Cities with the Highest Percentage of Puerto Rican Population in Virginia
RELATED REPORTS & OPTIONS
Puerto Rican
Virginia
Compare Cities
Map of Cities with the Highest Percentage of Puerto Rican Population in Virginia
0.00%
25.00%
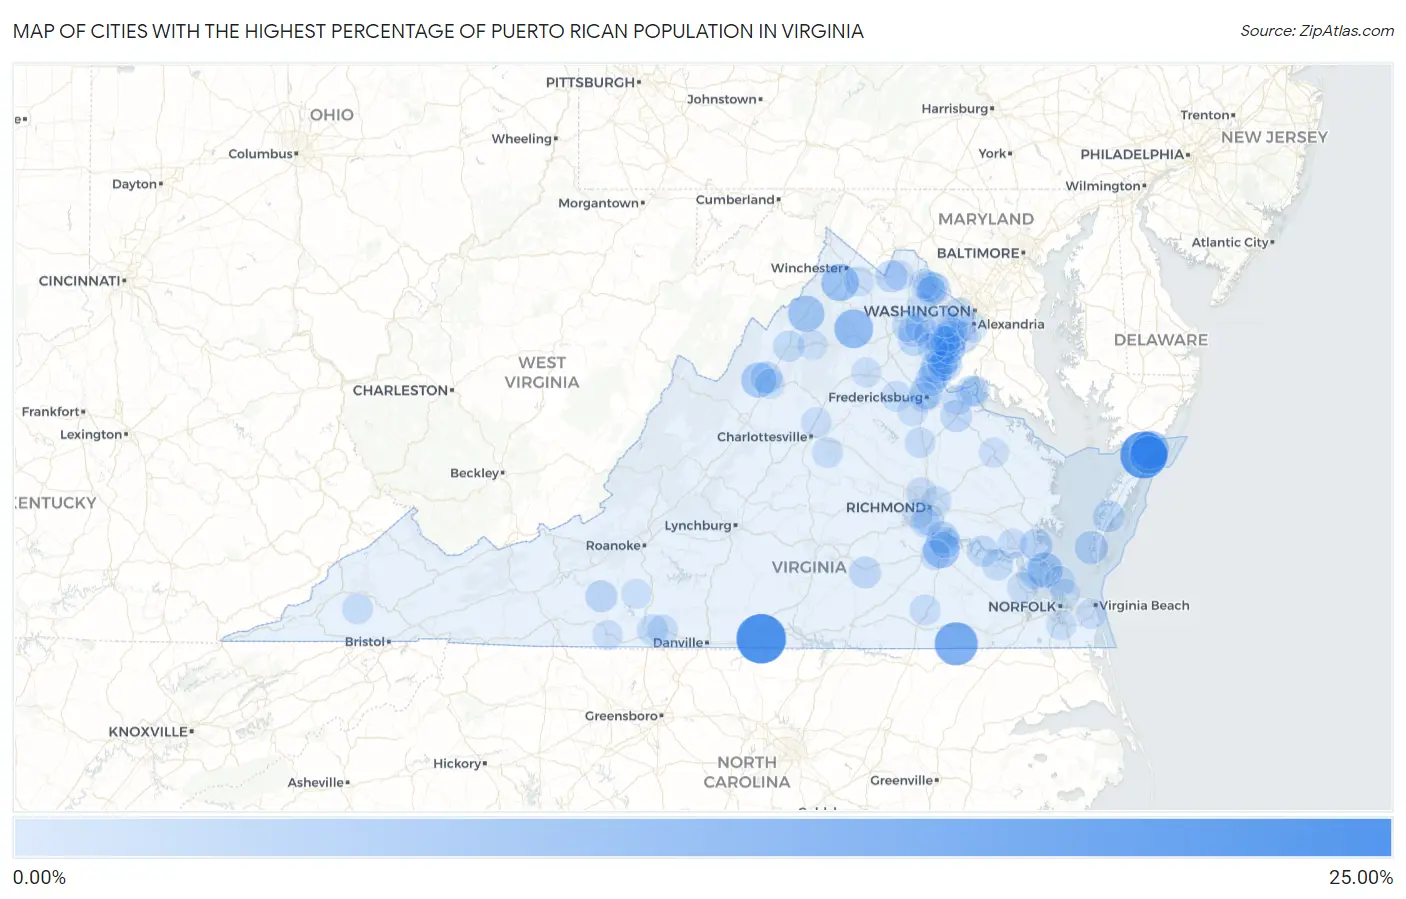
Cities with the Highest Percentage of Puerto Rican Population in Virginia
| City | Puerto Rican | vs State | vs National | |
| 1. | Cluster Springs | 23.50% | 1.29%(+22.2)#1 | 1.78%(+21.7)#356 |
| 2. | Temperanceville | 20.61% | 1.29%(+19.3)#2 | 1.78%(+18.8)#384 |
| 3. | Boykins | 16.18% | 1.29%(+14.9)#3 | 1.78%(+14.4)#450 |
| 4. | Linville | 13.00% | 1.29%(+11.7)#4 | 1.78%(+11.2)#541 |
| 5. | Flint Hill | 11.29% | 1.29%(+10.00)#5 | 1.78%(+9.50)#615 |
| 6. | Wattsville | 10.47% | 1.29%(+9.19)#6 | 1.78%(+8.69)#664 |
| 7. | Atlantic | 10.36% | 1.29%(+9.07)#7 | 1.78%(+8.57)#673 |
| 8. | Stephens City | 9.63% | 1.29%(+8.35)#8 | 1.78%(+7.85)#722 |
| 9. | Woodstock | 8.54% | 1.29%(+7.25)#9 | 1.78%(+6.75)#823 |
| 10. | Fort Lee | 8.45% | 1.29%(+7.16)#10 | 1.78%(+6.66)#833 |
| 11. | Bethel Manor | 7.26% | 1.29%(+5.97)#11 | 1.78%(+5.48)#987 |
| 12. | Dayton | 7.15% | 1.29%(+5.87)#12 | 1.78%(+5.37)#1,008 |
| 13. | Moorefield | 6.87% | 1.29%(+5.58)#13 | 1.78%(+5.08)#1,071 |
| 14. | Afton | 5.32% | 1.29%(+4.04)#14 | 1.78%(+3.54)#1,455 |
| 15. | Falmouth | 5.18% | 1.29%(+3.90)#15 | 1.78%(+3.40)#1,491 |
| 16. | Cape Charles | 5.07% | 1.29%(+3.79)#16 | 1.78%(+3.29)#1,527 |
| 17. | Gloucester Point | 4.58% | 1.29%(+3.29)#17 | 1.78%(+2.79)#1,679 |
| 18. | Occoquan | 4.20% | 1.29%(+2.91)#18 | 1.78%(+2.42)#1,854 |
| 19. | Aquia Harbour | 4.09% | 1.29%(+2.80)#19 | 1.78%(+2.31)#1,918 |
| 20. | Enon | 4.06% | 1.29%(+2.78)#20 | 1.78%(+2.28)#1,933 |
| 21. | Round Hill | 4.04% | 1.29%(+2.76)#21 | 1.78%(+2.26)#1,945 |
| 22. | Floyd | 3.86% | 1.29%(+2.57)#22 | 1.78%(+2.08)#2,053 |
| 23. | Fort Belvoir | 3.83% | 1.29%(+2.54)#23 | 1.78%(+2.04)#2,071 |
| 24. | Boswell S Corner | 3.79% | 1.29%(+2.50)#24 | 1.78%(+2.00)#2,103 |
| 25. | Harrisonburg | 3.74% | 1.29%(+2.45)#25 | 1.78%(+1.96)#2,127 |
| 26. | Blackstone | 3.69% | 1.29%(+2.40)#26 | 1.78%(+1.91)#2,171 |
| 27. | Quantico | 3.68% | 1.29%(+2.40)#27 | 1.78%(+1.90)#2,174 |
| 28. | Nassawadox | 3.64% | 1.29%(+2.35)#28 | 1.78%(+1.86)#2,202 |
| 29. | Port Royal | 3.60% | 1.29%(+2.31)#29 | 1.78%(+1.81)#2,229 |
| 30. | Nokesville | 3.51% | 1.29%(+2.23)#30 | 1.78%(+1.73)#2,285 |
| 31. | Stafford Courthouse | 3.50% | 1.29%(+2.22)#31 | 1.78%(+1.72)#2,290 |
| 32. | Kincora | 3.47% | 1.29%(+2.18)#32 | 1.78%(+1.69)#2,308 |
| 33. | Linton Hall | 3.46% | 1.29%(+2.17)#33 | 1.78%(+1.67)#2,320 |
| 34. | Woodlawn Cdp Fairfax County | 3.42% | 1.29%(+2.13)#34 | 1.78%(+1.64)#2,340 |
| 35. | Dahlgren | 3.10% | 1.29%(+1.81)#35 | 1.78%(+1.32)#2,530 |
| 36. | Newington Forest | 3.09% | 1.29%(+1.81)#36 | 1.78%(+1.31)#2,536 |
| 37. | Claremont | 3.09% | 1.29%(+1.80)#37 | 1.78%(+1.31)#2,540 |
| 38. | Triangle | 2.99% | 1.29%(+1.71)#38 | 1.78%(+1.21)#2,602 |
| 39. | Hopewell | 2.99% | 1.29%(+1.70)#39 | 1.78%(+1.21)#2,608 |
| 40. | New Market | 2.96% | 1.29%(+1.67)#40 | 1.78%(+1.18)#2,639 |
| 41. | Gainesville | 2.91% | 1.29%(+1.62)#41 | 1.78%(+1.13)#2,678 |
| 42. | Leesylvania | 2.89% | 1.29%(+1.60)#42 | 1.78%(+1.11)#2,698 |
| 43. | Potomac Mills | 2.86% | 1.29%(+1.57)#43 | 1.78%(+1.07)#2,720 |
| 44. | Martinsville | 2.84% | 1.29%(+1.56)#44 | 1.78%(+1.06)#2,738 |
| 45. | Cascades | 2.82% | 1.29%(+1.54)#45 | 1.78%(+1.04)#2,762 |
| 46. | Countryside | 2.80% | 1.29%(+1.51)#46 | 1.78%(+1.02)#2,784 |
| 47. | Newport News | 2.75% | 1.29%(+1.46)#47 | 1.78%(+0.967)#2,817 |
| 48. | Montclair | 2.71% | 1.29%(+1.43)#48 | 1.78%(+0.930)#2,855 |
| 49. | Surry | 2.70% | 1.29%(+1.42)#49 | 1.78%(+0.920)#2,863 |
| 50. | Goose Creek | 2.70% | 1.29%(+1.42)#50 | 1.78%(+0.919)#2,866 |
| 51. | Lake Caroline | 2.60% | 1.29%(+1.32)#51 | 1.78%(+0.819)#2,943 |
| 52. | Dungannon | 2.59% | 1.29%(+1.30)#52 | 1.78%(+0.806)#2,951 |
| 53. | Smithfield | 2.59% | 1.29%(+1.30)#53 | 1.78%(+0.803)#2,957 |
| 54. | Jarratt | 2.57% | 1.29%(+1.28)#54 | 1.78%(+0.784)#2,981 |
| 55. | Chatmoss | 2.54% | 1.29%(+1.25)#55 | 1.78%(+0.755)#3,018 |
| 56. | Lake Monticello | 2.52% | 1.29%(+1.23)#56 | 1.78%(+0.737)#3,046 |
| 57. | University Center | 2.49% | 1.29%(+1.20)#57 | 1.78%(+0.704)#3,082 |
| 58. | Cherry Hill | 2.48% | 1.29%(+1.19)#58 | 1.78%(+0.692)#3,095 |
| 59. | Hutchison | 2.45% | 1.29%(+1.16)#59 | 1.78%(+0.664)#3,119 |
| 60. | Bensley | 2.44% | 1.29%(+1.15)#60 | 1.78%(+0.654)#3,132 |
| 61. | Lake Wilderness | 2.43% | 1.29%(+1.15)#61 | 1.78%(+0.652)#3,134 |
| 62. | County Center | 2.26% | 1.29%(+0.975)#62 | 1.78%(+0.479)#3,296 |
| 63. | Virginia Beach | 2.21% | 1.29%(+0.925)#63 | 1.78%(+0.429)#3,358 |
| 64. | Hollymead | 2.21% | 1.29%(+0.922)#64 | 1.78%(+0.426)#3,362 |
| 65. | Boyce | 2.20% | 1.29%(+0.911)#65 | 1.78%(+0.414)#3,376 |
| 66. | Williamsburg | 2.18% | 1.29%(+0.890)#66 | 1.78%(+0.393)#3,414 |
| 67. | Hampton | 2.13% | 1.29%(+0.848)#67 | 1.78%(+0.351)#3,454 |
| 68. | Bull Run | 2.11% | 1.29%(+0.820)#68 | 1.78%(+0.323)#3,480 |
| 69. | Manchester | 2.04% | 1.29%(+0.751)#69 | 1.78%(+0.254)#3,570 |
| 70. | Purcellville | 2.02% | 1.29%(+0.730)#70 | 1.78%(+0.233)#3,588 |
| 71. | Crosspointe | 2.00% | 1.29%(+0.712)#71 | 1.78%(+0.215)#3,613 |
| 72. | South Riding | 1.97% | 1.29%(+0.687)#72 | 1.78%(+0.190)#3,641 |
| 73. | Chesapeake | 1.97% | 1.29%(+0.686)#73 | 1.78%(+0.189)#3,643 |
| 74. | King George | 1.97% | 1.29%(+0.683)#74 | 1.78%(+0.186)#3,651 |
| 75. | Laurel | 1.96% | 1.29%(+0.673)#75 | 1.78%(+0.176)#3,668 |
| 76. | Dahlgren Center | 1.94% | 1.29%(+0.650)#76 | 1.78%(+0.154)#3,710 |
| 77. | Quantico Base | 1.94% | 1.29%(+0.650)#77 | 1.78%(+0.153)#3,712 |
| 78. | Petersburg | 1.93% | 1.29%(+0.647)#78 | 1.78%(+0.151)#3,719 |
| 79. | Falls Church | 1.93% | 1.29%(+0.642)#79 | 1.78%(+0.145)#3,726 |
| 80. | East Highland Park | 1.90% | 1.29%(+0.611)#80 | 1.78%(+0.114)#3,769 |
| 81. | Woodbridge | 1.86% | 1.29%(+0.572)#81 | 1.78%(+0.076)#3,825 |
| 82. | West Springfield | 1.85% | 1.29%(+0.562)#82 | 1.78%(+0.066)#3,842 |
| 83. | Meadowbrook | 1.84% | 1.29%(+0.555)#83 | 1.78%(+0.058)#3,855 |
| 84. | Buckhall | 1.83% | 1.29%(+0.545)#84 | 1.78%(+0.049)#3,866 |
| 85. | Independent Hill | 1.83% | 1.29%(+0.540)#85 | 1.78%(+0.043)#3,873 |
| 86. | Massanetta Springs | 1.82% | 1.29%(+0.537)#86 | 1.78%(+0.040)#3,880 |
| 87. | Fredericksburg | 1.82% | 1.29%(+0.533)#87 | 1.78%(+0.036)#3,885 |
| 88. | Luray | 1.82% | 1.29%(+0.533)#88 | 1.78%(+0.036)#3,886 |
| 89. | Lake Ridge | 1.81% | 1.29%(+0.528)#89 | 1.78%(+0.031)#3,897 |
| 90. | Ferrum | 1.81% | 1.29%(+0.520)#90 | 1.78%(+0.023)#3,911 |
| 91. | Norfolk | 1.78% | 1.29%(+0.493)#91 | 1.78%(-0.004)#3,948 |
| 92. | Lansdowne | 1.78% | 1.29%(+0.490)#92 | 1.78%(-0.007)#3,952 |
| 93. | Tappahannock | 1.77% | 1.29%(+0.486)#93 | 1.78%(-0.011)#3,957 |
| 94. | Spotsylvania Courthouse | 1.77% | 1.29%(+0.484)#94 | 1.78%(-0.013)#3,961 |
| 95. | Culpeper | 1.77% | 1.29%(+0.480)#95 | 1.78%(-0.017)#3,967 |
| 96. | Stuart | 1.76% | 1.29%(+0.475)#96 | 1.78%(-0.021)#3,975 |
| 97. | Difficult Run | 1.74% | 1.29%(+0.458)#97 | 1.78%(-0.038)#4,003 |
| 98. | Kings Park West | 1.74% | 1.29%(+0.449)#98 | 1.78%(-0.047)#4,017 |
| 99. | Belle Haven | 1.73% | 1.29%(+0.444)#99 | 1.78%(-0.053)#4,025 |
| 100. | Dulles Town Center | 1.70% | 1.29%(+0.414)#100 | 1.78%(-0.083)#4,072 |
Common Questions
What are the Top 10 Cities with the Highest Percentage of Puerto Rican Population in Virginia?
Top 10 Cities with the Highest Percentage of Puerto Rican Population in Virginia are:
#1
23.50%
#2
20.61%
#3
16.18%
#4
11.29%
#5
10.47%
#6
10.36%
#7
9.63%
#8
8.54%
#9
8.45%
#10
7.26%
What city has the Highest Percentage of Puerto Rican Population in Virginia?
Cluster Springs has the Highest Percentage of Puerto Rican Population in Virginia with 23.50%.
What is the Percentage of Puerto Rican Population in the State of Virginia?
Percentage of Puerto Rican Population in Virginia is 1.29%.
What is the Percentage of Puerto Rican Population in the United States?
Percentage of Puerto Rican Population in the United States is 1.78%.