Cities with the Highest Percentage of Population Enrolled in University in Virginia
RELATED REPORTS & OPTIONS
University
Virginia
Compare Cities
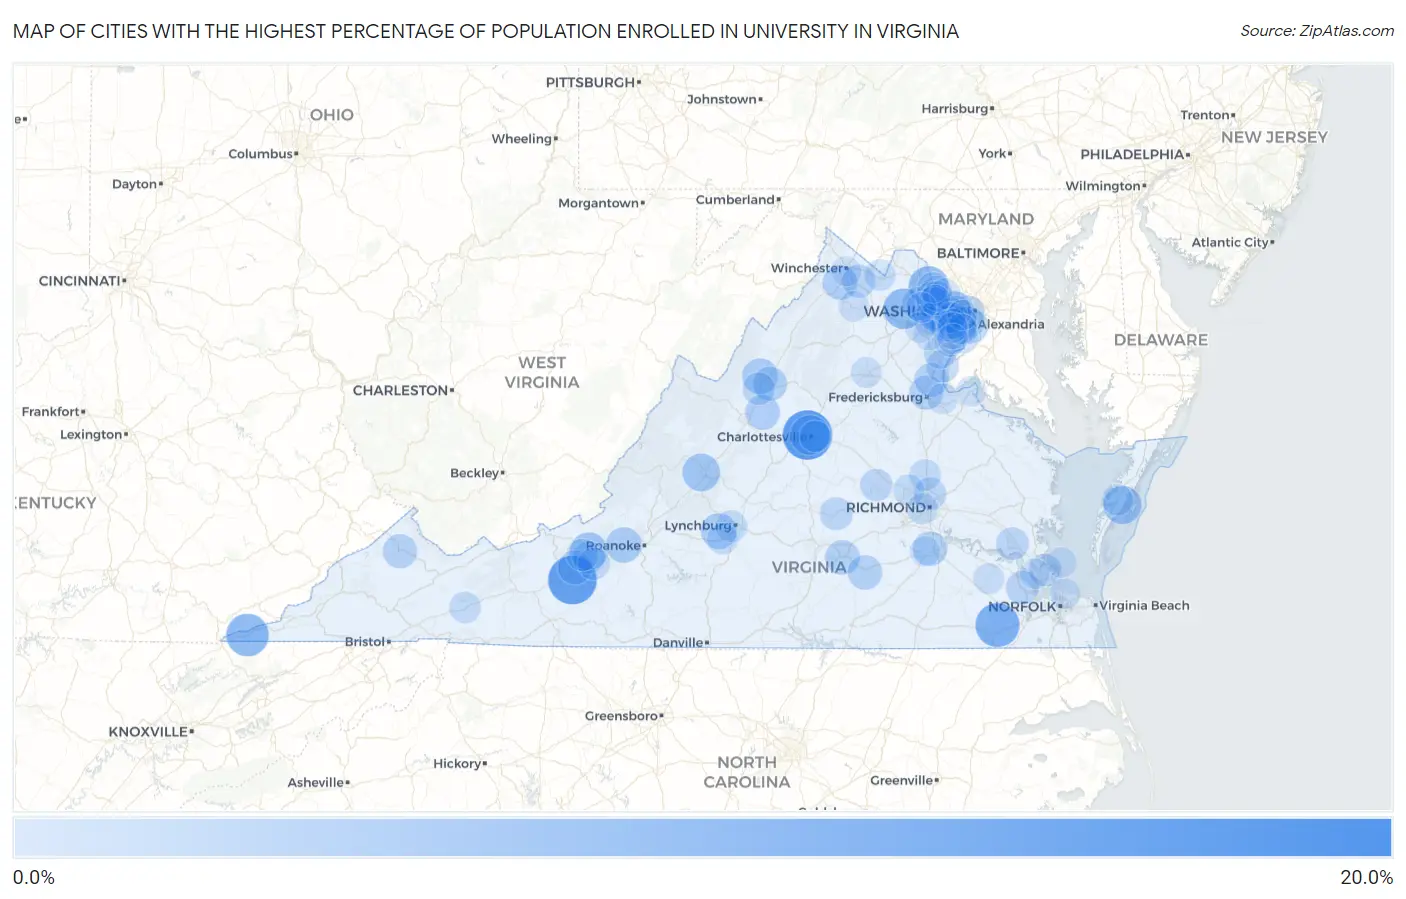
Map of Cities with the Highest Percentage of Population Enrolled in University in Virginia
0.0%
20.0%
Cities with the Highest Percentage of Population Enrolled in University in Virginia
| City | % in University | vs State | vs National | |
| 1. | Rio | 15.2% | 1.8%(+13.4)#1 | 1.4%(+13.8)#67 |
| 2. | University Of Virginia | 13.1% | 1.8%(+11.4)#2 | 1.4%(+11.7)#88 |
| 3. | Snowville | 12.7% | 1.8%(+10.9)#3 | 1.4%(+11.3)#94 |
| 4. | Carrsville | 9.9% | 1.8%(+8.13)#4 | 1.4%(+8.47)#156 |
| 5. | Ewing | 9.0% | 1.8%(+7.28)#5 | 1.4%(+7.63)#188 |
| 6. | Bull Run Mountain Estates | 7.9% | 1.8%(+6.18)#6 | 1.4%(+6.53)#239 |
| 7. | University Center | 7.7% | 1.8%(+5.96)#7 | 1.4%(+6.31)#252 |
| 8. | Charlottesville | 7.5% | 1.8%(+5.70)#8 | 1.4%(+6.04)#272 |
| 9. | Quinby | 6.6% | 1.8%(+4.82)#9 | 1.4%(+5.17)#331 |
| 10. | Lexington | 6.3% | 1.8%(+4.50)#10 | 1.4%(+4.84)#363 |
| 11. | Blacksburg | 6.2% | 1.8%(+4.44)#11 | 1.4%(+4.78)#369 |
| 12. | Forest | 5.2% | 1.8%(+3.46)#12 | 1.4%(+3.81)#496 |
| 13. | Belmont Estates | 5.2% | 1.8%(+3.45)#13 | 1.4%(+3.79)#499 |
| 14. | Glenvar | 5.2% | 1.8%(+3.40)#14 | 1.4%(+3.74)#505 |
| 15. | Stephens City | 4.7% | 1.8%(+2.95)#15 | 1.4%(+3.30)#613 |
| 16. | New Hope | 4.6% | 1.8%(+2.88)#16 | 1.4%(+3.23)#637 |
| 17. | Burkeville | 4.6% | 1.8%(+2.83)#17 | 1.4%(+3.18)#655 |
| 18. | Fair Oaks | 4.6% | 1.8%(+2.80)#18 | 1.4%(+3.15)#665 |
| 19. | Ettrick | 4.5% | 1.8%(+2.78)#19 | 1.4%(+3.12)#672 |
| 20. | Blackstone | 4.5% | 1.8%(+2.75)#20 | 1.4%(+3.10)#680 |
| 21. | Massanetta Springs | 4.4% | 1.8%(+2.67)#21 | 1.4%(+3.02)#706 |
| 22. | Vansant | 4.4% | 1.8%(+2.61)#22 | 1.4%(+2.96)#722 |
| 23. | Huntington | 4.3% | 1.8%(+2.59)#23 | 1.4%(+2.93)#731 |
| 24. | Radford | 4.3% | 1.8%(+2.58)#24 | 1.4%(+2.93)#732 |
| 25. | Falmouth | 4.3% | 1.8%(+2.54)#25 | 1.4%(+2.88)#745 |
| 26. | Arlington | 4.2% | 1.8%(+2.49)#26 | 1.4%(+2.84)#761 |
| 27. | Pounding Mill | 4.1% | 1.8%(+2.39)#27 | 1.4%(+2.73)#797 |
| 28. | Stafford Courthouse | 4.1% | 1.8%(+2.37)#28 | 1.4%(+2.72)#801 |
| 29. | Pimmit Hills | 4.1% | 1.8%(+2.34)#29 | 1.4%(+2.68)#806 |
| 30. | Arcola | 4.0% | 1.8%(+2.27)#30 | 1.4%(+2.62)#823 |
| 31. | Boyce | 3.8% | 1.8%(+2.02)#31 | 1.4%(+2.37)#927 |
| 32. | Smithfield | 3.8% | 1.8%(+2.00)#32 | 1.4%(+2.35)#938 |
| 33. | Tysons | 3.6% | 1.8%(+1.89)#33 | 1.4%(+2.24)#1,004 |
| 34. | Kings Park West | 3.6% | 1.8%(+1.88)#34 | 1.4%(+2.23)#1,010 |
| 35. | Cumberland | 3.6% | 1.8%(+1.84)#35 | 1.4%(+2.18)#1,045 |
| 36. | Quantico Base | 3.6% | 1.8%(+1.80)#36 | 1.4%(+2.15)#1,076 |
| 37. | Williamsburg | 3.6% | 1.8%(+1.80)#37 | 1.4%(+2.14)#1,079 |
| 38. | Bethel Manor | 3.5% | 1.8%(+1.75)#38 | 1.4%(+2.10)#1,102 |
| 39. | Fairfax | 3.5% | 1.8%(+1.74)#39 | 1.4%(+2.08)#1,112 |
| 40. | Chamberlayne | 3.4% | 1.8%(+1.66)#40 | 1.4%(+2.01)#1,163 |
| 41. | Mount Crawford | 3.3% | 1.8%(+1.59)#41 | 1.4%(+1.94)#1,195 |
| 42. | Goochland | 3.3% | 1.8%(+1.55)#42 | 1.4%(+1.90)#1,225 |
| 43. | Merrimac | 3.3% | 1.8%(+1.54)#43 | 1.4%(+1.88)#1,244 |
| 44. | Montclair | 3.3% | 1.8%(+1.53)#44 | 1.4%(+1.87)#1,250 |
| 45. | Greenbriar | 3.3% | 1.8%(+1.51)#45 | 1.4%(+1.86)#1,259 |
| 46. | Braddock | 3.3% | 1.8%(+1.50)#46 | 1.4%(+1.85)#1,268 |
| 47. | Leesylvania | 3.2% | 1.8%(+1.48)#47 | 1.4%(+1.83)#1,277 |
| 48. | Christiansburg | 3.2% | 1.8%(+1.44)#48 | 1.4%(+1.79)#1,312 |
| 49. | Prices Fork | 3.2% | 1.8%(+1.42)#49 | 1.4%(+1.77)#1,339 |
| 50. | North Garden | 3.1% | 1.8%(+1.32)#50 | 1.4%(+1.66)#1,414 |
| 51. | Oak Grove | 3.1% | 1.8%(+1.31)#51 | 1.4%(+1.66)#1,422 |
| 52. | Alexandria | 3.0% | 1.8%(+1.27)#52 | 1.4%(+1.62)#1,462 |
| 53. | Lynchburg | 3.0% | 1.8%(+1.27)#53 | 1.4%(+1.61)#1,466 |
| 54. | Merrifield | 2.9% | 1.8%(+1.19)#54 | 1.4%(+1.53)#1,537 |
| 55. | Lincolnia | 2.9% | 1.8%(+1.16)#55 | 1.4%(+1.51)#1,565 |
| 56. | Ashland | 2.9% | 1.8%(+1.15)#56 | 1.4%(+1.50)#1,573 |
| 57. | Pantops | 2.9% | 1.8%(+1.13)#57 | 1.4%(+1.47)#1,605 |
| 58. | Marion | 2.9% | 1.8%(+1.12)#58 | 1.4%(+1.47)#1,608 |
| 59. | Fort Belvoir | 2.9% | 1.8%(+1.11)#59 | 1.4%(+1.46)#1,617 |
| 60. | Shenandoah Retreat | 2.9% | 1.8%(+1.11)#60 | 1.4%(+1.45)#1,620 |
| 61. | Reston | 2.8% | 1.8%(+1.06)#61 | 1.4%(+1.41)#1,663 |
| 62. | Short Pump | 2.8% | 1.8%(+1.02)#62 | 1.4%(+1.36)#1,725 |
| 63. | Mcnair | 2.7% | 1.8%(+0.992)#63 | 1.4%(+1.34)#1,766 |
| 64. | Kingstowne | 2.7% | 1.8%(+0.984)#64 | 1.4%(+1.33)#1,780 |
| 65. | Sully Square | 2.7% | 1.8%(+0.979)#65 | 1.4%(+1.33)#1,786 |
| 66. | Painter | 2.7% | 1.8%(+0.973)#66 | 1.4%(+1.32)#1,796 |
| 67. | Centreville | 2.7% | 1.8%(+0.931)#67 | 1.4%(+1.28)#1,854 |
| 68. | Timberlake | 2.7% | 1.8%(+0.918)#68 | 1.4%(+1.26)#1,866 |
| 69. | Fair Lakes | 2.6% | 1.8%(+0.875)#69 | 1.4%(+1.22)#1,925 |
| 70. | Richmond | 2.6% | 1.8%(+0.847)#70 | 1.4%(+1.19)#1,968 |
| 71. | Woodburn | 2.6% | 1.8%(+0.801)#71 | 1.4%(+1.15)#2,039 |
| 72. | Idylwood | 2.6% | 1.8%(+0.796)#72 | 1.4%(+1.14)#2,049 |
| 73. | Sugarland Run | 2.5% | 1.8%(+0.782)#73 | 1.4%(+1.13)#2,074 |
| 74. | Occoquan | 2.5% | 1.8%(+0.782)#74 | 1.4%(+1.13)#2,079 |
| 75. | Dendron | 2.5% | 1.8%(+0.777)#75 | 1.4%(+1.12)#2,083 |
| 76. | Newington Forest | 2.5% | 1.8%(+0.758)#76 | 1.4%(+1.10)#2,112 |
| 77. | Burke Centre | 2.5% | 1.8%(+0.755)#77 | 1.4%(+1.10)#2,118 |
| 78. | Mantua | 2.5% | 1.8%(+0.722)#78 | 1.4%(+1.07)#2,167 |
| 79. | Great Falls Crossing | 2.5% | 1.8%(+0.720)#79 | 1.4%(+1.07)#2,171 |
| 80. | Culpeper | 2.4% | 1.8%(+0.677)#80 | 1.4%(+1.02)#2,239 |
| 81. | Countryside | 2.4% | 1.8%(+0.672)#81 | 1.4%(+1.02)#2,257 |
| 82. | Dranesville | 2.4% | 1.8%(+0.667)#82 | 1.4%(+1.01)#2,266 |
| 83. | Passapatanzy | 2.4% | 1.8%(+0.660)#83 | 1.4%(+1.01)#2,274 |
| 84. | Great Falls | 2.4% | 1.8%(+0.658)#84 | 1.4%(+1.00)#2,276 |
| 85. | Buckhall | 2.4% | 1.8%(+0.613)#85 | 1.4%(+0.959)#2,350 |
| 86. | Kings Park | 2.3% | 1.8%(+0.590)#86 | 1.4%(+0.937)#2,397 |
| 87. | Apple Mountain Lake | 2.3% | 1.8%(+0.547)#87 | 1.4%(+0.894)#2,477 |
| 88. | Franconia | 2.3% | 1.8%(+0.544)#88 | 1.4%(+0.890)#2,487 |
| 89. | Norfolk | 2.3% | 1.8%(+0.518)#89 | 1.4%(+0.864)#2,547 |
| 90. | Herndon | 2.3% | 1.8%(+0.514)#90 | 1.4%(+0.860)#2,556 |
| 91. | Poquoson | 2.2% | 1.8%(+0.491)#91 | 1.4%(+0.837)#2,608 |
| 92. | Bull Run | 2.2% | 1.8%(+0.485)#92 | 1.4%(+0.832)#2,619 |
| 93. | Seven Corners | 2.2% | 1.8%(+0.478)#93 | 1.4%(+0.825)#2,630 |
| 94. | South Riding | 2.2% | 1.8%(+0.474)#94 | 1.4%(+0.821)#2,640 |
| 95. | West Springfield | 2.2% | 1.8%(+0.448)#95 | 1.4%(+0.795)#2,691 |
| 96. | Dahlgren | 2.2% | 1.8%(+0.446)#96 | 1.4%(+0.793)#2,694 |
| 97. | Laurel Hill | 2.2% | 1.8%(+0.440)#97 | 1.4%(+0.786)#2,719 |
| 98. | Matoaca | 2.1% | 1.8%(+0.363)#98 | 1.4%(+0.710)#2,869 |
| 99. | Winchester | 2.1% | 1.8%(+0.359)#99 | 1.4%(+0.706)#2,878 |
| 100. | Newport News | 2.1% | 1.8%(+0.347)#100 | 1.4%(+0.693)#2,908 |
Common Questions
What are the Top 10 Cities with the Highest Percentage of Population Enrolled in University in Virginia?
Top 10 Cities with the Highest Percentage of Population Enrolled in University in Virginia are:
#1
13.1%
#2
12.7%
#3
9.9%
#4
9.0%
#5
7.9%
#6
7.7%
#7
7.5%
#8
6.6%
#9
6.3%
#10
6.2%
What city has the Highest Percentage of Population Enrolled in University in Virginia?
University of Virginia has the Highest Percentage of Population Enrolled in University in Virginia with 13.1%.
What is the Percentage of Population Enrolled in University in the State of Virginia?
Percentage of Population Enrolled in University in Virginia is 1.8%.
What is the Percentage of Population Enrolled in University in the United States?
Percentage of Population Enrolled in University in the United States is 1.4%.