Leesburg, VA Map & Demographics
Leesburg Map
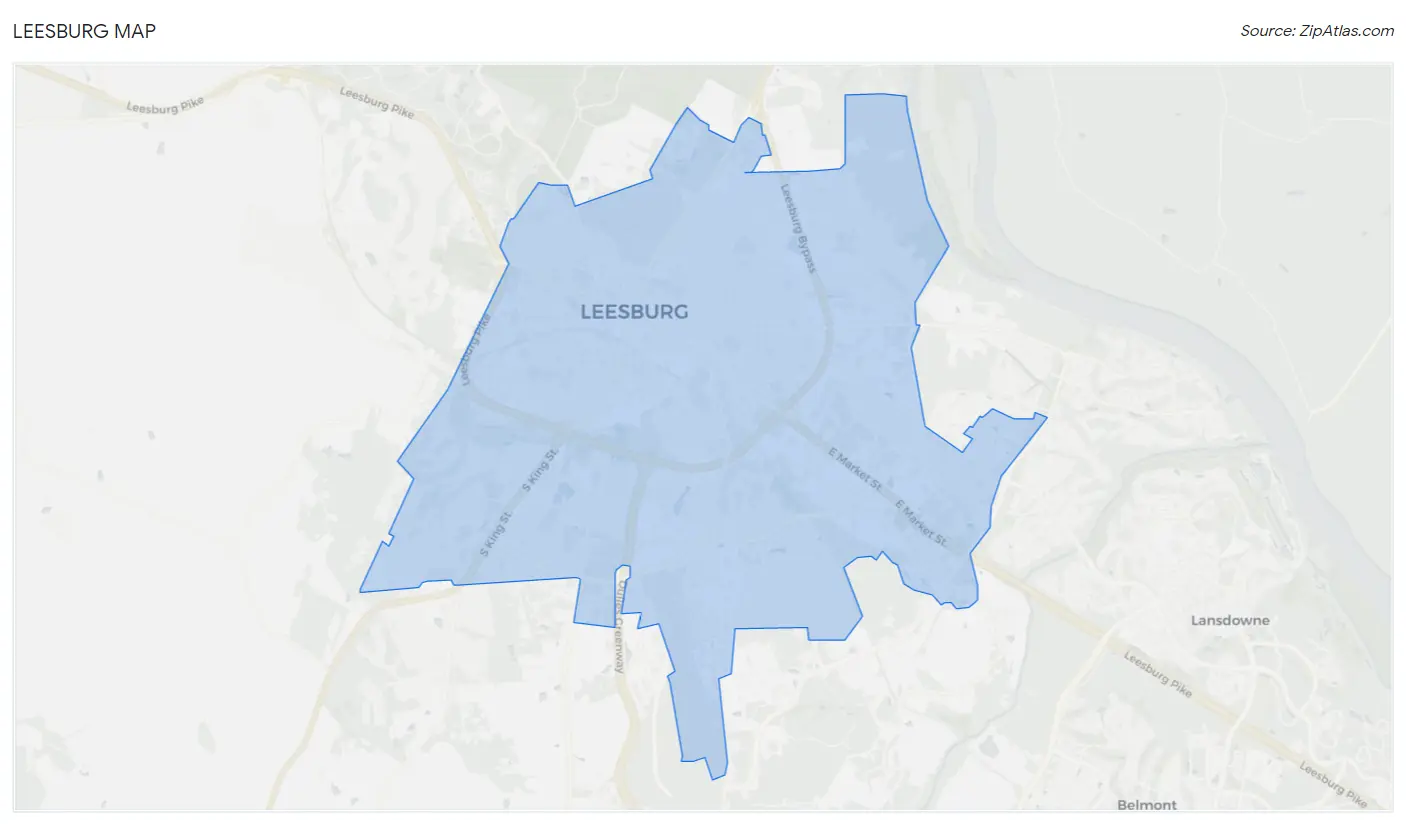
Leesburg Overview
$57,021
PER CAPITA INCOME
$150,710
AVG FAMILY INCOME
$132,298
AVG HOUSEHOLD INCOME
38.2%
WAGE / INCOME GAP [ % ]
61.8¢/ $1
WAGE / INCOME GAP [ $ ]
0.41
INEQUALITY / GINI INDEX
48,465
TOTAL POPULATION
24,519
MALE POPULATION
23,946
FEMALE POPULATION
102.39
MALES / 100 FEMALES
97.66
FEMALES / 100 MALES
34.8
MEDIAN AGE
3.4
AVG FAMILY SIZE
2.9
AVG HOUSEHOLD SIZE
28,382
LABOR FORCE [ PEOPLE ]
76.9%
PERCENT IN LABOR FORCE
3.1%
UNEMPLOYMENT RATE
Income in Leesburg
Income Overview in Leesburg
Per Capita Income in Leesburg is $57,021, while median incomes of families and households are $150,710 and $132,298 respectively.
| Characteristic | Number | Measure |
| Per Capita Income | 48,465 | $57,021 |
| Median Family Income | 11,795 | $150,710 |
| Mean Family Income | 11,795 | $180,267 |
| Median Household Income | 16,468 | $132,298 |
| Mean Household Income | 16,468 | $163,077 |
| Income Deficit | 11,795 | $0 |
| Wage / Income Gap (%) | 48,465 | 38.24% |
| Wage / Income Gap ($) | 48,465 | 61.76¢ per $1 |
| Gini / Inequality Index | 48,465 | 0.41 |
Earnings by Sex in Leesburg
Average Earnings in Leesburg are $59,200, $75,196 for men and $46,439 for women, a difference of 38.2%.
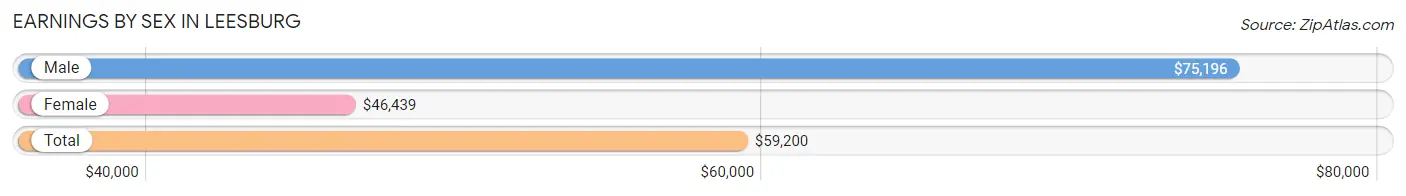
| Sex | Number | Average Earnings |
| Male | 15,631 (53.5%) | $75,196 |
| Female | 13,608 (46.5%) | $46,439 |
| Total | 29,239 (100.0%) | $59,200 |
Earnings by Sex by Income Bracket in Leesburg
The most common earnings brackets in Leesburg are $100,000+ for men (5,997 | 38.4%) and $100,000+ for women (2,767 | 20.3%).
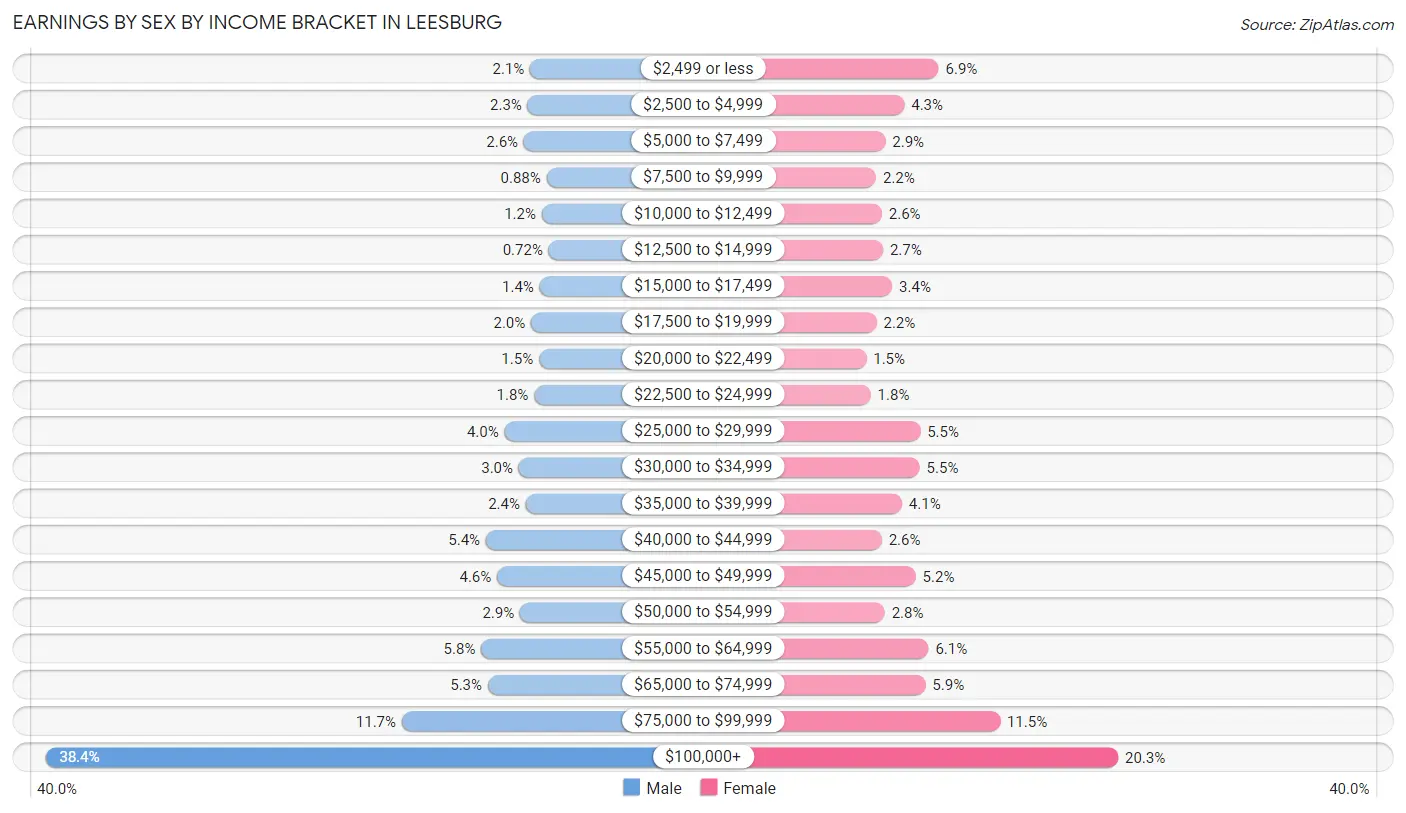
| Income | Male | Female |
| $2,499 or less | 330 (2.1%) | 936 (6.9%) |
| $2,500 to $4,999 | 359 (2.3%) | 586 (4.3%) |
| $5,000 to $7,499 | 403 (2.6%) | 393 (2.9%) |
| $7,500 to $9,999 | 138 (0.9%) | 298 (2.2%) |
| $10,000 to $12,499 | 194 (1.2%) | 358 (2.6%) |
| $12,500 to $14,999 | 112 (0.7%) | 369 (2.7%) |
| $15,000 to $17,499 | 219 (1.4%) | 462 (3.4%) |
| $17,500 to $19,999 | 319 (2.0%) | 303 (2.2%) |
| $20,000 to $22,499 | 226 (1.5%) | 199 (1.5%) |
| $22,500 to $24,999 | 283 (1.8%) | 244 (1.8%) |
| $25,000 to $29,999 | 630 (4.0%) | 748 (5.5%) |
| $30,000 to $34,999 | 462 (3.0%) | 743 (5.5%) |
| $35,000 to $39,999 | 381 (2.4%) | 562 (4.1%) |
| $40,000 to $44,999 | 849 (5.4%) | 356 (2.6%) |
| $45,000 to $49,999 | 718 (4.6%) | 702 (5.2%) |
| $50,000 to $54,999 | 449 (2.9%) | 386 (2.8%) |
| $55,000 to $64,999 | 903 (5.8%) | 833 (6.1%) |
| $65,000 to $74,999 | 826 (5.3%) | 801 (5.9%) |
| $75,000 to $99,999 | 1,833 (11.7%) | 1,562 (11.5%) |
| $100,000+ | 5,997 (38.4%) | 2,767 (20.3%) |
| Total | 15,631 (100.0%) | 13,608 (100.0%) |
Earnings by Sex by Educational Attainment in Leesburg
Average earnings in Leesburg are $87,253 for men and $56,815 for women, a difference of 34.9%. Men with an educational attainment of graduate degree enjoy the highest average annual earnings of $122,204, while those with less than high school education earn the least with $38,750. Women with an educational attainment of graduate degree earn the most with the average annual earnings of $88,708, while those with less than high school education have the smallest earnings of $28,250.
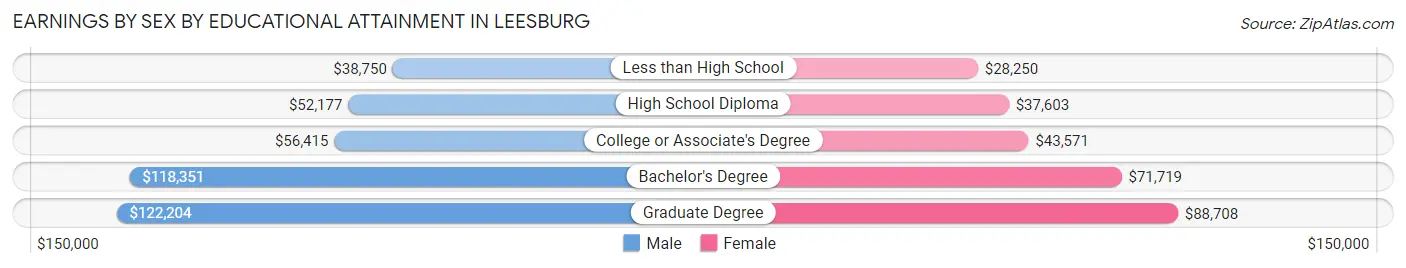
| Educational Attainment | Male Income | Female Income |
| Less than High School | $38,750 | $28,250 |
| High School Diploma | $52,177 | $37,603 |
| College or Associate's Degree | $56,415 | $43,571 |
| Bachelor's Degree | $118,351 | $71,719 |
| Graduate Degree | $122,204 | $88,708 |
| Total | $87,253 | $56,815 |
Family Income in Leesburg
Family Income Brackets in Leesburg
According to the Leesburg family income data, there are 3,751 families falling into the $200,000+ income range, which is the most common income bracket and makes up 31.8% of all families. Conversely, the $10,000 to $14,999 income bracket is the least frequent group with only 47 families (0.4%) belonging to this category.
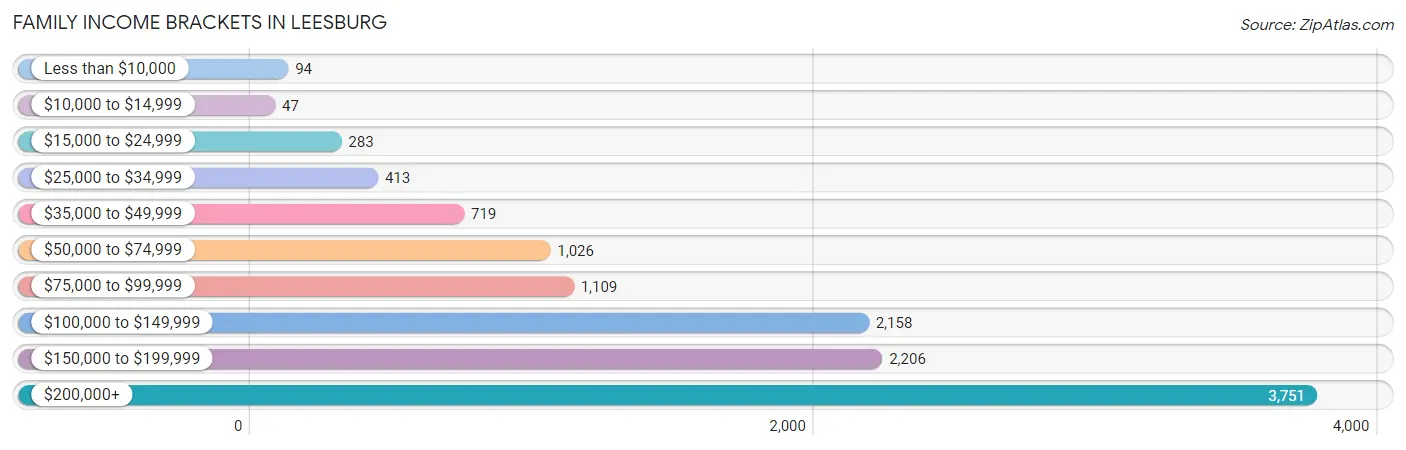
| Income Bracket | # Families | % Families |
| Less than $10,000 | 94 | 0.8% |
| $10,000 to $14,999 | 47 | 0.4% |
| $15,000 to $24,999 | 283 | 2.4% |
| $25,000 to $34,999 | 413 | 3.5% |
| $35,000 to $49,999 | 719 | 6.1% |
| $50,000 to $74,999 | 1,026 | 8.7% |
| $75,000 to $99,999 | 1,109 | 9.4% |
| $100,000 to $149,999 | 2,158 | 18.3% |
| $150,000 to $199,999 | 2,206 | 18.7% |
| $200,000+ | 3,751 | 31.8% |
Family Income by Famaliy Size in Leesburg
7+ person families (235 | 2.0%) account for the highest median family income in Leesburg with $185,050 per family, while 2-person families (3,908 | 33.1%) have the highest median income of $59,949 per family member.
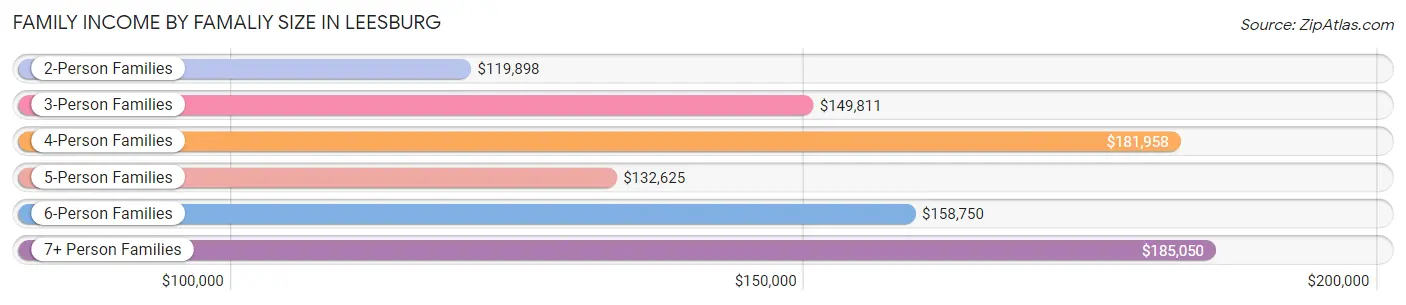
| Income Bracket | # Families | Median Income |
| 2-Person Families | 3,908 (33.1%) | $119,898 |
| 3-Person Families | 3,042 (25.8%) | $149,811 |
| 4-Person Families | 3,069 (26.0%) | $181,958 |
| 5-Person Families | 1,072 (9.1%) | $132,625 |
| 6-Person Families | 469 (4.0%) | $158,750 |
| 7+ Person Families | 235 (2.0%) | $185,050 |
| Total | 11,795 (100.0%) | $150,710 |
Family Income by Number of Earners in Leesburg
The median family income in Leesburg is $150,710, with families comprising 3+ earners (2,069) having the highest median family income of $197,704, while families with no earners (446) have the lowest median family income of $70,000, accounting for 17.5% and 3.8% of families, respectively.
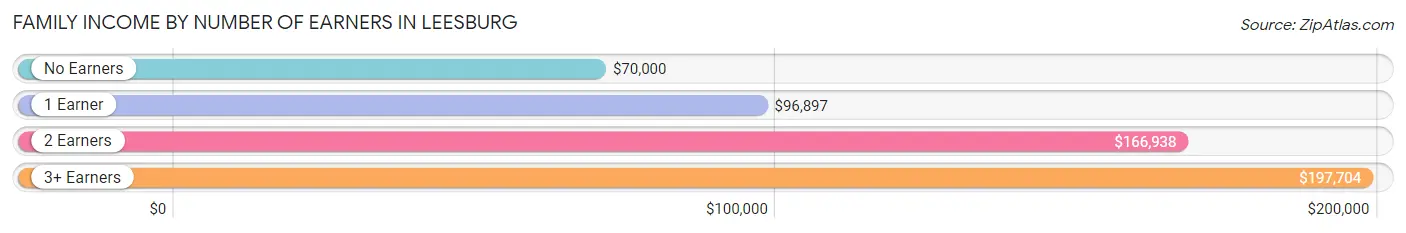
| Number of Earners | # Families | Median Income |
| No Earners | 446 (3.8%) | $70,000 |
| 1 Earner | 3,219 (27.3%) | $96,897 |
| 2 Earners | 6,061 (51.4%) | $166,938 |
| 3+ Earners | 2,069 (17.5%) | $197,704 |
| Total | 11,795 (100.0%) | $150,710 |
Household Income in Leesburg
Household Income Brackets in Leesburg
With 4,397 households falling in the category, the $200,000+ income range is the most frequent in Leesburg, accounting for 26.7% of all households. In contrast, only 115 households (0.7%) fall into the $10,000 to $14,999 income bracket, making it the least populous group.
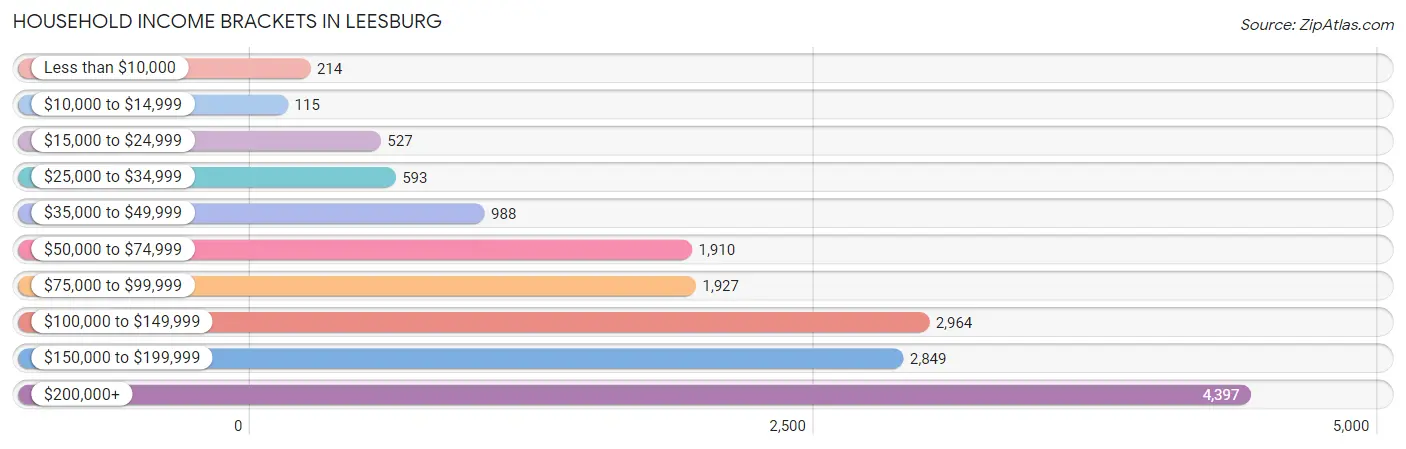
| Income Bracket | # Households | % Households |
| Less than $10,000 | 214 | 1.3% |
| $10,000 to $14,999 | 115 | 0.7% |
| $15,000 to $24,999 | 527 | 3.2% |
| $25,000 to $34,999 | 593 | 3.6% |
| $35,000 to $49,999 | 988 | 6.0% |
| $50,000 to $74,999 | 1,910 | 11.6% |
| $75,000 to $99,999 | 1,927 | 11.7% |
| $100,000 to $149,999 | 2,964 | 18.0% |
| $150,000 to $199,999 | 2,849 | 17.3% |
| $200,000+ | 4,397 | 26.7% |
Household Income by Householder Age in Leesburg
The median household income in Leesburg is $132,298, with the highest median household income of $161,553 found in the 45 to 64 years age bracket for the primary householder. A total of 6,716 households (40.8%) fall into this category. Meanwhile, the 15 to 24 years age bracket for the primary householder has the lowest median household income of $46,071, with 534 households (3.2%) in this group.
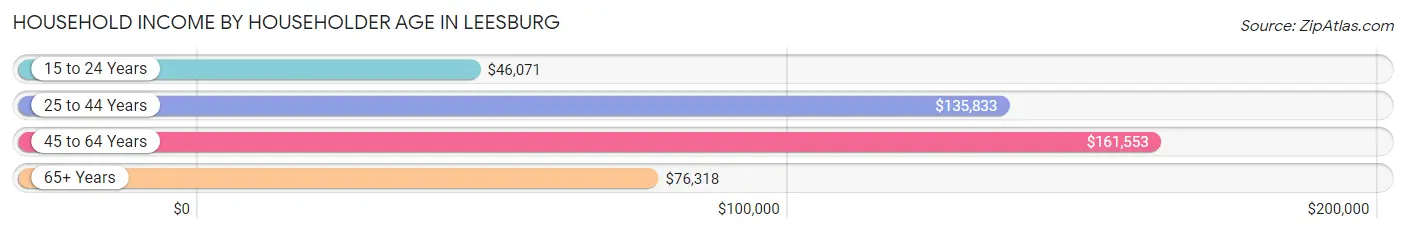
| Income Bracket | # Households | Median Income |
| 15 to 24 Years | 534 (3.2%) | $46,071 |
| 25 to 44 Years | 7,022 (42.6%) | $135,833 |
| 45 to 64 Years | 6,716 (40.8%) | $161,553 |
| 65+ Years | 2,196 (13.3%) | $76,318 |
| Total | 16,468 (100.0%) | $132,298 |
Poverty in Leesburg
Income Below Poverty by Sex and Age in Leesburg
With 4.3% poverty level for males and 8.2% for females among the residents of Leesburg, under 5 year old males and 18 to 24 year old females are the most vulnerable to poverty, with 285 males (14.8%) and 518 females (26.1%) in their respective age groups living below the poverty level.
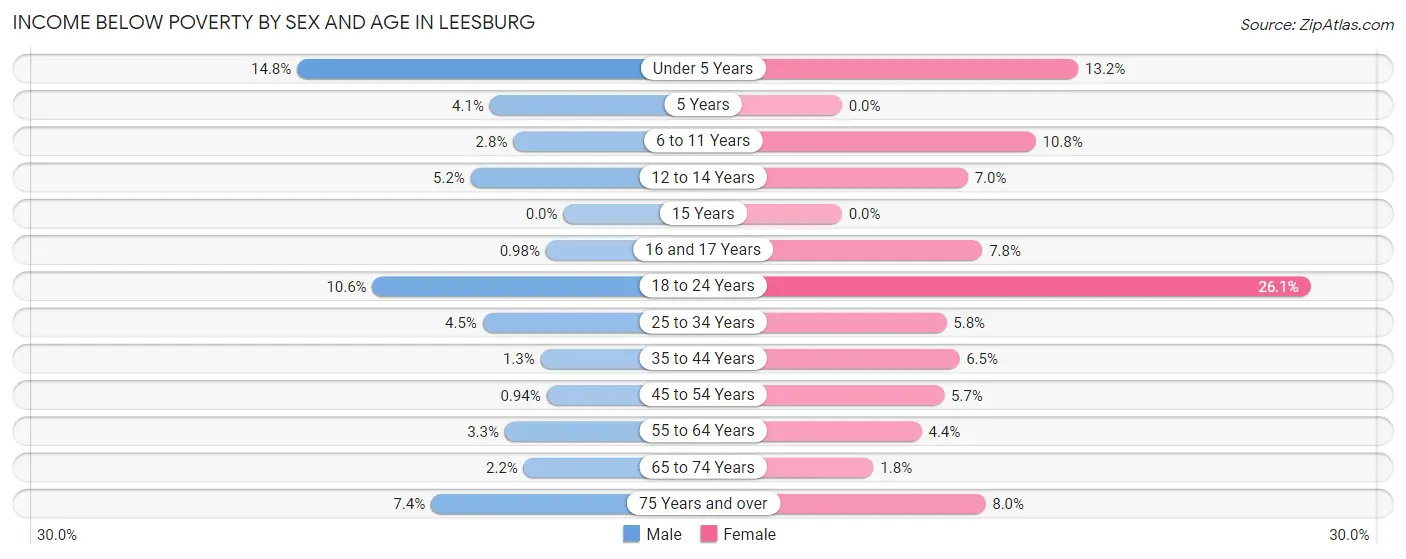
| Age Bracket | Male | Female |
| Under 5 Years | 285 (14.8%) | 254 (13.2%) |
| 5 Years | 31 (4.1%) | 0 (0.0%) |
| 6 to 11 Years | 57 (2.8%) | 192 (10.8%) |
| 12 to 14 Years | 58 (5.2%) | 65 (7.0%) |
| 15 Years | 0 (0.0%) | 0 (0.0%) |
| 16 and 17 Years | 7 (1.0%) | 63 (7.8%) |
| 18 to 24 Years | 209 (10.6%) | 518 (26.1%) |
| 25 to 34 Years | 167 (4.5%) | 210 (5.8%) |
| 35 to 44 Years | 52 (1.3%) | 244 (6.5%) |
| 45 to 54 Years | 31 (0.9%) | 173 (5.7%) |
| 55 to 64 Years | 86 (3.3%) | 125 (4.4%) |
| 65 to 74 Years | 27 (2.2%) | 25 (1.8%) |
| 75 Years and over | 35 (7.4%) | 86 (8.0%) |
| Total | 1,045 (4.3%) | 1,955 (8.2%) |
Income Above Poverty by Sex and Age in Leesburg
According to the poverty statistics in Leesburg, males aged 15 years and females aged 5 years are the age groups that are most secure financially, with 100.0% of males and 100.0% of females in these age groups living above the poverty line.
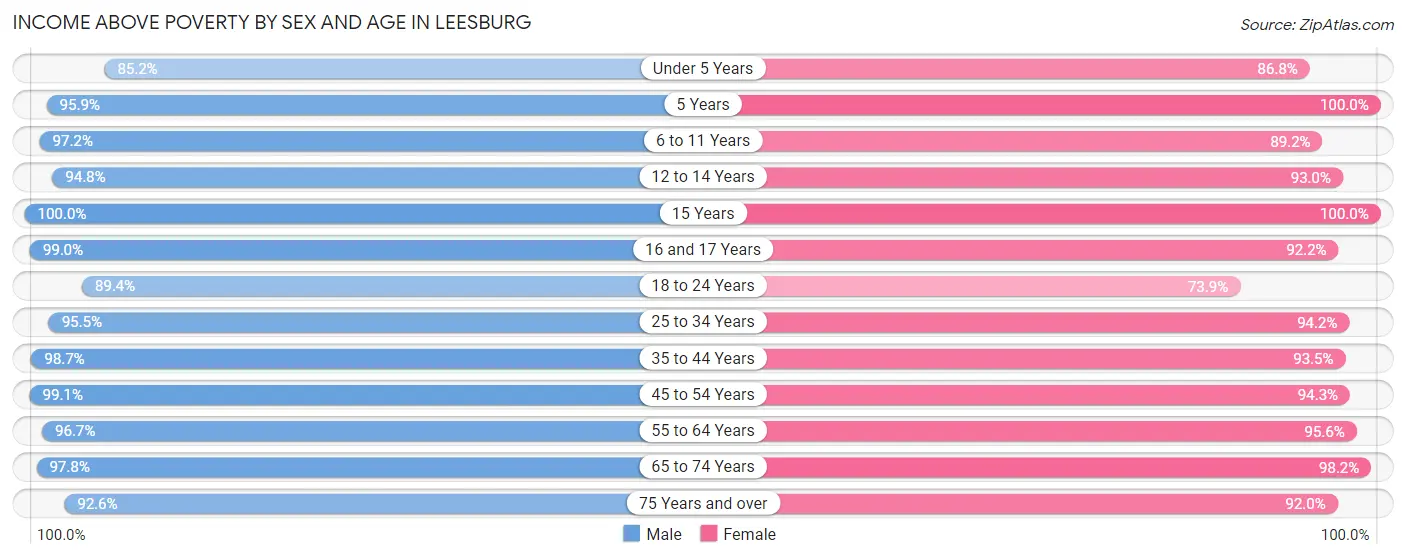
| Age Bracket | Male | Female |
| Under 5 Years | 1,637 (85.2%) | 1,676 (86.8%) |
| 5 Years | 726 (95.9%) | 391 (100.0%) |
| 6 to 11 Years | 1,984 (97.2%) | 1,588 (89.2%) |
| 12 to 14 Years | 1,067 (94.8%) | 862 (93.0%) |
| 15 Years | 333 (100.0%) | 197 (100.0%) |
| 16 and 17 Years | 705 (99.0%) | 743 (92.2%) |
| 18 to 24 Years | 1,757 (89.4%) | 1,467 (73.9%) |
| 25 to 34 Years | 3,555 (95.5%) | 3,400 (94.2%) |
| 35 to 44 Years | 4,042 (98.7%) | 3,488 (93.5%) |
| 45 to 54 Years | 3,281 (99.1%) | 2,868 (94.3%) |
| 55 to 64 Years | 2,553 (96.7%) | 2,691 (95.6%) |
| 65 to 74 Years | 1,192 (97.8%) | 1,396 (98.2%) |
| 75 Years and over | 440 (92.6%) | 990 (92.0%) |
| Total | 23,272 (95.7%) | 21,757 (91.8%) |
Income Below Poverty Among Married-Couple Families in Leesburg
The poverty statistics for married-couple families in Leesburg show that 1.7% or 162 of the total 9,373 families live below the poverty line. Families with 5 or more children have the highest poverty rate of 31.5%, comprising of 17 families. On the other hand, families with 1 or 2 children have the lowest poverty rate of 0.8%, which includes 38 families.
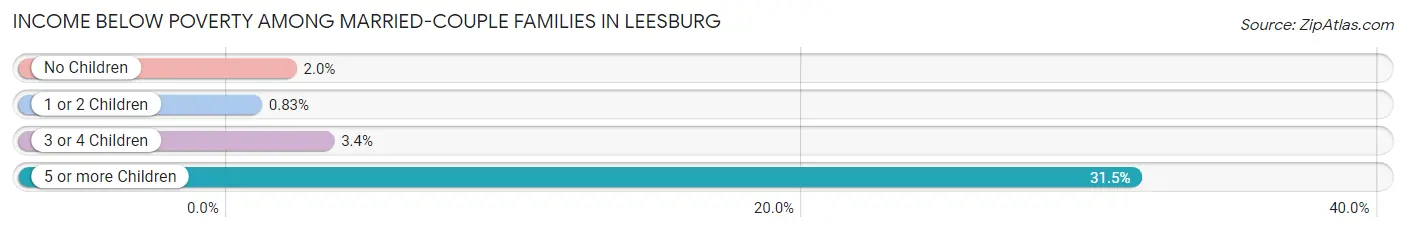
| Children | Above Poverty | Below Poverty |
| No Children | 3,844 (98.0%) | 80 (2.0%) |
| 1 or 2 Children | 4,551 (99.2%) | 38 (0.8%) |
| 3 or 4 Children | 779 (96.7%) | 27 (3.4%) |
| 5 or more Children | 37 (68.5%) | 17 (31.5%) |
| Total | 9,211 (98.3%) | 162 (1.7%) |
Income Below Poverty Among Single-Parent Households in Leesburg
According to the poverty data in Leesburg, 8.3% or 76 single-father households and 16.7% or 252 single-mother households are living below the poverty line. Among single-father households, those with 1 or 2 children have the highest poverty rate, with 76 households (14.7%) experiencing poverty. Likewise, among single-mother households, those with 3 or 4 children have the highest poverty rate, with 134 households (56.3%) falling below the poverty line.
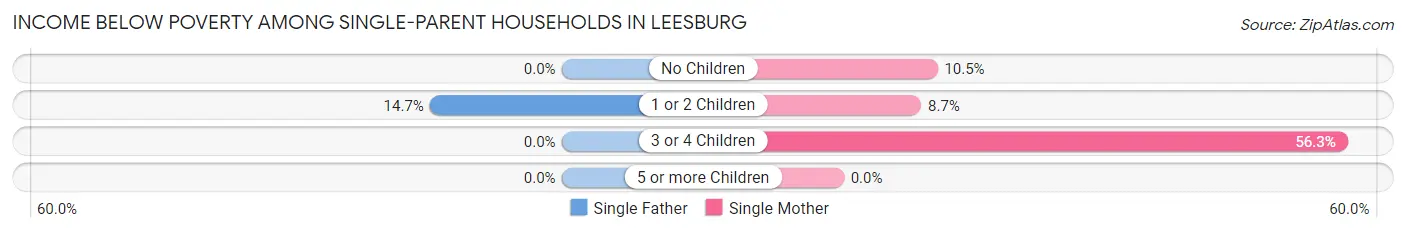
| Children | Single Father | Single Mother |
| No Children | 0 (0.0%) | 48 (10.5%) |
| 1 or 2 Children | 76 (14.7%) | 70 (8.6%) |
| 3 or 4 Children | 0 (0.0%) | 134 (56.3%) |
| 5 or more Children | 0 (0.0%) | 0 (0.0%) |
| Total | 76 (8.3%) | 252 (16.7%) |
Income Below Poverty Among Married-Couple vs Single-Parent Households in Leesburg
The poverty data for Leesburg shows that 162 of the married-couple family households (1.7%) and 328 of the single-parent households (13.5%) are living below the poverty level. Within the married-couple family households, those with 5 or more children have the highest poverty rate, with 17 households (31.5%) falling below the poverty line. Among the single-parent households, those with 3 or 4 children have the highest poverty rate, with 134 household (41.2%) living below poverty.
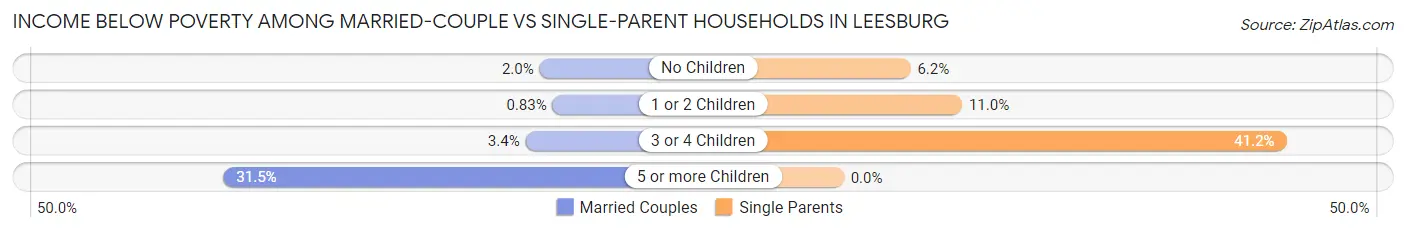
| Children | Married-Couple Families | Single-Parent Households |
| No Children | 80 (2.0%) | 48 (6.2%) |
| 1 or 2 Children | 38 (0.8%) | 146 (11.0%) |
| 3 or 4 Children | 27 (3.4%) | 134 (41.2%) |
| 5 or more Children | 17 (31.5%) | 0 (0.0%) |
| Total | 162 (1.7%) | 328 (13.5%) |
Race in Leesburg
The most populous races in Leesburg are White / Caucasian (30,716 | 63.4%), Hispanic or Latino (8,103 | 16.7%), and Two or more Races (5,757 | 11.9%).
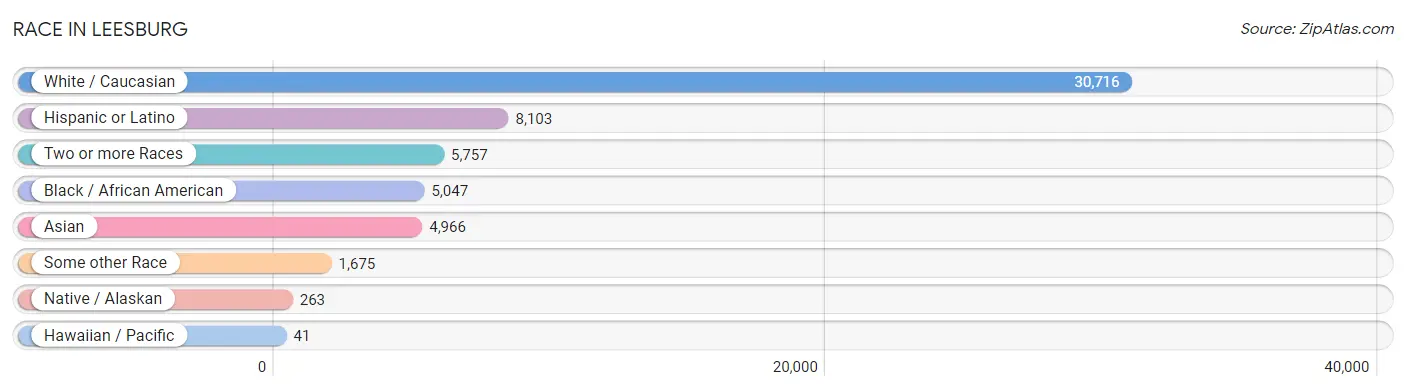
| Race | # Population | % Population |
| Asian | 4,966 | 10.2% |
| Black / African American | 5,047 | 10.4% |
| Hawaiian / Pacific | 41 | 0.1% |
| Hispanic or Latino | 8,103 | 16.7% |
| Native / Alaskan | 263 | 0.5% |
| White / Caucasian | 30,716 | 63.4% |
| Two or more Races | 5,757 | 11.9% |
| Some other Race | 1,675 | 3.5% |
| Total | 48,465 | 100.0% |
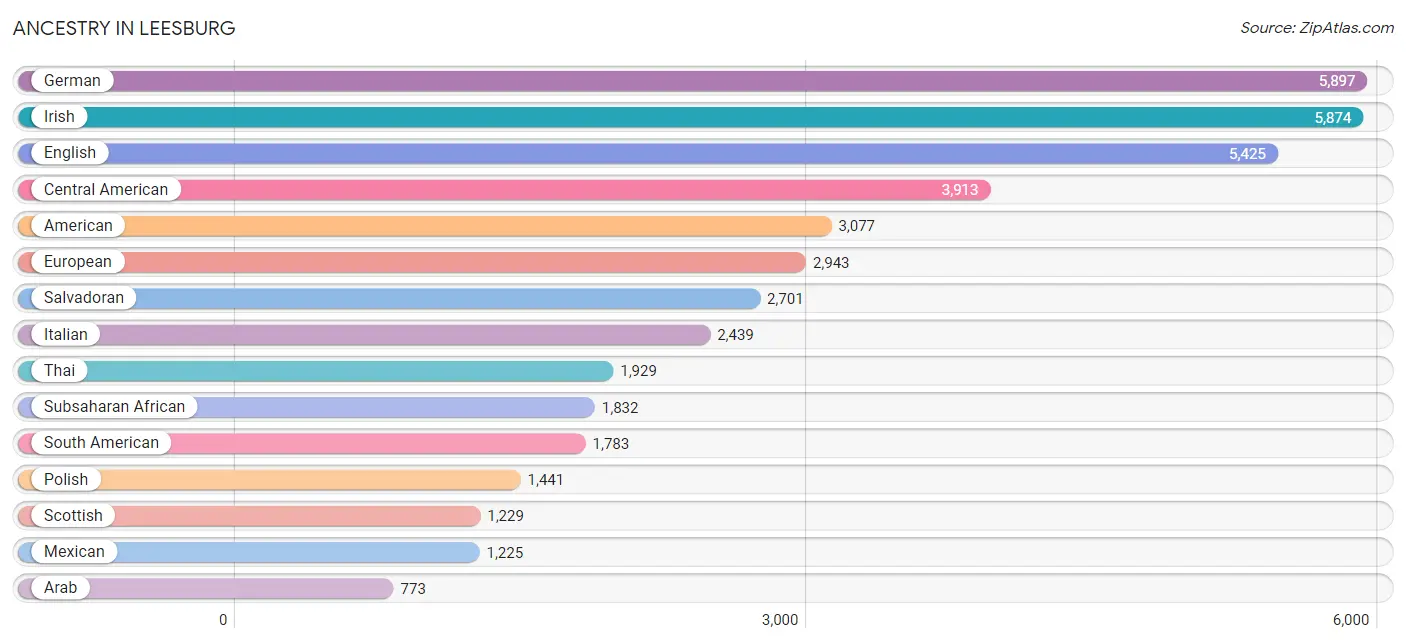
Ancestry in Leesburg
The most populous ancestries reported in Leesburg are German (5,897 | 12.2%), Irish (5,874 | 12.1%), English (5,425 | 11.2%), Central American (3,913 | 8.1%), and American (3,077 | 6.4%), together accounting for 49.9% of all Leesburg residents.
| Ancestry | # Population | % Population |
| Afghan | 22 | 0.1% |
| African | 680 | 1.4% |
| Albanian | 29 | 0.1% |
| American | 3,077 | 6.4% |
| Arab | 773 | 1.6% |
| Argentinean | 12 | 0.0% |
| Armenian | 26 | 0.1% |
| Australian | 40 | 0.1% |
| Austrian | 38 | 0.1% |
| Belgian | 48 | 0.1% |
| Bhutanese | 144 | 0.3% |
| Bolivian | 580 | 1.2% |
| Brazilian | 9 | 0.0% |
| British | 417 | 0.9% |
| Burmese | 436 | 0.9% |
| Cambodian | 9 | 0.0% |
| Canadian | 142 | 0.3% |
| Celtic | 3 | 0.0% |
| Central American | 3,913 | 8.1% |
| Central American Indian | 115 | 0.2% |
| Cherokee | 72 | 0.2% |
| Chilean | 144 | 0.3% |
| Chippewa | 7 | 0.0% |
| Colombian | 182 | 0.4% |
| Costa Rican | 78 | 0.2% |
| Creek | 15 | 0.0% |
| Croatian | 40 | 0.1% |
| Cuban | 156 | 0.3% |
| Czech | 66 | 0.1% |
| Czechoslovakian | 22 | 0.1% |
| Danish | 86 | 0.2% |
| Dutch | 598 | 1.2% |
| Eastern European | 135 | 0.3% |
| Ecuadorian | 169 | 0.4% |
| Egyptian | 329 | 0.7% |
| English | 5,425 | 11.2% |
| Ethiopian | 173 | 0.4% |
| European | 2,943 | 6.1% |
| Finnish | 22 | 0.1% |
| French | 708 | 1.5% |
| French Canadian | 200 | 0.4% |
| German | 5,897 | 12.2% |
| Ghanaian | 123 | 0.3% |
| Greek | 284 | 0.6% |
| Guamanian / Chamorro | 15 | 0.0% |
| Guatemalan | 273 | 0.6% |
| Guyanese | 40 | 0.1% |
| Honduran | 694 | 1.4% |
| Hungarian | 63 | 0.1% |
| Indian (Asian) | 702 | 1.5% |
| Indonesian | 36 | 0.1% |
| Iranian | 234 | 0.5% |
| Iraqi | 23 | 0.1% |
| Irish | 5,874 | 12.1% |
| Italian | 2,439 | 5.0% |
| Japanese | 25 | 0.1% |
| Kiowa | 48 | 0.1% |
| Korean | 672 | 1.4% |
| Laotian | 7 | 0.0% |
| Latvian | 3 | 0.0% |
| Lebanese | 150 | 0.3% |
| Liberian | 28 | 0.1% |
| Lithuanian | 68 | 0.1% |
| Malaysian | 49 | 0.1% |
| Mexican | 1,225 | 2.5% |
| Mexican American Indian | 162 | 0.3% |
| Moroccan | 52 | 0.1% |
| Native Hawaiian | 26 | 0.1% |
| Nicaraguan | 94 | 0.2% |
| Nigerian | 378 | 0.8% |
| Northern European | 120 | 0.3% |
| Norwegian | 504 | 1.0% |
| Pakistani | 141 | 0.3% |
| Palestinian | 63 | 0.1% |
| Panamanian | 44 | 0.1% |
| Paraguayan | 17 | 0.0% |
| Pennsylvania German | 54 | 0.1% |
| Peruvian | 623 | 1.3% |
| Polish | 1,441 | 3.0% |
| Portuguese | 39 | 0.1% |
| Puerto Rican | 610 | 1.3% |
| Romanian | 103 | 0.2% |
| Russian | 436 | 0.9% |
| Salvadoran | 2,701 | 5.6% |
| Scandinavian | 123 | 0.3% |
| Scotch-Irish | 510 | 1.1% |
| Scottish | 1,229 | 2.5% |
| Seminole | 19 | 0.0% |
| Serbian | 17 | 0.0% |
| Sierra Leonean | 19 | 0.0% |
| Slavic | 27 | 0.1% |
| Slovak | 263 | 0.5% |
| Somali | 285 | 0.6% |
| South African | 38 | 0.1% |
| South American | 1,783 | 3.7% |
| South American Indian | 107 | 0.2% |
| Spaniard | 128 | 0.3% |
| Spanish | 110 | 0.2% |
| Spanish American Indian | 155 | 0.3% |
| Sri Lankan | 282 | 0.6% |
| Subsaharan African | 1,832 | 3.8% |
| Swedish | 310 | 0.6% |
| Swiss | 52 | 0.1% |
| Thai | 1,929 | 4.0% |
| Trinidadian and Tobagonian | 130 | 0.3% |
| Turkish | 141 | 0.3% |
| Ukrainian | 165 | 0.3% |
| Uruguayan | 10 | 0.0% |
| Venezuelan | 46 | 0.1% |
| Welsh | 568 | 1.2% |
| West Indian | 36 | 0.1% |
| Yugoslavian | 100 | 0.2% | View All 112 Rows |
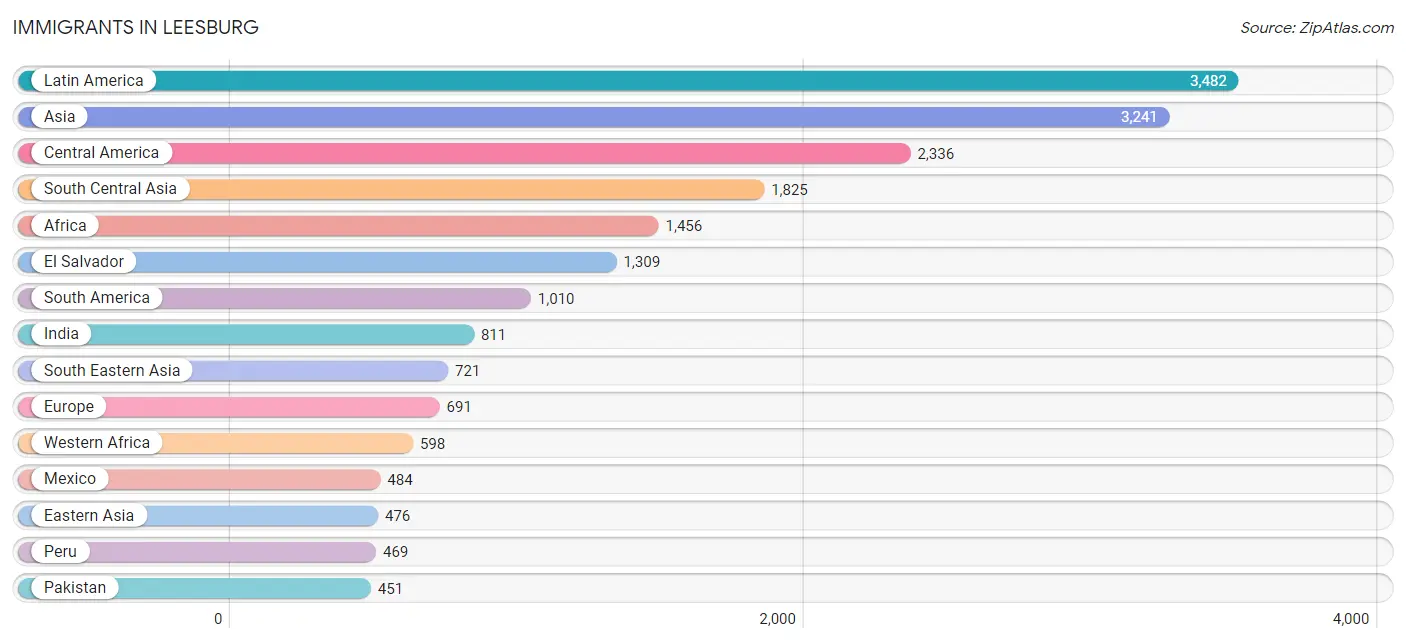
Immigrants in Leesburg
The most numerous immigrant groups reported in Leesburg came from Latin America (3,482 | 7.2%), Asia (3,241 | 6.7%), Central America (2,336 | 4.8%), South Central Asia (1,825 | 3.8%), and Africa (1,456 | 3.0%), together accounting for 25.5% of all Leesburg residents.
| Immigration Origin | # Population | % Population |
| Afghanistan | 61 | 0.1% |
| Africa | 1,456 | 3.0% |
| Argentina | 22 | 0.1% |
| Asia | 3,241 | 6.7% |
| Australia | 16 | 0.0% |
| Bangladesh | 248 | 0.5% |
| Bolivia | 358 | 0.7% |
| Bosnia and Herzegovina | 73 | 0.2% |
| Brazil | 10 | 0.0% |
| Cambodia | 25 | 0.1% |
| Cameroon | 11 | 0.0% |
| Canada | 150 | 0.3% |
| Caribbean | 136 | 0.3% |
| Central America | 2,336 | 4.8% |
| China | 184 | 0.4% |
| Colombia | 89 | 0.2% |
| Costa Rica | 4 | 0.0% |
| Croatia | 16 | 0.0% |
| Cuba | 24 | 0.1% |
| Denmark | 4 | 0.0% |
| Eastern Africa | 337 | 0.7% |
| Eastern Asia | 476 | 1.0% |
| Eastern Europe | 256 | 0.5% |
| Ecuador | 16 | 0.0% |
| Egypt | 315 | 0.6% |
| El Salvador | 1,309 | 2.7% |
| England | 50 | 0.1% |
| Ethiopia | 193 | 0.4% |
| Europe | 691 | 1.4% |
| France | 21 | 0.0% |
| Germany | 237 | 0.5% |
| Ghana | 115 | 0.2% |
| Guatemala | 157 | 0.3% |
| Honduras | 303 | 0.6% |
| India | 811 | 1.7% |
| Iran | 134 | 0.3% |
| Iraq | 23 | 0.1% |
| Israel | 63 | 0.1% |
| Japan | 10 | 0.0% |
| Kazakhstan | 26 | 0.1% |
| Korea | 273 | 0.6% |
| Laos | 49 | 0.1% |
| Latin America | 3,482 | 7.2% |
| Lebanon | 12 | 0.0% |
| Liberia | 28 | 0.1% |
| Mexico | 484 | 1.0% |
| Middle Africa | 121 | 0.3% |
| Moldova | 28 | 0.1% |
| Morocco | 33 | 0.1% |
| Nepal | 56 | 0.1% |
| Netherlands | 23 | 0.1% |
| Nicaragua | 59 | 0.1% |
| Nigeria | 378 | 0.8% |
| Northern Africa | 362 | 0.7% |
| Northern Europe | 145 | 0.3% |
| Oceania | 16 | 0.0% |
| Pakistan | 451 | 0.9% |
| Panama | 20 | 0.0% |
| Peru | 469 | 1.0% |
| Philippines | 368 | 0.8% |
| Poland | 47 | 0.1% |
| Romania | 16 | 0.0% |
| Russia | 50 | 0.1% |
| Scotland | 10 | 0.0% |
| Sierra Leone | 19 | 0.0% |
| Somalia | 132 | 0.3% |
| South Africa | 38 | 0.1% |
| South America | 1,010 | 2.1% |
| South Central Asia | 1,825 | 3.8% |
| South Eastern Asia | 721 | 1.5% |
| Southern Europe | 9 | 0.0% |
| Spain | 9 | 0.0% |
| Sri Lanka | 38 | 0.1% |
| Taiwan | 18 | 0.0% |
| Thailand | 128 | 0.3% |
| Trinidad and Tobago | 112 | 0.2% |
| Turkey | 57 | 0.1% |
| Ukraine | 26 | 0.1% |
| Venezuela | 46 | 0.1% |
| Vietnam | 123 | 0.3% |
| Western Africa | 598 | 1.2% |
| Western Asia | 219 | 0.4% |
| Western Europe | 281 | 0.6% |
| Zaire | 110 | 0.2% | View All 84 Rows |
Sex and Age in Leesburg
Sex and Age in Leesburg
The most populous age groups in Leesburg are 40 to 44 Years (2,304 | 9.4%) for men and 30 to 34 Years (2,083 | 8.7%) for women.
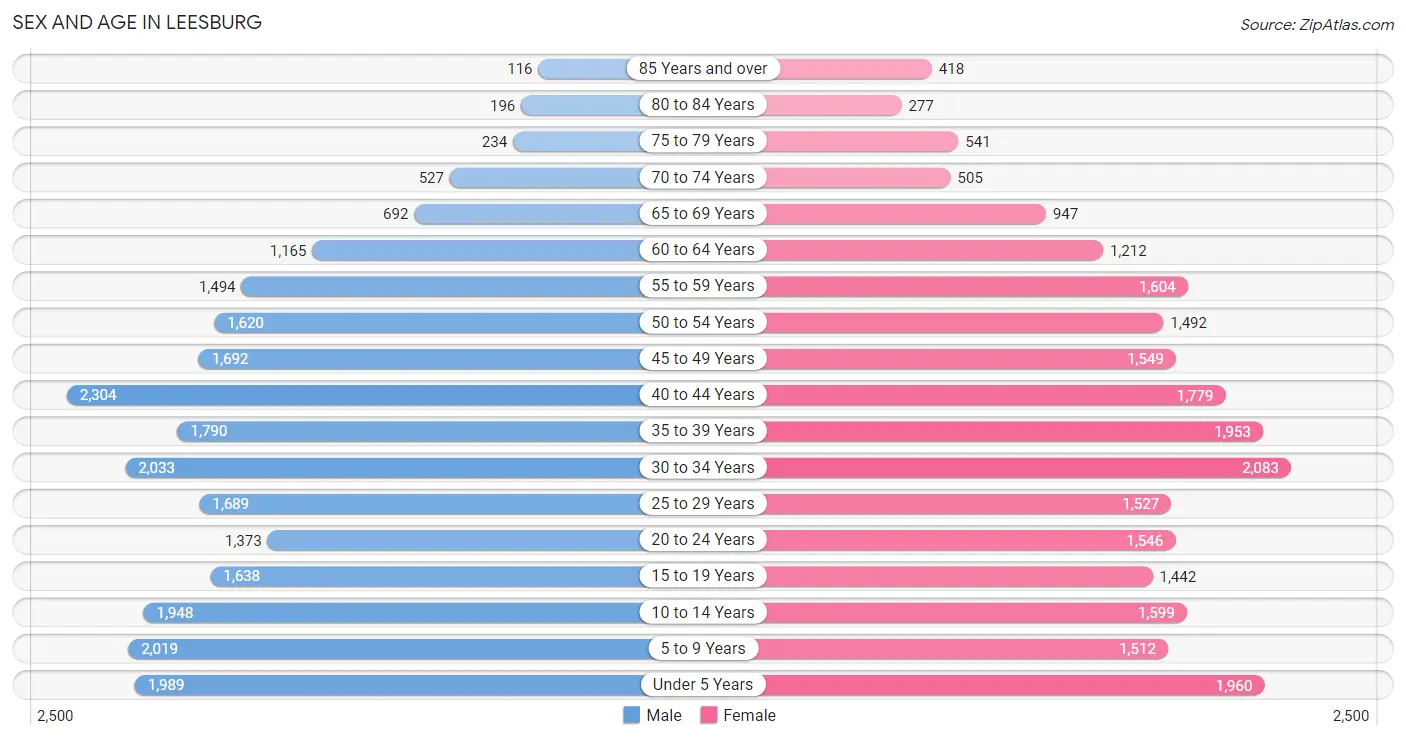
| Age Bracket | Male | Female |
| Under 5 Years | 1,989 (8.1%) | 1,960 (8.2%) |
| 5 to 9 Years | 2,019 (8.2%) | 1,512 (6.3%) |
| 10 to 14 Years | 1,948 (7.9%) | 1,599 (6.7%) |
| 15 to 19 Years | 1,638 (6.7%) | 1,442 (6.0%) |
| 20 to 24 Years | 1,373 (5.6%) | 1,546 (6.5%) |
| 25 to 29 Years | 1,689 (6.9%) | 1,527 (6.4%) |
| 30 to 34 Years | 2,033 (8.3%) | 2,083 (8.7%) |
| 35 to 39 Years | 1,790 (7.3%) | 1,953 (8.2%) |
| 40 to 44 Years | 2,304 (9.4%) | 1,779 (7.4%) |
| 45 to 49 Years | 1,692 (6.9%) | 1,549 (6.5%) |
| 50 to 54 Years | 1,620 (6.6%) | 1,492 (6.2%) |
| 55 to 59 Years | 1,494 (6.1%) | 1,604 (6.7%) |
| 60 to 64 Years | 1,165 (4.8%) | 1,212 (5.1%) |
| 65 to 69 Years | 692 (2.8%) | 947 (4.0%) |
| 70 to 74 Years | 527 (2.1%) | 505 (2.1%) |
| 75 to 79 Years | 234 (0.9%) | 541 (2.3%) |
| 80 to 84 Years | 196 (0.8%) | 277 (1.2%) |
| 85 Years and over | 116 (0.5%) | 418 (1.8%) |
| Total | 24,519 (100.0%) | 23,946 (100.0%) |
Families and Households in Leesburg
Median Family Size in Leesburg
The median family size in Leesburg is 3.44 persons per family, with single female/mother families (1,505 | 12.8%) accounting for the largest median family size of 3.78 persons per family. On the other hand, single male/father families (917 | 7.8%) represent the smallest median family size with 2.28 persons per family.
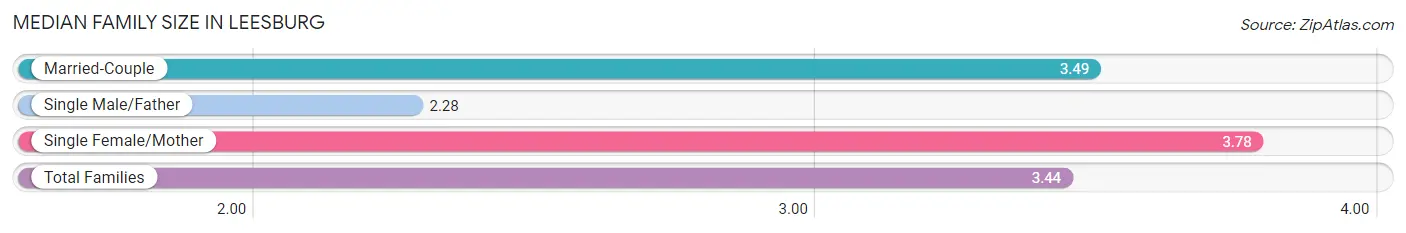
| Family Type | # Families | Family Size |
| Married-Couple | 9,373 (79.5%) | 3.49 |
| Single Male/Father | 917 (7.8%) | 2.28 |
| Single Female/Mother | 1,505 (12.8%) | 3.78 |
| Total Families | 11,795 (100.0%) | 3.44 |
Median Household Size in Leesburg
The median household size in Leesburg is 2.93 persons per household, with single female/mother households (1,505 | 9.1%) accounting for the largest median household size of 4 persons per household. non-family households (4,673 | 28.4%) represent the smallest median household size with 1.46 persons per household.
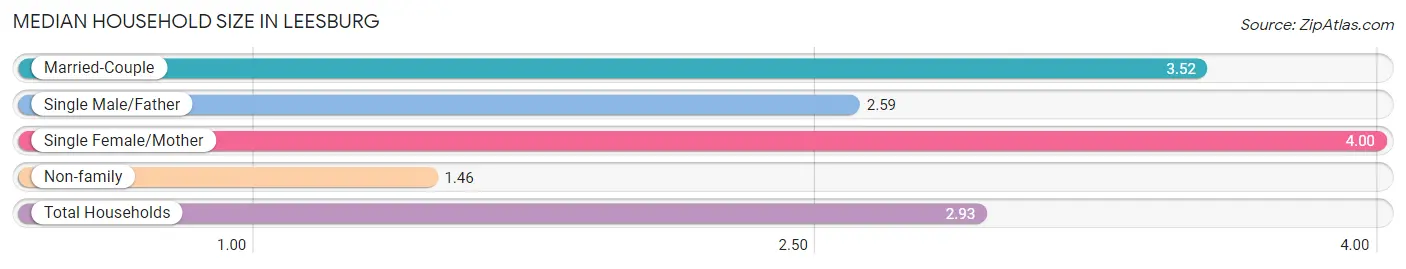
| Household Type | # Households | Household Size |
| Married-Couple | 9,373 (56.9%) | 3.52 |
| Single Male/Father | 917 (5.6%) | 2.59 |
| Single Female/Mother | 1,505 (9.1%) | 4.00 |
| Non-family | 4,673 (28.4%) | 1.46 |
| Total Households | 16,468 (100.0%) | 2.93 |
Household Size by Marriage Status in Leesburg
Out of a total of 16,468 households in Leesburg, 11,795 (71.6%) are family households, while 4,673 (28.4%) are nonfamily households. The most numerous type of family households are 2-person households, comprising 3,547, and the most common type of nonfamily households are 1-person households, comprising 3,185.
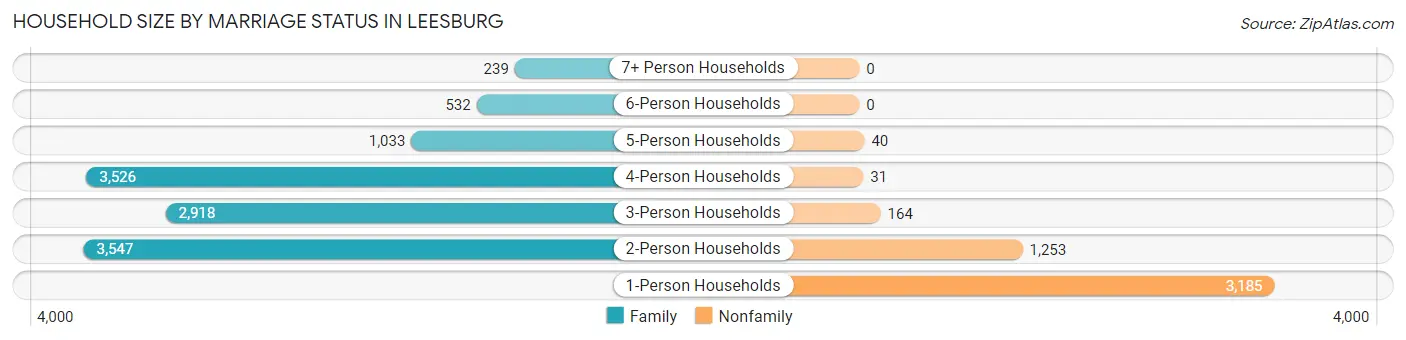
| Household Size | Family Households | Nonfamily Households |
| 1-Person Households | - | 3,185 (19.3%) |
| 2-Person Households | 3,547 (21.5%) | 1,253 (7.6%) |
| 3-Person Households | 2,918 (17.7%) | 164 (1.0%) |
| 4-Person Households | 3,526 (21.4%) | 31 (0.2%) |
| 5-Person Households | 1,033 (6.3%) | 40 (0.2%) |
| 6-Person Households | 532 (3.2%) | 0 (0.0%) |
| 7+ Person Households | 239 (1.5%) | 0 (0.0%) |
| Total | 11,795 (71.6%) | 4,673 (28.4%) |
Female Fertility in Leesburg
Fertility by Age in Leesburg
Average fertility rate in Leesburg is 61.0 births per 1,000 women. Women in the age bracket of 20 to 34 years have the highest fertility rate with 77.0 births per 1,000 women. Women in the age bracket of 20 to 34 years acount for 53.0% of all women with births.
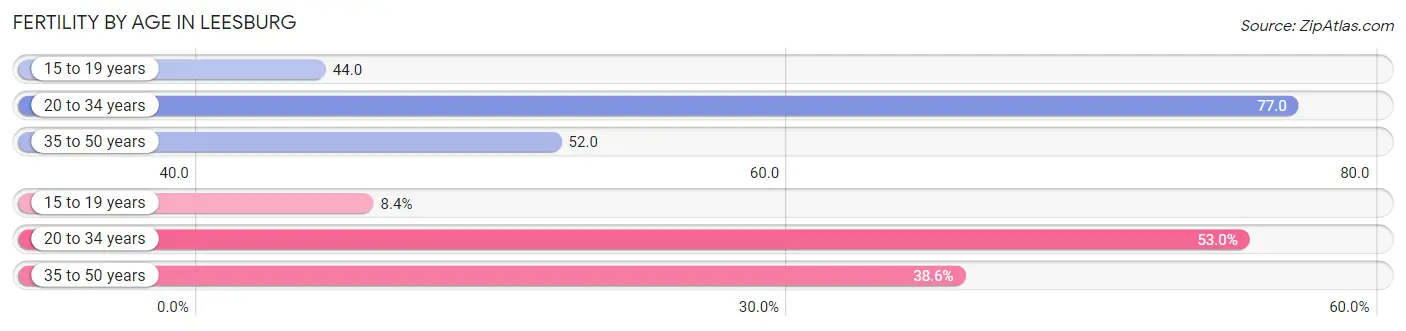
| Age Bracket | Women with Births | Births / 1,000 Women |
| 15 to 19 years | 63 (8.4%) | 44.0 |
| 20 to 34 years | 396 (53.0%) | 77.0 |
| 35 to 50 years | 288 (38.6%) | 52.0 |
| Total | 747 (100.0%) | 61.0 |
Fertility by Age by Marriage Status in Leesburg
78.0% of women with births (747) in Leesburg are married. The highest percentage of unmarried women with births falls into 15 to 19 years age bracket with 100.0% of them unmarried at the time of birth, while the lowest percentage of unmarried women with births belong to 35 to 50 years age bracket with 11.8% of them unmarried.
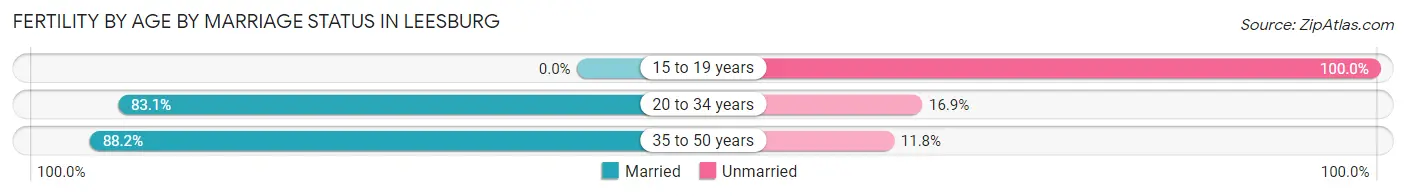
| Age Bracket | Married | Unmarried |
| 15 to 19 years | 0 (0.0%) | 63 (100.0%) |
| 20 to 34 years | 329 (83.1%) | 67 (16.9%) |
| 35 to 50 years | 254 (88.2%) | 34 (11.8%) |
| Total | 583 (78.0%) | 164 (22.0%) |
Fertility by Education in Leesburg
Average fertility rate in Leesburg is 61.0 births per 1,000 women. Women with the education attainment of less than high school have the highest fertility rate of 134.0 births per 1,000 women, while women with the education attainment of college or associate's degree have the lowest fertility at 15.0 births per 1,000 women. Women with the education attainment of bachelor's degree represent 40.4% of all women with births.
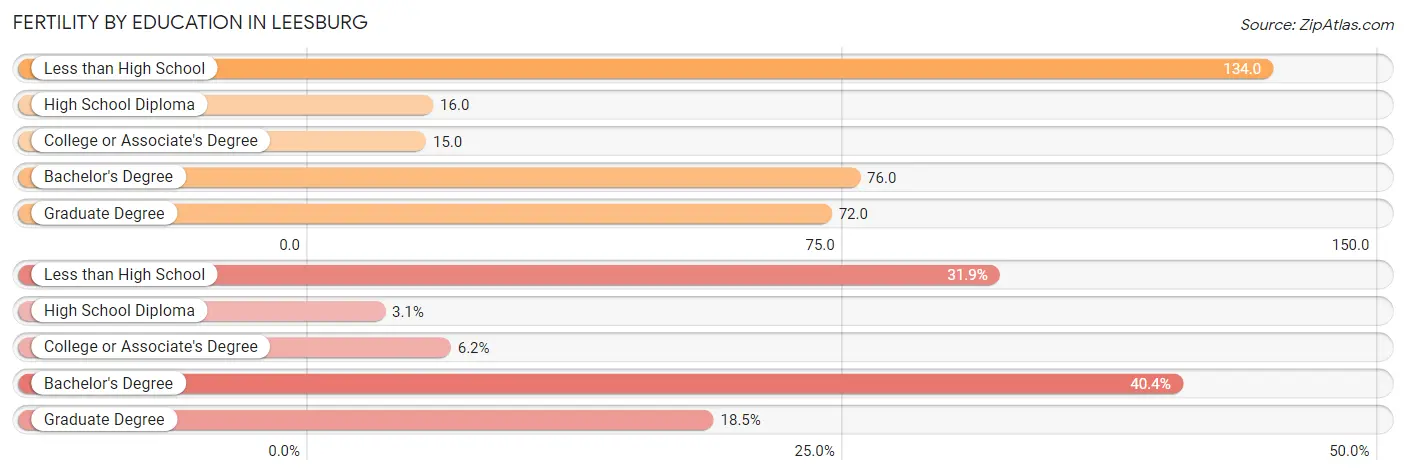
| Educational Attainment | Women with Births | Births / 1,000 Women |
| Less than High School | 238 (31.9%) | 134.0 |
| High School Diploma | 23 (3.1%) | 16.0 |
| College or Associate's Degree | 46 (6.2%) | 15.0 |
| Bachelor's Degree | 302 (40.4%) | 76.0 |
| Graduate Degree | 138 (18.5%) | 72.0 |
| Total | 747 (100.0%) | 61.0 |
Fertility by Education by Marriage Status in Leesburg
22.0% of women with births in Leesburg are unmarried. Women with the educational attainment of college or associate's degree are most likely to be married with 100.0% of them married at childbirth, while women with the educational attainment of high school diploma are least likely to be married with 69.6% of them unmarried at childbirth.
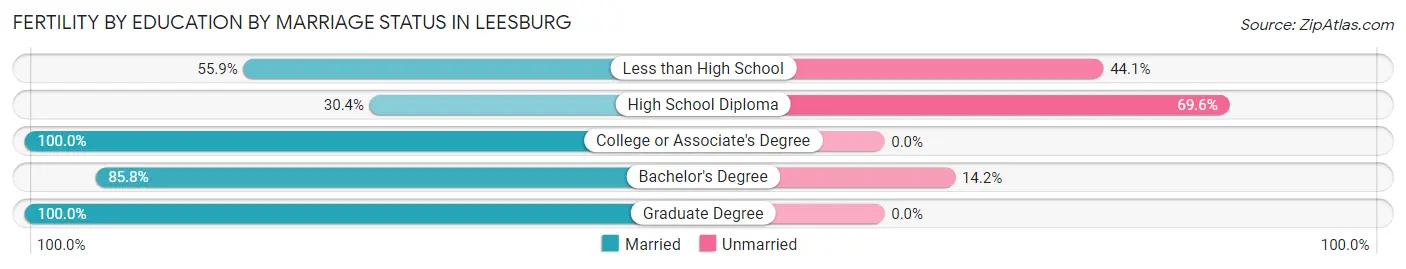
| Educational Attainment | Married | Unmarried |
| Less than High School | 133 (55.9%) | 105 (44.1%) |
| High School Diploma | 7 (30.4%) | 16 (69.6%) |
| College or Associate's Degree | 46 (100.0%) | 0 (0.0%) |
| Bachelor's Degree | 259 (85.8%) | 43 (14.2%) |
| Graduate Degree | 138 (100.0%) | 0 (0.0%) |
| Total | 583 (78.0%) | 164 (22.0%) |
Employment Characteristics in Leesburg
Employment by Class of Employer in Leesburg
Among the 27,206 employed individuals in Leesburg, private company employees (18,222 | 67.0%), local government employees (2,548 | 9.4%), and federal government employees (2,152 | 7.9%) make up the most common classes of employment.
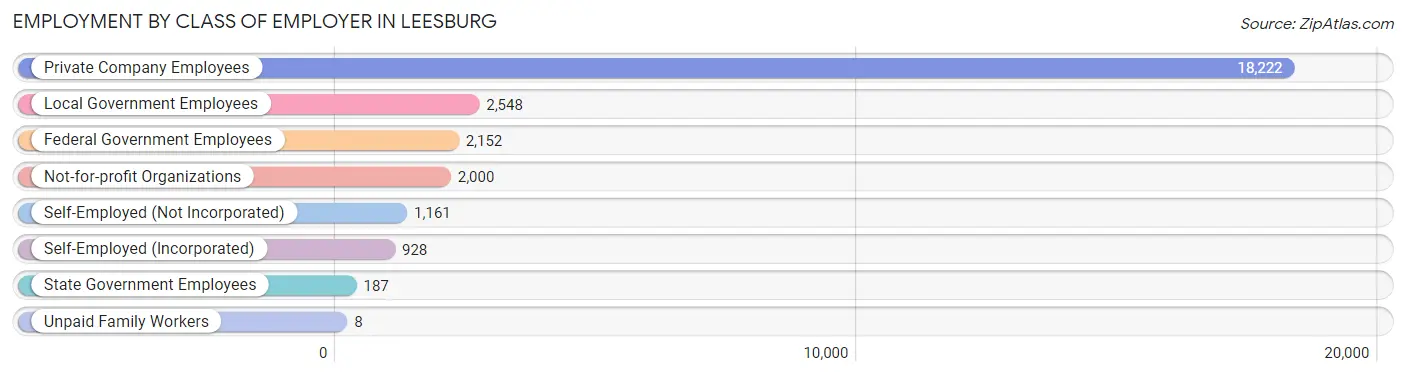
| Employer Class | # Employees | % Employees |
| Private Company Employees | 18,222 | 67.0% |
| Self-Employed (Incorporated) | 928 | 3.4% |
| Self-Employed (Not Incorporated) | 1,161 | 4.3% |
| Not-for-profit Organizations | 2,000 | 7.3% |
| Local Government Employees | 2,548 | 9.4% |
| State Government Employees | 187 | 0.7% |
| Federal Government Employees | 2,152 | 7.9% |
| Unpaid Family Workers | 8 | 0.0% |
| Total | 27,206 | 100.0% |
Employment Status by Age in Leesburg
According to the labor force statistics for Leesburg, out of the total population over 16 years of age (36,908), 76.9% or 28,382 individuals are in the labor force, with 3.1% or 880 of them unemployed. The age group with the highest labor force participation rate is 25 to 29 years, with 92.4% or 2,972 individuals in the labor force. Within the labor force, the 16 to 19 years age range has the highest percentage of unemployed individuals, with 8.3% or 104 of them being unemployed.
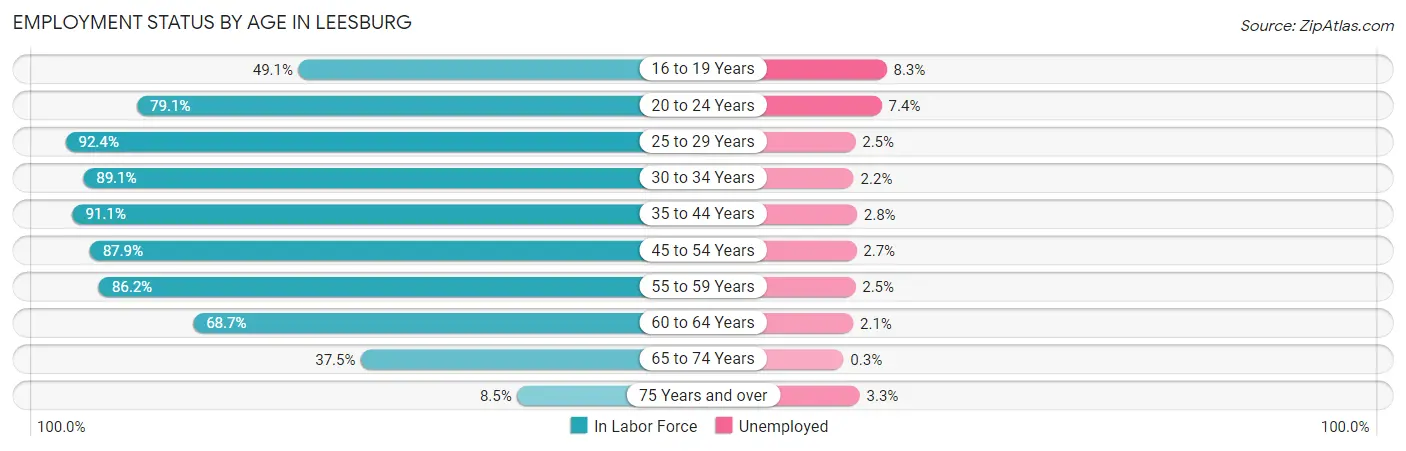
| Age Bracket | In Labor Force | Unemployed |
| 16 to 19 Years | 1,252 (49.1%) | 104 (8.3%) |
| 20 to 24 Years | 2,309 (79.1%) | 171 (7.4%) |
| 25 to 29 Years | 2,972 (92.4%) | 74 (2.5%) |
| 30 to 34 Years | 3,667 (89.1%) | 81 (2.2%) |
| 35 to 44 Years | 7,129 (91.1%) | 200 (2.8%) |
| 45 to 54 Years | 5,584 (87.9%) | 151 (2.7%) |
| 55 to 59 Years | 2,670 (86.2%) | 67 (2.5%) |
| 60 to 64 Years | 1,633 (68.7%) | 34 (2.1%) |
| 65 to 74 Years | 1,002 (37.5%) | 3 (0.3%) |
| 75 Years and over | 151 (8.5%) | 5 (3.3%) |
| Total | 28,382 (76.9%) | 880 (3.1%) |
Employment Status by Educational Attainment in Leesburg
According to labor force statistics for Leesburg, 87.7% of individuals (23,667) out of the total population between 25 and 64 years of age (26,986) are in the labor force, with 2.6% or 615 of them being unemployed. The group with the highest labor force participation rate are those with the educational attainment of bachelor's degree or higher, with 90.7% or 14,296 individuals in the labor force. Within the labor force, individuals with less than high school education have the highest percentage of unemployment, with 14.6% or 207 of them being unemployed.
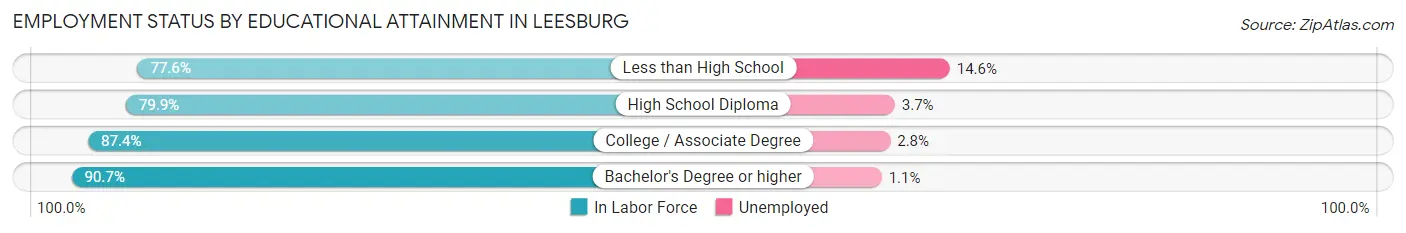
| Educational Attainment | In Labor Force | Unemployed |
| Less than High School | 1,415 (77.6%) | 266 (14.6%) |
| High School Diploma | 2,797 (79.9%) | 130 (3.7%) |
| College / Associate Degree | 5,156 (87.4%) | 165 (2.8%) |
| Bachelor's Degree or higher | 14,296 (90.7%) | 173 (1.1%) |
| Total | 23,667 (87.7%) | 702 (2.6%) |
Employment Occupations by Sex in Leesburg
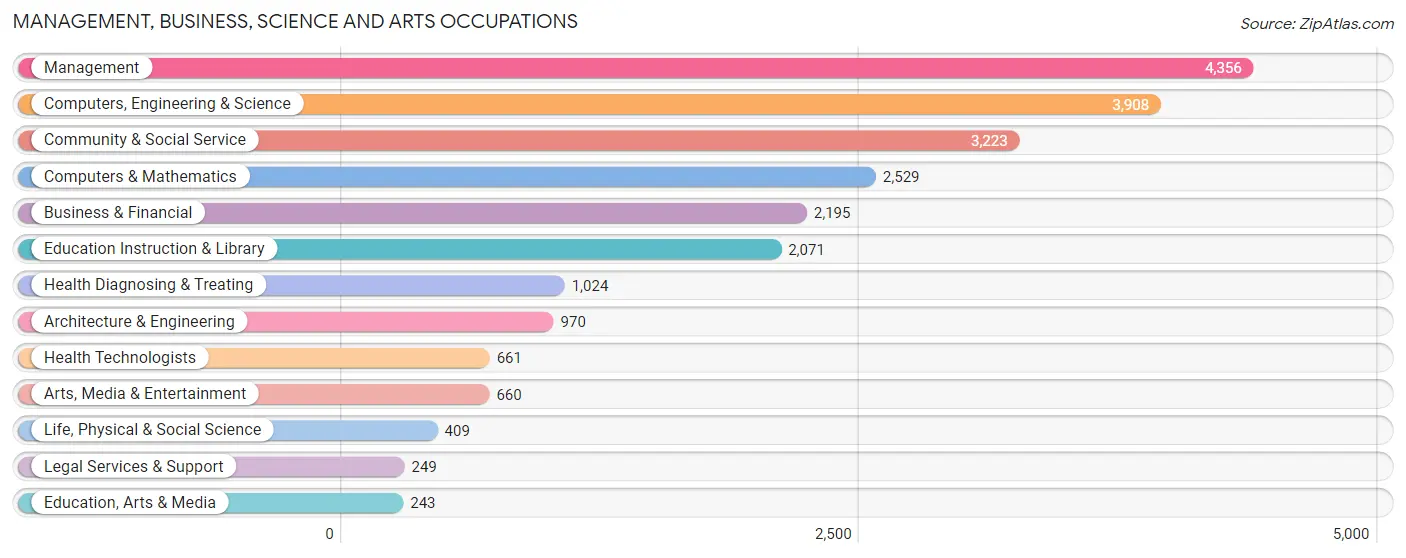
Management, Business, Science and Arts Occupations
The most common Management, Business, Science and Arts occupations in Leesburg are Management (4,356 | 15.9%), Computers, Engineering & Science (3,908 | 14.3%), Community & Social Service (3,223 | 11.8%), Computers & Mathematics (2,529 | 9.2%), and Business & Financial (2,195 | 8.0%).
Management, Business, Science and Arts Occupations by Sex
Within the Management, Business, Science and Arts occupations in Leesburg, the most male-oriented occupations are Architecture & Engineering (82.2%), Computers & Mathematics (80.6%), and Computers, Engineering & Science (79.5%), while the most female-oriented occupations are Education Instruction & Library (79.1%), Community & Social Service (67.6%), and Legal Services & Support (65.9%).
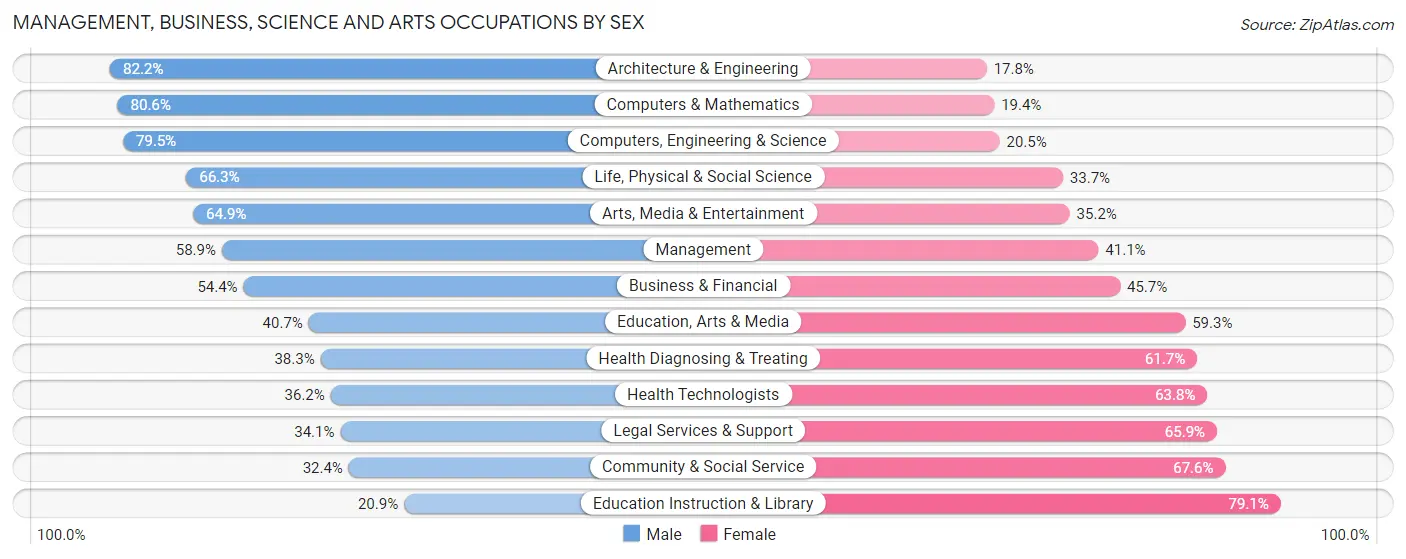
| Occupation | Male | Female |
| Management | 2,564 (58.9%) | 1,792 (41.1%) |
| Business & Financial | 1,193 (54.3%) | 1,002 (45.7%) |
| Computers, Engineering & Science | 3,106 (79.5%) | 802 (20.5%) |
| Computers & Mathematics | 2,038 (80.6%) | 491 (19.4%) |
| Architecture & Engineering | 797 (82.2%) | 173 (17.8%) |
| Life, Physical & Social Science | 271 (66.3%) | 138 (33.7%) |
| Community & Social Service | 1,044 (32.4%) | 2,179 (67.6%) |
| Education, Arts & Media | 99 (40.7%) | 144 (59.3%) |
| Legal Services & Support | 85 (34.1%) | 164 (65.9%) |
| Education Instruction & Library | 432 (20.9%) | 1,639 (79.1%) |
| Arts, Media & Entertainment | 428 (64.8%) | 232 (35.1%) |
| Health Diagnosing & Treating | 392 (38.3%) | 632 (61.7%) |
| Health Technologists | 239 (36.2%) | 422 (63.8%) |
| Total (Category) | 8,299 (56.4%) | 6,407 (43.6%) |
| Total (Overall) | 14,671 (53.6%) | 12,690 (46.4%) |
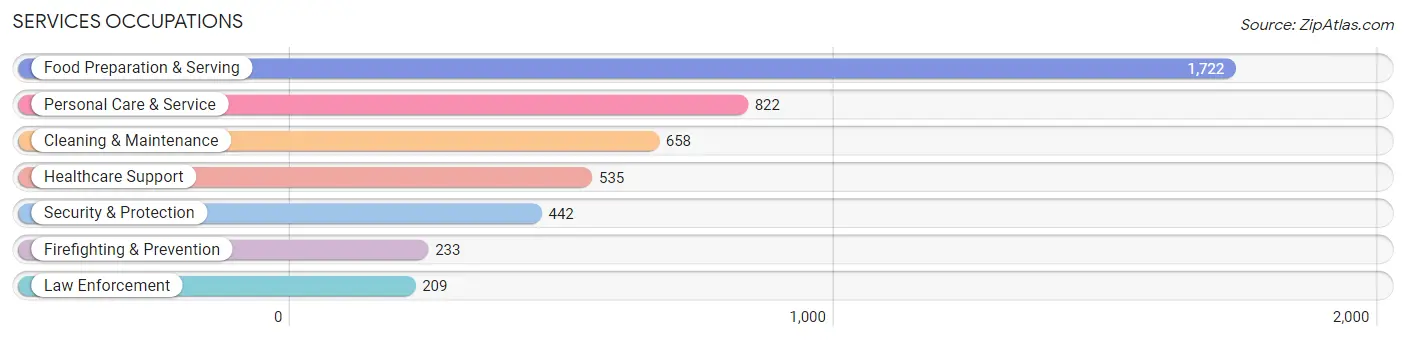
Services Occupations
The most common Services occupations in Leesburg are Food Preparation & Serving (1,722 | 6.3%), Personal Care & Service (822 | 3.0%), Cleaning & Maintenance (658 | 2.4%), Healthcare Support (535 | 2.0%), and Security & Protection (442 | 1.6%).
Services Occupations by Sex
Within the Services occupations in Leesburg, the most male-oriented occupations are Law Enforcement (91.4%), Security & Protection (87.1%), and Firefighting & Prevention (83.3%), while the most female-oriented occupations are Personal Care & Service (92.0%), Healthcare Support (83.2%), and Food Preparation & Serving (51.4%).
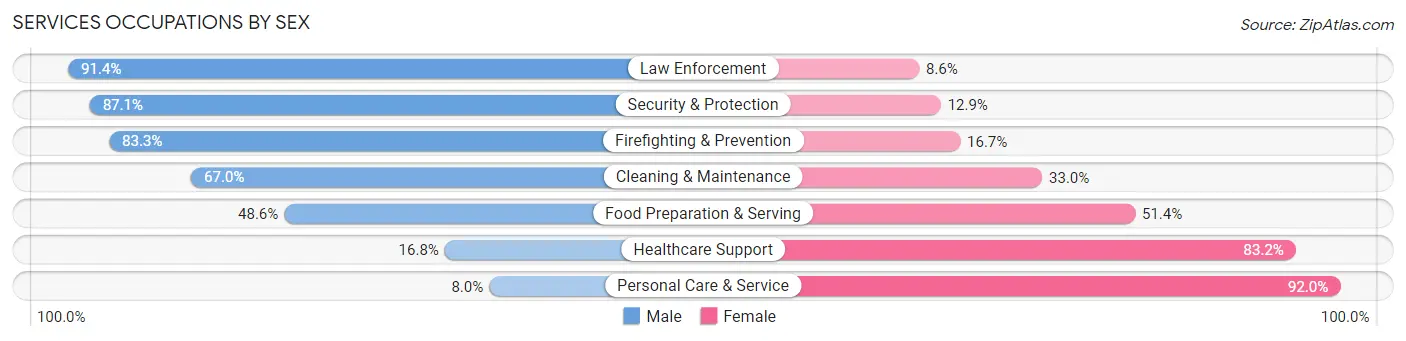
| Occupation | Male | Female |
| Healthcare Support | 90 (16.8%) | 445 (83.2%) |
| Security & Protection | 385 (87.1%) | 57 (12.9%) |
| Firefighting & Prevention | 194 (83.3%) | 39 (16.7%) |
| Law Enforcement | 191 (91.4%) | 18 (8.6%) |
| Food Preparation & Serving | 837 (48.6%) | 885 (51.4%) |
| Cleaning & Maintenance | 441 (67.0%) | 217 (33.0%) |
| Personal Care & Service | 66 (8.0%) | 756 (92.0%) |
| Total (Category) | 1,819 (43.5%) | 2,360 (56.5%) |
| Total (Overall) | 14,671 (53.6%) | 12,690 (46.4%) |
Sales and Office Occupations
The most common Sales and Office occupations in Leesburg are Sales & Related (2,748 | 10.0%), and Office & Administration (2,553 | 9.3%).

Sales and Office Occupations by Sex
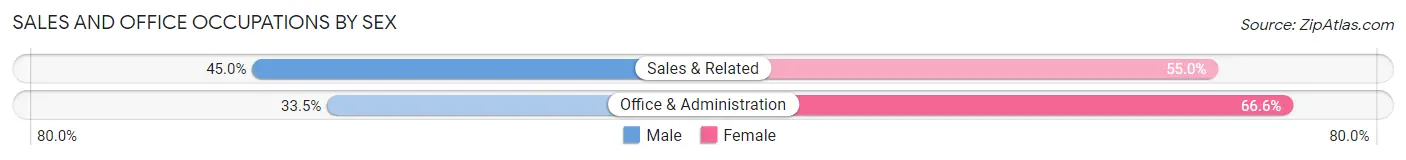
| Occupation | Male | Female |
| Sales & Related | 1,236 (45.0%) | 1,512 (55.0%) |
| Office & Administration | 854 (33.5%) | 1,699 (66.5%) |
| Total (Category) | 2,090 (39.4%) | 3,211 (60.6%) |
| Total (Overall) | 14,671 (53.6%) | 12,690 (46.4%) |
Natural Resources, Construction and Maintenance Occupations
The most common Natural Resources, Construction and Maintenance occupations in Leesburg are Construction & Extraction (678 | 2.5%), Installation, Maintenance & Repair (293 | 1.1%), and Farming, Fishing & Forestry (81 | 0.3%).

Natural Resources, Construction and Maintenance Occupations by Sex
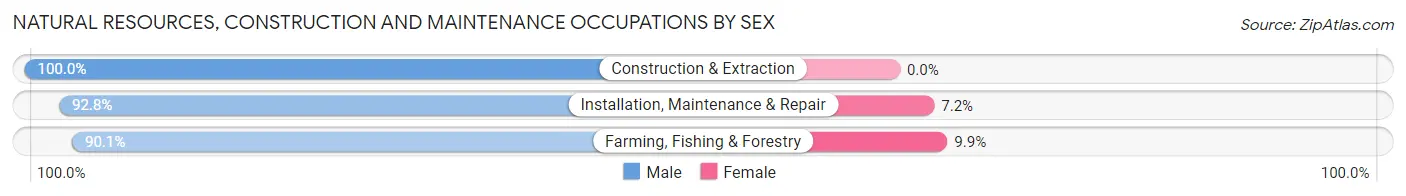
| Occupation | Male | Female |
| Farming, Fishing & Forestry | 73 (90.1%) | 8 (9.9%) |
| Construction & Extraction | 678 (100.0%) | 0 (0.0%) |
| Installation, Maintenance & Repair | 272 (92.8%) | 21 (7.2%) |
| Total (Category) | 1,023 (97.2%) | 29 (2.8%) |
| Total (Overall) | 14,671 (53.6%) | 12,690 (46.4%) |
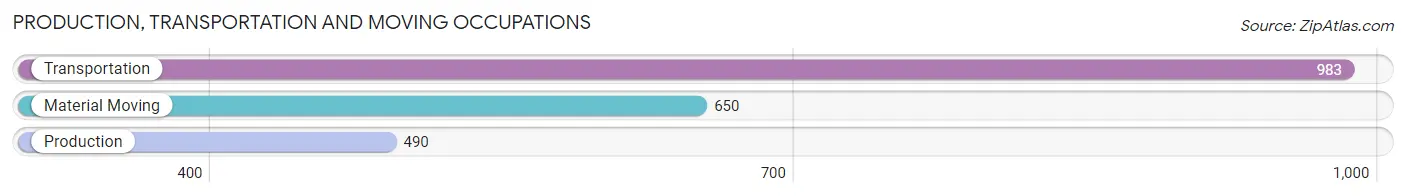
Production, Transportation and Moving Occupations
The most common Production, Transportation and Moving occupations in Leesburg are Transportation (983 | 3.6%), Material Moving (650 | 2.4%), and Production (490 | 1.8%).
Production, Transportation and Moving Occupations by Sex
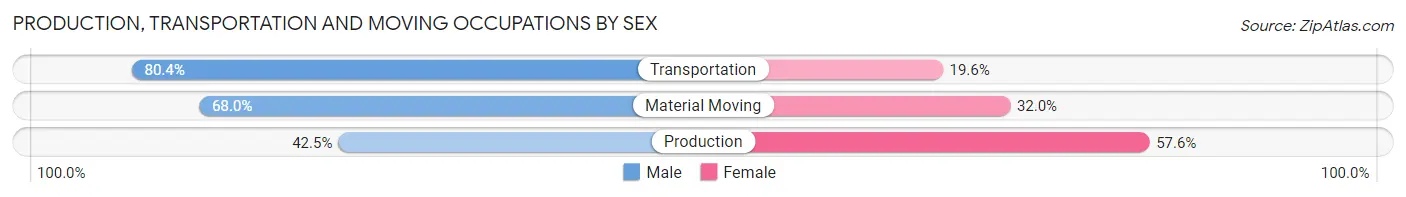
| Occupation | Male | Female |
| Production | 208 (42.4%) | 282 (57.6%) |
| Transportation | 790 (80.4%) | 193 (19.6%) |
| Material Moving | 442 (68.0%) | 208 (32.0%) |
| Total (Category) | 1,440 (67.8%) | 683 (32.2%) |
| Total (Overall) | 14,671 (53.6%) | 12,690 (46.4%) |
Employment Industries by Sex in Leesburg
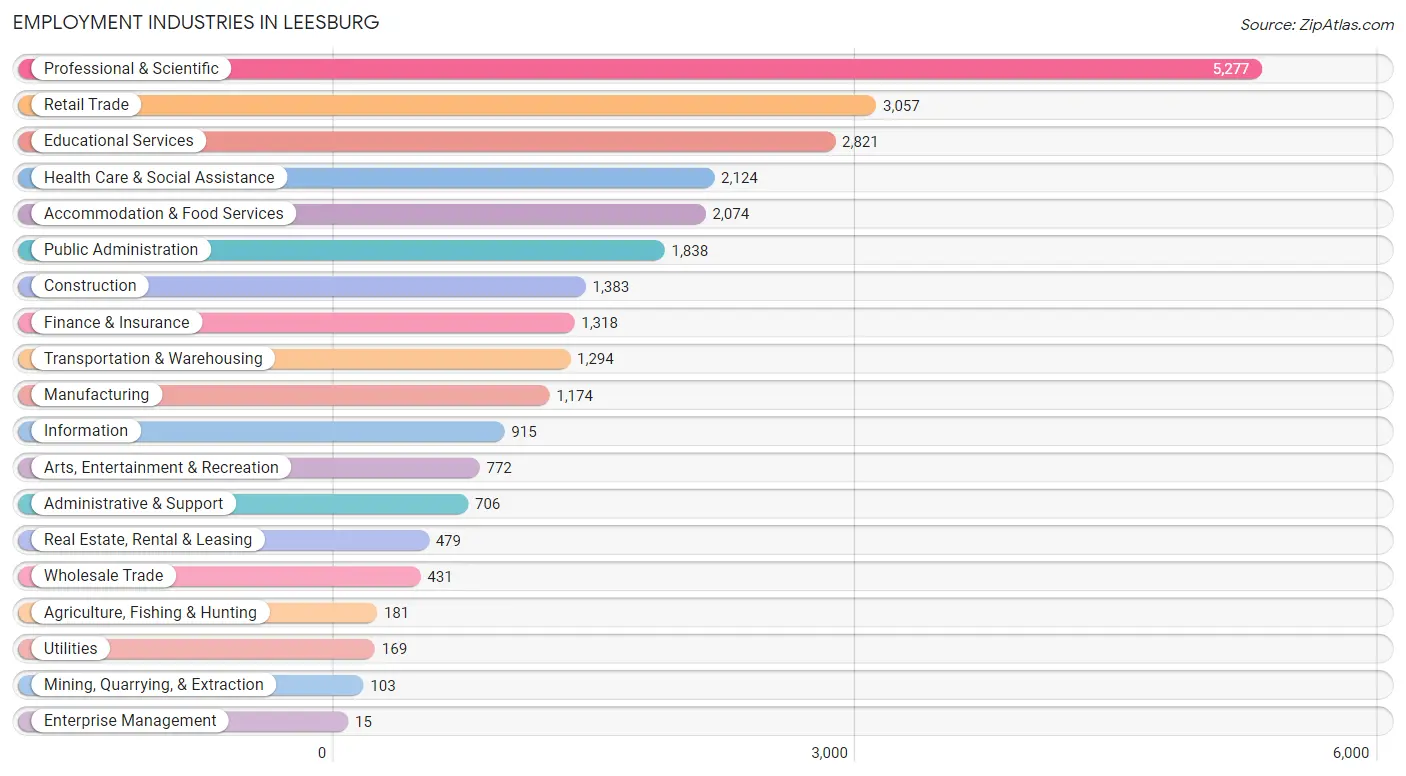
Employment Industries in Leesburg
The major employment industries in Leesburg include Professional & Scientific (5,277 | 19.3%), Retail Trade (3,057 | 11.2%), Educational Services (2,821 | 10.3%), Health Care & Social Assistance (2,124 | 7.8%), and Accommodation & Food Services (2,074 | 7.6%).
Employment Industries by Sex in Leesburg
The Leesburg industries that see more men than women are Mining, Quarrying, & Extraction (100.0%), Enterprise Management (100.0%), and Construction (89.8%), whereas the industries that tend to have a higher number of women are Health Care & Social Assistance (77.3%), Educational Services (74.4%), and Retail Trade (56.6%).
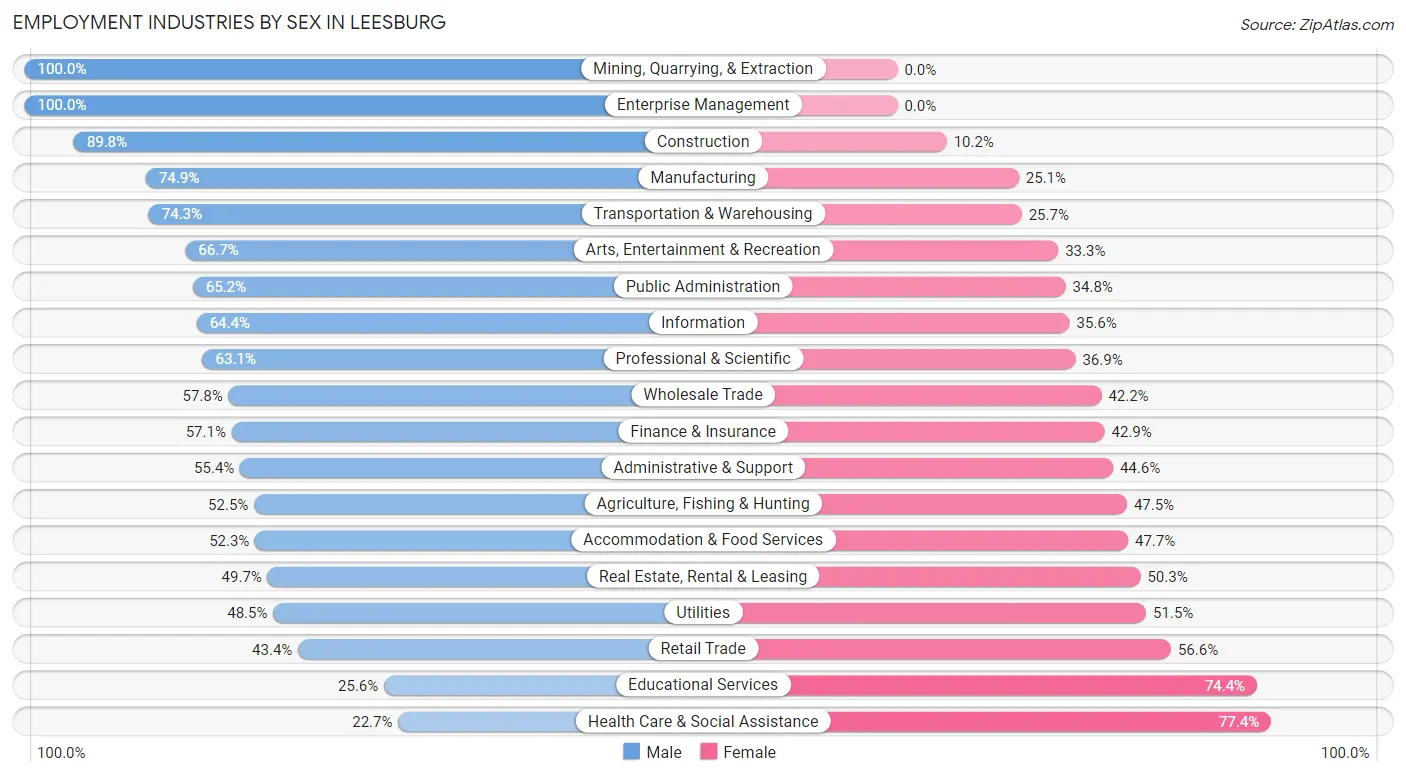
| Industry | Male | Female |
| Agriculture, Fishing & Hunting | 95 (52.5%) | 86 (47.5%) |
| Mining, Quarrying, & Extraction | 103 (100.0%) | 0 (0.0%) |
| Construction | 1,242 (89.8%) | 141 (10.2%) |
| Manufacturing | 879 (74.9%) | 295 (25.1%) |
| Wholesale Trade | 249 (57.8%) | 182 (42.2%) |
| Retail Trade | 1,326 (43.4%) | 1,731 (56.6%) |
| Transportation & Warehousing | 961 (74.3%) | 333 (25.7%) |
| Utilities | 82 (48.5%) | 87 (51.5%) |
| Information | 589 (64.4%) | 326 (35.6%) |
| Finance & Insurance | 753 (57.1%) | 565 (42.9%) |
| Real Estate, Rental & Leasing | 238 (49.7%) | 241 (50.3%) |
| Professional & Scientific | 3,332 (63.1%) | 1,945 (36.9%) |
| Enterprise Management | 15 (100.0%) | 0 (0.0%) |
| Administrative & Support | 391 (55.4%) | 315 (44.6%) |
| Educational Services | 722 (25.6%) | 2,099 (74.4%) |
| Health Care & Social Assistance | 481 (22.7%) | 1,643 (77.3%) |
| Arts, Entertainment & Recreation | 515 (66.7%) | 257 (33.3%) |
| Accommodation & Food Services | 1,084 (52.3%) | 990 (47.7%) |
| Public Administration | 1,198 (65.2%) | 640 (34.8%) |
| Total | 14,671 (53.6%) | 12,690 (46.4%) |
Education in Leesburg
School Enrollment in Leesburg
The most common levels of schooling among the 12,966 students in Leesburg are high school (2,963 | 22.9%), middle school (2,780 | 21.4%), and elementary school (2,378 | 18.3%).
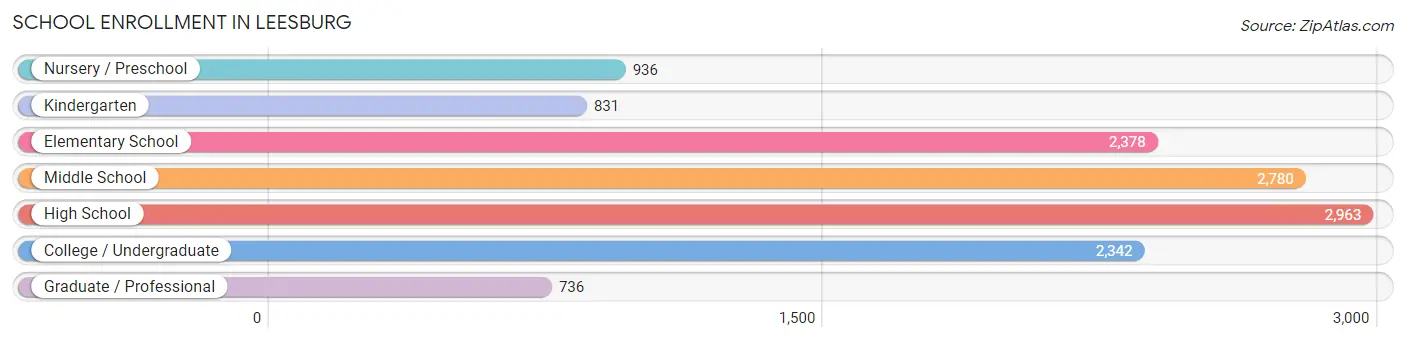
| School Level | # Students | % Students |
| Nursery / Preschool | 936 | 7.2% |
| Kindergarten | 831 | 6.4% |
| Elementary School | 2,378 | 18.3% |
| Middle School | 2,780 | 21.4% |
| High School | 2,963 | 22.9% |
| College / Undergraduate | 2,342 | 18.1% |
| Graduate / Professional | 736 | 5.7% |
| Total | 12,966 | 100.0% |
School Enrollment by Age by Funding Source in Leesburg
Out of a total of 12,966 students who are enrolled in schools in Leesburg, 2,373 (18.3%) attend a private institution, while the remaining 10,593 (81.7%) are enrolled in public schools. The age group of 3 to 4 year olds has the highest likelihood of being enrolled in private schools, with 414 (67.2% in the age bracket) enrolled. Conversely, the age group of 15 to 17 year olds has the lowest likelihood of being enrolled in a private school, with 1,904 (93.0% in the age bracket) attending a public institution.
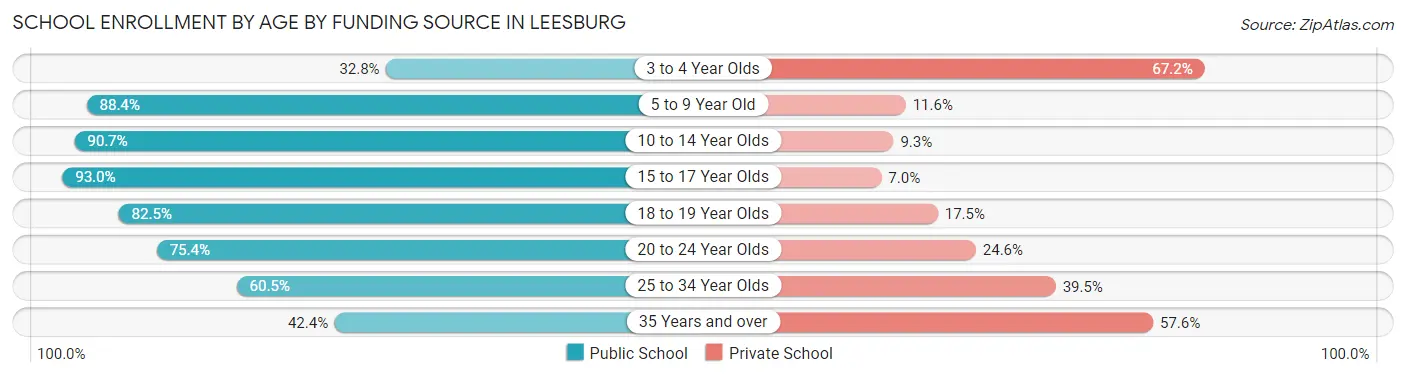
| Age Bracket | Public School | Private School |
| 3 to 4 Year Olds | 202 (32.8%) | 414 (67.2%) |
| 5 to 9 Year Old | 2,899 (88.4%) | 379 (11.6%) |
| 10 to 14 Year Olds | 3,195 (90.7%) | 327 (9.3%) |
| 15 to 17 Year Olds | 1,904 (93.0%) | 144 (7.0%) |
| 18 to 19 Year Olds | 649 (82.5%) | 138 (17.5%) |
| 20 to 24 Year Olds | 1,035 (75.4%) | 338 (24.6%) |
| 25 to 34 Year Olds | 455 (60.5%) | 297 (39.5%) |
| 35 Years and over | 250 (42.4%) | 340 (57.6%) |
| Total | 10,593 (81.7%) | 2,373 (18.3%) |
Educational Attainment by Field of Study in Leesburg
Business (3,558 | 18.8%), social sciences (2,184 | 11.5%), education (1,731 | 9.1%), computers & mathematics (1,666 | 8.8%), and engineering (1,500 | 7.9%) are the most common fields of study among 18,977 individuals in Leesburg who have obtained a bachelor's degree or higher.
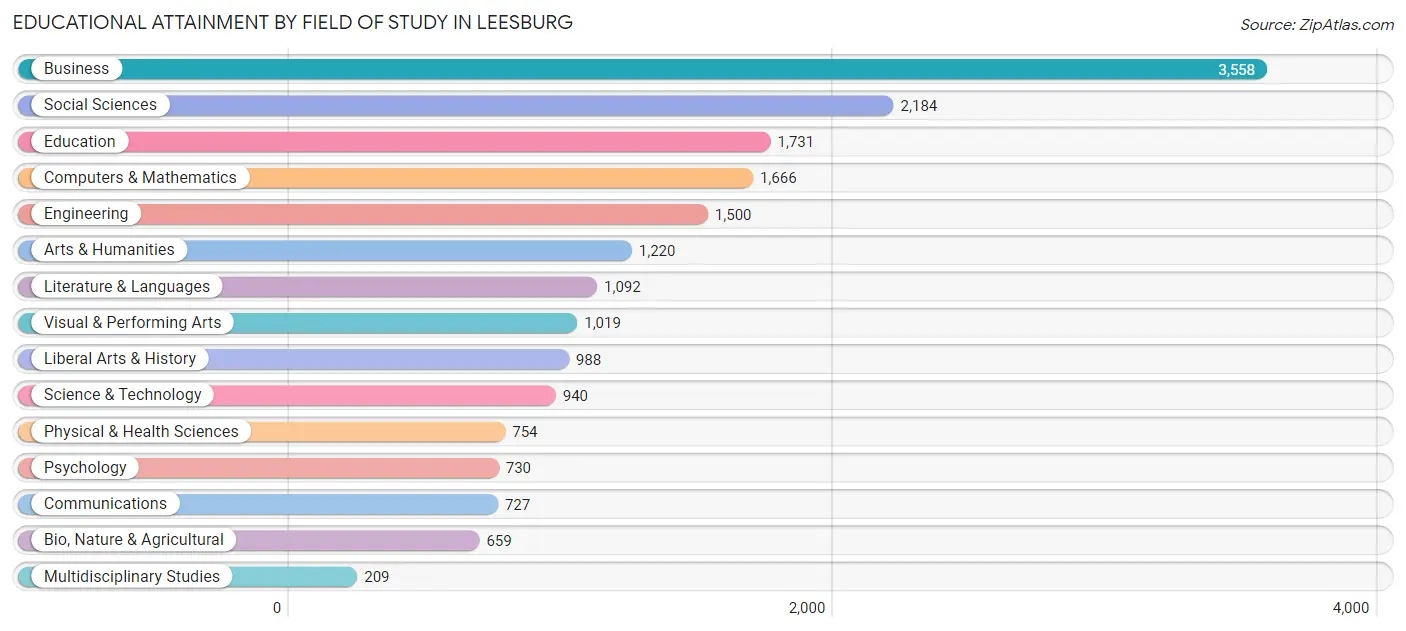
| Field of Study | # Graduates | % Graduates |
| Computers & Mathematics | 1,666 | 8.8% |
| Bio, Nature & Agricultural | 659 | 3.5% |
| Physical & Health Sciences | 754 | 4.0% |
| Psychology | 730 | 3.8% |
| Social Sciences | 2,184 | 11.5% |
| Engineering | 1,500 | 7.9% |
| Multidisciplinary Studies | 209 | 1.1% |
| Science & Technology | 940 | 5.0% |
| Business | 3,558 | 18.8% |
| Education | 1,731 | 9.1% |
| Literature & Languages | 1,092 | 5.8% |
| Liberal Arts & History | 988 | 5.2% |
| Visual & Performing Arts | 1,019 | 5.4% |
| Communications | 727 | 3.8% |
| Arts & Humanities | 1,220 | 6.4% |
| Total | 18,977 | 100.0% |
Transportation & Commute in Leesburg
Vehicle Availability by Sex in Leesburg
The most prevalent vehicle ownership categories in Leesburg are males with 2 vehicles (6,847, accounting for 46.9%) and females with 2 vehicles (5,385, making up 54.3%).
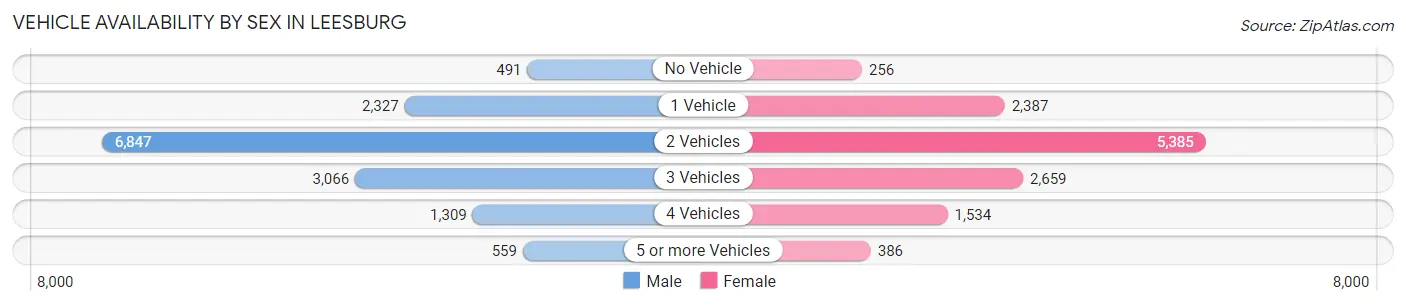
| Vehicles Available | Male | Female |
| No Vehicle | 491 (3.4%) | 256 (2.0%) |
| 1 Vehicle | 2,327 (15.9%) | 2,387 (18.9%) |
| 2 Vehicles | 6,847 (46.9%) | 5,385 (42.7%) |
| 3 Vehicles | 3,066 (21.0%) | 2,659 (21.1%) |
| 4 Vehicles | 1,309 (9.0%) | 1,534 (12.2%) |
| 5 or more Vehicles | 559 (3.8%) | 386 (3.1%) |
| Total | 14,599 (100.0%) | 12,607 (100.0%) |
Commute Time in Leesburg
The most frequently occuring commute durations in Leesburg are 10 to 14 minutes (3,018 commuters, 14.0%), 20 to 24 minutes (2,869 commuters, 13.3%), and 30 to 34 minutes (2,700 commuters, 12.5%).
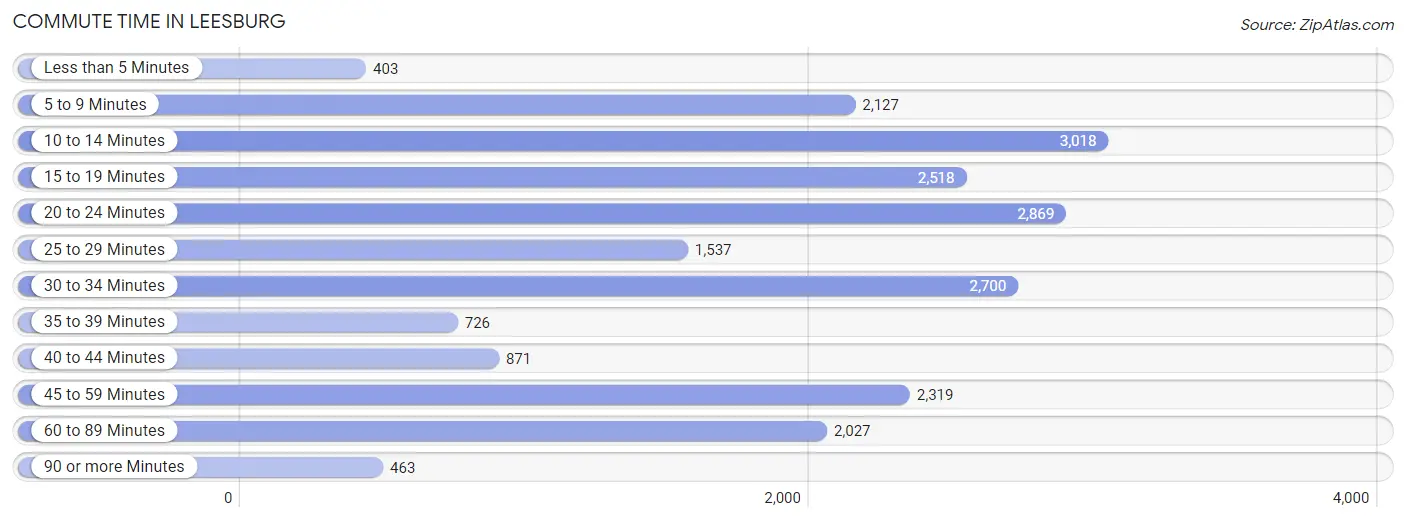
| Commute Time | # Commuters | % Commuters |
| Less than 5 Minutes | 403 | 1.9% |
| 5 to 9 Minutes | 2,127 | 9.9% |
| 10 to 14 Minutes | 3,018 | 14.0% |
| 15 to 19 Minutes | 2,518 | 11.7% |
| 20 to 24 Minutes | 2,869 | 13.3% |
| 25 to 29 Minutes | 1,537 | 7.1% |
| 30 to 34 Minutes | 2,700 | 12.5% |
| 35 to 39 Minutes | 726 | 3.4% |
| 40 to 44 Minutes | 871 | 4.0% |
| 45 to 59 Minutes | 2,319 | 10.7% |
| 60 to 89 Minutes | 2,027 | 9.4% |
| 90 or more Minutes | 463 | 2.1% |
Commute Time by Sex in Leesburg
The most common commute times in Leesburg are 20 to 24 minutes (1,928 commuters, 16.6%) for males and 10 to 14 minutes (1,910 commuters, 19.2%) for females.
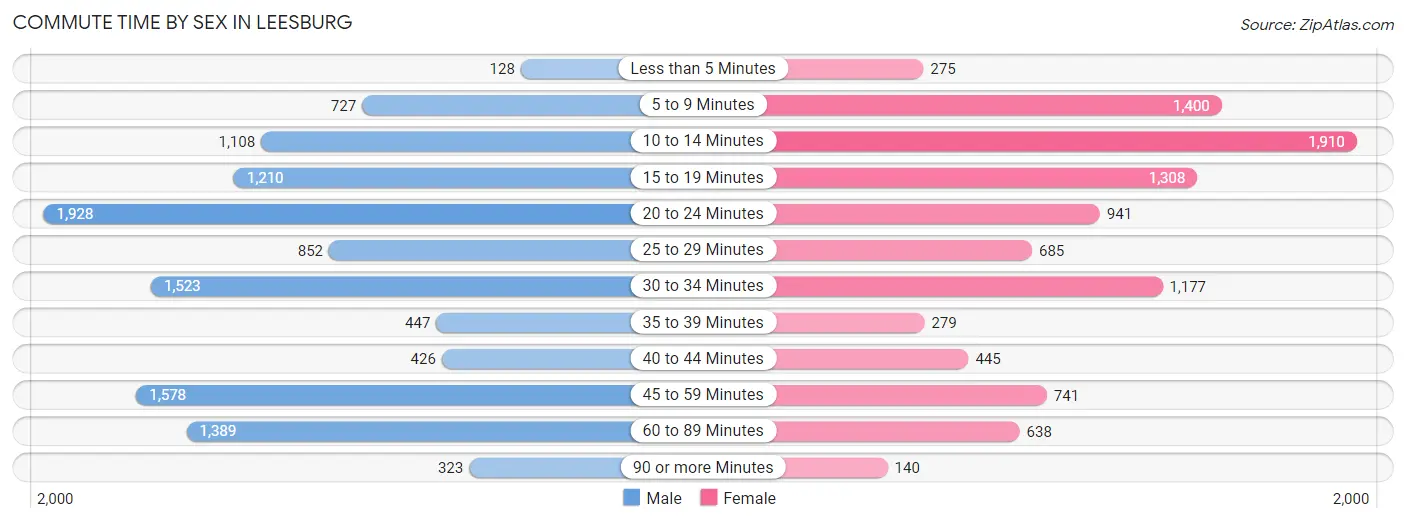
| Commute Time | Male | Female |
| Less than 5 Minutes | 128 (1.1%) | 275 (2.8%) |
| 5 to 9 Minutes | 727 (6.2%) | 1,400 (14.1%) |
| 10 to 14 Minutes | 1,108 (9.5%) | 1,910 (19.2%) |
| 15 to 19 Minutes | 1,210 (10.4%) | 1,308 (13.2%) |
| 20 to 24 Minutes | 1,928 (16.6%) | 941 (9.5%) |
| 25 to 29 Minutes | 852 (7.3%) | 685 (6.9%) |
| 30 to 34 Minutes | 1,523 (13.1%) | 1,177 (11.8%) |
| 35 to 39 Minutes | 447 (3.8%) | 279 (2.8%) |
| 40 to 44 Minutes | 426 (3.7%) | 445 (4.5%) |
| 45 to 59 Minutes | 1,578 (13.6%) | 741 (7.5%) |
| 60 to 89 Minutes | 1,389 (11.9%) | 638 (6.4%) |
| 90 or more Minutes | 323 (2.8%) | 140 (1.4%) |
Time of Departure to Work by Sex in Leesburg
The most frequent times of departure to work in Leesburg are 7:00 AM to 7:29 AM (1,894, 16.3%) for males and 8:00 AM to 8:29 AM (1,858, 18.7%) for females.
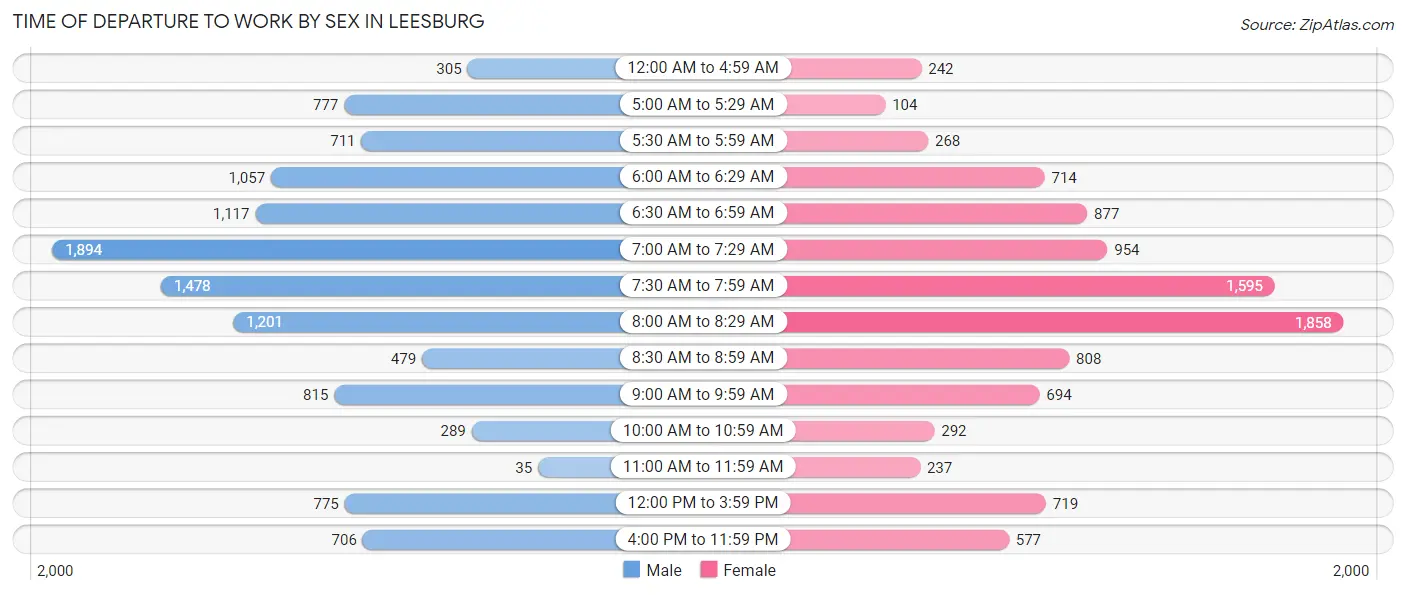
| Time of Departure | Male | Female |
| 12:00 AM to 4:59 AM | 305 (2.6%) | 242 (2.4%) |
| 5:00 AM to 5:29 AM | 777 (6.7%) | 104 (1.1%) |
| 5:30 AM to 5:59 AM | 711 (6.1%) | 268 (2.7%) |
| 6:00 AM to 6:29 AM | 1,057 (9.1%) | 714 (7.2%) |
| 6:30 AM to 6:59 AM | 1,117 (9.6%) | 877 (8.8%) |
| 7:00 AM to 7:29 AM | 1,894 (16.3%) | 954 (9.6%) |
| 7:30 AM to 7:59 AM | 1,478 (12.7%) | 1,595 (16.1%) |
| 8:00 AM to 8:29 AM | 1,201 (10.3%) | 1,858 (18.7%) |
| 8:30 AM to 8:59 AM | 479 (4.1%) | 808 (8.1%) |
| 9:00 AM to 9:59 AM | 815 (7.0%) | 694 (7.0%) |
| 10:00 AM to 10:59 AM | 289 (2.5%) | 292 (2.9%) |
| 11:00 AM to 11:59 AM | 35 (0.3%) | 237 (2.4%) |
| 12:00 PM to 3:59 PM | 775 (6.7%) | 719 (7.2%) |
| 4:00 PM to 11:59 PM | 706 (6.1%) | 577 (5.8%) |
| Total | 11,639 (100.0%) | 9,939 (100.0%) |
Housing Occupancy in Leesburg
Occupancy by Ownership in Leesburg
Of the total 16,468 dwellings in Leesburg, owner-occupied units account for 11,219 (68.1%), while renter-occupied units make up 5,249 (31.9%).
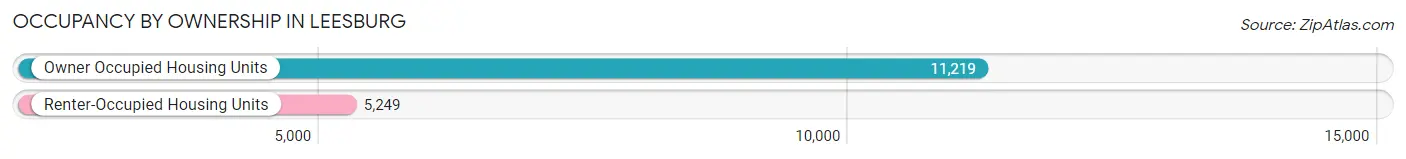
| Occupancy | # Housing Units | % Housing Units |
| Owner Occupied Housing Units | 11,219 | 68.1% |
| Renter-Occupied Housing Units | 5,249 | 31.9% |
| Total Occupied Housing Units | 16,468 | 100.0% |
Occupancy by Household Size in Leesburg
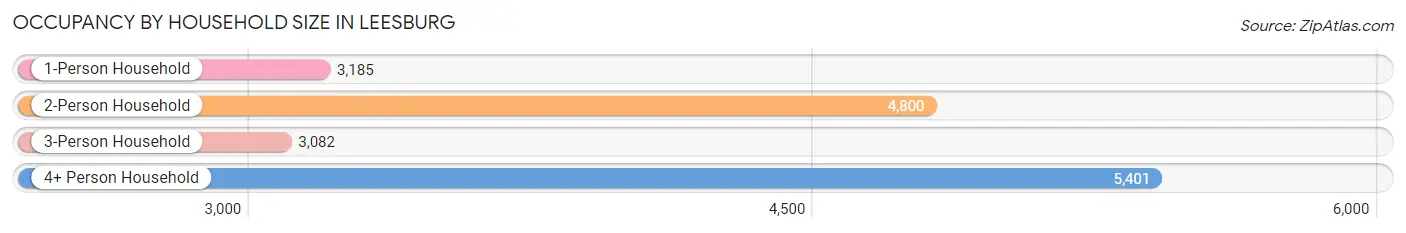
| Household Size | # Housing Units | % Housing Units |
| 1-Person Household | 3,185 | 19.3% |
| 2-Person Household | 4,800 | 29.1% |
| 3-Person Household | 3,082 | 18.7% |
| 4+ Person Household | 5,401 | 32.8% |
| Total Housing Units | 16,468 | 100.0% |
Occupancy by Ownership by Household Size in Leesburg
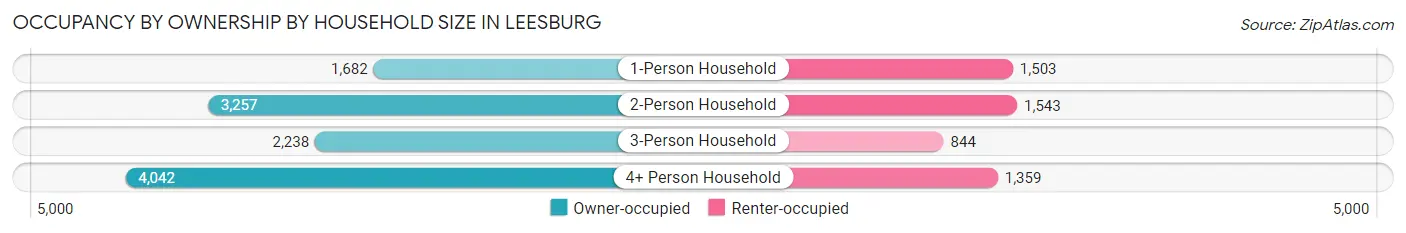
| Household Size | Owner-occupied | Renter-occupied |
| 1-Person Household | 1,682 (52.8%) | 1,503 (47.2%) |
| 2-Person Household | 3,257 (67.8%) | 1,543 (32.2%) |
| 3-Person Household | 2,238 (72.6%) | 844 (27.4%) |
| 4+ Person Household | 4,042 (74.8%) | 1,359 (25.2%) |
| Total Housing Units | 11,219 (68.1%) | 5,249 (31.9%) |
Occupancy by Educational Attainment in Leesburg
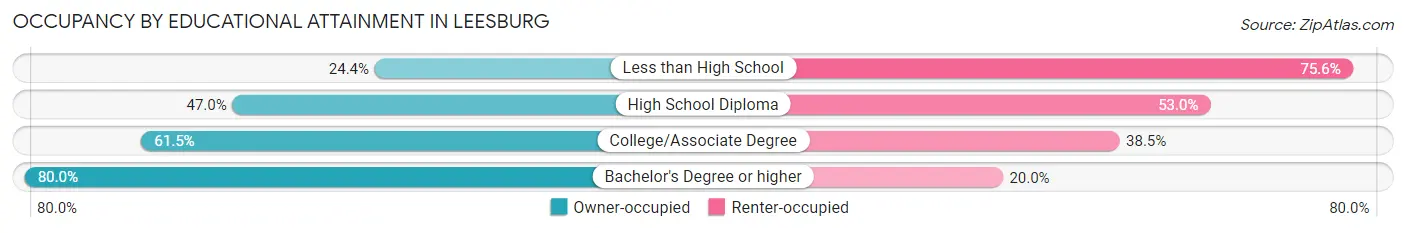
| Household Size | Owner-occupied | Renter-occupied |
| Less than High School | 284 (24.4%) | 878 (75.6%) |
| High School Diploma | 1,017 (47.0%) | 1,146 (53.0%) |
| College/Associate Degree | 1,969 (61.5%) | 1,234 (38.5%) |
| Bachelor's Degree or higher | 7,949 (80.0%) | 1,991 (20.0%) |
Occupancy by Age of Householder in Leesburg
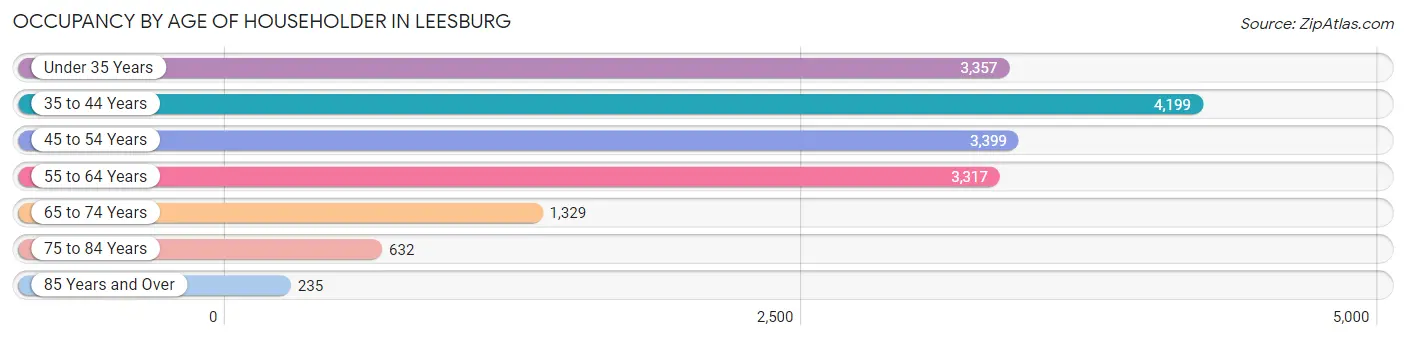
| Age Bracket | # Households | % Households |
| Under 35 Years | 3,357 | 20.4% |
| 35 to 44 Years | 4,199 | 25.5% |
| 45 to 54 Years | 3,399 | 20.6% |
| 55 to 64 Years | 3,317 | 20.1% |
| 65 to 74 Years | 1,329 | 8.1% |
| 75 to 84 Years | 632 | 3.8% |
| 85 Years and Over | 235 | 1.4% |
| Total | 16,468 | 100.0% |
Housing Finances in Leesburg
Median Income by Occupancy in Leesburg
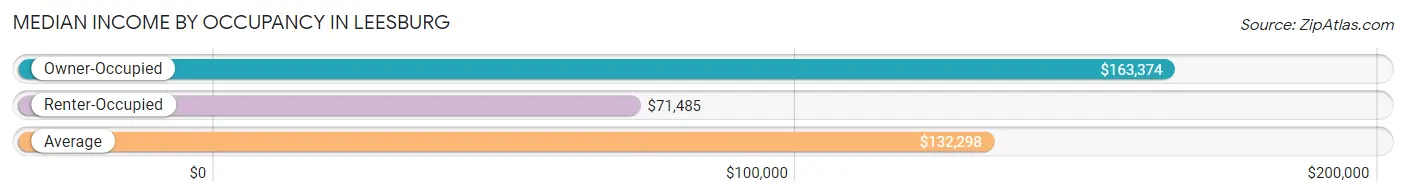
| Occupancy Type | # Households | Median Income |
| Owner-Occupied | 11,219 (68.1%) | $163,374 |
| Renter-Occupied | 5,249 (31.9%) | $71,485 |
| Average | 16,468 (100.0%) | $132,298 |
Occupancy by Householder Income Bracket in Leesburg
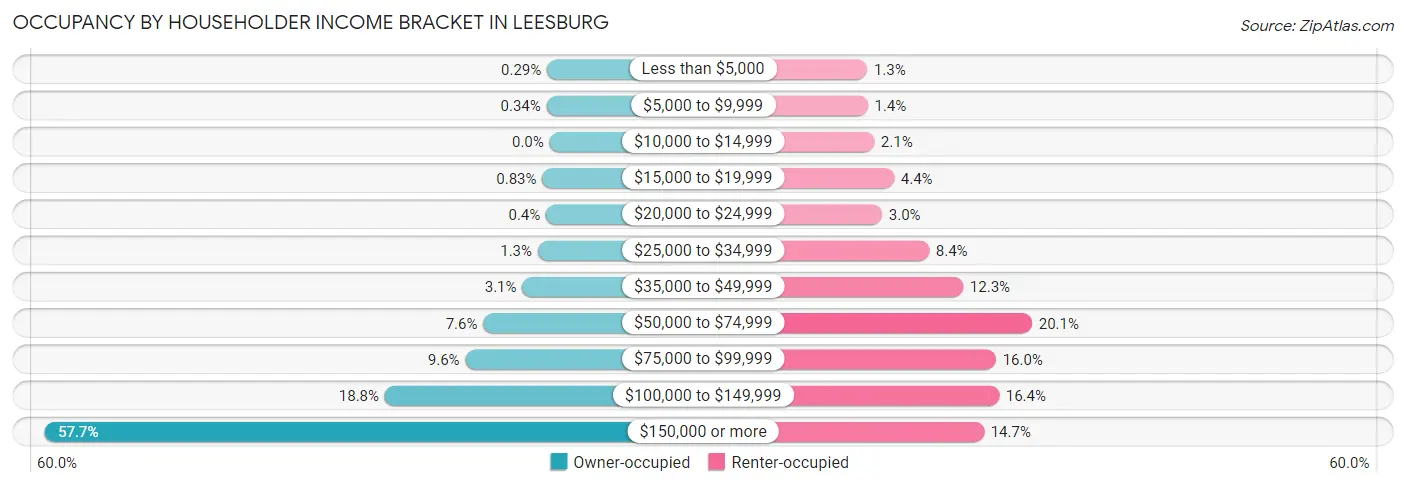
| Income Bracket | Owner-occupied | Renter-occupied |
| Less than $5,000 | 33 (0.3%) | 69 (1.3%) |
| $5,000 to $9,999 | 38 (0.3%) | 72 (1.4%) |
| $10,000 to $14,999 | 0 (0.0%) | 110 (2.1%) |
| $15,000 to $19,999 | 93 (0.8%) | 230 (4.4%) |
| $20,000 to $24,999 | 45 (0.4%) | 158 (3.0%) |
| $25,000 to $34,999 | 150 (1.3%) | 440 (8.4%) |
| $35,000 to $49,999 | 349 (3.1%) | 644 (12.3%) |
| $50,000 to $74,999 | 850 (7.6%) | 1,057 (20.1%) |
| $75,000 to $99,999 | 1,079 (9.6%) | 841 (16.0%) |
| $100,000 to $149,999 | 2,113 (18.8%) | 859 (16.4%) |
| $150,000 or more | 6,469 (57.7%) | 769 (14.6%) |
| Total | 11,219 (100.0%) | 5,249 (100.0%) |
Monthly Housing Cost Tiers in Leesburg
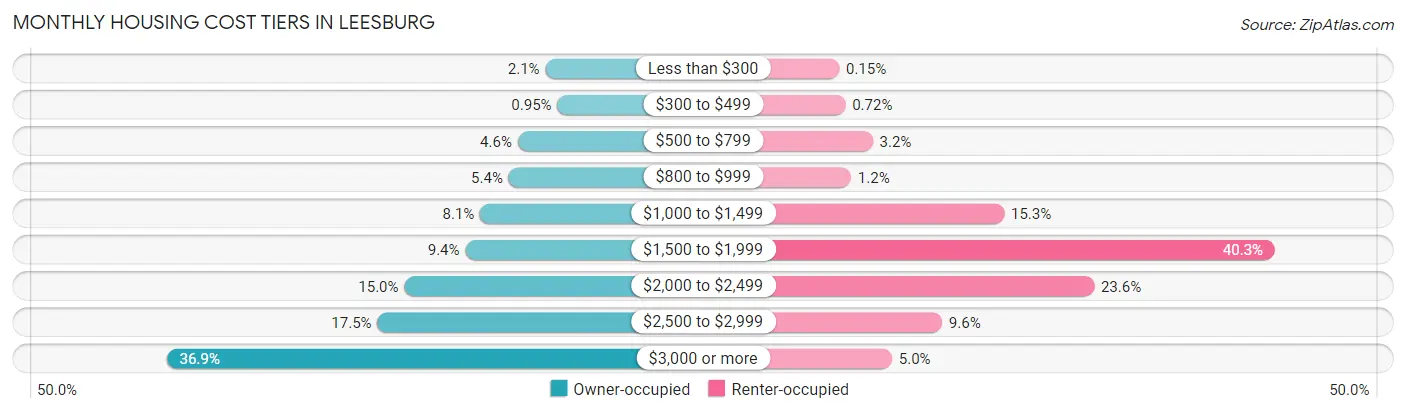
| Monthly Cost | Owner-occupied | Renter-occupied |
| Less than $300 | 230 (2.1%) | 8 (0.2%) |
| $300 to $499 | 107 (0.9%) | 38 (0.7%) |
| $500 to $799 | 516 (4.6%) | 170 (3.2%) |
| $800 to $999 | 609 (5.4%) | 65 (1.2%) |
| $1,000 to $1,499 | 904 (8.1%) | 805 (15.3%) |
| $1,500 to $1,999 | 1,057 (9.4%) | 2,114 (40.3%) |
| $2,000 to $2,499 | 1,687 (15.0%) | 1,240 (23.6%) |
| $2,500 to $2,999 | 1,966 (17.5%) | 505 (9.6%) |
| $3,000 or more | 4,143 (36.9%) | 263 (5.0%) |
| Total | 11,219 (100.0%) | 5,249 (100.0%) |
Physical Housing Characteristics in Leesburg
Housing Structures in Leesburg
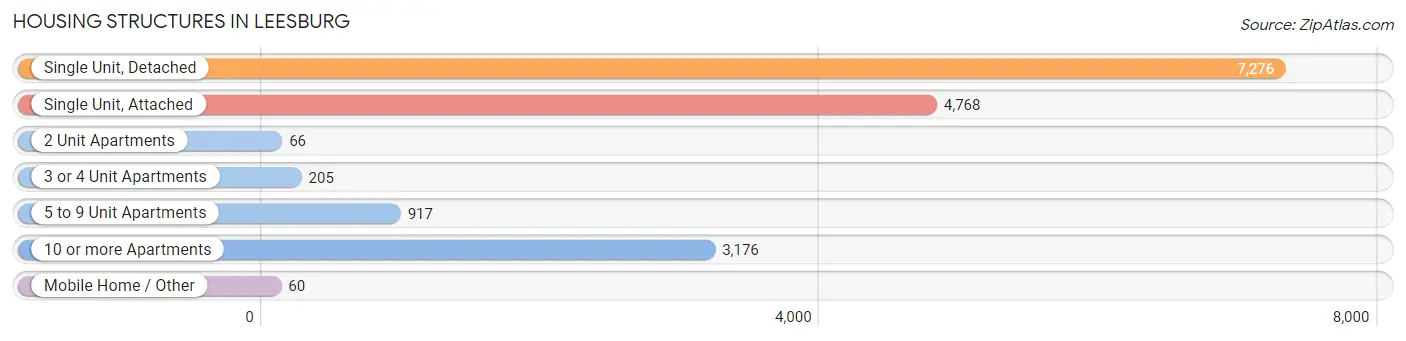
| Structure Type | # Housing Units | % Housing Units |
| Single Unit, Detached | 7,276 | 44.2% |
| Single Unit, Attached | 4,768 | 28.9% |
| 2 Unit Apartments | 66 | 0.4% |
| 3 or 4 Unit Apartments | 205 | 1.2% |
| 5 to 9 Unit Apartments | 917 | 5.6% |
| 10 or more Apartments | 3,176 | 19.3% |
| Mobile Home / Other | 60 | 0.4% |
| Total | 16,468 | 100.0% |
Housing Structures by Occupancy in Leesburg
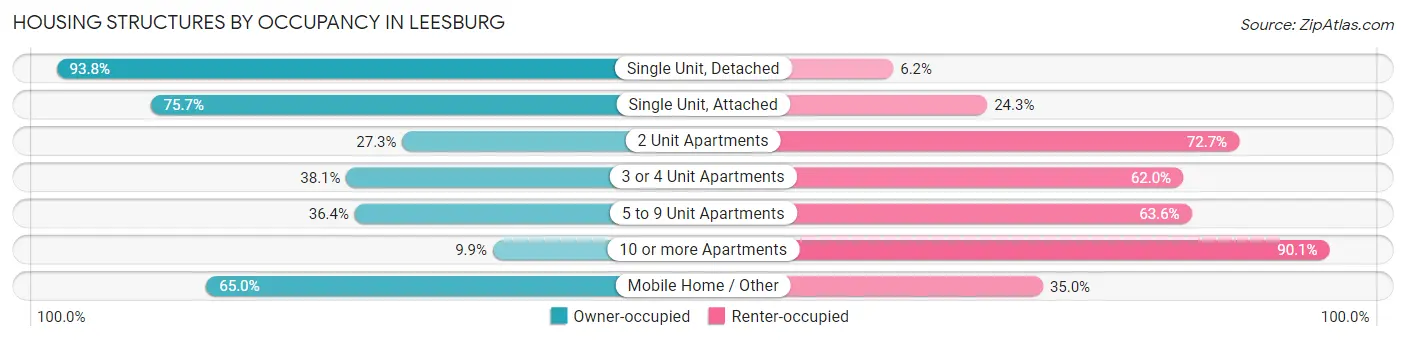
| Structure Type | Owner-occupied | Renter-occupied |
| Single Unit, Detached | 6,826 (93.8%) | 450 (6.2%) |
| Single Unit, Attached | 3,611 (75.7%) | 1,157 (24.3%) |
| 2 Unit Apartments | 18 (27.3%) | 48 (72.7%) |
| 3 or 4 Unit Apartments | 78 (38.1%) | 127 (62.0%) |
| 5 to 9 Unit Apartments | 334 (36.4%) | 583 (63.6%) |
| 10 or more Apartments | 313 (9.9%) | 2,863 (90.1%) |
| Mobile Home / Other | 39 (65.0%) | 21 (35.0%) |
| Total | 11,219 (68.1%) | 5,249 (31.9%) |
Housing Structures by Number of Rooms in Leesburg
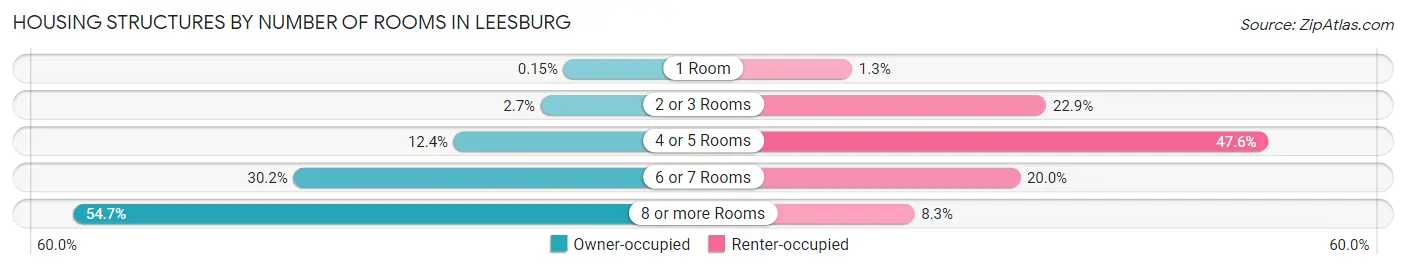
| Number of Rooms | Owner-occupied | Renter-occupied |
| 1 Room | 17 (0.2%) | 70 (1.3%) |
| 2 or 3 Rooms | 303 (2.7%) | 1,201 (22.9%) |
| 4 or 5 Rooms | 1,386 (12.3%) | 2,496 (47.5%) |
| 6 or 7 Rooms | 3,382 (30.1%) | 1,049 (20.0%) |
| 8 or more Rooms | 6,131 (54.6%) | 433 (8.3%) |
| Total | 11,219 (100.0%) | 5,249 (100.0%) |
Housing Structure by Heating Type in Leesburg
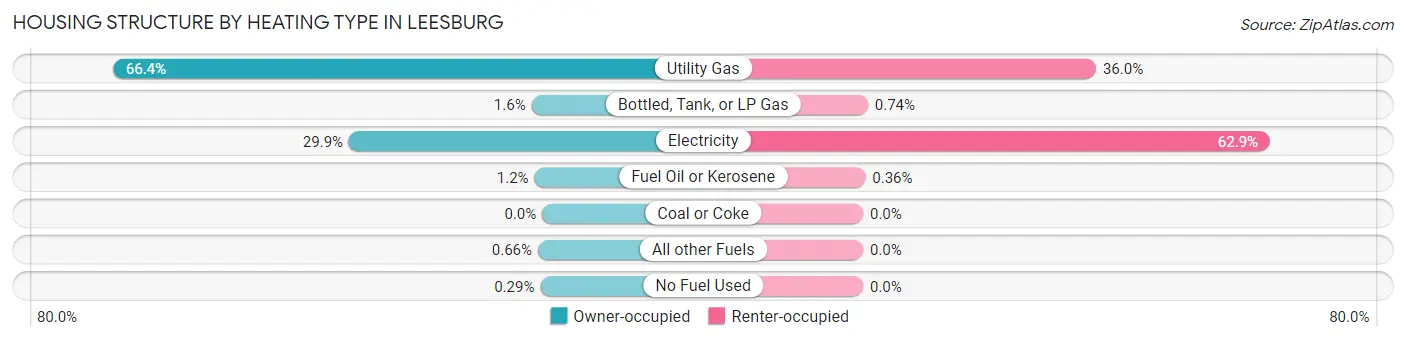
| Heating Type | Owner-occupied | Renter-occupied |
| Utility Gas | 7,444 (66.3%) | 1,890 (36.0%) |
| Bottled, Tank, or LP Gas | 184 (1.6%) | 39 (0.7%) |
| Electricity | 3,351 (29.9%) | 3,301 (62.9%) |
| Fuel Oil or Kerosene | 134 (1.2%) | 19 (0.4%) |
| Coal or Coke | 0 (0.0%) | 0 (0.0%) |
| All other Fuels | 74 (0.7%) | 0 (0.0%) |
| No Fuel Used | 32 (0.3%) | 0 (0.0%) |
| Total | 11,219 (100.0%) | 5,249 (100.0%) |
Household Vehicle Usage in Leesburg
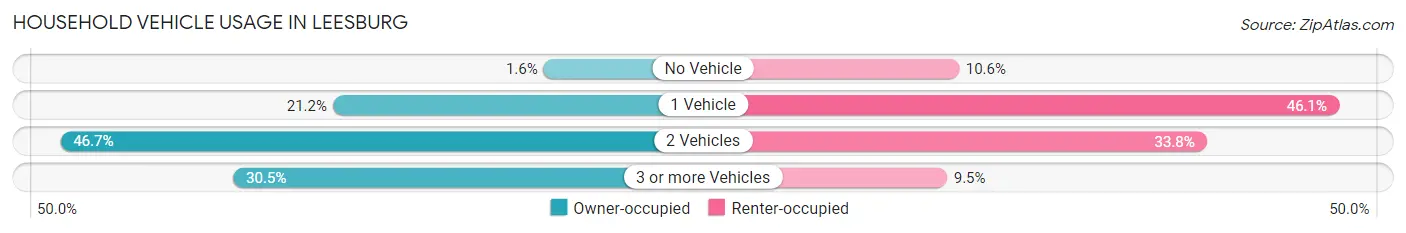
| Vehicles per Household | Owner-occupied | Renter-occupied |
| No Vehicle | 175 (1.6%) | 558 (10.6%) |
| 1 Vehicle | 2,382 (21.2%) | 2,420 (46.1%) |
| 2 Vehicles | 5,236 (46.7%) | 1,772 (33.8%) |
| 3 or more Vehicles | 3,426 (30.5%) | 499 (9.5%) |
| Total | 11,219 (100.0%) | 5,249 (100.0%) |
Real Estate & Mortgages in Leesburg
Real Estate and Mortgage Overview in Leesburg
| Characteristic | Without Mortgage | With Mortgage |
| Housing Units | 1,775 | 9,444 |
| Median Property Value | $537,400 | $577,900 |
| Median Household Income | $115,136 | $5,782 |
| Monthly Housing Costs | $833 | $4,143 |
| Real Estate Taxes | $5,299 | $167 |
Property Value by Mortgage Status in Leesburg
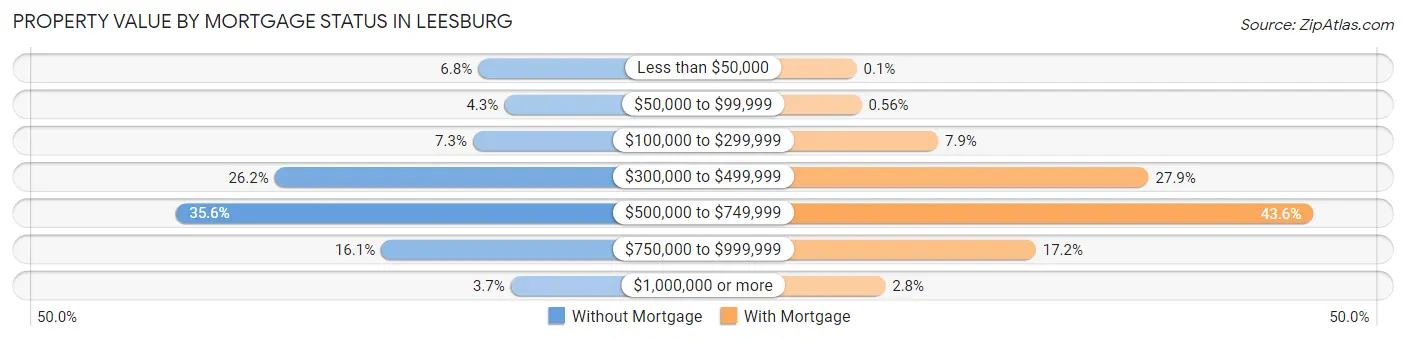
| Property Value | Without Mortgage | With Mortgage |
| Less than $50,000 | 121 (6.8%) | 9 (0.1%) |
| $50,000 to $99,999 | 77 (4.3%) | 53 (0.6%) |
| $100,000 to $299,999 | 130 (7.3%) | 742 (7.9%) |
| $300,000 to $499,999 | 465 (26.2%) | 2,636 (27.9%) |
| $500,000 to $749,999 | 631 (35.5%) | 4,115 (43.6%) |
| $750,000 to $999,999 | 285 (16.1%) | 1,622 (17.2%) |
| $1,000,000 or more | 66 (3.7%) | 267 (2.8%) |
| Total | 1,775 (100.0%) | 9,444 (100.0%) |
Household Income by Mortgage Status in Leesburg
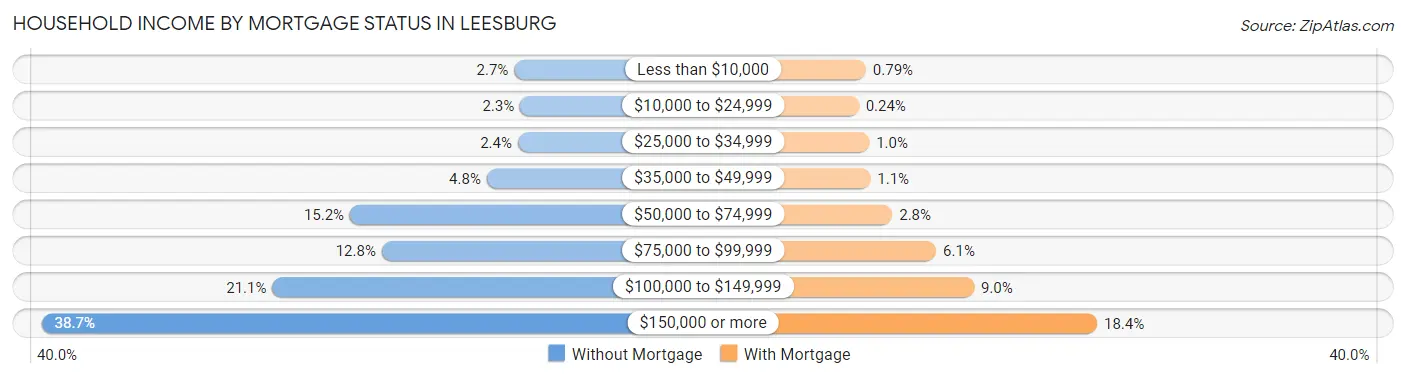
| Household Income | Without Mortgage | With Mortgage |
| Less than $10,000 | 48 (2.7%) | 75 (0.8%) |
| $10,000 to $24,999 | 40 (2.2%) | 23 (0.2%) |
| $25,000 to $34,999 | 43 (2.4%) | 98 (1.0%) |
| $35,000 to $49,999 | 85 (4.8%) | 107 (1.1%) |
| $50,000 to $74,999 | 270 (15.2%) | 264 (2.8%) |
| $75,000 to $99,999 | 227 (12.8%) | 580 (6.1%) |
| $100,000 to $149,999 | 375 (21.1%) | 852 (9.0%) |
| $150,000 or more | 687 (38.7%) | 1,738 (18.4%) |
| Total | 1,775 (100.0%) | 9,444 (100.0%) |
Property Value to Household Income Ratio in Leesburg
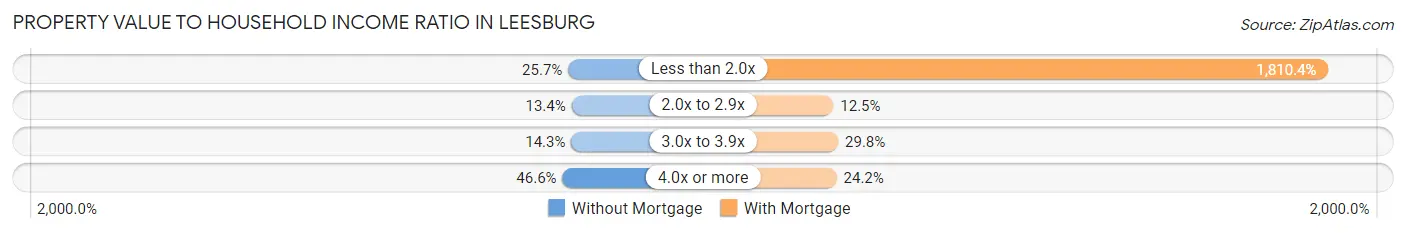
| Value-to-Income Ratio | Without Mortgage | With Mortgage |
| Less than 2.0x | 456 (25.7%) | 170,972 (1,810.4%) |
| 2.0x to 2.9x | 238 (13.4%) | 1,180 (12.5%) |
| 3.0x to 3.9x | 254 (14.3%) | 2,814 (29.8%) |
| 4.0x or more | 827 (46.6%) | 2,288 (24.2%) |
| Total | 1,775 (100.0%) | 9,444 (100.0%) |
Real Estate Taxes by Mortgage Status in Leesburg
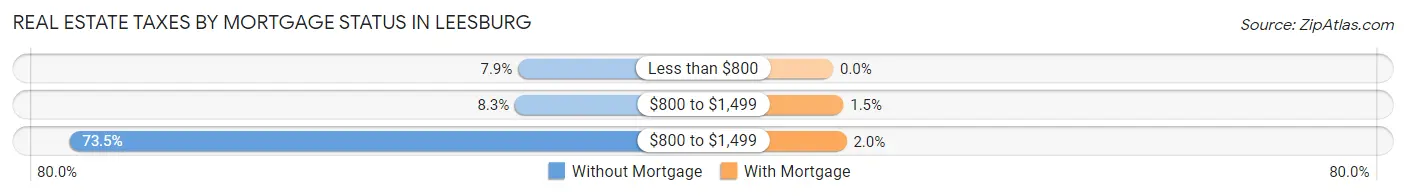
| Property Taxes | Without Mortgage | With Mortgage |
| Less than $800 | 140 (7.9%) | 0 (0.0%) |
| $800 to $1,499 | 148 (8.3%) | 142 (1.5%) |
| $800 to $1,499 | 1,304 (73.5%) | 185 (2.0%) |
| Total | 1,775 (100.0%) | 9,444 (100.0%) |
Health & Disability in Leesburg
Health Insurance Coverage by Age in Leesburg
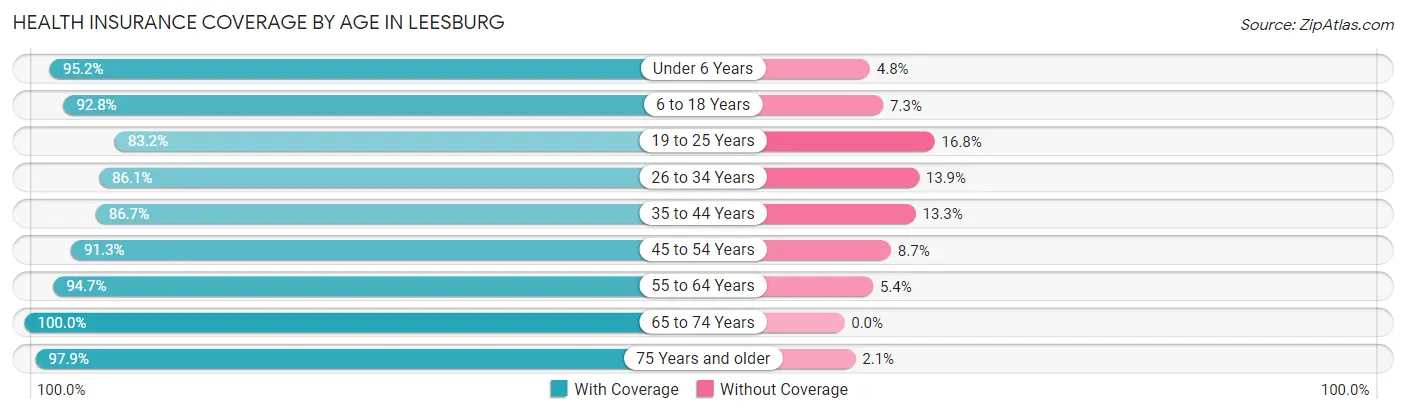
| Age Bracket | With Coverage | Without Coverage |
| Under 6 Years | 4,867 (95.2%) | 243 (4.8%) |
| 6 to 18 Years | 7,991 (92.7%) | 625 (7.2%) |
| 19 to 25 Years | 2,982 (83.2%) | 604 (16.8%) |
| 26 to 34 Years | 6,035 (86.1%) | 974 (13.9%) |
| 35 to 44 Years | 6,787 (86.7%) | 1,039 (13.3%) |
| 45 to 54 Years | 5,719 (91.3%) | 544 (8.7%) |
| 55 to 64 Years | 5,163 (94.7%) | 292 (5.3%) |
| 65 to 74 Years | 2,640 (100.0%) | 0 (0.0%) |
| 75 Years and older | 1,519 (97.9%) | 32 (2.1%) |
| Total | 43,703 (90.9%) | 4,353 (9.1%) |
Health Insurance Coverage by Citizenship Status in Leesburg
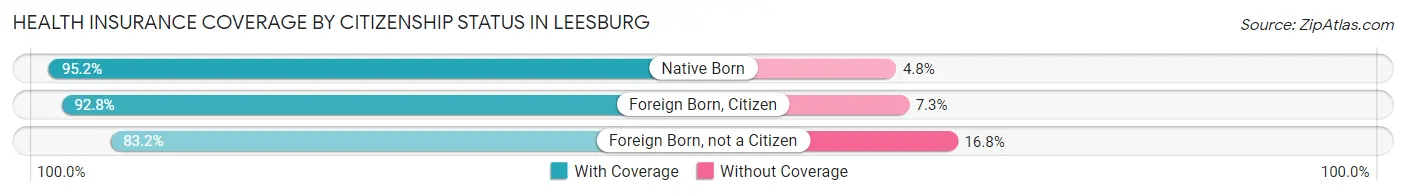
| Citizenship Status | With Coverage | Without Coverage |
| Native Born | 4,867 (95.2%) | 243 (4.8%) |
| Foreign Born, Citizen | 7,991 (92.7%) | 625 (7.2%) |
| Foreign Born, not a Citizen | 2,982 (83.2%) | 604 (16.8%) |
Health Insurance Coverage by Household Income in Leesburg
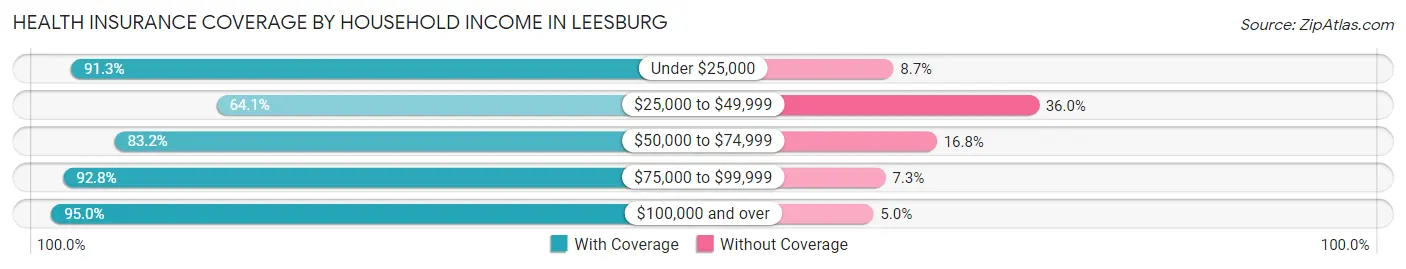
| Household Income | With Coverage | Without Coverage |
| Under $25,000 | 1,496 (91.3%) | 143 (8.7%) |
| $25,000 to $49,999 | 2,574 (64.0%) | 1,445 (35.9%) |
| $50,000 to $74,999 | 3,798 (83.2%) | 769 (16.8%) |
| $75,000 to $99,999 | 4,351 (92.7%) | 340 (7.2%) |
| $100,000 and over | 31,480 (95.0%) | 1,654 (5.0%) |
Public vs Private Health Insurance Coverage by Age in Leesburg
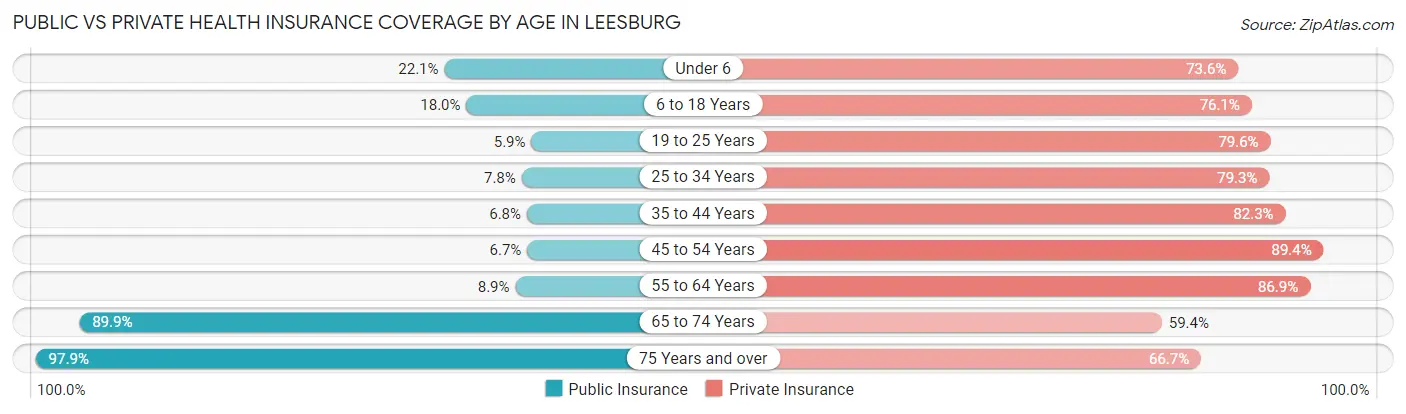
| Age Bracket | Public Insurance | Private Insurance |
| Under 6 | 1,129 (22.1%) | 3,760 (73.6%) |
| 6 to 18 Years | 1,551 (18.0%) | 6,555 (76.1%) |
| 19 to 25 Years | 213 (5.9%) | 2,853 (79.6%) |
| 25 to 34 Years | 543 (7.7%) | 5,561 (79.3%) |
| 35 to 44 Years | 530 (6.8%) | 6,444 (82.3%) |
| 45 to 54 Years | 421 (6.7%) | 5,600 (89.4%) |
| 55 to 64 Years | 486 (8.9%) | 4,741 (86.9%) |
| 65 to 74 Years | 2,372 (89.8%) | 1,568 (59.4%) |
| 75 Years and over | 1,519 (97.9%) | 1,034 (66.7%) |
| Total | 8,764 (18.2%) | 38,116 (79.3%) |
Disability Status by Sex by Age in Leesburg
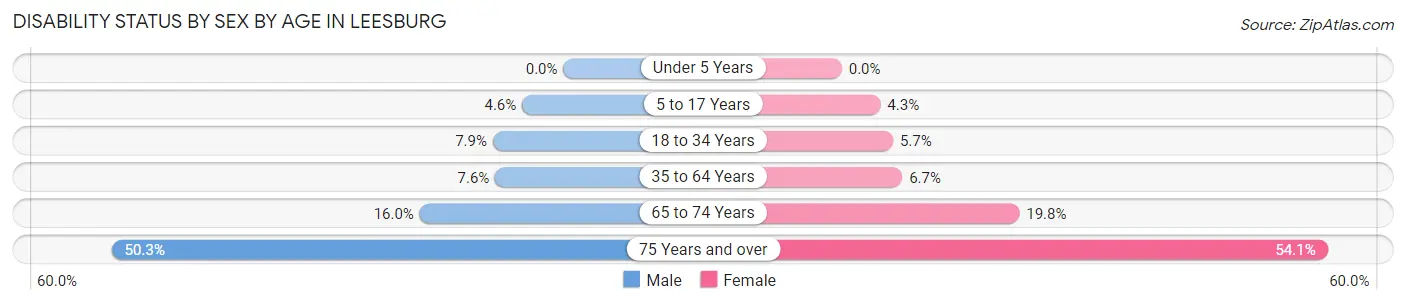
| Age Bracket | Male | Female |
| Under 5 Years | 0 (0.0%) | 0 (0.0%) |
| 5 to 17 Years | 230 (4.6%) | 177 (4.3%) |
| 18 to 34 Years | 444 (7.9%) | 319 (5.7%) |
| 35 to 64 Years | 756 (7.6%) | 645 (6.7%) |
| 65 to 74 Years | 195 (16.0%) | 281 (19.8%) |
| 75 Years and over | 239 (50.3%) | 582 (54.1%) |
Disability Class by Sex by Age in Leesburg
Disability Class: Hearing Difficulty
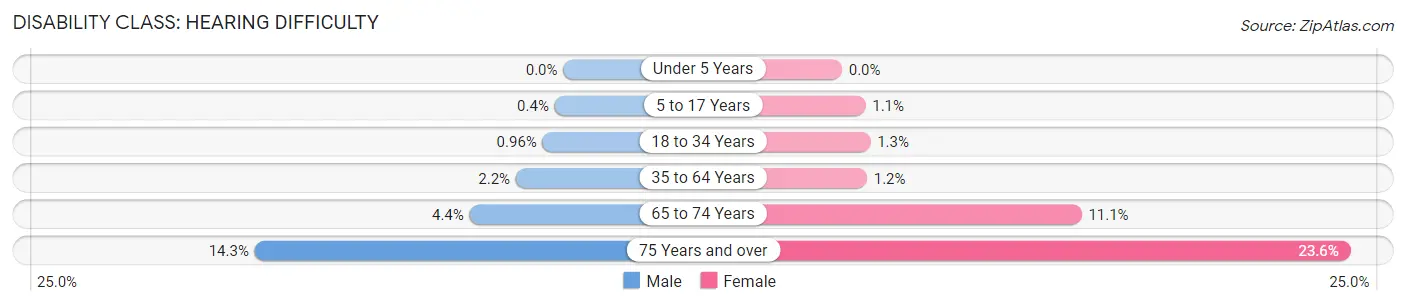
| Age Bracket | Male | Female |
| Under 5 Years | 0 (0.0%) | 0 (0.0%) |
| 5 to 17 Years | 20 (0.4%) | 45 (1.1%) |
| 18 to 34 Years | 54 (1.0%) | 74 (1.3%) |
| 35 to 64 Years | 219 (2.2%) | 111 (1.2%) |
| 65 to 74 Years | 53 (4.3%) | 158 (11.1%) |
| 75 Years and over | 68 (14.3%) | 254 (23.6%) |
Disability Class: Vision Difficulty
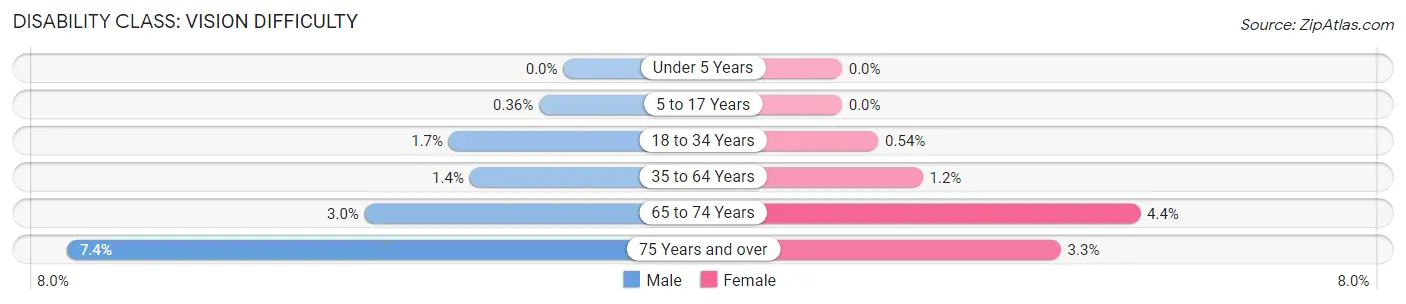
| Age Bracket | Male | Female |
| Under 5 Years | 0 (0.0%) | 0 (0.0%) |
| 5 to 17 Years | 18 (0.4%) | 0 (0.0%) |
| 18 to 34 Years | 96 (1.7%) | 30 (0.5%) |
| 35 to 64 Years | 138 (1.4%) | 115 (1.2%) |
| 65 to 74 Years | 36 (2.9%) | 63 (4.4%) |
| 75 Years and over | 35 (7.4%) | 35 (3.3%) |
Disability Class: Cognitive Difficulty
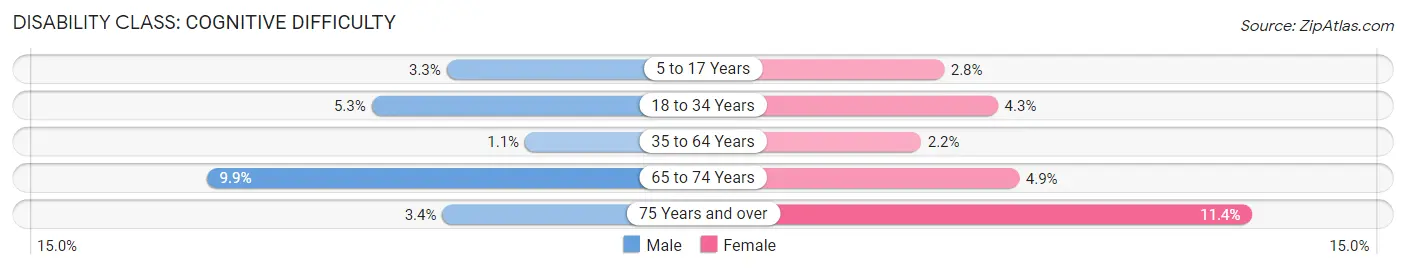
| Age Bracket | Male | Female |
| 5 to 17 Years | 163 (3.3%) | 117 (2.8%) |
| 18 to 34 Years | 302 (5.3%) | 243 (4.3%) |
| 35 to 64 Years | 107 (1.1%) | 211 (2.2%) |
| 65 to 74 Years | 121 (9.9%) | 70 (4.9%) |
| 75 Years and over | 16 (3.4%) | 123 (11.4%) |
Disability Class: Ambulatory Difficulty
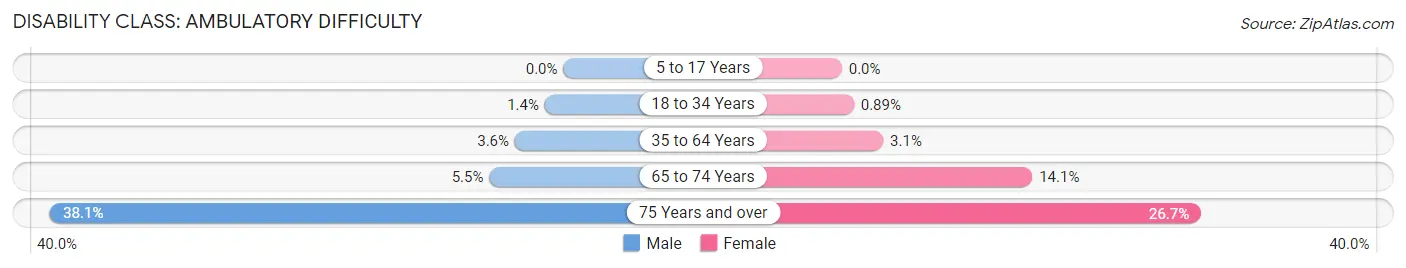
| Age Bracket | Male | Female |
| 5 to 17 Years | 0 (0.0%) | 0 (0.0%) |
| 18 to 34 Years | 78 (1.4%) | 50 (0.9%) |
| 35 to 64 Years | 358 (3.6%) | 294 (3.1%) |
| 65 to 74 Years | 67 (5.5%) | 201 (14.1%) |
| 75 Years and over | 181 (38.1%) | 287 (26.7%) |
Disability Class: Self-Care Difficulty
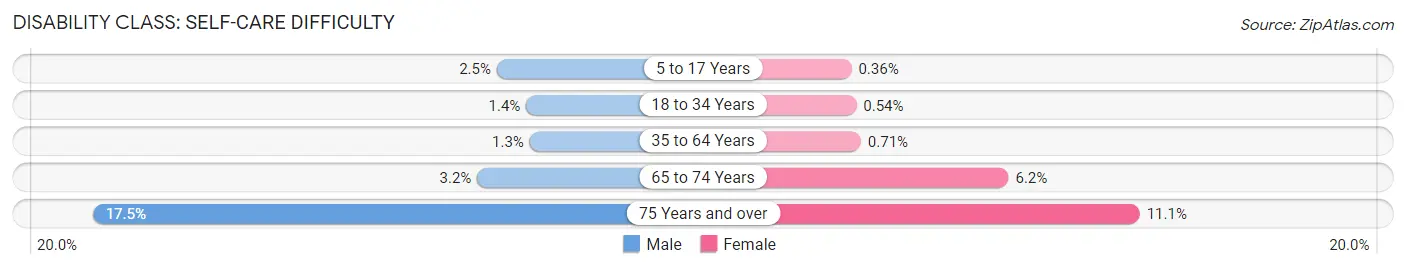
| Age Bracket | Male | Female |
| 5 to 17 Years | 124 (2.5%) | 15 (0.4%) |
| 18 to 34 Years | 78 (1.4%) | 30 (0.5%) |
| 35 to 64 Years | 124 (1.3%) | 68 (0.7%) |
| 65 to 74 Years | 39 (3.2%) | 88 (6.2%) |
| 75 Years and over | 83 (17.5%) | 119 (11.1%) |
Technology Access in Leesburg
Computing Device Access in Leesburg
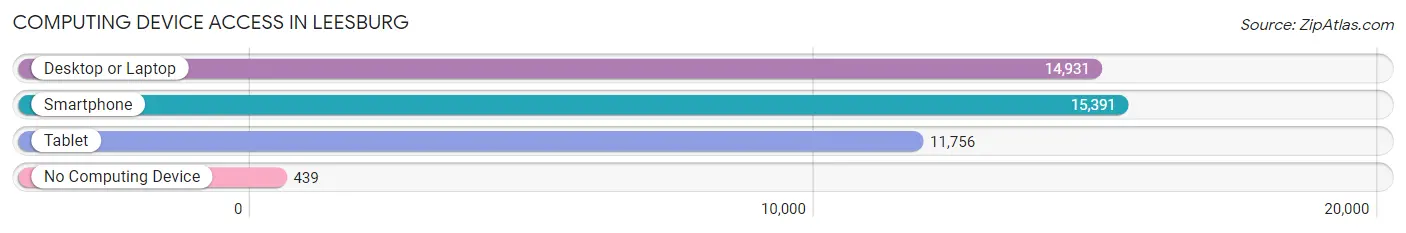
| Device Type | # Households | % Households |
| Desktop or Laptop | 14,931 | 90.7% |
| Smartphone | 15,391 | 93.5% |
| Tablet | 11,756 | 71.4% |
| No Computing Device | 439 | 2.7% |
| Total | 16,468 | 100.0% |
Internet Access in Leesburg
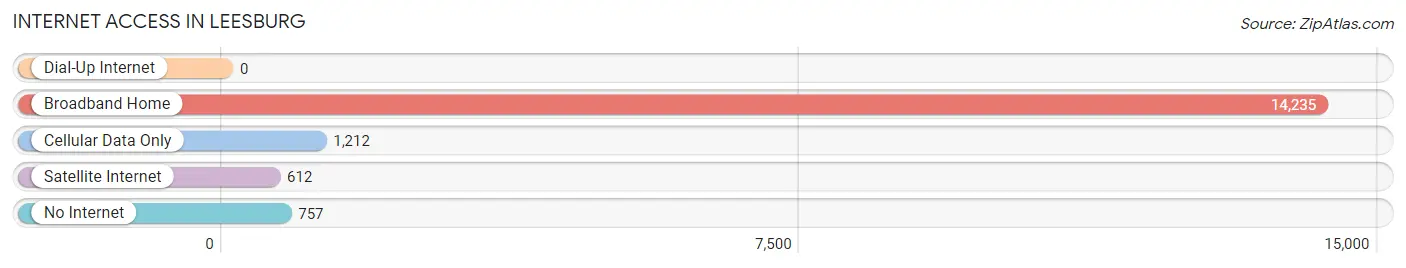
| Internet Type | # Households | % Households |
| Dial-Up Internet | 0 | 0.0% |
| Broadband Home | 14,235 | 86.4% |
| Cellular Data Only | 1,212 | 7.4% |
| Satellite Internet | 612 | 3.7% |
| No Internet | 757 | 4.6% |
| Total | 16,468 | 100.0% |
Leesburg Summary
Leesburg, Virginia is a town located in Loudoun County, Virginia, United States. It is the county seat of Loudoun County and is located in the northern part of the state, about 30 miles west of Washington, D.C. The population of Leesburg was estimated to be 42,616 in 2019.
History
Leesburg was founded in 1758 by a group of settlers led by Nicholas Minor and named after Thomas Lee, the great-grandson of the first English settler in Virginia, Richard Lee I. The town was established as a market town and was the first county seat of Loudoun County.
In the late 18th century, Leesburg was a major center of trade and commerce in the region. It was a major stop on the Great Wagon Road, which connected the Shenandoah Valley with the Potomac River. During the Civil War, Leesburg was the site of several battles, including the Battle of Ball’s Bluff in 1861 and the Battle of Cool Spring in 1864.
Geography
Leesburg is located in the northern part of Virginia, about 30 miles west of Washington, D.C. It is situated in the foothills of the Blue Ridge Mountains and is part of the Washington metropolitan area. The town is situated on the banks of the Potomac River and is surrounded by rolling hills and farmland.
The climate in Leesburg is humid subtropical, with hot, humid summers and mild winters. The average annual temperature is around 57°F (14°C). The average annual precipitation is around 40 inches (101 cm).
Economy
Leesburg’s economy is largely based on government, technology, and tourism. The town is home to several government agencies, including the Department of Homeland Security, the National Geospatial-Intelligence Agency, and the National Reconnaissance Office.
The town is also home to several technology companies, including Oracle, Verizon, and Microsoft. Tourism is also an important part of the local economy, with many visitors coming to the area to visit the historic downtown area, the nearby wineries, and the nearby national parks.
Demographics
As of 2019, the population of Leesburg was estimated to be 42,616. The racial makeup of the town was 79.2% White, 8.3% African American, 5.2% Asian, and 4.3% Hispanic or Latino. The median household income was $117,837, and the median age was 38.7 years.
Leesburg is a diverse and vibrant community, with a variety of cultural and recreational activities. The town is home to several museums, galleries, and theaters, as well as a variety of restaurants, shops, and parks. The town is also home to several annual festivals and events, including the Leesburg Flower and Garden Festival and the Leesburg Airshow.
Common Questions
What is Per Capita Income in Leesburg?
Per Capita income in Leesburg is $57,021.
What is the Median Family Income in Leesburg?
Median Family Income in Leesburg is $150,710.
What is the Median Household income in Leesburg?
Median Household Income in Leesburg is $132,298.
What is Income or Wage Gap in Leesburg?
Income or Wage Gap in Leesburg is 38.2%.
Women in Leesburg earn 61.8 cents for every dollar earned by a man.
What is Inequality or Gini Index in Leesburg?
Inequality or Gini Index in Leesburg is 0.41.
What is the Total Population of Leesburg?
Total Population of Leesburg is 48,465.
What is the Total Male Population of Leesburg?
Total Male Population of Leesburg is 24,519.
What is the Total Female Population of Leesburg?
Total Female Population of Leesburg is 23,946.
What is the Ratio of Males per 100 Females in Leesburg?
There are 102.39 Males per 100 Females in Leesburg.
What is the Ratio of Females per 100 Males in Leesburg?
There are 97.66 Females per 100 Males in Leesburg.
What is the Median Population Age in Leesburg?
Median Population Age in Leesburg is 34.8 Years.
What is the Average Family Size in Leesburg
Average Family Size in Leesburg is 3.4 People.
What is the Average Household Size in Leesburg
Average Household Size in Leesburg is 2.9 People.
How Large is the Labor Force in Leesburg?
There are 28,382 People in the Labor Forcein in Leesburg.
What is the Percentage of People in the Labor Force in Leesburg?
76.9% of People are in the Labor Force in Leesburg.
What is the Unemployment Rate in Leesburg?
Unemployment Rate in Leesburg is 3.1%.