Cities with the Highest Percentage of Peruvian Population in Virginia
RELATED REPORTS & OPTIONS
Peruvian
Virginia
Compare Cities
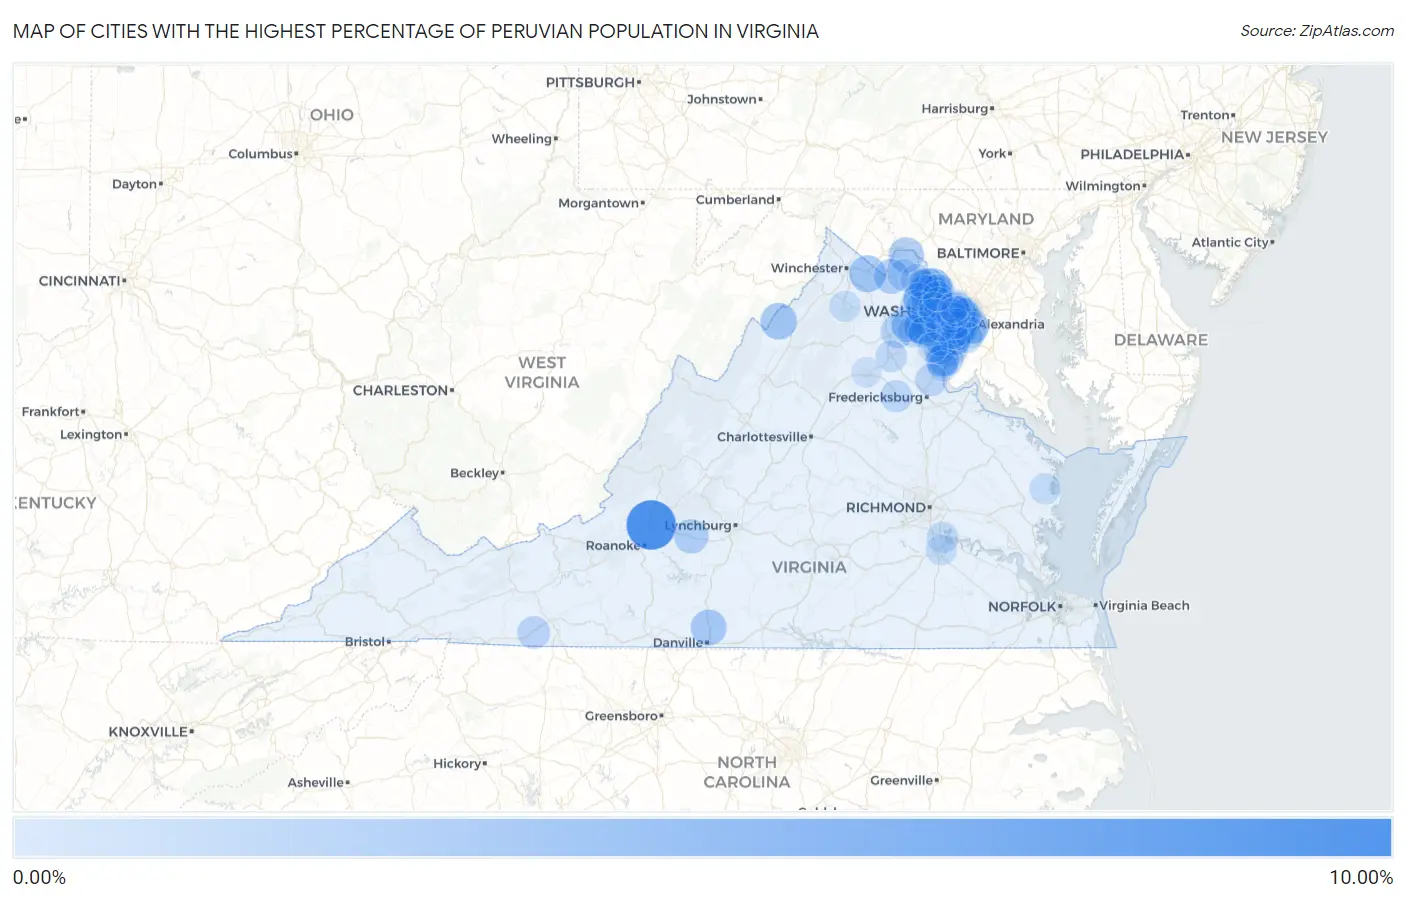
Map of Cities with the Highest Percentage of Peruvian Population in Virginia
0.00%
10.00%
Cities with the Highest Percentage of Peruvian Population in Virginia
| City | Peruvian | vs State | vs National | |
| 1. | Troutville | 8.14% | 0.47%(+7.67)#1 | 0.22%(+7.92)#25 |
| 2. | Ravensworth | 7.03% | 0.47%(+6.56)#2 | 0.22%(+6.81)#37 |
| 3. | Oak Grove | 4.46% | 0.47%(+3.99)#3 | 0.22%(+4.25)#81 |
| 4. | Countryside | 3.73% | 0.47%(+3.26)#4 | 0.22%(+3.52)#107 |
| 5. | Fairfax | 3.61% | 0.47%(+3.14)#5 | 0.22%(+3.40)#113 |
| 6. | Lake Barcroft | 3.58% | 0.47%(+3.11)#6 | 0.22%(+3.36)#114 |
| 7. | Sterling | 3.52% | 0.47%(+3.05)#7 | 0.22%(+3.30)#118 |
| 8. | Mcnair | 3.29% | 0.47%(+2.83)#8 | 0.22%(+3.08)#129 |
| 9. | West Falls Church | 3.14% | 0.47%(+2.67)#9 | 0.22%(+2.92)#137 |
| 10. | Berryville | 3.11% | 0.47%(+2.64)#10 | 0.22%(+2.89)#140 |
| 11. | Sudley | 3.11% | 0.47%(+2.64)#11 | 0.22%(+2.89)#141 |
| 12. | Basye | 2.98% | 0.47%(+2.51)#12 | 0.22%(+2.77)#158 |
| 13. | Laurel Hill | 2.92% | 0.47%(+2.45)#13 | 0.22%(+2.70)#162 |
| 14. | George Mason | 2.78% | 0.47%(+2.31)#14 | 0.22%(+2.56)#180 |
| 15. | Burke | 2.75% | 0.47%(+2.28)#15 | 0.22%(+2.54)#182 |
| 16. | Sully Square | 2.73% | 0.47%(+2.27)#16 | 0.22%(+2.52)#183 |
| 17. | Blairs | 2.66% | 0.47%(+2.19)#17 | 0.22%(+2.44)#190 |
| 18. | University Center | 2.65% | 0.47%(+2.18)#18 | 0.22%(+2.44)#193 |
| 19. | Woodbridge | 2.63% | 0.47%(+2.16)#19 | 0.22%(+2.42)#194 |
| 20. | Lovettsville | 2.59% | 0.47%(+2.12)#20 | 0.22%(+2.37)#199 |
| 21. | Loudoun Valley Estates | 2.57% | 0.47%(+2.10)#21 | 0.22%(+2.35)#202 |
| 22. | Chantilly | 2.45% | 0.47%(+1.98)#22 | 0.22%(+2.24)#216 |
| 23. | Huntington | 2.43% | 0.47%(+1.96)#23 | 0.22%(+2.21)#220 |
| 24. | Burke Centre | 2.42% | 0.47%(+1.95)#24 | 0.22%(+2.20)#223 |
| 25. | Round Hill | 2.40% | 0.47%(+1.93)#25 | 0.22%(+2.18)#228 |
| 26. | Hutchison | 2.39% | 0.47%(+1.92)#26 | 0.22%(+2.17)#229 |
| 27. | Annandale | 2.39% | 0.47%(+1.92)#27 | 0.22%(+2.17)#230 |
| 28. | Springfield | 2.32% | 0.47%(+1.85)#28 | 0.22%(+2.11)#237 |
| 29. | Manassas Park | 2.28% | 0.47%(+1.81)#29 | 0.22%(+2.06)#247 |
| 30. | Lake Ridge | 2.27% | 0.47%(+1.80)#30 | 0.22%(+2.06)#249 |
| 31. | Bedford | 2.19% | 0.47%(+1.72)#31 | 0.22%(+1.97)#264 |
| 32. | Franconia | 2.16% | 0.47%(+1.69)#32 | 0.22%(+1.94)#269 |
| 33. | Herndon | 2.13% | 0.47%(+1.67)#33 | 0.22%(+1.92)#273 |
| 34. | Cherry Hill | 2.10% | 0.47%(+1.63)#34 | 0.22%(+1.88)#277 |
| 35. | Dumfries | 2.09% | 0.47%(+1.62)#35 | 0.22%(+1.87)#283 |
| 36. | Loch Lomond | 2.00% | 0.47%(+1.53)#36 | 0.22%(+1.78)#302 |
| 37. | New Baltimore | 1.89% | 0.47%(+1.42)#37 | 0.22%(+1.68)#331 |
| 38. | Dale City | 1.89% | 0.47%(+1.42)#38 | 0.22%(+1.67)#334 |
| 39. | Pimmit Hills | 1.88% | 0.47%(+1.41)#39 | 0.22%(+1.66)#336 |
| 40. | Centreville | 1.83% | 0.47%(+1.36)#40 | 0.22%(+1.61)#353 |
| 41. | Rose Hill Cdp Fairfax County | 1.79% | 0.47%(+1.32)#41 | 0.22%(+1.58)#357 |
| 42. | Sugarland Run | 1.77% | 0.47%(+1.30)#42 | 0.22%(+1.56)#365 |
| 43. | Dulles Town Center | 1.75% | 0.47%(+1.28)#43 | 0.22%(+1.54)#370 |
| 44. | Triangle | 1.74% | 0.47%(+1.27)#44 | 0.22%(+1.52)#373 |
| 45. | Floris | 1.69% | 0.47%(+1.22)#45 | 0.22%(+1.47)#385 |
| 46. | Lincolnia | 1.63% | 0.47%(+1.16)#46 | 0.22%(+1.42)#399 |
| 47. | Galax | 1.60% | 0.47%(+1.13)#47 | 0.22%(+1.38)#407 |
| 48. | Falls Church | 1.59% | 0.47%(+1.12)#48 | 0.22%(+1.38)#409 |
| 49. | Belmont | 1.54% | 0.47%(+1.07)#49 | 0.22%(+1.32)#428 |
| 50. | Seven Corners | 1.52% | 0.47%(+1.05)#50 | 0.22%(+1.31)#437 |
| 51. | Moorefield | 1.49% | 0.47%(+1.02)#51 | 0.22%(+1.28)#451 |
| 52. | Haymarket | 1.46% | 0.47%(+0.994)#52 | 0.22%(+1.25)#459 |
| 53. | Ashburn | 1.45% | 0.47%(+0.978)#53 | 0.22%(+1.23)#468 |
| 54. | Newington | 1.44% | 0.47%(+0.969)#54 | 0.22%(+1.22)#474 |
| 55. | West Springfield | 1.42% | 0.47%(+0.947)#55 | 0.22%(+1.20)#481 |
| 56. | Linton Hall | 1.41% | 0.47%(+0.943)#56 | 0.22%(+1.20)#484 |
| 57. | Lowes Island | 1.38% | 0.47%(+0.916)#57 | 0.22%(+1.17)#498 |
| 58. | Stone Ridge | 1.38% | 0.47%(+0.914)#58 | 0.22%(+1.17)#500 |
| 59. | Stafford Courthouse | 1.36% | 0.47%(+0.892)#59 | 0.22%(+1.15)#506 |
| 60. | Hamilton | 1.34% | 0.47%(+0.866)#60 | 0.22%(+1.12)#514 |
| 61. | Yorkshire | 1.33% | 0.47%(+0.866)#61 | 0.22%(+1.12)#515 |
| 62. | Bull Run | 1.33% | 0.47%(+0.861)#62 | 0.22%(+1.11)#516 |
| 63. | Lake Wilderness | 1.31% | 0.47%(+0.844)#63 | 0.22%(+1.10)#523 |
| 64. | Gainesville | 1.31% | 0.47%(+0.839)#64 | 0.22%(+1.09)#528 |
| 65. | Leesburg | 1.29% | 0.47%(+0.816)#65 | 0.22%(+1.07)#541 |
| 66. | Belle Haven | 1.24% | 0.47%(+0.773)#66 | 0.22%(+1.03)#557 |
| 67. | Kings Park | 1.22% | 0.47%(+0.755)#67 | 0.22%(+1.01)#568 |
| 68. | Oakton | 1.18% | 0.47%(+0.708)#68 | 0.22%(+0.962)#591 |
| 69. | Bealeton | 1.16% | 0.47%(+0.687)#69 | 0.22%(+0.941)#595 |
| 70. | Brambleton | 1.13% | 0.47%(+0.663)#70 | 0.22%(+0.917)#606 |
| 71. | County Center | 1.12% | 0.47%(+0.649)#71 | 0.22%(+0.903)#616 |
| 72. | Fair Oaks | 1.12% | 0.47%(+0.647)#72 | 0.22%(+0.901)#618 |
| 73. | Enon | 1.10% | 0.47%(+0.632)#73 | 0.22%(+0.886)#626 |
| 74. | Hybla Valley | 1.04% | 0.47%(+0.575)#74 | 0.22%(+0.829)#672 |
| 75. | South Riding | 1.03% | 0.47%(+0.556)#75 | 0.22%(+0.810)#679 |
| 76. | Irvington | 0.96% | 0.47%(+0.494)#76 | 0.22%(+0.748)#721 |
| 77. | Lorton | 0.95% | 0.47%(+0.479)#77 | 0.22%(+0.733)#738 |
| 78. | Front Royal | 0.93% | 0.47%(+0.460)#78 | 0.22%(+0.714)#751 |
| 79. | Mount Vernon | 0.92% | 0.47%(+0.456)#79 | 0.22%(+0.710)#756 |
| 80. | Reston | 0.92% | 0.47%(+0.450)#80 | 0.22%(+0.704)#761 |
| 81. | Union Mill | 0.91% | 0.47%(+0.437)#81 | 0.22%(+0.691)#770 |
| 82. | Fort Lee | 0.86% | 0.47%(+0.389)#82 | 0.22%(+0.643)#800 |
| 83. | Lansdowne | 0.86% | 0.47%(+0.388)#83 | 0.22%(+0.641)#804 |
| 84. | Woodburn | 0.83% | 0.47%(+0.364)#84 | 0.22%(+0.618)#823 |
| 85. | Mclean | 0.80% | 0.47%(+0.327)#85 | 0.22%(+0.581)#857 |
| 86. | Franklin Farm | 0.78% | 0.47%(+0.314)#86 | 0.22%(+0.568)#871 |
| 87. | Manassas | 0.76% | 0.47%(+0.296)#87 | 0.22%(+0.550)#887 |
| 88. | Leesylvania | 0.76% | 0.47%(+0.295)#88 | 0.22%(+0.549)#889 |
| 89. | Newington Forest | 0.74% | 0.47%(+0.266)#89 | 0.22%(+0.520)#915 |
| 90. | Arlington | 0.70% | 0.47%(+0.234)#90 | 0.22%(+0.488)#952 |
| 91. | Merrifield | 0.68% | 0.47%(+0.213)#91 | 0.22%(+0.467)#982 |
| 92. | North Springfield | 0.68% | 0.47%(+0.210)#92 | 0.22%(+0.464)#986 |
| 93. | Fairfax Station | 0.68% | 0.47%(+0.207)#93 | 0.22%(+0.461)#992 |
| 94. | Quantico Base | 0.67% | 0.47%(+0.201)#94 | 0.22%(+0.455)#998 |
| 95. | Greenbriar | 0.65% | 0.47%(+0.185)#95 | 0.22%(+0.439)#1,015 |
| 96. | Idylwood | 0.65% | 0.47%(+0.183)#96 | 0.22%(+0.437)#1,023 |
| 97. | Tysons | 0.63% | 0.47%(+0.157)#97 | 0.22%(+0.411)#1,057 |
| 98. | Culpeper | 0.61% | 0.47%(+0.143)#98 | 0.22%(+0.397)#1,076 |
| 99. | Dranesville | 0.58% | 0.47%(+0.107)#99 | 0.22%(+0.361)#1,138 |
| 100. | Independent Hill | 0.57% | 0.47%(+0.099)#100 | 0.22%(+0.353)#1,149 |
Common Questions
What are the Top 10 Cities with the Highest Percentage of Peruvian Population in Virginia?
Top 10 Cities with the Highest Percentage of Peruvian Population in Virginia are:
#1
8.14%
#2
7.03%
#3
4.46%
#4
3.73%
#5
3.61%
#6
3.58%
#7
3.52%
#8
3.29%
#9
3.14%
#10
3.11%
What city has the Highest Percentage of Peruvian Population in Virginia?
Troutville has the Highest Percentage of Peruvian Population in Virginia with 8.14%.
What is the Percentage of Peruvian Population in the State of Virginia?
Percentage of Peruvian Population in Virginia is 0.47%.
What is the Percentage of Peruvian Population in the United States?
Percentage of Peruvian Population in the United States is 0.22%.