Boyce, VA Map & Demographics
Boyce Map

Boyce Overview
$46,484
PER CAPITA INCOME
$135,313
AVG FAMILY INCOME
$107,000
AVG HOUSEHOLD INCOME
53.1%
WAGE / INCOME GAP [ % ]
46.9¢/ $1
WAGE / INCOME GAP [ $ ]
0.36
INEQUALITY / GINI INDEX
956
TOTAL POPULATION
497
MALE POPULATION
459
FEMALE POPULATION
108.28
MALES / 100 FEMALES
92.35
FEMALES / 100 MALES
42.6
MEDIAN AGE
3.9
AVG FAMILY SIZE
3.0
AVG HOUSEHOLD SIZE
589
LABOR FORCE [ PEOPLE ]
75.1%
PERCENT IN LABOR FORCE
3.9%
UNEMPLOYMENT RATE
Boyce Zip Codes
Boyce Area Codes
Income in Boyce
Income Overview in Boyce
Per Capita Income in Boyce is $46,484, while median incomes of families and households are $135,313 and $107,000 respectively.
| Characteristic | Number | Measure |
| Per Capita Income | 956 | $46,484 |
| Median Family Income | 217 | $135,313 |
| Mean Family Income | 217 | $150,470 |
| Median Household Income | 316 | $107,000 |
| Mean Household Income | 316 | $122,450 |
| Income Deficit | 217 | $0 |
| Wage / Income Gap (%) | 956 | 53.13% |
| Wage / Income Gap ($) | 956 | 46.87¢ per $1 |
| Gini / Inequality Index | 956 | 0.36 |
Earnings by Sex in Boyce
Average Earnings in Boyce are $46,293, $68,229 for men and $31,979 for women, a difference of 53.1%.
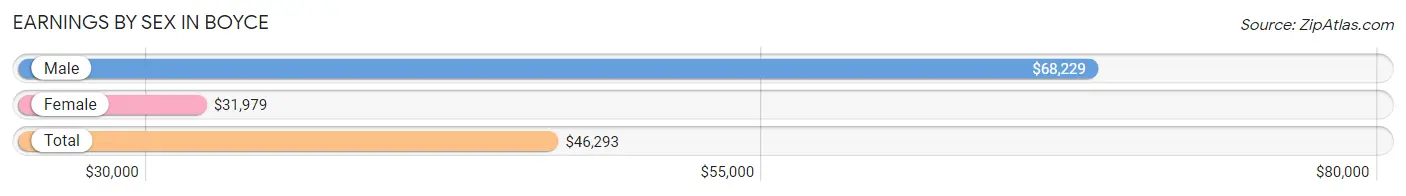
| Sex | Number | Average Earnings |
| Male | 329 (54.3%) | $68,229 |
| Female | 277 (45.7%) | $31,979 |
| Total | 606 (100.0%) | $46,293 |
Earnings by Sex by Income Bracket in Boyce
The most common earnings brackets in Boyce are $100,000+ for men (91 | 27.7%) and $40,000 to $44,999 for women (29 | 10.5%).
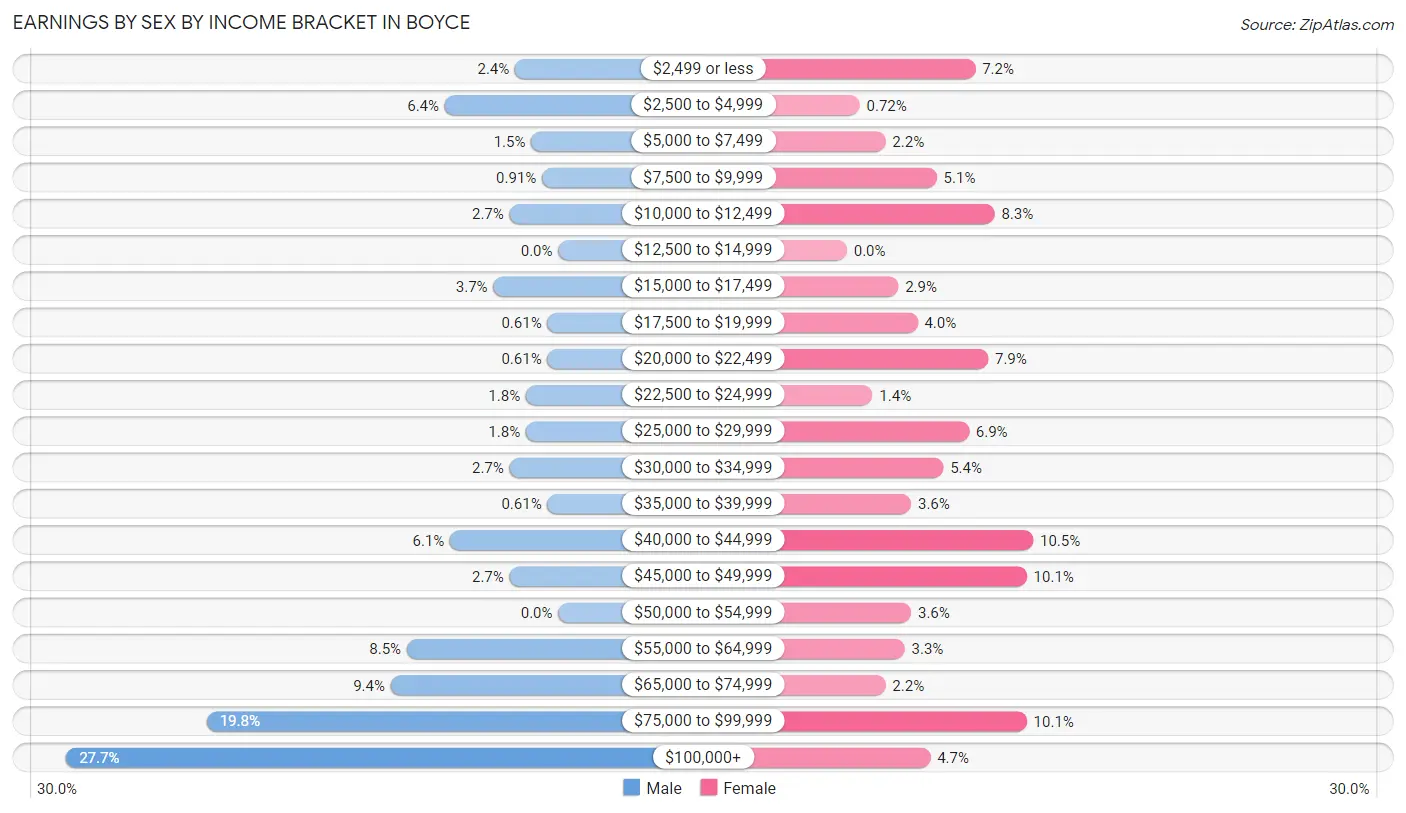
| Income | Male | Female |
| $2,499 or less | 8 (2.4%) | 20 (7.2%) |
| $2,500 to $4,999 | 21 (6.4%) | 2 (0.7%) |
| $5,000 to $7,499 | 5 (1.5%) | 6 (2.2%) |
| $7,500 to $9,999 | 3 (0.9%) | 14 (5.1%) |
| $10,000 to $12,499 | 9 (2.7%) | 23 (8.3%) |
| $12,500 to $14,999 | 0 (0.0%) | 0 (0.0%) |
| $15,000 to $17,499 | 12 (3.6%) | 8 (2.9%) |
| $17,500 to $19,999 | 2 (0.6%) | 11 (4.0%) |
| $20,000 to $22,499 | 2 (0.6%) | 22 (7.9%) |
| $22,500 to $24,999 | 6 (1.8%) | 4 (1.4%) |
| $25,000 to $29,999 | 6 (1.8%) | 19 (6.9%) |
| $30,000 to $34,999 | 9 (2.7%) | 15 (5.4%) |
| $35,000 to $39,999 | 2 (0.6%) | 10 (3.6%) |
| $40,000 to $44,999 | 20 (6.1%) | 29 (10.5%) |
| $45,000 to $49,999 | 9 (2.7%) | 28 (10.1%) |
| $50,000 to $54,999 | 0 (0.0%) | 10 (3.6%) |
| $55,000 to $64,999 | 28 (8.5%) | 9 (3.3%) |
| $65,000 to $74,999 | 31 (9.4%) | 6 (2.2%) |
| $75,000 to $99,999 | 65 (19.8%) | 28 (10.1%) |
| $100,000+ | 91 (27.7%) | 13 (4.7%) |
| Total | 329 (100.0%) | 277 (100.0%) |
Earnings by Sex by Educational Attainment in Boyce
Average earnings in Boyce are $81,500 for men and $42,321 for women, a difference of 48.1%. Men with an educational attainment of bachelor's degree enjoy the highest average annual earnings of $161,125, while those with high school diploma education earn the least with $46,667. Women with an educational attainment of bachelor's degree earn the most with the average annual earnings of $60,833, while those with high school diploma education have the smallest earnings of $38,750.
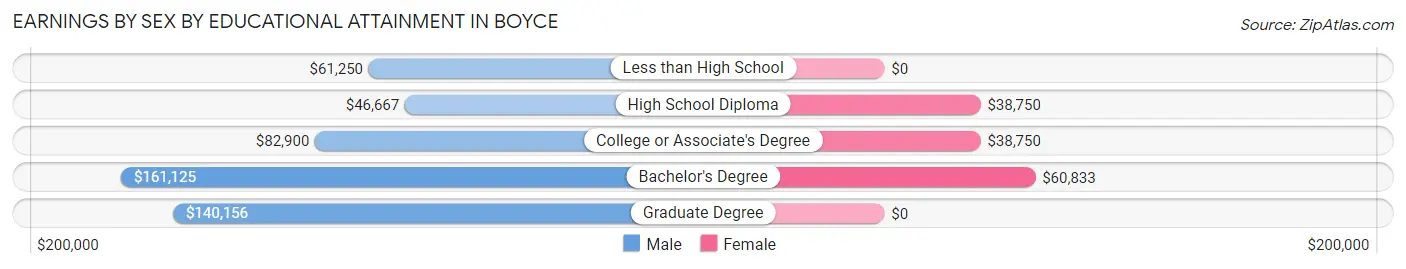
| Educational Attainment | Male Income | Female Income |
| Less than High School | $61,250 | $0 |
| High School Diploma | $46,667 | $38,750 |
| College or Associate's Degree | $82,900 | $38,750 |
| Bachelor's Degree | $161,125 | $60,833 |
| Graduate Degree | $140,156 | $0 |
| Total | $81,500 | $42,321 |
Family Income in Boyce
Family Income Brackets in Boyce
According to the Boyce family income data, there are 63 families falling into the $100,000 to $149,999 income range, which is the most common income bracket and makes up 29.0% of all families.
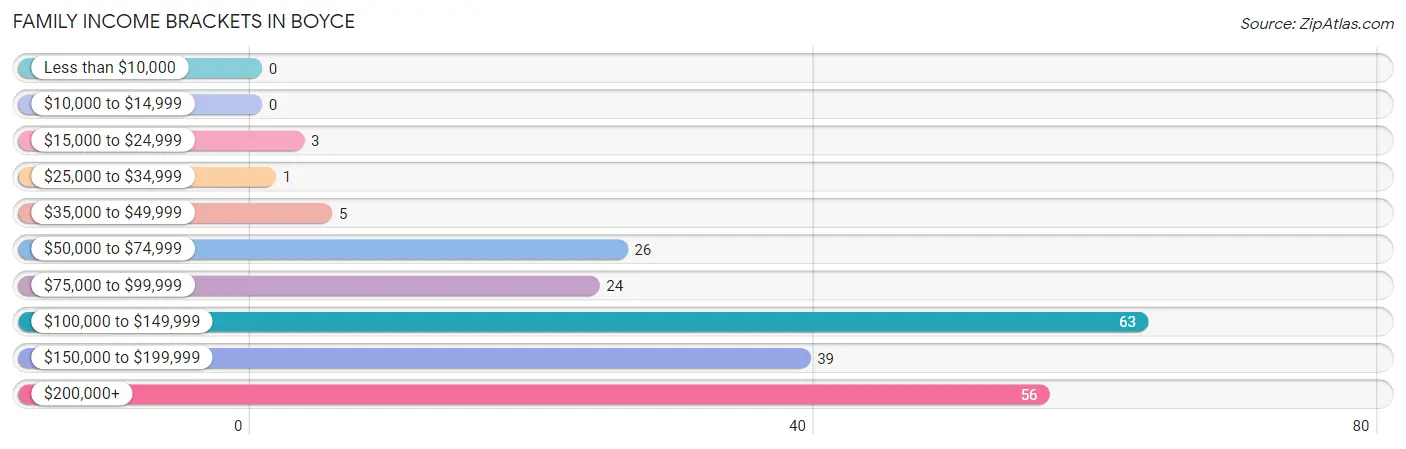
| Income Bracket | # Families | % Families |
| Less than $10,000 | 0 | 0.0% |
| $10,000 to $14,999 | 0 | 0.0% |
| $15,000 to $24,999 | 3 | 1.4% |
| $25,000 to $34,999 | 1 | 0.5% |
| $35,000 to $49,999 | 5 | 2.3% |
| $50,000 to $74,999 | 26 | 12.0% |
| $75,000 to $99,999 | 24 | 11.1% |
| $100,000 to $149,999 | 63 | 29.0% |
| $150,000 to $199,999 | 39 | 18.0% |
| $200,000+ | 56 | 25.8% |
Family Income by Famaliy Size in Boyce
5-person families (23 | 10.6%) account for the highest median family income in Boyce with $226,875 per family, while 2-person families (66 | 30.4%) have the highest median income of $45,938 per family member.
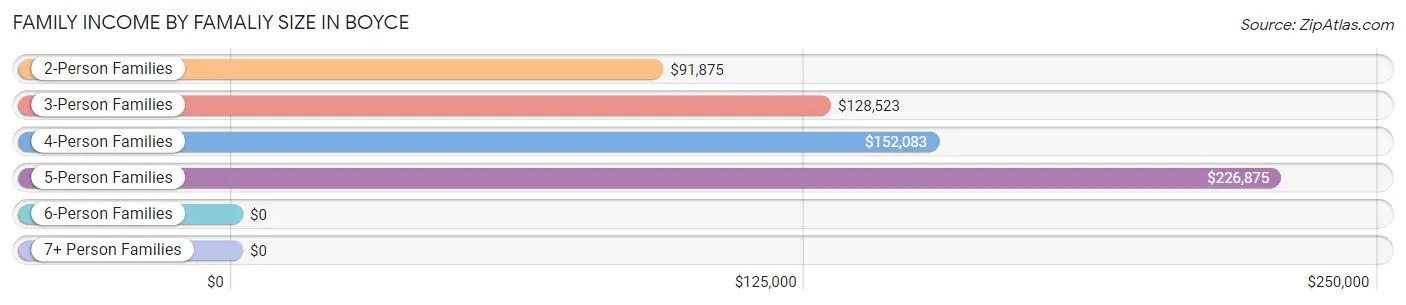
| Income Bracket | # Families | Median Income |
| 2-Person Families | 66 (30.4%) | $91,875 |
| 3-Person Families | 71 (32.7%) | $128,523 |
| 4-Person Families | 45 (20.7%) | $152,083 |
| 5-Person Families | 23 (10.6%) | $226,875 |
| 6-Person Families | 10 (4.6%) | $0 |
| 7+ Person Families | 2 (0.9%) | $0 |
| Total | 217 (100.0%) | $135,313 |
Family Income by Number of Earners in Boyce
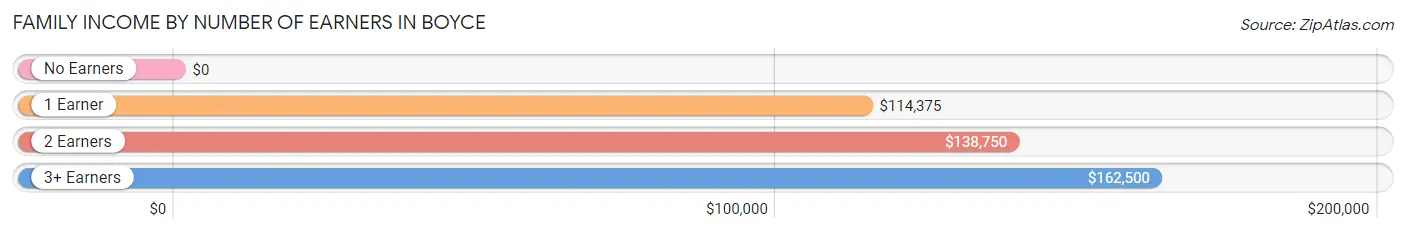
| Number of Earners | # Families | Median Income |
| No Earners | 14 (6.5%) | $0 |
| 1 Earner | 47 (21.7%) | $114,375 |
| 2 Earners | 96 (44.2%) | $138,750 |
| 3+ Earners | 60 (27.7%) | $162,500 |
| Total | 217 (100.0%) | $135,313 |
Household Income in Boyce
Household Income Brackets in Boyce
With 75 households falling in the category, the $100,000 to $149,999 income range is the most frequent in Boyce, accounting for 23.7% of all households. In contrast, only 2 households (0.6%) fall into the $10,000 to $14,999 income bracket, making it the least populous group.
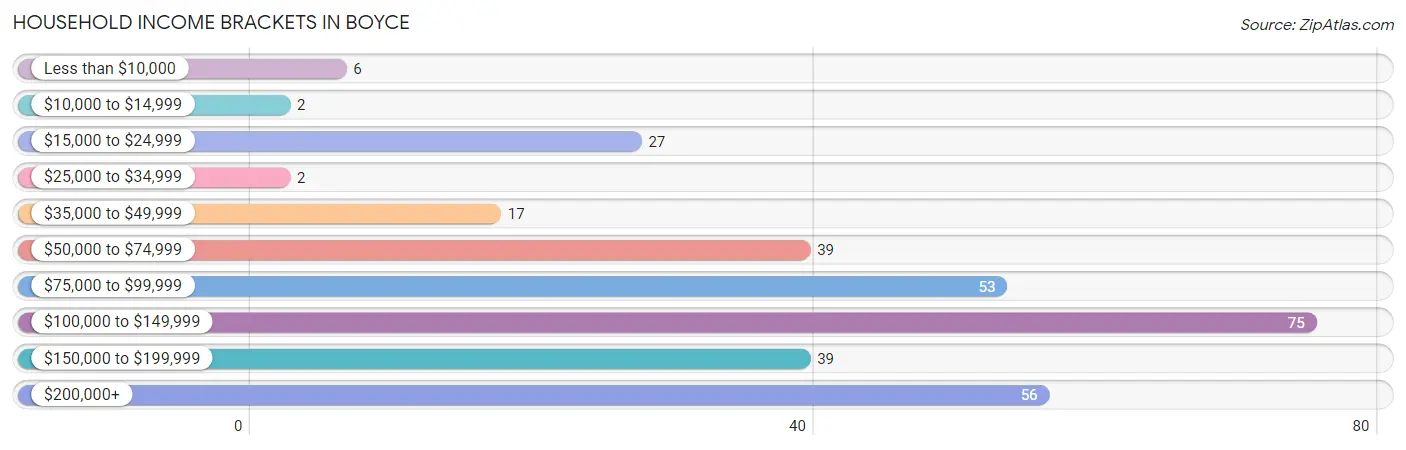
| Income Bracket | # Households | % Households |
| Less than $10,000 | 6 | 1.9% |
| $10,000 to $14,999 | 2 | 0.6% |
| $15,000 to $24,999 | 27 | 8.5% |
| $25,000 to $34,999 | 2 | 0.6% |
| $35,000 to $49,999 | 17 | 5.4% |
| $50,000 to $74,999 | 39 | 12.3% |
| $75,000 to $99,999 | 53 | 16.8% |
| $100,000 to $149,999 | 75 | 23.7% |
| $150,000 to $199,999 | 39 | 12.3% |
| $200,000+ | 56 | 17.7% |
Household Income by Householder Age in Boyce
The median household income in Boyce is $107,000, with the highest median household income of $127,841 found in the 45 to 64 years age bracket for the primary householder. A total of 119 households (37.7%) fall into this category. Meanwhile, the 15 to 24 years age bracket for the primary householder has the lowest median household income of $0, with 9 households (2.9%) in this group.
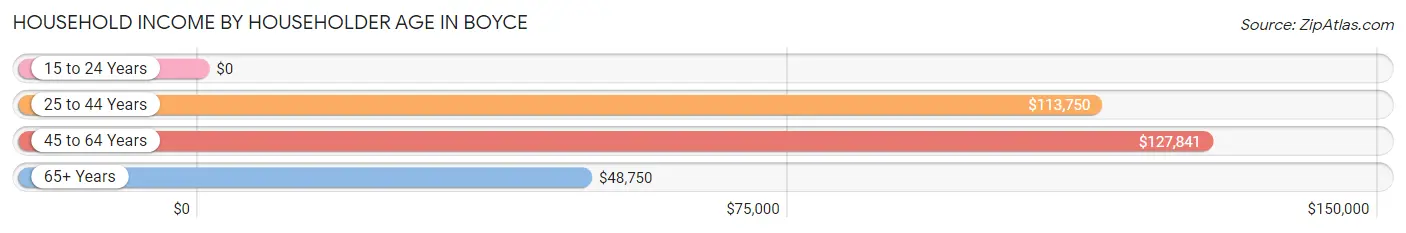
| Income Bracket | # Households | Median Income |
| 15 to 24 Years | 9 (2.9%) | $0 |
| 25 to 44 Years | 112 (35.4%) | $113,750 |
| 45 to 64 Years | 119 (37.7%) | $127,841 |
| 65+ Years | 76 (24.0%) | $48,750 |
| Total | 316 (100.0%) | $107,000 |
Poverty in Boyce
Income Below Poverty by Sex and Age in Boyce
With 1.2% poverty level for males and 0.4% for females among the residents of Boyce, 35 to 44 year old males and 75 year old and over females are the most vulnerable to poverty, with 4 males (6.1%) and 2 females (5.4%) in their respective age groups living below the poverty level.
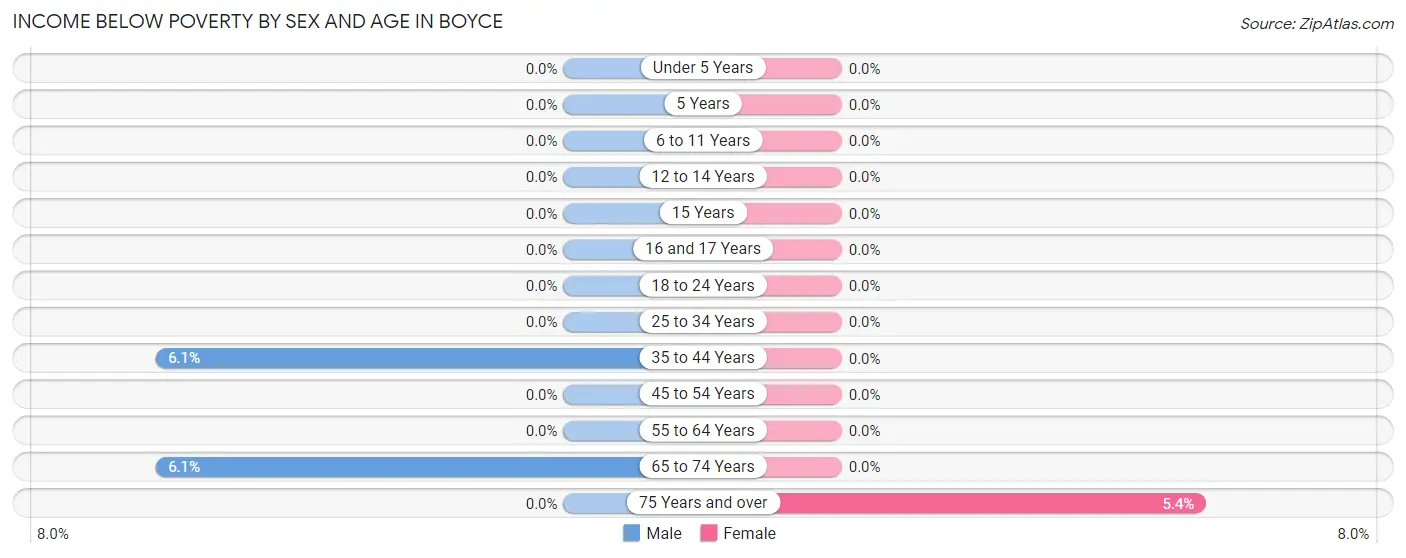
| Age Bracket | Male | Female |
| Under 5 Years | 0 (0.0%) | 0 (0.0%) |
| 5 Years | 0 (0.0%) | 0 (0.0%) |
| 6 to 11 Years | 0 (0.0%) | 0 (0.0%) |
| 12 to 14 Years | 0 (0.0%) | 0 (0.0%) |
| 15 Years | 0 (0.0%) | 0 (0.0%) |
| 16 and 17 Years | 0 (0.0%) | 0 (0.0%) |
| 18 to 24 Years | 0 (0.0%) | 0 (0.0%) |
| 25 to 34 Years | 0 (0.0%) | 0 (0.0%) |
| 35 to 44 Years | 4 (6.1%) | 0 (0.0%) |
| 45 to 54 Years | 0 (0.0%) | 0 (0.0%) |
| 55 to 64 Years | 0 (0.0%) | 0 (0.0%) |
| 65 to 74 Years | 2 (6.1%) | 0 (0.0%) |
| 75 Years and over | 0 (0.0%) | 2 (5.4%) |
| Total | 6 (1.2%) | 2 (0.4%) |
Income Above Poverty by Sex and Age in Boyce
According to the poverty statistics in Boyce, males aged under 5 years and females aged under 5 years are the age groups that are most secure financially, with 100.0% of males and 100.0% of females in these age groups living above the poverty line.
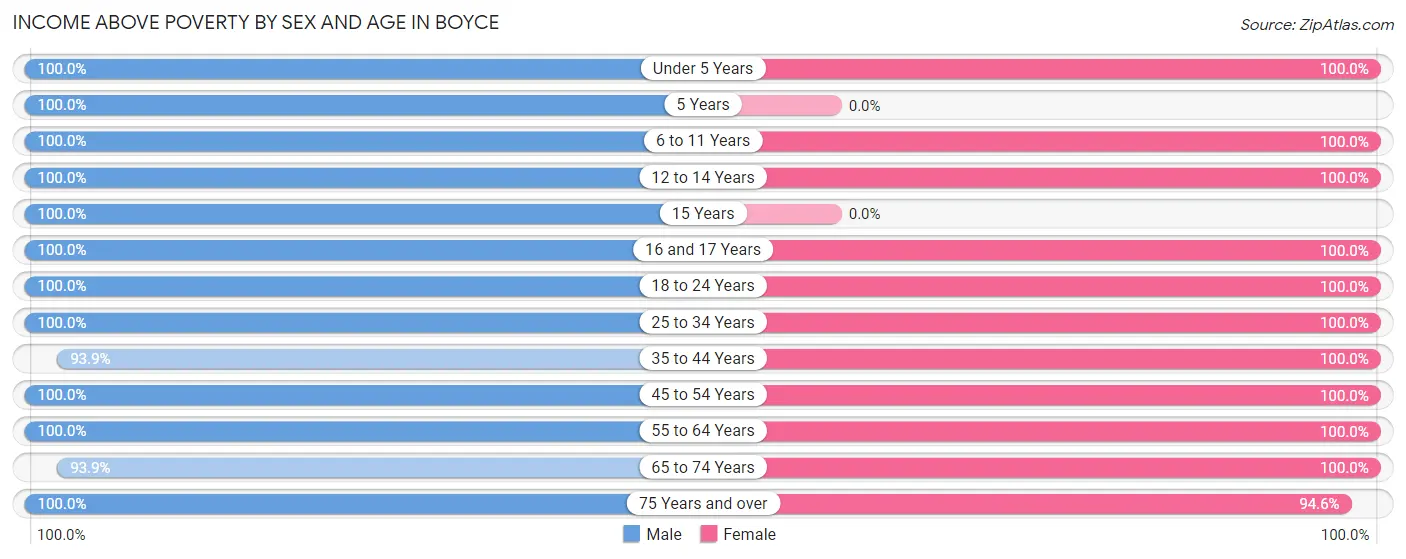
| Age Bracket | Male | Female |
| Under 5 Years | 24 (100.0%) | 36 (100.0%) |
| 5 Years | 5 (100.0%) | 0 (0.0%) |
| 6 to 11 Years | 43 (100.0%) | 34 (100.0%) |
| 12 to 14 Years | 13 (100.0%) | 15 (100.0%) |
| 15 Years | 2 (100.0%) | 0 (0.0%) |
| 16 and 17 Years | 24 (100.0%) | 15 (100.0%) |
| 18 to 24 Years | 47 (100.0%) | 31 (100.0%) |
| 25 to 34 Years | 54 (100.0%) | 59 (100.0%) |
| 35 to 44 Years | 62 (93.9%) | 57 (100.0%) |
| 45 to 54 Years | 109 (100.0%) | 72 (100.0%) |
| 55 to 64 Years | 53 (100.0%) | 70 (100.0%) |
| 65 to 74 Years | 31 (93.9%) | 33 (100.0%) |
| 75 Years and over | 24 (100.0%) | 35 (94.6%) |
| Total | 491 (98.8%) | 457 (99.6%) |
Income Below Poverty Among Married-Couple Families in Boyce
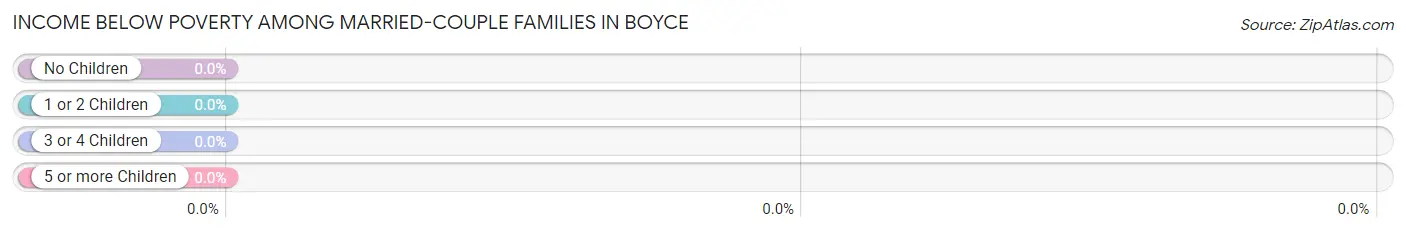
| Children | Above Poverty | Below Poverty |
| No Children | 102 (100.0%) | 0 (0.0%) |
| 1 or 2 Children | 84 (100.0%) | 0 (0.0%) |
| 3 or 4 Children | 10 (100.0%) | 0 (0.0%) |
| 5 or more Children | 0 (0.0%) | 0 (0.0%) |
| Total | 196 (100.0%) | 0 (0.0%) |
Income Below Poverty Among Single-Parent Households in Boyce
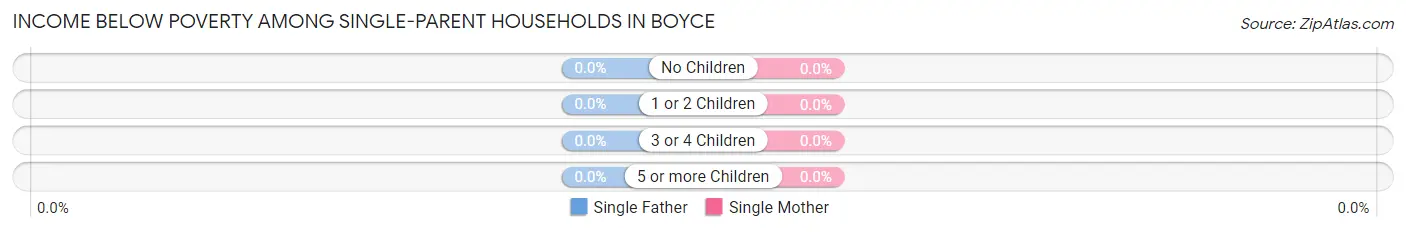
| Children | Single Father | Single Mother |
| No Children | 0 (0.0%) | 0 (0.0%) |
| 1 or 2 Children | 0 (0.0%) | 0 (0.0%) |
| 3 or 4 Children | 0 (0.0%) | 0 (0.0%) |
| 5 or more Children | 0 (0.0%) | 0 (0.0%) |
| Total | 0 (0.0%) | 0 (0.0%) |
Income Below Poverty Among Married-Couple vs Single-Parent Households in Boyce
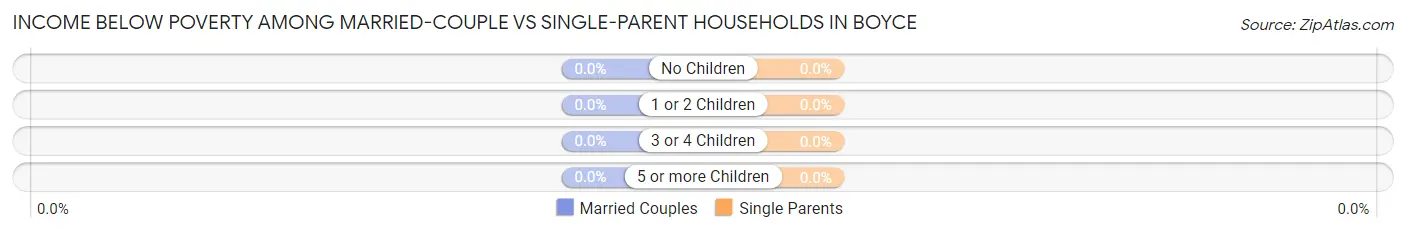
| Children | Married-Couple Families | Single-Parent Households |
| No Children | 0 (0.0%) | 0 (0.0%) |
| 1 or 2 Children | 0 (0.0%) | 0 (0.0%) |
| 3 or 4 Children | 0 (0.0%) | 0 (0.0%) |
| 5 or more Children | 0 (0.0%) | 0 (0.0%) |
| Total | 0 (0.0%) | 0 (0.0%) |
Race in Boyce
The most populous races in Boyce are White / Caucasian (739 | 77.3%), Two or more Races (105 | 11.0%), and Hispanic or Latino (103 | 10.8%).
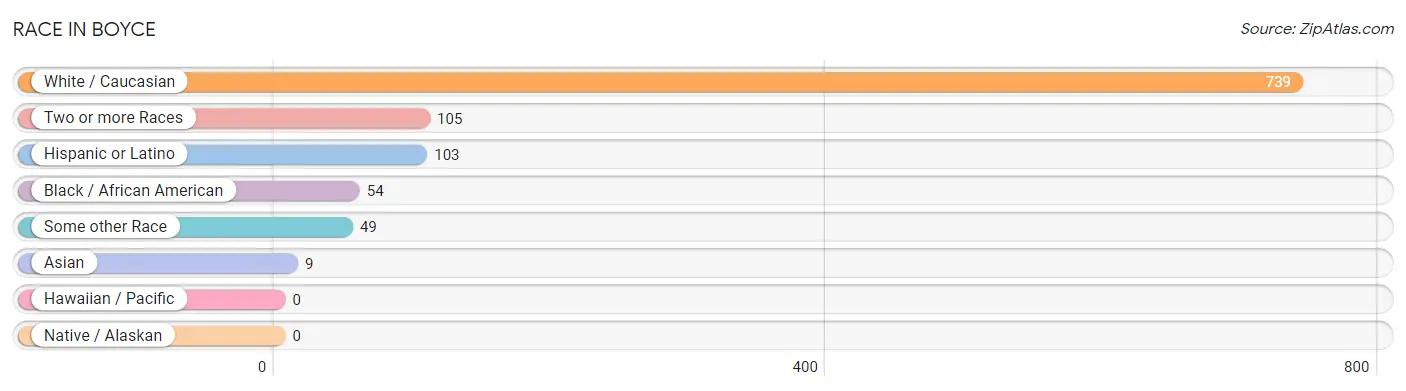
| Race | # Population | % Population |
| Asian | 9 | 0.9% |
| Black / African American | 54 | 5.7% |
| Hawaiian / Pacific | 0 | 0.0% |
| Hispanic or Latino | 103 | 10.8% |
| Native / Alaskan | 0 | 0.0% |
| White / Caucasian | 739 | 77.3% |
| Two or more Races | 105 | 11.0% |
| Some other Race | 49 | 5.1% |
| Total | 956 | 100.0% |
Ancestry in Boyce
The most populous ancestries reported in Boyce are Irish (242 | 25.3%), German (195 | 20.4%), English (179 | 18.7%), American (131 | 13.7%), and Mexican (63 | 6.6%), together accounting for 84.7% of all Boyce residents.
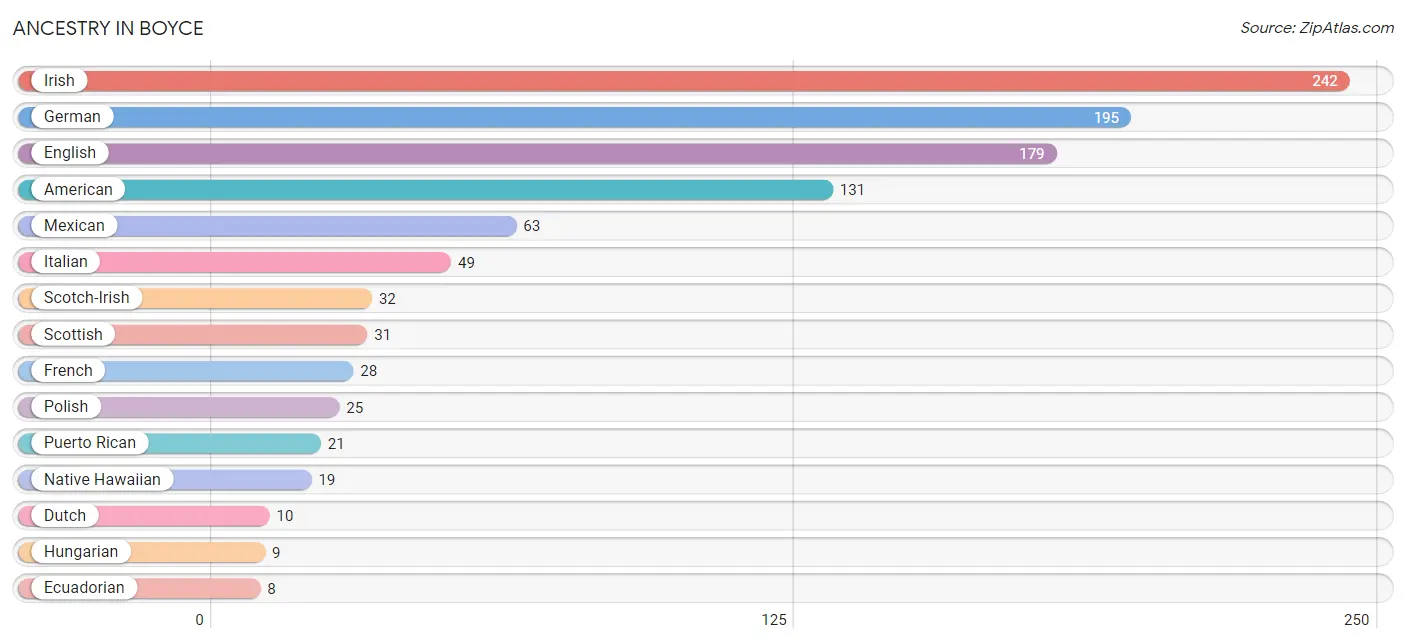
| Ancestry | # Population | % Population |
| American | 131 | 13.7% |
| British | 5 | 0.5% |
| British West Indian | 1 | 0.1% |
| Burmese | 4 | 0.4% |
| Central American | 6 | 0.6% |
| Cherokee | 2 | 0.2% |
| Czech | 2 | 0.2% |
| Czechoslovakian | 3 | 0.3% |
| Dutch | 10 | 1.1% |
| Eastern European | 4 | 0.4% |
| Ecuadorian | 8 | 0.8% |
| English | 179 | 18.7% |
| European | 6 | 0.6% |
| French | 28 | 2.9% |
| French Canadian | 5 | 0.5% |
| German | 195 | 20.4% |
| Hungarian | 9 | 0.9% |
| Indian (Asian) | 8 | 0.8% |
| Irish | 242 | 25.3% |
| Italian | 49 | 5.1% |
| Mexican | 63 | 6.6% |
| Native Hawaiian | 19 | 2.0% |
| Polish | 25 | 2.6% |
| Portuguese | 5 | 0.5% |
| Puerto Rican | 21 | 2.2% |
| Russian | 2 | 0.2% |
| Salvadoran | 6 | 0.6% |
| Scotch-Irish | 32 | 3.4% |
| Scottish | 31 | 3.2% |
| Slavic | 2 | 0.2% |
| South American | 8 | 0.8% |
| Welsh | 8 | 0.8% | View All 32 Rows |
Immigrants in Boyce
The most numerous immigrant groups reported in Boyce came from Central America (13 | 1.4%), Latin America (13 | 1.4%), Asia (9 | 0.9%), Eastern Asia (9 | 0.9%), and Mexico (7 | 0.7%), together accounting for 5.3% of all Boyce residents.
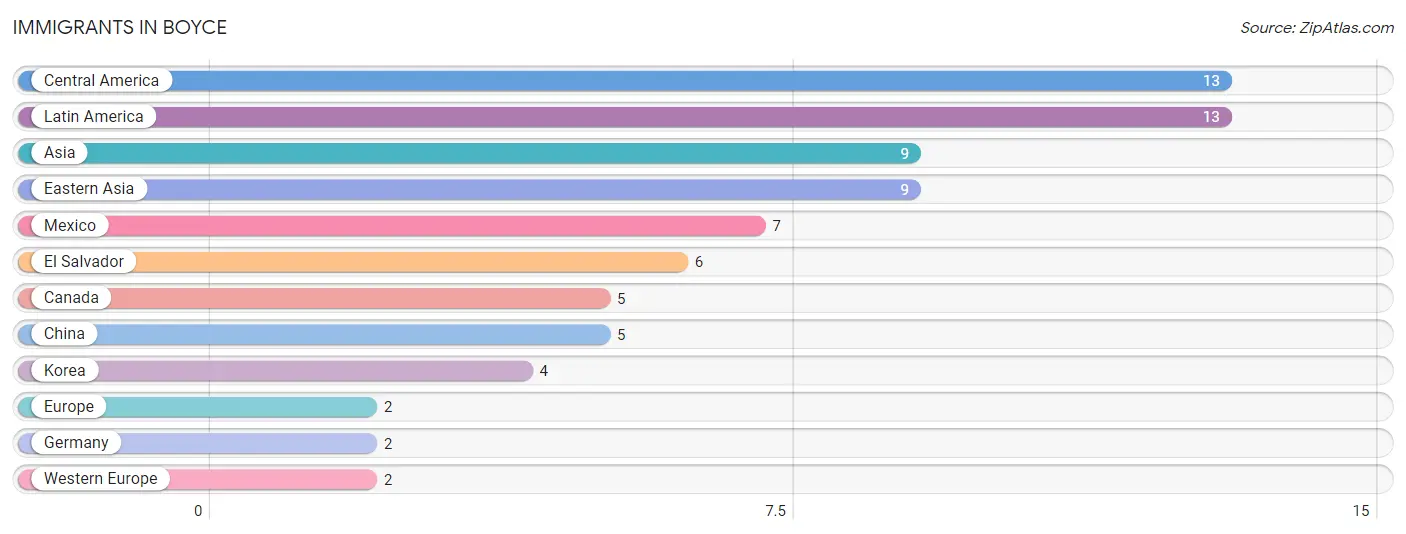
| Immigration Origin | # Population | % Population |
| Asia | 9 | 0.9% |
| Canada | 5 | 0.5% |
| Central America | 13 | 1.4% |
| China | 5 | 0.5% |
| Eastern Asia | 9 | 0.9% |
| El Salvador | 6 | 0.6% |
| Europe | 2 | 0.2% |
| Germany | 2 | 0.2% |
| Korea | 4 | 0.4% |
| Latin America | 13 | 1.4% |
| Mexico | 7 | 0.7% |
| Western Europe | 2 | 0.2% | View All 12 Rows |
Sex and Age in Boyce
Sex and Age in Boyce
The most populous age groups in Boyce are 45 to 49 Years (60 | 12.1%) for men and 50 to 54 Years (55 | 12.0%) for women.
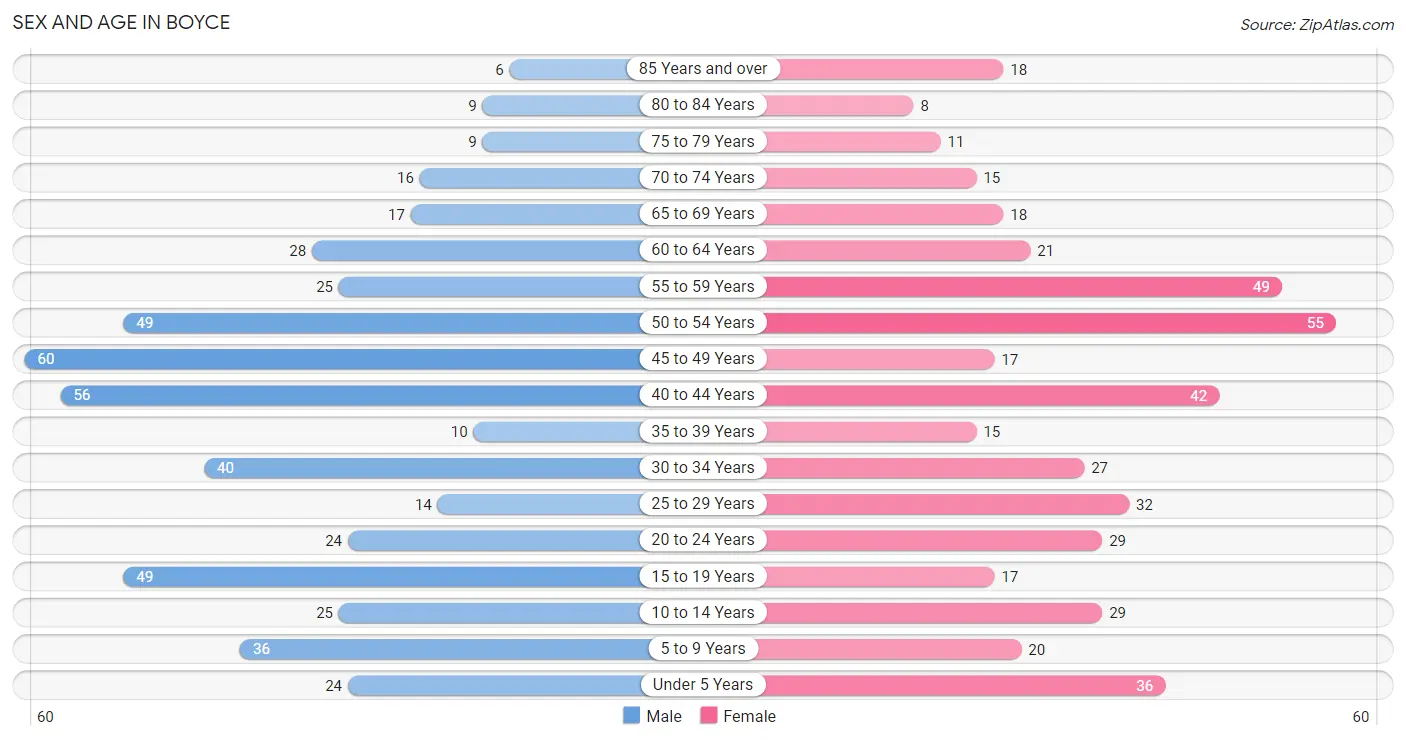
| Age Bracket | Male | Female |
| Under 5 Years | 24 (4.8%) | 36 (7.8%) |
| 5 to 9 Years | 36 (7.2%) | 20 (4.4%) |
| 10 to 14 Years | 25 (5.0%) | 29 (6.3%) |
| 15 to 19 Years | 49 (9.9%) | 17 (3.7%) |
| 20 to 24 Years | 24 (4.8%) | 29 (6.3%) |
| 25 to 29 Years | 14 (2.8%) | 32 (7.0%) |
| 30 to 34 Years | 40 (8.1%) | 27 (5.9%) |
| 35 to 39 Years | 10 (2.0%) | 15 (3.3%) |
| 40 to 44 Years | 56 (11.3%) | 42 (9.1%) |
| 45 to 49 Years | 60 (12.1%) | 17 (3.7%) |
| 50 to 54 Years | 49 (9.9%) | 55 (12.0%) |
| 55 to 59 Years | 25 (5.0%) | 49 (10.7%) |
| 60 to 64 Years | 28 (5.6%) | 21 (4.6%) |
| 65 to 69 Years | 17 (3.4%) | 18 (3.9%) |
| 70 to 74 Years | 16 (3.2%) | 15 (3.3%) |
| 75 to 79 Years | 9 (1.8%) | 11 (2.4%) |
| 80 to 84 Years | 9 (1.8%) | 8 (1.7%) |
| 85 Years and over | 6 (1.2%) | 18 (3.9%) |
| Total | 497 (100.0%) | 459 (100.0%) |
Families and Households in Boyce
Median Family Size in Boyce
The median family size in Boyce is 3.89 persons per family, with married-couple families (196 | 90.3%) accounting for the largest median family size of 4 persons per family. On the other hand, single female/mother families (14 | 6.5%) represent the smallest median family size with 2.79 persons per family.
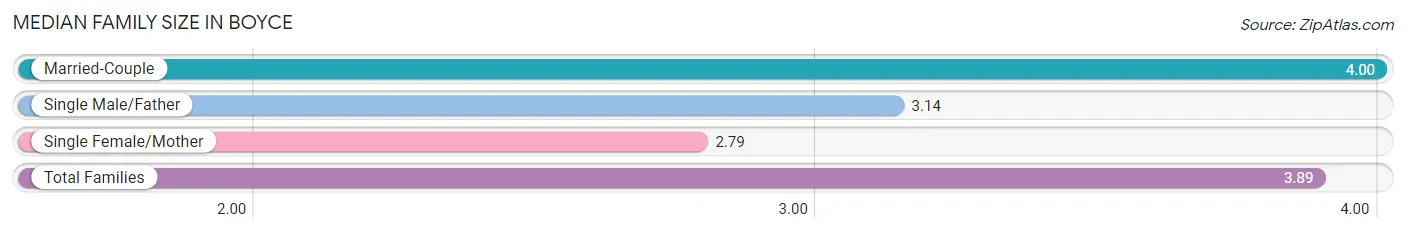
| Family Type | # Families | Family Size |
| Married-Couple | 196 (90.3%) | 4.00 |
| Single Male/Father | 7 (3.2%) | 3.14 |
| Single Female/Mother | 14 (6.5%) | 2.79 |
| Total Families | 217 (100.0%) | 3.89 |
Median Household Size in Boyce
The median household size in Boyce is 3.03 persons per household, with married-couple households (196 | 62.0%) accounting for the largest median household size of 4.02 persons per household. non-family households (99 | 31.3%) represent the smallest median household size with 1.08 persons per household.
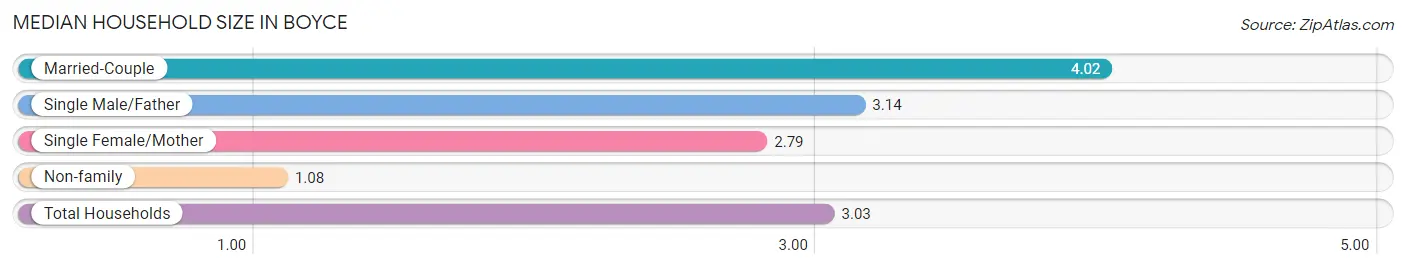
| Household Type | # Households | Household Size |
| Married-Couple | 196 (62.0%) | 4.02 |
| Single Male/Father | 7 (2.2%) | 3.14 |
| Single Female/Mother | 14 (4.4%) | 2.79 |
| Non-family | 99 (31.3%) | 1.08 |
| Total Households | 316 (100.0%) | 3.03 |
Household Size by Marriage Status in Boyce
Out of a total of 316 households in Boyce, 217 (68.7%) are family households, while 99 (31.3%) are nonfamily households. The most numerous type of family households are 3-person households, comprising 71, and the most common type of nonfamily households are 1-person households, comprising 91.
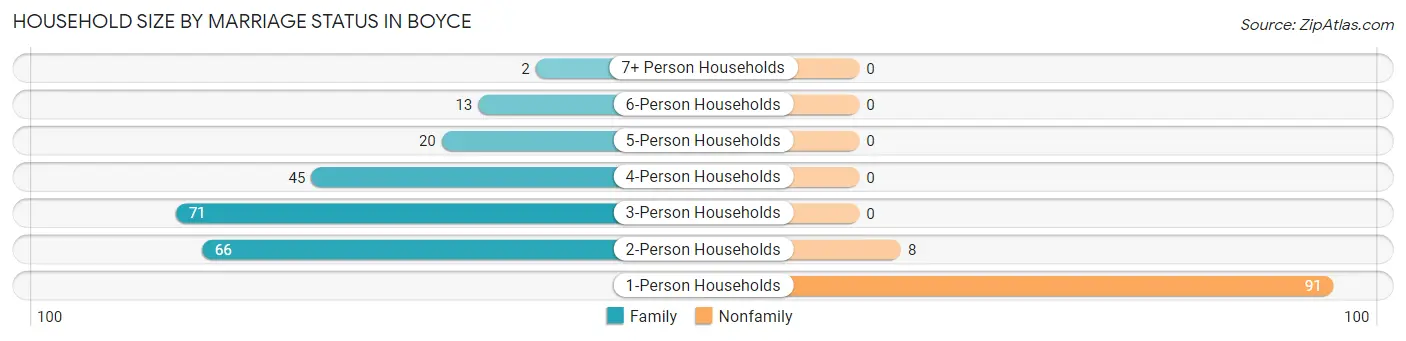
| Household Size | Family Households | Nonfamily Households |
| 1-Person Households | - | 91 (28.8%) |
| 2-Person Households | 66 (20.9%) | 8 (2.5%) |
| 3-Person Households | 71 (22.5%) | 0 (0.0%) |
| 4-Person Households | 45 (14.2%) | 0 (0.0%) |
| 5-Person Households | 20 (6.3%) | 0 (0.0%) |
| 6-Person Households | 13 (4.1%) | 0 (0.0%) |
| 7+ Person Households | 2 (0.6%) | 0 (0.0%) |
| Total | 217 (68.7%) | 99 (31.3%) |
Female Fertility in Boyce
Fertility by Age in Boyce
Average fertility rate in Boyce is 30.0 births per 1,000 women. Women in the age bracket of 20 to 34 years have the highest fertility rate with 57.0 births per 1,000 women. Women in the age bracket of 20 to 34 years acount for 83.3% of all women with births.
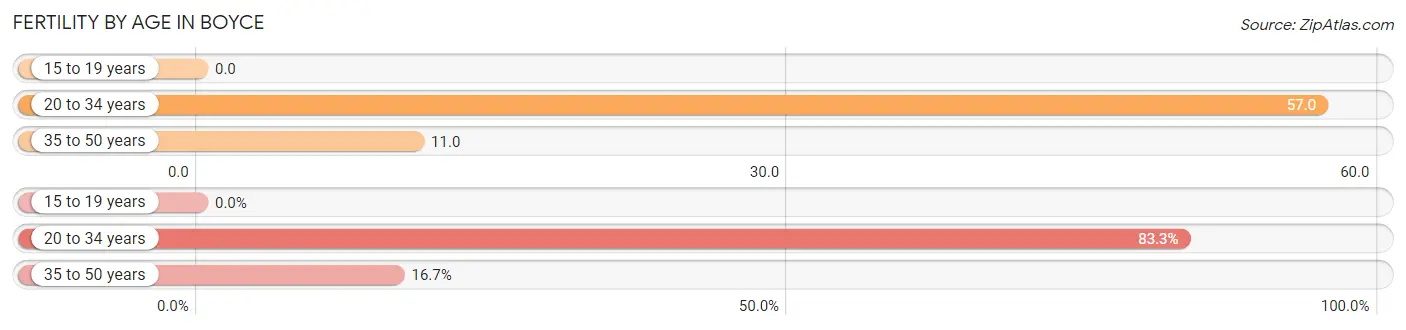
| Age Bracket | Women with Births | Births / 1,000 Women |
| 15 to 19 years | 0 (0.0%) | 0.0 |
| 20 to 34 years | 5 (83.3%) | 57.0 |
| 35 to 50 years | 1 (16.7%) | 11.0 |
| Total | 6 (100.0%) | 30.0 |
Fertility by Age by Marriage Status in Boyce
66.7% of women with births (6) in Boyce are married. The highest percentage of unmarried women with births falls into 20 to 34 years age bracket with 40.0% of them unmarried at the time of birth, while the lowest percentage of unmarried women with births belong to 35 to 50 years age bracket with 0.0% of them unmarried.
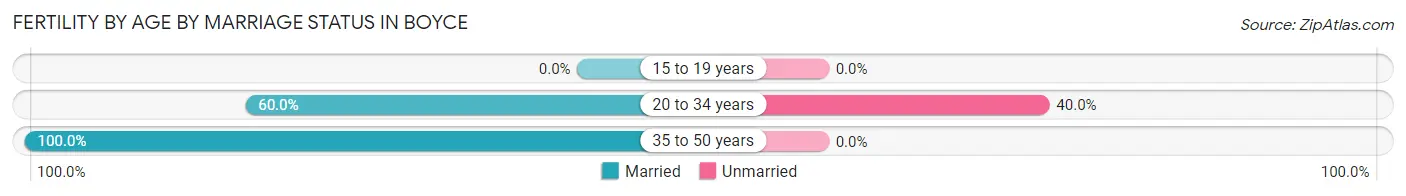
| Age Bracket | Married | Unmarried |
| 15 to 19 years | 0 (0.0%) | 0 (0.0%) |
| 20 to 34 years | 3 (60.0%) | 2 (40.0%) |
| 35 to 50 years | 1 (100.0%) | 0 (0.0%) |
| Total | 4 (66.7%) | 2 (33.3%) |
Fertility by Education in Boyce
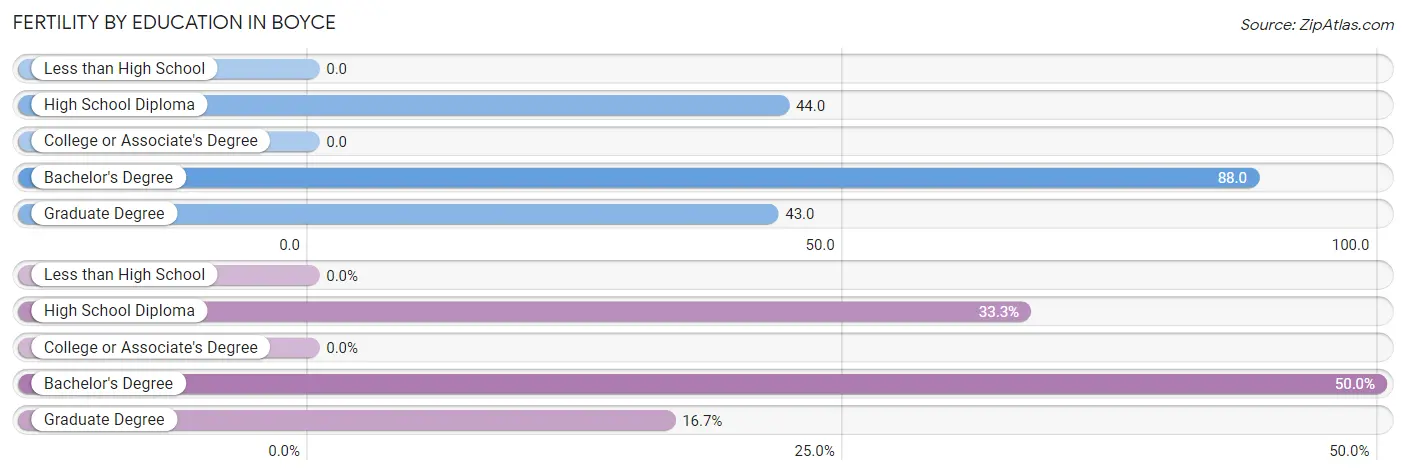
| Educational Attainment | Women with Births | Births / 1,000 Women |
| Less than High School | 0 (0.0%) | 0.0 |
| High School Diploma | 2 (33.3%) | 44.0 |
| College or Associate's Degree | 0 (0.0%) | 0.0 |
| Bachelor's Degree | 3 (50.0%) | 88.0 |
| Graduate Degree | 1 (16.7%) | 43.0 |
| Total | 6 (100.0%) | 30.0 |
Fertility by Education by Marriage Status in Boyce
33.3% of women with births in Boyce are unmarried. Women with the educational attainment of bachelor's degree are most likely to be married with 100.0% of them married at childbirth, while women with the educational attainment of high school diploma are least likely to be married with 100.0% of them unmarried at childbirth.
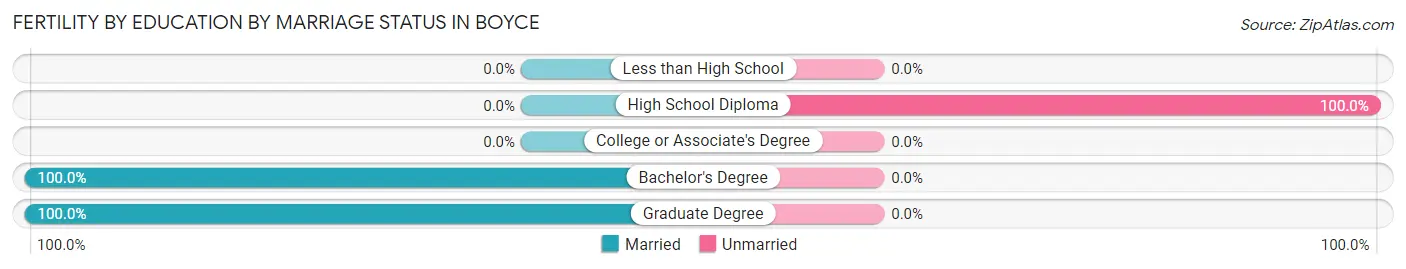
| Educational Attainment | Married | Unmarried |
| Less than High School | 0 (0.0%) | 0 (0.0%) |
| High School Diploma | 0 (0.0%) | 2 (100.0%) |
| College or Associate's Degree | 0 (0.0%) | 0 (0.0%) |
| Bachelor's Degree | 3 (100.0%) | 0 (0.0%) |
| Graduate Degree | 1 (100.0%) | 0 (0.0%) |
| Total | 4 (66.7%) | 2 (33.3%) |
Employment Characteristics in Boyce
Employment by Class of Employer in Boyce
Among the 564 employed individuals in Boyce, private company employees (356 | 63.1%), local government employees (93 | 16.5%), and not-for-profit organizations (51 | 9.0%) make up the most common classes of employment.
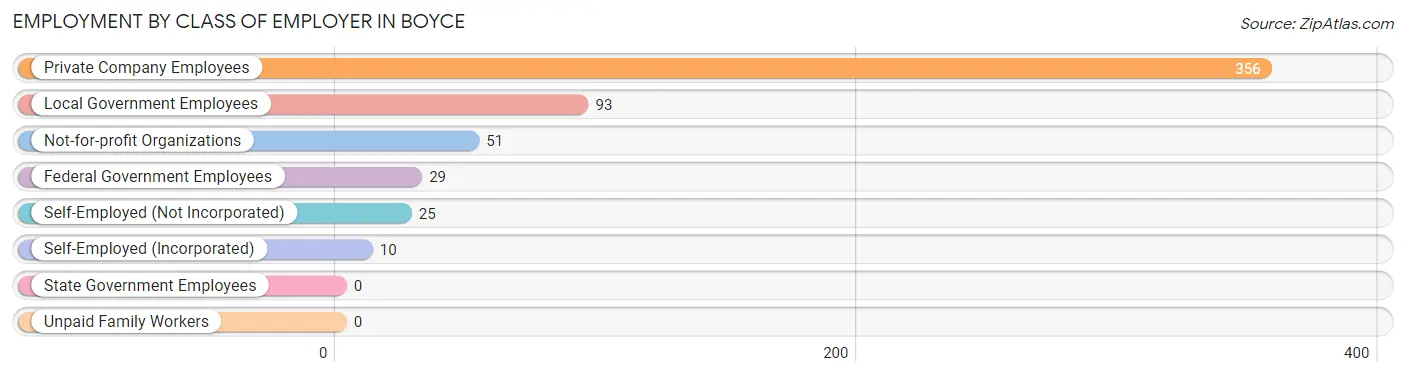
| Employer Class | # Employees | % Employees |
| Private Company Employees | 356 | 63.1% |
| Self-Employed (Incorporated) | 10 | 1.8% |
| Self-Employed (Not Incorporated) | 25 | 4.4% |
| Not-for-profit Organizations | 51 | 9.0% |
| Local Government Employees | 93 | 16.5% |
| State Government Employees | 0 | 0.0% |
| Federal Government Employees | 29 | 5.1% |
| Unpaid Family Workers | 0 | 0.0% |
| Total | 564 | 100.0% |
Employment Status by Age in Boyce
According to the labor force statistics for Boyce, out of the total population over 16 years of age (784), 75.1% or 589 individuals are in the labor force, with 3.9% or 23 of them unemployed. The age group with the highest labor force participation rate is 35 to 44 years, with 96.7% or 119 individuals in the labor force. Within the labor force, the 16 to 19 years age range has the highest percentage of unemployed individuals, with 19.1% or 9 of them being unemployed.
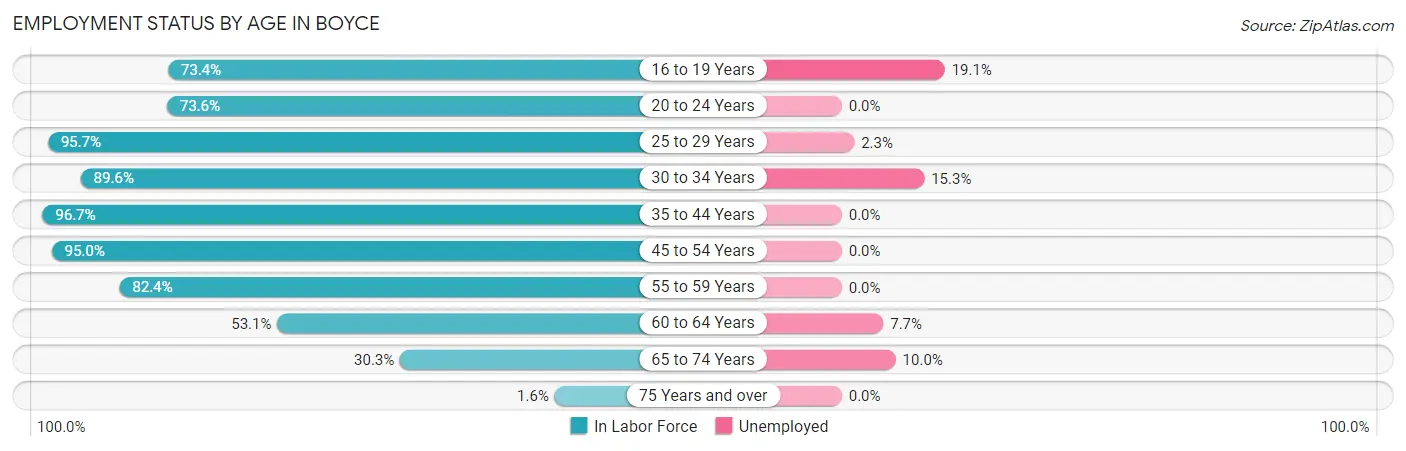
| Age Bracket | In Labor Force | Unemployed |
| 16 to 19 Years | 47 (73.4%) | 9 (19.1%) |
| 20 to 24 Years | 39 (73.6%) | 0 (0.0%) |
| 25 to 29 Years | 44 (95.7%) | 1 (2.3%) |
| 30 to 34 Years | 60 (89.6%) | 9 (15.3%) |
| 35 to 44 Years | 119 (96.7%) | 0 (0.0%) |
| 45 to 54 Years | 172 (95.0%) | 0 (0.0%) |
| 55 to 59 Years | 61 (82.4%) | 0 (0.0%) |
| 60 to 64 Years | 26 (53.1%) | 2 (7.7%) |
| 65 to 74 Years | 20 (30.3%) | 2 (10.0%) |
| 75 Years and over | 1 (1.6%) | 0 (0.0%) |
| Total | 589 (75.1%) | 23 (3.9%) |
Employment Status by Educational Attainment in Boyce
According to labor force statistics for Boyce, 89.3% of individuals (482) out of the total population between 25 and 64 years of age (540) are in the labor force, with 2.5% or 12 of them being unemployed. The group with the highest labor force participation rate are those with the educational attainment of bachelor's degree or higher, with 96.3% or 157 individuals in the labor force. Within the labor force, individuals with high school diploma education have the highest percentage of unemployment, with 10.9% or 11 of them being unemployed.
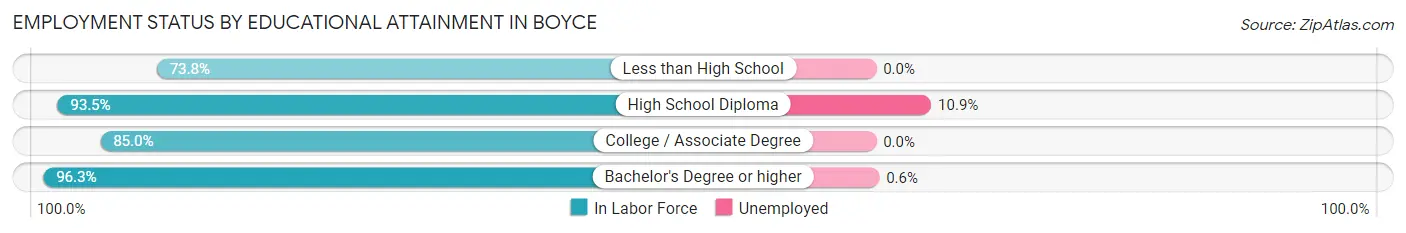
| Educational Attainment | In Labor Force | Unemployed |
| Less than High School | 31 (73.8%) | 0 (0.0%) |
| High School Diploma | 101 (93.5%) | 12 (10.9%) |
| College / Associate Degree | 193 (85.0%) | 0 (0.0%) |
| Bachelor's Degree or higher | 157 (96.3%) | 1 (0.6%) |
| Total | 482 (89.3%) | 14 (2.5%) |
Employment Occupations by Sex in Boyce
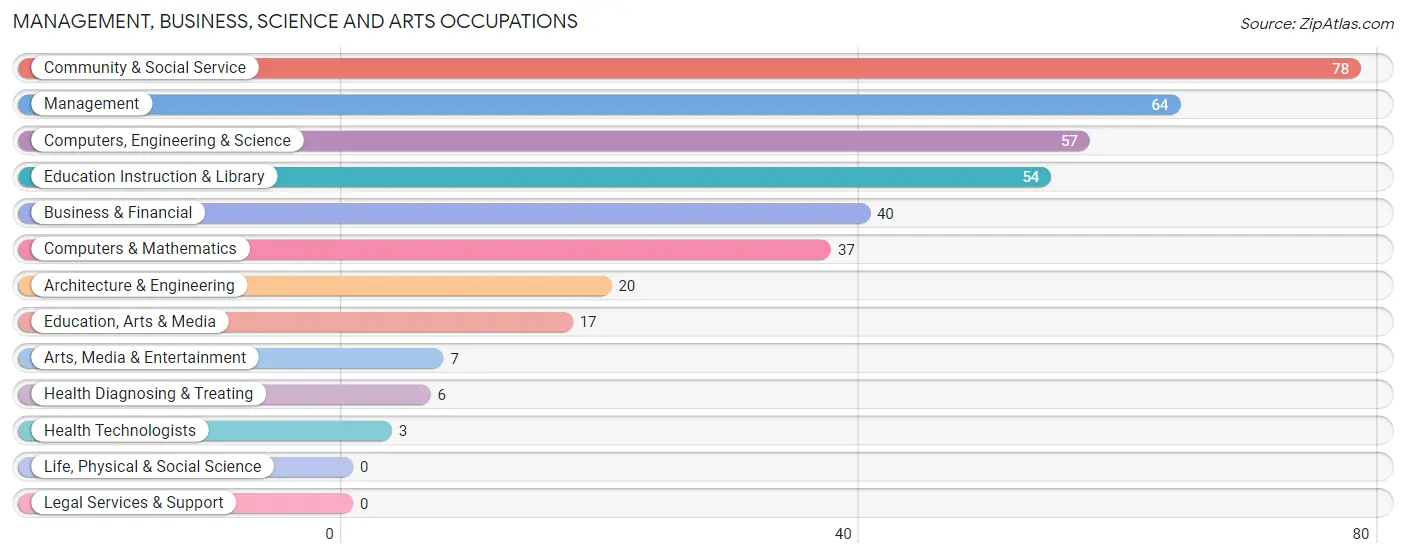
Management, Business, Science and Arts Occupations
The most common Management, Business, Science and Arts occupations in Boyce are Community & Social Service (78 | 13.8%), Management (64 | 11.3%), Computers, Engineering & Science (57 | 10.1%), Education Instruction & Library (54 | 9.6%), and Business & Financial (40 | 7.1%).
Management, Business, Science and Arts Occupations by Sex
Within the Management, Business, Science and Arts occupations in Boyce, the most male-oriented occupations are Business & Financial (100.0%), Health Technologists (100.0%), and Computers & Mathematics (83.8%), while the most female-oriented occupations are Arts, Media & Entertainment (100.0%), Education, Arts & Media (88.2%), and Community & Social Service (75.6%).
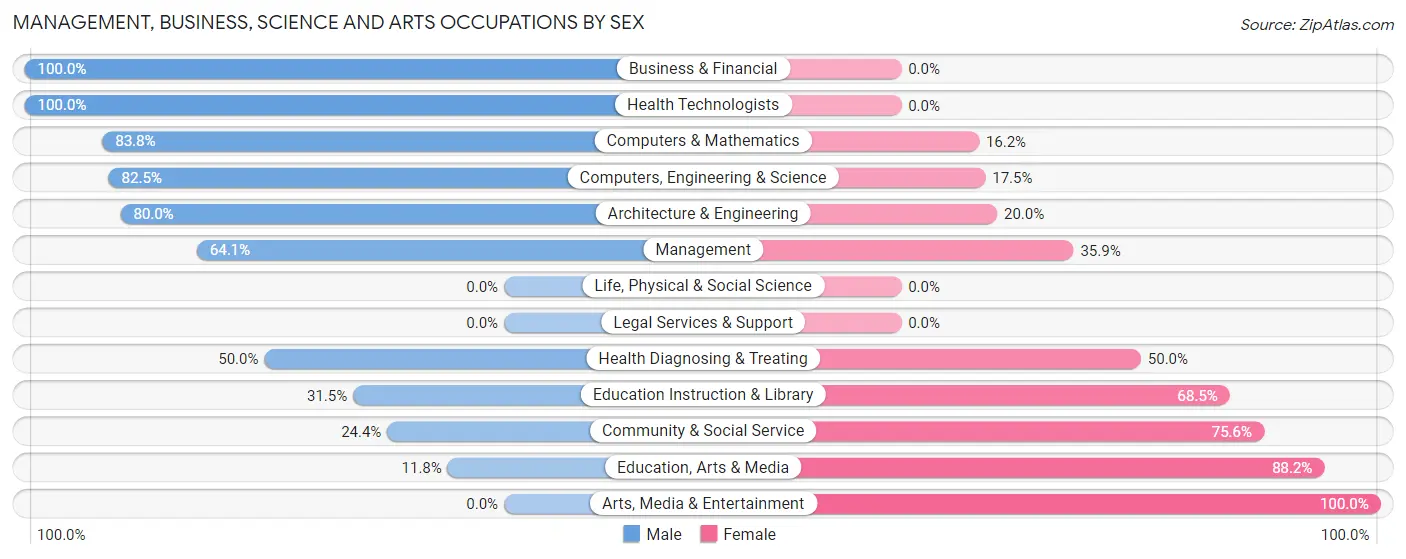
| Occupation | Male | Female |
| Management | 41 (64.1%) | 23 (35.9%) |
| Business & Financial | 40 (100.0%) | 0 (0.0%) |
| Computers, Engineering & Science | 47 (82.5%) | 10 (17.5%) |
| Computers & Mathematics | 31 (83.8%) | 6 (16.2%) |
| Architecture & Engineering | 16 (80.0%) | 4 (20.0%) |
| Life, Physical & Social Science | 0 (0.0%) | 0 (0.0%) |
| Community & Social Service | 19 (24.4%) | 59 (75.6%) |
| Education, Arts & Media | 2 (11.8%) | 15 (88.2%) |
| Legal Services & Support | 0 (0.0%) | 0 (0.0%) |
| Education Instruction & Library | 17 (31.5%) | 37 (68.5%) |
| Arts, Media & Entertainment | 0 (0.0%) | 7 (100.0%) |
| Health Diagnosing & Treating | 3 (50.0%) | 3 (50.0%) |
| Health Technologists | 3 (100.0%) | 0 (0.0%) |
| Total (Category) | 150 (61.2%) | 95 (38.8%) |
| Total (Overall) | 296 (52.4%) | 269 (47.6%) |
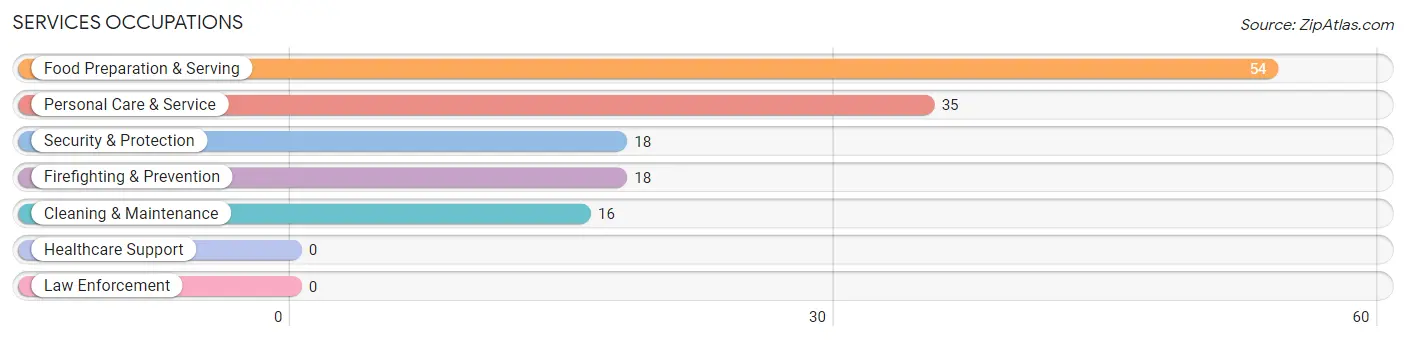
Services Occupations
The most common Services occupations in Boyce are Food Preparation & Serving (54 | 9.6%), Personal Care & Service (35 | 6.2%), Security & Protection (18 | 3.2%), Firefighting & Prevention (18 | 3.2%), and Cleaning & Maintenance (16 | 2.8%).
Services Occupations by Sex
Within the Services occupations in Boyce, the most male-oriented occupations are Cleaning & Maintenance (81.2%), Food Preparation & Serving (18.5%), and Personal Care & Service (11.4%), while the most female-oriented occupations are Security & Protection (94.4%), Firefighting & Prevention (94.4%), and Personal Care & Service (88.6%).
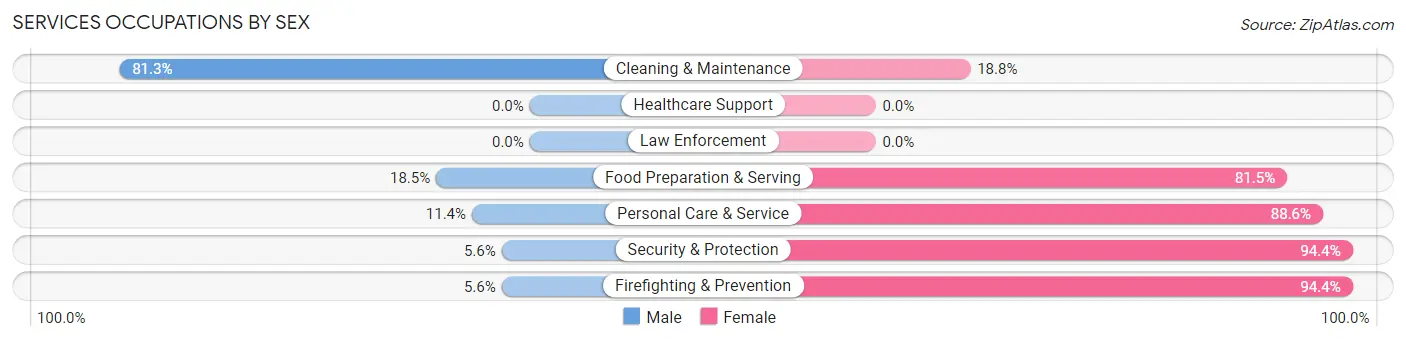
| Occupation | Male | Female |
| Healthcare Support | 0 (0.0%) | 0 (0.0%) |
| Security & Protection | 1 (5.6%) | 17 (94.4%) |
| Firefighting & Prevention | 1 (5.6%) | 17 (94.4%) |
| Law Enforcement | 0 (0.0%) | 0 (0.0%) |
| Food Preparation & Serving | 10 (18.5%) | 44 (81.5%) |
| Cleaning & Maintenance | 13 (81.2%) | 3 (18.8%) |
| Personal Care & Service | 4 (11.4%) | 31 (88.6%) |
| Total (Category) | 28 (22.8%) | 95 (77.2%) |
| Total (Overall) | 296 (52.4%) | 269 (47.6%) |
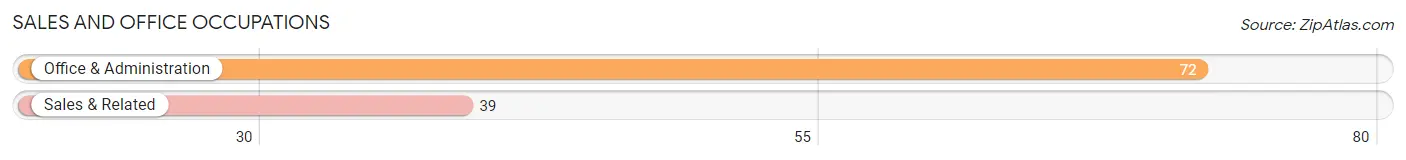
Sales and Office Occupations
The most common Sales and Office occupations in Boyce are Office & Administration (72 | 12.7%), and Sales & Related (39 | 6.9%).
Sales and Office Occupations by Sex
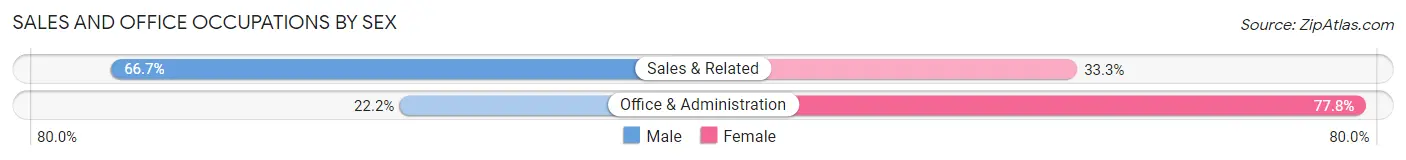
| Occupation | Male | Female |
| Sales & Related | 26 (66.7%) | 13 (33.3%) |
| Office & Administration | 16 (22.2%) | 56 (77.8%) |
| Total (Category) | 42 (37.8%) | 69 (62.2%) |
| Total (Overall) | 296 (52.4%) | 269 (47.6%) |
Natural Resources, Construction and Maintenance Occupations
The most common Natural Resources, Construction and Maintenance occupations in Boyce are Construction & Extraction (34 | 6.0%), Installation, Maintenance & Repair (10 | 1.8%), and Farming, Fishing & Forestry (2 | 0.4%).
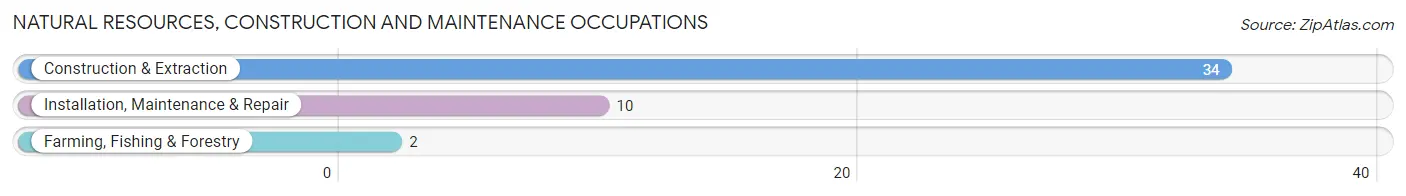
Natural Resources, Construction and Maintenance Occupations by Sex
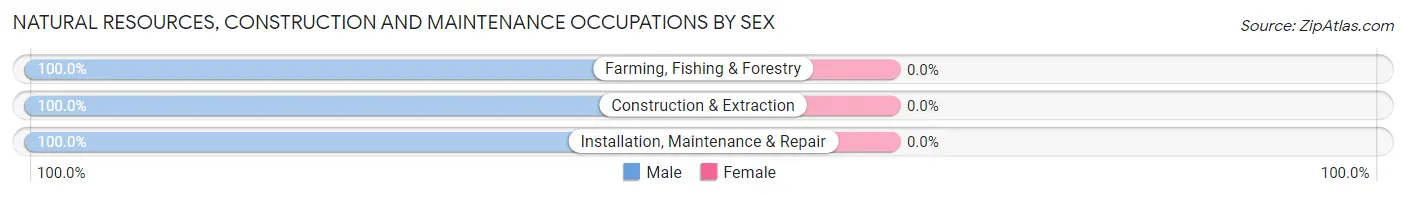
| Occupation | Male | Female |
| Farming, Fishing & Forestry | 2 (100.0%) | 0 (0.0%) |
| Construction & Extraction | 34 (100.0%) | 0 (0.0%) |
| Installation, Maintenance & Repair | 10 (100.0%) | 0 (0.0%) |
| Total (Category) | 46 (100.0%) | 0 (0.0%) |
| Total (Overall) | 296 (52.4%) | 269 (47.6%) |
Production, Transportation and Moving Occupations
The most common Production, Transportation and Moving occupations in Boyce are Material Moving (22 | 3.9%), Production (13 | 2.3%), and Transportation (5 | 0.9%).
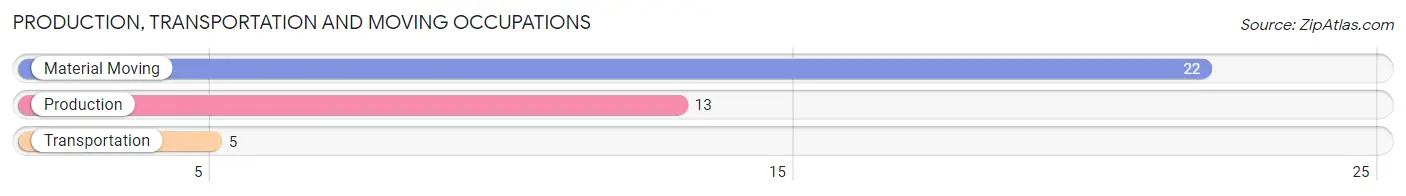
Production, Transportation and Moving Occupations by Sex
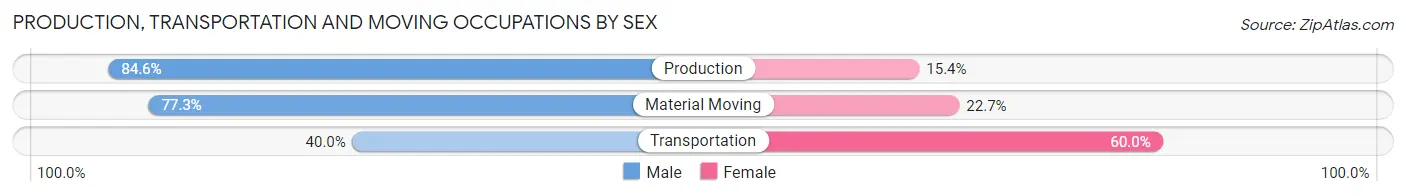
| Occupation | Male | Female |
| Production | 11 (84.6%) | 2 (15.4%) |
| Transportation | 2 (40.0%) | 3 (60.0%) |
| Material Moving | 17 (77.3%) | 5 (22.7%) |
| Total (Category) | 30 (75.0%) | 10 (25.0%) |
| Total (Overall) | 296 (52.4%) | 269 (47.6%) |
Employment Industries by Sex in Boyce
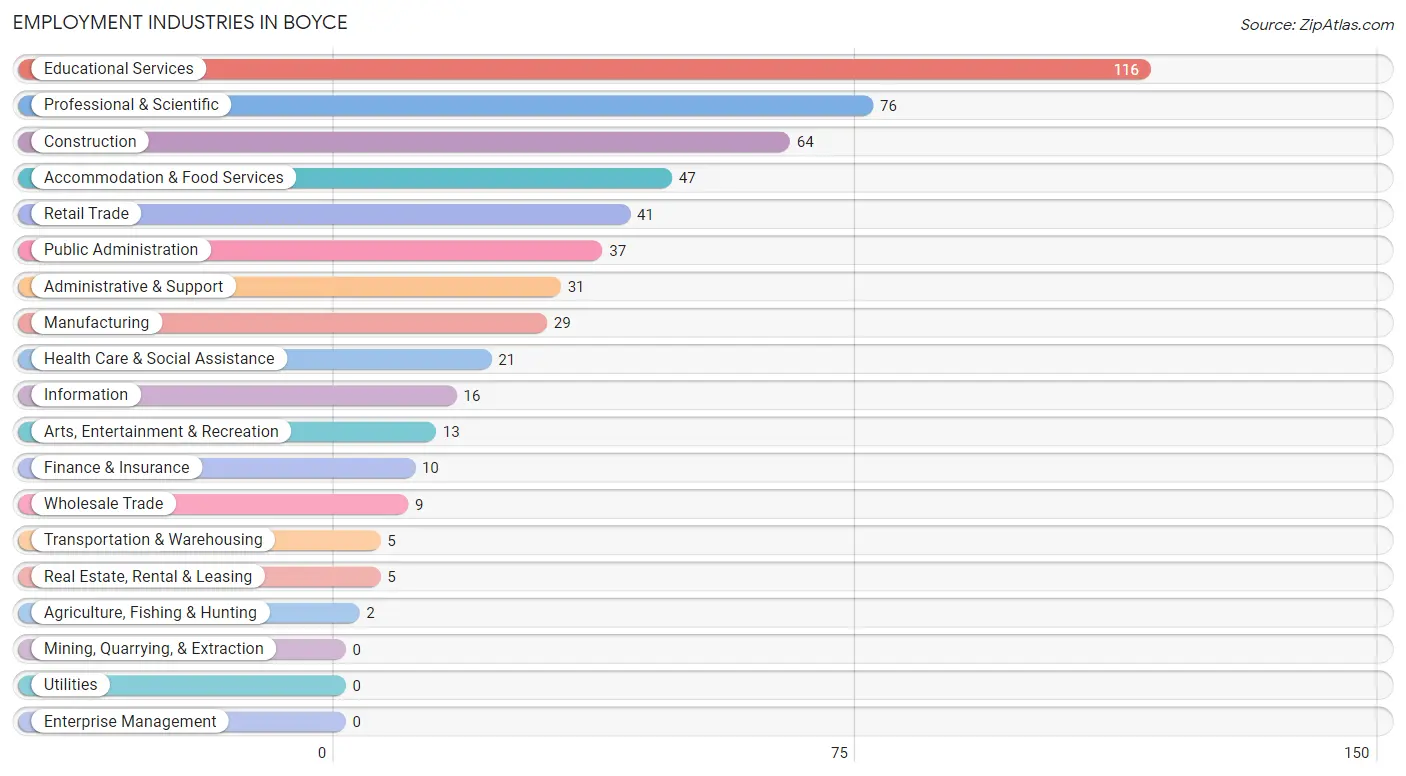
Employment Industries in Boyce
The major employment industries in Boyce include Educational Services (116 | 20.5%), Professional & Scientific (76 | 13.5%), Construction (64 | 11.3%), Accommodation & Food Services (47 | 8.3%), and Retail Trade (41 | 7.3%).
Employment Industries by Sex in Boyce
The Boyce industries that see more men than women are Agriculture, Fishing & Hunting (100.0%), Wholesale Trade (100.0%), and Transportation & Warehousing (100.0%), whereas the industries that tend to have a higher number of women are Arts, Entertainment & Recreation (100.0%), Educational Services (83.6%), and Accommodation & Food Services (78.7%).
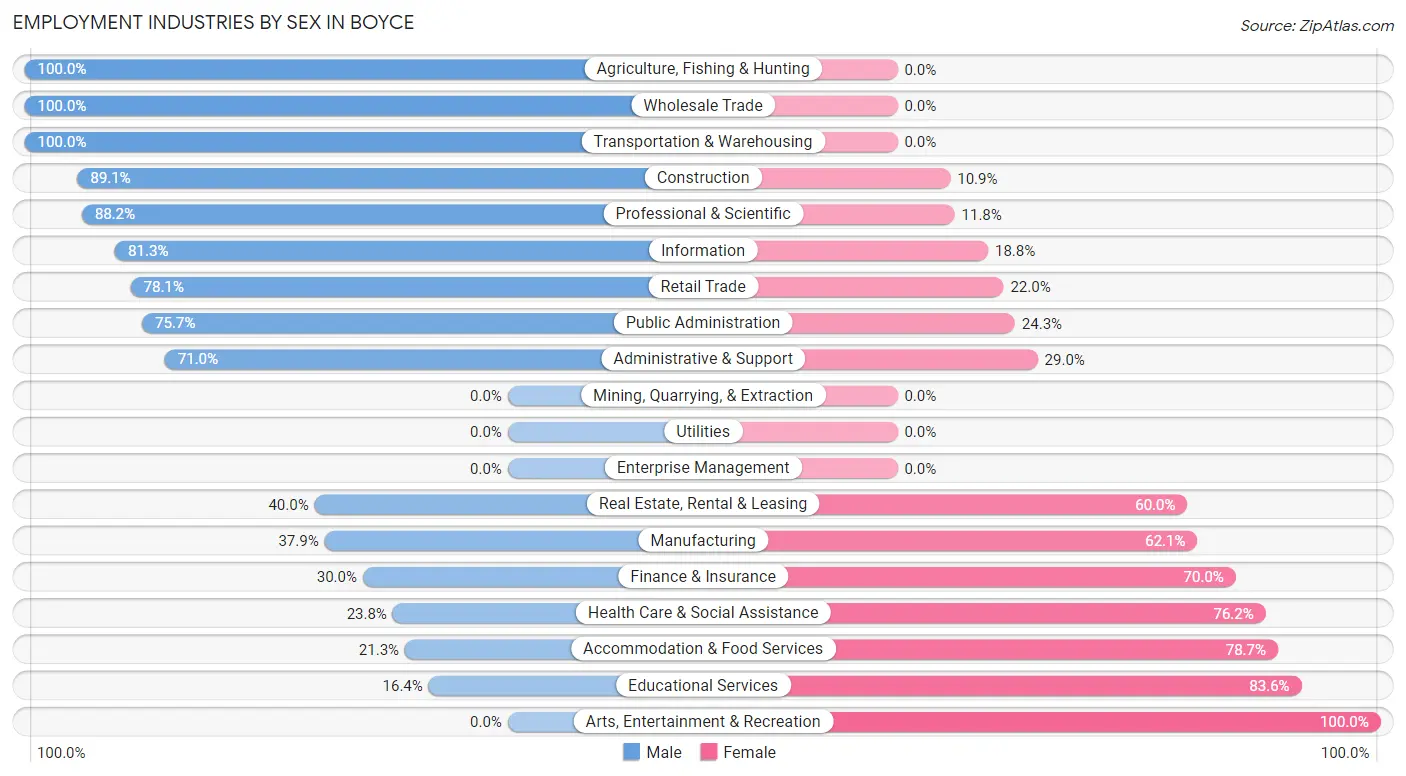
| Industry | Male | Female |
| Agriculture, Fishing & Hunting | 2 (100.0%) | 0 (0.0%) |
| Mining, Quarrying, & Extraction | 0 (0.0%) | 0 (0.0%) |
| Construction | 57 (89.1%) | 7 (10.9%) |
| Manufacturing | 11 (37.9%) | 18 (62.1%) |
| Wholesale Trade | 9 (100.0%) | 0 (0.0%) |
| Retail Trade | 32 (78.0%) | 9 (22.0%) |
| Transportation & Warehousing | 5 (100.0%) | 0 (0.0%) |
| Utilities | 0 (0.0%) | 0 (0.0%) |
| Information | 13 (81.2%) | 3 (18.8%) |
| Finance & Insurance | 3 (30.0%) | 7 (70.0%) |
| Real Estate, Rental & Leasing | 2 (40.0%) | 3 (60.0%) |
| Professional & Scientific | 67 (88.2%) | 9 (11.8%) |
| Enterprise Management | 0 (0.0%) | 0 (0.0%) |
| Administrative & Support | 22 (71.0%) | 9 (29.0%) |
| Educational Services | 19 (16.4%) | 97 (83.6%) |
| Health Care & Social Assistance | 5 (23.8%) | 16 (76.2%) |
| Arts, Entertainment & Recreation | 0 (0.0%) | 13 (100.0%) |
| Accommodation & Food Services | 10 (21.3%) | 37 (78.7%) |
| Public Administration | 28 (75.7%) | 9 (24.3%) |
| Total | 296 (52.4%) | 269 (47.6%) |
Education in Boyce
School Enrollment in Boyce
The most common levels of schooling among the 210 students in Boyce are high school (58 | 27.6%), elementary school (50 | 23.8%), and graduate / professional (35 | 16.7%).
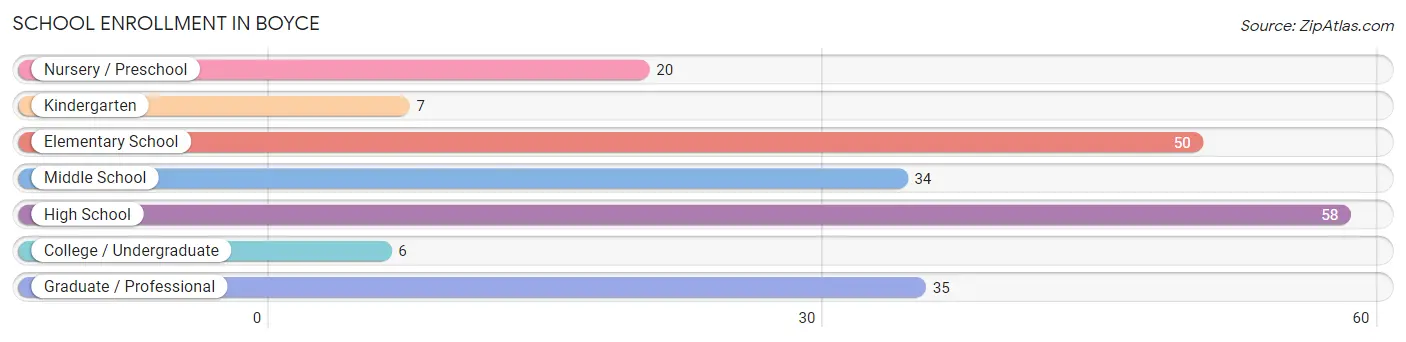
| School Level | # Students | % Students |
| Nursery / Preschool | 20 | 9.5% |
| Kindergarten | 7 | 3.3% |
| Elementary School | 50 | 23.8% |
| Middle School | 34 | 16.2% |
| High School | 58 | 27.6% |
| College / Undergraduate | 6 | 2.9% |
| Graduate / Professional | 35 | 16.7% |
| Total | 210 | 100.0% |
School Enrollment by Age by Funding Source in Boyce
Out of a total of 210 students who are enrolled in schools in Boyce, 60 (28.6%) attend a private institution, while the remaining 150 (71.4%) are enrolled in public schools. The age group of 20 to 24 year olds has the highest likelihood of being enrolled in private schools, with 12 (100.0% in the age bracket) enrolled. Conversely, the age group of 25 to 34 year olds has the lowest likelihood of being enrolled in a private school, with 3 (100.0% in the age bracket) attending a public institution.
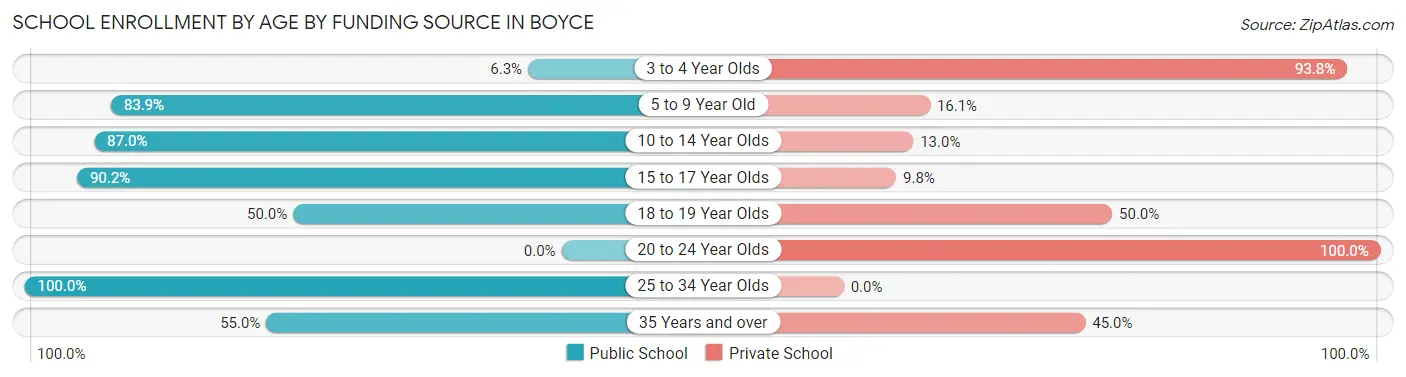
| Age Bracket | Public School | Private School |
| 3 to 4 Year Olds | 1 (6.2%) | 15 (93.8%) |
| 5 to 9 Year Old | 47 (83.9%) | 9 (16.1%) |
| 10 to 14 Year Olds | 47 (87.0%) | 7 (13.0%) |
| 15 to 17 Year Olds | 37 (90.2%) | 4 (9.8%) |
| 18 to 19 Year Olds | 4 (50.0%) | 4 (50.0%) |
| 20 to 24 Year Olds | 0 (0.0%) | 12 (100.0%) |
| 25 to 34 Year Olds | 3 (100.0%) | 0 (0.0%) |
| 35 Years and over | 11 (55.0%) | 9 (45.0%) |
| Total | 150 (71.4%) | 60 (28.6%) |
Educational Attainment by Field of Study in Boyce
Education (37 | 17.7%), engineering (34 | 16.3%), bio, nature & agricultural (22 | 10.5%), visual & performing arts (22 | 10.5%), and business (21 | 10.1%) are the most common fields of study among 209 individuals in Boyce who have obtained a bachelor's degree or higher.
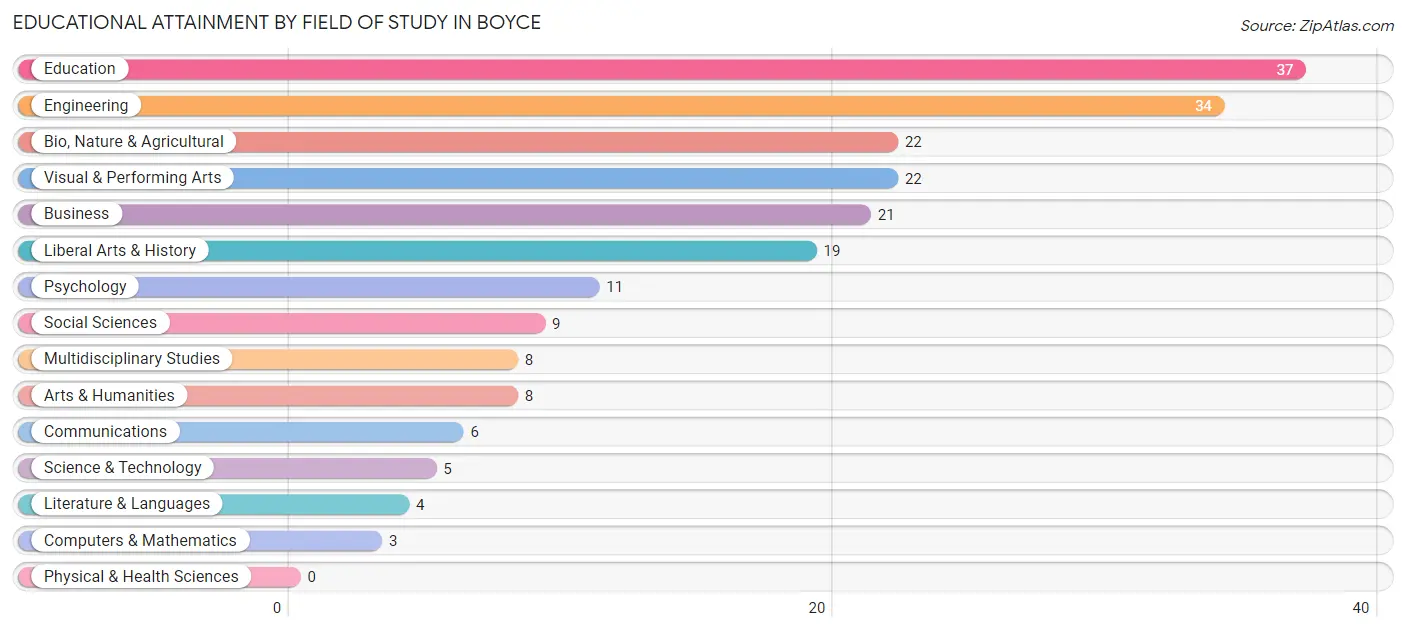
| Field of Study | # Graduates | % Graduates |
| Computers & Mathematics | 3 | 1.4% |
| Bio, Nature & Agricultural | 22 | 10.5% |
| Physical & Health Sciences | 0 | 0.0% |
| Psychology | 11 | 5.3% |
| Social Sciences | 9 | 4.3% |
| Engineering | 34 | 16.3% |
| Multidisciplinary Studies | 8 | 3.8% |
| Science & Technology | 5 | 2.4% |
| Business | 21 | 10.1% |
| Education | 37 | 17.7% |
| Literature & Languages | 4 | 1.9% |
| Liberal Arts & History | 19 | 9.1% |
| Visual & Performing Arts | 22 | 10.5% |
| Communications | 6 | 2.9% |
| Arts & Humanities | 8 | 3.8% |
| Total | 209 | 100.0% |
Transportation & Commute in Boyce
Vehicle Availability by Sex in Boyce
The most prevalent vehicle ownership categories in Boyce are males with 2 vehicles (116, accounting for 39.3%) and females with 2 vehicles (101, making up 43.1%).
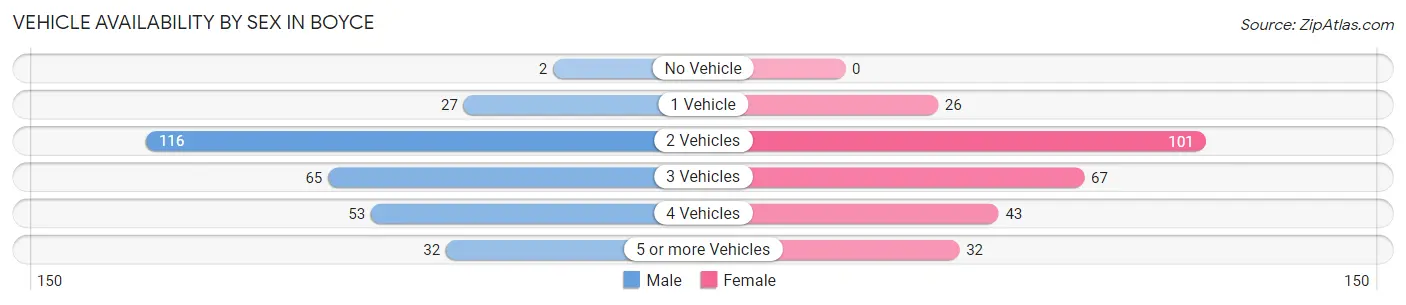
| Vehicles Available | Male | Female |
| No Vehicle | 2 (0.7%) | 0 (0.0%) |
| 1 Vehicle | 27 (9.1%) | 26 (9.7%) |
| 2 Vehicles | 116 (39.3%) | 101 (37.6%) |
| 3 Vehicles | 65 (22.0%) | 67 (24.9%) |
| 4 Vehicles | 53 (18.0%) | 43 (16.0%) |
| 5 or more Vehicles | 32 (10.8%) | 32 (11.9%) |
| Total | 295 (100.0%) | 269 (100.0%) |
Commute Time in Boyce
The most frequently occuring commute durations in Boyce are 60 to 89 minutes (78 commuters, 16.3%), 20 to 24 minutes (72 commuters, 15.0%), and 15 to 19 minutes (64 commuters, 13.4%).
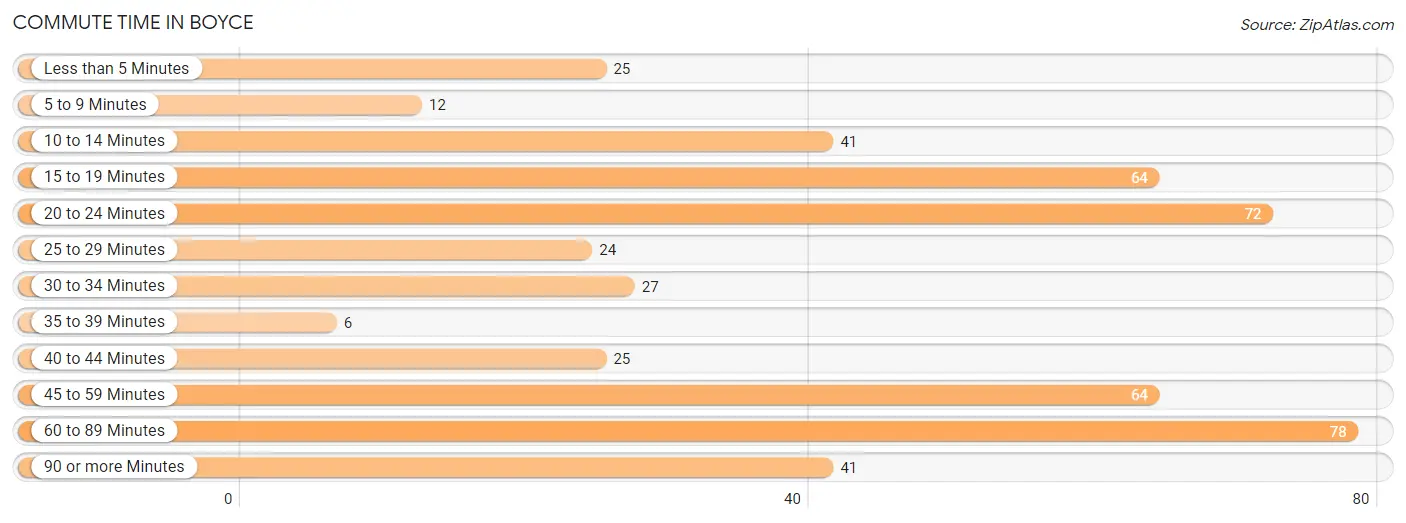
| Commute Time | # Commuters | % Commuters |
| Less than 5 Minutes | 25 | 5.2% |
| 5 to 9 Minutes | 12 | 2.5% |
| 10 to 14 Minutes | 41 | 8.6% |
| 15 to 19 Minutes | 64 | 13.4% |
| 20 to 24 Minutes | 72 | 15.0% |
| 25 to 29 Minutes | 24 | 5.0% |
| 30 to 34 Minutes | 27 | 5.6% |
| 35 to 39 Minutes | 6 | 1.3% |
| 40 to 44 Minutes | 25 | 5.2% |
| 45 to 59 Minutes | 64 | 13.4% |
| 60 to 89 Minutes | 78 | 16.3% |
| 90 or more Minutes | 41 | 8.6% |
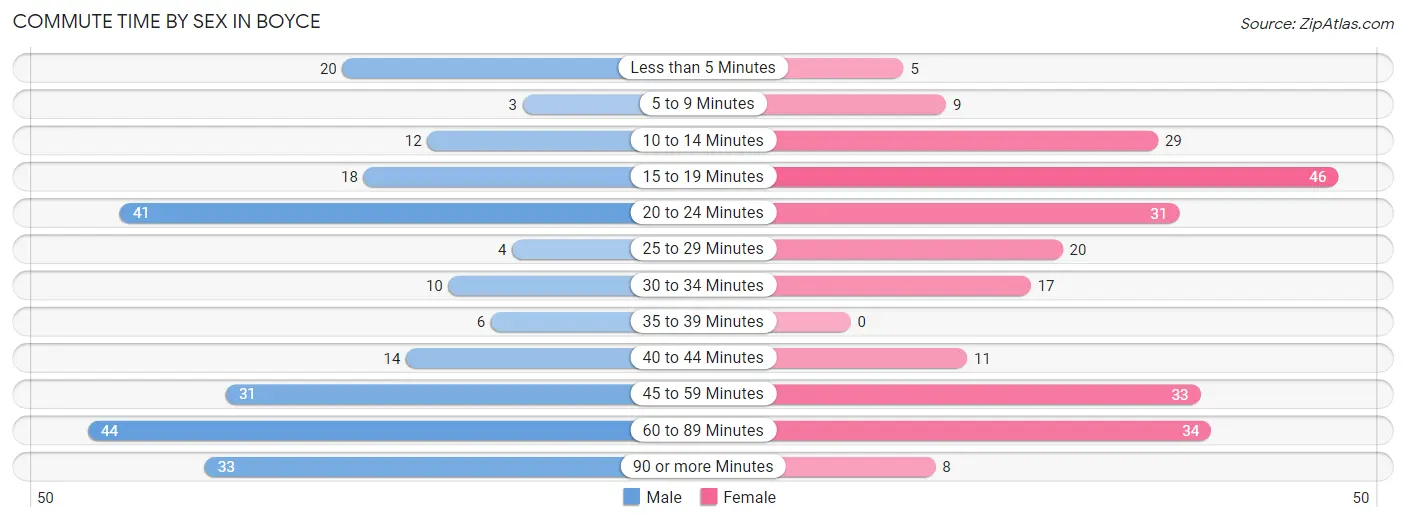
Commute Time by Sex in Boyce
The most common commute times in Boyce are 60 to 89 minutes (44 commuters, 18.6%) for males and 15 to 19 minutes (46 commuters, 18.9%) for females.
| Commute Time | Male | Female |
| Less than 5 Minutes | 20 (8.5%) | 5 (2.1%) |
| 5 to 9 Minutes | 3 (1.3%) | 9 (3.7%) |
| 10 to 14 Minutes | 12 (5.1%) | 29 (11.9%) |
| 15 to 19 Minutes | 18 (7.6%) | 46 (18.9%) |
| 20 to 24 Minutes | 41 (17.4%) | 31 (12.8%) |
| 25 to 29 Minutes | 4 (1.7%) | 20 (8.2%) |
| 30 to 34 Minutes | 10 (4.2%) | 17 (7.0%) |
| 35 to 39 Minutes | 6 (2.5%) | 0 (0.0%) |
| 40 to 44 Minutes | 14 (5.9%) | 11 (4.5%) |
| 45 to 59 Minutes | 31 (13.1%) | 33 (13.6%) |
| 60 to 89 Minutes | 44 (18.6%) | 34 (14.0%) |
| 90 or more Minutes | 33 (14.0%) | 8 (3.3%) |
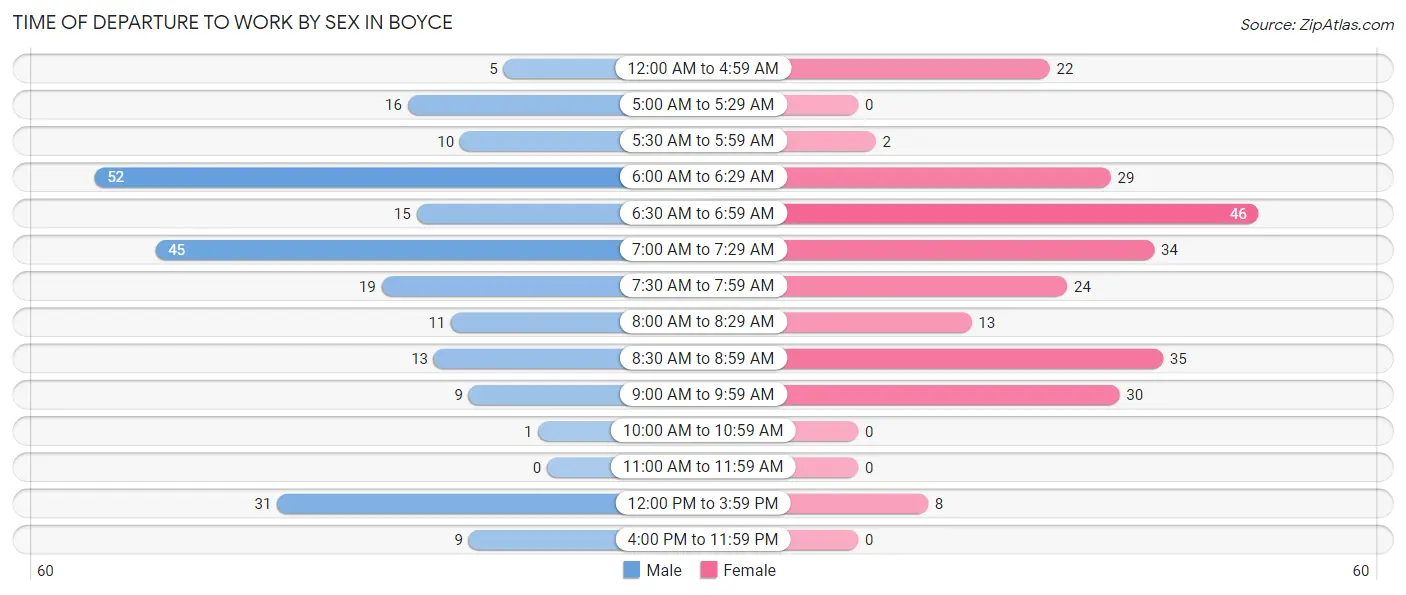
Time of Departure to Work by Sex in Boyce
The most frequent times of departure to work in Boyce are 6:00 AM to 6:29 AM (52, 22.0%) for males and 6:30 AM to 6:59 AM (46, 18.9%) for females.
| Time of Departure | Male | Female |
| 12:00 AM to 4:59 AM | 5 (2.1%) | 22 (9.0%) |
| 5:00 AM to 5:29 AM | 16 (6.8%) | 0 (0.0%) |
| 5:30 AM to 5:59 AM | 10 (4.2%) | 2 (0.8%) |
| 6:00 AM to 6:29 AM | 52 (22.0%) | 29 (11.9%) |
| 6:30 AM to 6:59 AM | 15 (6.4%) | 46 (18.9%) |
| 7:00 AM to 7:29 AM | 45 (19.1%) | 34 (14.0%) |
| 7:30 AM to 7:59 AM | 19 (8.1%) | 24 (9.9%) |
| 8:00 AM to 8:29 AM | 11 (4.7%) | 13 (5.3%) |
| 8:30 AM to 8:59 AM | 13 (5.5%) | 35 (14.4%) |
| 9:00 AM to 9:59 AM | 9 (3.8%) | 30 (12.3%) |
| 10:00 AM to 10:59 AM | 1 (0.4%) | 0 (0.0%) |
| 11:00 AM to 11:59 AM | 0 (0.0%) | 0 (0.0%) |
| 12:00 PM to 3:59 PM | 31 (13.1%) | 8 (3.3%) |
| 4:00 PM to 11:59 PM | 9 (3.8%) | 0 (0.0%) |
| Total | 236 (100.0%) | 243 (100.0%) |
Housing Occupancy in Boyce
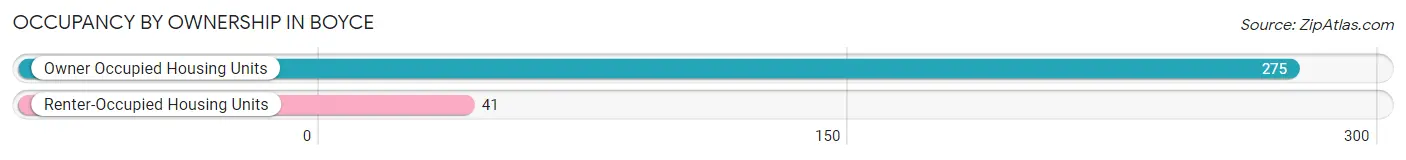
Occupancy by Ownership in Boyce
Of the total 316 dwellings in Boyce, owner-occupied units account for 275 (87.0%), while renter-occupied units make up 41 (13.0%).
| Occupancy | # Housing Units | % Housing Units |
| Owner Occupied Housing Units | 275 | 87.0% |
| Renter-Occupied Housing Units | 41 | 13.0% |
| Total Occupied Housing Units | 316 | 100.0% |
Occupancy by Household Size in Boyce
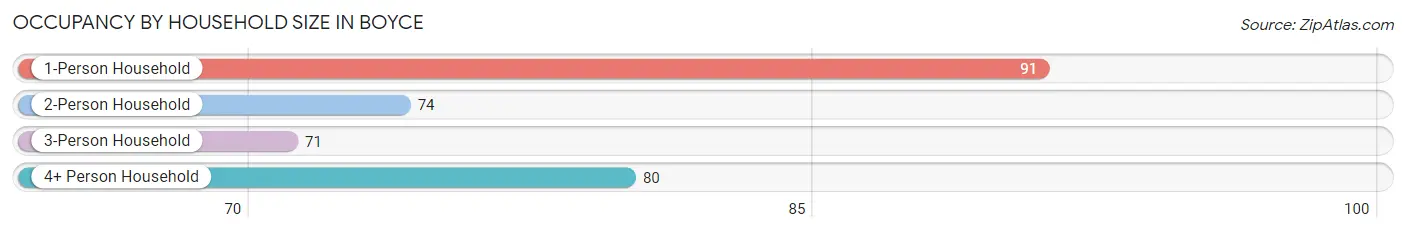
| Household Size | # Housing Units | % Housing Units |
| 1-Person Household | 91 | 28.8% |
| 2-Person Household | 74 | 23.4% |
| 3-Person Household | 71 | 22.5% |
| 4+ Person Household | 80 | 25.3% |
| Total Housing Units | 316 | 100.0% |
Occupancy by Ownership by Household Size in Boyce
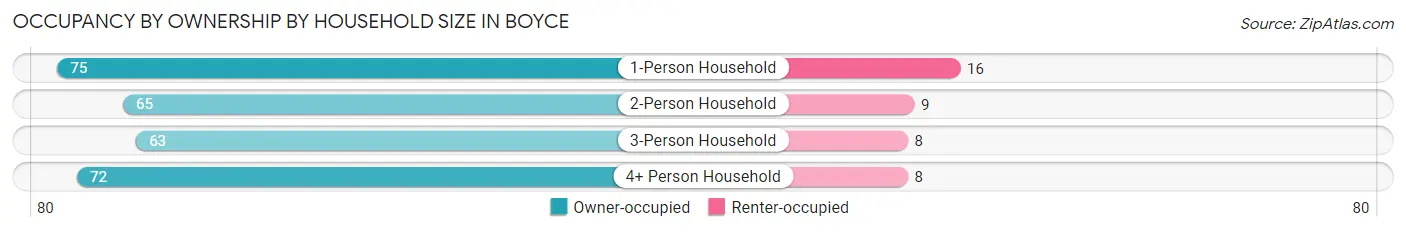
| Household Size | Owner-occupied | Renter-occupied |
| 1-Person Household | 75 (82.4%) | 16 (17.6%) |
| 2-Person Household | 65 (87.8%) | 9 (12.2%) |
| 3-Person Household | 63 (88.7%) | 8 (11.3%) |
| 4+ Person Household | 72 (90.0%) | 8 (10.0%) |
| Total Housing Units | 275 (87.0%) | 41 (13.0%) |
Occupancy by Educational Attainment in Boyce
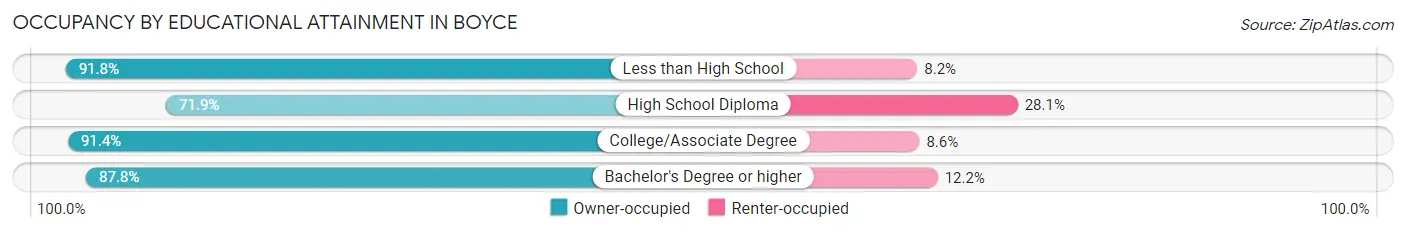
| Household Size | Owner-occupied | Renter-occupied |
| Less than High School | 45 (91.8%) | 4 (8.2%) |
| High School Diploma | 41 (71.9%) | 16 (28.1%) |
| College/Associate Degree | 117 (91.4%) | 11 (8.6%) |
| Bachelor's Degree or higher | 72 (87.8%) | 10 (12.2%) |
Occupancy by Age of Householder in Boyce
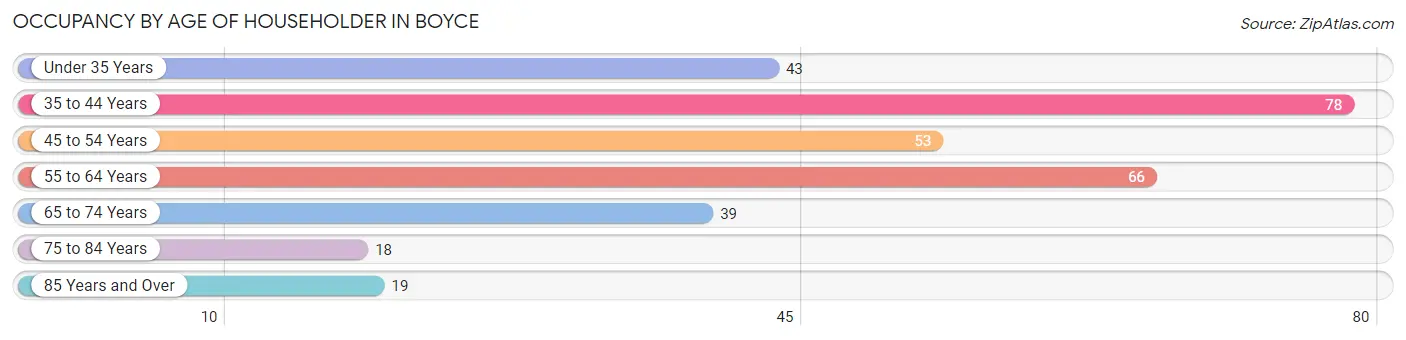
| Age Bracket | # Households | % Households |
| Under 35 Years | 43 | 13.6% |
| 35 to 44 Years | 78 | 24.7% |
| 45 to 54 Years | 53 | 16.8% |
| 55 to 64 Years | 66 | 20.9% |
| 65 to 74 Years | 39 | 12.3% |
| 75 to 84 Years | 18 | 5.7% |
| 85 Years and Over | 19 | 6.0% |
| Total | 316 | 100.0% |
Housing Finances in Boyce
Median Income by Occupancy in Boyce
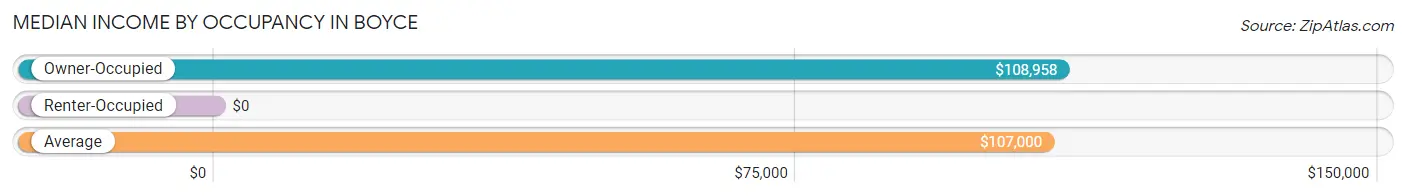
| Occupancy Type | # Households | Median Income |
| Owner-Occupied | 275 (87.0%) | $108,958 |
| Renter-Occupied | 41 (13.0%) | $0 |
| Average | 316 (100.0%) | $107,000 |
Occupancy by Householder Income Bracket in Boyce
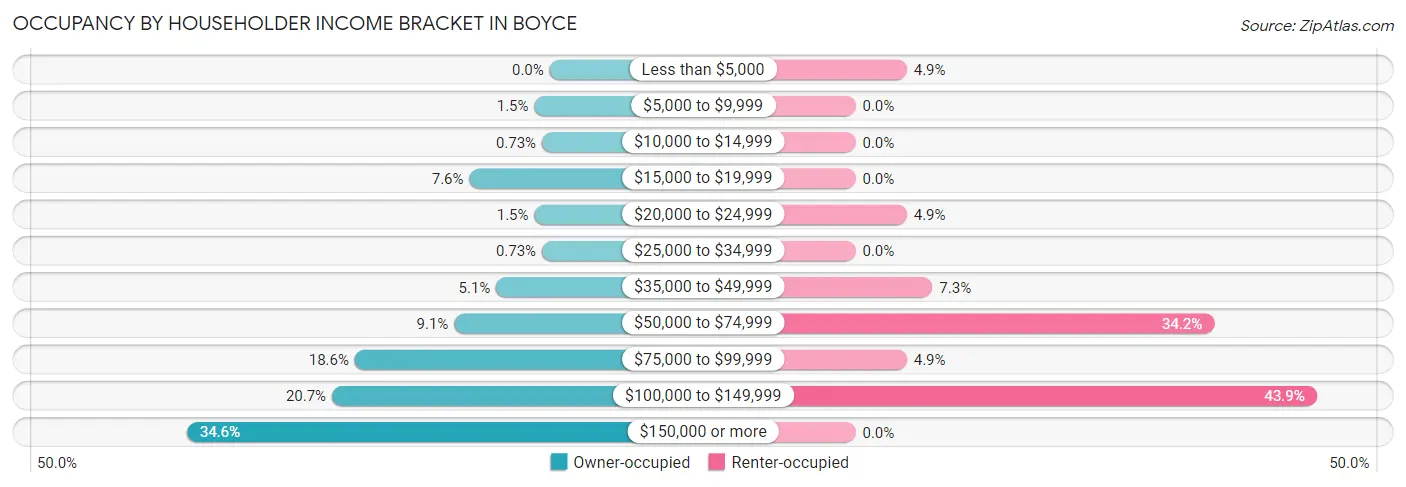
| Income Bracket | Owner-occupied | Renter-occupied |
| Less than $5,000 | 0 (0.0%) | 2 (4.9%) |
| $5,000 to $9,999 | 4 (1.5%) | 0 (0.0%) |
| $10,000 to $14,999 | 2 (0.7%) | 0 (0.0%) |
| $15,000 to $19,999 | 21 (7.6%) | 0 (0.0%) |
| $20,000 to $24,999 | 4 (1.5%) | 2 (4.9%) |
| $25,000 to $34,999 | 2 (0.7%) | 0 (0.0%) |
| $35,000 to $49,999 | 14 (5.1%) | 3 (7.3%) |
| $50,000 to $74,999 | 25 (9.1%) | 14 (34.2%) |
| $75,000 to $99,999 | 51 (18.5%) | 2 (4.9%) |
| $100,000 to $149,999 | 57 (20.7%) | 18 (43.9%) |
| $150,000 or more | 95 (34.5%) | 0 (0.0%) |
| Total | 275 (100.0%) | 41 (100.0%) |
Monthly Housing Cost Tiers in Boyce
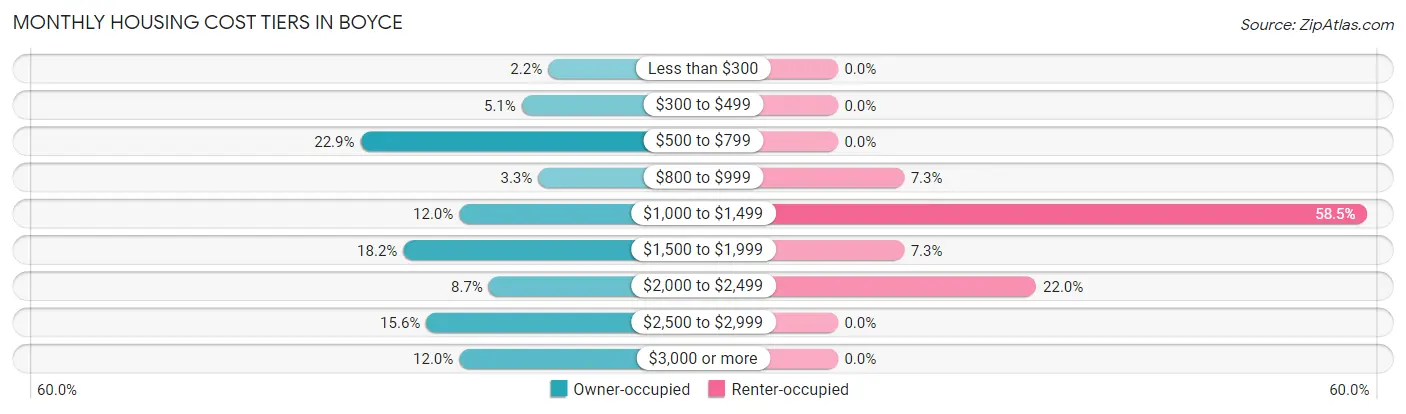
| Monthly Cost | Owner-occupied | Renter-occupied |
| Less than $300 | 6 (2.2%) | 0 (0.0%) |
| $300 to $499 | 14 (5.1%) | 0 (0.0%) |
| $500 to $799 | 63 (22.9%) | 0 (0.0%) |
| $800 to $999 | 9 (3.3%) | 3 (7.3%) |
| $1,000 to $1,499 | 33 (12.0%) | 24 (58.5%) |
| $1,500 to $1,999 | 50 (18.2%) | 3 (7.3%) |
| $2,000 to $2,499 | 24 (8.7%) | 9 (22.0%) |
| $2,500 to $2,999 | 43 (15.6%) | 0 (0.0%) |
| $3,000 or more | 33 (12.0%) | 0 (0.0%) |
| Total | 275 (100.0%) | 41 (100.0%) |
Physical Housing Characteristics in Boyce
Housing Structures in Boyce
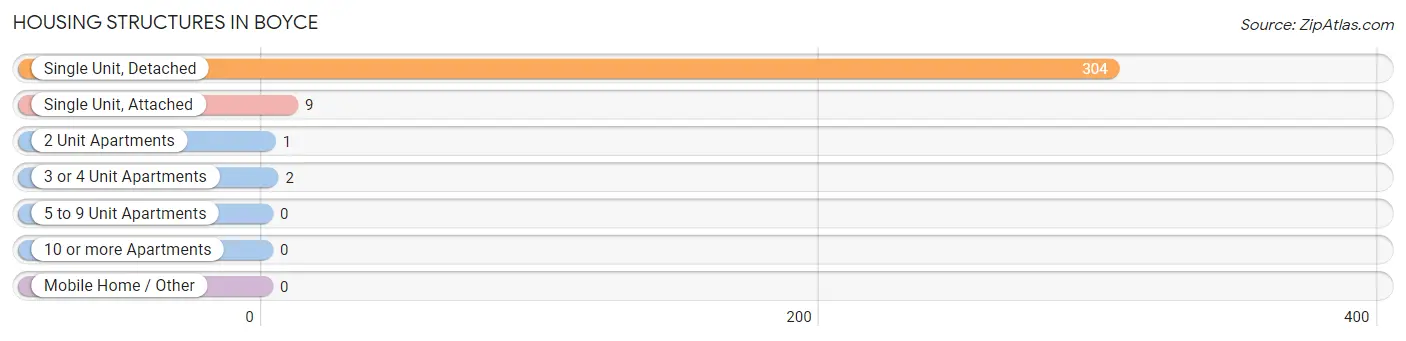
| Structure Type | # Housing Units | % Housing Units |
| Single Unit, Detached | 304 | 96.2% |
| Single Unit, Attached | 9 | 2.9% |
| 2 Unit Apartments | 1 | 0.3% |
| 3 or 4 Unit Apartments | 2 | 0.6% |
| 5 to 9 Unit Apartments | 0 | 0.0% |
| 10 or more Apartments | 0 | 0.0% |
| Mobile Home / Other | 0 | 0.0% |
| Total | 316 | 100.0% |
Housing Structures by Occupancy in Boyce
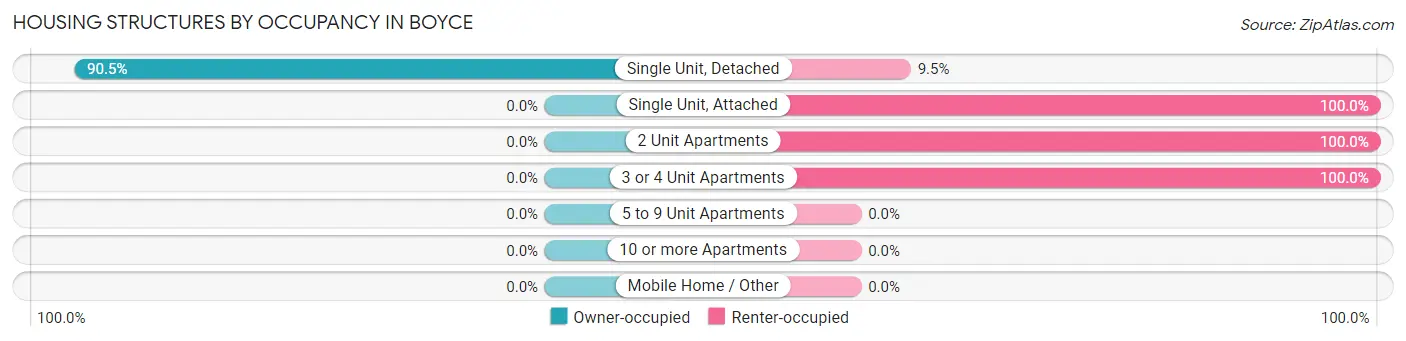
| Structure Type | Owner-occupied | Renter-occupied |
| Single Unit, Detached | 275 (90.5%) | 29 (9.5%) |
| Single Unit, Attached | 0 (0.0%) | 9 (100.0%) |
| 2 Unit Apartments | 0 (0.0%) | 1 (100.0%) |
| 3 or 4 Unit Apartments | 0 (0.0%) | 2 (100.0%) |
| 5 to 9 Unit Apartments | 0 (0.0%) | 0 (0.0%) |
| 10 or more Apartments | 0 (0.0%) | 0 (0.0%) |
| Mobile Home / Other | 0 (0.0%) | 0 (0.0%) |
| Total | 275 (87.0%) | 41 (13.0%) |
Housing Structures by Number of Rooms in Boyce
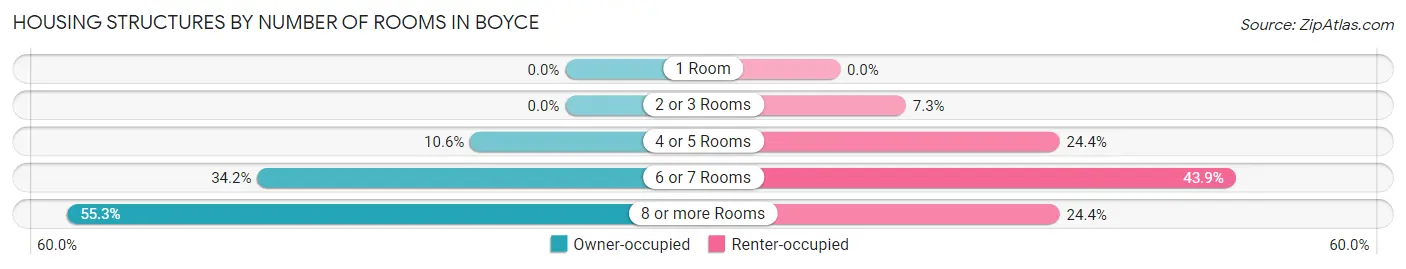
| Number of Rooms | Owner-occupied | Renter-occupied |
| 1 Room | 0 (0.0%) | 0 (0.0%) |
| 2 or 3 Rooms | 0 (0.0%) | 3 (7.3%) |
| 4 or 5 Rooms | 29 (10.5%) | 10 (24.4%) |
| 6 or 7 Rooms | 94 (34.2%) | 18 (43.9%) |
| 8 or more Rooms | 152 (55.3%) | 10 (24.4%) |
| Total | 275 (100.0%) | 41 (100.0%) |
Housing Structure by Heating Type in Boyce
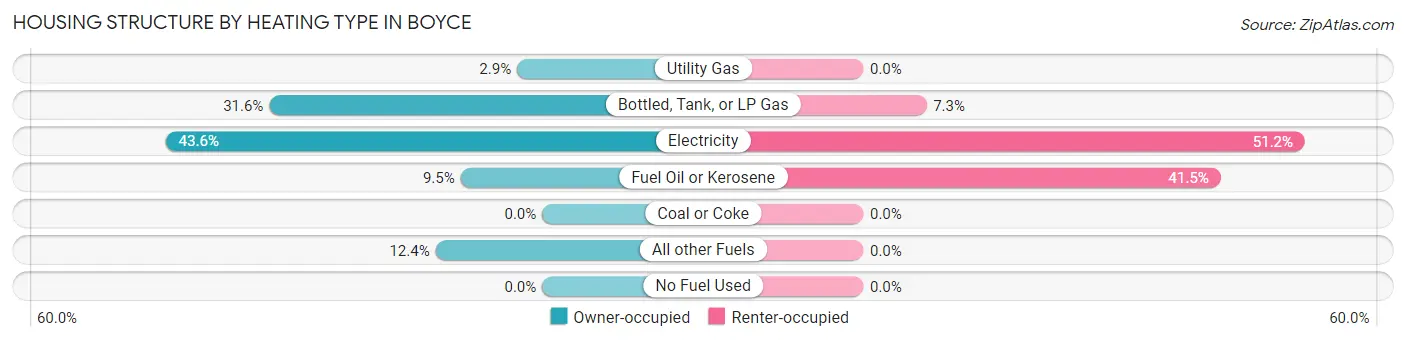
| Heating Type | Owner-occupied | Renter-occupied |
| Utility Gas | 8 (2.9%) | 0 (0.0%) |
| Bottled, Tank, or LP Gas | 87 (31.6%) | 3 (7.3%) |
| Electricity | 120 (43.6%) | 21 (51.2%) |
| Fuel Oil or Kerosene | 26 (9.5%) | 17 (41.5%) |
| Coal or Coke | 0 (0.0%) | 0 (0.0%) |
| All other Fuels | 34 (12.4%) | 0 (0.0%) |
| No Fuel Used | 0 (0.0%) | 0 (0.0%) |
| Total | 275 (100.0%) | 41 (100.0%) |
Household Vehicle Usage in Boyce
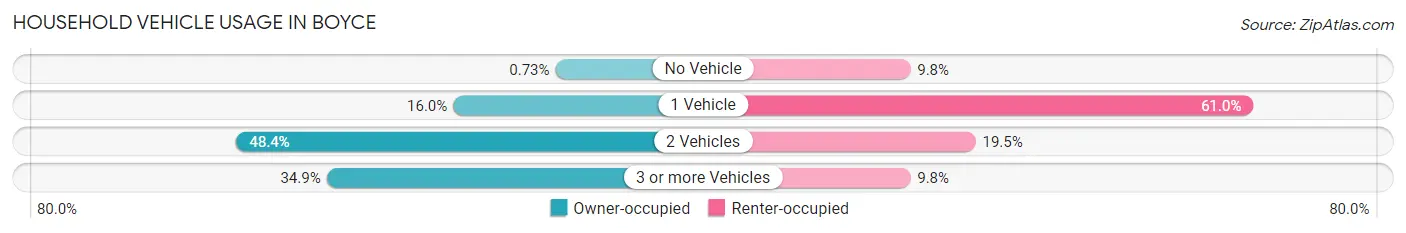
| Vehicles per Household | Owner-occupied | Renter-occupied |
| No Vehicle | 2 (0.7%) | 4 (9.8%) |
| 1 Vehicle | 44 (16.0%) | 25 (61.0%) |
| 2 Vehicles | 133 (48.4%) | 8 (19.5%) |
| 3 or more Vehicles | 96 (34.9%) | 4 (9.8%) |
| Total | 275 (100.0%) | 41 (100.0%) |
Real Estate & Mortgages in Boyce
Real Estate and Mortgage Overview in Boyce
| Characteristic | Without Mortgage | With Mortgage |
| Housing Units | 86 | 189 |
| Median Property Value | $404,800 | $410,500 |
| Median Household Income | $84,000 | $73 |
| Monthly Housing Costs | $686 | $33 |
| Real Estate Taxes | $2,175 | $0 |
Property Value by Mortgage Status in Boyce
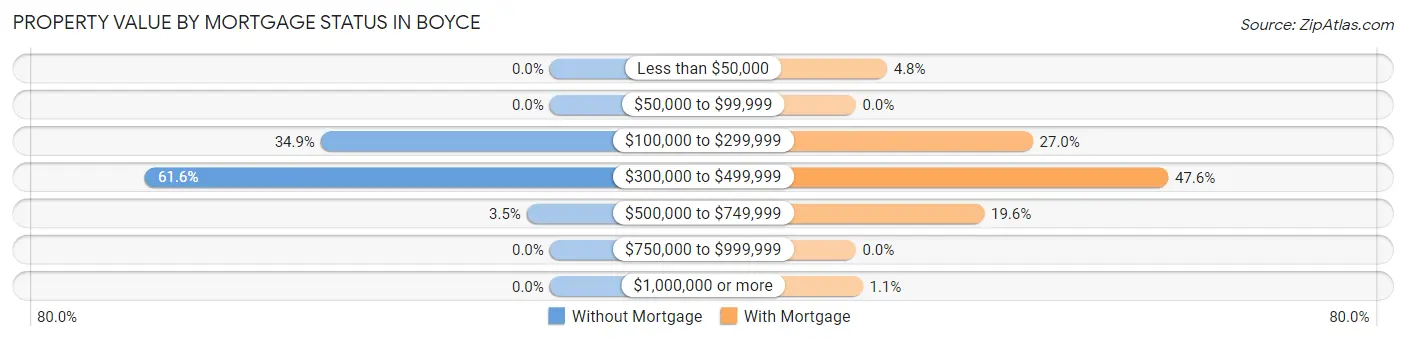
| Property Value | Without Mortgage | With Mortgage |
| Less than $50,000 | 0 (0.0%) | 9 (4.8%) |
| $50,000 to $99,999 | 0 (0.0%) | 0 (0.0%) |
| $100,000 to $299,999 | 30 (34.9%) | 51 (27.0%) |
| $300,000 to $499,999 | 53 (61.6%) | 90 (47.6%) |
| $500,000 to $749,999 | 3 (3.5%) | 37 (19.6%) |
| $750,000 to $999,999 | 0 (0.0%) | 0 (0.0%) |
| $1,000,000 or more | 0 (0.0%) | 2 (1.1%) |
| Total | 86 (100.0%) | 189 (100.0%) |
Household Income by Mortgage Status in Boyce
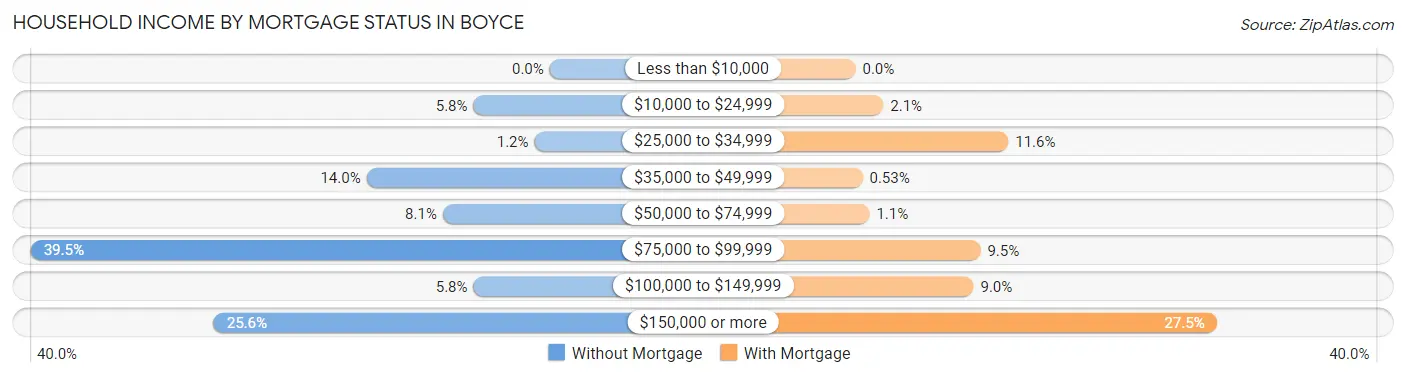
| Household Income | Without Mortgage | With Mortgage |
| Less than $10,000 | 0 (0.0%) | 0 (0.0%) |
| $10,000 to $24,999 | 5 (5.8%) | 4 (2.1%) |
| $25,000 to $34,999 | 1 (1.2%) | 22 (11.6%) |
| $35,000 to $49,999 | 12 (14.0%) | 1 (0.5%) |
| $50,000 to $74,999 | 7 (8.1%) | 2 (1.1%) |
| $75,000 to $99,999 | 34 (39.5%) | 18 (9.5%) |
| $100,000 to $149,999 | 5 (5.8%) | 17 (9.0%) |
| $150,000 or more | 22 (25.6%) | 52 (27.5%) |
| Total | 86 (100.0%) | 189 (100.0%) |
Property Value to Household Income Ratio in Boyce
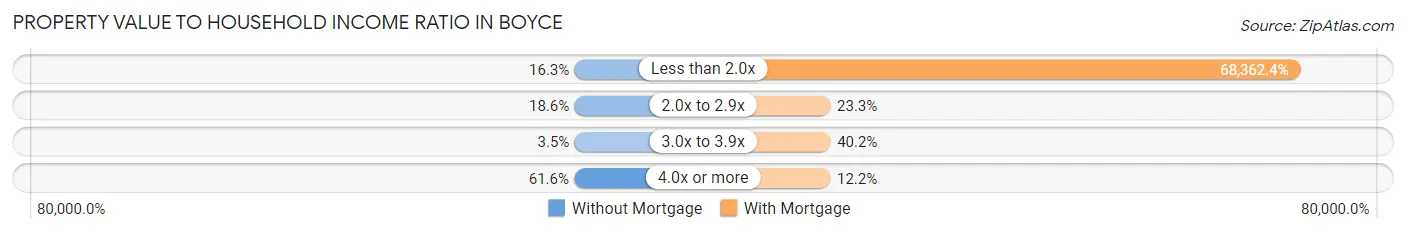
| Value-to-Income Ratio | Without Mortgage | With Mortgage |
| Less than 2.0x | 14 (16.3%) | 129,205 (68,362.4%) |
| 2.0x to 2.9x | 16 (18.6%) | 44 (23.3%) |
| 3.0x to 3.9x | 3 (3.5%) | 76 (40.2%) |
| 4.0x or more | 53 (61.6%) | 23 (12.2%) |
| Total | 86 (100.0%) | 189 (100.0%) |
Real Estate Taxes by Mortgage Status in Boyce
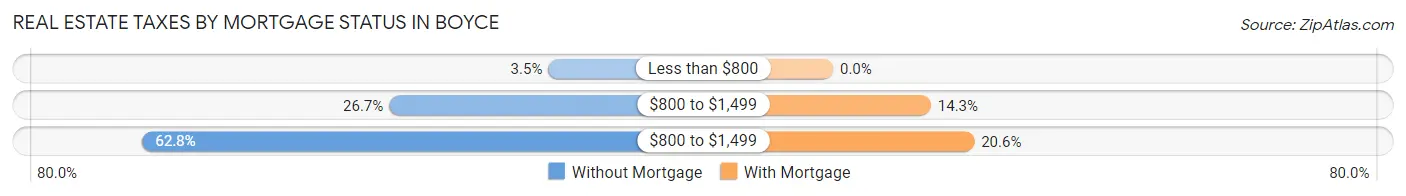
| Property Taxes | Without Mortgage | With Mortgage |
| Less than $800 | 3 (3.5%) | 0 (0.0%) |
| $800 to $1,499 | 23 (26.7%) | 27 (14.3%) |
| $800 to $1,499 | 54 (62.8%) | 39 (20.6%) |
| Total | 86 (100.0%) | 189 (100.0%) |
Health & Disability in Boyce
Health Insurance Coverage by Age in Boyce
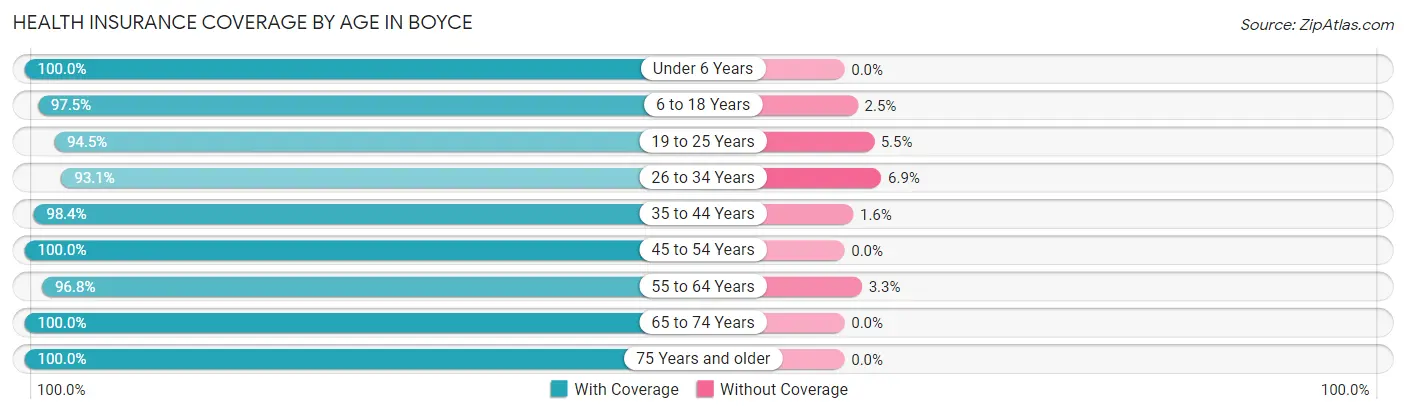
| Age Bracket | With Coverage | Without Coverage |
| Under 6 Years | 65 (100.0%) | 0 (0.0%) |
| 6 to 18 Years | 157 (97.5%) | 4 (2.5%) |
| 19 to 25 Years | 69 (94.5%) | 4 (5.5%) |
| 26 to 34 Years | 95 (93.1%) | 7 (6.9%) |
| 35 to 44 Years | 121 (98.4%) | 2 (1.6%) |
| 45 to 54 Years | 181 (100.0%) | 0 (0.0%) |
| 55 to 64 Years | 119 (96.8%) | 4 (3.3%) |
| 65 to 74 Years | 66 (100.0%) | 0 (0.0%) |
| 75 Years and older | 61 (100.0%) | 0 (0.0%) |
| Total | 934 (97.8%) | 21 (2.2%) |
Health Insurance Coverage by Citizenship Status in Boyce
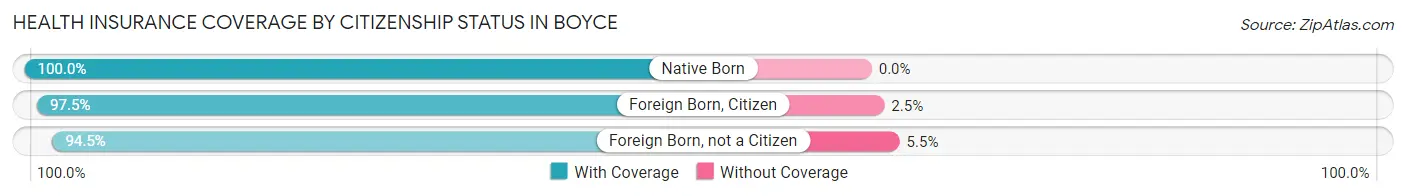
| Citizenship Status | With Coverage | Without Coverage |
| Native Born | 65 (100.0%) | 0 (0.0%) |
| Foreign Born, Citizen | 157 (97.5%) | 4 (2.5%) |
| Foreign Born, not a Citizen | 69 (94.5%) | 4 (5.5%) |
Health Insurance Coverage by Household Income in Boyce
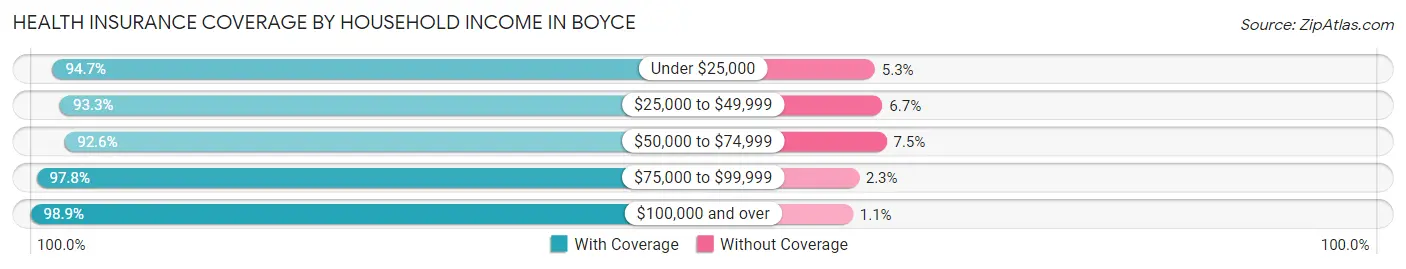
| Household Income | With Coverage | Without Coverage |
| Under $25,000 | 36 (94.7%) | 2 (5.3%) |
| $25,000 to $49,999 | 28 (93.3%) | 2 (6.7%) |
| $50,000 to $74,999 | 87 (92.5%) | 7 (7.4%) |
| $75,000 to $99,999 | 87 (97.8%) | 2 (2.2%) |
| $100,000 and over | 696 (98.9%) | 8 (1.1%) |
Public vs Private Health Insurance Coverage by Age in Boyce
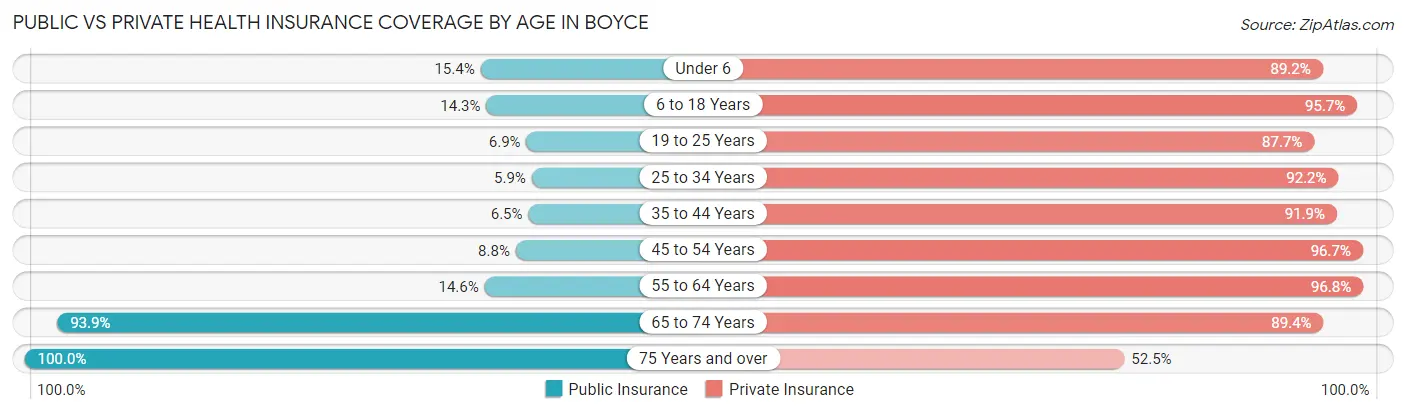
| Age Bracket | Public Insurance | Private Insurance |
| Under 6 | 10 (15.4%) | 58 (89.2%) |
| 6 to 18 Years | 23 (14.3%) | 154 (95.7%) |
| 19 to 25 Years | 5 (6.9%) | 64 (87.7%) |
| 25 to 34 Years | 6 (5.9%) | 94 (92.2%) |
| 35 to 44 Years | 8 (6.5%) | 113 (91.9%) |
| 45 to 54 Years | 16 (8.8%) | 175 (96.7%) |
| 55 to 64 Years | 18 (14.6%) | 119 (96.8%) |
| 65 to 74 Years | 62 (93.9%) | 59 (89.4%) |
| 75 Years and over | 61 (100.0%) | 32 (52.5%) |
| Total | 209 (21.9%) | 868 (90.9%) |
Disability Status by Sex by Age in Boyce
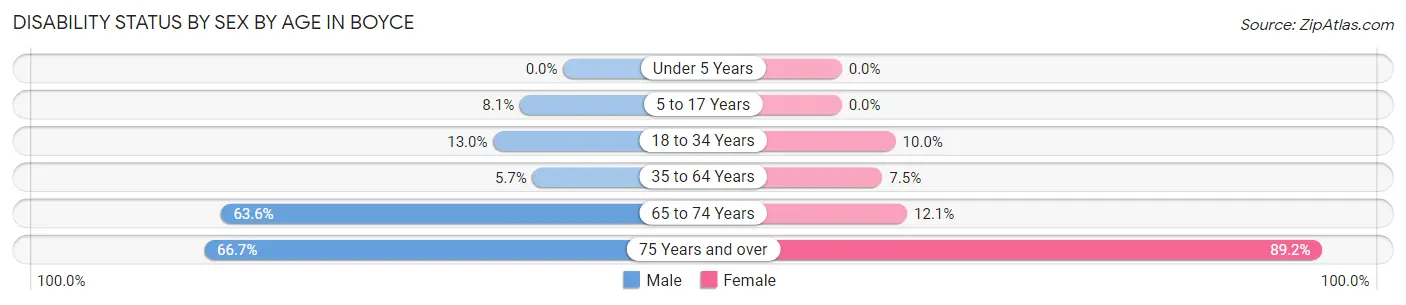
| Age Bracket | Male | Female |
| Under 5 Years | 0 (0.0%) | 0 (0.0%) |
| 5 to 17 Years | 7 (8.1%) | 0 (0.0%) |
| 18 to 34 Years | 13 (13.0%) | 9 (10.0%) |
| 35 to 64 Years | 13 (5.7%) | 15 (7.5%) |
| 65 to 74 Years | 21 (63.6%) | 4 (12.1%) |
| 75 Years and over | 16 (66.7%) | 33 (89.2%) |
Disability Class by Sex by Age in Boyce
Disability Class: Hearing Difficulty
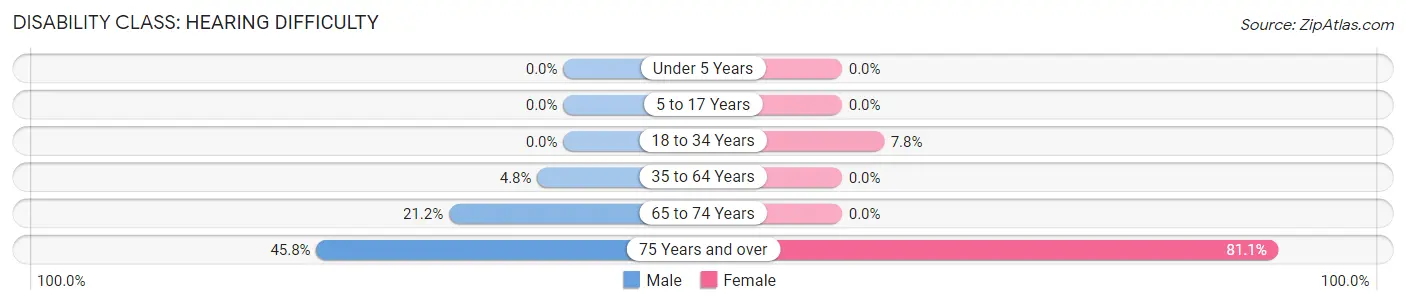
| Age Bracket | Male | Female |
| Under 5 Years | 0 (0.0%) | 0 (0.0%) |
| 5 to 17 Years | 0 (0.0%) | 0 (0.0%) |
| 18 to 34 Years | 0 (0.0%) | 7 (7.8%) |
| 35 to 64 Years | 11 (4.8%) | 0 (0.0%) |
| 65 to 74 Years | 7 (21.2%) | 0 (0.0%) |
| 75 Years and over | 11 (45.8%) | 30 (81.1%) |
Disability Class: Vision Difficulty
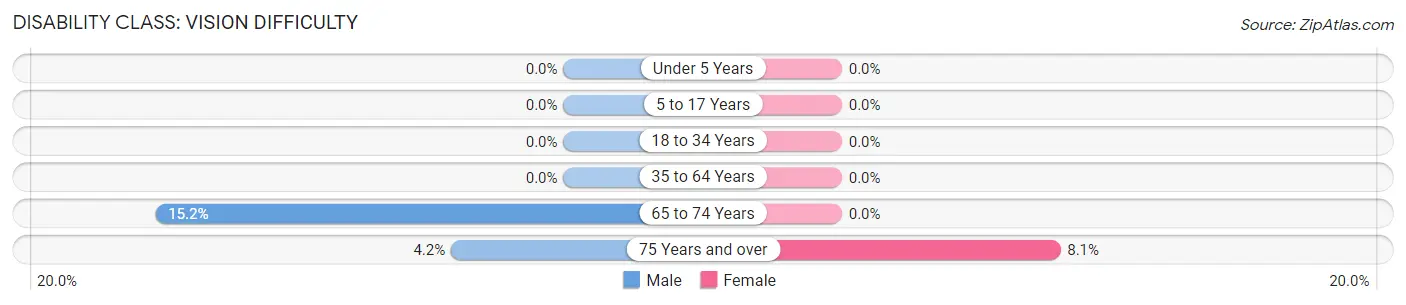
| Age Bracket | Male | Female |
| Under 5 Years | 0 (0.0%) | 0 (0.0%) |
| 5 to 17 Years | 0 (0.0%) | 0 (0.0%) |
| 18 to 34 Years | 0 (0.0%) | 0 (0.0%) |
| 35 to 64 Years | 0 (0.0%) | 0 (0.0%) |
| 65 to 74 Years | 5 (15.1%) | 0 (0.0%) |
| 75 Years and over | 1 (4.2%) | 3 (8.1%) |
Disability Class: Cognitive Difficulty
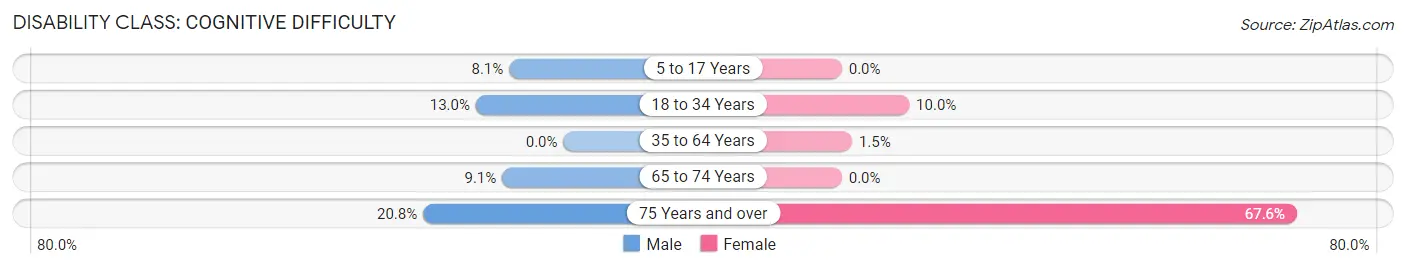
| Age Bracket | Male | Female |
| 5 to 17 Years | 7 (8.1%) | 0 (0.0%) |
| 18 to 34 Years | 13 (13.0%) | 9 (10.0%) |
| 35 to 64 Years | 0 (0.0%) | 3 (1.5%) |
| 65 to 74 Years | 3 (9.1%) | 0 (0.0%) |
| 75 Years and over | 5 (20.8%) | 25 (67.6%) |
Disability Class: Ambulatory Difficulty
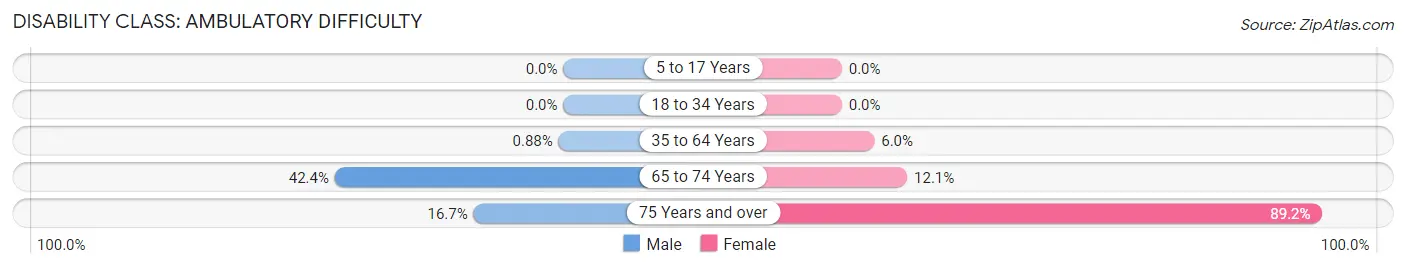
| Age Bracket | Male | Female |
| 5 to 17 Years | 0 (0.0%) | 0 (0.0%) |
| 18 to 34 Years | 0 (0.0%) | 0 (0.0%) |
| 35 to 64 Years | 2 (0.9%) | 12 (6.0%) |
| 65 to 74 Years | 14 (42.4%) | 4 (12.1%) |
| 75 Years and over | 4 (16.7%) | 33 (89.2%) |
Disability Class: Self-Care Difficulty
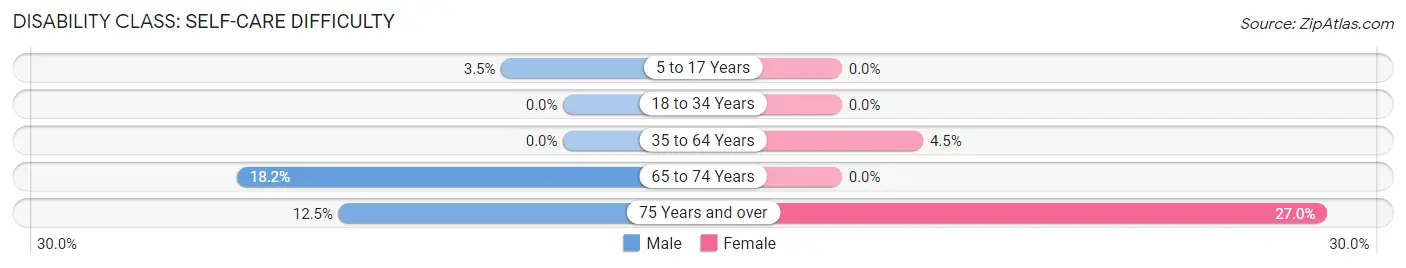
| Age Bracket | Male | Female |
| 5 to 17 Years | 3 (3.5%) | 0 (0.0%) |
| 18 to 34 Years | 0 (0.0%) | 0 (0.0%) |
| 35 to 64 Years | 0 (0.0%) | 9 (4.5%) |
| 65 to 74 Years | 6 (18.2%) | 0 (0.0%) |
| 75 Years and over | 3 (12.5%) | 10 (27.0%) |
Technology Access in Boyce
Computing Device Access in Boyce
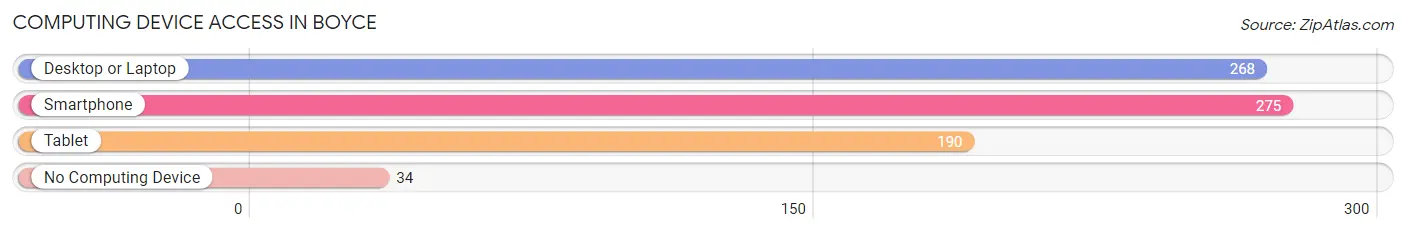
| Device Type | # Households | % Households |
| Desktop or Laptop | 268 | 84.8% |
| Smartphone | 275 | 87.0% |
| Tablet | 190 | 60.1% |
| No Computing Device | 34 | 10.8% |
| Total | 316 | 100.0% |
Internet Access in Boyce
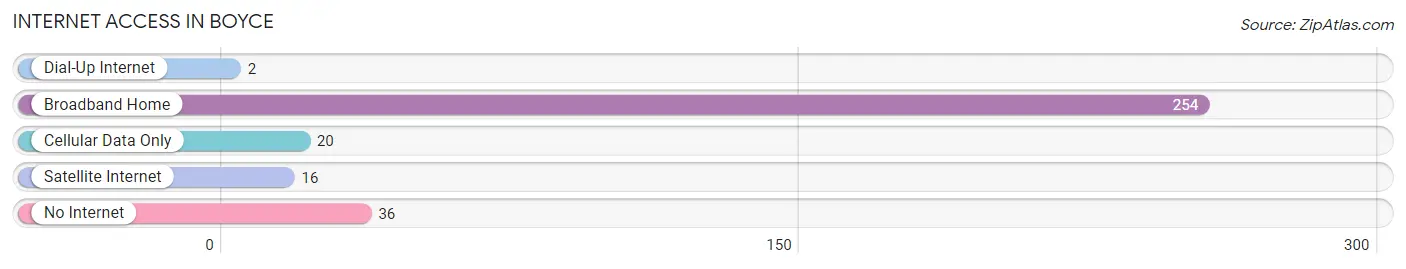
| Internet Type | # Households | % Households |
| Dial-Up Internet | 2 | 0.6% |
| Broadband Home | 254 | 80.4% |
| Cellular Data Only | 20 | 6.3% |
| Satellite Internet | 16 | 5.1% |
| No Internet | 36 | 11.4% |
| Total | 316 | 100.0% |
Boyce Summary
Boyce is a small town located in Clarke County, Virginia, United States. The town is situated in the northern part of the county, near the border with West Virginia. The population of Boyce was estimated to be 545 in 2019.
History
The town of Boyce was founded in 1836 by William Boyce, a local landowner. The town was named after him and was incorporated in 1887. The town was originally a farming community, but it soon developed into a small industrial center. The town was home to several factories, including a woolen mill, a sawmill, and a gristmill.
The town was also home to a number of churches, including the Boyce Methodist Church, which was founded in 1837. The town also had a post office, which opened in 1838.
Geography
Boyce is located in the northern part of Clarke County, Virginia, near the border with West Virginia. The town is situated in the Shenandoah Valley, which is a major agricultural region in the state. The town is located at the intersection of U.S. Route 340 and Virginia State Route 7.
The town is surrounded by rolling hills and is located near the Blue Ridge Mountains. The town is located near the Shenandoah River, which is a major tributary of the Potomac River.
Economy
The economy of Boyce is largely based on agriculture and tourism. The town is home to several farms, which produce a variety of crops, including corn, soybeans, wheat, and hay. The town is also home to several wineries, which produce a variety of wines.
The town is also home to several small businesses, including restaurants, shops, and other services. The town is also home to a number of bed and breakfasts, which attract tourists from all over the region.
Demographics
The population of Boyce was estimated to be 545 in 2019. The town has a median age of 44.7 years, and the median household income is $50,945. The town is predominantly white, with 92.3% of the population identifying as white. The town also has a small Hispanic population, with 4.2% of the population identifying as Hispanic or Latino.
The town is home to a number of churches, including the Boyce Methodist Church, which was founded in 1837. The town also has a post office, which opened in 1838.
Conclusion
Boyce is a small town located in Clarke County, Virginia, United States. The town is situated in the northern part of the county, near the border with West Virginia. The population of Boyce was estimated to be 545 in 2019. The town has a long history, and it was originally a farming community. The town is now home to several small businesses, including restaurants, shops, and other services. The town is also home to several wineries, which produce a variety of wines. The town is predominantly white, with 92.3% of the population identifying as white. The town is also home to a number of churches, including the Boyce Methodist Church, which was founded in 1837. The town also has a post office, which opened in 1838.
Common Questions
What is Per Capita Income in Boyce?
Per Capita income in Boyce is $46,484.
What is the Median Family Income in Boyce?
Median Family Income in Boyce is $135,313.
What is the Median Household income in Boyce?
Median Household Income in Boyce is $107,000.
What is Income or Wage Gap in Boyce?
Income or Wage Gap in Boyce is 53.1%.
Women in Boyce earn 46.9 cents for every dollar earned by a man.
What is Inequality or Gini Index in Boyce?
Inequality or Gini Index in Boyce is 0.36.
What is the Total Population of Boyce?
Total Population of Boyce is 956.
What is the Total Male Population of Boyce?
Total Male Population of Boyce is 497.
What is the Total Female Population of Boyce?
Total Female Population of Boyce is 459.
What is the Ratio of Males per 100 Females in Boyce?
There are 108.28 Males per 100 Females in Boyce.
What is the Ratio of Females per 100 Males in Boyce?
There are 92.35 Females per 100 Males in Boyce.
What is the Median Population Age in Boyce?
Median Population Age in Boyce is 42.6 Years.
What is the Average Family Size in Boyce
Average Family Size in Boyce is 3.9 People.
What is the Average Household Size in Boyce
Average Household Size in Boyce is 3.0 People.
How Large is the Labor Force in Boyce?
There are 589 People in the Labor Forcein in Boyce.
What is the Percentage of People in the Labor Force in Boyce?
75.1% of People are in the Labor Force in Boyce.
What is the Unemployment Rate in Boyce?
Unemployment Rate in Boyce is 3.9%.