Quinby, VA Map & Demographics
Quinby Map
Quinby Overview
$45,451
PER CAPITA INCOME
$95,091
AVG HOUSEHOLD INCOME
0.45
INEQUALITY / GINI INDEX
298
TOTAL POPULATION
163
MALE POPULATION
135
FEMALE POPULATION
120.74
MALES / 100 FEMALES
82.82
FEMALES / 100 MALES
39.4
MEDIAN AGE
2.7
AVG FAMILY SIZE
2.2
AVG HOUSEHOLD SIZE
109
LABOR FORCE [ PEOPLE ]
44.9%
PERCENT IN LABOR FORCE
Quinby Zip Codes
Quinby Area Codes
Income in Quinby
Income Overview in Quinby
| Characteristic | Number | Measure |
| Per Capita Income | 298 | $45,451 |
| Median Family Income | 95 | $0 |
| Mean Family Income | 95 | $130,224 |
| Median Household Income | 137 | $95,091 |
| Mean Household Income | 137 | $106,995 |
| Income Deficit | 95 | $0 |
| Wage / Income Gap (%) | 298 | 0.00% |
| Wage / Income Gap ($) | 298 | 100.00¢ per $1 |
| Gini / Inequality Index | 298 | 0.45 |
Earnings by Sex in Quinby
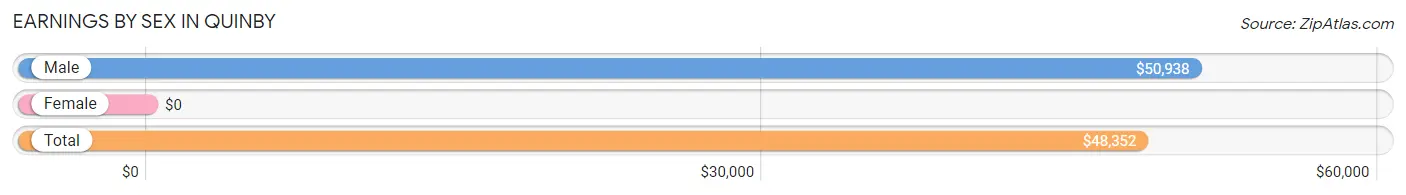
| Sex | Number | Average Earnings |
| Male | 68 (51.9%) | $50,938 |
| Female | 63 (48.1%) | $0 |
| Total | 131 (100.0%) | $48,352 |
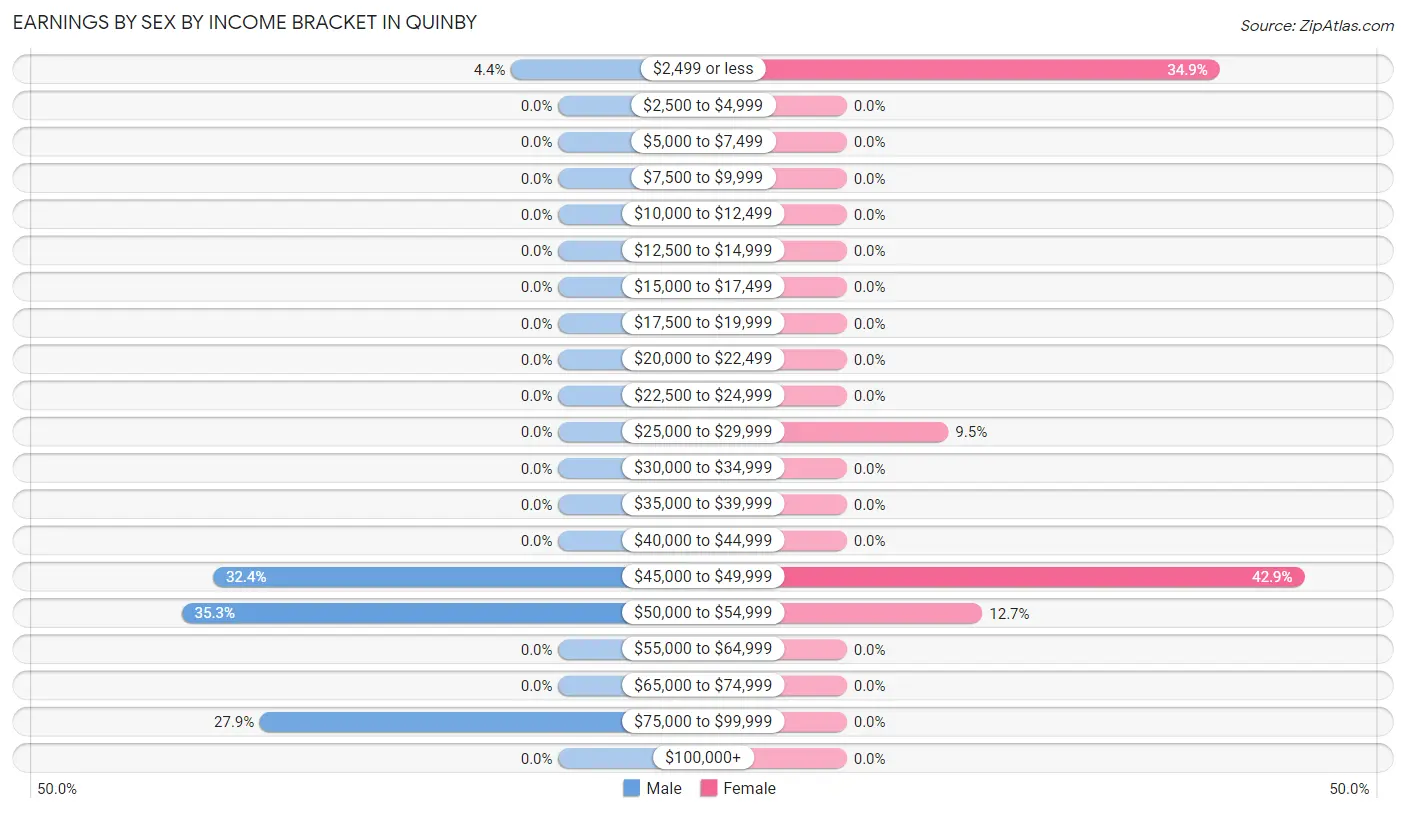
Earnings by Sex by Income Bracket in Quinby
The most common earnings brackets in Quinby are $50,000 to $54,999 for men (24 | 35.3%) and $45,000 to $49,999 for women (27 | 42.9%).
| Income | Male | Female |
| $2,499 or less | 3 (4.4%) | 22 (34.9%) |
| $2,500 to $4,999 | 0 (0.0%) | 0 (0.0%) |
| $5,000 to $7,499 | 0 (0.0%) | 0 (0.0%) |
| $7,500 to $9,999 | 0 (0.0%) | 0 (0.0%) |
| $10,000 to $12,499 | 0 (0.0%) | 0 (0.0%) |
| $12,500 to $14,999 | 0 (0.0%) | 0 (0.0%) |
| $15,000 to $17,499 | 0 (0.0%) | 0 (0.0%) |
| $17,500 to $19,999 | 0 (0.0%) | 0 (0.0%) |
| $20,000 to $22,499 | 0 (0.0%) | 0 (0.0%) |
| $22,500 to $24,999 | 0 (0.0%) | 0 (0.0%) |
| $25,000 to $29,999 | 0 (0.0%) | 6 (9.5%) |
| $30,000 to $34,999 | 0 (0.0%) | 0 (0.0%) |
| $35,000 to $39,999 | 0 (0.0%) | 0 (0.0%) |
| $40,000 to $44,999 | 0 (0.0%) | 0 (0.0%) |
| $45,000 to $49,999 | 22 (32.4%) | 27 (42.9%) |
| $50,000 to $54,999 | 24 (35.3%) | 8 (12.7%) |
| $55,000 to $64,999 | 0 (0.0%) | 0 (0.0%) |
| $65,000 to $74,999 | 0 (0.0%) | 0 (0.0%) |
| $75,000 to $99,999 | 19 (27.9%) | 0 (0.0%) |
| $100,000+ | 0 (0.0%) | 0 (0.0%) |
| Total | 68 (100.0%) | 63 (100.0%) |
Earnings by Sex by Educational Attainment in Quinby
| Educational Attainment | Male Income | Female Income |
| Less than High School | - | - |
| High School Diploma | - | - |
| College or Associate's Degree | - | - |
| Bachelor's Degree | - | - |
| Graduate Degree | - | - |
| Total | $50,938 | $46,343 |
Family Income in Quinby
Family Income Brackets in Quinby
According to the Quinby family income data, there are 30 families falling into the $50,000 to $74,999 income range, which is the most common income bracket and makes up 31.6% of all families.
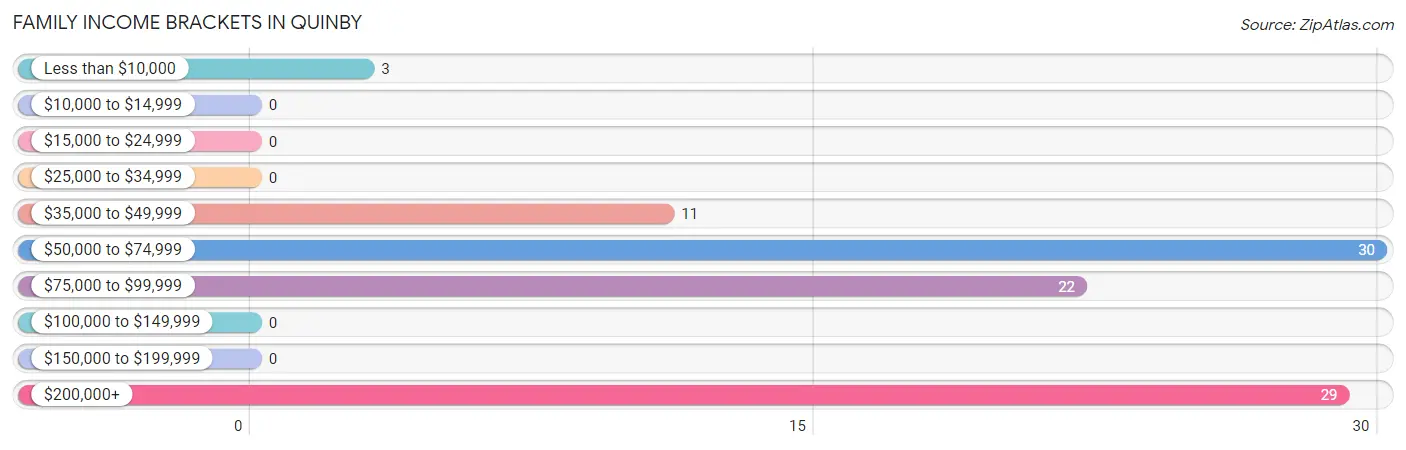
| Income Bracket | # Families | % Families |
| Less than $10,000 | 3 | 3.2% |
| $10,000 to $14,999 | 0 | 0.0% |
| $15,000 to $24,999 | 0 | 0.0% |
| $25,000 to $34,999 | 0 | 0.0% |
| $35,000 to $49,999 | 11 | 11.6% |
| $50,000 to $74,999 | 30 | 31.6% |
| $75,000 to $99,999 | 22 | 23.2% |
| $100,000 to $149,999 | 0 | 0.0% |
| $150,000 to $199,999 | 0 | 0.0% |
| $200,000+ | 29 | 30.5% |
Family Income by Famaliy Size in Quinby
2-person families (42 | 44.2%) account for the highest median family income in Quinby with $250,001 per family, while 2-person families (42 | 44.2%) have the highest median income of $125,000 per family member.
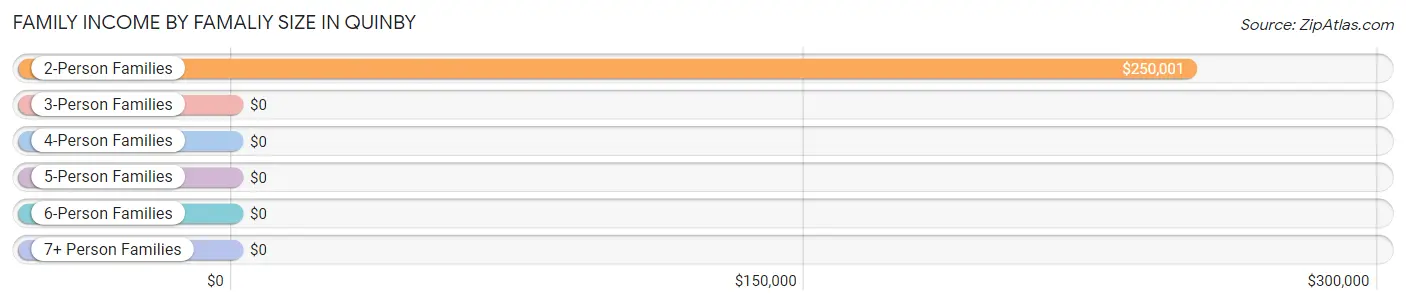
| Income Bracket | # Families | Median Income |
| 2-Person Families | 42 (44.2%) | $250,001 |
| 3-Person Families | 28 (29.5%) | $0 |
| 4-Person Families | 25 (26.3%) | $0 |
| 5-Person Families | 0 (0.0%) | $0 |
| 6-Person Families | 0 (0.0%) | $0 |
| 7+ Person Families | 0 (0.0%) | $0 |
| Total | 95 (100.0%) | $0 |
Family Income by Number of Earners in Quinby
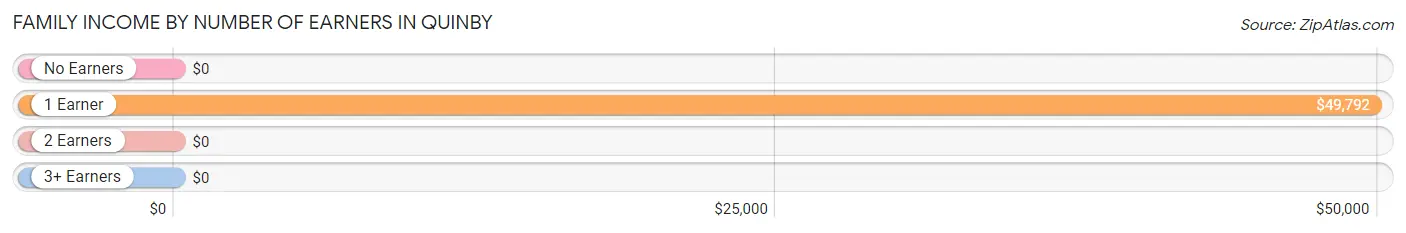
| Number of Earners | # Families | Median Income |
| No Earners | 34 (35.8%) | $0 |
| 1 Earner | 17 (17.9%) | $49,792 |
| 2 Earners | 44 (46.3%) | $0 |
| 3+ Earners | 0 (0.0%) | $0 |
| Total | 95 (100.0%) | $0 |
Household Income in Quinby
Household Income Brackets in Quinby
With 41 households falling in the category, the $75,000 to $99,999 income range is the most frequent in Quinby, accounting for 29.9% of all households.
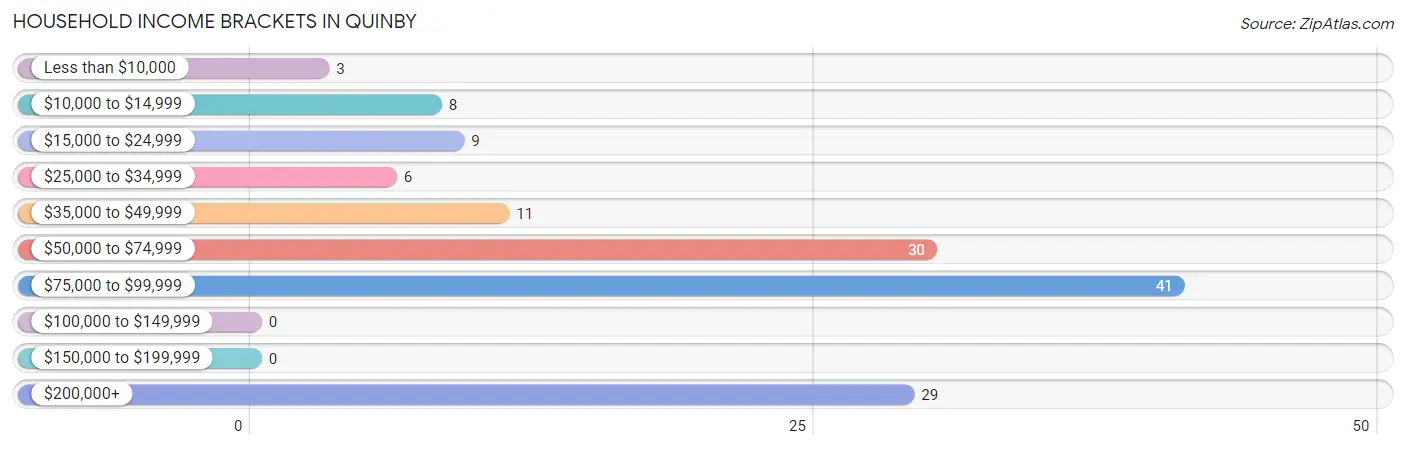
| Income Bracket | # Households | % Households |
| Less than $10,000 | 3 | 2.2% |
| $10,000 to $14,999 | 8 | 5.8% |
| $15,000 to $24,999 | 9 | 6.6% |
| $25,000 to $34,999 | 6 | 4.4% |
| $35,000 to $49,999 | 11 | 8.0% |
| $50,000 to $74,999 | 30 | 21.9% |
| $75,000 to $99,999 | 41 | 29.9% |
| $100,000 to $149,999 | 0 | 0.0% |
| $150,000 to $199,999 | 0 | 0.0% |
| $200,000+ | 29 | 21.2% |
Household Income by Householder Age in Quinby
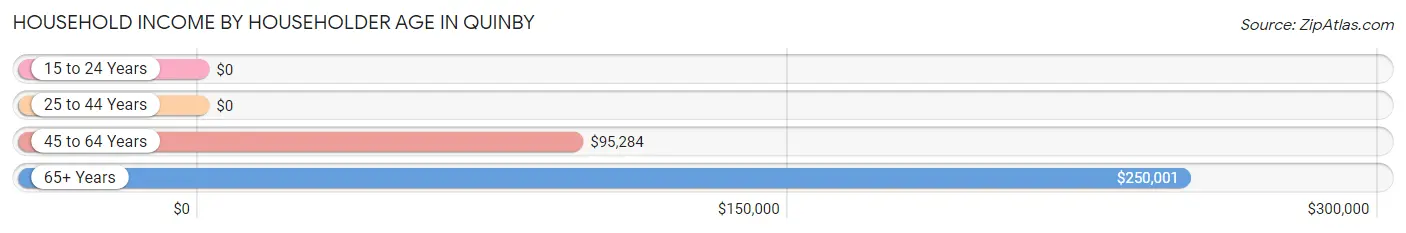
The median household income in Quinby is $95,091, with the highest median household income of $250,001 found in the 65+ years age bracket for the primary householder. A total of 57 households (41.6%) fall into this category. Meanwhile, the 15 to 24 years age bracket for the primary householder has the lowest median household income of $0, with 22 households (16.1%) in this group.
| Income Bracket | # Households | Median Income |
| 15 to 24 Years | 22 (16.1%) | $0 |
| 25 to 44 Years | 19 (13.9%) | $0 |
| 45 to 64 Years | 39 (28.5%) | $95,284 |
| 65+ Years | 57 (41.6%) | $250,001 |
| Total | 137 (100.0%) | $95,091 |
Poverty in Quinby
Income Below Poverty by Sex and Age in Quinby
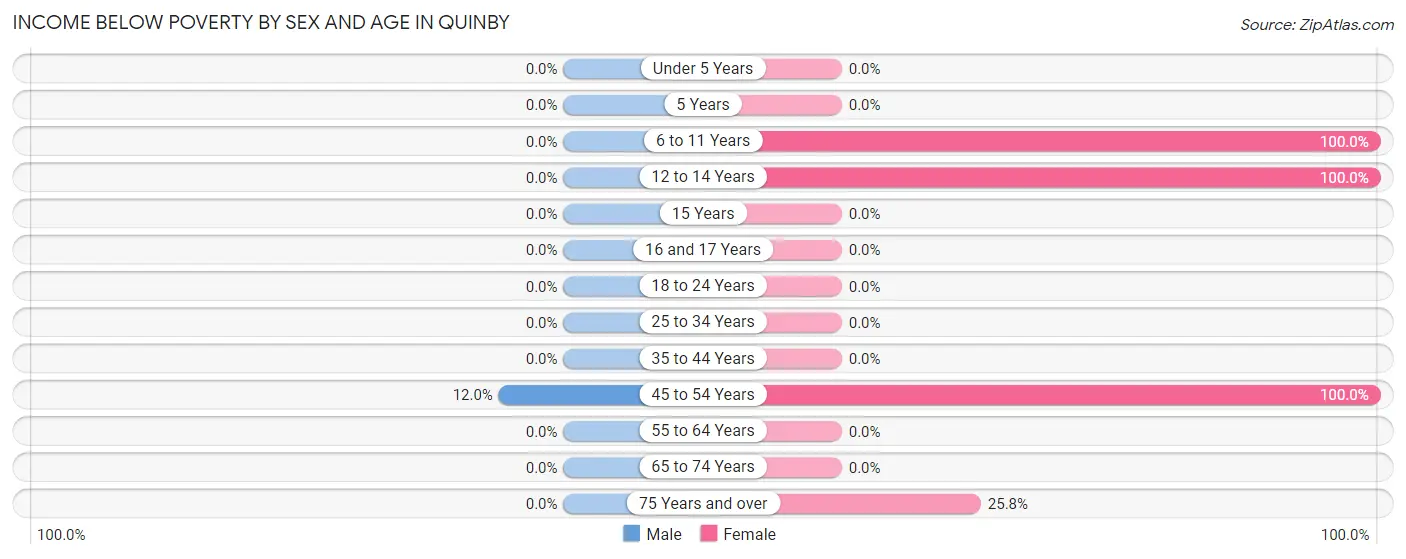
With 1.8% poverty level for males and 14.8% for females among the residents of Quinby, 45 to 54 year old males and 6 to 11 year old females are the most vulnerable to poverty, with 3 males (12.0%) and 4 females (100.0%) in their respective age groups living below the poverty level.
| Age Bracket | Male | Female |
| Under 5 Years | 0 (0.0%) | 0 (0.0%) |
| 5 Years | 0 (0.0%) | 0 (0.0%) |
| 6 to 11 Years | 0 (0.0%) | 4 (100.0%) |
| 12 to 14 Years | 0 (0.0%) | 4 (100.0%) |
| 15 Years | 0 (0.0%) | 0 (0.0%) |
| 16 and 17 Years | 0 (0.0%) | 0 (0.0%) |
| 18 to 24 Years | 0 (0.0%) | 0 (0.0%) |
| 25 to 34 Years | 0 (0.0%) | 0 (0.0%) |
| 35 to 44 Years | 0 (0.0%) | 0 (0.0%) |
| 45 to 54 Years | 3 (12.0%) | 4 (100.0%) |
| 55 to 64 Years | 0 (0.0%) | 0 (0.0%) |
| 65 to 74 Years | 0 (0.0%) | 0 (0.0%) |
| 75 Years and over | 0 (0.0%) | 8 (25.8%) |
| Total | 3 (1.8%) | 20 (14.8%) |
Income Above Poverty by Sex and Age in Quinby
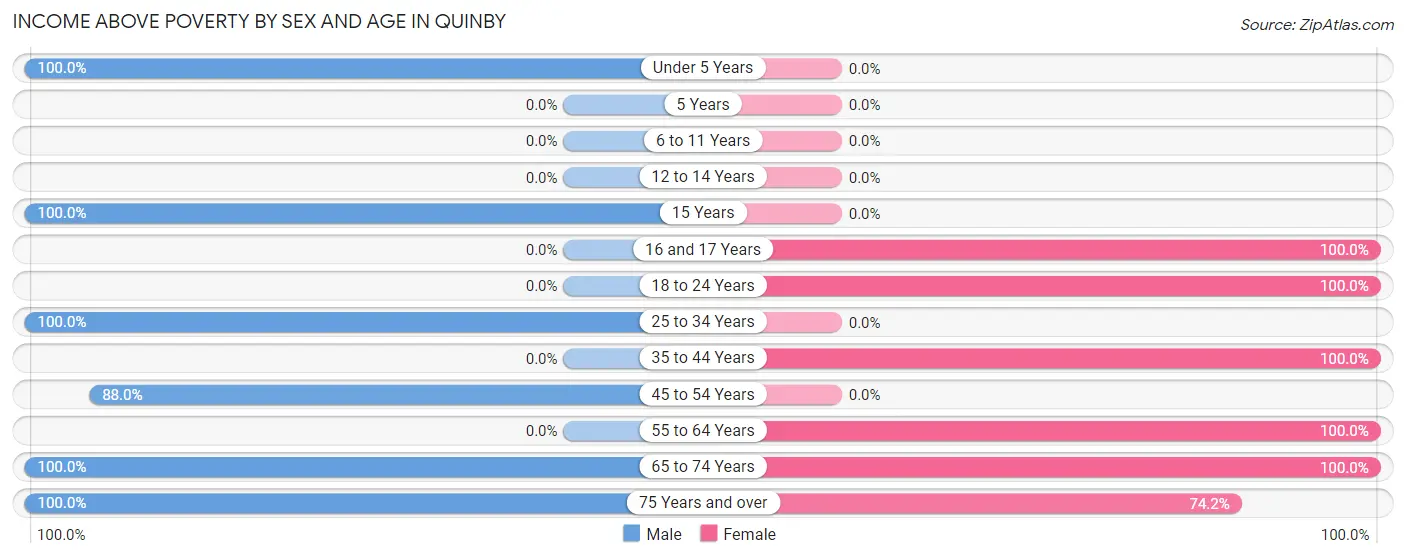
According to the poverty statistics in Quinby, males aged under 5 years and females aged 16 and 17 years are the age groups that are most secure financially, with 100.0% of males and 100.0% of females in these age groups living above the poverty line.
| Age Bracket | Male | Female |
| Under 5 Years | 27 (100.0%) | 0 (0.0%) |
| 5 Years | 0 (0.0%) | 0 (0.0%) |
| 6 to 11 Years | 0 (0.0%) | 0 (0.0%) |
| 12 to 14 Years | 0 (0.0%) | 0 (0.0%) |
| 15 Years | 20 (100.0%) | 0 (0.0%) |
| 16 and 17 Years | 0 (0.0%) | 6 (100.0%) |
| 18 to 24 Years | 0 (0.0%) | 34 (100.0%) |
| 25 to 34 Years | 43 (100.0%) | 0 (0.0%) |
| 35 to 44 Years | 0 (0.0%) | 27 (100.0%) |
| 45 to 54 Years | 22 (88.0%) | 0 (0.0%) |
| 55 to 64 Years | 0 (0.0%) | 14 (100.0%) |
| 65 to 74 Years | 10 (100.0%) | 11 (100.0%) |
| 75 Years and over | 38 (100.0%) | 23 (74.2%) |
| Total | 160 (98.2%) | 115 (85.2%) |
Income Below Poverty Among Married-Couple Families in Quinby
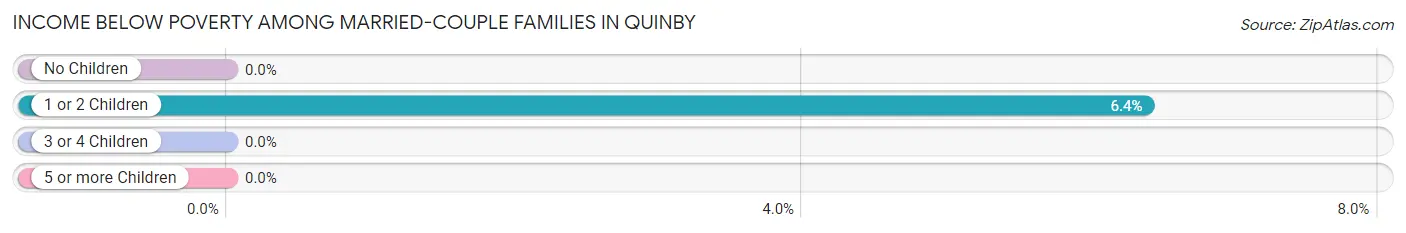
The poverty statistics for married-couple families in Quinby show that 3.5% or 3 of the total 87 families live below the poverty line. Families with 1 or 2 children have the highest poverty rate of 6.4%, comprising of 3 families. On the other hand, families with no children have the lowest poverty rate of 0.0%, which includes 0 families.
| Children | Above Poverty | Below Poverty |
| No Children | 40 (100.0%) | 0 (0.0%) |
| 1 or 2 Children | 44 (93.6%) | 3 (6.4%) |
| 3 or 4 Children | 0 (0.0%) | 0 (0.0%) |
| 5 or more Children | 0 (0.0%) | 0 (0.0%) |
| Total | 84 (96.6%) | 3 (3.5%) |
Income Below Poverty Among Single-Parent Households in Quinby
| Children | Single Father | Single Mother |
| No Children | 0 (0.0%) | 0 (0.0%) |
| 1 or 2 Children | 0 (0.0%) | 0 (0.0%) |
| 3 or 4 Children | 0 (0.0%) | 0 (0.0%) |
| 5 or more Children | 0 (0.0%) | 0 (0.0%) |
| Total | 0 (0.0%) | 0 (0.0%) |
Income Below Poverty Among Married-Couple vs Single-Parent Households in Quinby
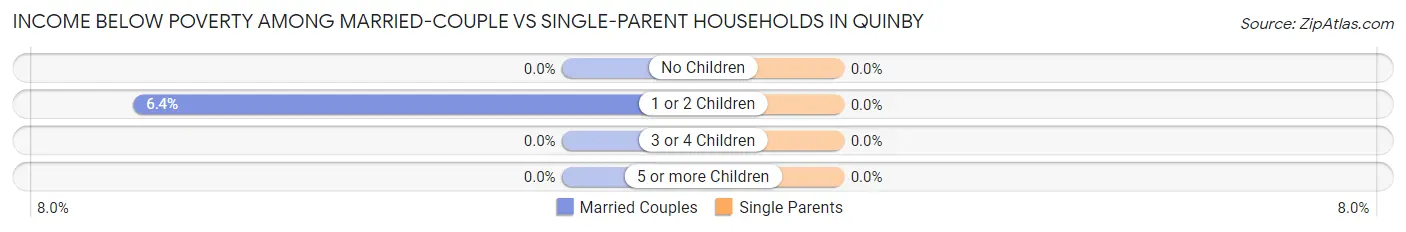
| Children | Married-Couple Families | Single-Parent Households |
| No Children | 0 (0.0%) | 0 (0.0%) |
| 1 or 2 Children | 3 (6.4%) | 0 (0.0%) |
| 3 or 4 Children | 0 (0.0%) | 0 (0.0%) |
| 5 or more Children | 0 (0.0%) | 0 (0.0%) |
| Total | 3 (3.5%) | 0 (0.0%) |
Race in Quinby
The most populous races in Quinby are , and White / Caucasian (298 | 100.0%).
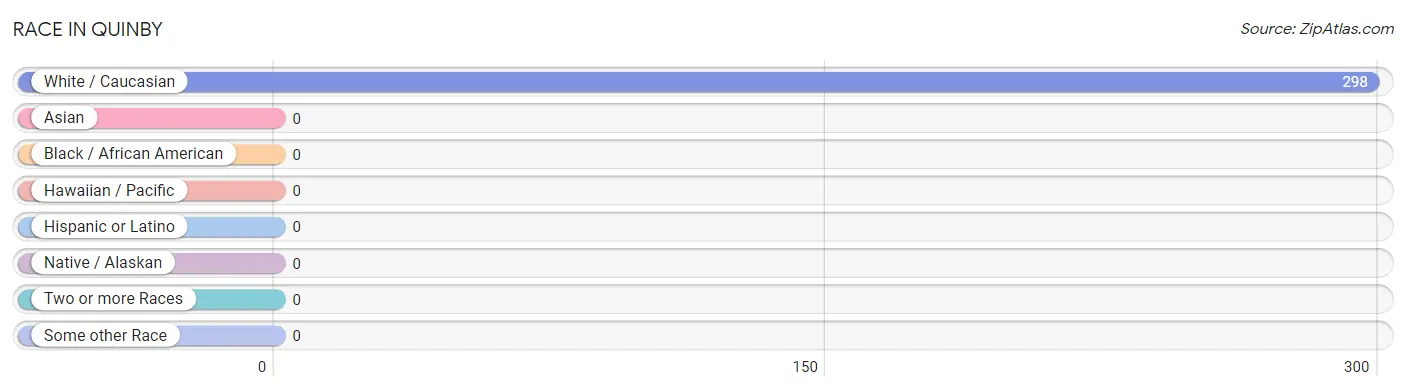
| Race | # Population | % Population |
| Asian | 0 | 0.0% |
| Black / African American | 0 | 0.0% |
| Hawaiian / Pacific | 0 | 0.0% |
| Hispanic or Latino | 0 | 0.0% |
| Native / Alaskan | 0 | 0.0% |
| White / Caucasian | 298 | 100.0% |
| Two or more Races | 0 | 0.0% |
| Some other Race | 0 | 0.0% |
| Total | 298 | 100.0% |
Ancestry in Quinby
The most populous ancestries reported in Quinby are American (101 | 33.9%), Scotch-Irish (35 | 11.7%), German (28 | 9.4%), English (26 | 8.7%), and Irish (11 | 3.7%), together accounting for 67.4% of all Quinby residents.
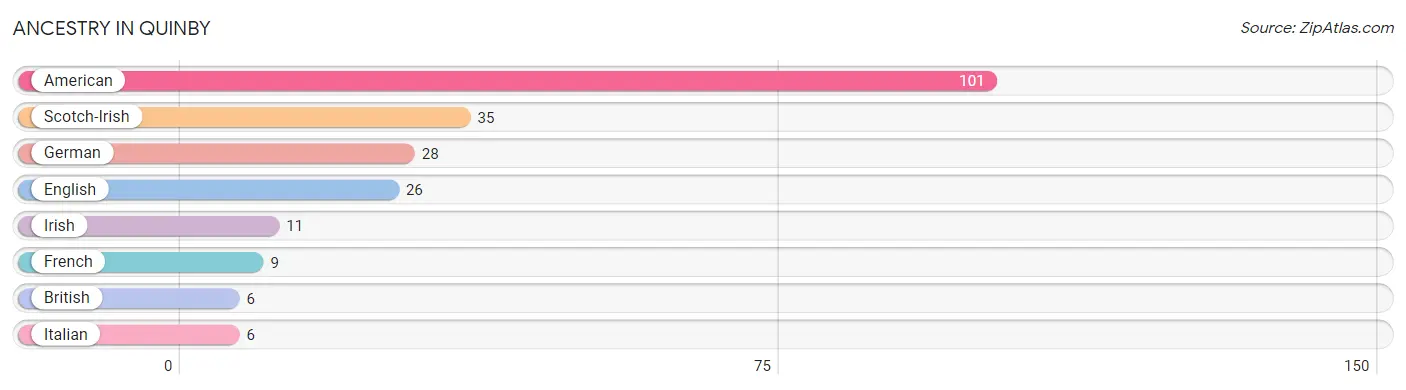
| Ancestry | # Population | % Population |
| American | 101 | 33.9% |
| British | 6 | 2.0% |
| English | 26 | 8.7% |
| French | 9 | 3.0% |
| German | 28 | 9.4% |
| Irish | 11 | 3.7% |
| Italian | 6 | 2.0% |
| Scotch-Irish | 35 | 11.7% | View All 8 Rows |
Immigrants in Quinby

| Immigration Origin | # Population | % Population | View All 0 Rows |
Sex and Age in Quinby
Sex and Age in Quinby
The most populous age groups in Quinby are 25 to 29 Years (43 | 26.4%) for men and 20 to 24 Years (34 | 25.2%) for women.
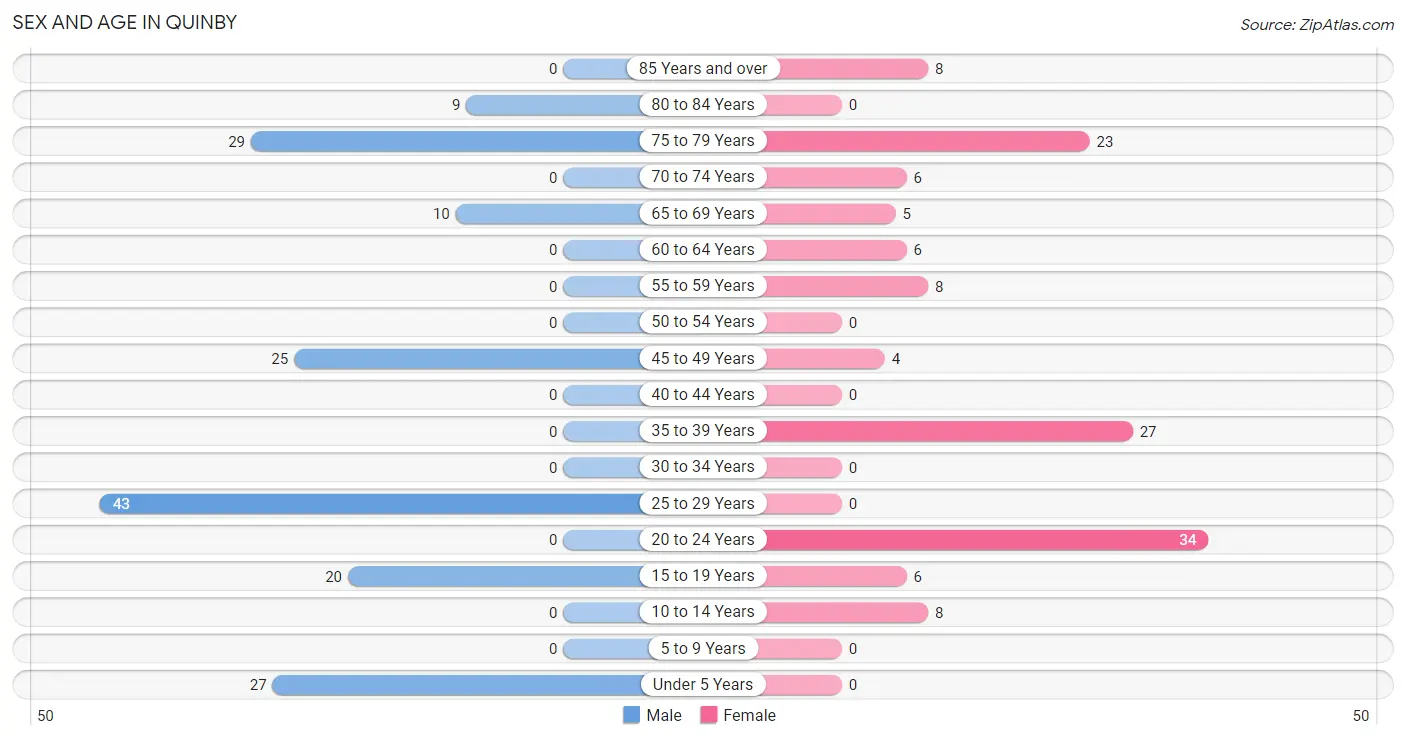
| Age Bracket | Male | Female |
| Under 5 Years | 27 (16.6%) | 0 (0.0%) |
| 5 to 9 Years | 0 (0.0%) | 0 (0.0%) |
| 10 to 14 Years | 0 (0.0%) | 8 (5.9%) |
| 15 to 19 Years | 20 (12.3%) | 6 (4.4%) |
| 20 to 24 Years | 0 (0.0%) | 34 (25.2%) |
| 25 to 29 Years | 43 (26.4%) | 0 (0.0%) |
| 30 to 34 Years | 0 (0.0%) | 0 (0.0%) |
| 35 to 39 Years | 0 (0.0%) | 27 (20.0%) |
| 40 to 44 Years | 0 (0.0%) | 0 (0.0%) |
| 45 to 49 Years | 25 (15.3%) | 4 (3.0%) |
| 50 to 54 Years | 0 (0.0%) | 0 (0.0%) |
| 55 to 59 Years | 0 (0.0%) | 8 (5.9%) |
| 60 to 64 Years | 0 (0.0%) | 6 (4.4%) |
| 65 to 69 Years | 10 (6.1%) | 5 (3.7%) |
| 70 to 74 Years | 0 (0.0%) | 6 (4.4%) |
| 75 to 79 Years | 29 (17.8%) | 23 (17.0%) |
| 80 to 84 Years | 9 (5.5%) | 0 (0.0%) |
| 85 Years and over | 0 (0.0%) | 8 (5.9%) |
| Total | 163 (100.0%) | 135 (100.0%) |
Families and Households in Quinby
Median Family Size in Quinby
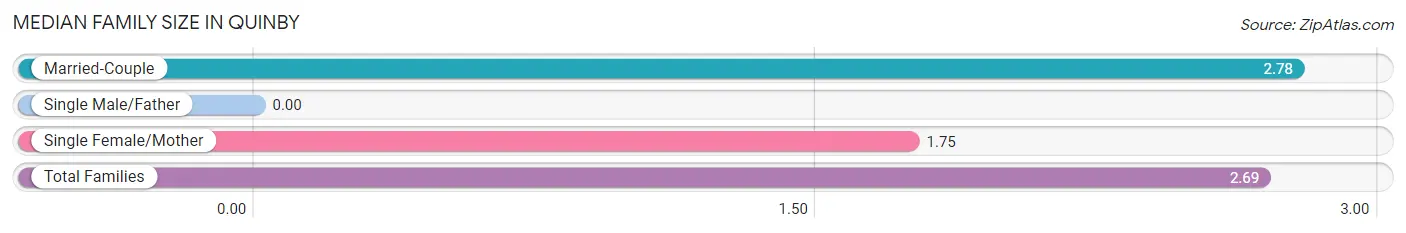
| Family Type | # Families | Family Size |
| Married-Couple | 87 (91.6%) | 2.78 |
| Single Male/Father | 0 (0.0%) | - |
| Single Female/Mother | 8 (8.4%) | 1.75 |
| Total Families | 95 (100.0%) | 2.69 |
Median Household Size in Quinby
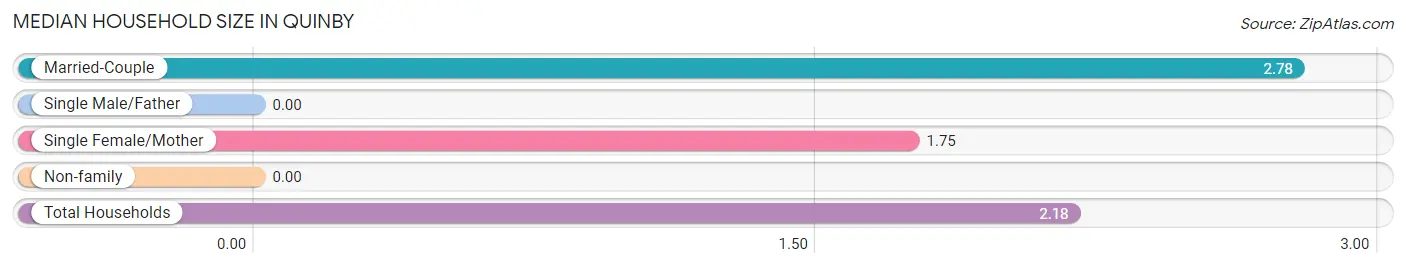
| Household Type | # Households | Household Size |
| Married-Couple | 87 (63.5%) | 2.78 |
| Single Male/Father | 0 (0.0%) | - |
| Single Female/Mother | 8 (5.8%) | 1.75 |
| Non-family | 42 (30.7%) | - |
| Total Households | 137 (100.0%) | 2.18 |
Household Size by Marriage Status in Quinby
Out of a total of 137 households in Quinby, 95 (69.3%) are family households, while 42 (30.7%) are nonfamily households. The most numerous type of family households are 2-person households, comprising 42, and the most common type of nonfamily households are 1-person households, comprising 42.
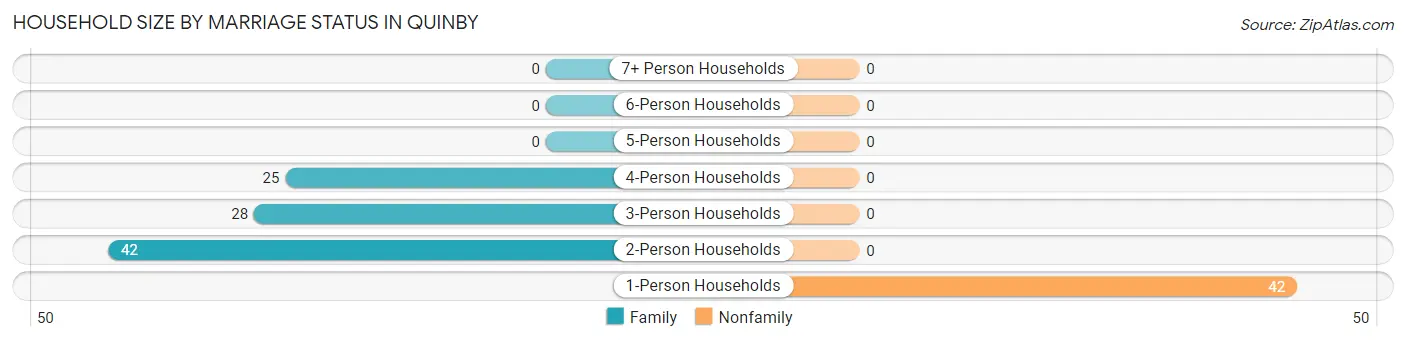
| Household Size | Family Households | Nonfamily Households |
| 1-Person Households | - | 42 (30.7%) |
| 2-Person Households | 42 (30.7%) | 0 (0.0%) |
| 3-Person Households | 28 (20.4%) | 0 (0.0%) |
| 4-Person Households | 25 (18.2%) | 0 (0.0%) |
| 5-Person Households | 0 (0.0%) | 0 (0.0%) |
| 6-Person Households | 0 (0.0%) | 0 (0.0%) |
| 7+ Person Households | 0 (0.0%) | 0 (0.0%) |
| Total | 95 (69.3%) | 42 (30.7%) |
Female Fertility in Quinby
Fertility by Age in Quinby
Average fertility rate in Quinby is 310.0 births per 1,000 women. Women in the age bracket of 20 to 34 years have the highest fertility rate with 647.0 births per 1,000 women. Women in the age bracket of 20 to 34 years acount for 100.0% of all women with births.
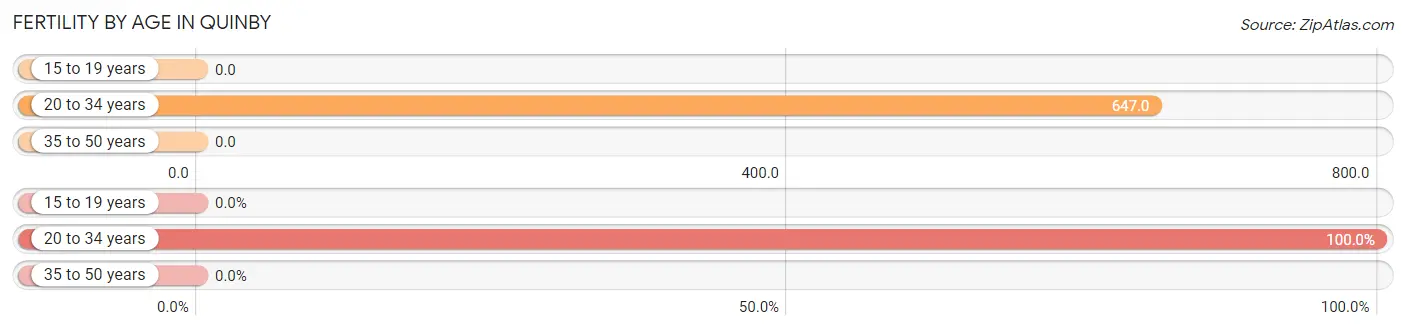
| Age Bracket | Women with Births | Births / 1,000 Women |
| 15 to 19 years | 0 (0.0%) | 0.0 |
| 20 to 34 years | 22 (100.0%) | 647.0 |
| 35 to 50 years | 0 (0.0%) | 0.0 |
| Total | 22 (100.0%) | 310.0 |
Fertility by Age by Marriage Status in Quinby
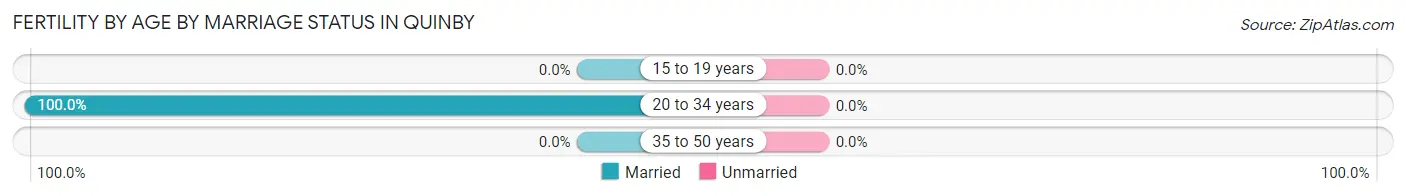
| Age Bracket | Married | Unmarried |
| 15 to 19 years | 0 (0.0%) | 0 (0.0%) |
| 20 to 34 years | 22 (100.0%) | 0 (0.0%) |
| 35 to 50 years | 0 (0.0%) | 0 (0.0%) |
| Total | 22 (100.0%) | 0 (0.0%) |
Fertility by Education in Quinby
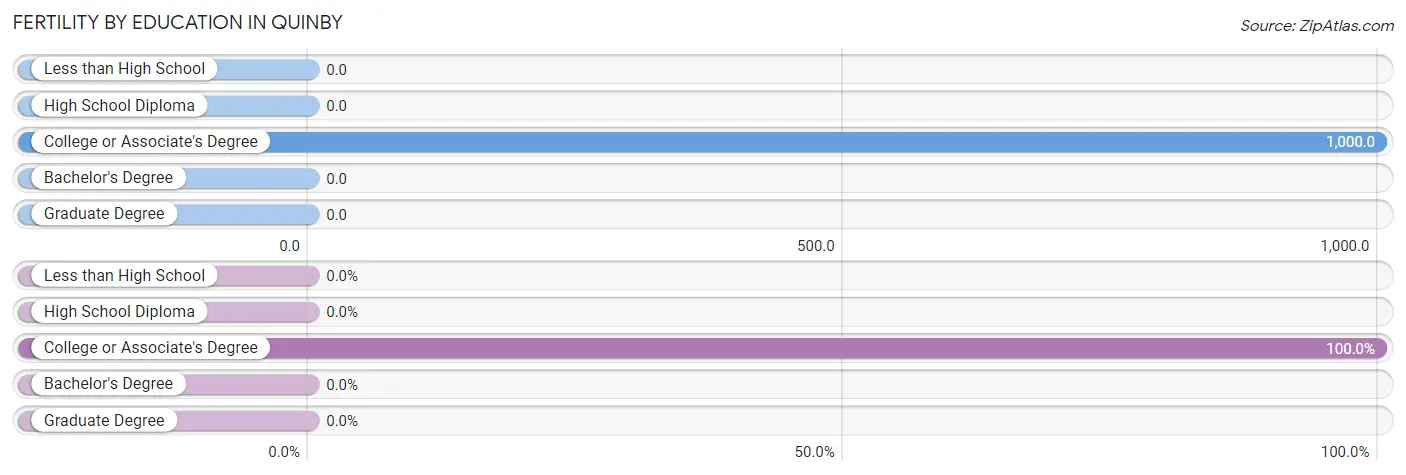
| Educational Attainment | Women with Births | Births / 1,000 Women |
| Less than High School | 0 (0.0%) | 0.0 |
| High School Diploma | 0 (0.0%) | 0.0 |
| College or Associate's Degree | 22 (100.0%) | 1,000.0 |
| Bachelor's Degree | 0 (0.0%) | 0.0 |
| Graduate Degree | 0 (0.0%) | 0.0 |
| Total | 22 (100.0%) | 310.0 |
Fertility by Education by Marriage Status in Quinby
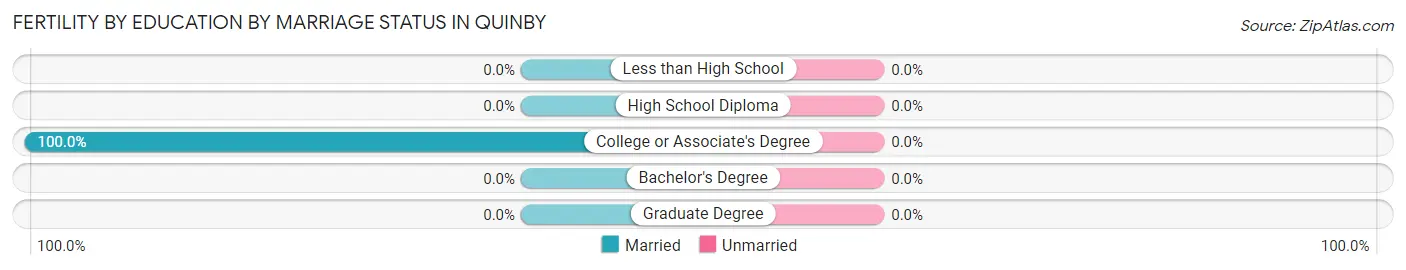
| Educational Attainment | Married | Unmarried |
| Less than High School | 0 (0.0%) | 0 (0.0%) |
| High School Diploma | 0 (0.0%) | 0 (0.0%) |
| College or Associate's Degree | 22 (100.0%) | 0 (0.0%) |
| Bachelor's Degree | 0 (0.0%) | 0 (0.0%) |
| Graduate Degree | 0 (0.0%) | 0 (0.0%) |
| Total | 22 (100.0%) | 0 (0.0%) |
Employment Characteristics in Quinby
Employment by Class of Employer in Quinby
Among the 109 employed individuals in Quinby, private company employees (98 | 89.9%), state government employees (8 | 7.3%), and self-employed (not incorporated) (3 | 2.8%) make up the most common classes of employment.
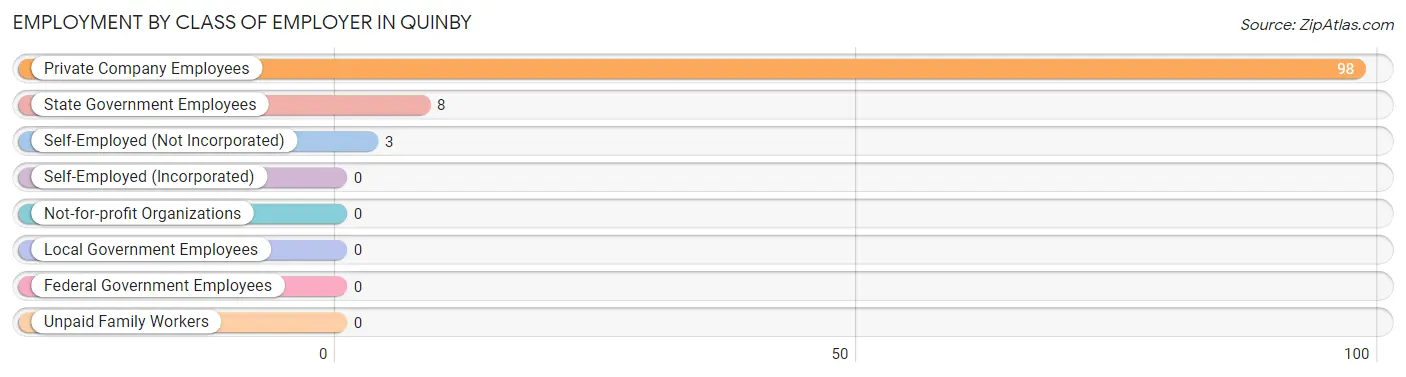
| Employer Class | # Employees | % Employees |
| Private Company Employees | 98 | 89.9% |
| Self-Employed (Incorporated) | 0 | 0.0% |
| Self-Employed (Not Incorporated) | 3 | 2.8% |
| Not-for-profit Organizations | 0 | 0.0% |
| Local Government Employees | 0 | 0.0% |
| State Government Employees | 8 | 7.3% |
| Federal Government Employees | 0 | 0.0% |
| Unpaid Family Workers | 0 | 0.0% |
| Total | 109 | 100.0% |
Employment Status by Age in Quinby
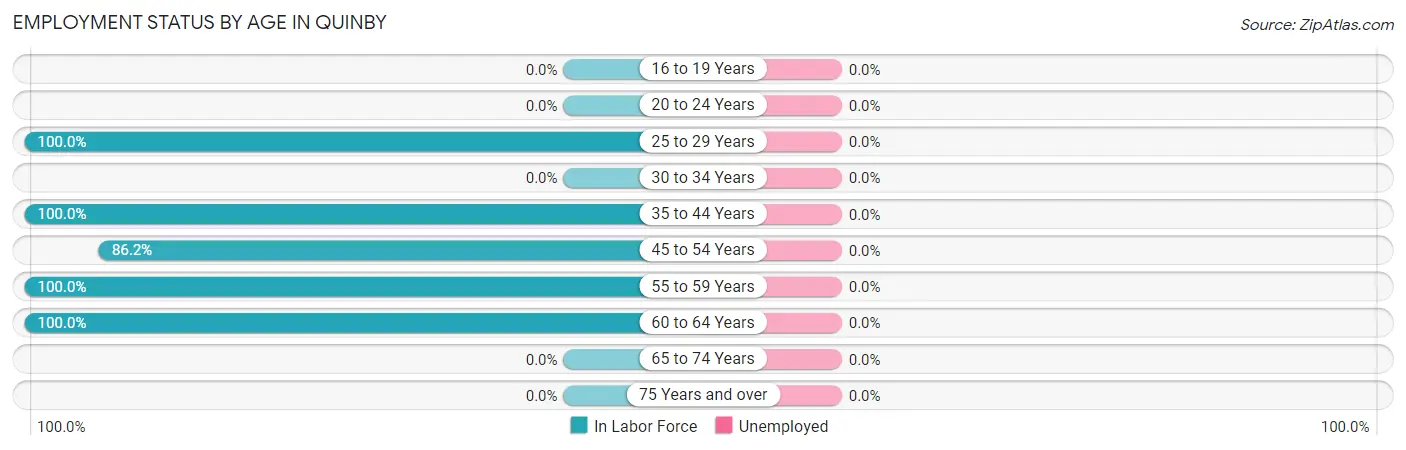
| Age Bracket | In Labor Force | Unemployed |
| 16 to 19 Years | 0 (0.0%) | 0 (0.0%) |
| 20 to 24 Years | 0 (0.0%) | 0 (0.0%) |
| 25 to 29 Years | 43 (100.0%) | 0 (0.0%) |
| 30 to 34 Years | 0 (0.0%) | 0 (0.0%) |
| 35 to 44 Years | 27 (100.0%) | 0 (0.0%) |
| 45 to 54 Years | 25 (86.2%) | 0 (0.0%) |
| 55 to 59 Years | 8 (100.0%) | 0 (0.0%) |
| 60 to 64 Years | 6 (100.0%) | 0 (0.0%) |
| 65 to 74 Years | 0 (0.0%) | 0 (0.0%) |
| 75 Years and over | 0 (0.0%) | 0 (0.0%) |
| Total | 109 (44.9%) | 0 (0.0%) |
Employment Status by Educational Attainment in Quinby
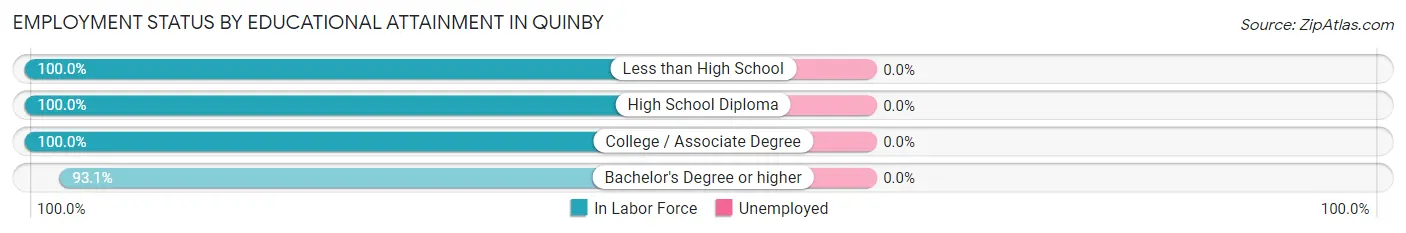
| Educational Attainment | In Labor Force | Unemployed |
| Less than High School | 22 (100.0%) | 0 (0.0%) |
| High School Diploma | 30 (100.0%) | 0 (0.0%) |
| College / Associate Degree | 3 (100.0%) | 0 (0.0%) |
| Bachelor's Degree or higher | 54 (93.1%) | 0 (0.0%) |
| Total | 109 (96.5%) | 0 (0.0%) |
Employment Occupations by Sex in Quinby
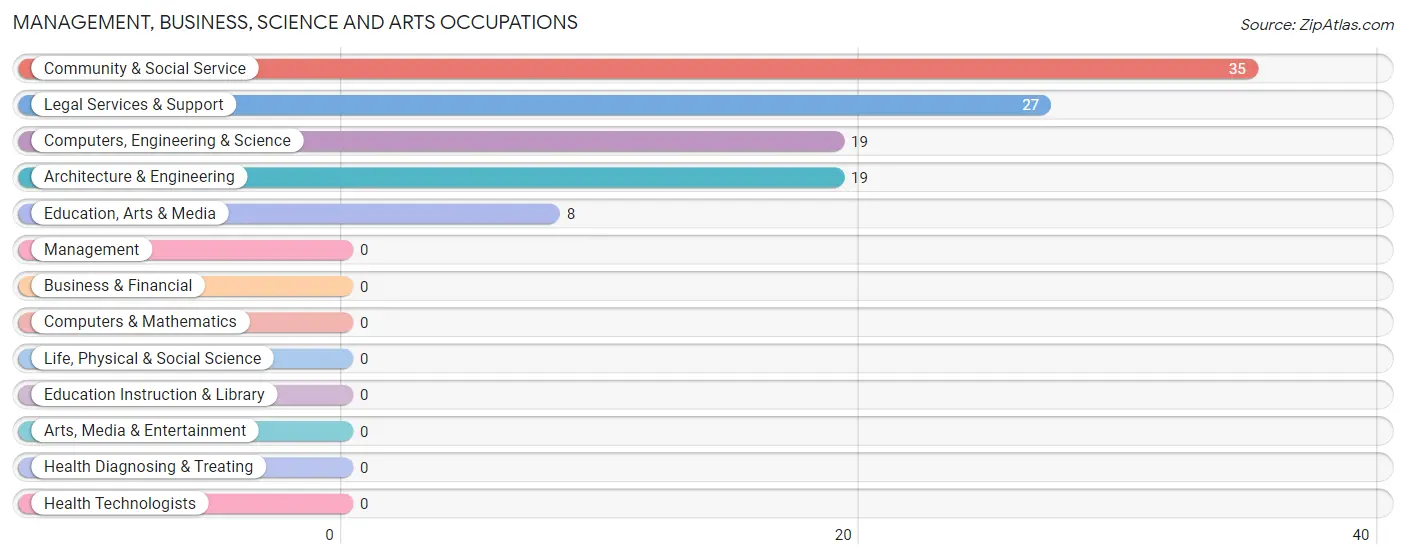
Management, Business, Science and Arts Occupations
The most common Management, Business, Science and Arts occupations in Quinby are Community & Social Service (35 | 32.1%), Legal Services & Support (27 | 24.8%), Computers, Engineering & Science (19 | 17.4%), Architecture & Engineering (19 | 17.4%), and Education, Arts & Media (8 | 7.3%).
Management, Business, Science and Arts Occupations by Sex
Within the Management, Business, Science and Arts occupations in Quinby, the most male-oriented occupations are Computers, Engineering & Science (100.0%), and Architecture & Engineering (100.0%), while the most female-oriented occupations are Community & Social Service (100.0%), Education, Arts & Media (100.0%), and Legal Services & Support (100.0%).
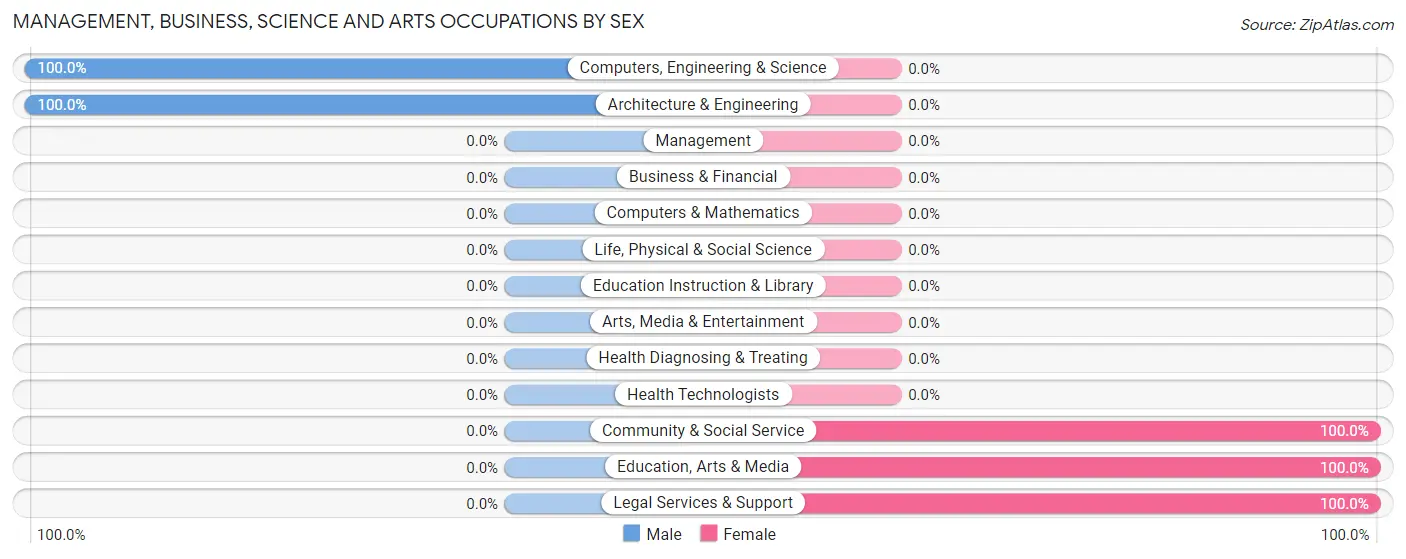
| Occupation | Male | Female |
| Management | 0 (0.0%) | 0 (0.0%) |
| Business & Financial | 0 (0.0%) | 0 (0.0%) |
| Computers, Engineering & Science | 19 (100.0%) | 0 (0.0%) |
| Computers & Mathematics | 0 (0.0%) | 0 (0.0%) |
| Architecture & Engineering | 19 (100.0%) | 0 (0.0%) |
| Life, Physical & Social Science | 0 (0.0%) | 0 (0.0%) |
| Community & Social Service | 0 (0.0%) | 35 (100.0%) |
| Education, Arts & Media | 0 (0.0%) | 8 (100.0%) |
| Legal Services & Support | 0 (0.0%) | 27 (100.0%) |
| Education Instruction & Library | 0 (0.0%) | 0 (0.0%) |
| Arts, Media & Entertainment | 0 (0.0%) | 0 (0.0%) |
| Health Diagnosing & Treating | 0 (0.0%) | 0 (0.0%) |
| Health Technologists | 0 (0.0%) | 0 (0.0%) |
| Total (Category) | 19 (35.2%) | 35 (64.8%) |
| Total (Overall) | 68 (62.4%) | 41 (37.6%) |
Services Occupations
Services Occupations by Sex
| Occupation | Male | Female |
| Healthcare Support | 0 (0.0%) | 0 (0.0%) |
| Security & Protection | 0 (0.0%) | 0 (0.0%) |
| Firefighting & Prevention | 0 (0.0%) | 0 (0.0%) |
| Law Enforcement | 0 (0.0%) | 0 (0.0%) |
| Food Preparation & Serving | 0 (0.0%) | 0 (0.0%) |
| Cleaning & Maintenance | 0 (0.0%) | 0 (0.0%) |
| Personal Care & Service | 0 (0.0%) | 0 (0.0%) |
| Total (Category) | 0 (0.0%) | 0 (0.0%) |
| Total (Overall) | 68 (62.4%) | 41 (37.6%) |
Sales and Office Occupations
The most common Sales and Office occupations in Quinby are , and Office & Administration (6 | 5.5%).
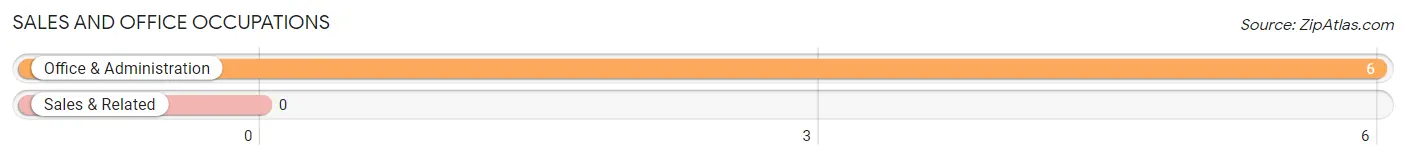
Sales and Office Occupations by Sex
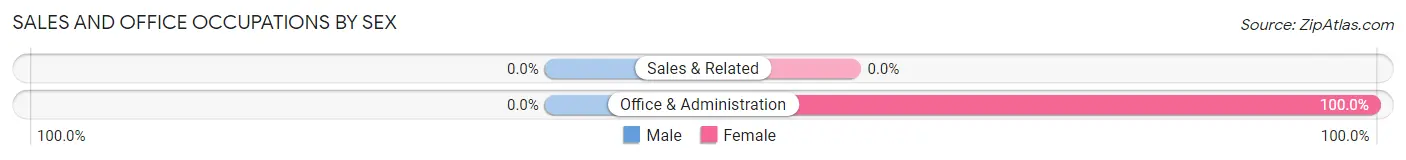
| Occupation | Male | Female |
| Sales & Related | 0 (0.0%) | 0 (0.0%) |
| Office & Administration | 0 (0.0%) | 6 (100.0%) |
| Total (Category) | 0 (0.0%) | 6 (100.0%) |
| Total (Overall) | 68 (62.4%) | 41 (37.6%) |
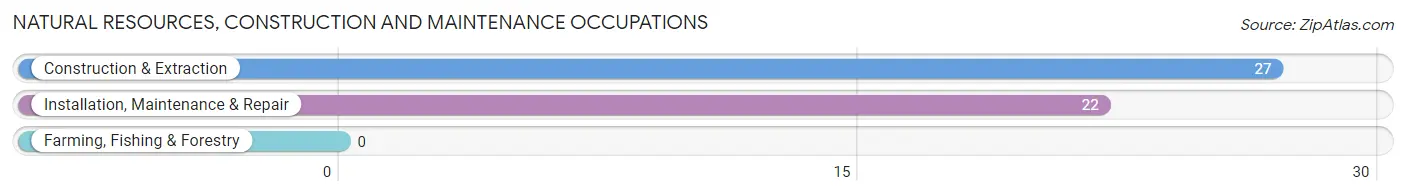
Natural Resources, Construction and Maintenance Occupations
The most common Natural Resources, Construction and Maintenance occupations in Quinby are Construction & Extraction (27 | 24.8%), and Installation, Maintenance & Repair (22 | 20.2%).
Natural Resources, Construction and Maintenance Occupations by Sex
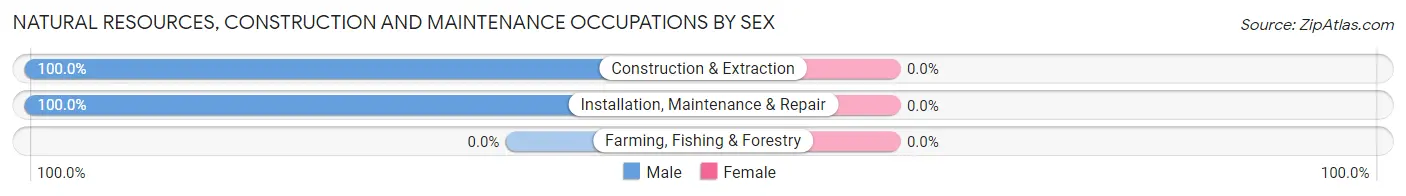
| Occupation | Male | Female |
| Farming, Fishing & Forestry | 0 (0.0%) | 0 (0.0%) |
| Construction & Extraction | 27 (100.0%) | 0 (0.0%) |
| Installation, Maintenance & Repair | 22 (100.0%) | 0 (0.0%) |
| Total (Category) | 49 (100.0%) | 0 (0.0%) |
| Total (Overall) | 68 (62.4%) | 41 (37.6%) |
Production, Transportation and Moving Occupations
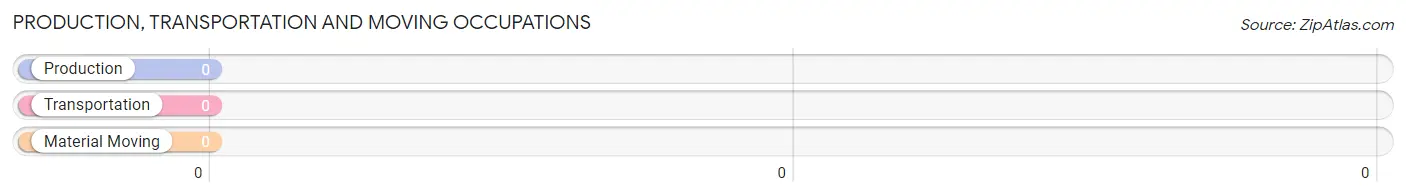
Production, Transportation and Moving Occupations by Sex
| Occupation | Male | Female |
| Production | 0 (0.0%) | 0 (0.0%) |
| Transportation | 0 (0.0%) | 0 (0.0%) |
| Material Moving | 0 (0.0%) | 0 (0.0%) |
| Total (Category) | 0 (0.0%) | 0 (0.0%) |
| Total (Overall) | 68 (62.4%) | 41 (37.6%) |
Employment Industries by Sex in Quinby
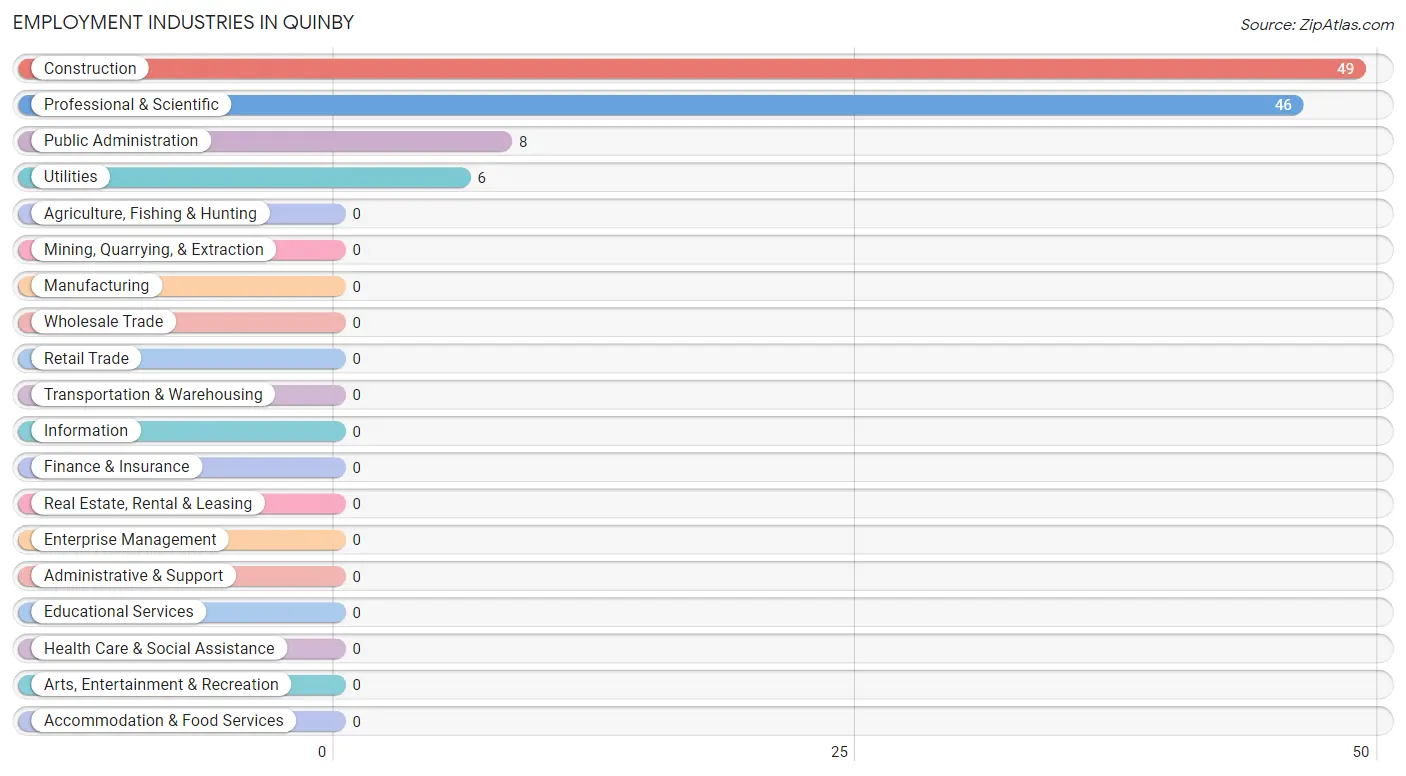
Employment Industries in Quinby
The major employment industries in Quinby include Construction (49 | 45.0%), Professional & Scientific (46 | 42.2%), Public Administration (8 | 7.3%), and Utilities (6 | 5.5%).
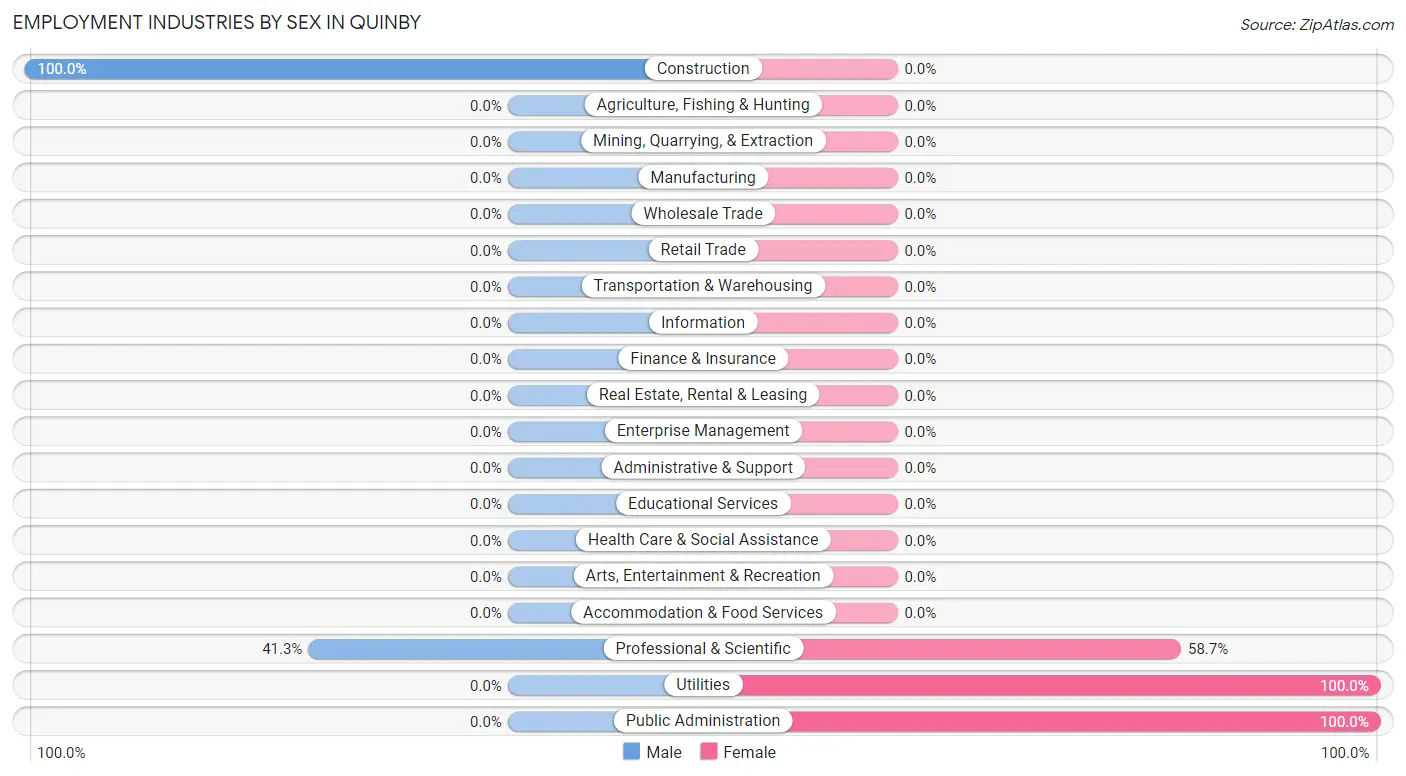
Employment Industries by Sex in Quinby
The Quinby industries that see more men than women are Construction (100.0%), and Professional & Scientific (41.3%), whereas the industries that tend to have a higher number of women are Utilities (100.0%), Public Administration (100.0%), and Professional & Scientific (58.7%).
| Industry | Male | Female |
| Agriculture, Fishing & Hunting | 0 (0.0%) | 0 (0.0%) |
| Mining, Quarrying, & Extraction | 0 (0.0%) | 0 (0.0%) |
| Construction | 49 (100.0%) | 0 (0.0%) |
| Manufacturing | 0 (0.0%) | 0 (0.0%) |
| Wholesale Trade | 0 (0.0%) | 0 (0.0%) |
| Retail Trade | 0 (0.0%) | 0 (0.0%) |
| Transportation & Warehousing | 0 (0.0%) | 0 (0.0%) |
| Utilities | 0 (0.0%) | 6 (100.0%) |
| Information | 0 (0.0%) | 0 (0.0%) |
| Finance & Insurance | 0 (0.0%) | 0 (0.0%) |
| Real Estate, Rental & Leasing | 0 (0.0%) | 0 (0.0%) |
| Professional & Scientific | 19 (41.3%) | 27 (58.7%) |
| Enterprise Management | 0 (0.0%) | 0 (0.0%) |
| Administrative & Support | 0 (0.0%) | 0 (0.0%) |
| Educational Services | 0 (0.0%) | 0 (0.0%) |
| Health Care & Social Assistance | 0 (0.0%) | 0 (0.0%) |
| Arts, Entertainment & Recreation | 0 (0.0%) | 0 (0.0%) |
| Accommodation & Food Services | 0 (0.0%) | 0 (0.0%) |
| Public Administration | 0 (0.0%) | 8 (100.0%) |
| Total | 68 (62.4%) | 41 (37.6%) |
Education in Quinby
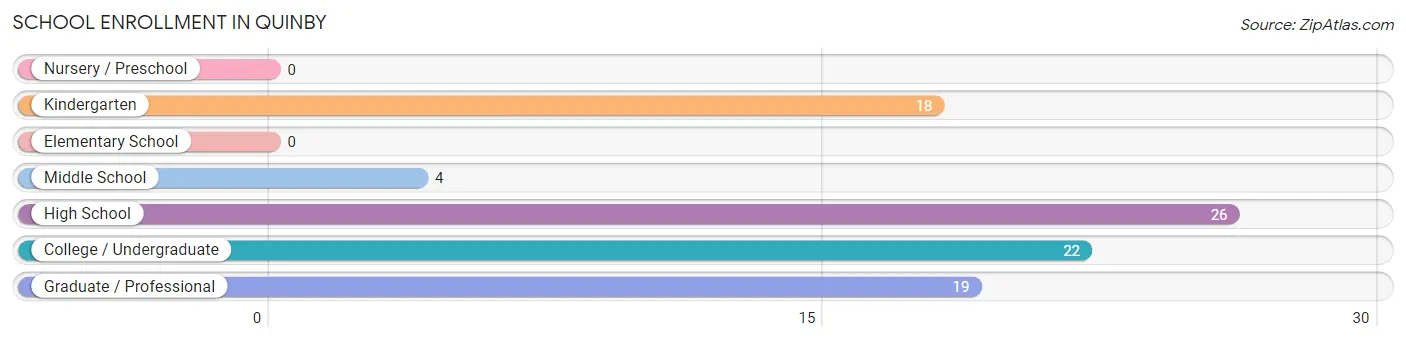
School Enrollment in Quinby
The most common levels of schooling among the 89 students in Quinby are high school (26 | 29.2%), college / undergraduate (22 | 24.7%), and graduate / professional (19 | 21.3%).
| School Level | # Students | % Students |
| Nursery / Preschool | 0 | 0.0% |
| Kindergarten | 18 | 20.2% |
| Elementary School | 0 | 0.0% |
| Middle School | 4 | 4.5% |
| High School | 26 | 29.2% |
| College / Undergraduate | 22 | 24.7% |
| Graduate / Professional | 19 | 21.3% |
| Total | 89 | 100.0% |
School Enrollment by Age by Funding Source in Quinby
Out of a total of 89 students who are enrolled in schools in Quinby, 19 (21.3%) attend a private institution, while the remaining 70 (78.7%) are enrolled in public schools. The age group of 25 to 34 year olds has the highest likelihood of being enrolled in private schools, with 19 (100.0% in the age bracket) enrolled. Conversely, the age group of 3 to 4 year olds has the lowest likelihood of being enrolled in a private school, with 18 (100.0% in the age bracket) attending a public institution.
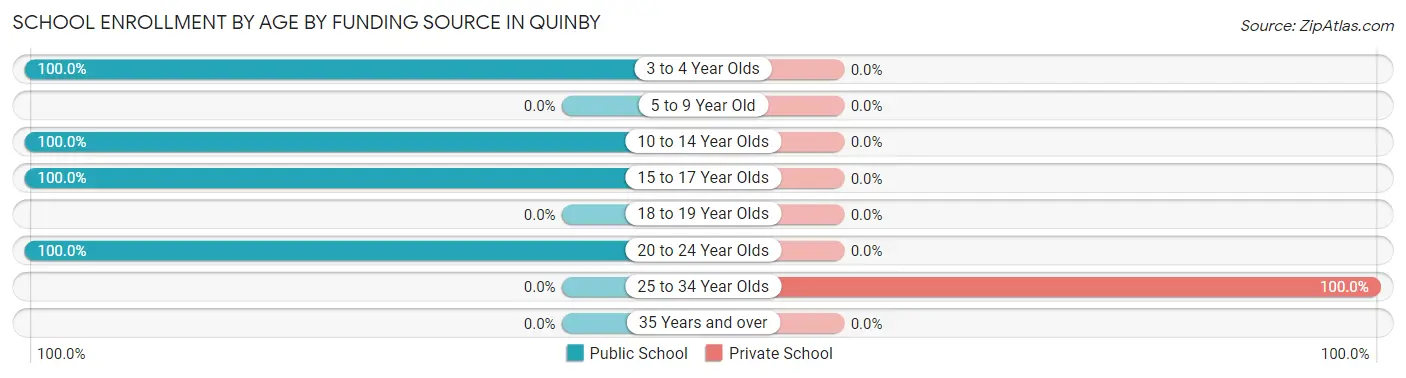
| Age Bracket | Public School | Private School |
| 3 to 4 Year Olds | 18 (100.0%) | 0 (0.0%) |
| 5 to 9 Year Old | 0 (0.0%) | 0 (0.0%) |
| 10 to 14 Year Olds | 4 (100.0%) | 0 (0.0%) |
| 15 to 17 Year Olds | 26 (100.0%) | 0 (0.0%) |
| 18 to 19 Year Olds | 0 (0.0%) | 0 (0.0%) |
| 20 to 24 Year Olds | 22 (100.0%) | 0 (0.0%) |
| 25 to 34 Year Olds | 0 (0.0%) | 19 (100.0%) |
| 35 Years and over | 0 (0.0%) | 0 (0.0%) |
| Total | 70 (78.7%) | 19 (21.3%) |
Educational Attainment by Field of Study in Quinby
Liberal arts & history (29 | 24.6%), business (27 | 22.9%), literature & languages (23 | 19.5%), computers & mathematics (19 | 16.1%), and psychology (8 | 6.8%) are the most common fields of study among 118 individuals in Quinby who have obtained a bachelor's degree or higher.
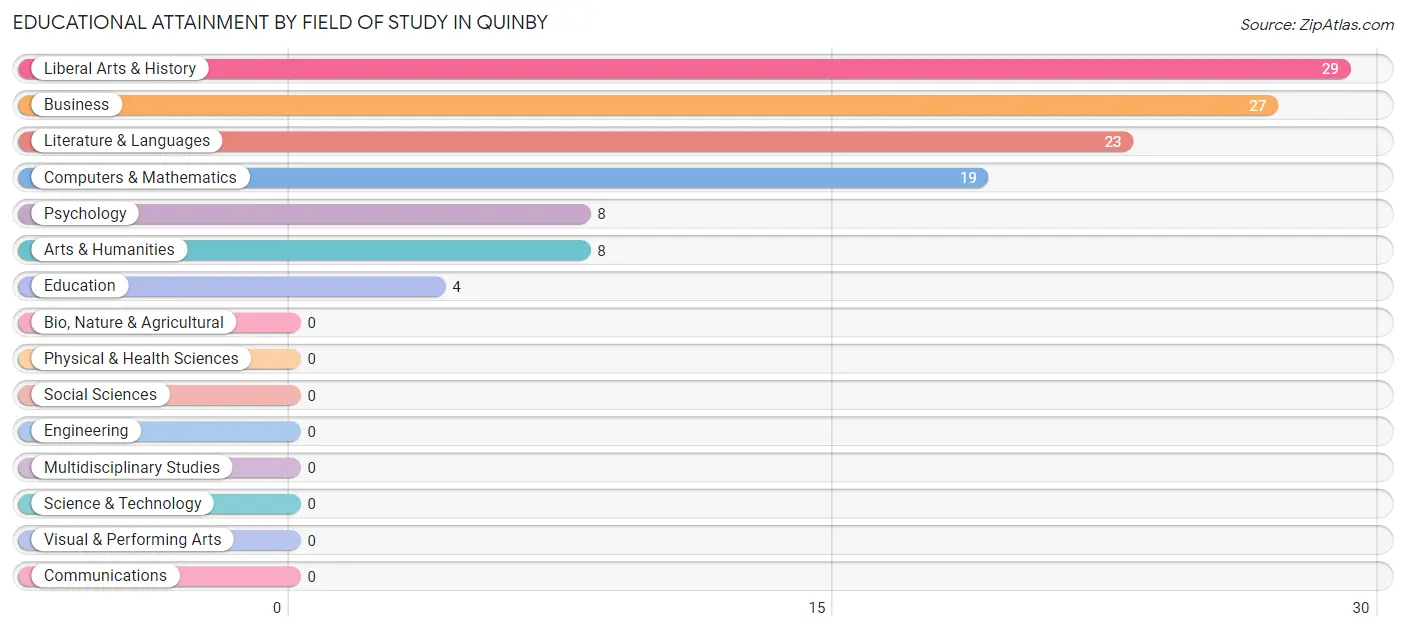
| Field of Study | # Graduates | % Graduates |
| Computers & Mathematics | 19 | 16.1% |
| Bio, Nature & Agricultural | 0 | 0.0% |
| Physical & Health Sciences | 0 | 0.0% |
| Psychology | 8 | 6.8% |
| Social Sciences | 0 | 0.0% |
| Engineering | 0 | 0.0% |
| Multidisciplinary Studies | 0 | 0.0% |
| Science & Technology | 0 | 0.0% |
| Business | 27 | 22.9% |
| Education | 4 | 3.4% |
| Literature & Languages | 23 | 19.5% |
| Liberal Arts & History | 29 | 24.6% |
| Visual & Performing Arts | 0 | 0.0% |
| Communications | 0 | 0.0% |
| Arts & Humanities | 8 | 6.8% |
| Total | 118 | 100.0% |
Transportation & Commute in Quinby
Vehicle Availability by Sex in Quinby
The most prevalent vehicle ownership categories in Quinby are males with 2 vehicles (27, accounting for 39.7%) and females with 2 vehicles (8, making up 65.8%).
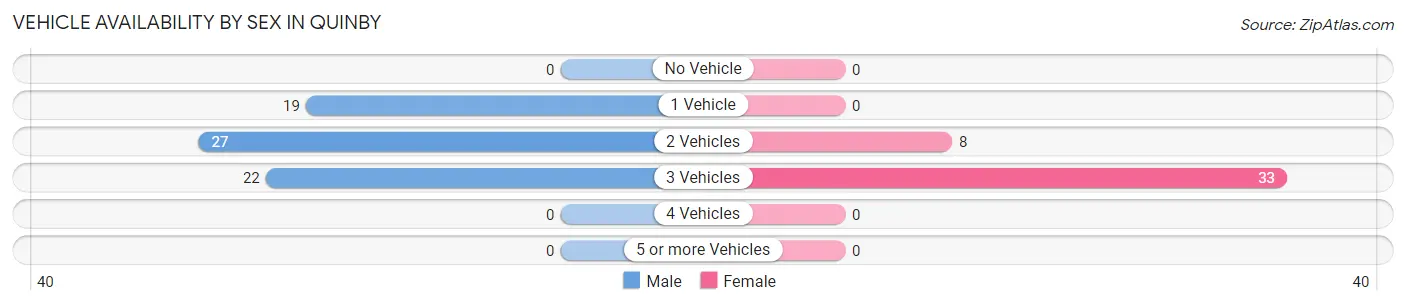
| Vehicles Available | Male | Female |
| No Vehicle | 0 (0.0%) | 0 (0.0%) |
| 1 Vehicle | 19 (27.9%) | 0 (0.0%) |
| 2 Vehicles | 27 (39.7%) | 8 (19.5%) |
| 3 Vehicles | 22 (32.4%) | 33 (80.5%) |
| 4 Vehicles | 0 (0.0%) | 0 (0.0%) |
| 5 or more Vehicles | 0 (0.0%) | 0 (0.0%) |
| Total | 68 (100.0%) | 41 (100.0%) |
Commute Time in Quinby
The most frequently occuring commute durations in Quinby are 10 to 14 minutes (30 commuters, 27.5%), 20 to 24 minutes (27 commuters, 24.8%), and 15 to 19 minutes (22 commuters, 20.2%).
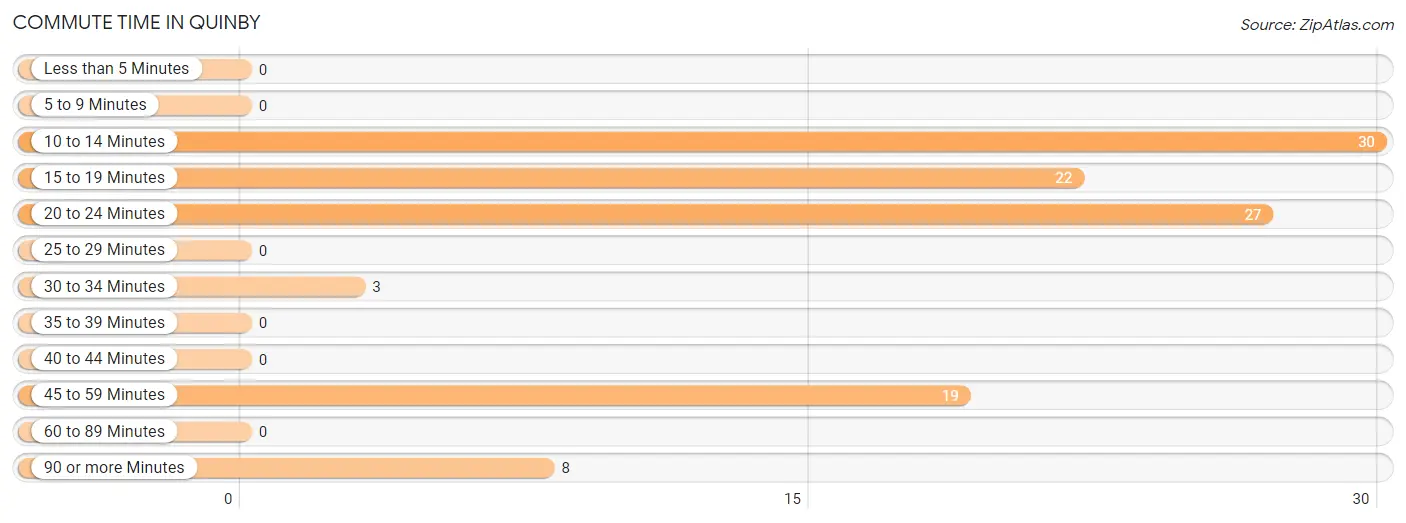
| Commute Time | # Commuters | % Commuters |
| Less than 5 Minutes | 0 | 0.0% |
| 5 to 9 Minutes | 0 | 0.0% |
| 10 to 14 Minutes | 30 | 27.5% |
| 15 to 19 Minutes | 22 | 20.2% |
| 20 to 24 Minutes | 27 | 24.8% |
| 25 to 29 Minutes | 0 | 0.0% |
| 30 to 34 Minutes | 3 | 2.8% |
| 35 to 39 Minutes | 0 | 0.0% |
| 40 to 44 Minutes | 0 | 0.0% |
| 45 to 59 Minutes | 19 | 17.4% |
| 60 to 89 Minutes | 0 | 0.0% |
| 90 or more Minutes | 8 | 7.3% |
Commute Time by Sex in Quinby
The most common commute times in Quinby are 10 to 14 minutes (24 commuters, 35.3%) for males and 20 to 24 minutes (27 commuters, 65.8%) for females.
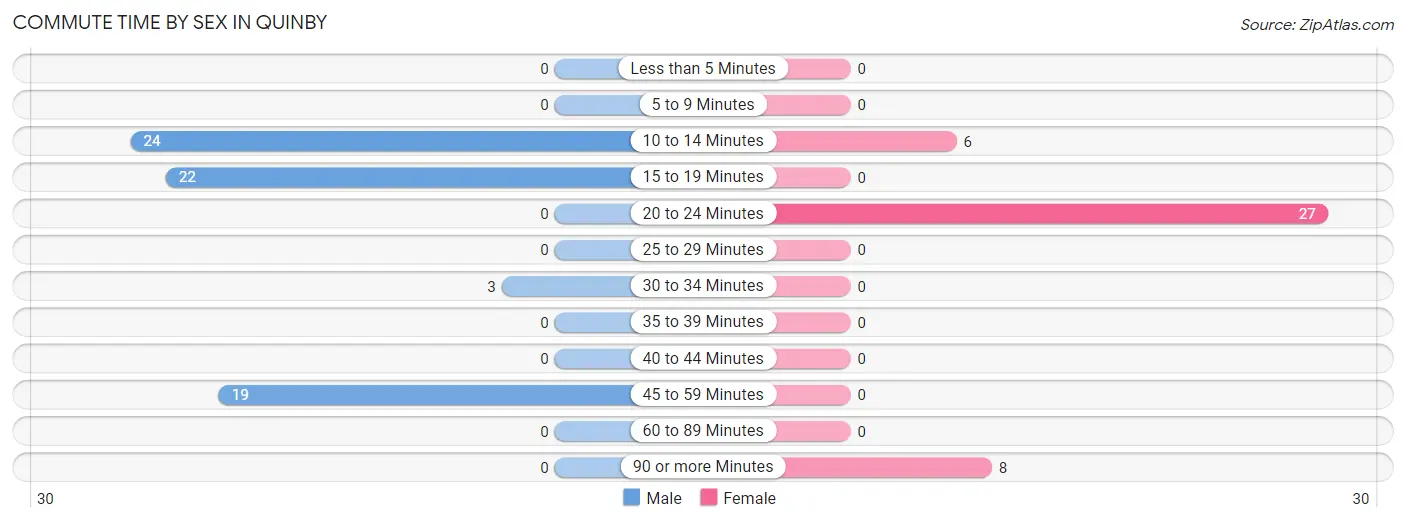
| Commute Time | Male | Female |
| Less than 5 Minutes | 0 (0.0%) | 0 (0.0%) |
| 5 to 9 Minutes | 0 (0.0%) | 0 (0.0%) |
| 10 to 14 Minutes | 24 (35.3%) | 6 (14.6%) |
| 15 to 19 Minutes | 22 (32.4%) | 0 (0.0%) |
| 20 to 24 Minutes | 0 (0.0%) | 27 (65.8%) |
| 25 to 29 Minutes | 0 (0.0%) | 0 (0.0%) |
| 30 to 34 Minutes | 3 (4.4%) | 0 (0.0%) |
| 35 to 39 Minutes | 0 (0.0%) | 0 (0.0%) |
| 40 to 44 Minutes | 0 (0.0%) | 0 (0.0%) |
| 45 to 59 Minutes | 19 (27.9%) | 0 (0.0%) |
| 60 to 89 Minutes | 0 (0.0%) | 0 (0.0%) |
| 90 or more Minutes | 0 (0.0%) | 8 (19.5%) |
Time of Departure to Work by Sex in Quinby
The most frequent times of departure to work in Quinby are 7:00 AM to 7:29 AM (41, 60.3%) for males and 8:00 AM to 8:29 AM (27, 65.8%) for females.
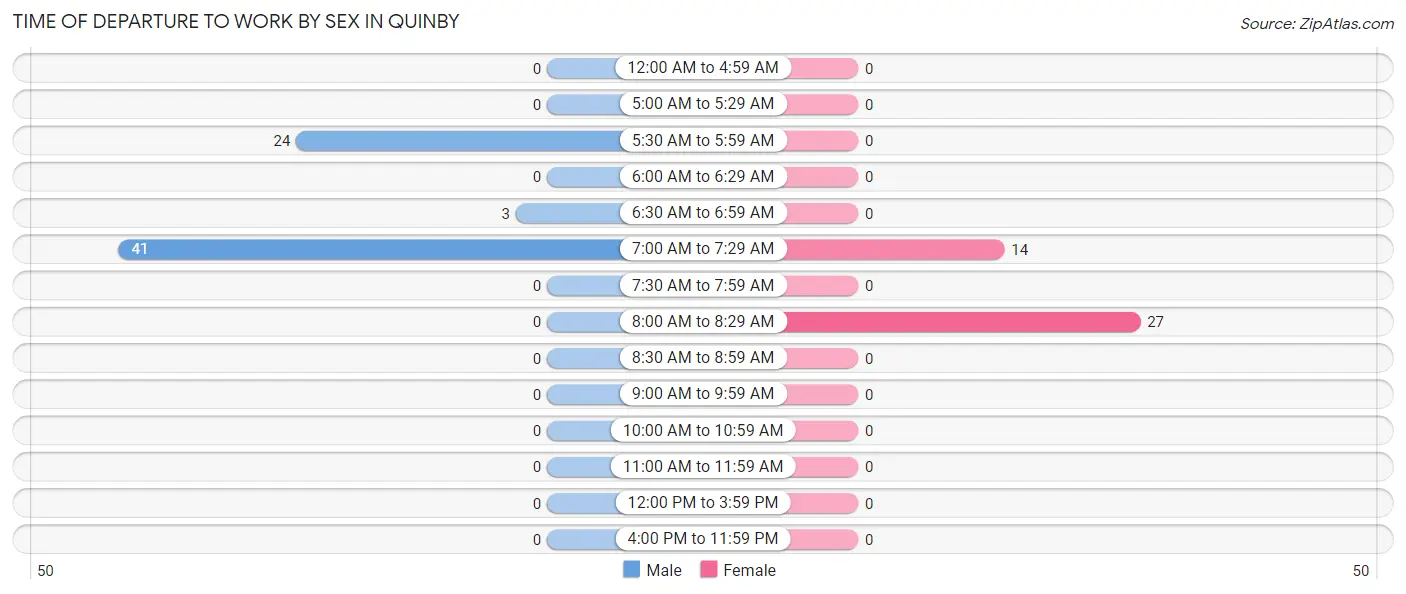
| Time of Departure | Male | Female |
| 12:00 AM to 4:59 AM | 0 (0.0%) | 0 (0.0%) |
| 5:00 AM to 5:29 AM | 0 (0.0%) | 0 (0.0%) |
| 5:30 AM to 5:59 AM | 24 (35.3%) | 0 (0.0%) |
| 6:00 AM to 6:29 AM | 0 (0.0%) | 0 (0.0%) |
| 6:30 AM to 6:59 AM | 3 (4.4%) | 0 (0.0%) |
| 7:00 AM to 7:29 AM | 41 (60.3%) | 14 (34.2%) |
| 7:30 AM to 7:59 AM | 0 (0.0%) | 0 (0.0%) |
| 8:00 AM to 8:29 AM | 0 (0.0%) | 27 (65.8%) |
| 8:30 AM to 8:59 AM | 0 (0.0%) | 0 (0.0%) |
| 9:00 AM to 9:59 AM | 0 (0.0%) | 0 (0.0%) |
| 10:00 AM to 10:59 AM | 0 (0.0%) | 0 (0.0%) |
| 11:00 AM to 11:59 AM | 0 (0.0%) | 0 (0.0%) |
| 12:00 PM to 3:59 PM | 0 (0.0%) | 0 (0.0%) |
| 4:00 PM to 11:59 PM | 0 (0.0%) | 0 (0.0%) |
| Total | 68 (100.0%) | 41 (100.0%) |
Housing Occupancy in Quinby
Occupancy by Ownership in Quinby
Of the total 137 dwellings in Quinby, owner-occupied units account for 100 (73.0%), while renter-occupied units make up 37 (27.0%).
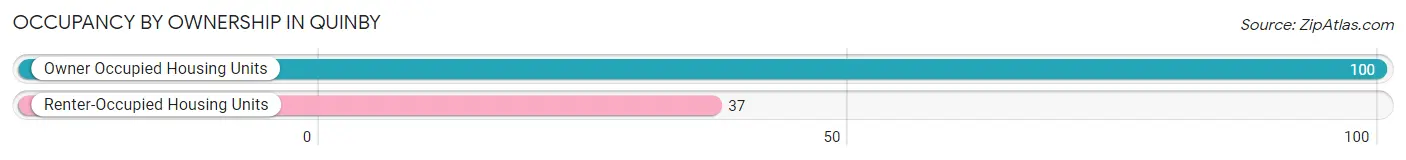
| Occupancy | # Housing Units | % Housing Units |
| Owner Occupied Housing Units | 100 | 73.0% |
| Renter-Occupied Housing Units | 37 | 27.0% |
| Total Occupied Housing Units | 137 | 100.0% |
Occupancy by Household Size in Quinby
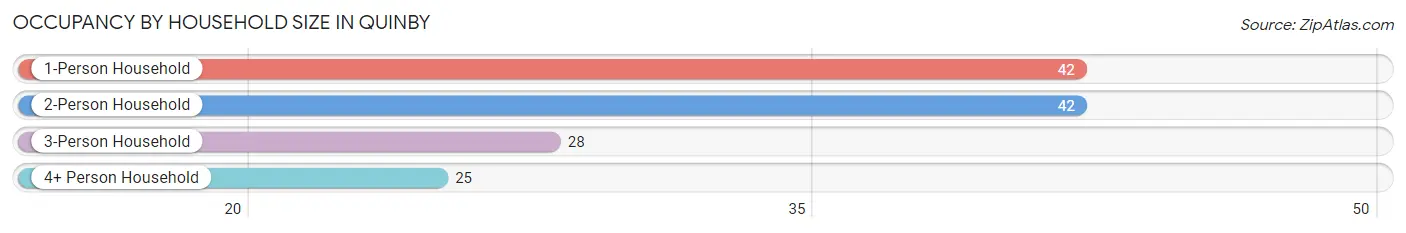
| Household Size | # Housing Units | % Housing Units |
| 1-Person Household | 42 | 30.7% |
| 2-Person Household | 42 | 30.7% |
| 3-Person Household | 28 | 20.4% |
| 4+ Person Household | 25 | 18.2% |
| Total Housing Units | 137 | 100.0% |
Occupancy by Ownership by Household Size in Quinby
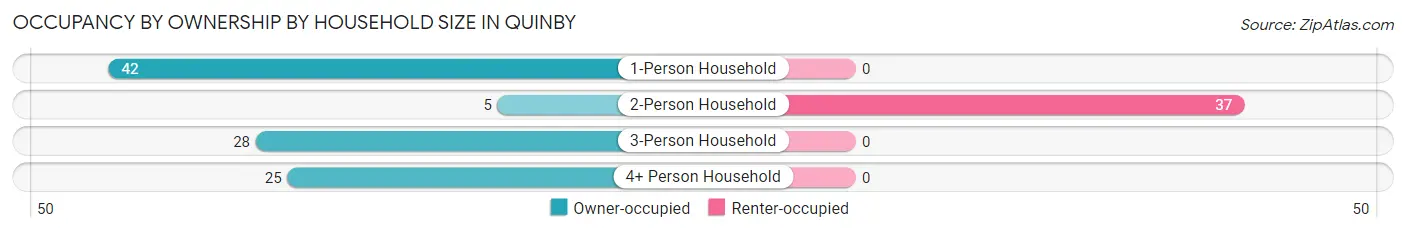
| Household Size | Owner-occupied | Renter-occupied |
| 1-Person Household | 42 (100.0%) | 0 (0.0%) |
| 2-Person Household | 5 (11.9%) | 37 (88.1%) |
| 3-Person Household | 28 (100.0%) | 0 (0.0%) |
| 4+ Person Household | 25 (100.0%) | 0 (0.0%) |
| Total Housing Units | 100 (73.0%) | 37 (27.0%) |
Occupancy by Educational Attainment in Quinby
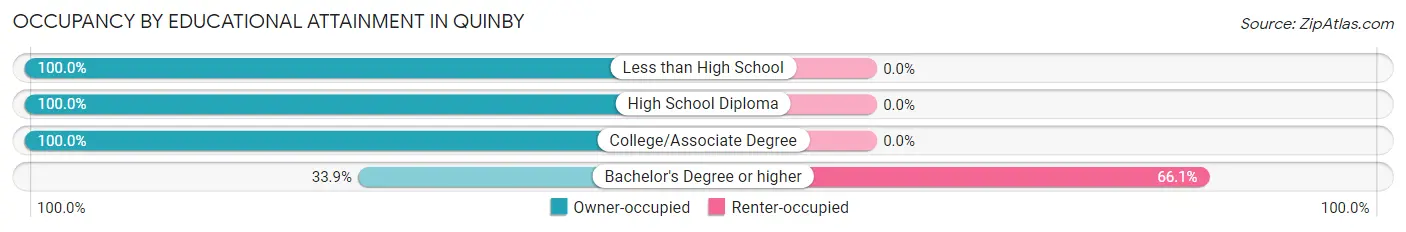
| Household Size | Owner-occupied | Renter-occupied |
| Less than High School | 30 (100.0%) | 0 (0.0%) |
| High School Diploma | 20 (100.0%) | 0 (0.0%) |
| College/Associate Degree | 31 (100.0%) | 0 (0.0%) |
| Bachelor's Degree or higher | 19 (33.9%) | 37 (66.1%) |
Occupancy by Age of Householder in Quinby
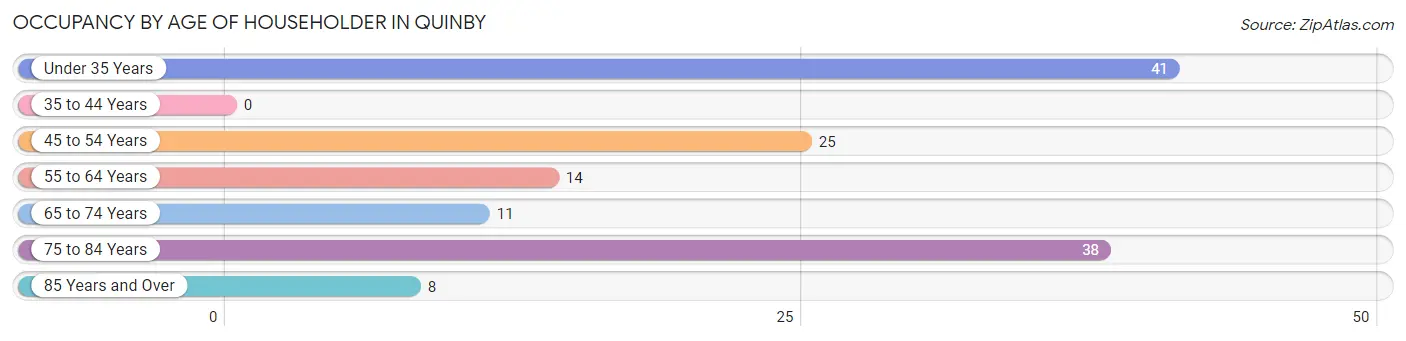
| Age Bracket | # Households | % Households |
| Under 35 Years | 41 | 29.9% |
| 35 to 44 Years | 0 | 0.0% |
| 45 to 54 Years | 25 | 18.2% |
| 55 to 64 Years | 14 | 10.2% |
| 65 to 74 Years | 11 | 8.0% |
| 75 to 84 Years | 38 | 27.7% |
| 85 Years and Over | 8 | 5.8% |
| Total | 137 | 100.0% |
Housing Finances in Quinby
Median Income by Occupancy in Quinby
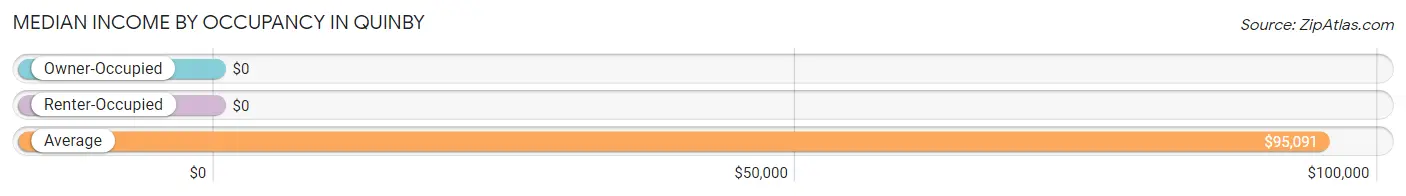
| Occupancy Type | # Households | Median Income |
| Owner-Occupied | 100 (73.0%) | $0 |
| Renter-Occupied | 37 (27.0%) | $0 |
| Average | 137 (100.0%) | $95,091 |
Occupancy by Householder Income Bracket in Quinby
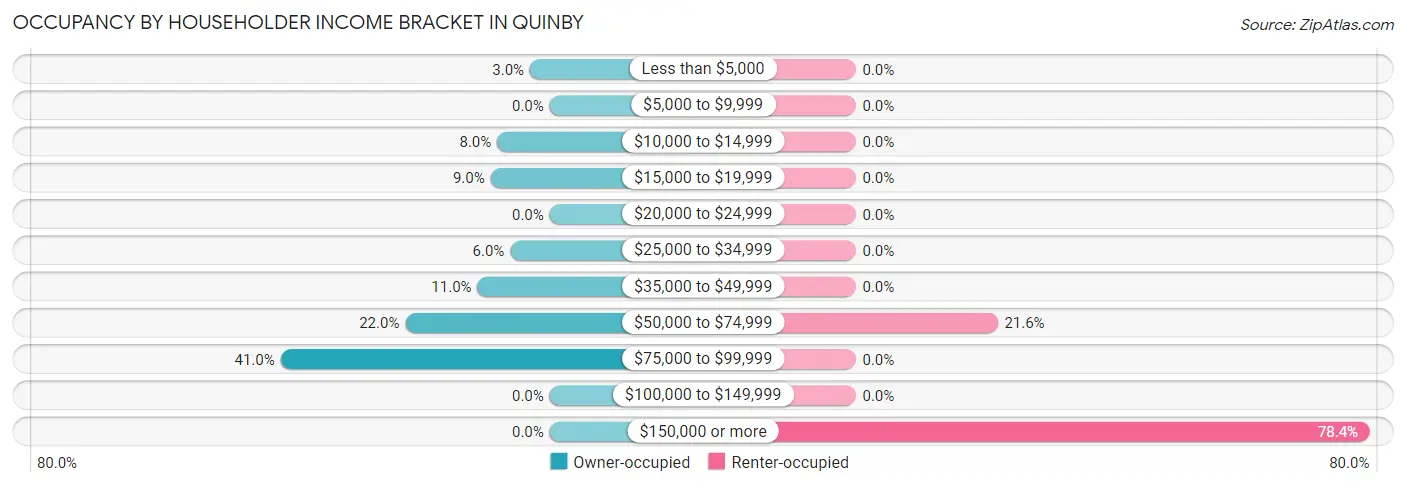
| Income Bracket | Owner-occupied | Renter-occupied |
| Less than $5,000 | 3 (3.0%) | 0 (0.0%) |
| $5,000 to $9,999 | 0 (0.0%) | 0 (0.0%) |
| $10,000 to $14,999 | 8 (8.0%) | 0 (0.0%) |
| $15,000 to $19,999 | 9 (9.0%) | 0 (0.0%) |
| $20,000 to $24,999 | 0 (0.0%) | 0 (0.0%) |
| $25,000 to $34,999 | 6 (6.0%) | 0 (0.0%) |
| $35,000 to $49,999 | 11 (11.0%) | 0 (0.0%) |
| $50,000 to $74,999 | 22 (22.0%) | 8 (21.6%) |
| $75,000 to $99,999 | 41 (41.0%) | 0 (0.0%) |
| $100,000 to $149,999 | 0 (0.0%) | 0 (0.0%) |
| $150,000 or more | 0 (0.0%) | 29 (78.4%) |
| Total | 100 (100.0%) | 37 (100.0%) |
Monthly Housing Cost Tiers in Quinby
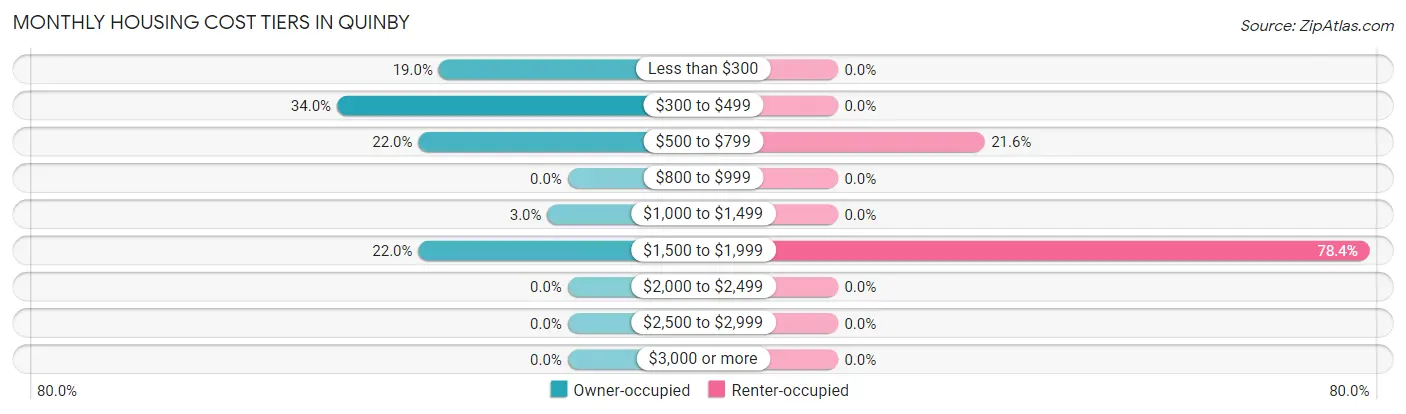
| Monthly Cost | Owner-occupied | Renter-occupied |
| Less than $300 | 19 (19.0%) | 0 (0.0%) |
| $300 to $499 | 34 (34.0%) | 0 (0.0%) |
| $500 to $799 | 22 (22.0%) | 8 (21.6%) |
| $800 to $999 | 0 (0.0%) | 0 (0.0%) |
| $1,000 to $1,499 | 3 (3.0%) | 0 (0.0%) |
| $1,500 to $1,999 | 22 (22.0%) | 29 (78.4%) |
| $2,000 to $2,499 | 0 (0.0%) | 0 (0.0%) |
| $2,500 to $2,999 | 0 (0.0%) | 0 (0.0%) |
| $3,000 or more | 0 (0.0%) | 0 (0.0%) |
| Total | 100 (100.0%) | 37 (100.0%) |
Physical Housing Characteristics in Quinby
Housing Structures in Quinby
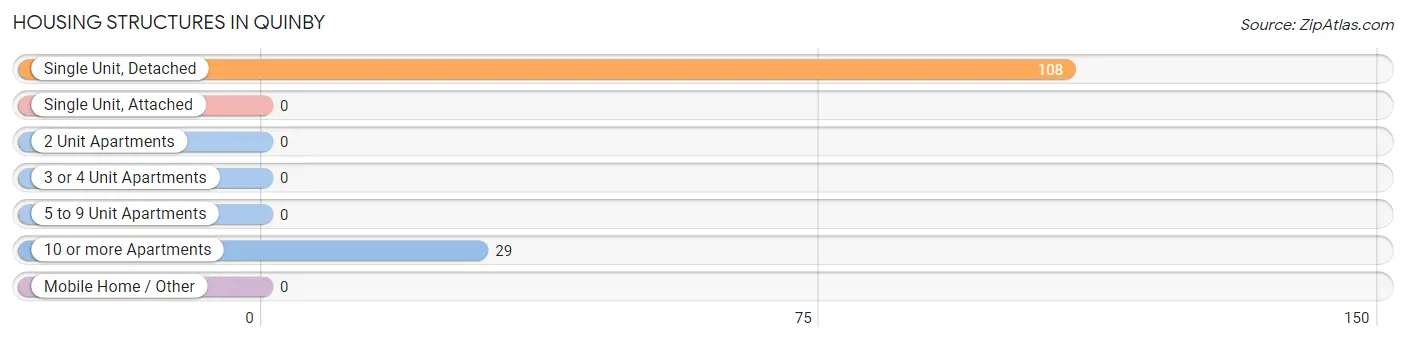
| Structure Type | # Housing Units | % Housing Units |
| Single Unit, Detached | 108 | 78.8% |
| Single Unit, Attached | 0 | 0.0% |
| 2 Unit Apartments | 0 | 0.0% |
| 3 or 4 Unit Apartments | 0 | 0.0% |
| 5 to 9 Unit Apartments | 0 | 0.0% |
| 10 or more Apartments | 29 | 21.2% |
| Mobile Home / Other | 0 | 0.0% |
| Total | 137 | 100.0% |
Housing Structures by Occupancy in Quinby
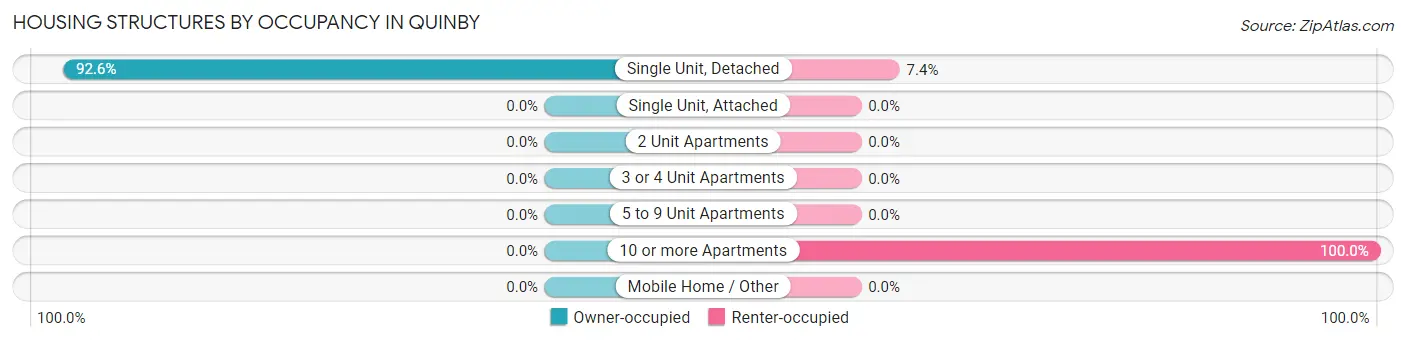
| Structure Type | Owner-occupied | Renter-occupied |
| Single Unit, Detached | 100 (92.6%) | 8 (7.4%) |
| Single Unit, Attached | 0 (0.0%) | 0 (0.0%) |
| 2 Unit Apartments | 0 (0.0%) | 0 (0.0%) |
| 3 or 4 Unit Apartments | 0 (0.0%) | 0 (0.0%) |
| 5 to 9 Unit Apartments | 0 (0.0%) | 0 (0.0%) |
| 10 or more Apartments | 0 (0.0%) | 29 (100.0%) |
| Mobile Home / Other | 0 (0.0%) | 0 (0.0%) |
| Total | 100 (73.0%) | 37 (27.0%) |
Housing Structures by Number of Rooms in Quinby
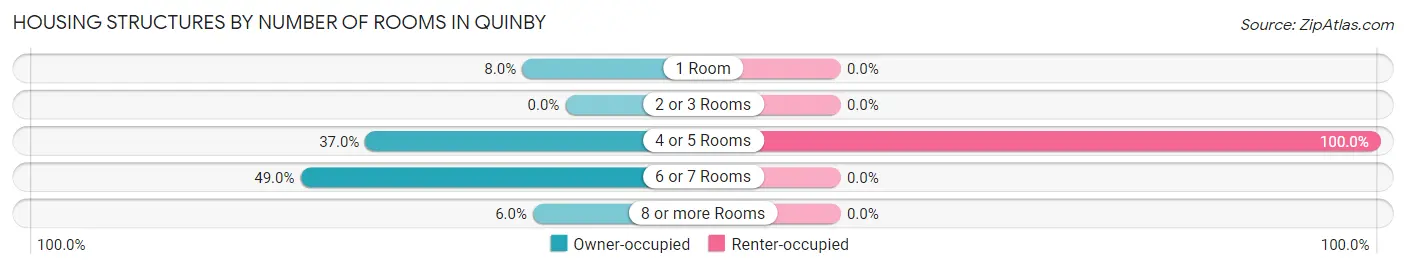
| Number of Rooms | Owner-occupied | Renter-occupied |
| 1 Room | 8 (8.0%) | 0 (0.0%) |
| 2 or 3 Rooms | 0 (0.0%) | 0 (0.0%) |
| 4 or 5 Rooms | 37 (37.0%) | 37 (100.0%) |
| 6 or 7 Rooms | 49 (49.0%) | 0 (0.0%) |
| 8 or more Rooms | 6 (6.0%) | 0 (0.0%) |
| Total | 100 (100.0%) | 37 (100.0%) |
Housing Structure by Heating Type in Quinby
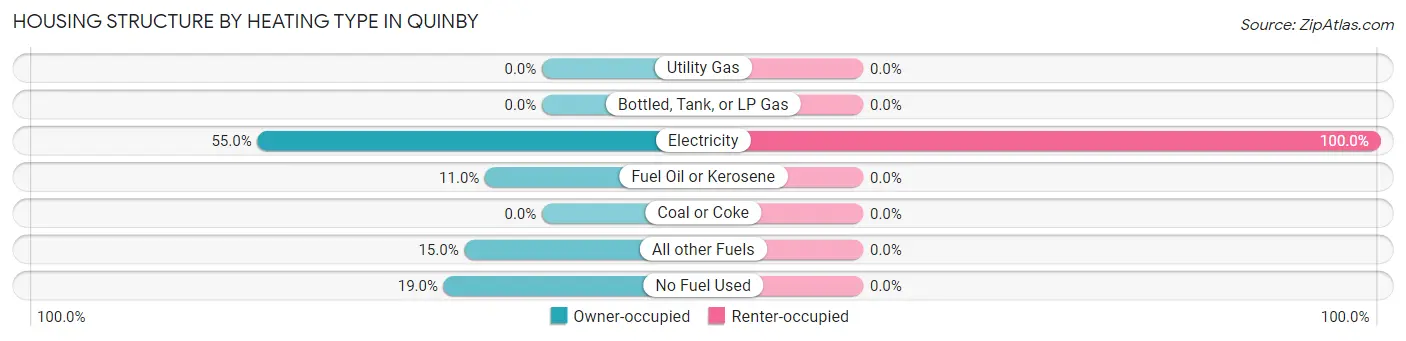
| Heating Type | Owner-occupied | Renter-occupied |
| Utility Gas | 0 (0.0%) | 0 (0.0%) |
| Bottled, Tank, or LP Gas | 0 (0.0%) | 0 (0.0%) |
| Electricity | 55 (55.0%) | 37 (100.0%) |
| Fuel Oil or Kerosene | 11 (11.0%) | 0 (0.0%) |
| Coal or Coke | 0 (0.0%) | 0 (0.0%) |
| All other Fuels | 15 (15.0%) | 0 (0.0%) |
| No Fuel Used | 19 (19.0%) | 0 (0.0%) |
| Total | 100 (100.0%) | 37 (100.0%) |
Household Vehicle Usage in Quinby
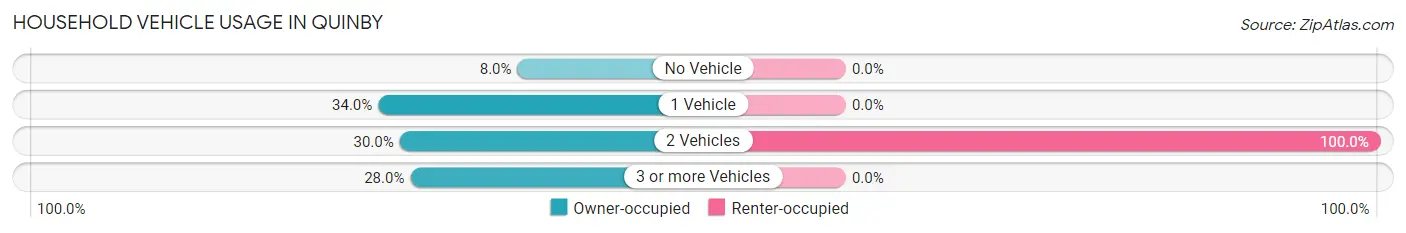
| Vehicles per Household | Owner-occupied | Renter-occupied |
| No Vehicle | 8 (8.0%) | 0 (0.0%) |
| 1 Vehicle | 34 (34.0%) | 0 (0.0%) |
| 2 Vehicles | 30 (30.0%) | 37 (100.0%) |
| 3 or more Vehicles | 28 (28.0%) | 0 (0.0%) |
| Total | 100 (100.0%) | 37 (100.0%) |
Real Estate & Mortgages in Quinby
Real Estate and Mortgage Overview in Quinby
| Characteristic | Without Mortgage | With Mortgage |
| Housing Units | 53 | 47 |
| Median Property Value | - | - |
| Median Household Income | - | - |
| Monthly Housing Costs | $320 | $0 |
| Real Estate Taxes | $394 | $0 |
Property Value by Mortgage Status in Quinby
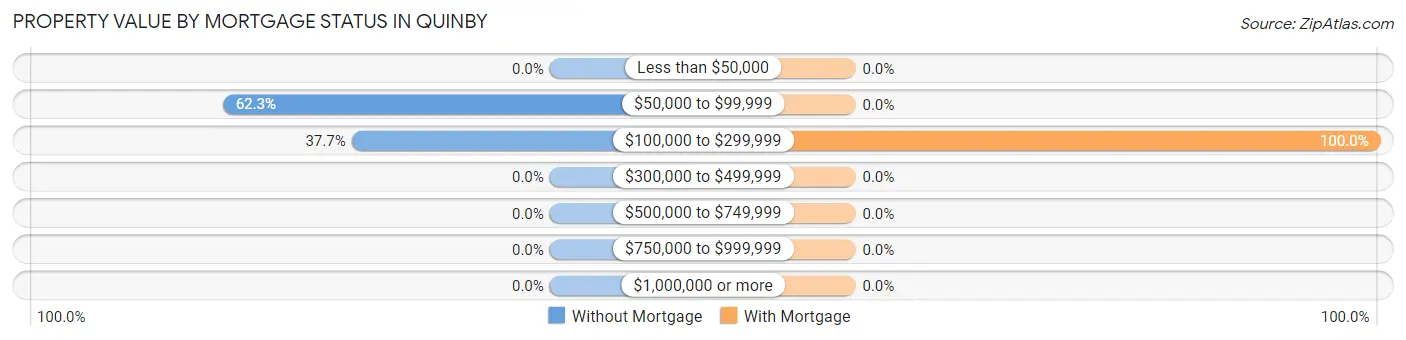
| Property Value | Without Mortgage | With Mortgage |
| Less than $50,000 | 0 (0.0%) | 0 (0.0%) |
| $50,000 to $99,999 | 33 (62.3%) | 0 (0.0%) |
| $100,000 to $299,999 | 20 (37.7%) | 47 (100.0%) |
| $300,000 to $499,999 | 0 (0.0%) | 0 (0.0%) |
| $500,000 to $749,999 | 0 (0.0%) | 0 (0.0%) |
| $750,000 to $999,999 | 0 (0.0%) | 0 (0.0%) |
| $1,000,000 or more | 0 (0.0%) | 0 (0.0%) |
| Total | 53 (100.0%) | 47 (100.0%) |
Household Income by Mortgage Status in Quinby
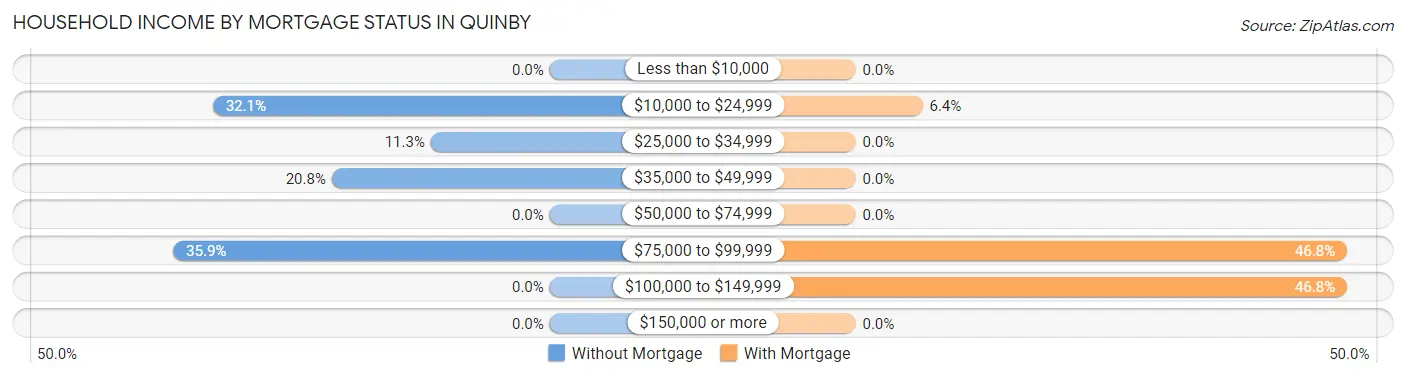
| Household Income | Without Mortgage | With Mortgage |
| Less than $10,000 | 0 (0.0%) | 0 (0.0%) |
| $10,000 to $24,999 | 17 (32.1%) | 3 (6.4%) |
| $25,000 to $34,999 | 6 (11.3%) | 0 (0.0%) |
| $35,000 to $49,999 | 11 (20.7%) | 0 (0.0%) |
| $50,000 to $74,999 | 0 (0.0%) | 0 (0.0%) |
| $75,000 to $99,999 | 19 (35.8%) | 22 (46.8%) |
| $100,000 to $149,999 | 0 (0.0%) | 22 (46.8%) |
| $150,000 or more | 0 (0.0%) | 0 (0.0%) |
| Total | 53 (100.0%) | 47 (100.0%) |
Property Value to Household Income Ratio in Quinby
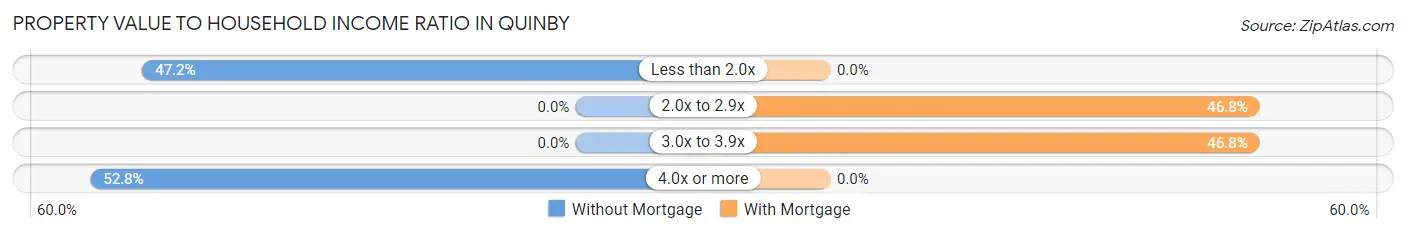
| Value-to-Income Ratio | Without Mortgage | With Mortgage |
| Less than 2.0x | 25 (47.2%) | 0 (0.0%) |
| 2.0x to 2.9x | 0 (0.0%) | 22 (46.8%) |
| 3.0x to 3.9x | 0 (0.0%) | 22 (46.8%) |
| 4.0x or more | 28 (52.8%) | 0 (0.0%) |
| Total | 53 (100.0%) | 47 (100.0%) |
Real Estate Taxes by Mortgage Status in Quinby
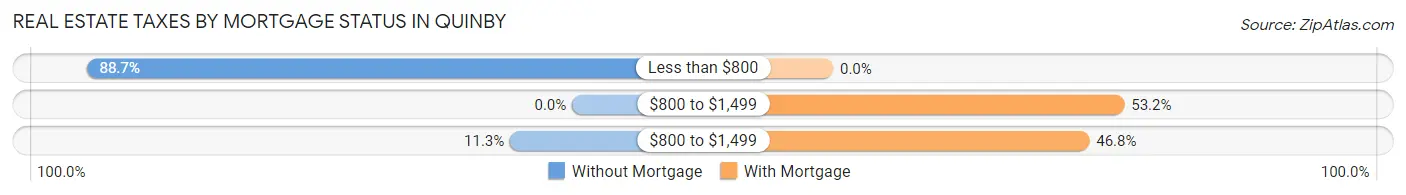
| Property Taxes | Without Mortgage | With Mortgage |
| Less than $800 | 47 (88.7%) | 0 (0.0%) |
| $800 to $1,499 | 0 (0.0%) | 25 (53.2%) |
| $800 to $1,499 | 6 (11.3%) | 22 (46.8%) |
| Total | 53 (100.0%) | 47 (100.0%) |
Health & Disability in Quinby
Health Insurance Coverage by Age in Quinby
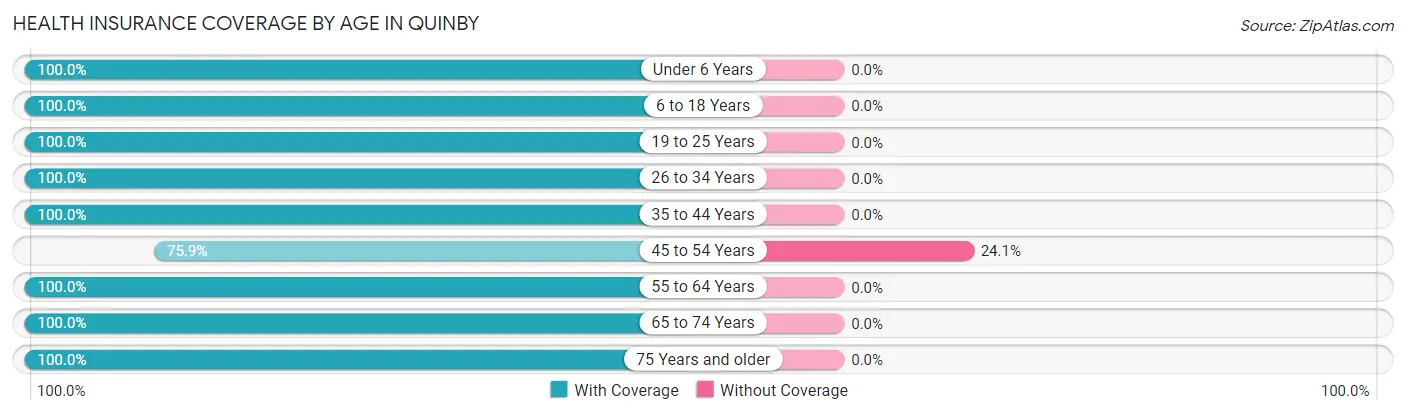
| Age Bracket | With Coverage | Without Coverage |
| Under 6 Years | 27 (100.0%) | 0 (0.0%) |
| 6 to 18 Years | 34 (100.0%) | 0 (0.0%) |
| 19 to 25 Years | 34 (100.0%) | 0 (0.0%) |
| 26 to 34 Years | 43 (100.0%) | 0 (0.0%) |
| 35 to 44 Years | 27 (100.0%) | 0 (0.0%) |
| 45 to 54 Years | 22 (75.9%) | 7 (24.1%) |
| 55 to 64 Years | 14 (100.0%) | 0 (0.0%) |
| 65 to 74 Years | 21 (100.0%) | 0 (0.0%) |
| 75 Years and older | 69 (100.0%) | 0 (0.0%) |
| Total | 291 (97.7%) | 7 (2.4%) |
Health Insurance Coverage by Citizenship Status in Quinby
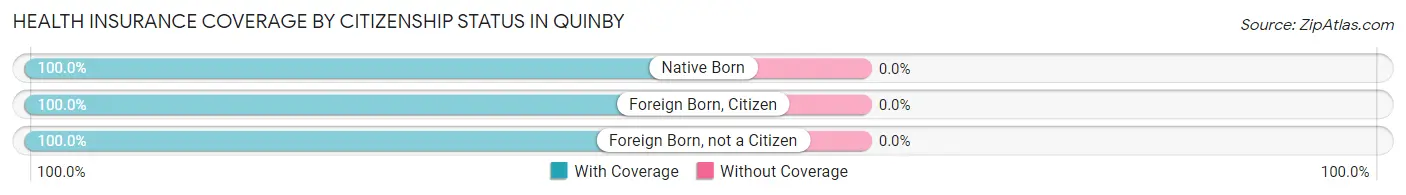
| Citizenship Status | With Coverage | Without Coverage |
| Native Born | 27 (100.0%) | 0 (0.0%) |
| Foreign Born, Citizen | 34 (100.0%) | 0 (0.0%) |
| Foreign Born, not a Citizen | 34 (100.0%) | 0 (0.0%) |
Health Insurance Coverage by Household Income in Quinby
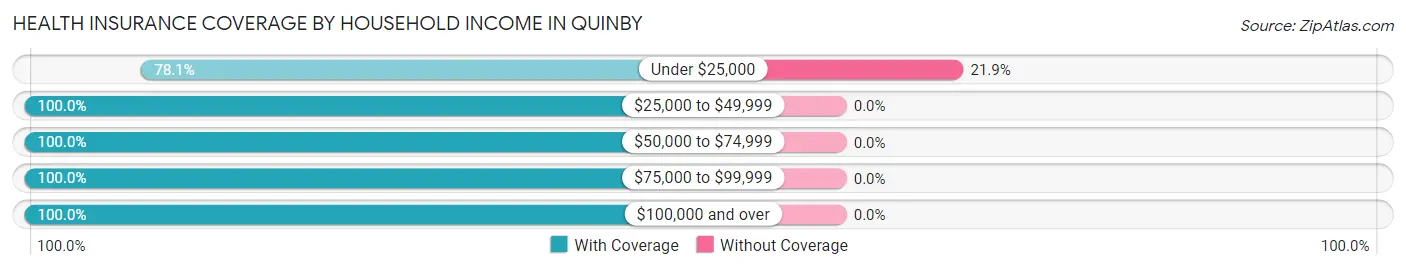
| Household Income | With Coverage | Without Coverage |
| Under $25,000 | 25 (78.1%) | 7 (21.9%) |
| $25,000 to $49,999 | 39 (100.0%) | 0 (0.0%) |
| $50,000 to $74,999 | 69 (100.0%) | 0 (0.0%) |
| $75,000 to $99,999 | 106 (100.0%) | 0 (0.0%) |
| $100,000 and over | 52 (100.0%) | 0 (0.0%) |
Public vs Private Health Insurance Coverage by Age in Quinby
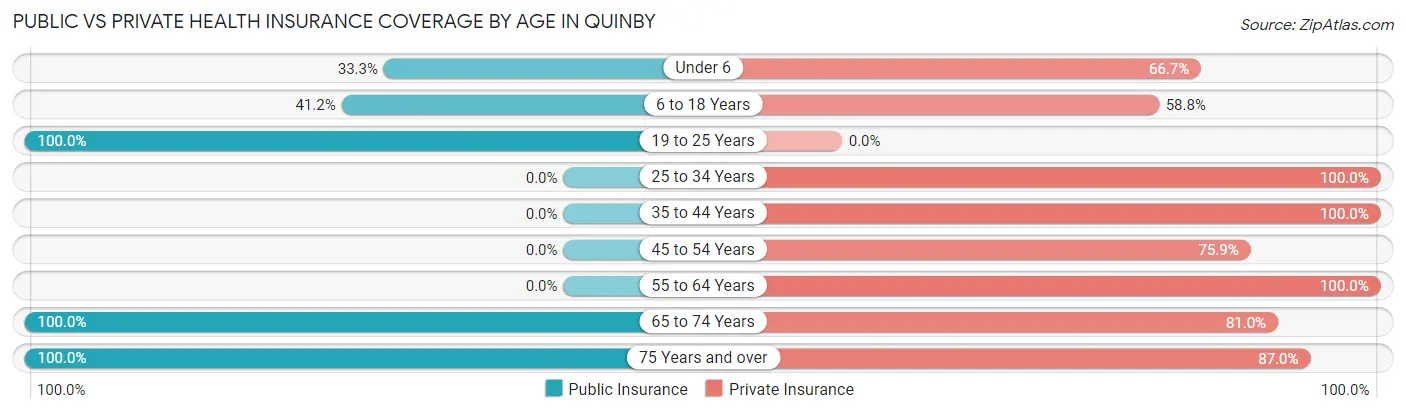
| Age Bracket | Public Insurance | Private Insurance |
| Under 6 | 9 (33.3%) | 18 (66.7%) |
| 6 to 18 Years | 14 (41.2%) | 20 (58.8%) |
| 19 to 25 Years | 34 (100.0%) | 0 (0.0%) |
| 25 to 34 Years | 0 (0.0%) | 43 (100.0%) |
| 35 to 44 Years | 0 (0.0%) | 27 (100.0%) |
| 45 to 54 Years | 0 (0.0%) | 22 (75.9%) |
| 55 to 64 Years | 0 (0.0%) | 14 (100.0%) |
| 65 to 74 Years | 21 (100.0%) | 17 (80.9%) |
| 75 Years and over | 69 (100.0%) | 60 (87.0%) |
| Total | 147 (49.3%) | 221 (74.2%) |
Disability Status by Sex by Age in Quinby
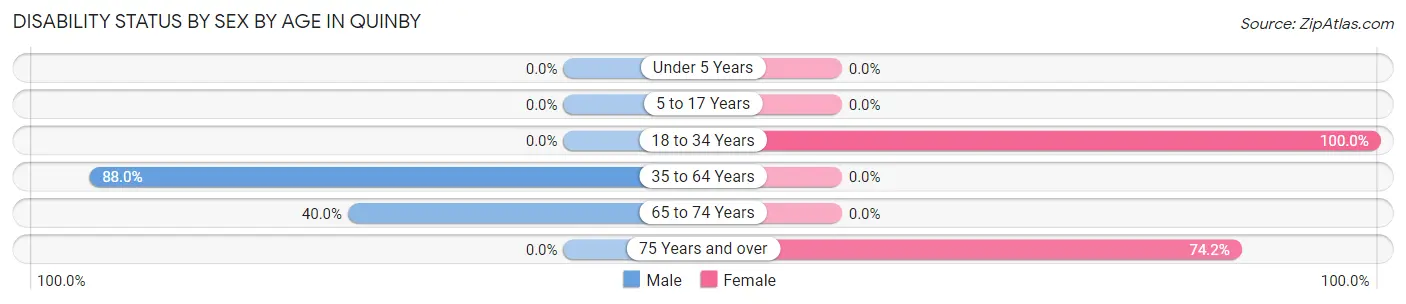
| Age Bracket | Male | Female |
| Under 5 Years | 0 (0.0%) | 0 (0.0%) |
| 5 to 17 Years | 0 (0.0%) | 0 (0.0%) |
| 18 to 34 Years | 0 (0.0%) | 34 (100.0%) |
| 35 to 64 Years | 22 (88.0%) | 0 (0.0%) |
| 65 to 74 Years | 4 (40.0%) | 0 (0.0%) |
| 75 Years and over | 0 (0.0%) | 23 (74.2%) |
Disability Class by Sex by Age in Quinby
Disability Class: Hearing Difficulty
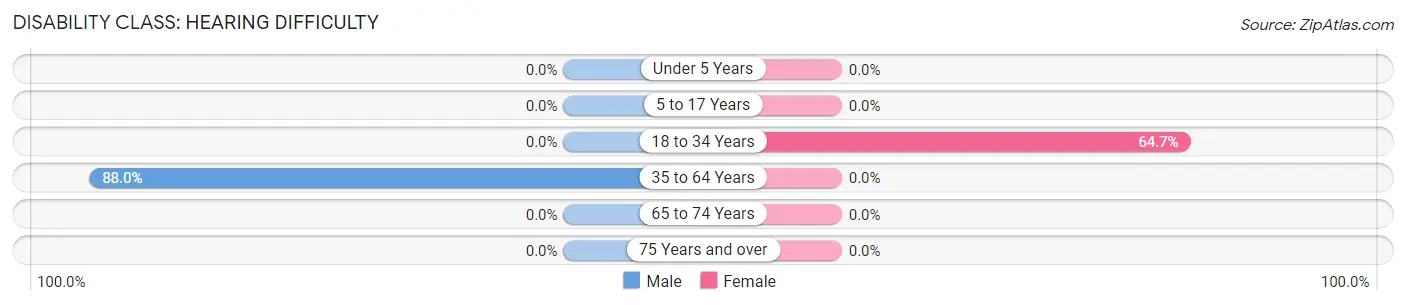
| Age Bracket | Male | Female |
| Under 5 Years | 0 (0.0%) | 0 (0.0%) |
| 5 to 17 Years | 0 (0.0%) | 0 (0.0%) |
| 18 to 34 Years | 0 (0.0%) | 22 (64.7%) |
| 35 to 64 Years | 22 (88.0%) | 0 (0.0%) |
| 65 to 74 Years | 0 (0.0%) | 0 (0.0%) |
| 75 Years and over | 0 (0.0%) | 0 (0.0%) |
Disability Class: Vision Difficulty
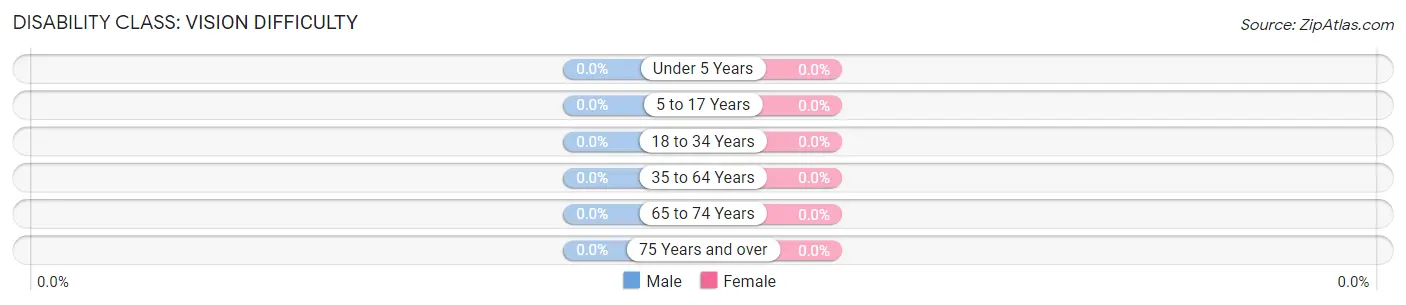
| Age Bracket | Male | Female |
| Under 5 Years | 0 (0.0%) | 0 (0.0%) |
| 5 to 17 Years | 0 (0.0%) | 0 (0.0%) |
| 18 to 34 Years | 0 (0.0%) | 0 (0.0%) |
| 35 to 64 Years | 0 (0.0%) | 0 (0.0%) |
| 65 to 74 Years | 0 (0.0%) | 0 (0.0%) |
| 75 Years and over | 0 (0.0%) | 0 (0.0%) |
Disability Class: Cognitive Difficulty
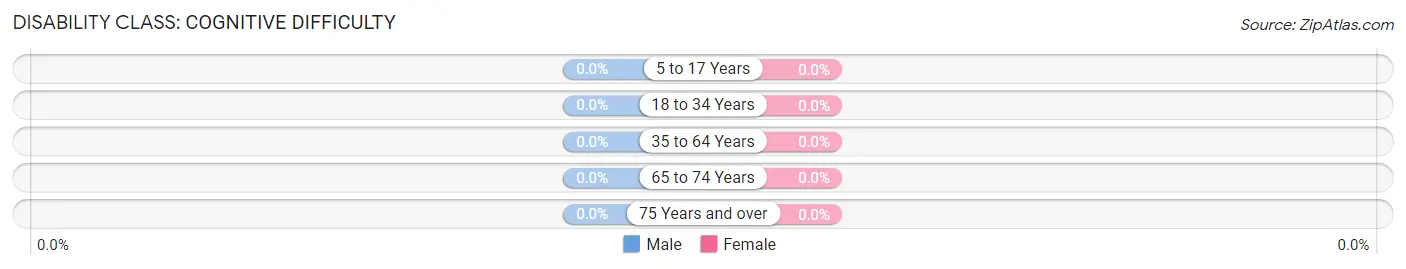
| Age Bracket | Male | Female |
| 5 to 17 Years | 0 (0.0%) | 0 (0.0%) |
| 18 to 34 Years | 0 (0.0%) | 0 (0.0%) |
| 35 to 64 Years | 0 (0.0%) | 0 (0.0%) |
| 65 to 74 Years | 0 (0.0%) | 0 (0.0%) |
| 75 Years and over | 0 (0.0%) | 0 (0.0%) |
Disability Class: Ambulatory Difficulty
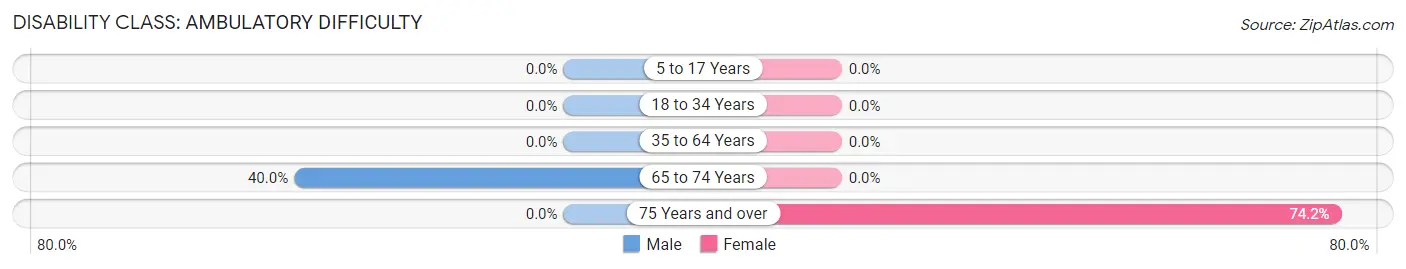
| Age Bracket | Male | Female |
| 5 to 17 Years | 0 (0.0%) | 0 (0.0%) |
| 18 to 34 Years | 0 (0.0%) | 0 (0.0%) |
| 35 to 64 Years | 0 (0.0%) | 0 (0.0%) |
| 65 to 74 Years | 4 (40.0%) | 0 (0.0%) |
| 75 Years and over | 0 (0.0%) | 23 (74.2%) |
Disability Class: Self-Care Difficulty
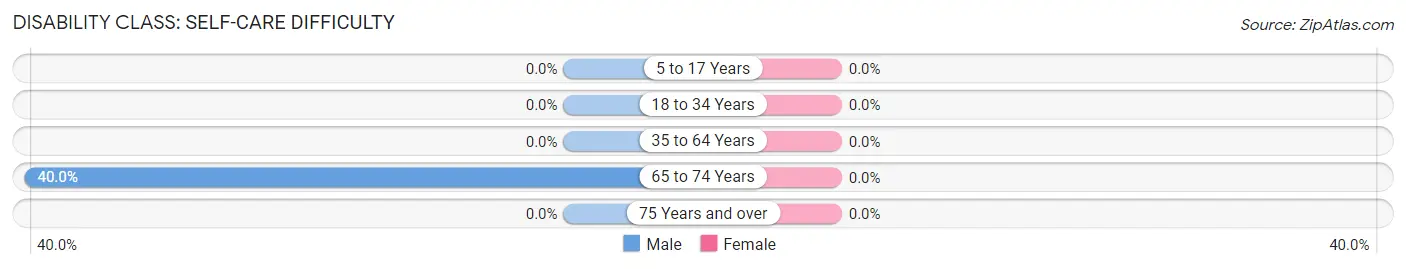
| Age Bracket | Male | Female |
| 5 to 17 Years | 0 (0.0%) | 0 (0.0%) |
| 18 to 34 Years | 0 (0.0%) | 0 (0.0%) |
| 35 to 64 Years | 0 (0.0%) | 0 (0.0%) |
| 65 to 74 Years | 4 (40.0%) | 0 (0.0%) |
| 75 Years and over | 0 (0.0%) | 0 (0.0%) |
Technology Access in Quinby
Computing Device Access in Quinby
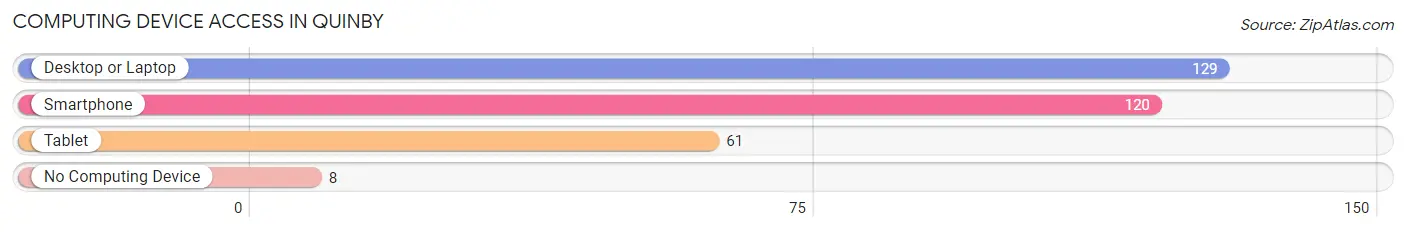
| Device Type | # Households | % Households |
| Desktop or Laptop | 129 | 94.2% |
| Smartphone | 120 | 87.6% |
| Tablet | 61 | 44.5% |
| No Computing Device | 8 | 5.8% |
| Total | 137 | 100.0% |
Internet Access in Quinby
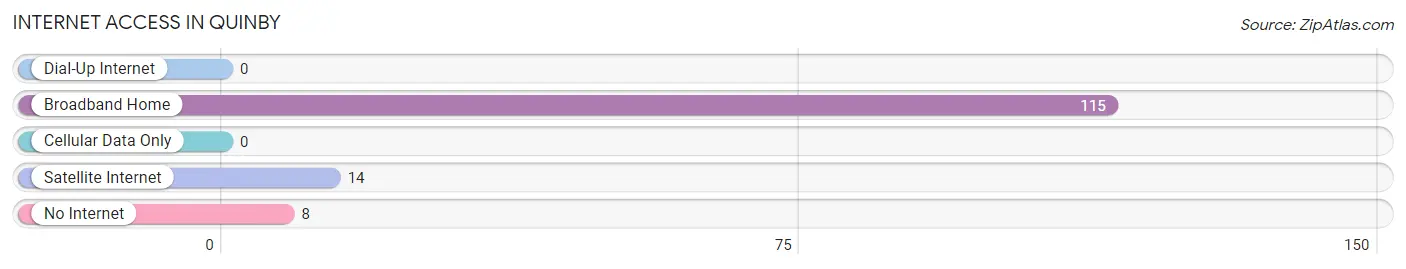
| Internet Type | # Households | % Households |
| Dial-Up Internet | 0 | 0.0% |
| Broadband Home | 115 | 83.9% |
| Cellular Data Only | 0 | 0.0% |
| Satellite Internet | 14 | 10.2% |
| No Internet | 8 | 5.8% |
| Total | 137 | 100.0% |
Quinby Summary
Quinby, Virginia is a small unincorporated community located in the southeastern corner of the state, in Accomack County. It is situated on the Eastern Shore of the Chesapeake Bay, and is bordered by the towns of Onancock and Parksley. The population of Quinby was estimated to be around 500 in 2020.
History
Quinby was first settled in the early 1700s by English colonists. The town was named after the Quinby family, who were among the first settlers. The town was originally known as Quinby’s Crossroads, as it was located at the intersection of two major roads. In the late 1800s, the town was renamed Quinby.
In the early 1900s, Quinby was a thriving agricultural community. The town was home to several farms, as well as a cannery, a sawmill, and a general store. The town also had a post office, a school, and a church.
In the mid-1900s, the town began to decline as the agricultural industry shifted away from the area. The cannery and sawmill closed, and the general store was sold. The post office closed in the 1970s, and the school closed in the 1980s.
Geography
Quinby is located in the southeastern corner of Accomack County, Virginia. It is situated on the Eastern Shore of the Chesapeake Bay, and is bordered by the towns of Onancock and Parksley. The town is located approximately 30 miles south of the state capital, Richmond.
The town is situated on a flat plain, with the Chesapeake Bay to the east and the Atlantic Ocean to the south. The town is surrounded by farmland and wetlands, and is home to several small creeks and streams.
Economy
Quinby’s economy is largely based on agriculture and tourism. The town is home to several farms, which produce a variety of crops, including corn, soybeans, and wheat. The town is also home to several seafood processing plants, which process and package local seafood for sale.
The town is also a popular tourist destination, as it is located near several popular beaches and attractions. The town is home to several bed and breakfasts, as well as a few restaurants and shops.
Demographics
As of 2020, the population of Quinby was estimated to be around 500. The town is predominantly white, with a small African American population. The median household income in the town is around $35,000, and the median home value is around $150,000. The town has a low unemployment rate, and the majority of residents are employed in the agricultural and tourism industries.
Common Questions
What is Per Capita Income in Quinby?
Per Capita income in Quinby is $45,451.
What is the Median Household income in Quinby?
Median Household Income in Quinby is $95,091.
What is Inequality or Gini Index in Quinby?
Inequality or Gini Index in Quinby is 0.45.
What is the Total Population of Quinby?
Total Population of Quinby is 298.
What is the Total Male Population of Quinby?
Total Male Population of Quinby is 163.
What is the Total Female Population of Quinby?
Total Female Population of Quinby is 135.
What is the Ratio of Males per 100 Females in Quinby?
There are 120.74 Males per 100 Females in Quinby.
What is the Ratio of Females per 100 Males in Quinby?
There are 82.82 Females per 100 Males in Quinby.
What is the Median Population Age in Quinby?
Median Population Age in Quinby is 39.4 Years.
What is the Average Family Size in Quinby
Average Family Size in Quinby is 2.7 People.
What is the Average Household Size in Quinby
Average Household Size in Quinby is 2.2 People.
How Large is the Labor Force in Quinby?
There are 109 People in the Labor Forcein in Quinby.
What is the Percentage of People in the Labor Force in Quinby?
44.9% of People are in the Labor Force in Quinby.