King William, VA Map & Demographics
King William Map
King William Overview
$28,656
PER CAPITA INCOME
$113,250
AVG FAMILY INCOME
$111,827
AVG HOUSEHOLD INCOME
79.1%
WAGE / INCOME GAP [ % ]
20.9¢/ $1
WAGE / INCOME GAP [ $ ]
0.24
INEQUALITY / GINI INDEX
155
TOTAL POPULATION
69
MALE POPULATION
86
FEMALE POPULATION
80.23
MALES / 100 FEMALES
124.64
FEMALES / 100 MALES
20.9
MEDIAN AGE
4.2
AVG FAMILY SIZE
3.6
AVG HOUSEHOLD SIZE
81
LABOR FORCE [ PEOPLE ]
94.2%
PERCENT IN LABOR FORCE
King William Zip Codes
King William Area Codes
Income in King William
Income Overview in King William
Per Capita Income in King William is $28,656, while median incomes of families and households are $113,250 and $111,827 respectively.
| Characteristic | Number | Measure |
| Per Capita Income | 155 | $28,656 |
| Median Family Income | 33 | $113,250 |
| Mean Family Income | 33 | $98,342 |
| Median Household Income | 43 | $111,827 |
| Mean Household Income | 43 | $90,884 |
| Income Deficit | 33 | $0 |
| Wage / Income Gap (%) | 155 | 79.13% |
| Wage / Income Gap ($) | 155 | 20.87¢ per $1 |
| Gini / Inequality Index | 155 | 0.24 |
Earnings by Sex in King William
Average Earnings in King William are $49,250, $79,643 for men and $16,625 for women, a difference of 79.1%.
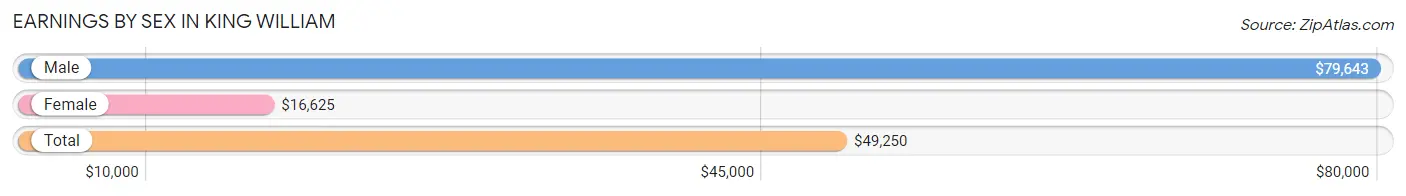
| Sex | Number | Average Earnings |
| Male | 48 (59.3%) | $79,643 |
| Female | 33 (40.7%) | $16,625 |
| Total | 81 (100.0%) | $49,250 |
Earnings by Sex by Income Bracket in King William
The most common earnings brackets in King William are $75,000 to $99,999 for men (15 | 31.2%) and $5,000 to $7,499 for women (10 | 30.3%).
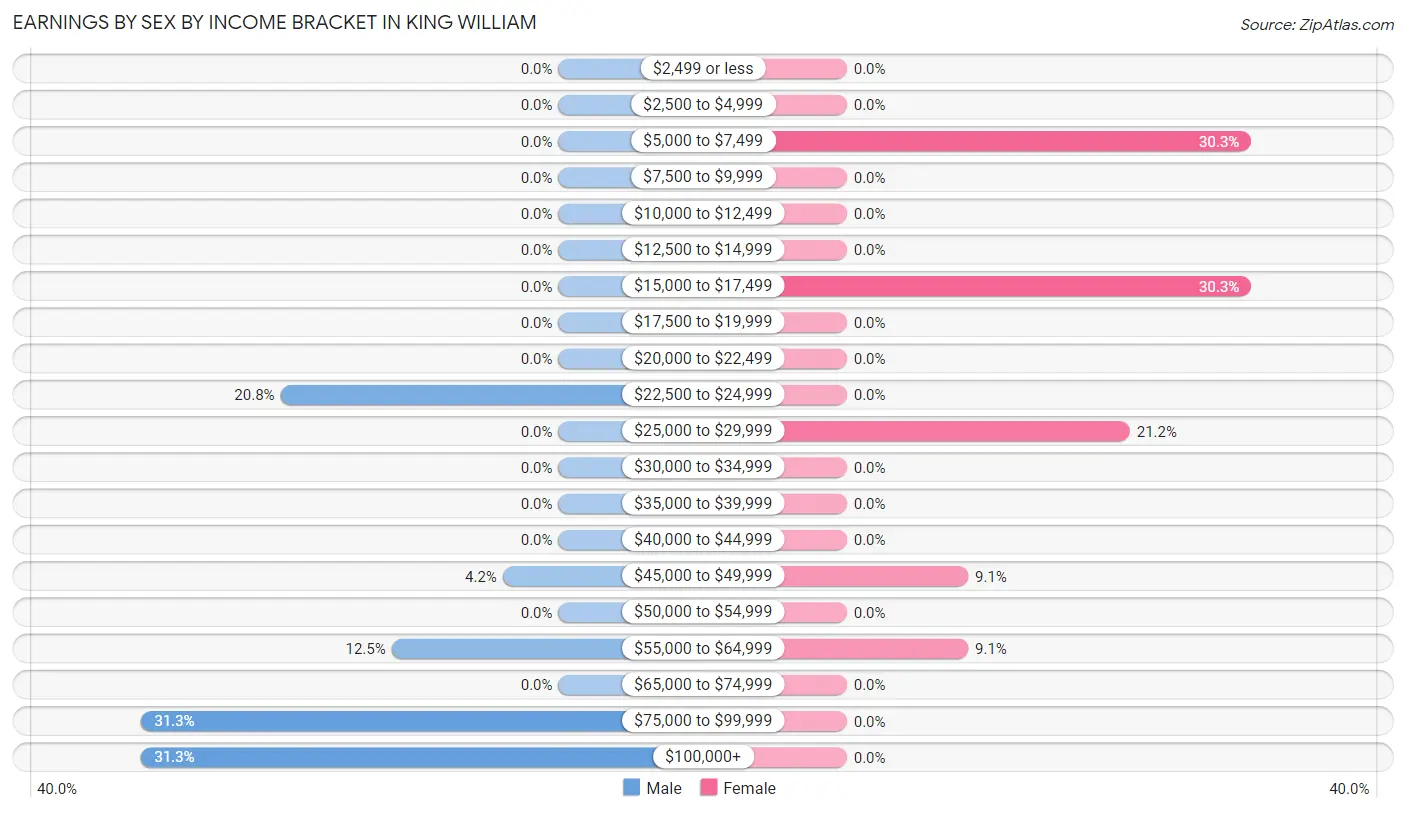
| Income | Male | Female |
| $2,499 or less | 0 (0.0%) | 0 (0.0%) |
| $2,500 to $4,999 | 0 (0.0%) | 0 (0.0%) |
| $5,000 to $7,499 | 0 (0.0%) | 10 (30.3%) |
| $7,500 to $9,999 | 0 (0.0%) | 0 (0.0%) |
| $10,000 to $12,499 | 0 (0.0%) | 0 (0.0%) |
| $12,500 to $14,999 | 0 (0.0%) | 0 (0.0%) |
| $15,000 to $17,499 | 0 (0.0%) | 10 (30.3%) |
| $17,500 to $19,999 | 0 (0.0%) | 0 (0.0%) |
| $20,000 to $22,499 | 0 (0.0%) | 0 (0.0%) |
| $22,500 to $24,999 | 10 (20.8%) | 0 (0.0%) |
| $25,000 to $29,999 | 0 (0.0%) | 7 (21.2%) |
| $30,000 to $34,999 | 0 (0.0%) | 0 (0.0%) |
| $35,000 to $39,999 | 0 (0.0%) | 0 (0.0%) |
| $40,000 to $44,999 | 0 (0.0%) | 0 (0.0%) |
| $45,000 to $49,999 | 2 (4.2%) | 3 (9.1%) |
| $50,000 to $54,999 | 0 (0.0%) | 0 (0.0%) |
| $55,000 to $64,999 | 6 (12.5%) | 3 (9.1%) |
| $65,000 to $74,999 | 0 (0.0%) | 0 (0.0%) |
| $75,000 to $99,999 | 15 (31.2%) | 0 (0.0%) |
| $100,000+ | 15 (31.2%) | 0 (0.0%) |
| Total | 48 (100.0%) | 33 (100.0%) |
Earnings by Sex by Educational Attainment in King William
| Educational Attainment | Male Income | Female Income |
| Less than High School | - | - |
| High School Diploma | - | - |
| College or Associate's Degree | - | - |
| Bachelor's Degree | - | - |
| Graduate Degree | - | - |
| Total | $81,250 | $16,625 |
Family Income in King William
Family Income Brackets in King William
According to the King William family income data, there are 24 families falling into the $100,000 to $149,999 income range, which is the most common income bracket and makes up 72.7% of all families.
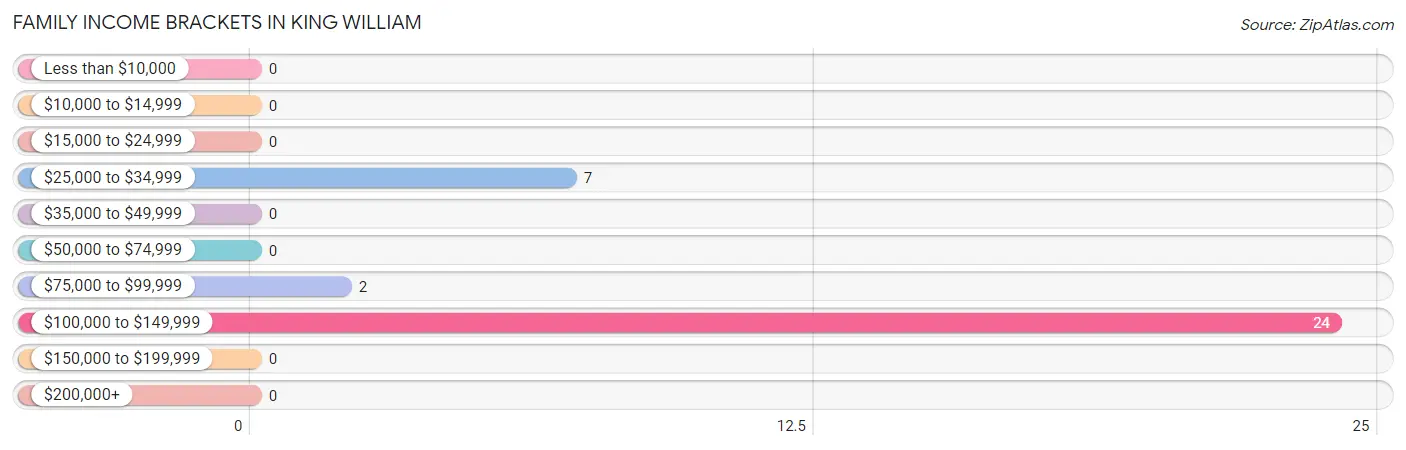
| Income Bracket | # Families | % Families |
| Less than $10,000 | 0 | 0.0% |
| $10,000 to $14,999 | 0 | 0.0% |
| $15,000 to $24,999 | 0 | 0.0% |
| $25,000 to $34,999 | 7 | 21.2% |
| $35,000 to $49,999 | 0 | 0.0% |
| $50,000 to $74,999 | 0 | 0.0% |
| $75,000 to $99,999 | 2 | 6.1% |
| $100,000 to $149,999 | 24 | 72.7% |
| $150,000 to $199,999 | 0 | 0.0% |
| $200,000+ | 0 | 0.0% |
Family Income by Famaliy Size in King William
| Income Bracket | # Families | Median Income |
| 2-Person Families | 16 (48.5%) | $0 |
| 3-Person Families | 3 (9.1%) | $0 |
| 4-Person Families | 7 (21.2%) | $0 |
| 5-Person Families | 7 (21.2%) | $0 |
| 6-Person Families | 0 (0.0%) | $0 |
| 7+ Person Families | 0 (0.0%) | $0 |
| Total | 33 (100.0%) | $113,250 |
Family Income by Number of Earners in King William
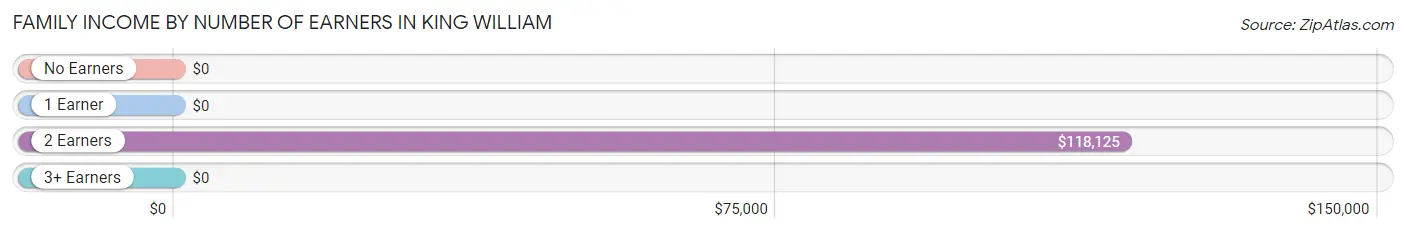
| Number of Earners | # Families | Median Income |
| No Earners | 0 (0.0%) | $0 |
| 1 Earner | 12 (36.4%) | $0 |
| 2 Earners | 21 (63.6%) | $118,125 |
| 3+ Earners | 0 (0.0%) | $0 |
| Total | 33 (100.0%) | $113,250 |
Household Income in King William
Household Income Brackets in King William
With 31 households falling in the category, the $100,000 to $149,999 income range is the most frequent in King William, accounting for 72.1% of all households.
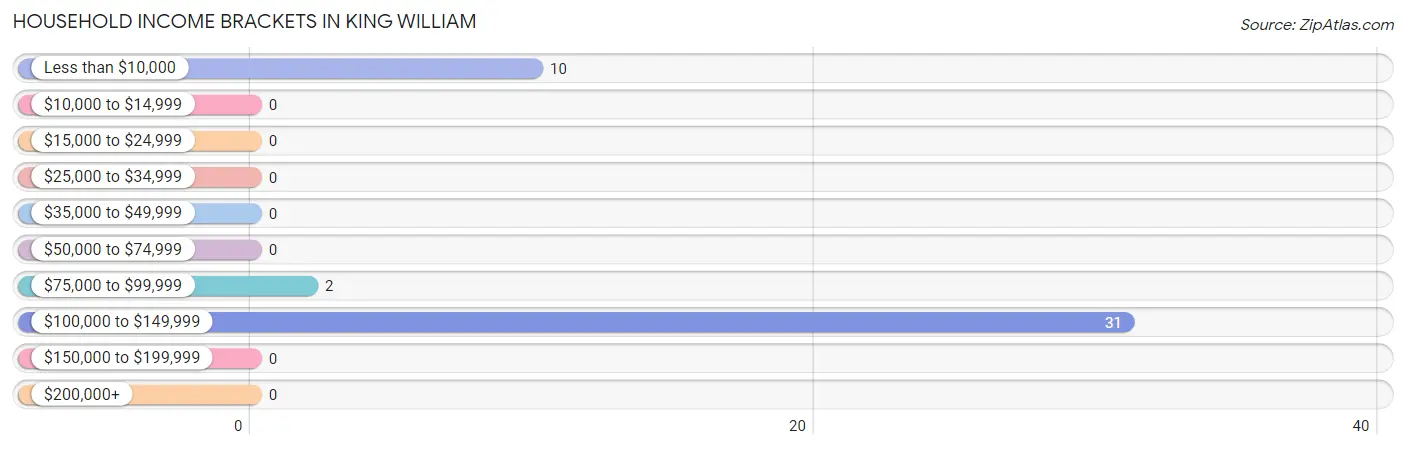
| Income Bracket | # Households | % Households |
| Less than $10,000 | 10 | 23.3% |
| $10,000 to $14,999 | 0 | 0.0% |
| $15,000 to $24,999 | 0 | 0.0% |
| $25,000 to $34,999 | 0 | 0.0% |
| $35,000 to $49,999 | 0 | 0.0% |
| $50,000 to $74,999 | 0 | 0.0% |
| $75,000 to $99,999 | 2 | 4.7% |
| $100,000 to $149,999 | 31 | 72.1% |
| $150,000 to $199,999 | 0 | 0.0% |
| $200,000+ | 0 | 0.0% |
Household Income by Householder Age in King William
The median household income in King William is $111,827, with the highest median household income of $114,000 found in the 25 to 44 years age bracket for the primary householder. A total of 24 households (55.8%) fall into this category.
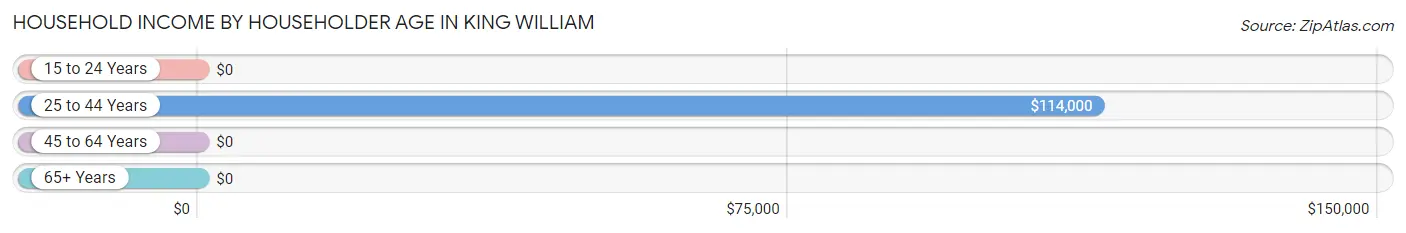
| Income Bracket | # Households | Median Income |
| 15 to 24 Years | 0 (0.0%) | $0 |
| 25 to 44 Years | 24 (55.8%) | $114,000 |
| 45 to 64 Years | 3 (7.0%) | $0 |
| 65+ Years | 16 (37.2%) | $0 |
| Total | 43 (100.0%) | $111,827 |
Poverty in King William
Income Below Poverty by Sex and Age in King William
With 11.6% poverty level for males and 54.6% for females among the residents of King William, 12 to 14 year old males and 12 to 14 year old females are the most vulnerable to poverty, with 8 males (100.0%) and 20 females (100.0%) in their respective age groups living below the poverty level.
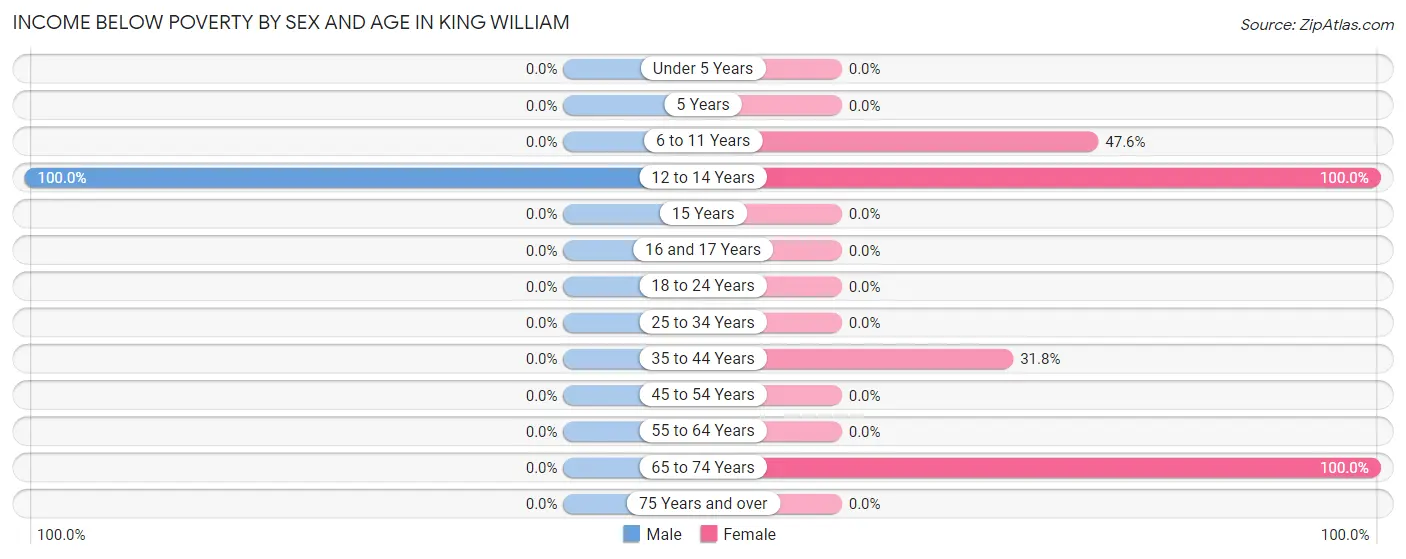
| Age Bracket | Male | Female |
| Under 5 Years | 0 (0.0%) | 0 (0.0%) |
| 5 Years | 0 (0.0%) | 0 (0.0%) |
| 6 to 11 Years | 0 (0.0%) | 10 (47.6%) |
| 12 to 14 Years | 8 (100.0%) | 20 (100.0%) |
| 15 Years | 0 (0.0%) | 0 (0.0%) |
| 16 and 17 Years | 0 (0.0%) | 0 (0.0%) |
| 18 to 24 Years | 0 (0.0%) | 0 (0.0%) |
| 25 to 34 Years | 0 (0.0%) | 0 (0.0%) |
| 35 to 44 Years | 0 (0.0%) | 7 (31.8%) |
| 45 to 54 Years | 0 (0.0%) | 0 (0.0%) |
| 55 to 64 Years | 0 (0.0%) | 0 (0.0%) |
| 65 to 74 Years | 0 (0.0%) | 10 (100.0%) |
| 75 Years and over | 0 (0.0%) | 0 (0.0%) |
| Total | 8 (11.6%) | 47 (54.6%) |
Income Above Poverty by Sex and Age in King William
According to the poverty statistics in King William, males aged under 5 years and females aged under 5 years are the age groups that are most secure financially, with 100.0% of males and 100.0% of females in these age groups living above the poverty line.
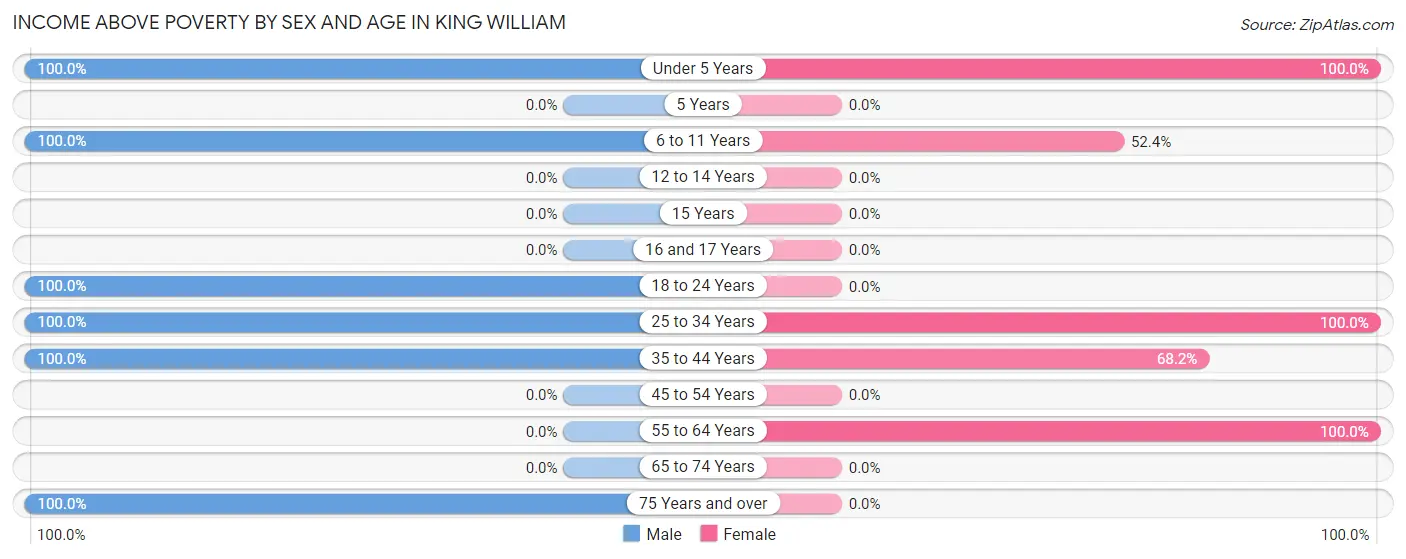
| Age Bracket | Male | Female |
| Under 5 Years | 9 (100.0%) | 7 (100.0%) |
| 5 Years | 0 (0.0%) | 0 (0.0%) |
| 6 to 11 Years | 4 (100.0%) | 11 (52.4%) |
| 12 to 14 Years | 0 (0.0%) | 0 (0.0%) |
| 15 Years | 0 (0.0%) | 0 (0.0%) |
| 16 and 17 Years | 0 (0.0%) | 0 (0.0%) |
| 18 to 24 Years | 10 (100.0%) | 0 (0.0%) |
| 25 to 34 Years | 2 (100.0%) | 3 (100.0%) |
| 35 to 44 Years | 30 (100.0%) | 15 (68.2%) |
| 45 to 54 Years | 0 (0.0%) | 0 (0.0%) |
| 55 to 64 Years | 0 (0.0%) | 3 (100.0%) |
| 65 to 74 Years | 0 (0.0%) | 0 (0.0%) |
| 75 Years and over | 6 (100.0%) | 0 (0.0%) |
| Total | 61 (88.4%) | 39 (45.4%) |
Income Below Poverty Among Married-Couple Families in King William
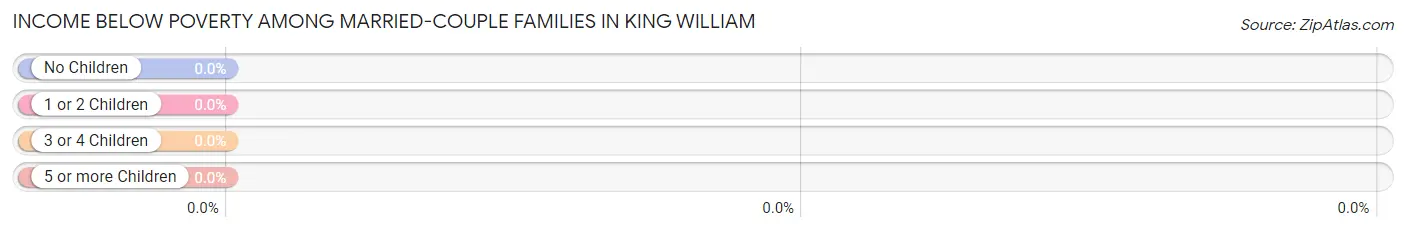
| Children | Above Poverty | Below Poverty |
| No Children | 10 (100.0%) | 0 (0.0%) |
| 1 or 2 Children | 7 (100.0%) | 0 (0.0%) |
| 3 or 4 Children | 0 (0.0%) | 0 (0.0%) |
| 5 or more Children | 0 (0.0%) | 0 (0.0%) |
| Total | 17 (100.0%) | 0 (0.0%) |
Income Below Poverty Among Single-Parent Households in King William
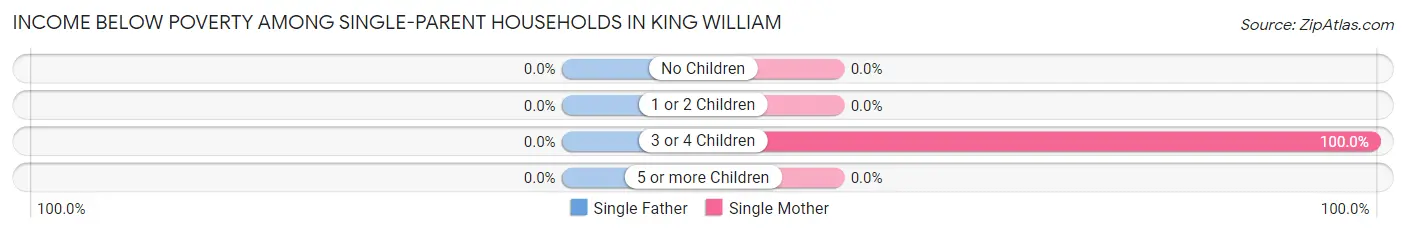
| Children | Single Father | Single Mother |
| No Children | 0 (0.0%) | 0 (0.0%) |
| 1 or 2 Children | 0 (0.0%) | 0 (0.0%) |
| 3 or 4 Children | 0 (0.0%) | 7 (100.0%) |
| 5 or more Children | 0 (0.0%) | 0 (0.0%) |
| Total | 0 (0.0%) | 7 (70.0%) |
Income Below Poverty Among Married-Couple vs Single-Parent Households in King William
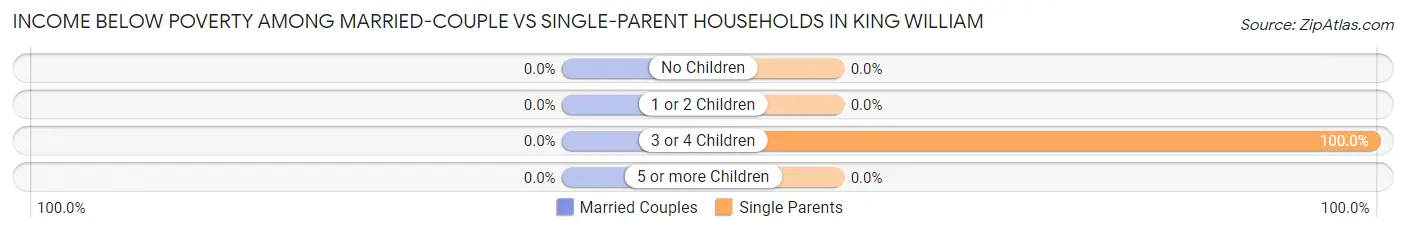
| Children | Married-Couple Families | Single-Parent Households |
| No Children | 0 (0.0%) | 0 (0.0%) |
| 1 or 2 Children | 0 (0.0%) | 0 (0.0%) |
| 3 or 4 Children | 0 (0.0%) | 7 (100.0%) |
| 5 or more Children | 0 (0.0%) | 0 (0.0%) |
| Total | 0 (0.0%) | 7 (43.8%) |
Race in King William
The most populous races in King William are , and White / Caucasian (155 | 100.0%).
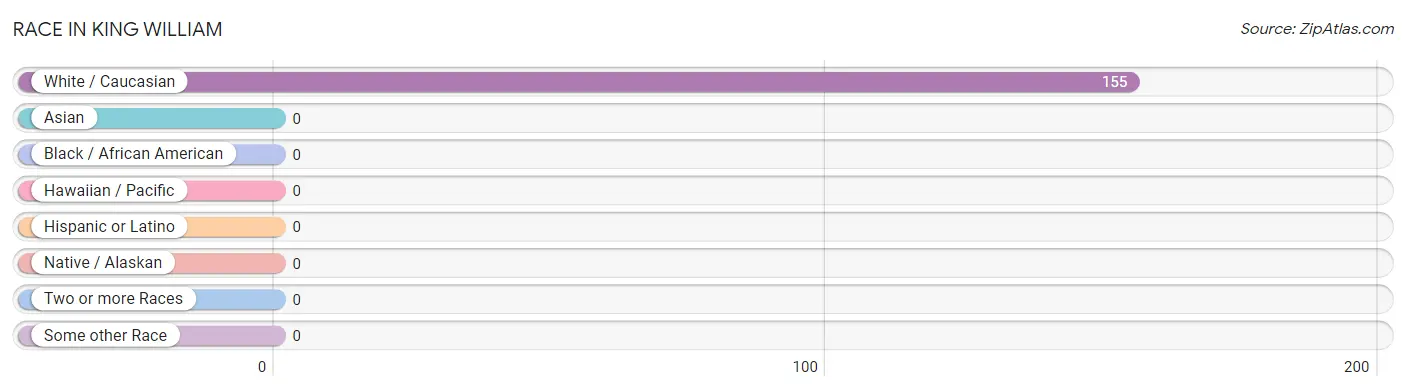
| Race | # Population | % Population |
| Asian | 0 | 0.0% |
| Black / African American | 0 | 0.0% |
| Hawaiian / Pacific | 0 | 0.0% |
| Hispanic or Latino | 0 | 0.0% |
| Native / Alaskan | 0 | 0.0% |
| White / Caucasian | 155 | 100.0% |
| Two or more Races | 0 | 0.0% |
| Some other Race | 0 | 0.0% |
| Total | 155 | 100.0% |
Ancestry in King William
The most populous ancestries reported in King William are English (41 | 26.5%), American (23 | 14.8%), Scotch-Irish (21 | 13.6%), German (20 | 12.9%), and Irish (10 | 6.5%), together accounting for 74.2% of all King William residents.
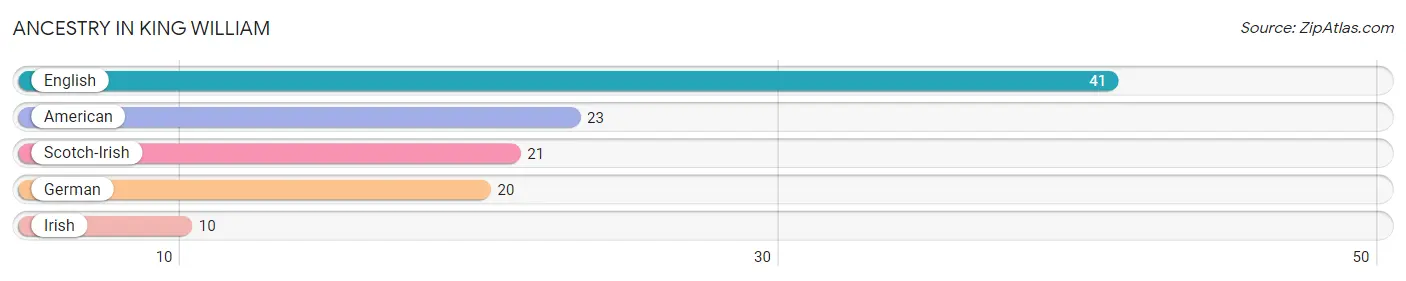
| Ancestry | # Population | % Population |
| American | 23 | 14.8% |
| English | 41 | 26.5% |
| German | 20 | 12.9% |
| Irish | 10 | 6.5% |
| Scotch-Irish | 21 | 13.6% | View All 5 Rows |
Immigrants in King William

| Immigration Origin | # Population | % Population | View All 0 Rows |
Sex and Age in King William
Sex and Age in King William
The most populous age groups in King William are 35 to 39 Years (15 | 21.7%) for men and 10 to 14 Years (31 | 36.0%) for women.
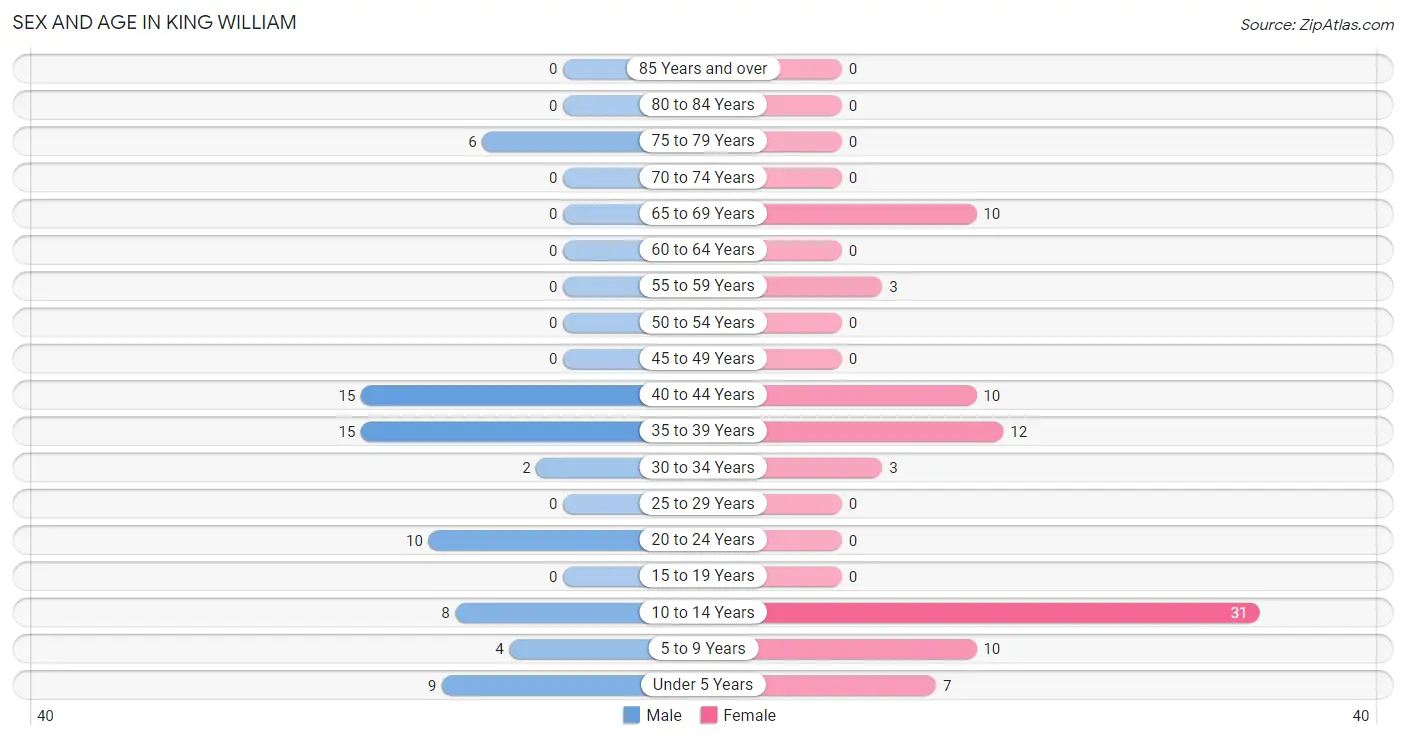
| Age Bracket | Male | Female |
| Under 5 Years | 9 (13.0%) | 7 (8.1%) |
| 5 to 9 Years | 4 (5.8%) | 10 (11.6%) |
| 10 to 14 Years | 8 (11.6%) | 31 (36.0%) |
| 15 to 19 Years | 0 (0.0%) | 0 (0.0%) |
| 20 to 24 Years | 10 (14.5%) | 0 (0.0%) |
| 25 to 29 Years | 0 (0.0%) | 0 (0.0%) |
| 30 to 34 Years | 2 (2.9%) | 3 (3.5%) |
| 35 to 39 Years | 15 (21.7%) | 12 (14.0%) |
| 40 to 44 Years | 15 (21.7%) | 10 (11.6%) |
| 45 to 49 Years | 0 (0.0%) | 0 (0.0%) |
| 50 to 54 Years | 0 (0.0%) | 0 (0.0%) |
| 55 to 59 Years | 0 (0.0%) | 3 (3.5%) |
| 60 to 64 Years | 0 (0.0%) | 0 (0.0%) |
| 65 to 69 Years | 0 (0.0%) | 10 (11.6%) |
| 70 to 74 Years | 0 (0.0%) | 0 (0.0%) |
| 75 to 79 Years | 6 (8.7%) | 0 (0.0%) |
| 80 to 84 Years | 0 (0.0%) | 0 (0.0%) |
| 85 Years and over | 0 (0.0%) | 0 (0.0%) |
| Total | 69 (100.0%) | 86 (100.0%) |
Families and Households in King William
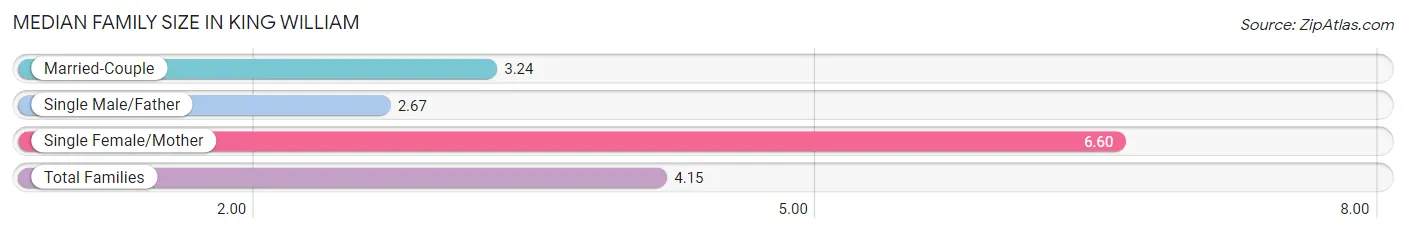
Median Family Size in King William
The median family size in King William is 4.15 persons per family, with single female/mother families (10 | 30.3%) accounting for the largest median family size of 6.6 persons per family. On the other hand, single male/father families (6 | 18.2%) represent the smallest median family size with 2.67 persons per family.
| Family Type | # Families | Family Size |
| Married-Couple | 17 (51.5%) | 3.24 |
| Single Male/Father | 6 (18.2%) | 2.67 |
| Single Female/Mother | 10 (30.3%) | 6.60 |
| Total Families | 33 (100.0%) | 4.15 |
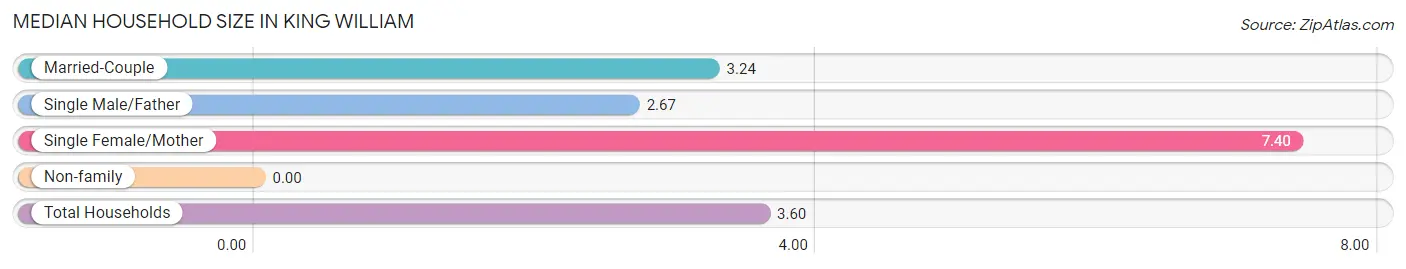
Median Household Size in King William
| Household Type | # Households | Household Size |
| Married-Couple | 17 (39.5%) | 3.24 |
| Single Male/Father | 6 (14.0%) | 2.67 |
| Single Female/Mother | 10 (23.3%) | 7.40 |
| Non-family | 10 (23.3%) | - |
| Total Households | 43 (100.0%) | 3.60 |
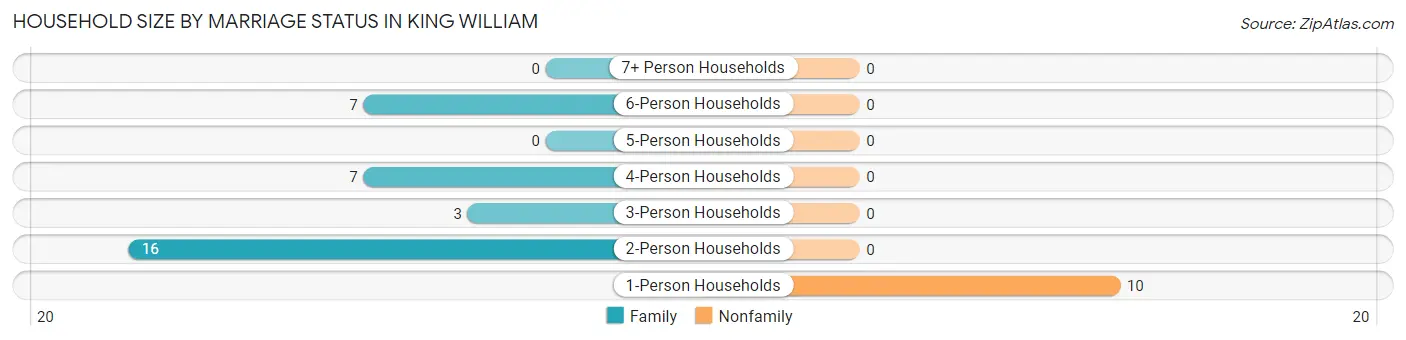
Household Size by Marriage Status in King William
Out of a total of 43 households in King William, 33 (76.7%) are family households, while 10 (23.3%) are nonfamily households. The most numerous type of family households are 2-person households, comprising 16, and the most common type of nonfamily households are 1-person households, comprising 10.
| Household Size | Family Households | Nonfamily Households |
| 1-Person Households | - | 10 (23.3%) |
| 2-Person Households | 16 (37.2%) | 0 (0.0%) |
| 3-Person Households | 3 (7.0%) | 0 (0.0%) |
| 4-Person Households | 7 (16.3%) | 0 (0.0%) |
| 5-Person Households | 0 (0.0%) | 0 (0.0%) |
| 6-Person Households | 7 (16.3%) | 0 (0.0%) |
| 7+ Person Households | 0 (0.0%) | 0 (0.0%) |
| Total | 33 (76.7%) | 10 (23.3%) |
Female Fertility in King William
Fertility by Age in King William
Average fertility rate in King William is 200.0 births per 1,000 women. Women in the age bracket of 35 to 50 years have the highest fertility rate with 227.0 births per 1,000 women. Women in the age bracket of 35 to 50 years acount for 100.0% of all women with births.
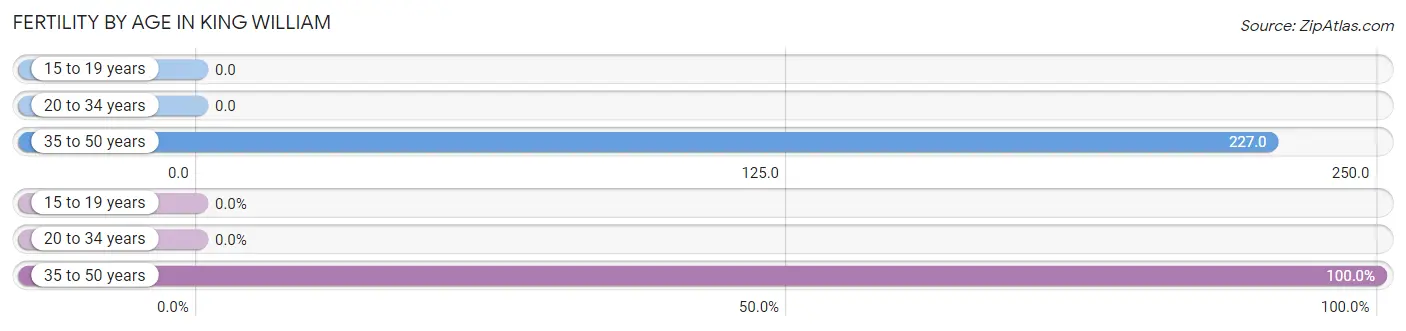
| Age Bracket | Women with Births | Births / 1,000 Women |
| 15 to 19 years | 0 (0.0%) | 0.0 |
| 20 to 34 years | 0 (0.0%) | 0.0 |
| 35 to 50 years | 5 (100.0%) | 227.0 |
| Total | 5 (100.0%) | 200.0 |
Fertility by Age by Marriage Status in King William
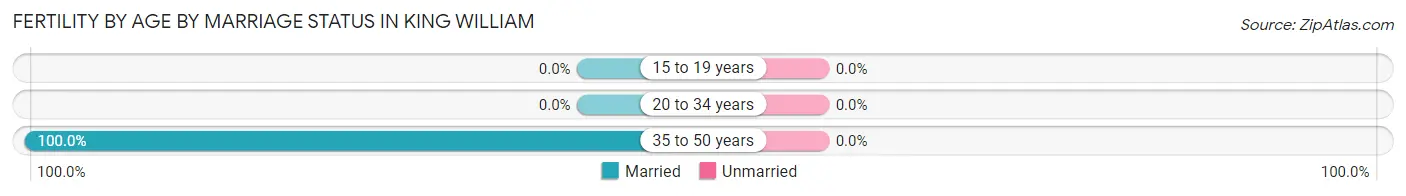
| Age Bracket | Married | Unmarried |
| 15 to 19 years | 0 (0.0%) | 0 (0.0%) |
| 20 to 34 years | 0 (0.0%) | 0 (0.0%) |
| 35 to 50 years | 5 (100.0%) | 0 (0.0%) |
| Total | 5 (100.0%) | 0 (0.0%) |
Fertility by Education in King William
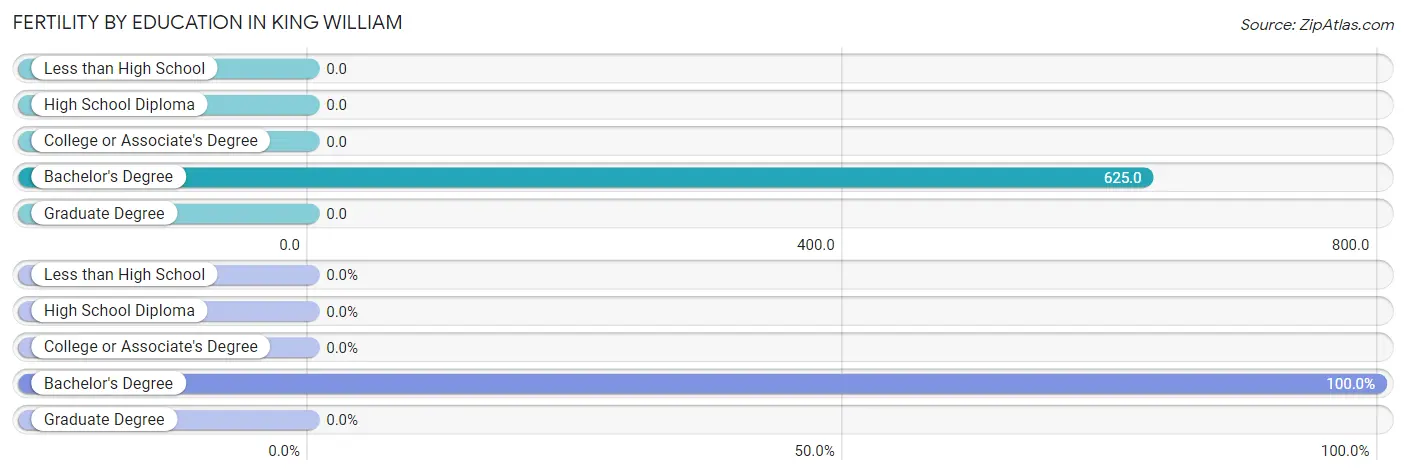
| Educational Attainment | Women with Births | Births / 1,000 Women |
| Less than High School | 0 (0.0%) | 0.0 |
| High School Diploma | 0 (0.0%) | 0.0 |
| College or Associate's Degree | 0 (0.0%) | 0.0 |
| Bachelor's Degree | 5 (100.0%) | 625.0 |
| Graduate Degree | 0 (0.0%) | 0.0 |
| Total | 5 (100.0%) | 200.0 |
Fertility by Education by Marriage Status in King William
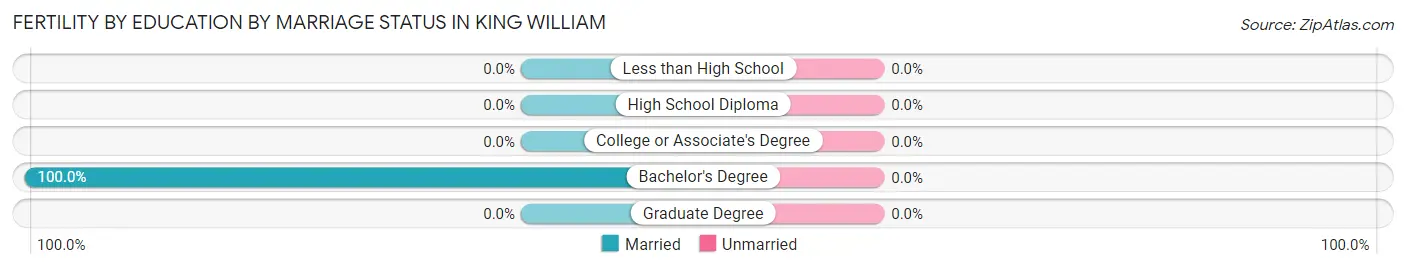
| Educational Attainment | Married | Unmarried |
| Less than High School | 0 (0.0%) | 0 (0.0%) |
| High School Diploma | 0 (0.0%) | 0 (0.0%) |
| College or Associate's Degree | 0 (0.0%) | 0 (0.0%) |
| Bachelor's Degree | 5 (100.0%) | 0 (0.0%) |
| Graduate Degree | 0 (0.0%) | 0 (0.0%) |
| Total | 5 (100.0%) | 0 (0.0%) |
Employment Characteristics in King William
Employment by Class of Employer in King William
Among the 81 employed individuals in King William, private company employees (41 | 50.6%), self-employed (not incorporated) (20 | 24.7%), and federal government employees (10 | 12.3%) make up the most common classes of employment.
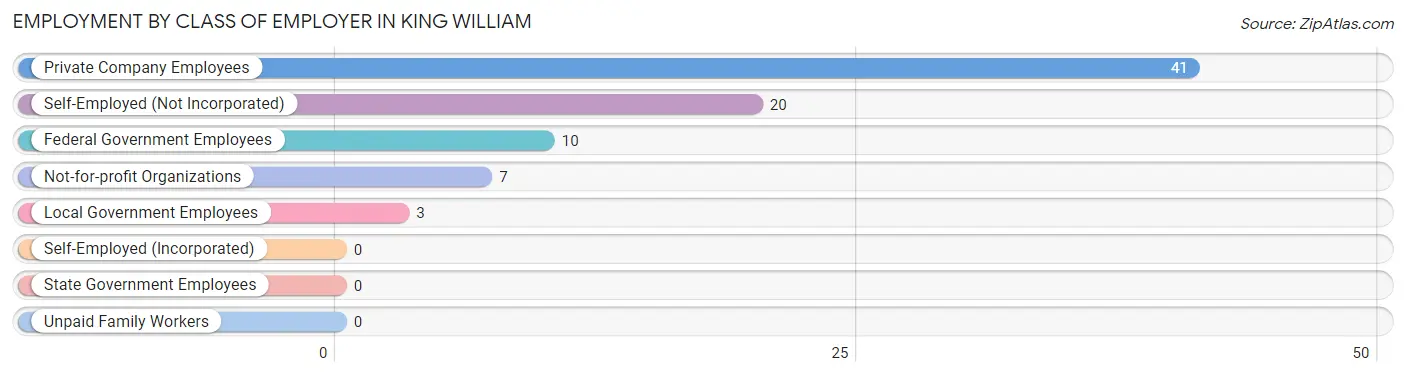
| Employer Class | # Employees | % Employees |
| Private Company Employees | 41 | 50.6% |
| Self-Employed (Incorporated) | 0 | 0.0% |
| Self-Employed (Not Incorporated) | 20 | 24.7% |
| Not-for-profit Organizations | 7 | 8.6% |
| Local Government Employees | 3 | 3.7% |
| State Government Employees | 0 | 0.0% |
| Federal Government Employees | 10 | 12.3% |
| Unpaid Family Workers | 0 | 0.0% |
| Total | 81 | 100.0% |
Employment Status by Age in King William
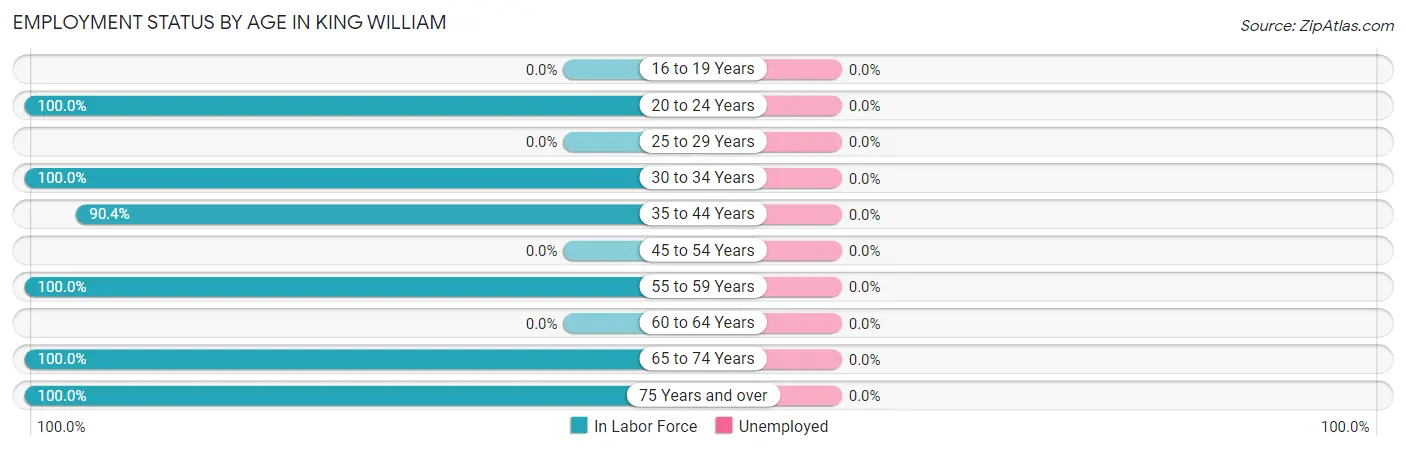
| Age Bracket | In Labor Force | Unemployed |
| 16 to 19 Years | 0 (0.0%) | 0 (0.0%) |
| 20 to 24 Years | 10 (100.0%) | 0 (0.0%) |
| 25 to 29 Years | 0 (0.0%) | 0 (0.0%) |
| 30 to 34 Years | 5 (100.0%) | 0 (0.0%) |
| 35 to 44 Years | 47 (90.4%) | 0 (0.0%) |
| 45 to 54 Years | 0 (0.0%) | 0 (0.0%) |
| 55 to 59 Years | 3 (100.0%) | 0 (0.0%) |
| 60 to 64 Years | 0 (0.0%) | 0 (0.0%) |
| 65 to 74 Years | 10 (100.0%) | 0 (0.0%) |
| 75 Years and over | 6 (100.0%) | 0 (0.0%) |
| Total | 81 (94.2%) | 0 (0.0%) |
Employment Status by Educational Attainment in King William
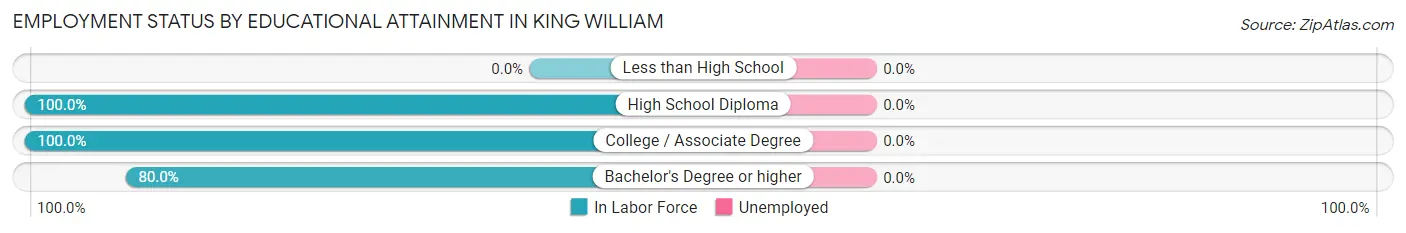
| Educational Attainment | In Labor Force | Unemployed |
| Less than High School | 0 (0.0%) | 0 (0.0%) |
| High School Diploma | 15 (100.0%) | 0 (0.0%) |
| College / Associate Degree | 20 (100.0%) | 0 (0.0%) |
| Bachelor's Degree or higher | 20 (80.0%) | 0 (0.0%) |
| Total | 55 (91.7%) | 0 (0.0%) |
Employment Occupations by Sex in King William
Management, Business, Science and Arts Occupations
The most common Management, Business, Science and Arts occupations in King William are Computers, Engineering & Science (12 | 14.8%), Computers & Mathematics (7 | 8.6%), Management (6 | 7.4%), Community & Social Service (6 | 7.4%), and Architecture & Engineering (5 | 6.2%).
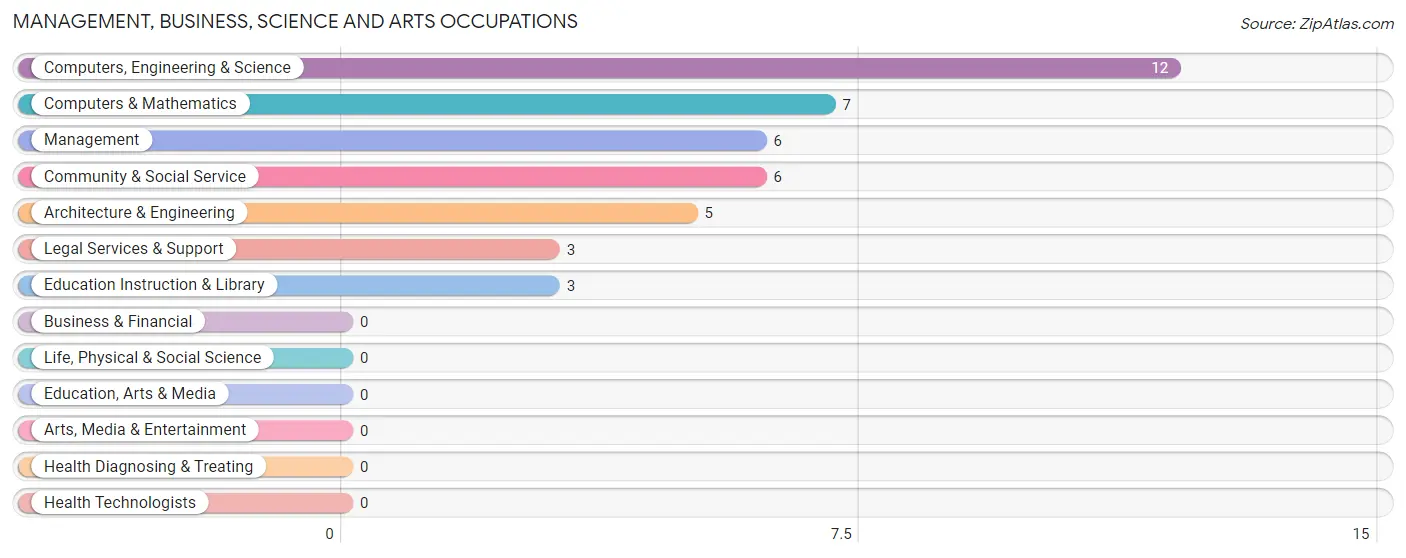
Management, Business, Science and Arts Occupations by Sex
Within the Management, Business, Science and Arts occupations in King William, the most male-oriented occupations are Management (100.0%), Computers, Engineering & Science (100.0%), and Computers & Mathematics (100.0%), while the most female-oriented occupations are Community & Social Service (100.0%), Legal Services & Support (100.0%), and Education Instruction & Library (100.0%).
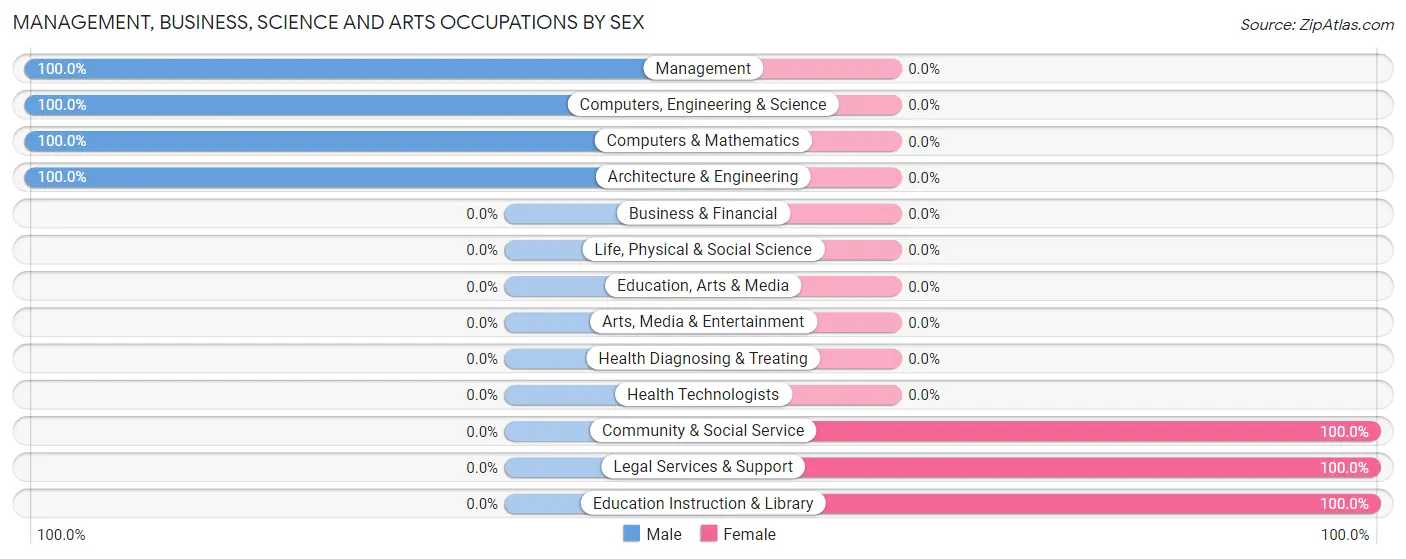
| Occupation | Male | Female |
| Management | 6 (100.0%) | 0 (0.0%) |
| Business & Financial | 0 (0.0%) | 0 (0.0%) |
| Computers, Engineering & Science | 12 (100.0%) | 0 (0.0%) |
| Computers & Mathematics | 7 (100.0%) | 0 (0.0%) |
| Architecture & Engineering | 5 (100.0%) | 0 (0.0%) |
| Life, Physical & Social Science | 0 (0.0%) | 0 (0.0%) |
| Community & Social Service | 0 (0.0%) | 6 (100.0%) |
| Education, Arts & Media | 0 (0.0%) | 0 (0.0%) |
| Legal Services & Support | 0 (0.0%) | 3 (100.0%) |
| Education Instruction & Library | 0 (0.0%) | 3 (100.0%) |
| Arts, Media & Entertainment | 0 (0.0%) | 0 (0.0%) |
| Health Diagnosing & Treating | 0 (0.0%) | 0 (0.0%) |
| Health Technologists | 0 (0.0%) | 0 (0.0%) |
| Total (Category) | 18 (75.0%) | 6 (25.0%) |
| Total (Overall) | 48 (59.3%) | 33 (40.7%) |
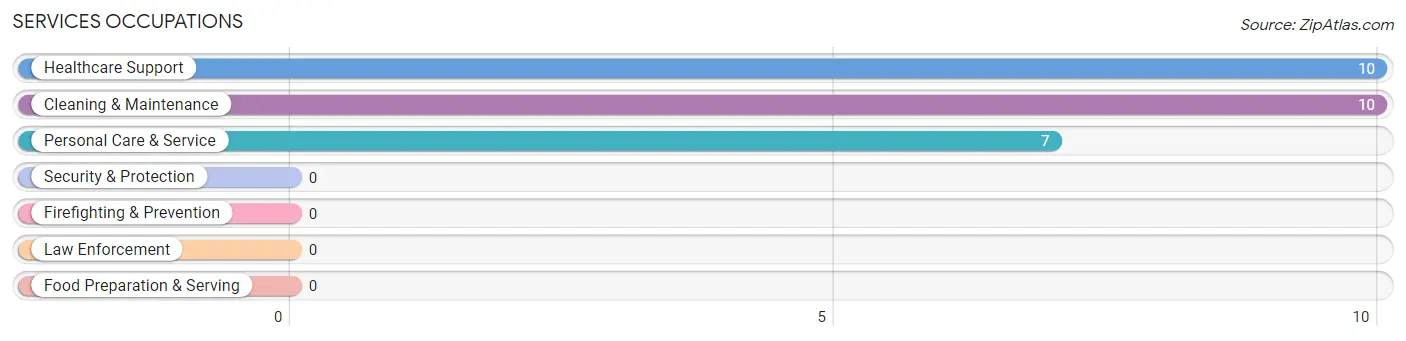
Services Occupations
The most common Services occupations in King William are Healthcare Support (10 | 12.3%), Cleaning & Maintenance (10 | 12.3%), and Personal Care & Service (7 | 8.6%).
Services Occupations by Sex
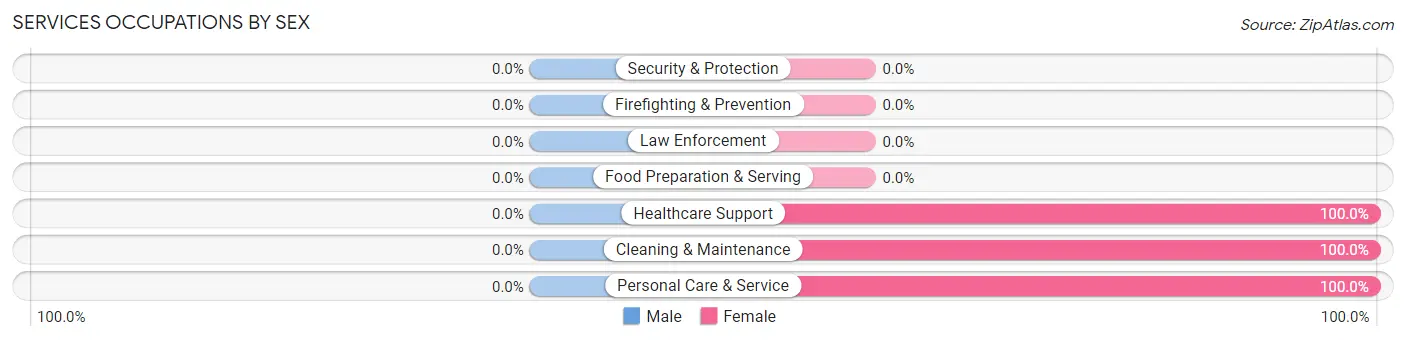
| Occupation | Male | Female |
| Healthcare Support | 0 (0.0%) | 10 (100.0%) |
| Security & Protection | 0 (0.0%) | 0 (0.0%) |
| Firefighting & Prevention | 0 (0.0%) | 0 (0.0%) |
| Law Enforcement | 0 (0.0%) | 0 (0.0%) |
| Food Preparation & Serving | 0 (0.0%) | 0 (0.0%) |
| Cleaning & Maintenance | 0 (0.0%) | 10 (100.0%) |
| Personal Care & Service | 0 (0.0%) | 7 (100.0%) |
| Total (Category) | 0 (0.0%) | 27 (100.0%) |
| Total (Overall) | 48 (59.3%) | 33 (40.7%) |
Sales and Office Occupations
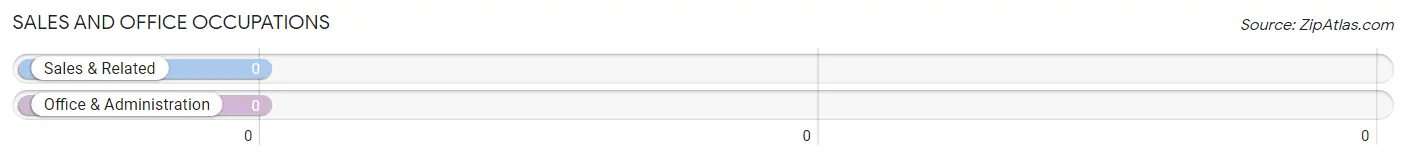
Sales and Office Occupations by Sex
| Occupation | Male | Female |
| Sales & Related | 0 (0.0%) | 0 (0.0%) |
| Office & Administration | 0 (0.0%) | 0 (0.0%) |
| Total (Category) | 0 (0.0%) | 0 (0.0%) |
| Total (Overall) | 48 (59.3%) | 33 (40.7%) |
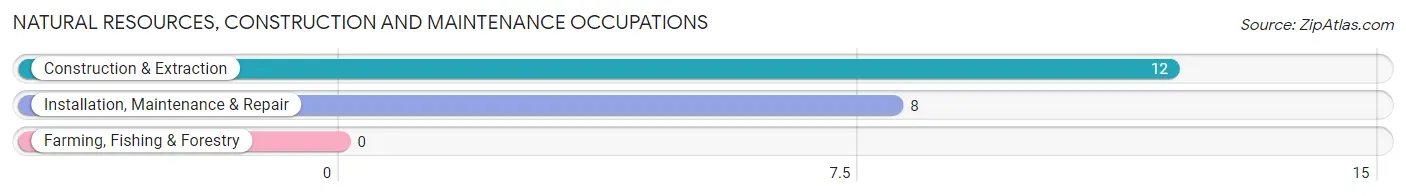
Natural Resources, Construction and Maintenance Occupations
The most common Natural Resources, Construction and Maintenance occupations in King William are Construction & Extraction (12 | 14.8%), and Installation, Maintenance & Repair (8 | 9.9%).
Natural Resources, Construction and Maintenance Occupations by Sex
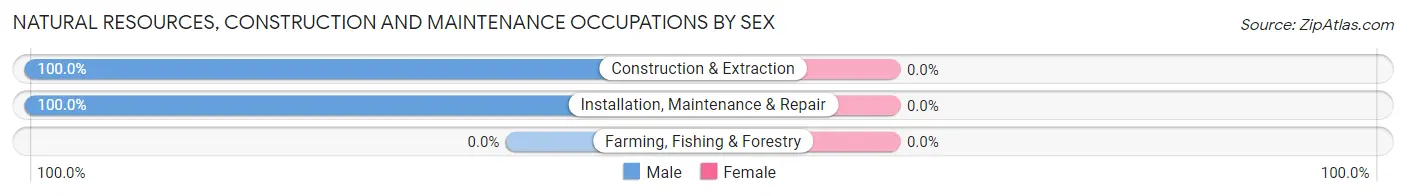
| Occupation | Male | Female |
| Farming, Fishing & Forestry | 0 (0.0%) | 0 (0.0%) |
| Construction & Extraction | 12 (100.0%) | 0 (0.0%) |
| Installation, Maintenance & Repair | 8 (100.0%) | 0 (0.0%) |
| Total (Category) | 20 (100.0%) | 0 (0.0%) |
| Total (Overall) | 48 (59.3%) | 33 (40.7%) |
Production, Transportation and Moving Occupations
The most common Production, Transportation and Moving occupations in King William are , and Transportation (10 | 12.3%).
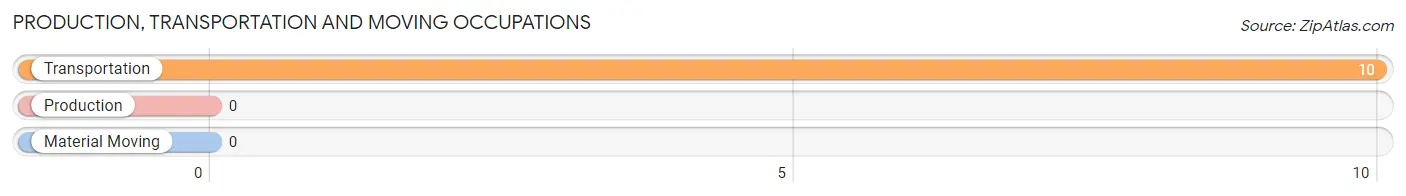
Production, Transportation and Moving Occupations by Sex
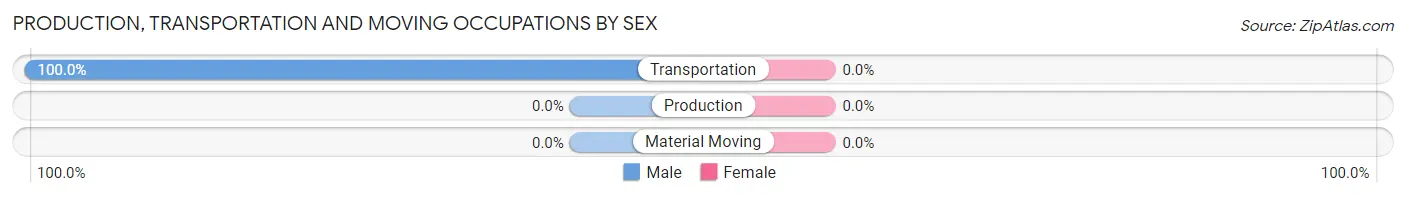
| Occupation | Male | Female |
| Production | 0 (0.0%) | 0 (0.0%) |
| Transportation | 10 (100.0%) | 0 (0.0%) |
| Material Moving | 0 (0.0%) | 0 (0.0%) |
| Total (Category) | 10 (100.0%) | 0 (0.0%) |
| Total (Overall) | 48 (59.3%) | 33 (40.7%) |
Employment Industries by Sex in King William
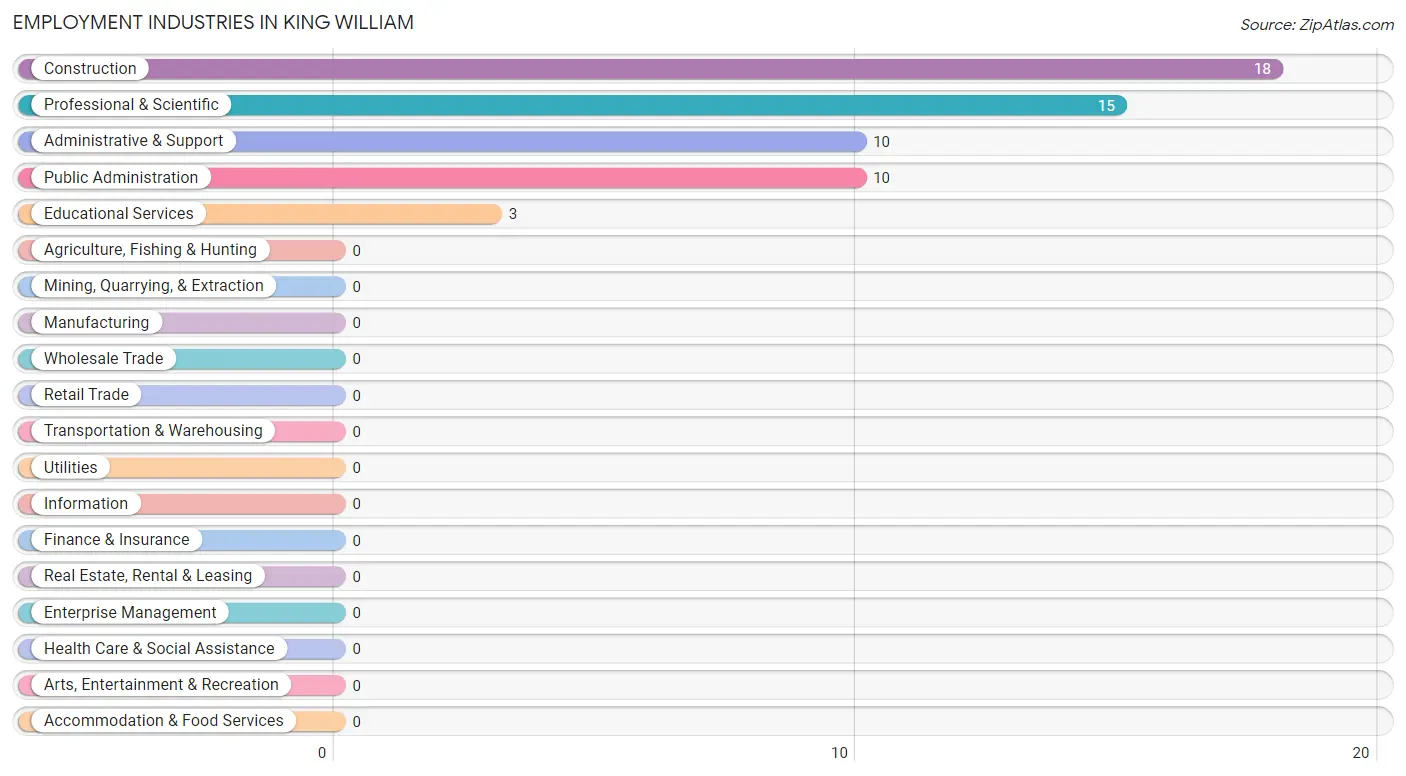
Employment Industries in King William
The major employment industries in King William include Construction (18 | 22.2%), Professional & Scientific (15 | 18.5%), Administrative & Support (10 | 12.3%), Public Administration (10 | 12.3%), and Educational Services (3 | 3.7%).
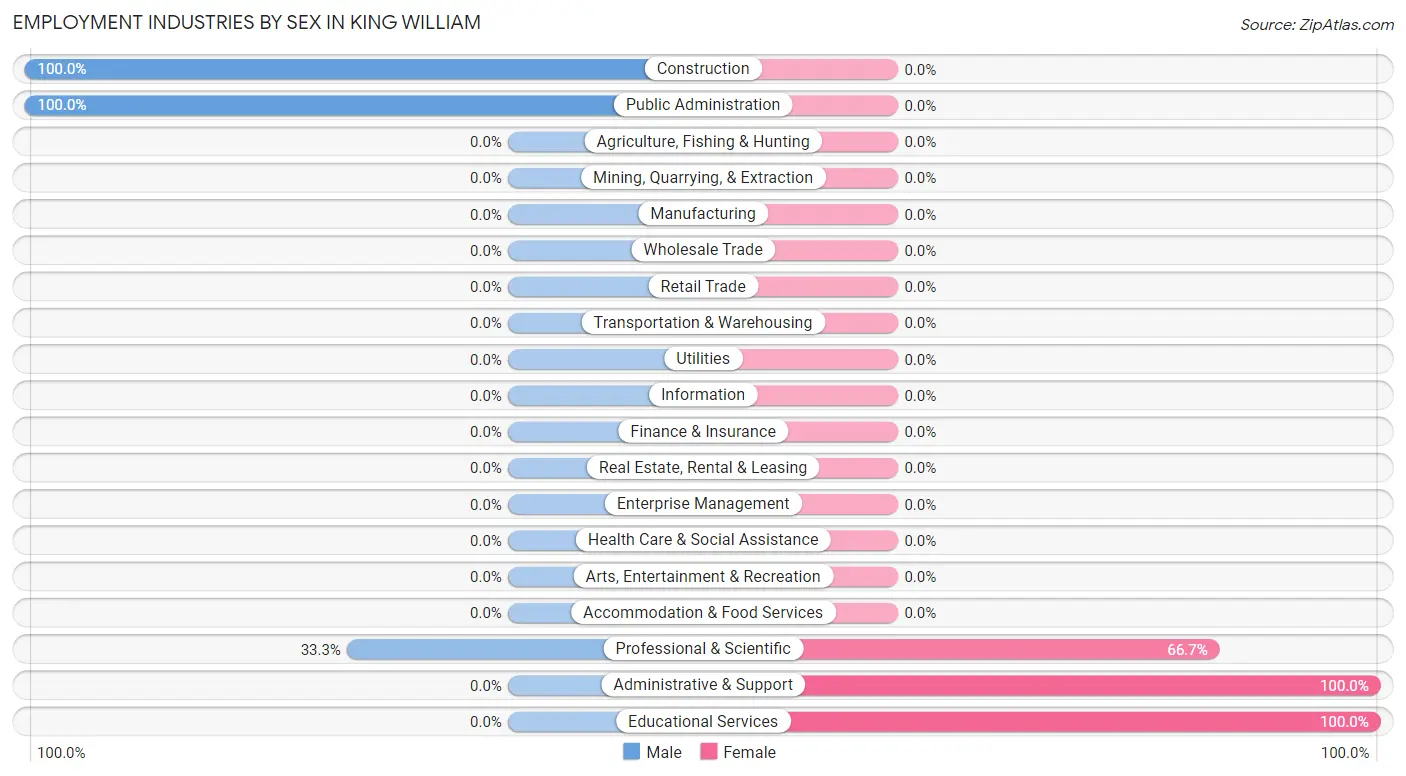
Employment Industries by Sex in King William
The King William industries that see more men than women are Construction (100.0%), Public Administration (100.0%), and Professional & Scientific (33.3%), whereas the industries that tend to have a higher number of women are Administrative & Support (100.0%), Educational Services (100.0%), and Professional & Scientific (66.7%).
| Industry | Male | Female |
| Agriculture, Fishing & Hunting | 0 (0.0%) | 0 (0.0%) |
| Mining, Quarrying, & Extraction | 0 (0.0%) | 0 (0.0%) |
| Construction | 18 (100.0%) | 0 (0.0%) |
| Manufacturing | 0 (0.0%) | 0 (0.0%) |
| Wholesale Trade | 0 (0.0%) | 0 (0.0%) |
| Retail Trade | 0 (0.0%) | 0 (0.0%) |
| Transportation & Warehousing | 0 (0.0%) | 0 (0.0%) |
| Utilities | 0 (0.0%) | 0 (0.0%) |
| Information | 0 (0.0%) | 0 (0.0%) |
| Finance & Insurance | 0 (0.0%) | 0 (0.0%) |
| Real Estate, Rental & Leasing | 0 (0.0%) | 0 (0.0%) |
| Professional & Scientific | 5 (33.3%) | 10 (66.7%) |
| Enterprise Management | 0 (0.0%) | 0 (0.0%) |
| Administrative & Support | 0 (0.0%) | 10 (100.0%) |
| Educational Services | 0 (0.0%) | 3 (100.0%) |
| Health Care & Social Assistance | 0 (0.0%) | 0 (0.0%) |
| Arts, Entertainment & Recreation | 0 (0.0%) | 0 (0.0%) |
| Accommodation & Food Services | 0 (0.0%) | 0 (0.0%) |
| Public Administration | 10 (100.0%) | 0 (0.0%) |
| Total | 48 (59.3%) | 33 (40.7%) |
Education in King William
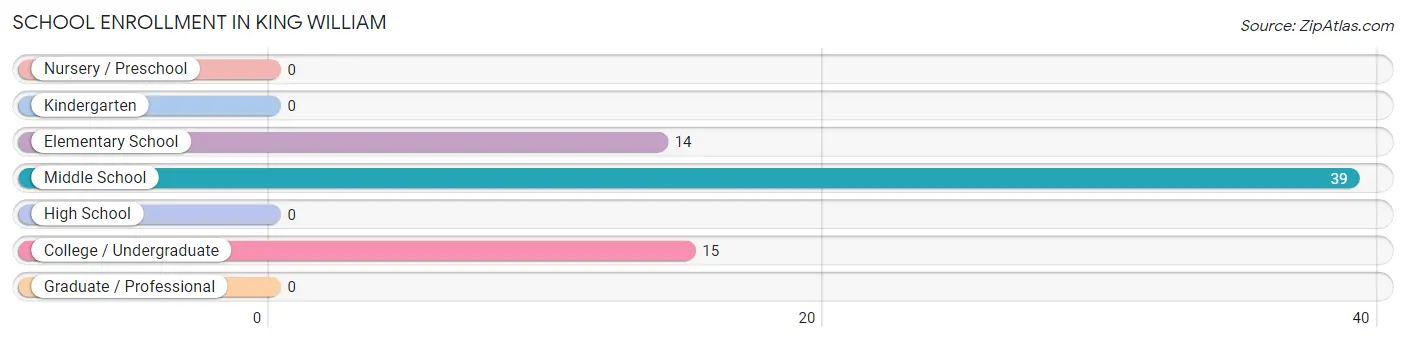
School Enrollment in King William
The most common levels of schooling among the 68 students in King William are middle school (39 | 57.4%), college / undergraduate (15 | 22.1%), and elementary school (14 | 20.6%).
| School Level | # Students | % Students |
| Nursery / Preschool | 0 | 0.0% |
| Kindergarten | 0 | 0.0% |
| Elementary School | 14 | 20.6% |
| Middle School | 39 | 57.4% |
| High School | 0 | 0.0% |
| College / Undergraduate | 15 | 22.1% |
| Graduate / Professional | 0 | 0.0% |
| Total | 68 | 100.0% |
School Enrollment by Age by Funding Source in King William
Out of a total of 68 students who are enrolled in schools in King William, 10 (14.7%) attend a private institution, while the remaining 58 (85.3%) are enrolled in public schools. The age group of 10 to 14 year olds has the highest likelihood of being enrolled in private schools, with 10 (25.6% in the age bracket) enrolled. Conversely, the age group of 5 to 9 year old has the lowest likelihood of being enrolled in a private school, with 14 (100.0% in the age bracket) attending a public institution.
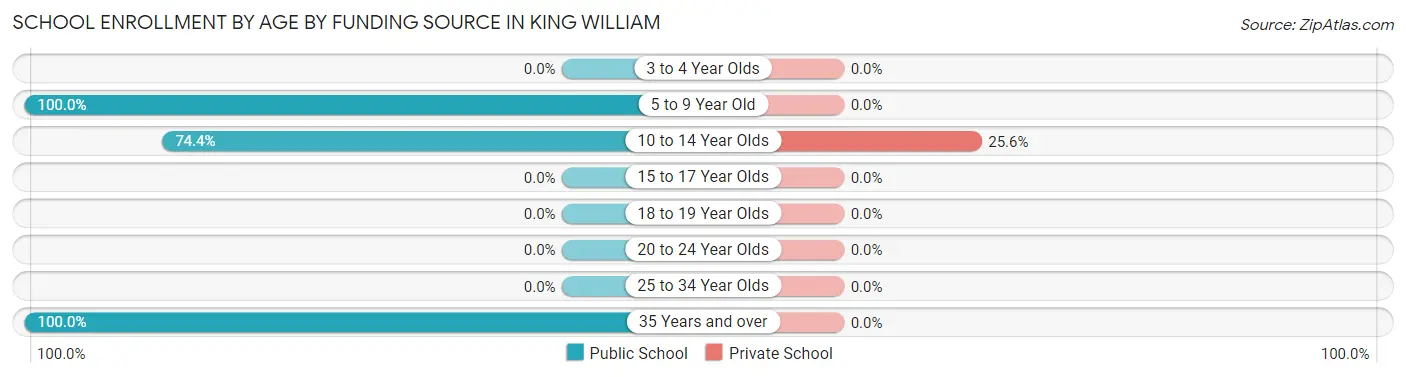
| Age Bracket | Public School | Private School |
| 3 to 4 Year Olds | 0 (0.0%) | 0 (0.0%) |
| 5 to 9 Year Old | 14 (100.0%) | 0 (0.0%) |
| 10 to 14 Year Olds | 29 (74.4%) | 10 (25.6%) |
| 15 to 17 Year Olds | 0 (0.0%) | 0 (0.0%) |
| 18 to 19 Year Olds | 0 (0.0%) | 0 (0.0%) |
| 20 to 24 Year Olds | 0 (0.0%) | 0 (0.0%) |
| 25 to 34 Year Olds | 0 (0.0%) | 0 (0.0%) |
| 35 Years and over | 15 (100.0%) | 0 (0.0%) |
| Total | 58 (85.3%) | 10 (14.7%) |
Educational Attainment by Field of Study in King William
Arts & humanities (10 | 40.0%), engineering (5 | 20.0%), science & technology (5 | 20.0%), education (3 | 12.0%), and business (2 | 8.0%) are the most common fields of study among 25 individuals in King William who have obtained a bachelor's degree or higher.
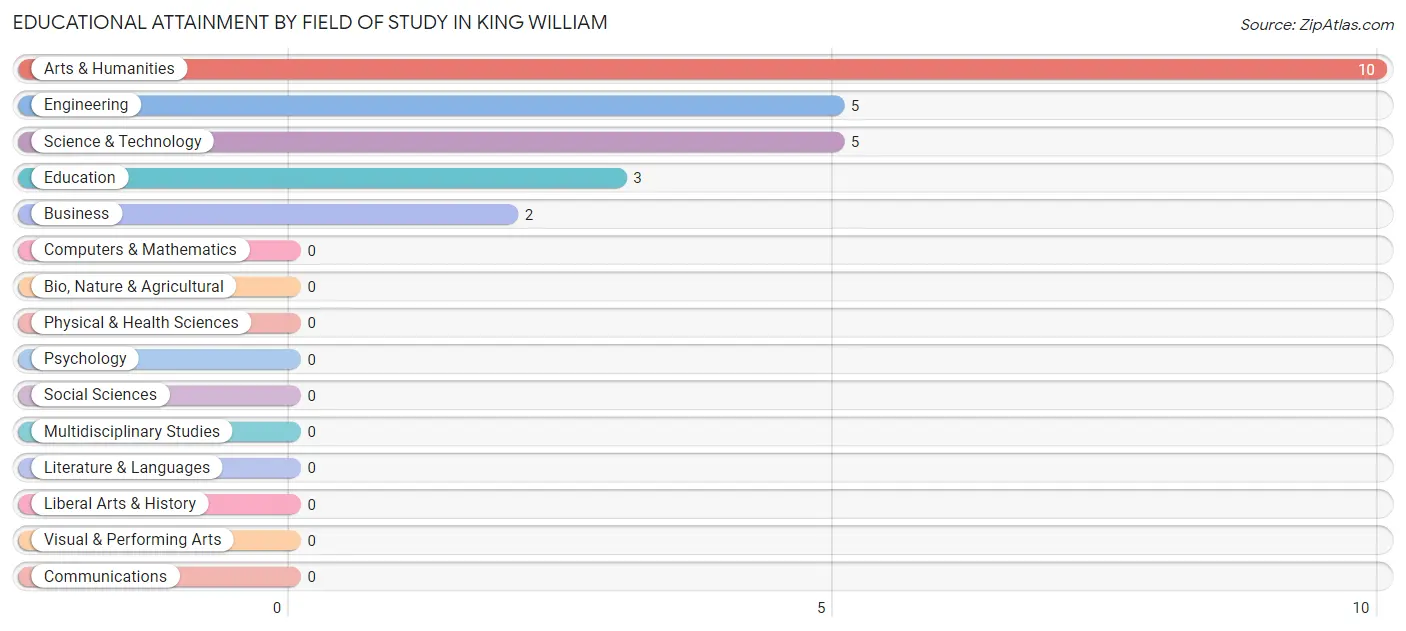
| Field of Study | # Graduates | % Graduates |
| Computers & Mathematics | 0 | 0.0% |
| Bio, Nature & Agricultural | 0 | 0.0% |
| Physical & Health Sciences | 0 | 0.0% |
| Psychology | 0 | 0.0% |
| Social Sciences | 0 | 0.0% |
| Engineering | 5 | 20.0% |
| Multidisciplinary Studies | 0 | 0.0% |
| Science & Technology | 5 | 20.0% |
| Business | 2 | 8.0% |
| Education | 3 | 12.0% |
| Literature & Languages | 0 | 0.0% |
| Liberal Arts & History | 0 | 0.0% |
| Visual & Performing Arts | 0 | 0.0% |
| Communications | 0 | 0.0% |
| Arts & Humanities | 10 | 40.0% |
| Total | 25 | 100.0% |
Transportation & Commute in King William
Vehicle Availability by Sex in King William
The most prevalent vehicle ownership categories in King William are males with 2 vehicles (18, accounting for 37.5%) and females with 2 vehicles (3, making up 54.5%).
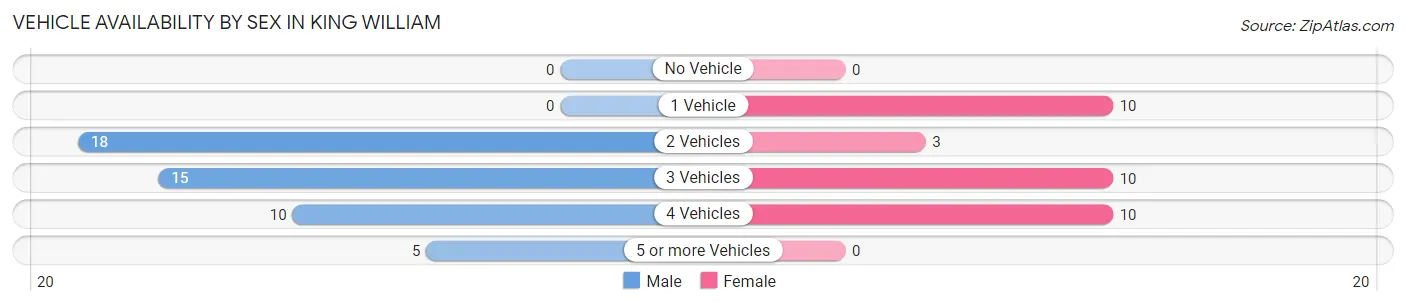
| Vehicles Available | Male | Female |
| No Vehicle | 0 (0.0%) | 0 (0.0%) |
| 1 Vehicle | 0 (0.0%) | 10 (30.3%) |
| 2 Vehicles | 18 (37.5%) | 3 (9.1%) |
| 3 Vehicles | 15 (31.2%) | 10 (30.3%) |
| 4 Vehicles | 10 (20.8%) | 10 (30.3%) |
| 5 or more Vehicles | 5 (10.4%) | 0 (0.0%) |
| Total | 48 (100.0%) | 33 (100.0%) |
Commute Time in King William
The most frequently occuring commute durations in King William are 45 to 59 minutes (22 commuters, 27.2%), 30 to 34 minutes (20 commuters, 24.7%), and 60 to 89 minutes (20 commuters, 24.7%).
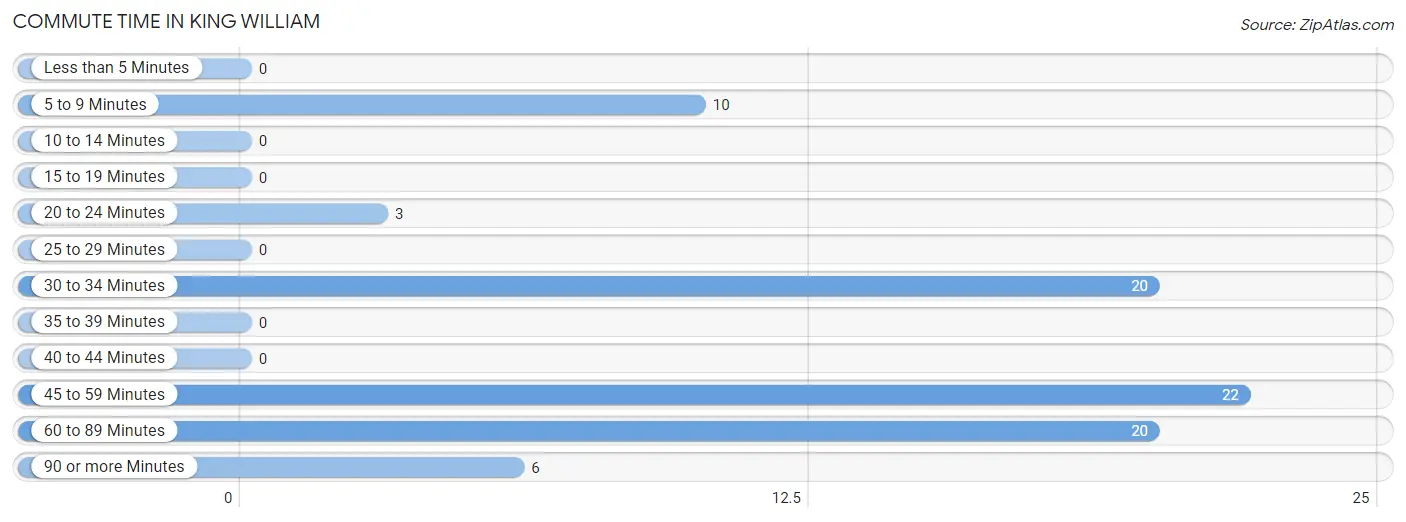
| Commute Time | # Commuters | % Commuters |
| Less than 5 Minutes | 0 | 0.0% |
| 5 to 9 Minutes | 10 | 12.3% |
| 10 to 14 Minutes | 0 | 0.0% |
| 15 to 19 Minutes | 0 | 0.0% |
| 20 to 24 Minutes | 3 | 3.7% |
| 25 to 29 Minutes | 0 | 0.0% |
| 30 to 34 Minutes | 20 | 24.7% |
| 35 to 39 Minutes | 0 | 0.0% |
| 40 to 44 Minutes | 0 | 0.0% |
| 45 to 59 Minutes | 22 | 27.2% |
| 60 to 89 Minutes | 20 | 24.7% |
| 90 or more Minutes | 6 | 7.4% |
Commute Time by Sex in King William
The most common commute times in King William are 60 to 89 minutes (17 commuters, 35.4%) for males and 5 to 9 minutes (10 commuters, 30.3%) for females.
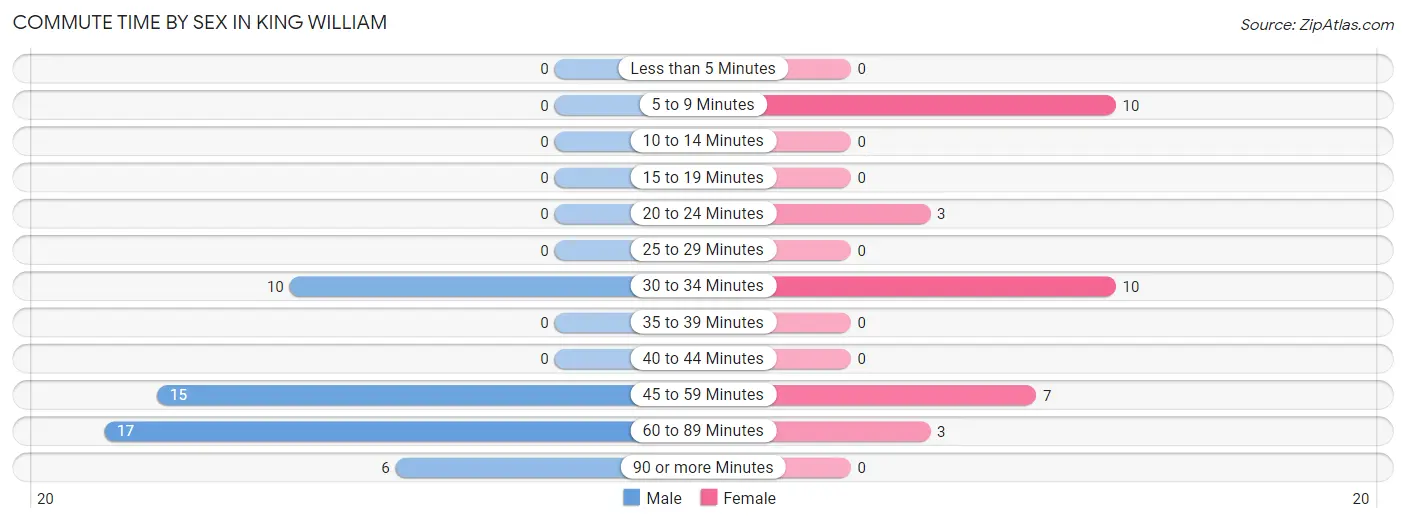
| Commute Time | Male | Female |
| Less than 5 Minutes | 0 (0.0%) | 0 (0.0%) |
| 5 to 9 Minutes | 0 (0.0%) | 10 (30.3%) |
| 10 to 14 Minutes | 0 (0.0%) | 0 (0.0%) |
| 15 to 19 Minutes | 0 (0.0%) | 0 (0.0%) |
| 20 to 24 Minutes | 0 (0.0%) | 3 (9.1%) |
| 25 to 29 Minutes | 0 (0.0%) | 0 (0.0%) |
| 30 to 34 Minutes | 10 (20.8%) | 10 (30.3%) |
| 35 to 39 Minutes | 0 (0.0%) | 0 (0.0%) |
| 40 to 44 Minutes | 0 (0.0%) | 0 (0.0%) |
| 45 to 59 Minutes | 15 (31.2%) | 7 (21.2%) |
| 60 to 89 Minutes | 17 (35.4%) | 3 (9.1%) |
| 90 or more Minutes | 6 (12.5%) | 0 (0.0%) |
Time of Departure to Work by Sex in King William
The most frequent times of departure to work in King William are 8:00 AM to 8:29 AM (21, 43.8%) for males and 10:00 AM to 10:59 AM (20, 60.6%) for females.
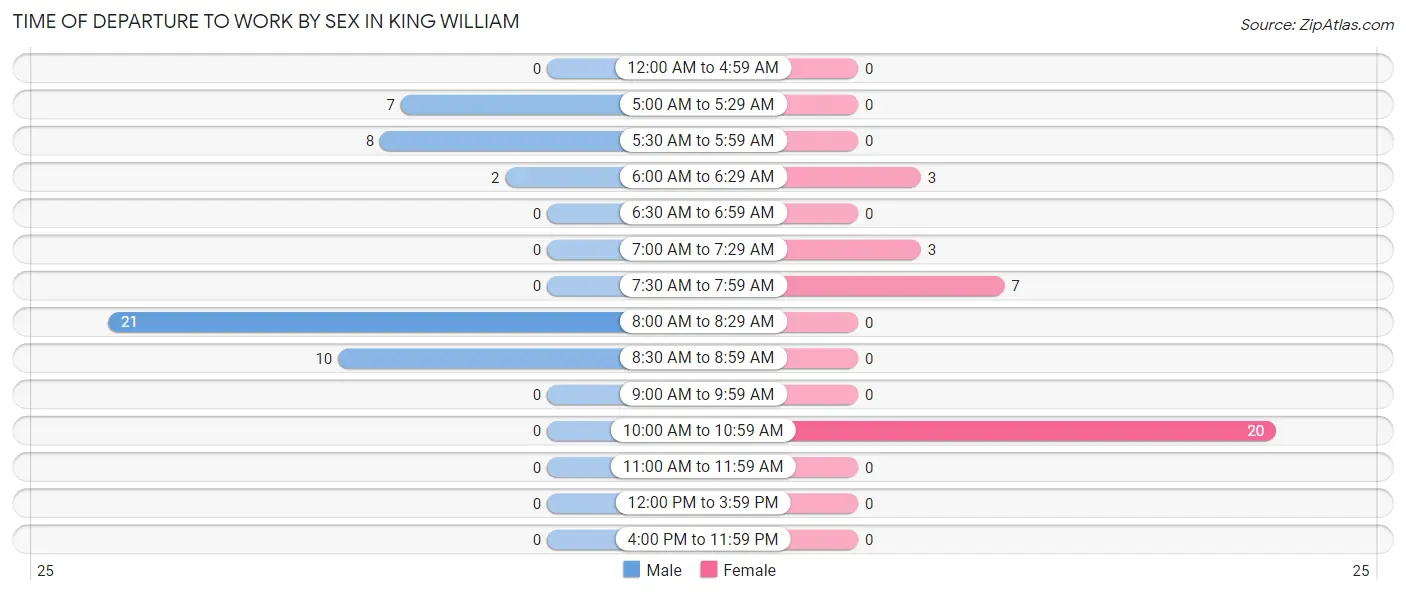
| Time of Departure | Male | Female |
| 12:00 AM to 4:59 AM | 0 (0.0%) | 0 (0.0%) |
| 5:00 AM to 5:29 AM | 7 (14.6%) | 0 (0.0%) |
| 5:30 AM to 5:59 AM | 8 (16.7%) | 0 (0.0%) |
| 6:00 AM to 6:29 AM | 2 (4.2%) | 3 (9.1%) |
| 6:30 AM to 6:59 AM | 0 (0.0%) | 0 (0.0%) |
| 7:00 AM to 7:29 AM | 0 (0.0%) | 3 (9.1%) |
| 7:30 AM to 7:59 AM | 0 (0.0%) | 7 (21.2%) |
| 8:00 AM to 8:29 AM | 21 (43.8%) | 0 (0.0%) |
| 8:30 AM to 8:59 AM | 10 (20.8%) | 0 (0.0%) |
| 9:00 AM to 9:59 AM | 0 (0.0%) | 0 (0.0%) |
| 10:00 AM to 10:59 AM | 0 (0.0%) | 20 (60.6%) |
| 11:00 AM to 11:59 AM | 0 (0.0%) | 0 (0.0%) |
| 12:00 PM to 3:59 PM | 0 (0.0%) | 0 (0.0%) |
| 4:00 PM to 11:59 PM | 0 (0.0%) | 0 (0.0%) |
| Total | 48 (100.0%) | 33 (100.0%) |
Housing Occupancy in King William
Occupancy by Ownership in King William
Of the total 43 dwellings in King William, owner-occupied units account for 36 (83.7%), while renter-occupied units make up 7 (16.3%).
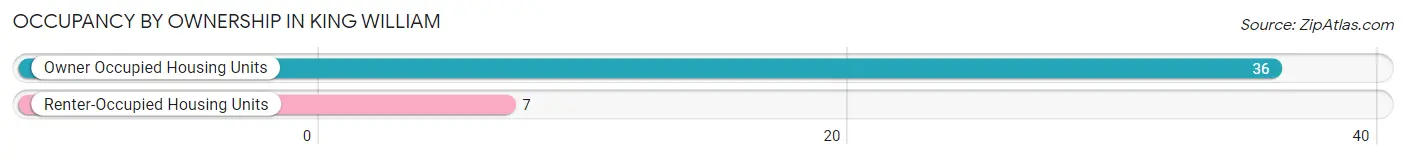
| Occupancy | # Housing Units | % Housing Units |
| Owner Occupied Housing Units | 36 | 83.7% |
| Renter-Occupied Housing Units | 7 | 16.3% |
| Total Occupied Housing Units | 43 | 100.0% |
Occupancy by Household Size in King William
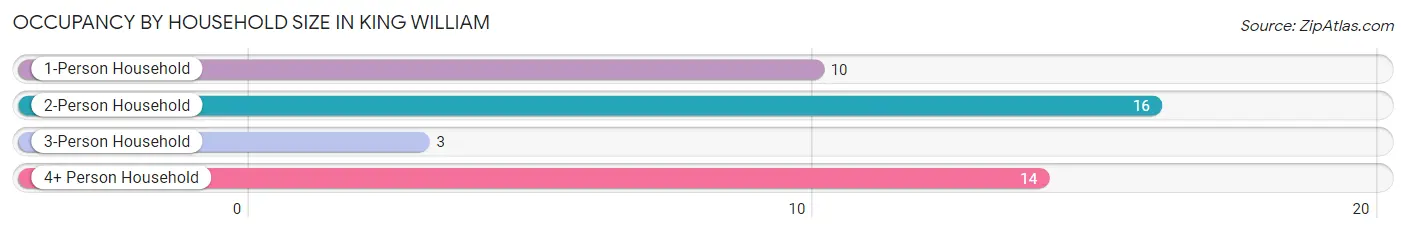
| Household Size | # Housing Units | % Housing Units |
| 1-Person Household | 10 | 23.3% |
| 2-Person Household | 16 | 37.2% |
| 3-Person Household | 3 | 7.0% |
| 4+ Person Household | 14 | 32.6% |
| Total Housing Units | 43 | 100.0% |
Occupancy by Ownership by Household Size in King William
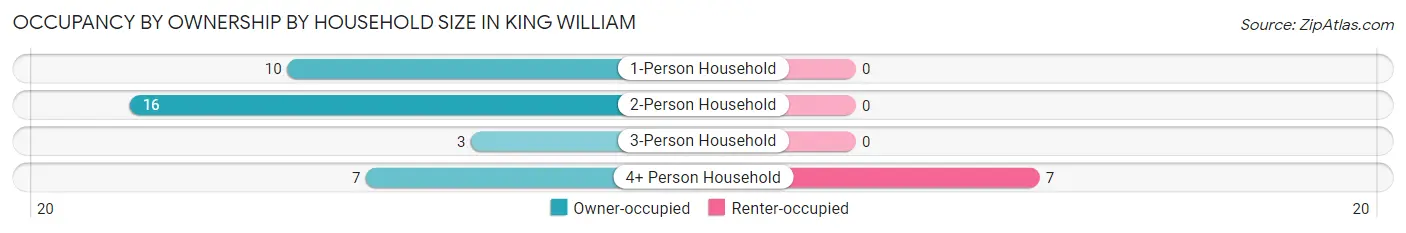
| Household Size | Owner-occupied | Renter-occupied |
| 1-Person Household | 10 (100.0%) | 0 (0.0%) |
| 2-Person Household | 16 (100.0%) | 0 (0.0%) |
| 3-Person Household | 3 (100.0%) | 0 (0.0%) |
| 4+ Person Household | 7 (50.0%) | 7 (50.0%) |
| Total Housing Units | 36 (83.7%) | 7 (16.3%) |
Occupancy by Educational Attainment in King William
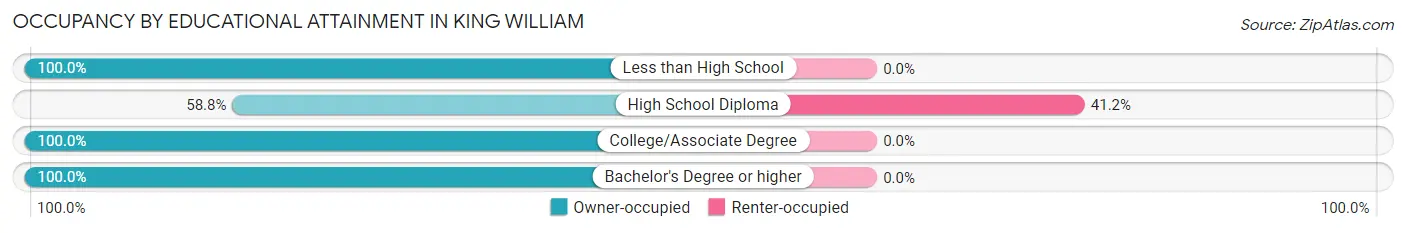
| Household Size | Owner-occupied | Renter-occupied |
| Less than High School | 6 (100.0%) | 0 (0.0%) |
| High School Diploma | 10 (58.8%) | 7 (41.2%) |
| College/Associate Degree | 13 (100.0%) | 0 (0.0%) |
| Bachelor's Degree or higher | 7 (100.0%) | 0 (0.0%) |
Occupancy by Age of Householder in King William
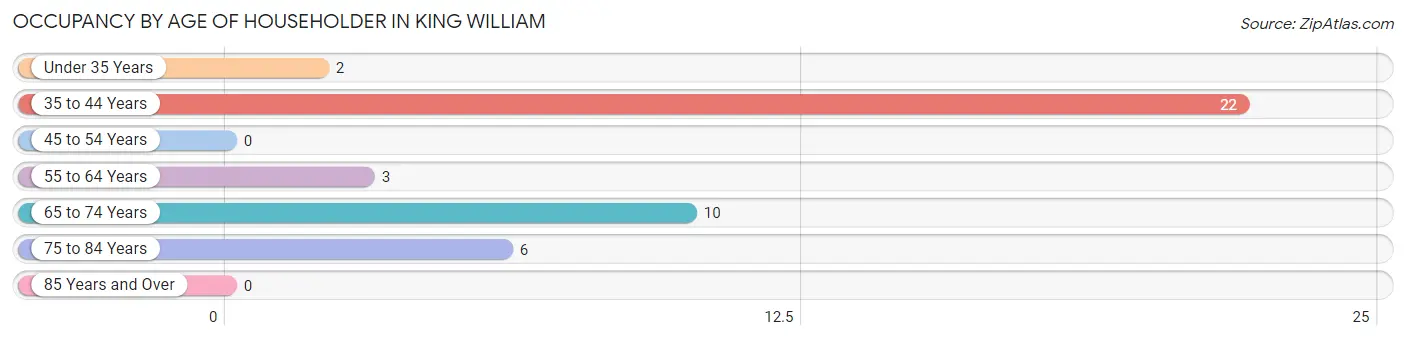
| Age Bracket | # Households | % Households |
| Under 35 Years | 2 | 4.6% |
| 35 to 44 Years | 22 | 51.2% |
| 45 to 54 Years | 0 | 0.0% |
| 55 to 64 Years | 3 | 7.0% |
| 65 to 74 Years | 10 | 23.3% |
| 75 to 84 Years | 6 | 14.0% |
| 85 Years and Over | 0 | 0.0% |
| Total | 43 | 100.0% |
Housing Finances in King William
Median Income by Occupancy in King William
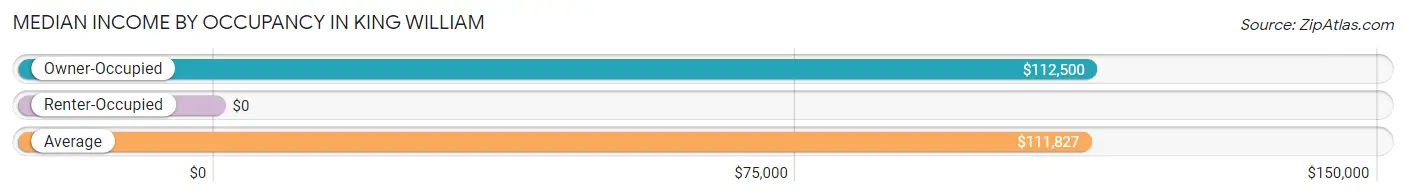
| Occupancy Type | # Households | Median Income |
| Owner-Occupied | 36 (83.7%) | $112,500 |
| Renter-Occupied | 7 (16.3%) | $0 |
| Average | 43 (100.0%) | $111,827 |
Occupancy by Householder Income Bracket in King William
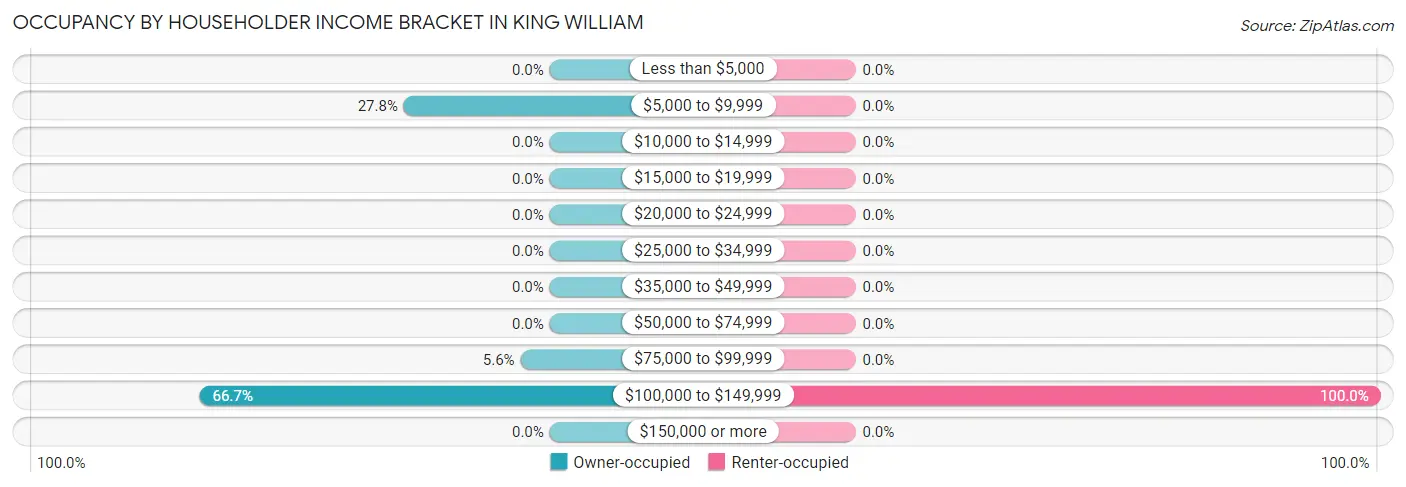
| Income Bracket | Owner-occupied | Renter-occupied |
| Less than $5,000 | 0 (0.0%) | 0 (0.0%) |
| $5,000 to $9,999 | 10 (27.8%) | 0 (0.0%) |
| $10,000 to $14,999 | 0 (0.0%) | 0 (0.0%) |
| $15,000 to $19,999 | 0 (0.0%) | 0 (0.0%) |
| $20,000 to $24,999 | 0 (0.0%) | 0 (0.0%) |
| $25,000 to $34,999 | 0 (0.0%) | 0 (0.0%) |
| $35,000 to $49,999 | 0 (0.0%) | 0 (0.0%) |
| $50,000 to $74,999 | 0 (0.0%) | 0 (0.0%) |
| $75,000 to $99,999 | 2 (5.6%) | 0 (0.0%) |
| $100,000 to $149,999 | 24 (66.7%) | 7 (100.0%) |
| $150,000 or more | 0 (0.0%) | 0 (0.0%) |
| Total | 36 (100.0%) | 7 (100.0%) |
Monthly Housing Cost Tiers in King William
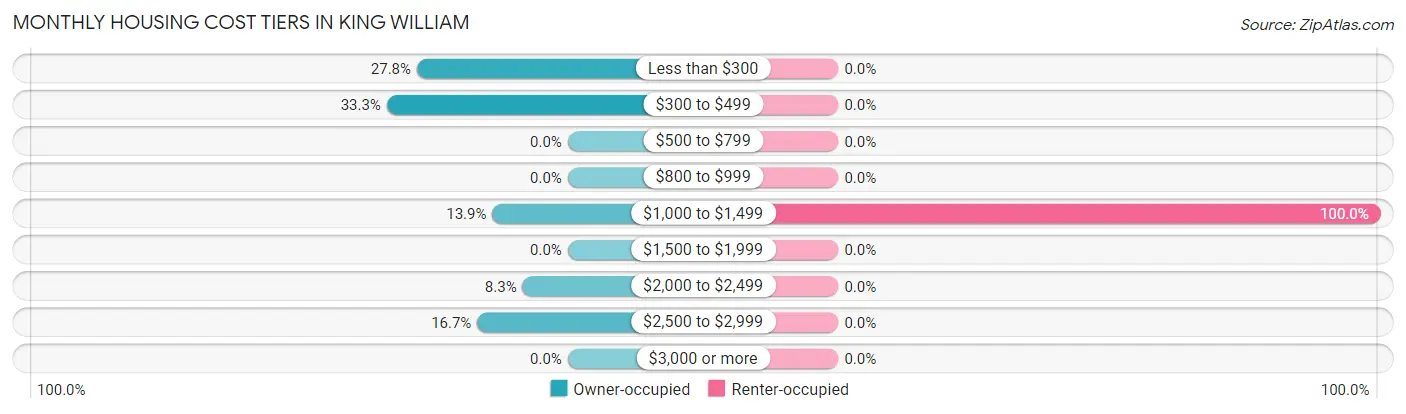
| Monthly Cost | Owner-occupied | Renter-occupied |
| Less than $300 | 10 (27.8%) | 0 (0.0%) |
| $300 to $499 | 12 (33.3%) | 0 (0.0%) |
| $500 to $799 | 0 (0.0%) | 0 (0.0%) |
| $800 to $999 | 0 (0.0%) | 0 (0.0%) |
| $1,000 to $1,499 | 5 (13.9%) | 7 (100.0%) |
| $1,500 to $1,999 | 0 (0.0%) | 0 (0.0%) |
| $2,000 to $2,499 | 3 (8.3%) | 0 (0.0%) |
| $2,500 to $2,999 | 6 (16.7%) | 0 (0.0%) |
| $3,000 or more | 0 (0.0%) | 0 (0.0%) |
| Total | 36 (100.0%) | 7 (100.0%) |
Physical Housing Characteristics in King William
Housing Structures in King William
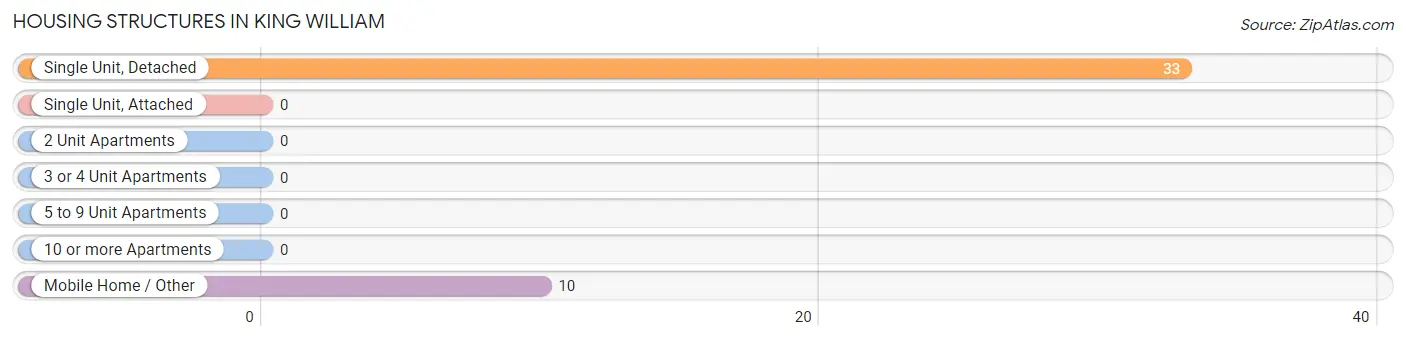
| Structure Type | # Housing Units | % Housing Units |
| Single Unit, Detached | 33 | 76.7% |
| Single Unit, Attached | 0 | 0.0% |
| 2 Unit Apartments | 0 | 0.0% |
| 3 or 4 Unit Apartments | 0 | 0.0% |
| 5 to 9 Unit Apartments | 0 | 0.0% |
| 10 or more Apartments | 0 | 0.0% |
| Mobile Home / Other | 10 | 23.3% |
| Total | 43 | 100.0% |
Housing Structures by Occupancy in King William
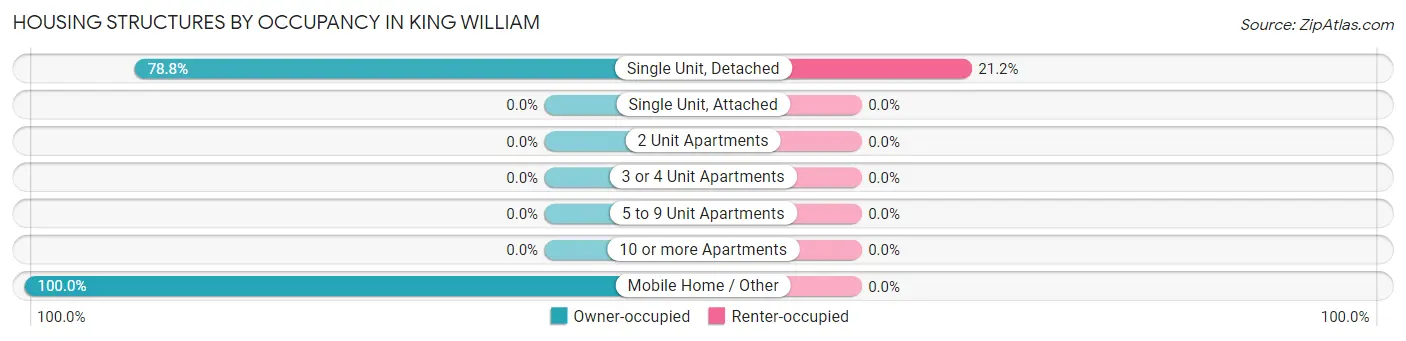
| Structure Type | Owner-occupied | Renter-occupied |
| Single Unit, Detached | 26 (78.8%) | 7 (21.2%) |
| Single Unit, Attached | 0 (0.0%) | 0 (0.0%) |
| 2 Unit Apartments | 0 (0.0%) | 0 (0.0%) |
| 3 or 4 Unit Apartments | 0 (0.0%) | 0 (0.0%) |
| 5 to 9 Unit Apartments | 0 (0.0%) | 0 (0.0%) |
| 10 or more Apartments | 0 (0.0%) | 0 (0.0%) |
| Mobile Home / Other | 10 (100.0%) | 0 (0.0%) |
| Total | 36 (83.7%) | 7 (16.3%) |
Housing Structures by Number of Rooms in King William
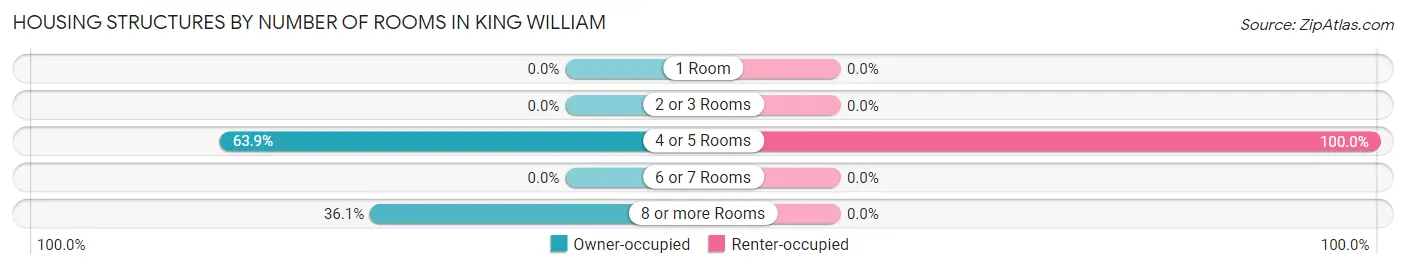
| Number of Rooms | Owner-occupied | Renter-occupied |
| 1 Room | 0 (0.0%) | 0 (0.0%) |
| 2 or 3 Rooms | 0 (0.0%) | 0 (0.0%) |
| 4 or 5 Rooms | 23 (63.9%) | 7 (100.0%) |
| 6 or 7 Rooms | 0 (0.0%) | 0 (0.0%) |
| 8 or more Rooms | 13 (36.1%) | 0 (0.0%) |
| Total | 36 (100.0%) | 7 (100.0%) |
Housing Structure by Heating Type in King William
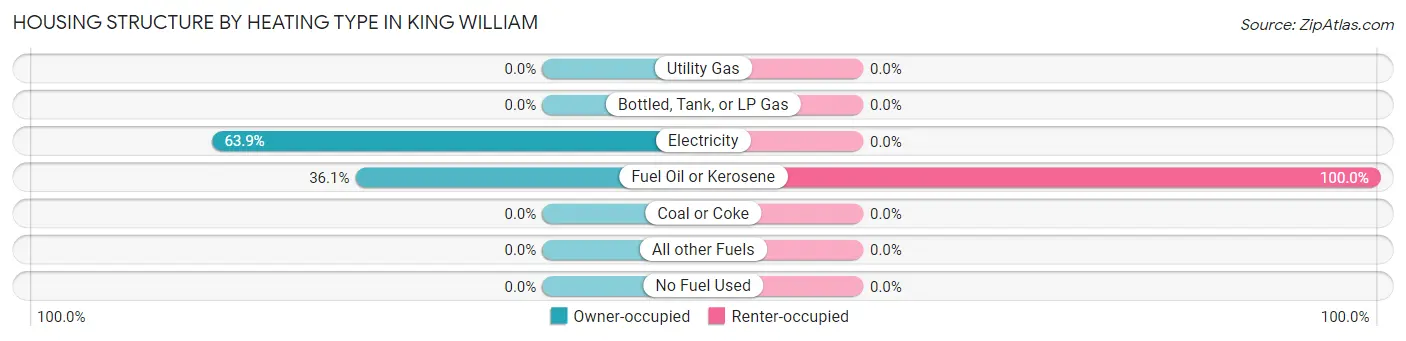
| Heating Type | Owner-occupied | Renter-occupied |
| Utility Gas | 0 (0.0%) | 0 (0.0%) |
| Bottled, Tank, or LP Gas | 0 (0.0%) | 0 (0.0%) |
| Electricity | 23 (63.9%) | 0 (0.0%) |
| Fuel Oil or Kerosene | 13 (36.1%) | 7 (100.0%) |
| Coal or Coke | 0 (0.0%) | 0 (0.0%) |
| All other Fuels | 0 (0.0%) | 0 (0.0%) |
| No Fuel Used | 0 (0.0%) | 0 (0.0%) |
| Total | 36 (100.0%) | 7 (100.0%) |
Household Vehicle Usage in King William
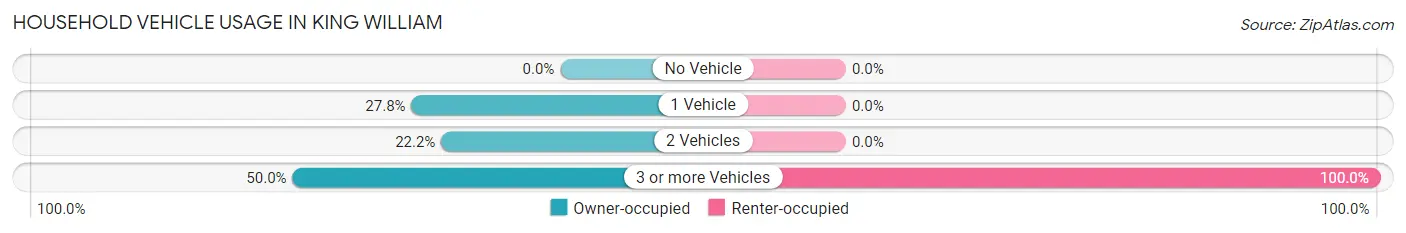
| Vehicles per Household | Owner-occupied | Renter-occupied |
| No Vehicle | 0 (0.0%) | 0 (0.0%) |
| 1 Vehicle | 10 (27.8%) | 0 (0.0%) |
| 2 Vehicles | 8 (22.2%) | 0 (0.0%) |
| 3 or more Vehicles | 18 (50.0%) | 7 (100.0%) |
| Total | 36 (100.0%) | 7 (100.0%) |
Real Estate & Mortgages in King William
Real Estate and Mortgage Overview in King William
| Characteristic | Without Mortgage | With Mortgage |
| Housing Units | 22 | 14 |
| Median Property Value | - | - |
| Median Household Income | - | - |
| Monthly Housing Costs | - | - |
| Real Estate Taxes | - | - |
Property Value by Mortgage Status in King William
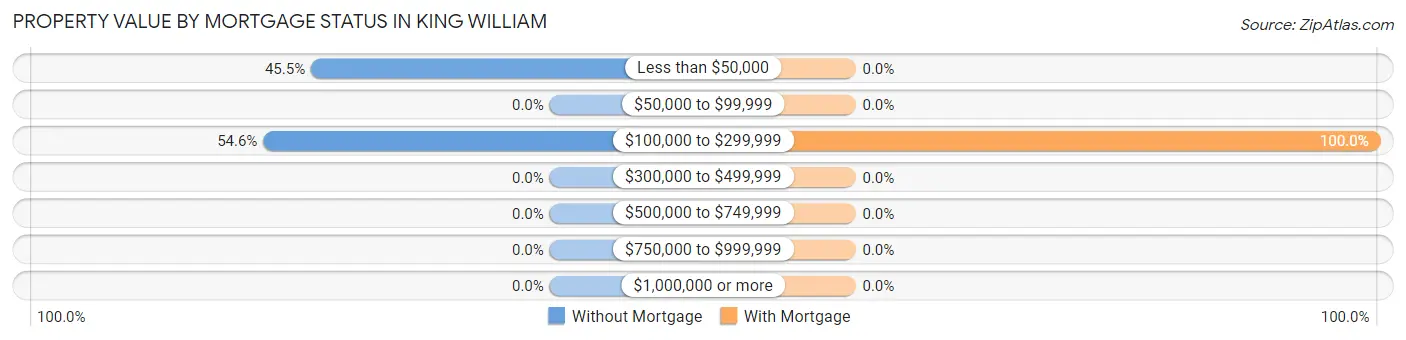
| Property Value | Without Mortgage | With Mortgage |
| Less than $50,000 | 10 (45.5%) | 0 (0.0%) |
| $50,000 to $99,999 | 0 (0.0%) | 0 (0.0%) |
| $100,000 to $299,999 | 12 (54.5%) | 14 (100.0%) |
| $300,000 to $499,999 | 0 (0.0%) | 0 (0.0%) |
| $500,000 to $749,999 | 0 (0.0%) | 0 (0.0%) |
| $750,000 to $999,999 | 0 (0.0%) | 0 (0.0%) |
| $1,000,000 or more | 0 (0.0%) | 0 (0.0%) |
| Total | 22 (100.0%) | 14 (100.0%) |
Household Income by Mortgage Status in King William
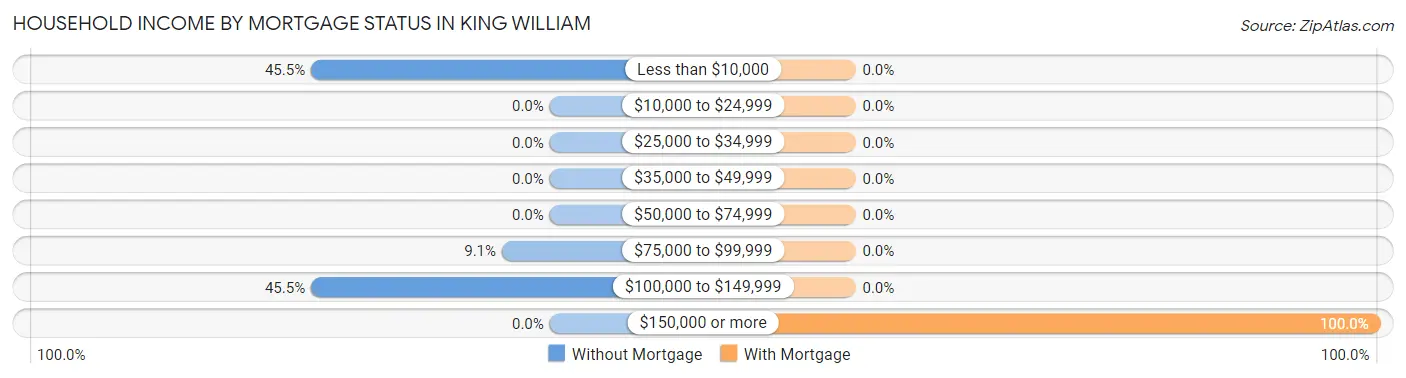
| Household Income | Without Mortgage | With Mortgage |
| Less than $10,000 | 10 (45.5%) | 0 (0.0%) |
| $10,000 to $24,999 | 0 (0.0%) | 0 (0.0%) |
| $25,000 to $34,999 | 0 (0.0%) | 0 (0.0%) |
| $35,000 to $49,999 | 0 (0.0%) | 0 (0.0%) |
| $50,000 to $74,999 | 0 (0.0%) | 0 (0.0%) |
| $75,000 to $99,999 | 2 (9.1%) | 0 (0.0%) |
| $100,000 to $149,999 | 10 (45.5%) | 0 (0.0%) |
| $150,000 or more | 0 (0.0%) | 14 (100.0%) |
| Total | 22 (100.0%) | 14 (100.0%) |
Property Value to Household Income Ratio in King William
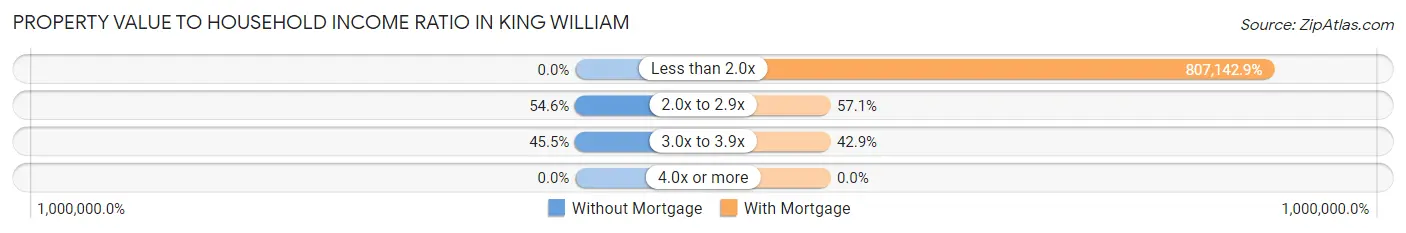
| Value-to-Income Ratio | Without Mortgage | With Mortgage |
| Less than 2.0x | 0 (0.0%) | 113,000 (807,142.9%) |
| 2.0x to 2.9x | 12 (54.5%) | 8 (57.1%) |
| 3.0x to 3.9x | 10 (45.5%) | 6 (42.9%) |
| 4.0x or more | 0 (0.0%) | 0 (0.0%) |
| Total | 22 (100.0%) | 14 (100.0%) |
Real Estate Taxes by Mortgage Status in King William
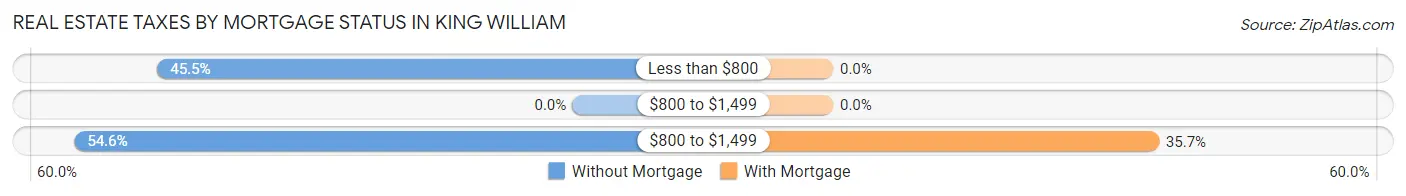
| Property Taxes | Without Mortgage | With Mortgage |
| Less than $800 | 10 (45.5%) | 0 (0.0%) |
| $800 to $1,499 | 0 (0.0%) | 0 (0.0%) |
| $800 to $1,499 | 12 (54.5%) | 5 (35.7%) |
| Total | 22 (100.0%) | 14 (100.0%) |
Health & Disability in King William
Health Insurance Coverage by Age in King William
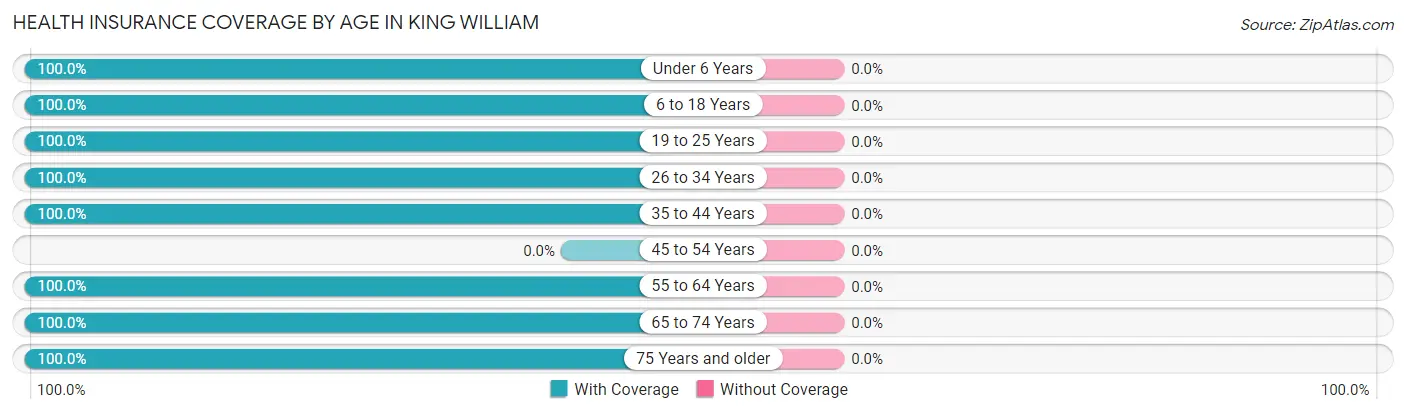
| Age Bracket | With Coverage | Without Coverage |
| Under 6 Years | 16 (100.0%) | 0 (0.0%) |
| 6 to 18 Years | 53 (100.0%) | 0 (0.0%) |
| 19 to 25 Years | 10 (100.0%) | 0 (0.0%) |
| 26 to 34 Years | 5 (100.0%) | 0 (0.0%) |
| 35 to 44 Years | 52 (100.0%) | 0 (0.0%) |
| 45 to 54 Years | 0 (0.0%) | 0 (0.0%) |
| 55 to 64 Years | 3 (100.0%) | 0 (0.0%) |
| 65 to 74 Years | 10 (100.0%) | 0 (0.0%) |
| 75 Years and older | 6 (100.0%) | 0 (0.0%) |
| Total | 155 (100.0%) | 0 (0.0%) |
Health Insurance Coverage by Citizenship Status in King William
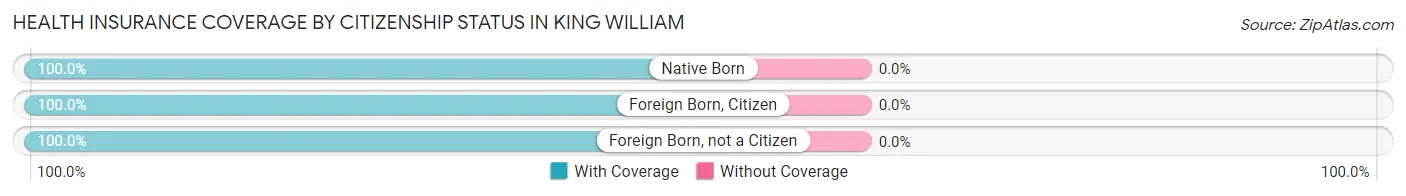
| Citizenship Status | With Coverage | Without Coverage |
| Native Born | 16 (100.0%) | 0 (0.0%) |
| Foreign Born, Citizen | 53 (100.0%) | 0 (0.0%) |
| Foreign Born, not a Citizen | 10 (100.0%) | 0 (0.0%) |
Health Insurance Coverage by Household Income in King William
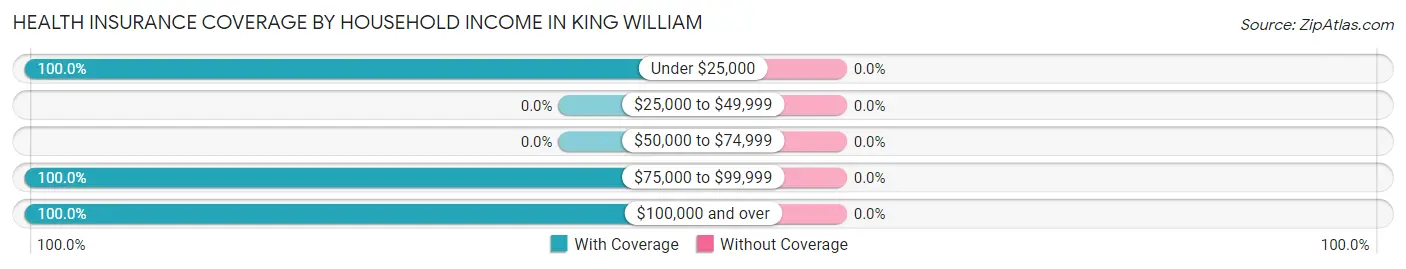
| Household Income | With Coverage | Without Coverage |
| Under $25,000 | 10 (100.0%) | 0 (0.0%) |
| $25,000 to $49,999 | 0 (0.0%) | 0 (0.0%) |
| $50,000 to $74,999 | 0 (0.0%) | 0 (0.0%) |
| $75,000 to $99,999 | 13 (100.0%) | 0 (0.0%) |
| $100,000 and over | 132 (100.0%) | 0 (0.0%) |
Public vs Private Health Insurance Coverage by Age in King William
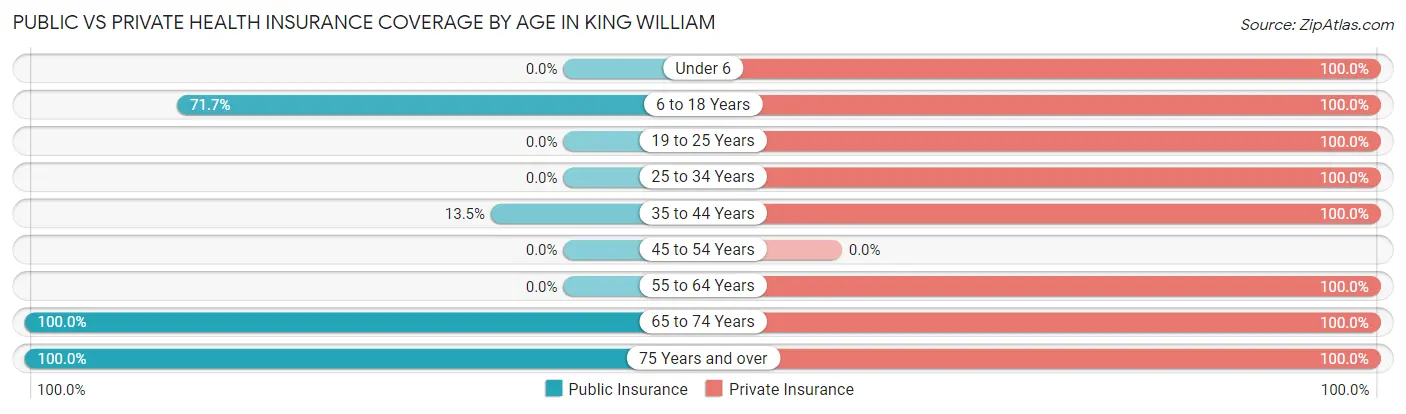
| Age Bracket | Public Insurance | Private Insurance |
| Under 6 | 0 (0.0%) | 16 (100.0%) |
| 6 to 18 Years | 38 (71.7%) | 53 (100.0%) |
| 19 to 25 Years | 0 (0.0%) | 10 (100.0%) |
| 25 to 34 Years | 0 (0.0%) | 5 (100.0%) |
| 35 to 44 Years | 7 (13.5%) | 52 (100.0%) |
| 45 to 54 Years | 0 (0.0%) | 0 (0.0%) |
| 55 to 64 Years | 0 (0.0%) | 3 (100.0%) |
| 65 to 74 Years | 10 (100.0%) | 10 (100.0%) |
| 75 Years and over | 6 (100.0%) | 6 (100.0%) |
| Total | 61 (39.4%) | 155 (100.0%) |
Disability Status by Sex by Age in King William
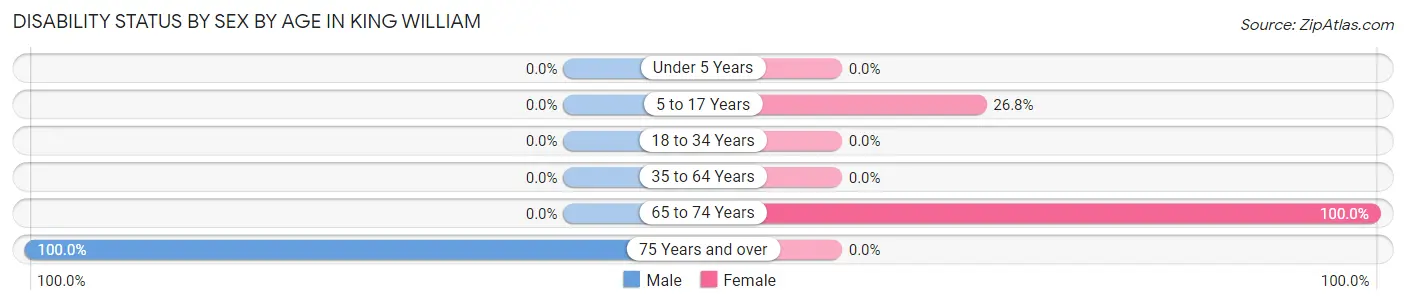
| Age Bracket | Male | Female |
| Under 5 Years | 0 (0.0%) | 0 (0.0%) |
| 5 to 17 Years | 0 (0.0%) | 11 (26.8%) |
| 18 to 34 Years | 0 (0.0%) | 0 (0.0%) |
| 35 to 64 Years | 0 (0.0%) | 0 (0.0%) |
| 65 to 74 Years | 0 (0.0%) | 10 (100.0%) |
| 75 Years and over | 6 (100.0%) | 0 (0.0%) |
Disability Class by Sex by Age in King William
Disability Class: Hearing Difficulty
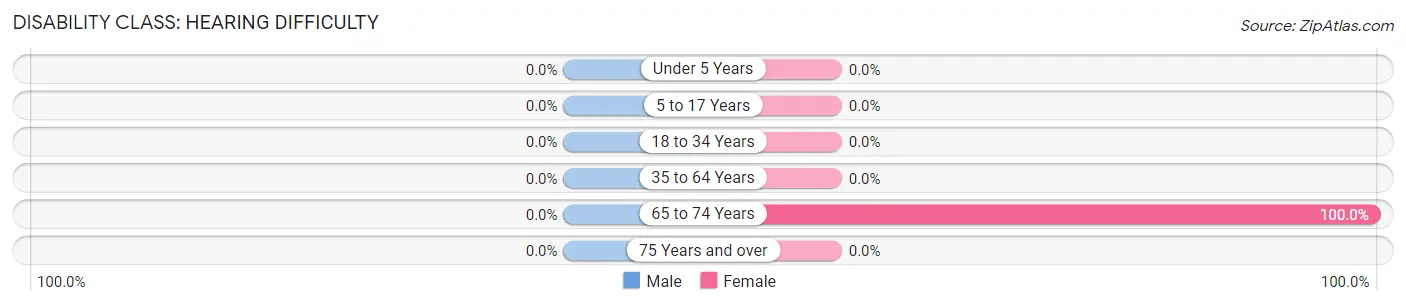
| Age Bracket | Male | Female |
| Under 5 Years | 0 (0.0%) | 0 (0.0%) |
| 5 to 17 Years | 0 (0.0%) | 0 (0.0%) |
| 18 to 34 Years | 0 (0.0%) | 0 (0.0%) |
| 35 to 64 Years | 0 (0.0%) | 0 (0.0%) |
| 65 to 74 Years | 0 (0.0%) | 10 (100.0%) |
| 75 Years and over | 0 (0.0%) | 0 (0.0%) |
Disability Class: Vision Difficulty
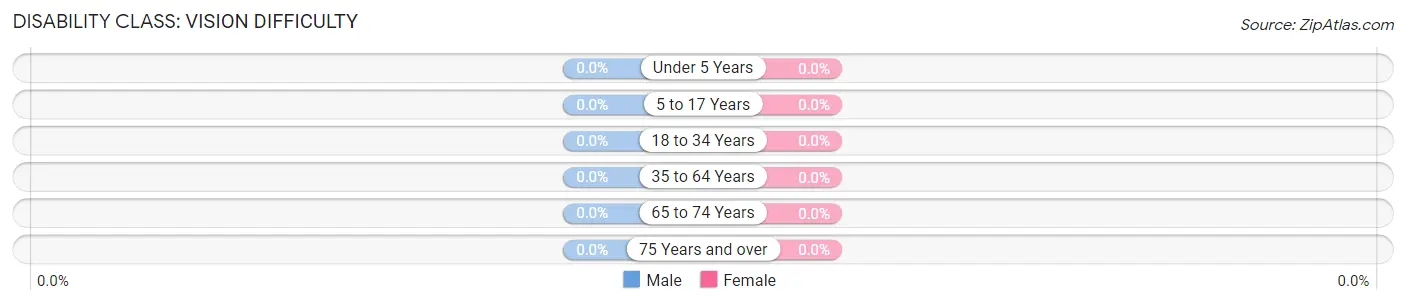
| Age Bracket | Male | Female |
| Under 5 Years | 0 (0.0%) | 0 (0.0%) |
| 5 to 17 Years | 0 (0.0%) | 0 (0.0%) |
| 18 to 34 Years | 0 (0.0%) | 0 (0.0%) |
| 35 to 64 Years | 0 (0.0%) | 0 (0.0%) |
| 65 to 74 Years | 0 (0.0%) | 0 (0.0%) |
| 75 Years and over | 0 (0.0%) | 0 (0.0%) |
Disability Class: Cognitive Difficulty
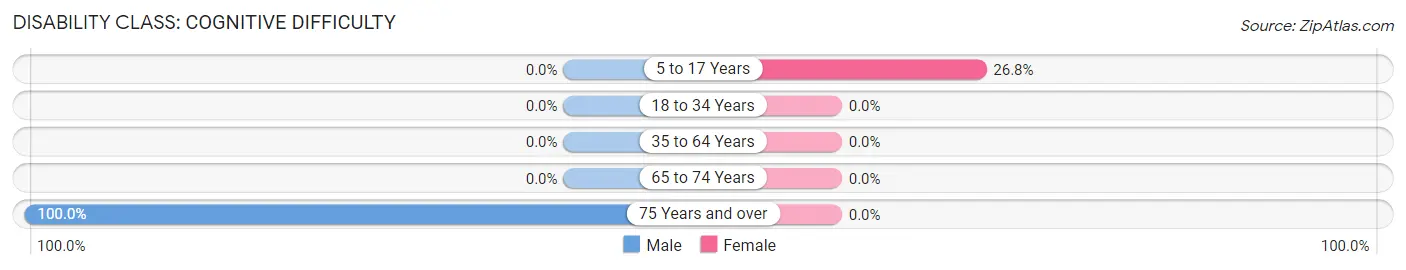
| Age Bracket | Male | Female |
| 5 to 17 Years | 0 (0.0%) | 11 (26.8%) |
| 18 to 34 Years | 0 (0.0%) | 0 (0.0%) |
| 35 to 64 Years | 0 (0.0%) | 0 (0.0%) |
| 65 to 74 Years | 0 (0.0%) | 0 (0.0%) |
| 75 Years and over | 6 (100.0%) | 0 (0.0%) |
Disability Class: Ambulatory Difficulty
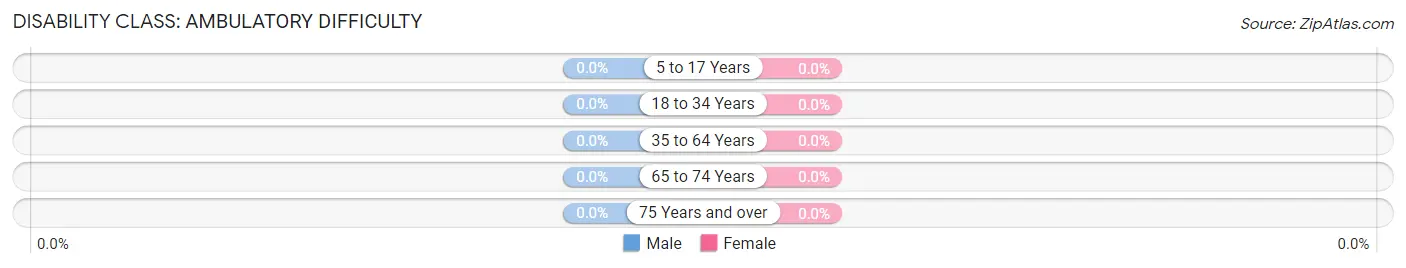
| Age Bracket | Male | Female |
| 5 to 17 Years | 0 (0.0%) | 0 (0.0%) |
| 18 to 34 Years | 0 (0.0%) | 0 (0.0%) |
| 35 to 64 Years | 0 (0.0%) | 0 (0.0%) |
| 65 to 74 Years | 0 (0.0%) | 0 (0.0%) |
| 75 Years and over | 0 (0.0%) | 0 (0.0%) |
Disability Class: Self-Care Difficulty
| Age Bracket | Male | Female |
| 5 to 17 Years | 0 (0.0%) | 0 (0.0%) |
| 18 to 34 Years | 0 (0.0%) | 0 (0.0%) |
| 35 to 64 Years | 0 (0.0%) | 0 (0.0%) |
| 65 to 74 Years | 0 (0.0%) | 0 (0.0%) |
| 75 Years and over | 0 (0.0%) | 0 (0.0%) |
Technology Access in King William
Computing Device Access in King William
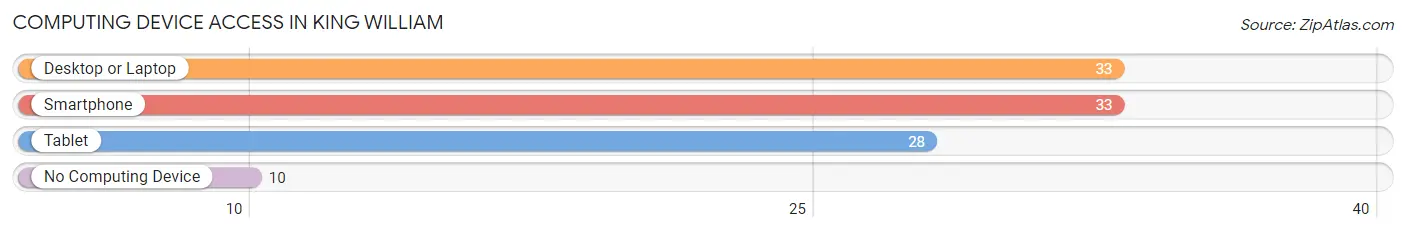
| Device Type | # Households | % Households |
| Desktop or Laptop | 33 | 76.7% |
| Smartphone | 33 | 76.7% |
| Tablet | 28 | 65.1% |
| No Computing Device | 10 | 23.3% |
| Total | 43 | 100.0% |
Internet Access in King William
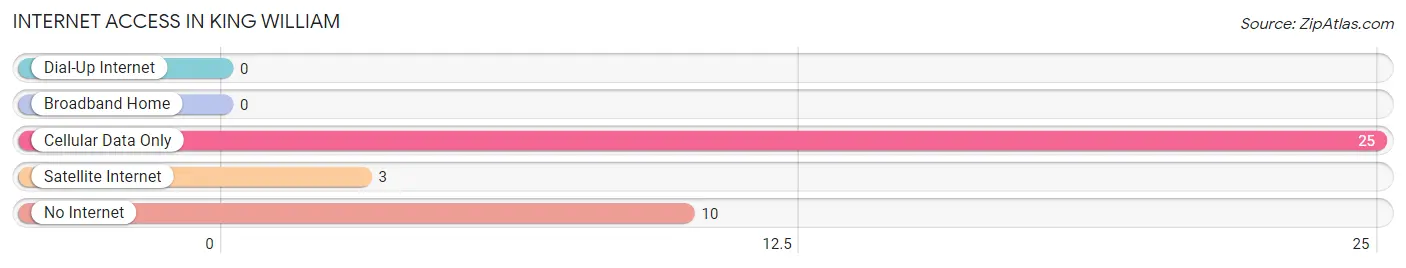
| Internet Type | # Households | % Households |
| Dial-Up Internet | 0 | 0.0% |
| Broadband Home | 0 | 0.0% |
| Cellular Data Only | 25 | 58.1% |
| Satellite Internet | 3 | 7.0% |
| No Internet | 10 | 23.3% |
| Total | 43 | 100.0% |
King William Summary
William, VA is a small town located in King and Queen County, Virginia. It is situated on the banks of the Mattaponi River, about 25 miles east of Richmond. The town was founded in 1702 and is named after King William III of England. The town has a population of approximately 1,000 people and is a part of the Richmond-Petersburg metropolitan area.
Geography
William, VA is located in the eastern part of King and Queen County, Virginia. It is situated on the banks of the Mattaponi River, about 25 miles east of Richmond. The town is surrounded by rolling hills and forests, and is located in the Piedmont region of Virginia. The climate in William is humid subtropical, with hot, humid summers and mild winters.
Economy
William, VA is a small town with a population of approximately 1,000 people. The town’s economy is largely based on agriculture and tourism. The town is home to several small businesses, including a grocery store, a hardware store, and a few restaurants. The town also has a few small manufacturing companies, such as a furniture factory and a woodworking shop.
Demographics
William, VA has a population of approximately 1,000 people. The town is predominantly white, with a small African American population. The median household income in William is $41,000, and the median home value is $150,000. The town has a low unemployment rate of 3.5%.
History
William, VA was founded in 1702 and is named after King William III of England. The town was originally a trading post for the local Native American tribes. In the late 1700s, the town was a major stop on the stagecoach route between Richmond and Norfolk. During the Civil War, the town was the site of several battles, including the Battle of King William Courthouse. After the war, the town experienced a period of economic growth, and several new businesses were established. In the late 1800s, the town was connected to the railroad, which further increased its economic growth.
Today, William, VA is a small town with a population of approximately 1,000 people. The town is home to several small businesses, and is a popular tourist destination. The town is also home to several historic sites, including the King William Courthouse and the King William Historic District.
Common Questions
What is Per Capita Income in King William?
Per Capita income in King William is $28,656.
What is the Median Family Income in King William?
Median Family Income in King William is $113,250.
What is the Median Household income in King William?
Median Household Income in King William is $111,827.
What is Income or Wage Gap in King William?
Income or Wage Gap in King William is 79.1%.
Women in King William earn 20.9 cents for every dollar earned by a man.
What is Inequality or Gini Index in King William?
Inequality or Gini Index in King William is 0.24.
What is the Total Population of King William?
Total Population of King William is 155.
What is the Total Male Population of King William?
Total Male Population of King William is 69.
What is the Total Female Population of King William?
Total Female Population of King William is 86.
What is the Ratio of Males per 100 Females in King William?
There are 80.23 Males per 100 Females in King William.
What is the Ratio of Females per 100 Males in King William?
There are 124.64 Females per 100 Males in King William.
What is the Median Population Age in King William?
Median Population Age in King William is 20.9 Years.
What is the Average Family Size in King William
Average Family Size in King William is 4.2 People.
What is the Average Household Size in King William
Average Household Size in King William is 3.6 People.
How Large is the Labor Force in King William?
There are 81 People in the Labor Forcein in King William.
What is the Percentage of People in the Labor Force in King William?
94.2% of People are in the Labor Force in King William.