Merrifield, VA Map & Demographics
Merrifield Map
Merrifield Overview
$73,188
PER CAPITA INCOME
$166,076
AVG FAMILY INCOME
$134,022
AVG HOUSEHOLD INCOME
22.8%
WAGE / INCOME GAP [ % ]
77.2¢/ $1
WAGE / INCOME GAP [ $ ]
$14,230
FAMILY INCOME DEFICIT
0.40
INEQUALITY / GINI INDEX
19,923
TOTAL POPULATION
10,207
MALE POPULATION
9,716
FEMALE POPULATION
105.05
MALES / 100 FEMALES
95.19
FEMALES / 100 MALES
33.8
MEDIAN AGE
2.9
AVG FAMILY SIZE
2.2
AVG HOUSEHOLD SIZE
13,766
LABOR FORCE [ PEOPLE ]
82.0%
PERCENT IN LABOR FORCE
2.1%
UNEMPLOYMENT RATE
Income in Merrifield
Income Overview in Merrifield
Per Capita Income in Merrifield is $73,188, while median incomes of families and households are $166,076 and $134,022 respectively.
| Characteristic | Number | Measure |
| Per Capita Income | 19,923 | $73,188 |
| Median Family Income | 4,979 | $166,076 |
| Mean Family Income | 4,979 | $180,069 |
| Median Household Income | 9,121 | $134,022 |
| Mean Household Income | 9,121 | $157,798 |
| Income Deficit | 4,979 | $14,230 |
| Wage / Income Gap (%) | 19,923 | 22.77% |
| Wage / Income Gap ($) | 19,923 | 77.23¢ per $1 |
| Gini / Inequality Index | 19,923 | 0.40 |
Earnings by Sex in Merrifield
Average Earnings in Merrifield are $79,013, $90,340 for men and $69,771 for women, a difference of 22.8%.
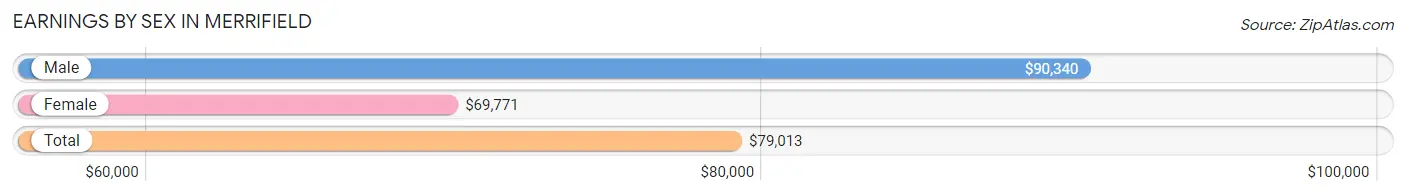
| Sex | Number | Average Earnings |
| Male | 7,577 (53.3%) | $90,340 |
| Female | 6,627 (46.7%) | $69,771 |
| Total | 14,204 (100.0%) | $79,013 |
Earnings by Sex by Income Bracket in Merrifield
The most common earnings brackets in Merrifield are $100,000+ for men (3,206 | 42.3%) and $100,000+ for women (2,035 | 30.7%).
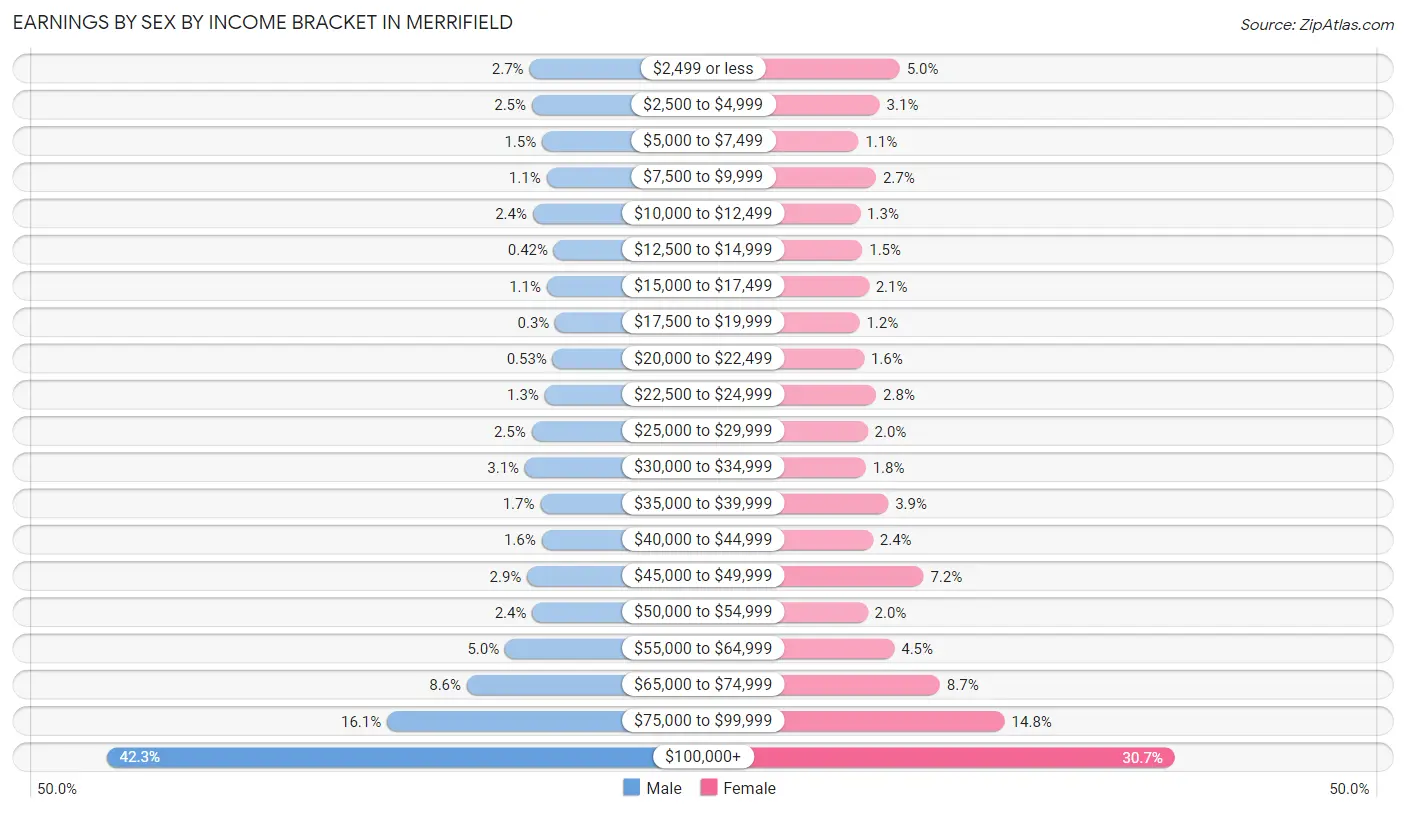
| Income | Male | Female |
| $2,499 or less | 205 (2.7%) | 329 (5.0%) |
| $2,500 to $4,999 | 188 (2.5%) | 204 (3.1%) |
| $5,000 to $7,499 | 116 (1.5%) | 72 (1.1%) |
| $7,500 to $9,999 | 84 (1.1%) | 181 (2.7%) |
| $10,000 to $12,499 | 181 (2.4%) | 83 (1.3%) |
| $12,500 to $14,999 | 32 (0.4%) | 96 (1.5%) |
| $15,000 to $17,499 | 82 (1.1%) | 136 (2.1%) |
| $17,500 to $19,999 | 23 (0.3%) | 79 (1.2%) |
| $20,000 to $22,499 | 40 (0.5%) | 107 (1.6%) |
| $22,500 to $24,999 | 97 (1.3%) | 182 (2.8%) |
| $25,000 to $29,999 | 190 (2.5%) | 129 (1.9%) |
| $30,000 to $34,999 | 237 (3.1%) | 117 (1.8%) |
| $35,000 to $39,999 | 128 (1.7%) | 257 (3.9%) |
| $40,000 to $44,999 | 119 (1.6%) | 162 (2.4%) |
| $45,000 to $49,999 | 221 (2.9%) | 476 (7.2%) |
| $50,000 to $54,999 | 185 (2.4%) | 129 (1.9%) |
| $55,000 to $64,999 | 378 (5.0%) | 295 (4.4%) |
| $65,000 to $74,999 | 649 (8.6%) | 578 (8.7%) |
| $75,000 to $99,999 | 1,216 (16.1%) | 980 (14.8%) |
| $100,000+ | 3,206 (42.3%) | 2,035 (30.7%) |
| Total | 7,577 (100.0%) | 6,627 (100.0%) |
Earnings by Sex by Educational Attainment in Merrifield
Average earnings in Merrifield are $96,115 for men and $73,714 for women, a difference of 23.3%. Men with an educational attainment of graduate degree enjoy the highest average annual earnings of $124,006, while those with less than high school education earn the least with $30,804. Women with an educational attainment of graduate degree earn the most with the average annual earnings of $89,175, while those with less than high school education have the smallest earnings of $9,053.
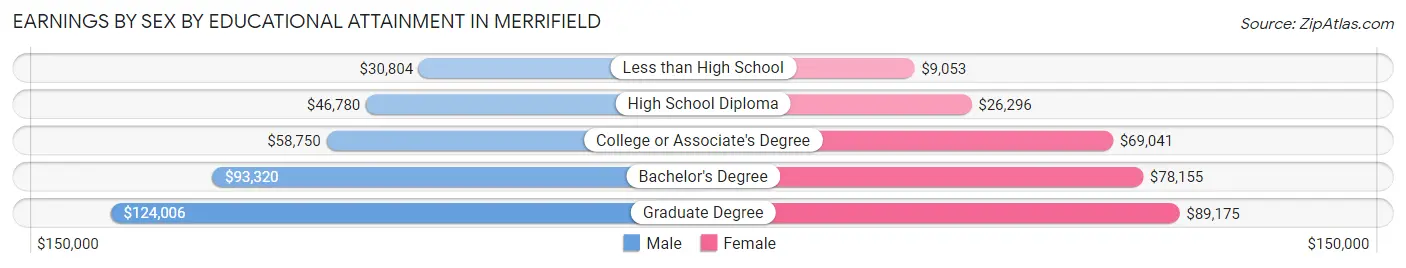
| Educational Attainment | Male Income | Female Income |
| Less than High School | $30,804 | $9,053 |
| High School Diploma | $46,780 | $26,296 |
| College or Associate's Degree | $58,750 | $69,041 |
| Bachelor's Degree | $93,320 | $78,155 |
| Graduate Degree | $124,006 | $89,175 |
| Total | $96,115 | $73,714 |
Family Income in Merrifield
Family Income Brackets in Merrifield
According to the Merrifield family income data, there are 1,768 families falling into the $200,000+ income range, which is the most common income bracket and makes up 35.5% of all families. Conversely, the $10,000 to $14,999 income bracket is the least frequent group with only 40 families (0.8%) belonging to this category.
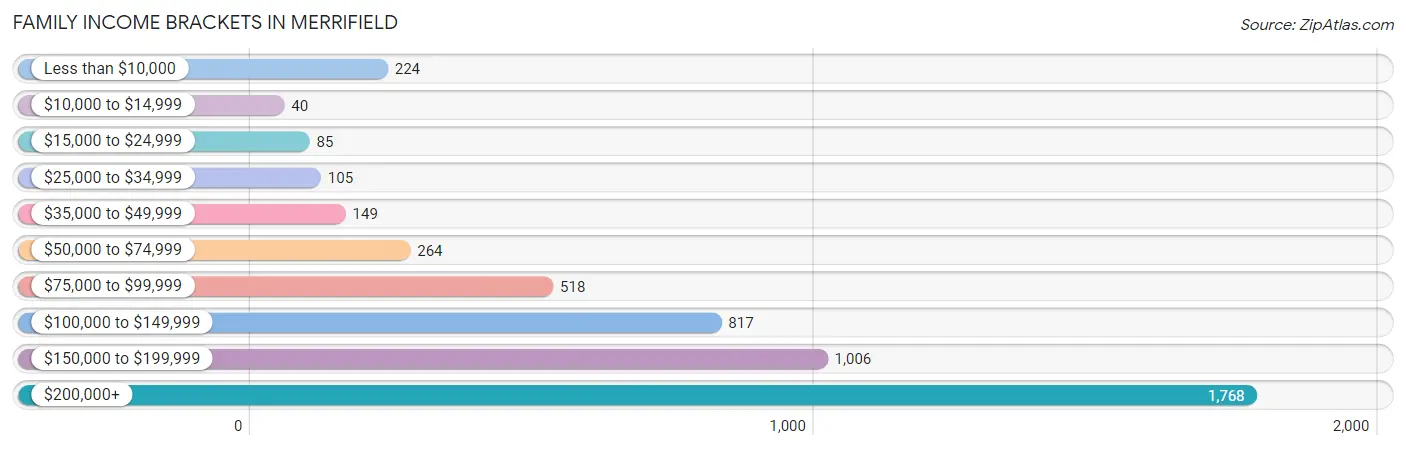
| Income Bracket | # Families | % Families |
| Less than $10,000 | 224 | 4.5% |
| $10,000 to $14,999 | 40 | 0.8% |
| $15,000 to $24,999 | 85 | 1.7% |
| $25,000 to $34,999 | 105 | 2.1% |
| $35,000 to $49,999 | 149 | 3.0% |
| $50,000 to $74,999 | 264 | 5.3% |
| $75,000 to $99,999 | 518 | 10.4% |
| $100,000 to $149,999 | 817 | 16.4% |
| $150,000 to $199,999 | 1,006 | 20.2% |
| $200,000+ | 1,768 | 35.5% |
Family Income by Famaliy Size in Merrifield
3-person families (1,295 | 26.0%) account for the highest median family income in Merrifield with $210,557 per family, while 2-person families (2,519 | 50.6%) have the highest median income of $82,700 per family member.
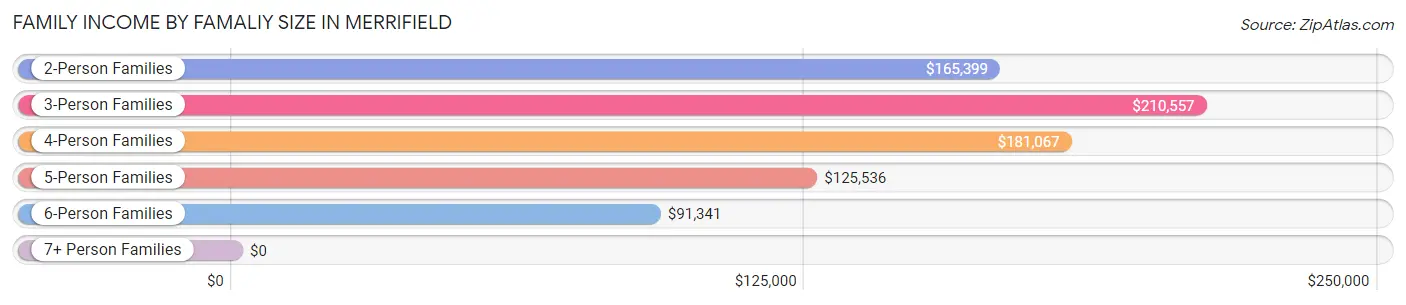
| Income Bracket | # Families | Median Income |
| 2-Person Families | 2,519 (50.6%) | $165,399 |
| 3-Person Families | 1,295 (26.0%) | $210,557 |
| 4-Person Families | 737 (14.8%) | $181,067 |
| 5-Person Families | 252 (5.1%) | $125,536 |
| 6-Person Families | 176 (3.5%) | $91,341 |
| 7+ Person Families | 0 (0.0%) | $0 |
| Total | 4,979 (100.0%) | $166,076 |
Family Income by Number of Earners in Merrifield
The median family income in Merrifield is $166,076, with families comprising 2 earners (3,184) having the highest median family income of $192,937, while families with no earners (304) have the lowest median family income of $84,063, accounting for 63.9% and 6.1% of families, respectively.
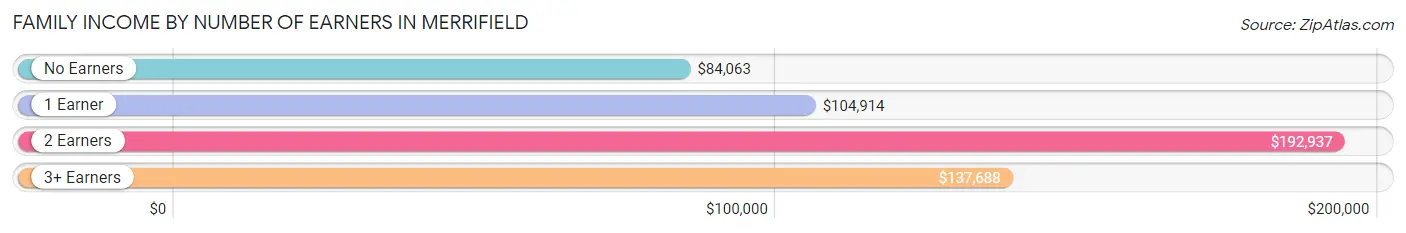
| Number of Earners | # Families | Median Income |
| No Earners | 304 (6.1%) | $84,063 |
| 1 Earner | 1,094 (22.0%) | $104,914 |
| 2 Earners | 3,184 (63.9%) | $192,937 |
| 3+ Earners | 397 (8.0%) | $137,688 |
| Total | 4,979 (100.0%) | $166,076 |
Household Income in Merrifield
Household Income Brackets in Merrifield
With 2,271 households falling in the category, the $200,000+ income range is the most frequent in Merrifield, accounting for 24.9% of all households. In contrast, only 64 households (0.7%) fall into the $10,000 to $14,999 income bracket, making it the least populous group.
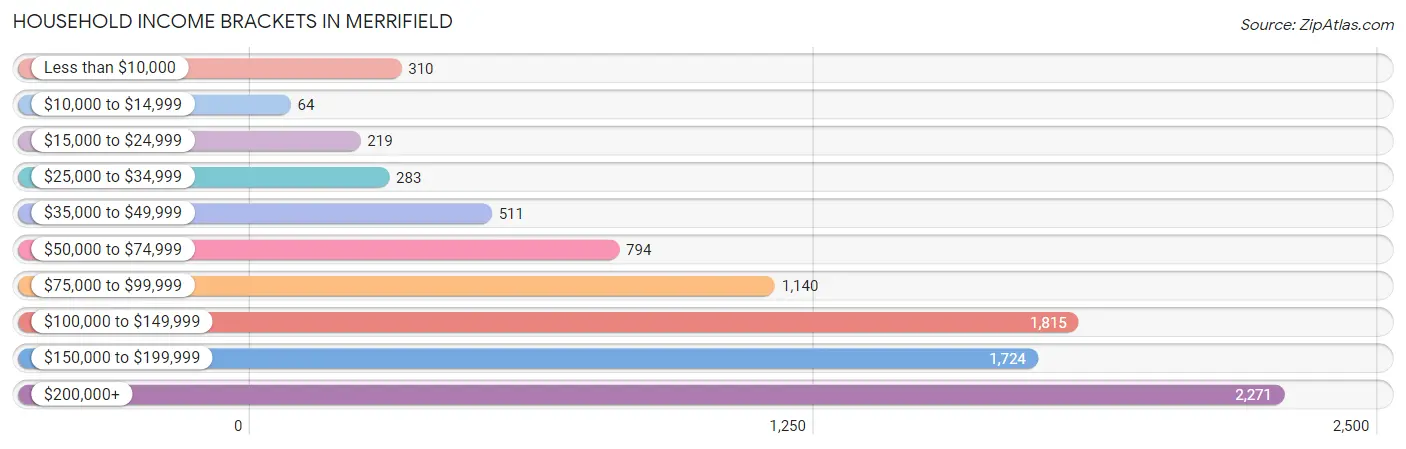
| Income Bracket | # Households | % Households |
| Less than $10,000 | 310 | 3.4% |
| $10,000 to $14,999 | 64 | 0.7% |
| $15,000 to $24,999 | 219 | 2.4% |
| $25,000 to $34,999 | 283 | 3.1% |
| $35,000 to $49,999 | 511 | 5.6% |
| $50,000 to $74,999 | 794 | 8.7% |
| $75,000 to $99,999 | 1,140 | 12.5% |
| $100,000 to $149,999 | 1,815 | 19.9% |
| $150,000 to $199,999 | 1,724 | 18.9% |
| $200,000+ | 2,271 | 24.9% |
Household Income by Householder Age in Merrifield
The median household income in Merrifield is $134,022, with the highest median household income of $150,490 found in the 25 to 44 years age bracket for the primary householder. A total of 5,456 households (59.8%) fall into this category. Meanwhile, the 15 to 24 years age bracket for the primary householder has the lowest median household income of $73,947, with 608 households (6.7%) in this group.
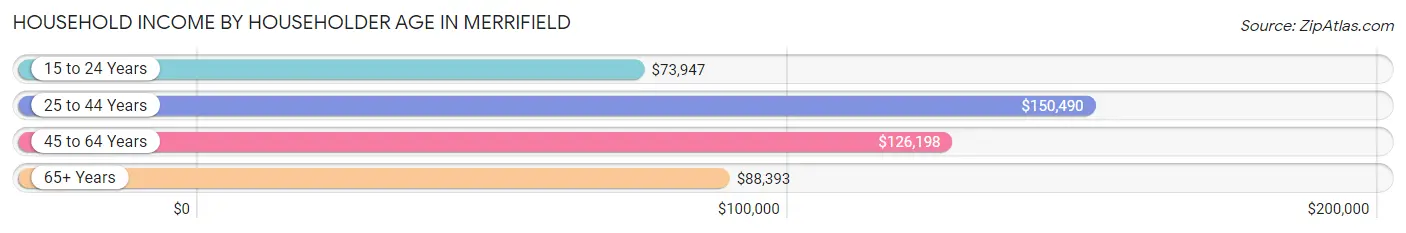
| Income Bracket | # Households | Median Income |
| 15 to 24 Years | 608 (6.7%) | $73,947 |
| 25 to 44 Years | 5,456 (59.8%) | $150,490 |
| 45 to 64 Years | 2,195 (24.1%) | $126,198 |
| 65+ Years | 862 (9.5%) | $88,393 |
| Total | 9,121 (100.0%) | $134,022 |
Poverty in Merrifield
Income Below Poverty by Sex and Age in Merrifield
With 6.1% poverty level for males and 6.7% for females among the residents of Merrifield, 75 year old and over males and 5 year old females are the most vulnerable to poverty, with 78 males (36.6%) and 30 females (33.0%) in their respective age groups living below the poverty level.
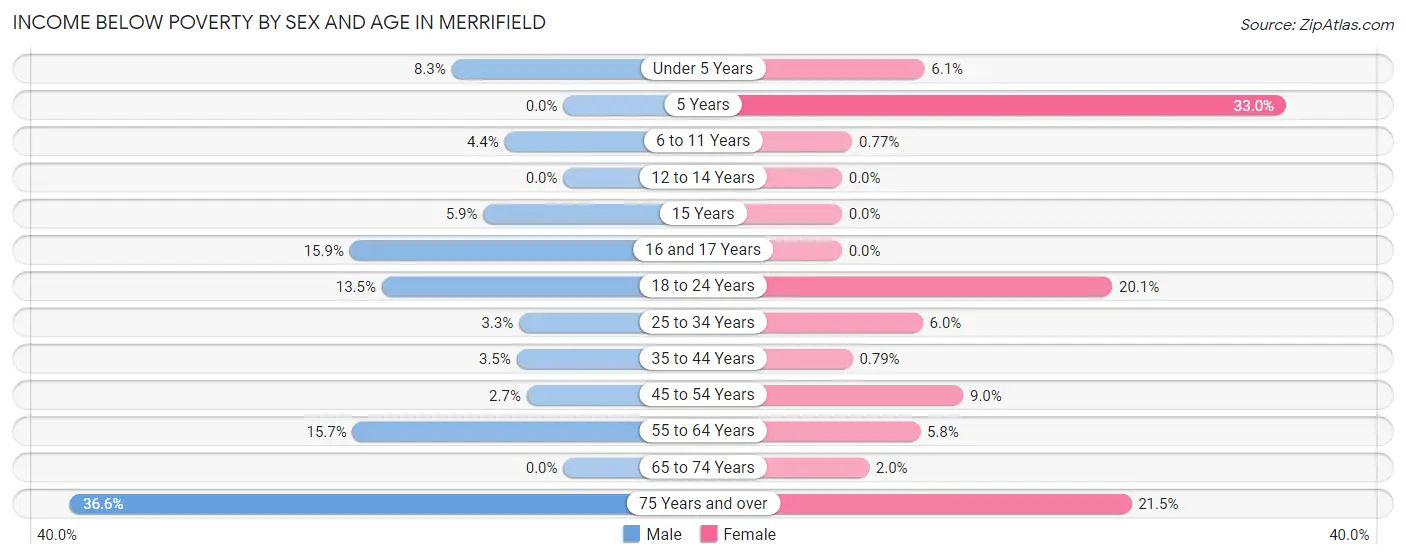
| Age Bracket | Male | Female |
| Under 5 Years | 47 (8.3%) | 33 (6.1%) |
| 5 Years | 0 (0.0%) | 30 (33.0%) |
| 6 to 11 Years | 25 (4.4%) | 5 (0.8%) |
| 12 to 14 Years | 0 (0.0%) | 0 (0.0%) |
| 15 Years | 12 (5.9%) | 0 (0.0%) |
| 16 and 17 Years | 36 (15.9%) | 0 (0.0%) |
| 18 to 24 Years | 112 (13.5%) | 180 (20.1%) |
| 25 to 34 Years | 90 (3.3%) | 175 (6.0%) |
| 35 to 44 Years | 75 (3.5%) | 15 (0.8%) |
| 45 to 54 Years | 31 (2.7%) | 80 (9.0%) |
| 55 to 64 Years | 120 (15.7%) | 44 (5.8%) |
| 65 to 74 Years | 0 (0.0%) | 9 (2.0%) |
| 75 Years and over | 78 (36.6%) | 78 (21.5%) |
| Total | 626 (6.1%) | 649 (6.7%) |
Income Above Poverty by Sex and Age in Merrifield
According to the poverty statistics in Merrifield, males aged 5 years and females aged 12 to 14 years are the age groups that are most secure financially, with 100.0% of males and 100.0% of females in these age groups living above the poverty line.
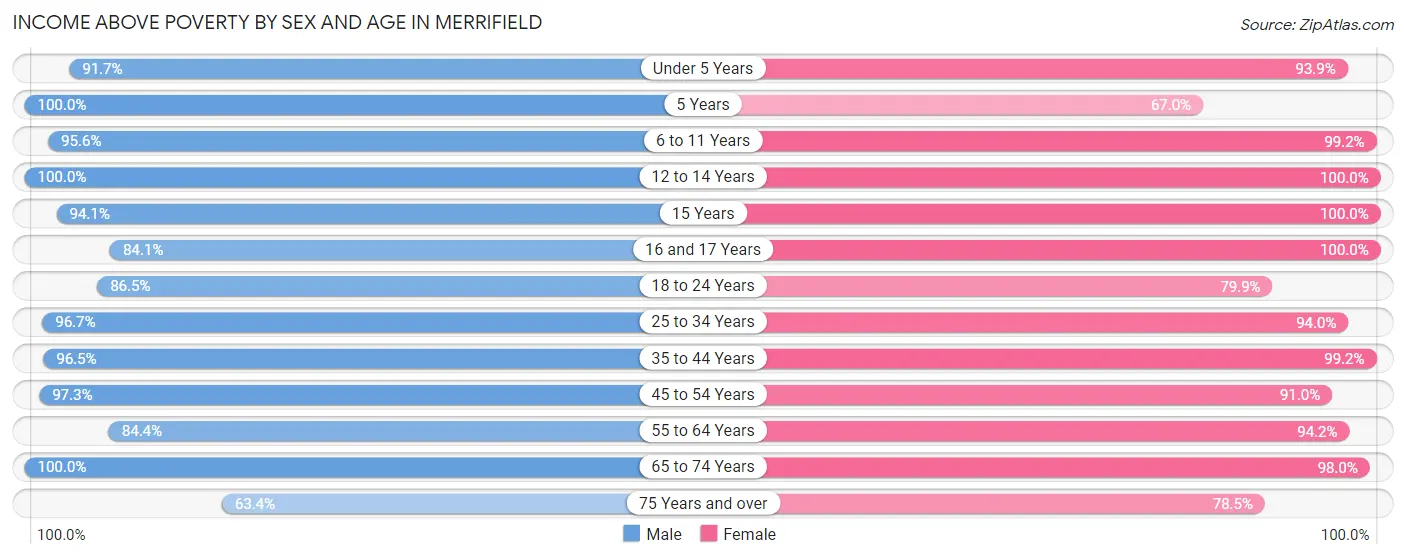
| Age Bracket | Male | Female |
| Under 5 Years | 519 (91.7%) | 505 (93.9%) |
| 5 Years | 102 (100.0%) | 61 (67.0%) |
| 6 to 11 Years | 549 (95.6%) | 645 (99.2%) |
| 12 to 14 Years | 220 (100.0%) | 81 (100.0%) |
| 15 Years | 190 (94.1%) | 111 (100.0%) |
| 16 and 17 Years | 191 (84.1%) | 65 (100.0%) |
| 18 to 24 Years | 719 (86.5%) | 717 (79.9%) |
| 25 to 34 Years | 2,648 (96.7%) | 2,744 (94.0%) |
| 35 to 44 Years | 2,085 (96.5%) | 1,892 (99.2%) |
| 45 to 54 Years | 1,109 (97.3%) | 809 (91.0%) |
| 55 to 64 Years | 647 (84.4%) | 713 (94.2%) |
| 65 to 74 Years | 467 (100.0%) | 439 (98.0%) |
| 75 Years and over | 135 (63.4%) | 285 (78.5%) |
| Total | 9,581 (93.9%) | 9,067 (93.3%) |
Income Below Poverty Among Married-Couple Families in Merrifield
The poverty statistics for married-couple families in Merrifield show that 5.9% or 241 of the total 4,067 families live below the poverty line. Families with 3 or 4 children have the highest poverty rate of 9.8%, comprising of 28 families. On the other hand, families with 1 or 2 children have the lowest poverty rate of 3.9%, which includes 66 families.
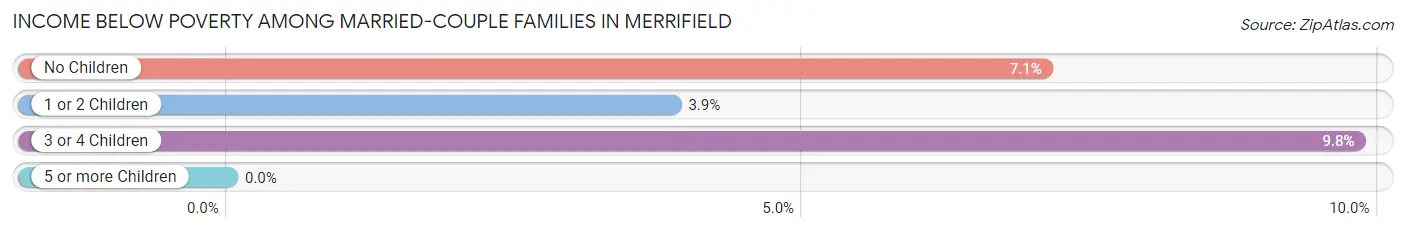
| Children | Above Poverty | Below Poverty |
| No Children | 1,924 (92.9%) | 147 (7.1%) |
| 1 or 2 Children | 1,645 (96.1%) | 66 (3.9%) |
| 3 or 4 Children | 257 (90.2%) | 28 (9.8%) |
| 5 or more Children | 0 (0.0%) | 0 (0.0%) |
| Total | 3,826 (94.1%) | 241 (5.9%) |
Income Below Poverty Among Single-Parent Households in Merrifield
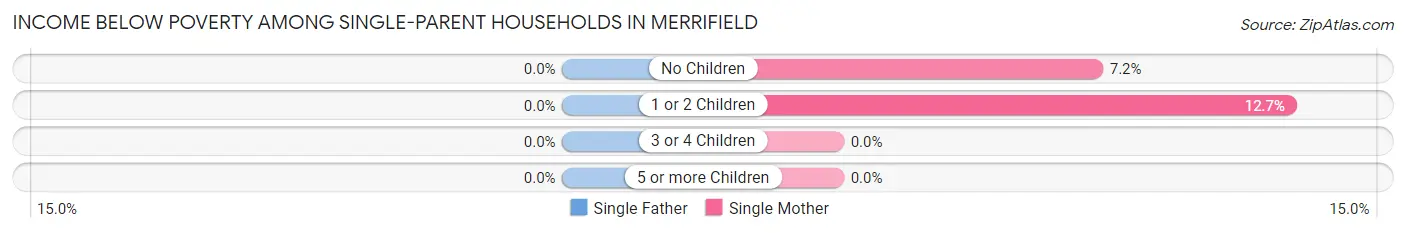
| Children | Single Father | Single Mother |
| No Children | 0 (0.0%) | 21 (7.2%) |
| 1 or 2 Children | 0 (0.0%) | 39 (12.7%) |
| 3 or 4 Children | 0 (0.0%) | 0 (0.0%) |
| 5 or more Children | 0 (0.0%) | 0 (0.0%) |
| Total | 0 (0.0%) | 60 (9.9%) |
Income Below Poverty Among Married-Couple vs Single-Parent Households in Merrifield
The poverty data for Merrifield shows that 241 of the married-couple family households (5.9%) and 60 of the single-parent households (6.6%) are living below the poverty level. Within the married-couple family households, those with 3 or 4 children have the highest poverty rate, with 28 households (9.8%) falling below the poverty line. Among the single-parent households, those with 1 or 2 children have the highest poverty rate, with 39 household (11.6%) living below poverty.
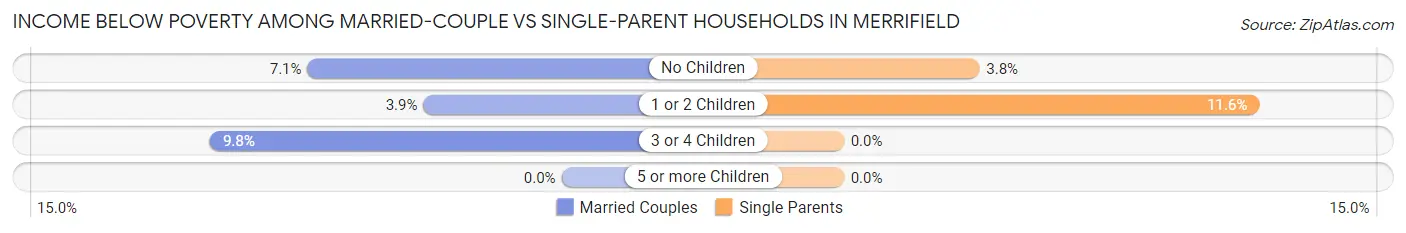
| Children | Married-Couple Families | Single-Parent Households |
| No Children | 147 (7.1%) | 21 (3.8%) |
| 1 or 2 Children | 66 (3.9%) | 39 (11.6%) |
| 3 or 4 Children | 28 (9.8%) | 0 (0.0%) |
| 5 or more Children | 0 (0.0%) | 0 (0.0%) |
| Total | 241 (5.9%) | 60 (6.6%) |
Race in Merrifield
The most populous races in Merrifield are White / Caucasian (9,206 | 46.2%), Asian (6,526 | 32.8%), and Hispanic or Latino (2,031 | 10.2%).
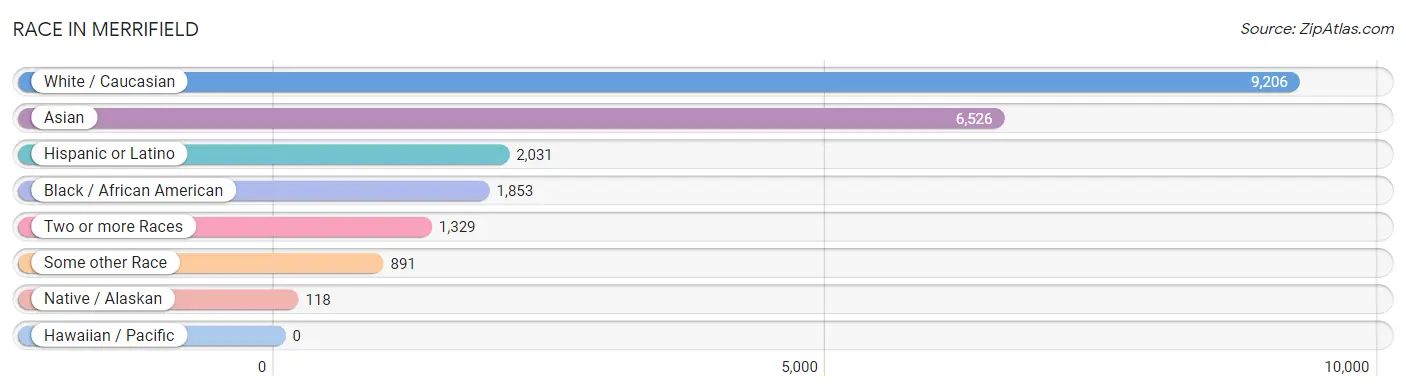
| Race | # Population | % Population |
| Asian | 6,526 | 32.8% |
| Black / African American | 1,853 | 9.3% |
| Hawaiian / Pacific | 0 | 0.0% |
| Hispanic or Latino | 2,031 | 10.2% |
| Native / Alaskan | 118 | 0.6% |
| White / Caucasian | 9,206 | 46.2% |
| Two or more Races | 1,329 | 6.7% |
| Some other Race | 891 | 4.5% |
| Total | 19,923 | 100.0% |
Ancestry in Merrifield
The most populous ancestries reported in Merrifield are Thai (2,238 | 11.2%), German (1,797 | 9.0%), Irish (1,465 | 7.3%), Burmese (1,298 | 6.5%), and English (1,093 | 5.5%), together accounting for 39.6% of all Merrifield residents.
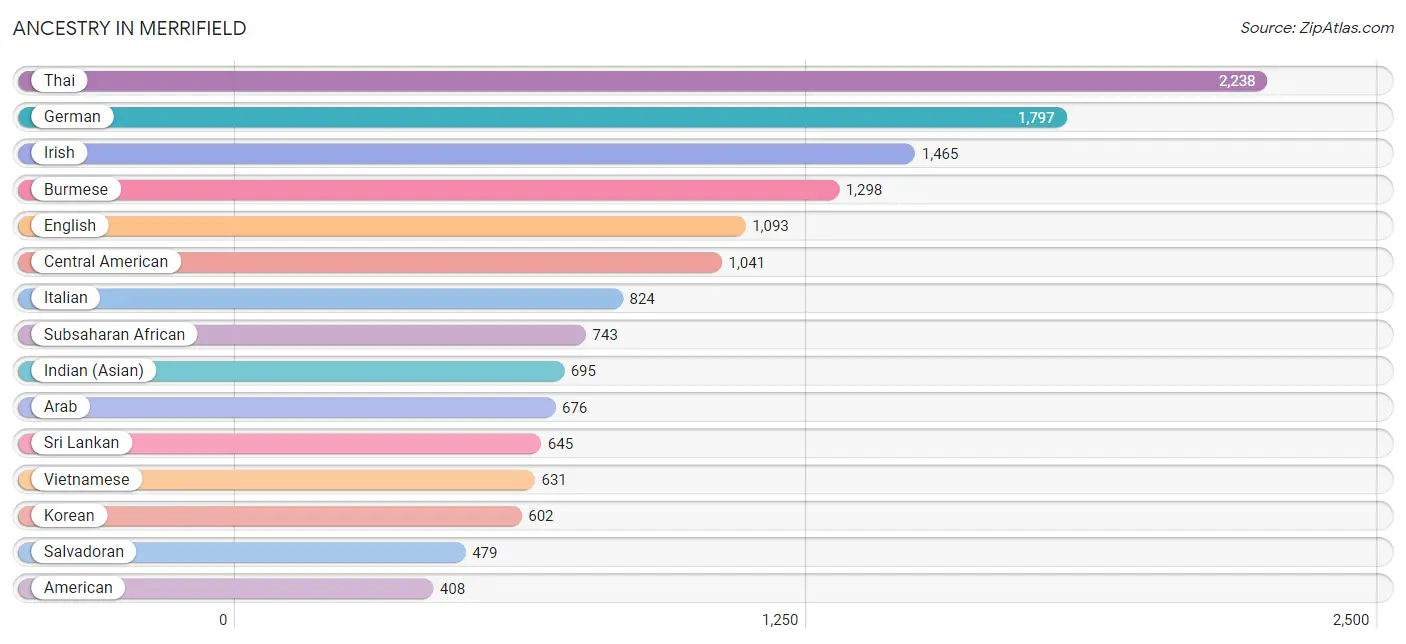
| Ancestry | # Population | % Population |
| Afghan | 234 | 1.2% |
| African | 87 | 0.4% |
| American | 408 | 2.1% |
| Arab | 676 | 3.4% |
| Argentinean | 17 | 0.1% |
| Armenian | 161 | 0.8% |
| Australian | 39 | 0.2% |
| Austrian | 10 | 0.1% |
| Belgian | 9 | 0.1% |
| Bhutanese | 85 | 0.4% |
| Bolivian | 31 | 0.2% |
| Brazilian | 16 | 0.1% |
| British | 393 | 2.0% |
| Bulgarian | 86 | 0.4% |
| Burmese | 1,298 | 6.5% |
| Cambodian | 101 | 0.5% |
| Canadian | 29 | 0.2% |
| Carpatho Rusyn | 4 | 0.0% |
| Central American | 1,041 | 5.2% |
| Central American Indian | 82 | 0.4% |
| Cherokee | 54 | 0.3% |
| Colombian | 160 | 0.8% |
| Costa Rican | 13 | 0.1% |
| Croatian | 16 | 0.1% |
| Cuban | 163 | 0.8% |
| Czech | 8 | 0.0% |
| Danish | 26 | 0.1% |
| Dutch | 245 | 1.2% |
| Eastern European | 85 | 0.4% |
| Ecuadorian | 13 | 0.1% |
| Egyptian | 39 | 0.2% |
| English | 1,093 | 5.5% |
| Ethiopian | 38 | 0.2% |
| European | 354 | 1.8% |
| Filipino | 196 | 1.0% |
| Finnish | 56 | 0.3% |
| French | 313 | 1.6% |
| French Canadian | 10 | 0.1% |
| German | 1,797 | 9.0% |
| Ghanaian | 105 | 0.5% |
| Greek | 61 | 0.3% |
| Guatemalan | 74 | 0.4% |
| Honduran | 379 | 1.9% |
| Hungarian | 98 | 0.5% |
| Indian (Asian) | 695 | 3.5% |
| Indonesian | 67 | 0.3% |
| Iranian | 183 | 0.9% |
| Irish | 1,465 | 7.3% |
| Italian | 824 | 4.1% |
| Jamaican | 74 | 0.4% |
| Japanese | 17 | 0.1% |
| Jordanian | 50 | 0.3% |
| Korean | 602 | 3.0% |
| Lebanese | 223 | 1.1% |
| Lithuanian | 8 | 0.0% |
| Macedonian | 38 | 0.2% |
| Malaysian | 29 | 0.2% |
| Mexican | 151 | 0.8% |
| Mexican American Indian | 36 | 0.2% |
| Moroccan | 32 | 0.2% |
| Nicaraguan | 74 | 0.4% |
| Nigerian | 176 | 0.9% |
| Norwegian | 239 | 1.2% |
| Pakistani | 59 | 0.3% |
| Panamanian | 22 | 0.1% |
| Peruvian | 136 | 0.7% |
| Polish | 286 | 1.4% |
| Portuguese | 33 | 0.2% |
| Puerto Rican | 130 | 0.6% |
| Russian | 192 | 1.0% |
| Salvadoran | 479 | 2.4% |
| Samoan | 15 | 0.1% |
| Scandinavian | 26 | 0.1% |
| Scotch-Irish | 310 | 1.6% |
| Scottish | 215 | 1.1% |
| Serbian | 7 | 0.0% |
| Sierra Leonean | 39 | 0.2% |
| Slovak | 87 | 0.4% |
| Slovene | 3 | 0.0% |
| Somali | 126 | 0.6% |
| South American | 361 | 1.8% |
| South American Indian | 8 | 0.0% |
| Spaniard | 113 | 0.6% |
| Spanish | 12 | 0.1% |
| Sri Lankan | 645 | 3.2% |
| Subsaharan African | 743 | 3.7% |
| Sudanese | 66 | 0.3% |
| Swedish | 252 | 1.3% |
| Swiss | 79 | 0.4% |
| Thai | 2,238 | 11.2% |
| Turkish | 72 | 0.4% |
| Ukrainian | 362 | 1.8% |
| Venezuelan | 4 | 0.0% |
| Vietnamese | 631 | 3.2% |
| Welsh | 26 | 0.1% | View All 95 Rows |
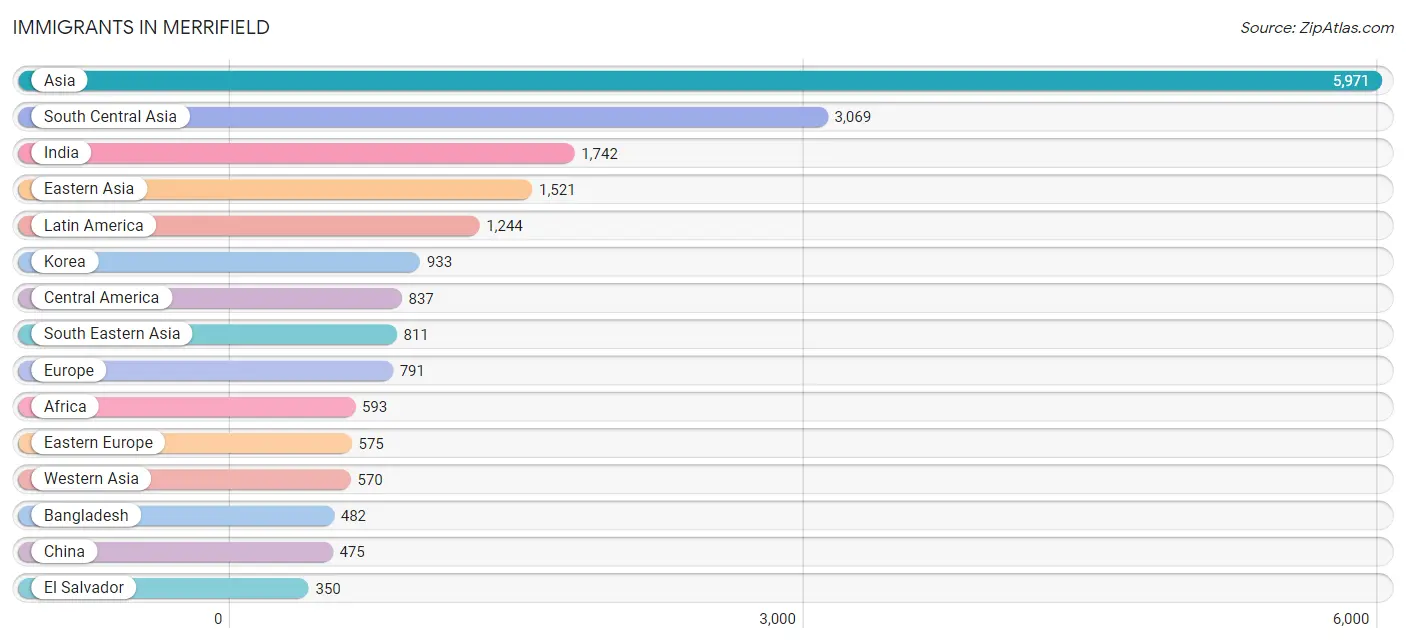
Immigrants in Merrifield
The most numerous immigrant groups reported in Merrifield came from Asia (5,971 | 30.0%), South Central Asia (3,069 | 15.4%), India (1,742 | 8.7%), Eastern Asia (1,521 | 7.6%), and Latin America (1,244 | 6.2%), together accounting for 68.0% of all Merrifield residents.
| Immigration Origin | # Population | % Population |
| Afghanistan | 229 | 1.1% |
| Africa | 593 | 3.0% |
| Argentina | 17 | 0.1% |
| Armenia | 101 | 0.5% |
| Asia | 5,971 | 30.0% |
| Bangladesh | 482 | 2.4% |
| Belarus | 54 | 0.3% |
| Bolivia | 31 | 0.2% |
| Brazil | 14 | 0.1% |
| Bulgaria | 119 | 0.6% |
| Cameroon | 36 | 0.2% |
| Canada | 30 | 0.2% |
| Caribbean | 73 | 0.4% |
| Central America | 837 | 4.2% |
| China | 475 | 2.4% |
| Colombia | 108 | 0.5% |
| Cuba | 73 | 0.4% |
| Eastern Africa | 89 | 0.4% |
| Eastern Asia | 1,521 | 7.6% |
| Eastern Europe | 575 | 2.9% |
| Ecuador | 13 | 0.1% |
| Egypt | 47 | 0.2% |
| El Salvador | 350 | 1.8% |
| Ethiopia | 19 | 0.1% |
| Europe | 791 | 4.0% |
| France | 22 | 0.1% |
| Germany | 9 | 0.1% |
| Guatemala | 38 | 0.2% |
| Honduras | 304 | 1.5% |
| India | 1,742 | 8.7% |
| Iran | 292 | 1.5% |
| Italy | 54 | 0.3% |
| Japan | 29 | 0.2% |
| Jordan | 50 | 0.3% |
| Kenya | 21 | 0.1% |
| Korea | 933 | 4.7% |
| Laos | 43 | 0.2% |
| Latin America | 1,244 | 6.2% |
| Lebanon | 42 | 0.2% |
| Mexico | 84 | 0.4% |
| Middle Africa | 36 | 0.2% |
| Morocco | 18 | 0.1% |
| Nepal | 262 | 1.3% |
| Netherlands | 53 | 0.3% |
| Nicaragua | 54 | 0.3% |
| Nigeria | 169 | 0.9% |
| North Macedonia | 38 | 0.2% |
| Northern Africa | 131 | 0.7% |
| Northern Europe | 63 | 0.3% |
| Pakistan | 52 | 0.3% |
| Panama | 7 | 0.0% |
| Peru | 151 | 0.8% |
| Philippines | 292 | 1.5% |
| Russia | 73 | 0.4% |
| Saudi Arabia | 263 | 1.3% |
| Serbia | 7 | 0.0% |
| Somalia | 49 | 0.3% |
| South Africa | 36 | 0.2% |
| South America | 334 | 1.7% |
| South Central Asia | 3,069 | 15.4% |
| South Eastern Asia | 811 | 4.1% |
| Southern Europe | 54 | 0.3% |
| Sudan | 66 | 0.3% |
| Switzerland | 15 | 0.1% |
| Syria | 39 | 0.2% |
| Taiwan | 174 | 0.9% |
| Thailand | 59 | 0.3% |
| Turkey | 55 | 0.3% |
| Ukraine | 284 | 1.4% |
| Vietnam | 350 | 1.8% |
| Western Africa | 275 | 1.4% |
| Western Asia | 570 | 2.9% |
| Western Europe | 99 | 0.5% | View All 73 Rows |
Sex and Age in Merrifield
Sex and Age in Merrifield
The most populous age groups in Merrifield are 25 to 29 Years (1,474 | 14.4%) for men and 25 to 29 Years (1,464 | 15.1%) for women.
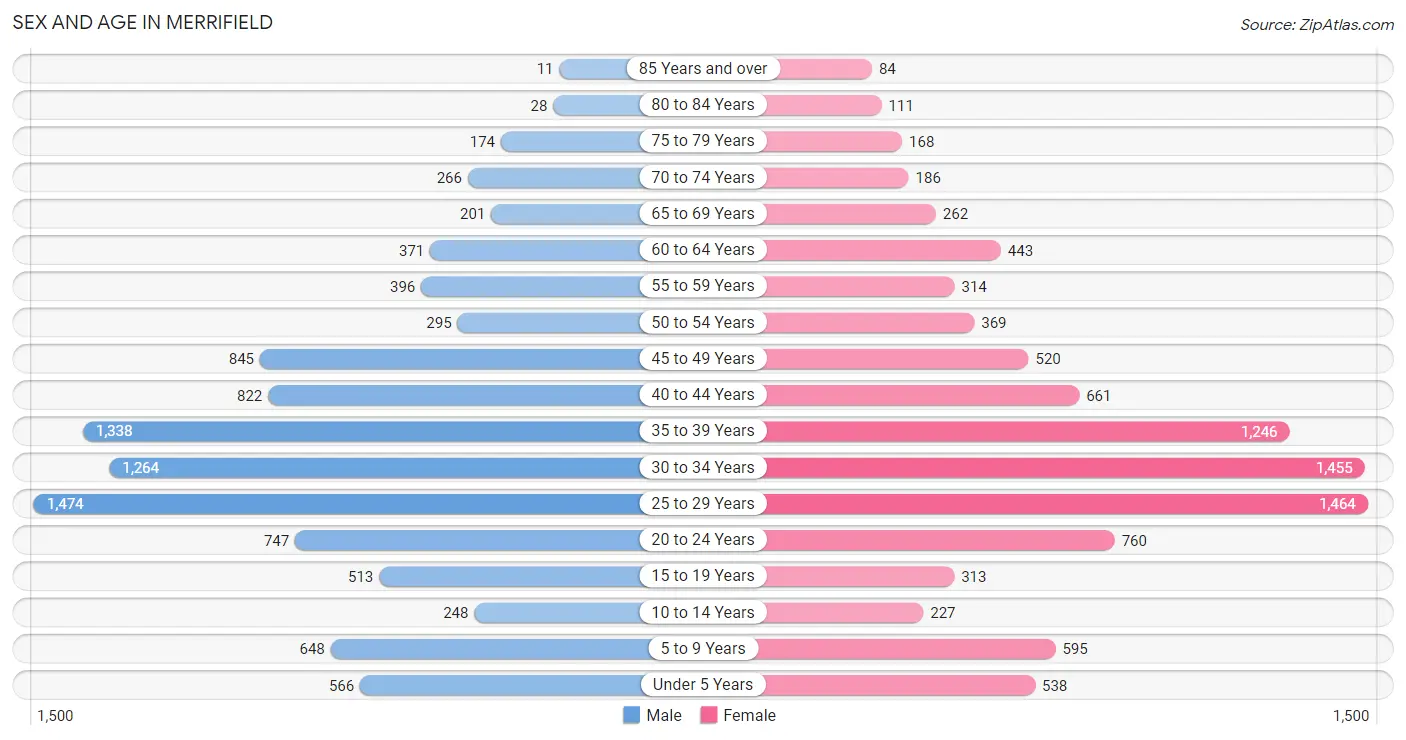
| Age Bracket | Male | Female |
| Under 5 Years | 566 (5.6%) | 538 (5.5%) |
| 5 to 9 Years | 648 (6.4%) | 595 (6.1%) |
| 10 to 14 Years | 248 (2.4%) | 227 (2.3%) |
| 15 to 19 Years | 513 (5.0%) | 313 (3.2%) |
| 20 to 24 Years | 747 (7.3%) | 760 (7.8%) |
| 25 to 29 Years | 1,474 (14.4%) | 1,464 (15.1%) |
| 30 to 34 Years | 1,264 (12.4%) | 1,455 (15.0%) |
| 35 to 39 Years | 1,338 (13.1%) | 1,246 (12.8%) |
| 40 to 44 Years | 822 (8.1%) | 661 (6.8%) |
| 45 to 49 Years | 845 (8.3%) | 520 (5.3%) |
| 50 to 54 Years | 295 (2.9%) | 369 (3.8%) |
| 55 to 59 Years | 396 (3.9%) | 314 (3.2%) |
| 60 to 64 Years | 371 (3.6%) | 443 (4.6%) |
| 65 to 69 Years | 201 (2.0%) | 262 (2.7%) |
| 70 to 74 Years | 266 (2.6%) | 186 (1.9%) |
| 75 to 79 Years | 174 (1.7%) | 168 (1.7%) |
| 80 to 84 Years | 28 (0.3%) | 111 (1.1%) |
| 85 Years and over | 11 (0.1%) | 84 (0.9%) |
| Total | 10,207 (100.0%) | 9,716 (100.0%) |
Families and Households in Merrifield
Median Family Size in Merrifield
The median family size in Merrifield is 2.87 persons per family, with single male/father families (304 | 6.1%) accounting for the largest median family size of 3.13 persons per family. On the other hand, single female/mother families (608 | 12.2%) represent the smallest median family size with 2.34 persons per family.
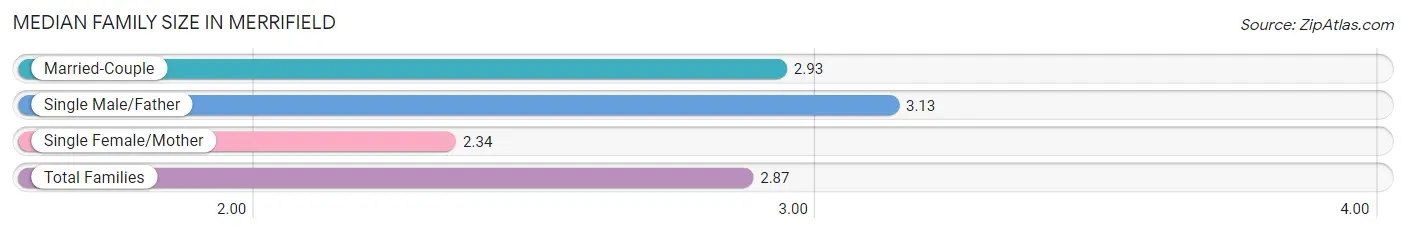
| Family Type | # Families | Family Size |
| Married-Couple | 4,067 (81.7%) | 2.93 |
| Single Male/Father | 304 (6.1%) | 3.13 |
| Single Female/Mother | 608 (12.2%) | 2.34 |
| Total Families | 4,979 (100.0%) | 2.87 |
Median Household Size in Merrifield
The median household size in Merrifield is 2.18 persons per household, with single male/father households (304 | 3.3%) accounting for the largest median household size of 3.45 persons per household. non-family households (4,142 | 45.4%) represent the smallest median household size with 1.27 persons per household.
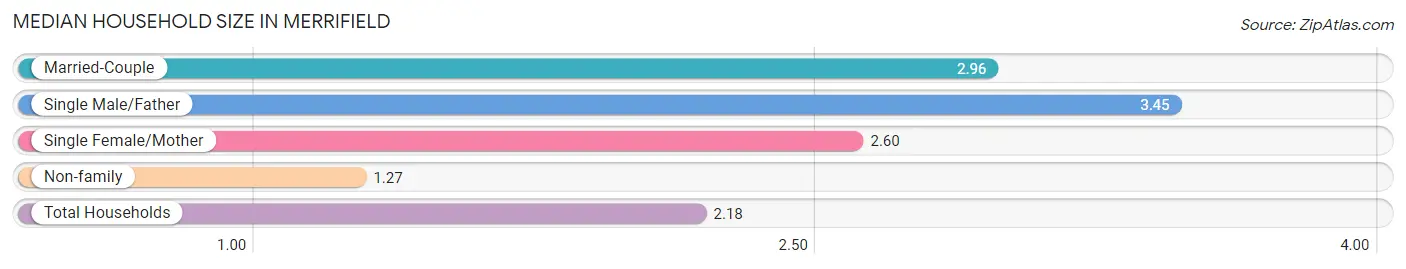
| Household Type | # Households | Household Size |
| Married-Couple | 4,067 (44.6%) | 2.96 |
| Single Male/Father | 304 (3.3%) | 3.45 |
| Single Female/Mother | 608 (6.7%) | 2.60 |
| Non-family | 4,142 (45.4%) | 1.27 |
| Total Households | 9,121 (100.0%) | 2.18 |
Household Size by Marriage Status in Merrifield
Out of a total of 9,121 households in Merrifield, 4,979 (54.6%) are family households, while 4,142 (45.4%) are nonfamily households. The most numerous type of family households are 2-person households, comprising 2,391, and the most common type of nonfamily households are 1-person households, comprising 3,308.
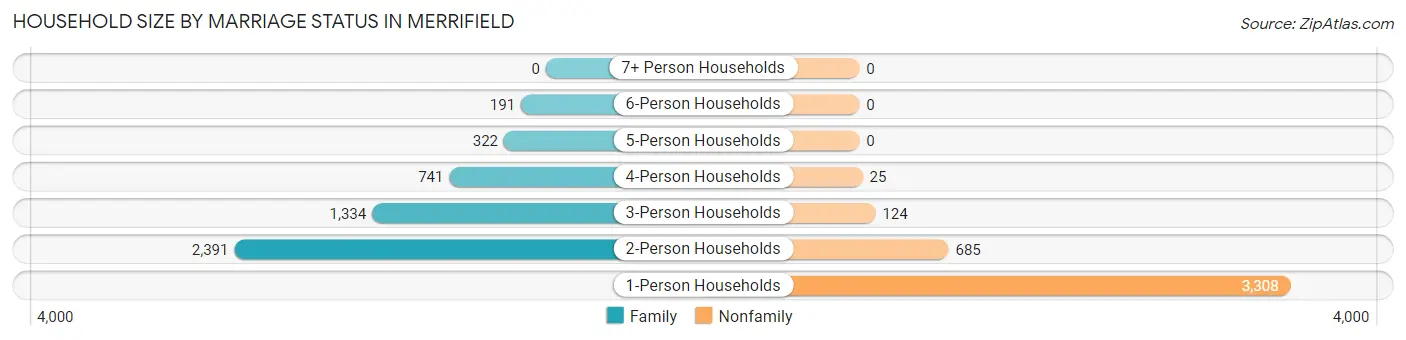
| Household Size | Family Households | Nonfamily Households |
| 1-Person Households | - | 3,308 (36.3%) |
| 2-Person Households | 2,391 (26.2%) | 685 (7.5%) |
| 3-Person Households | 1,334 (14.6%) | 124 (1.4%) |
| 4-Person Households | 741 (8.1%) | 25 (0.3%) |
| 5-Person Households | 322 (3.5%) | 0 (0.0%) |
| 6-Person Households | 191 (2.1%) | 0 (0.0%) |
| 7+ Person Households | 0 (0.0%) | 0 (0.0%) |
| Total | 4,979 (54.6%) | 4,142 (45.4%) |
Female Fertility in Merrifield
Fertility by Age in Merrifield
Average fertility rate in Merrifield is 67.0 births per 1,000 women. Women in the age bracket of 20 to 34 years have the highest fertility rate with 82.0 births per 1,000 women. Women in the age bracket of 20 to 34 years acount for 69.0% of all women with births.
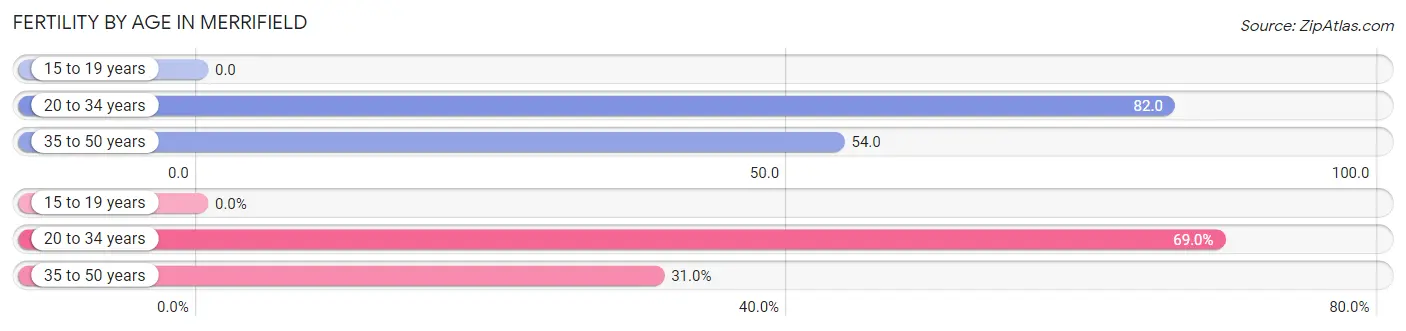
| Age Bracket | Women with Births | Births / 1,000 Women |
| 15 to 19 years | 0 (0.0%) | 0.0 |
| 20 to 34 years | 301 (69.0%) | 82.0 |
| 35 to 50 years | 135 (31.0%) | 54.0 |
| Total | 436 (100.0%) | 67.0 |
Fertility by Age by Marriage Status in Merrifield
85.6% of women with births (436) in Merrifield are married. The highest percentage of unmarried women with births falls into 20 to 34 years age bracket with 20.9% of them unmarried at the time of birth, while the lowest percentage of unmarried women with births belong to 35 to 50 years age bracket with 0.0% of them unmarried.
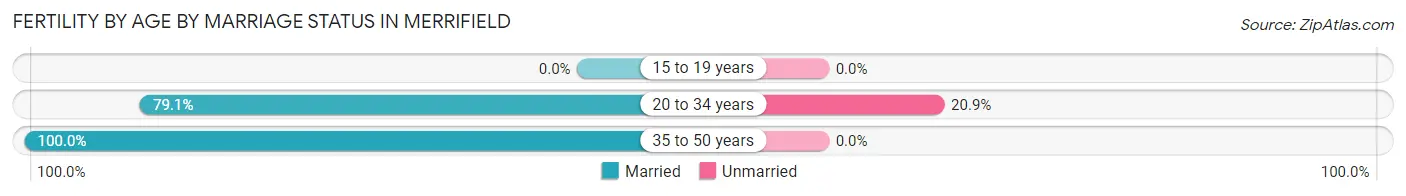
| Age Bracket | Married | Unmarried |
| 15 to 19 years | 0 (0.0%) | 0 (0.0%) |
| 20 to 34 years | 238 (79.1%) | 63 (20.9%) |
| 35 to 50 years | 135 (100.0%) | 0 (0.0%) |
| Total | 373 (85.6%) | 63 (14.4%) |
Fertility by Education in Merrifield
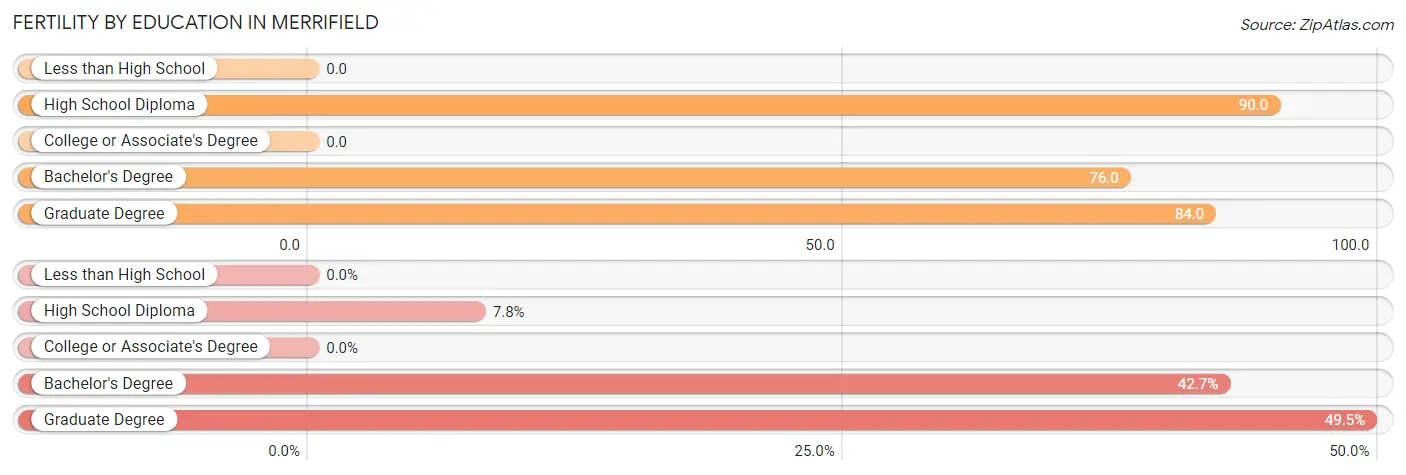
| Educational Attainment | Women with Births | Births / 1,000 Women |
| Less than High School | 0 (0.0%) | 0.0 |
| High School Diploma | 34 (7.8%) | 90.0 |
| College or Associate's Degree | 0 (0.0%) | 0.0 |
| Bachelor's Degree | 186 (42.7%) | 76.0 |
| Graduate Degree | 216 (49.5%) | 84.0 |
| Total | 436 (100.0%) | 67.0 |
Fertility by Education by Marriage Status in Merrifield
14.4% of women with births in Merrifield are unmarried. Women with the educational attainment of graduate degree are most likely to be married with 100.0% of them married at childbirth, while women with the educational attainment of high school diploma are least likely to be married with 100.0% of them unmarried at childbirth.
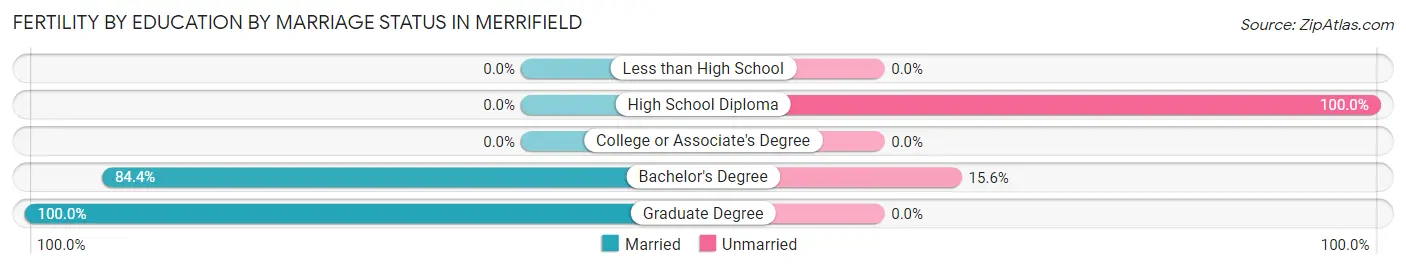
| Educational Attainment | Married | Unmarried |
| Less than High School | 0 (0.0%) | 0 (0.0%) |
| High School Diploma | 0 (0.0%) | 34 (100.0%) |
| College or Associate's Degree | 0 (0.0%) | 0 (0.0%) |
| Bachelor's Degree | 157 (84.4%) | 29 (15.6%) |
| Graduate Degree | 216 (100.0%) | 0 (0.0%) |
| Total | 373 (85.6%) | 63 (14.4%) |
Employment Characteristics in Merrifield
Employment by Class of Employer in Merrifield
Among the 13,154 employed individuals in Merrifield, private company employees (7,779 | 59.1%), federal government employees (2,720 | 20.7%), and not-for-profit organizations (1,407 | 10.7%) make up the most common classes of employment.
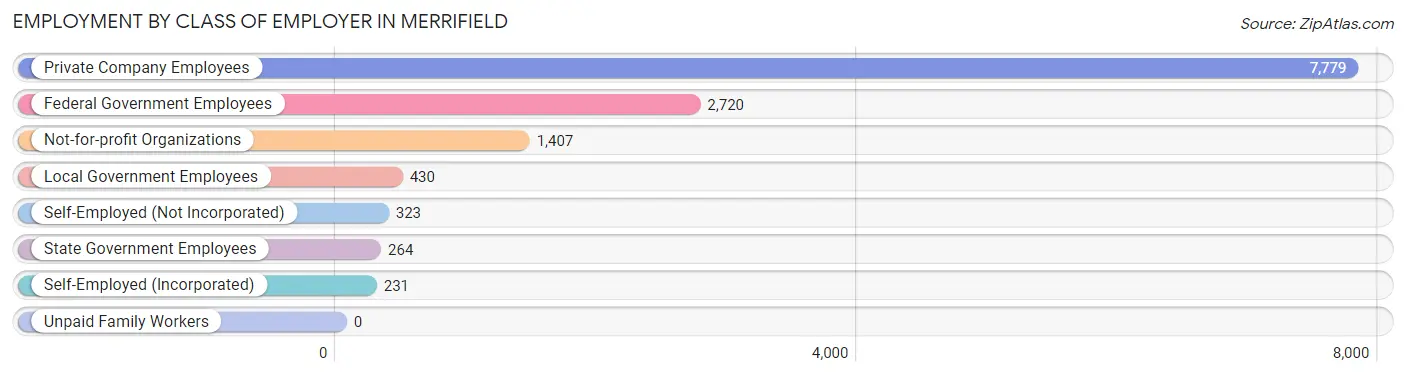
| Employer Class | # Employees | % Employees |
| Private Company Employees | 7,779 | 59.1% |
| Self-Employed (Incorporated) | 231 | 1.8% |
| Self-Employed (Not Incorporated) | 323 | 2.5% |
| Not-for-profit Organizations | 1,407 | 10.7% |
| Local Government Employees | 430 | 3.3% |
| State Government Employees | 264 | 2.0% |
| Federal Government Employees | 2,720 | 20.7% |
| Unpaid Family Workers | 0 | 0.0% |
| Total | 13,154 | 100.0% |
Employment Status by Age in Merrifield
According to the labor force statistics for Merrifield, out of the total population over 16 years of age (16,788), 82.0% or 13,766 individuals are in the labor force, with 2.1% or 289 of them unemployed. The age group with the highest labor force participation rate is 30 to 34 years, with 94.1% or 2,559 individuals in the labor force. Within the labor force, the 16 to 19 years age range has the highest percentage of unemployed individuals, with 17.5% or 27 of them being unemployed.
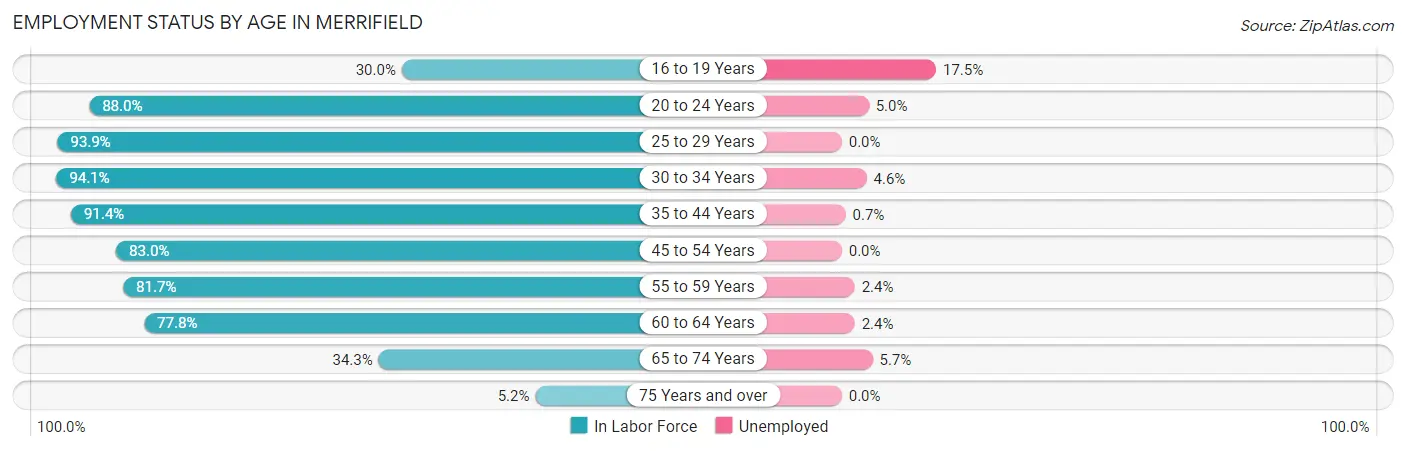
| Age Bracket | In Labor Force | Unemployed |
| 16 to 19 Years | 154 (30.0%) | 27 (17.5%) |
| 20 to 24 Years | 1,326 (88.0%) | 66 (5.0%) |
| 25 to 29 Years | 2,759 (93.9%) | 0 (0.0%) |
| 30 to 34 Years | 2,559 (94.1%) | 118 (4.6%) |
| 35 to 44 Years | 3,717 (91.4%) | 26 (0.7%) |
| 45 to 54 Years | 1,684 (83.0%) | 0 (0.0%) |
| 55 to 59 Years | 580 (81.7%) | 14 (2.4%) |
| 60 to 64 Years | 633 (77.8%) | 15 (2.4%) |
| 65 to 74 Years | 314 (34.3%) | 18 (5.7%) |
| 75 Years and over | 30 (5.2%) | 0 (0.0%) |
| Total | 13,766 (82.0%) | 289 (2.1%) |
Employment Status by Educational Attainment in Merrifield
According to labor force statistics for Merrifield, 89.9% of individuals (11,936) out of the total population between 25 and 64 years of age (13,277) are in the labor force, with 1.4% or 167 of them being unemployed. The group with the highest labor force participation rate are those with the educational attainment of college / associate degree, with 91.7% or 991 individuals in the labor force. Within the labor force, individuals with less than high school education have the highest percentage of unemployment, with 6.6% or 25 of them being unemployed.
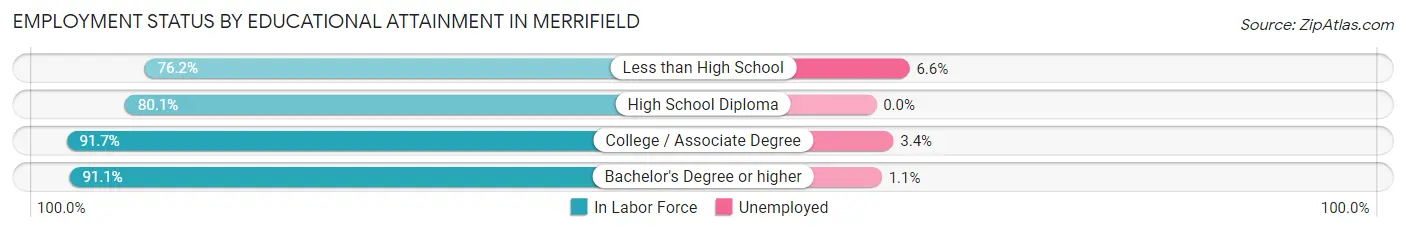
| Educational Attainment | In Labor Force | Unemployed |
| Less than High School | 377 (76.2%) | 33 (6.6%) |
| High School Diploma | 692 (80.1%) | 0 (0.0%) |
| College / Associate Degree | 991 (91.7%) | 37 (3.4%) |
| Bachelor's Degree or higher | 9,873 (91.1%) | 119 (1.1%) |
| Total | 11,936 (89.9%) | 186 (1.4%) |
Employment Occupations by Sex in Merrifield
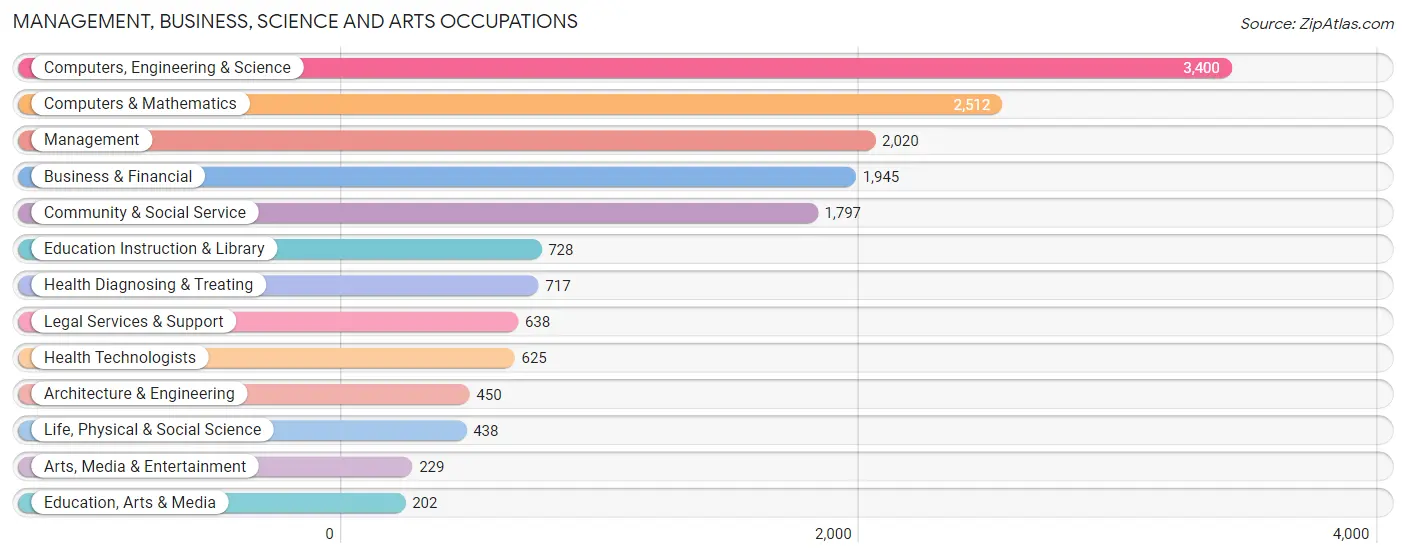
Management, Business, Science and Arts Occupations
The most common Management, Business, Science and Arts occupations in Merrifield are Computers, Engineering & Science (3,400 | 25.7%), Computers & Mathematics (2,512 | 19.0%), Management (2,020 | 15.3%), Business & Financial (1,945 | 14.7%), and Community & Social Service (1,797 | 13.6%).
Management, Business, Science and Arts Occupations by Sex
Within the Management, Business, Science and Arts occupations in Merrifield, the most male-oriented occupations are Arts, Media & Entertainment (72.9%), Computers & Mathematics (67.1%), and Education, Arts & Media (65.3%), while the most female-oriented occupations are Health Diagnosing & Treating (76.0%), Education Instruction & Library (74.6%), and Health Technologists (74.6%).
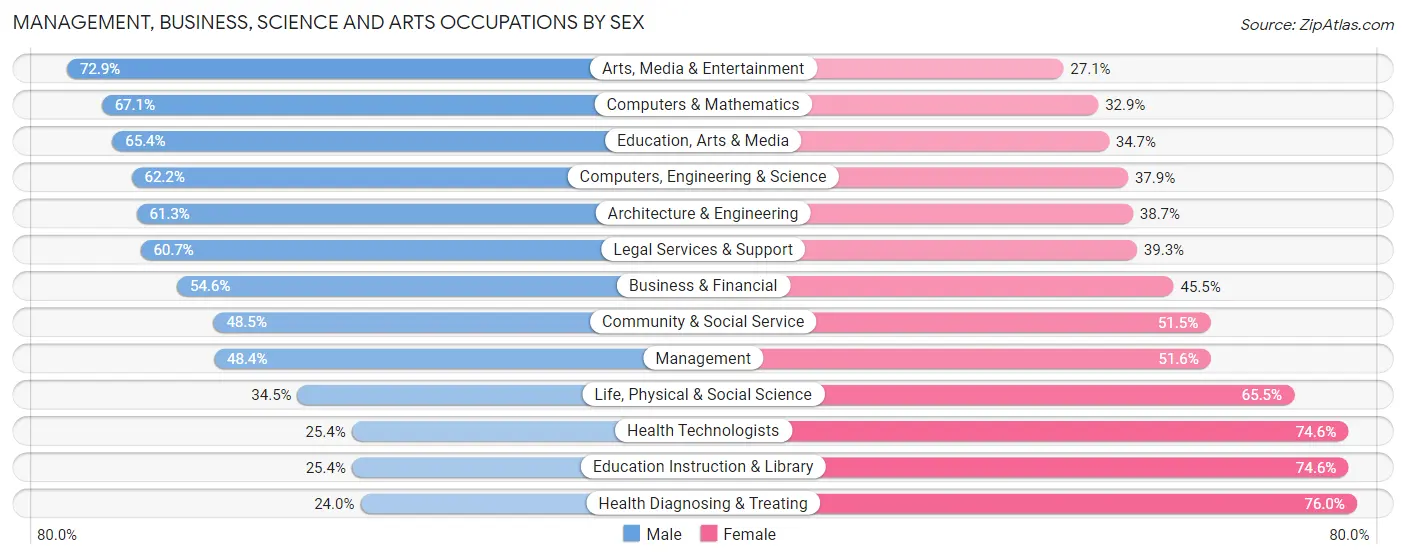
| Occupation | Male | Female |
| Management | 977 (48.4%) | 1,043 (51.6%) |
| Business & Financial | 1,061 (54.5%) | 884 (45.5%) |
| Computers, Engineering & Science | 2,113 (62.2%) | 1,287 (37.9%) |
| Computers & Mathematics | 1,686 (67.1%) | 826 (32.9%) |
| Architecture & Engineering | 276 (61.3%) | 174 (38.7%) |
| Life, Physical & Social Science | 151 (34.5%) | 287 (65.5%) |
| Community & Social Service | 871 (48.5%) | 926 (51.5%) |
| Education, Arts & Media | 132 (65.3%) | 70 (34.6%) |
| Legal Services & Support | 387 (60.7%) | 251 (39.3%) |
| Education Instruction & Library | 185 (25.4%) | 543 (74.6%) |
| Arts, Media & Entertainment | 167 (72.9%) | 62 (27.1%) |
| Health Diagnosing & Treating | 172 (24.0%) | 545 (76.0%) |
| Health Technologists | 159 (25.4%) | 466 (74.6%) |
| Total (Category) | 5,194 (52.6%) | 4,685 (47.4%) |
| Total (Overall) | 7,003 (52.9%) | 6,235 (47.1%) |
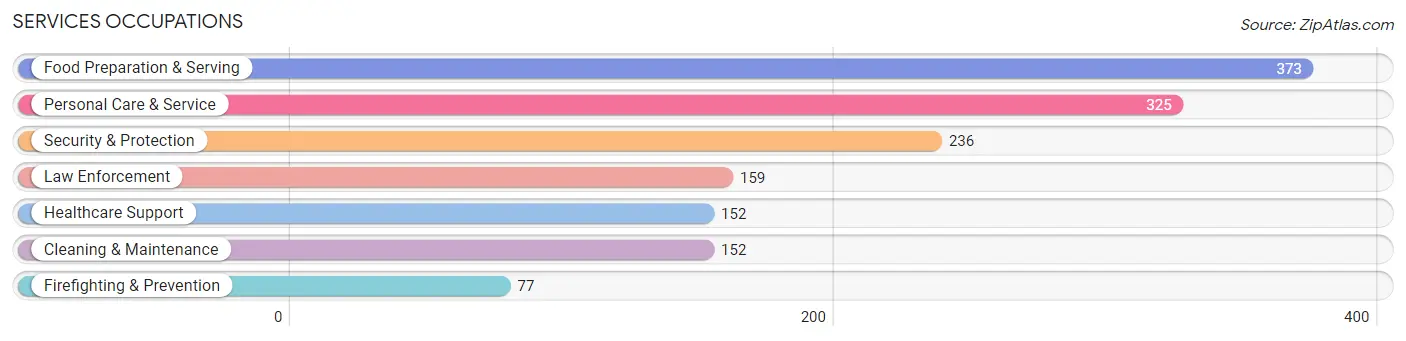
Services Occupations
The most common Services occupations in Merrifield are Food Preparation & Serving (373 | 2.8%), Personal Care & Service (325 | 2.5%), Security & Protection (236 | 1.8%), Law Enforcement (159 | 1.2%), and Healthcare Support (152 | 1.1%).
Services Occupations by Sex
Within the Services occupations in Merrifield, the most male-oriented occupations are Law Enforcement (92.4%), Security & Protection (88.6%), and Firefighting & Prevention (80.5%), while the most female-oriented occupations are Healthcare Support (100.0%), Personal Care & Service (84.0%), and Cleaning & Maintenance (77.6%).
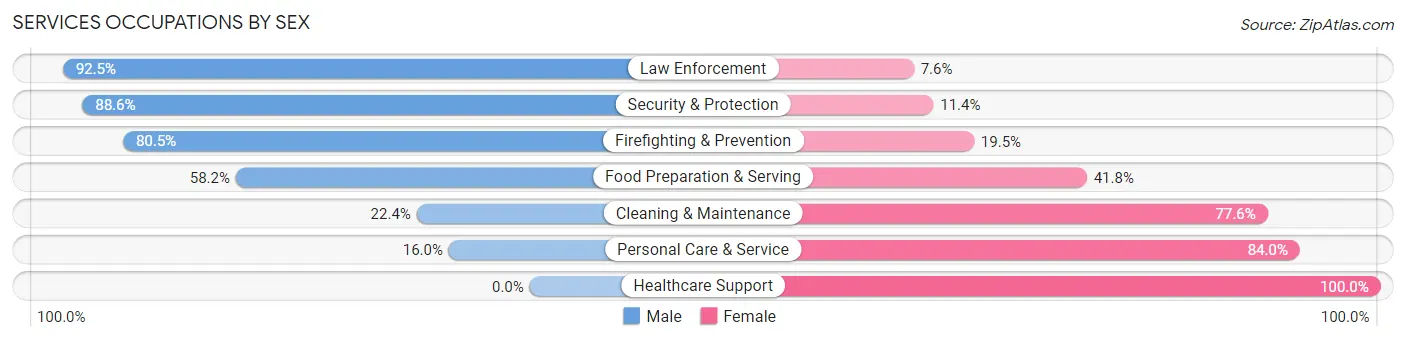
| Occupation | Male | Female |
| Healthcare Support | 0 (0.0%) | 152 (100.0%) |
| Security & Protection | 209 (88.6%) | 27 (11.4%) |
| Firefighting & Prevention | 62 (80.5%) | 15 (19.5%) |
| Law Enforcement | 147 (92.4%) | 12 (7.5%) |
| Food Preparation & Serving | 217 (58.2%) | 156 (41.8%) |
| Cleaning & Maintenance | 34 (22.4%) | 118 (77.6%) |
| Personal Care & Service | 52 (16.0%) | 273 (84.0%) |
| Total (Category) | 512 (41.4%) | 726 (58.6%) |
| Total (Overall) | 7,003 (52.9%) | 6,235 (47.1%) |
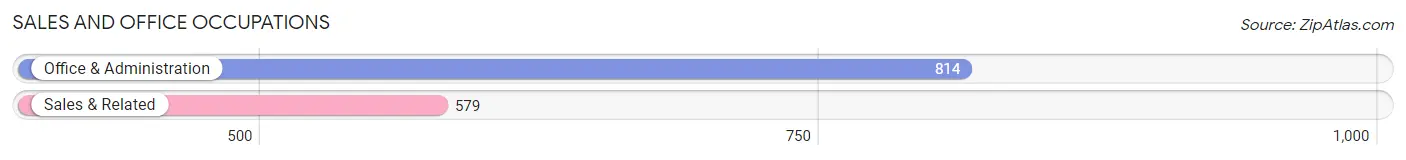
Sales and Office Occupations
The most common Sales and Office occupations in Merrifield are Office & Administration (814 | 6.1%), and Sales & Related (579 | 4.4%).
Sales and Office Occupations by Sex
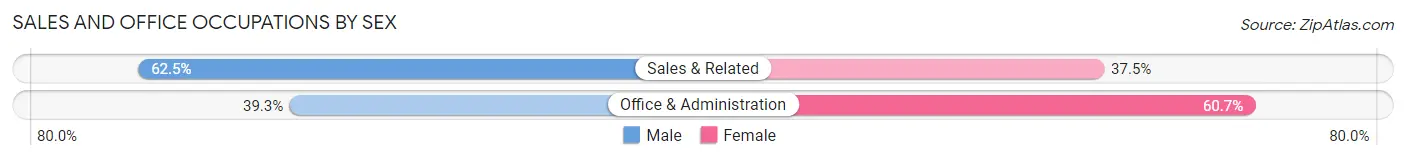
| Occupation | Male | Female |
| Sales & Related | 362 (62.5%) | 217 (37.5%) |
| Office & Administration | 320 (39.3%) | 494 (60.7%) |
| Total (Category) | 682 (49.0%) | 711 (51.0%) |
| Total (Overall) | 7,003 (52.9%) | 6,235 (47.1%) |
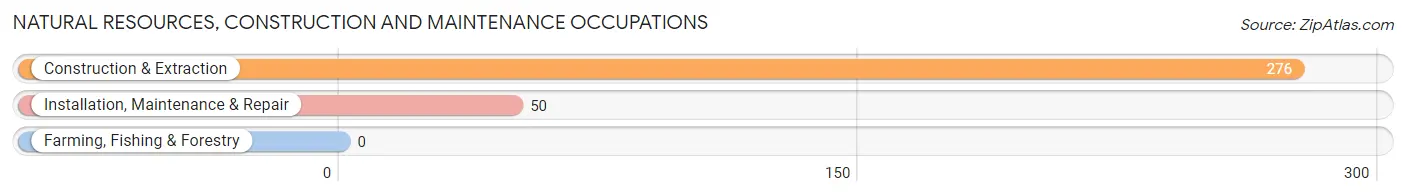
Natural Resources, Construction and Maintenance Occupations
The most common Natural Resources, Construction and Maintenance occupations in Merrifield are Construction & Extraction (276 | 2.1%), and Installation, Maintenance & Repair (50 | 0.4%).
Natural Resources, Construction and Maintenance Occupations by Sex
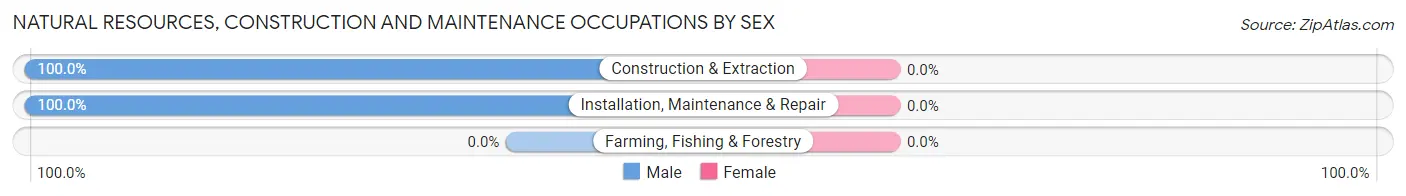
| Occupation | Male | Female |
| Farming, Fishing & Forestry | 0 (0.0%) | 0 (0.0%) |
| Construction & Extraction | 276 (100.0%) | 0 (0.0%) |
| Installation, Maintenance & Repair | 50 (100.0%) | 0 (0.0%) |
| Total (Category) | 326 (100.0%) | 0 (0.0%) |
| Total (Overall) | 7,003 (52.9%) | 6,235 (47.1%) |
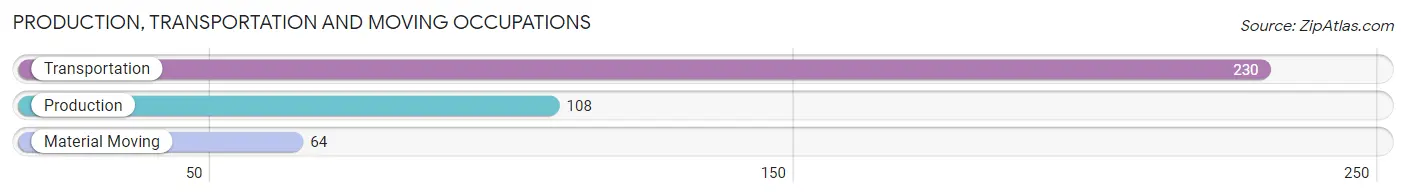
Production, Transportation and Moving Occupations
The most common Production, Transportation and Moving occupations in Merrifield are Transportation (230 | 1.7%), Production (108 | 0.8%), and Material Moving (64 | 0.5%).
Production, Transportation and Moving Occupations by Sex
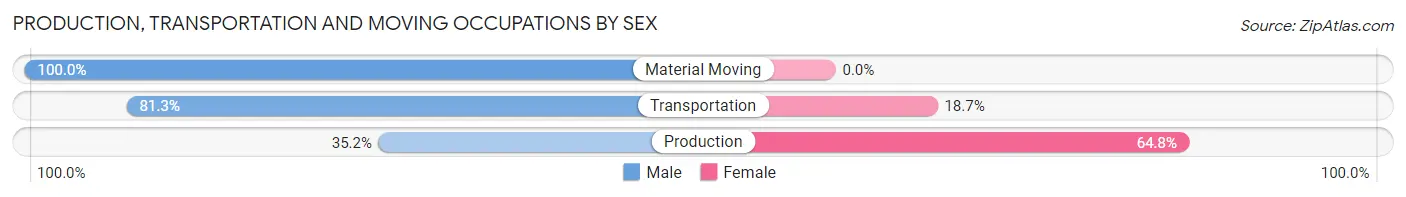
| Occupation | Male | Female |
| Production | 38 (35.2%) | 70 (64.8%) |
| Transportation | 187 (81.3%) | 43 (18.7%) |
| Material Moving | 64 (100.0%) | 0 (0.0%) |
| Total (Category) | 289 (71.9%) | 113 (28.1%) |
| Total (Overall) | 7,003 (52.9%) | 6,235 (47.1%) |
Employment Industries by Sex in Merrifield
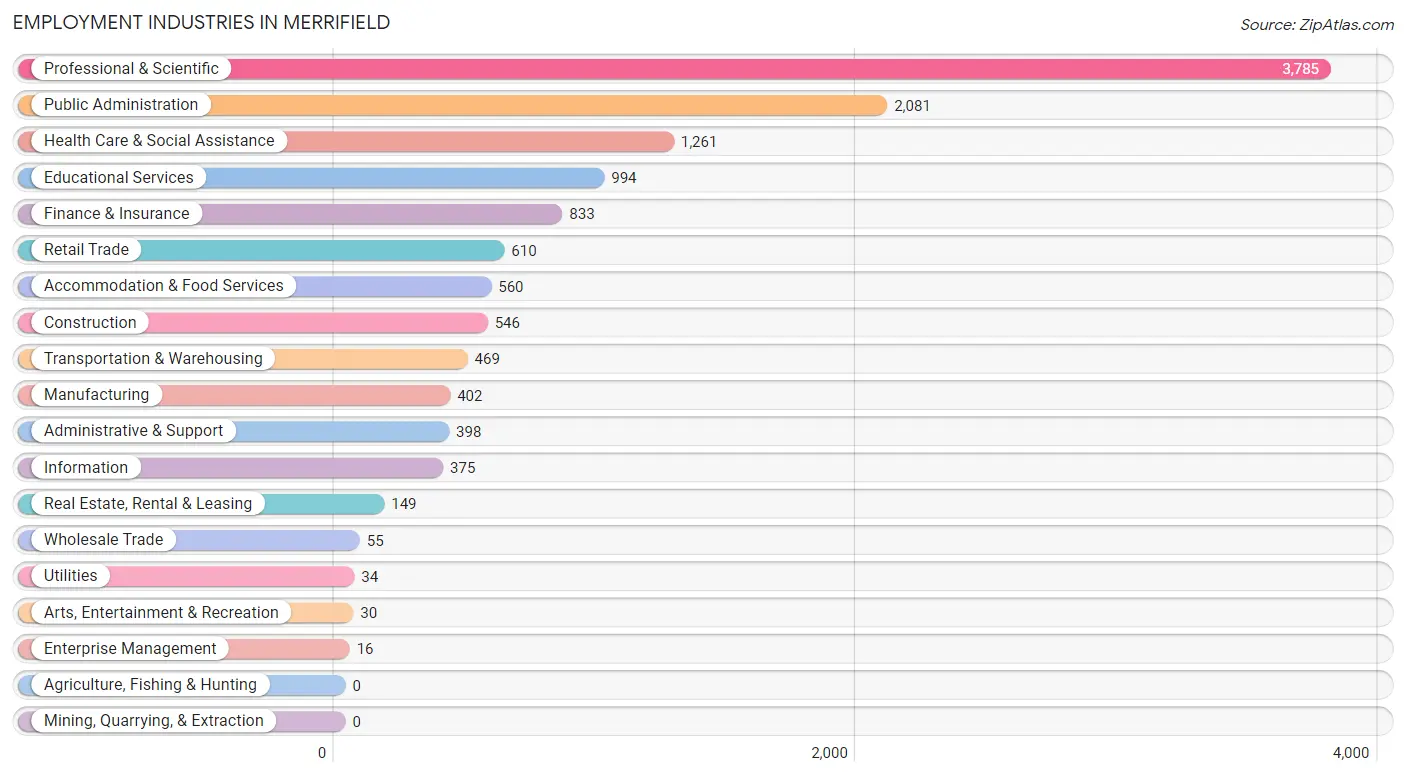
Employment Industries in Merrifield
The major employment industries in Merrifield include Professional & Scientific (3,785 | 28.6%), Public Administration (2,081 | 15.7%), Health Care & Social Assistance (1,261 | 9.5%), Educational Services (994 | 7.5%), and Finance & Insurance (833 | 6.3%).
Employment Industries by Sex in Merrifield
The Merrifield industries that see more men than women are Utilities (100.0%), Construction (87.5%), and Transportation & Warehousing (78.2%), whereas the industries that tend to have a higher number of women are Wholesale Trade (100.0%), Enterprise Management (100.0%), and Health Care & Social Assistance (76.9%).
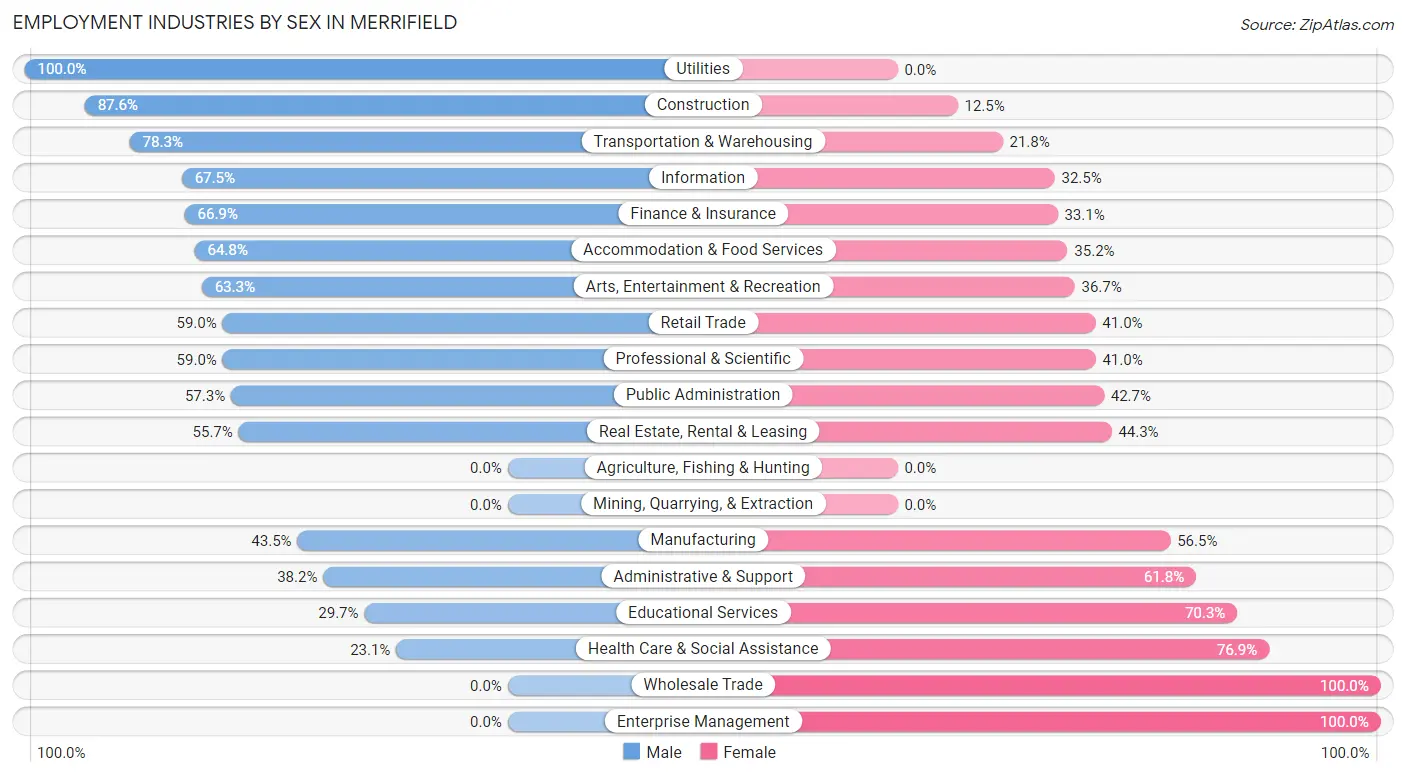
| Industry | Male | Female |
| Agriculture, Fishing & Hunting | 0 (0.0%) | 0 (0.0%) |
| Mining, Quarrying, & Extraction | 0 (0.0%) | 0 (0.0%) |
| Construction | 478 (87.5%) | 68 (12.4%) |
| Manufacturing | 175 (43.5%) | 227 (56.5%) |
| Wholesale Trade | 0 (0.0%) | 55 (100.0%) |
| Retail Trade | 360 (59.0%) | 250 (41.0%) |
| Transportation & Warehousing | 367 (78.2%) | 102 (21.7%) |
| Utilities | 34 (100.0%) | 0 (0.0%) |
| Information | 253 (67.5%) | 122 (32.5%) |
| Finance & Insurance | 557 (66.9%) | 276 (33.1%) |
| Real Estate, Rental & Leasing | 83 (55.7%) | 66 (44.3%) |
| Professional & Scientific | 2,233 (59.0%) | 1,552 (41.0%) |
| Enterprise Management | 0 (0.0%) | 16 (100.0%) |
| Administrative & Support | 152 (38.2%) | 246 (61.8%) |
| Educational Services | 295 (29.7%) | 699 (70.3%) |
| Health Care & Social Assistance | 291 (23.1%) | 970 (76.9%) |
| Arts, Entertainment & Recreation | 19 (63.3%) | 11 (36.7%) |
| Accommodation & Food Services | 363 (64.8%) | 197 (35.2%) |
| Public Administration | 1,192 (57.3%) | 889 (42.7%) |
| Total | 7,003 (52.9%) | 6,235 (47.1%) |
Education in Merrifield
School Enrollment in Merrifield
The most common levels of schooling among the 4,140 students in Merrifield are elementary school (1,030 | 24.9%), college / undergraduate (981 | 23.7%), and high school (715 | 17.3%).
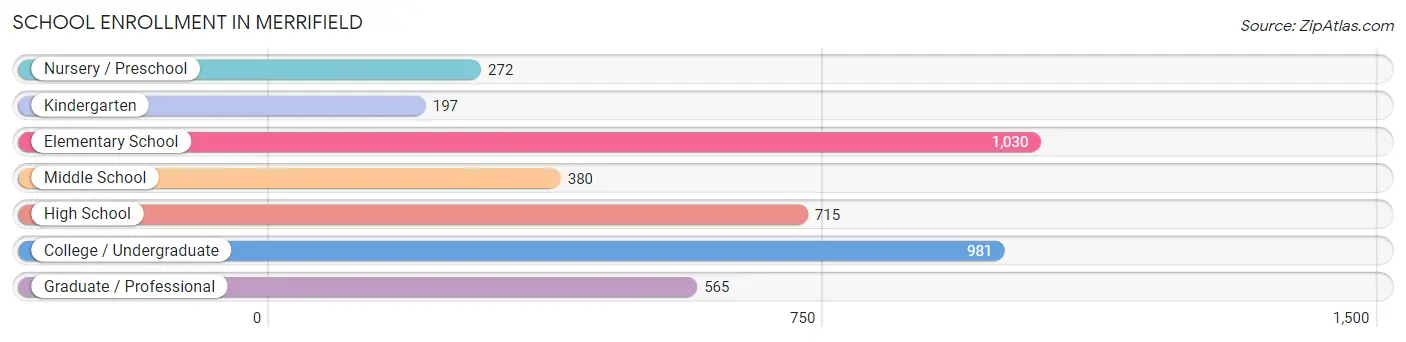
| School Level | # Students | % Students |
| Nursery / Preschool | 272 | 6.6% |
| Kindergarten | 197 | 4.8% |
| Elementary School | 1,030 | 24.9% |
| Middle School | 380 | 9.2% |
| High School | 715 | 17.3% |
| College / Undergraduate | 981 | 23.7% |
| Graduate / Professional | 565 | 13.7% |
| Total | 4,140 | 100.0% |
School Enrollment by Age by Funding Source in Merrifield
Out of a total of 4,140 students who are enrolled in schools in Merrifield, 638 (15.4%) attend a private institution, while the remaining 3,502 (84.6%) are enrolled in public schools. The age group of 35 years and over has the highest likelihood of being enrolled in private schools, with 241 (56.2% in the age bracket) enrolled. Conversely, the age group of 10 to 14 year olds has the lowest likelihood of being enrolled in a private school, with 475 (100.0% in the age bracket) attending a public institution.
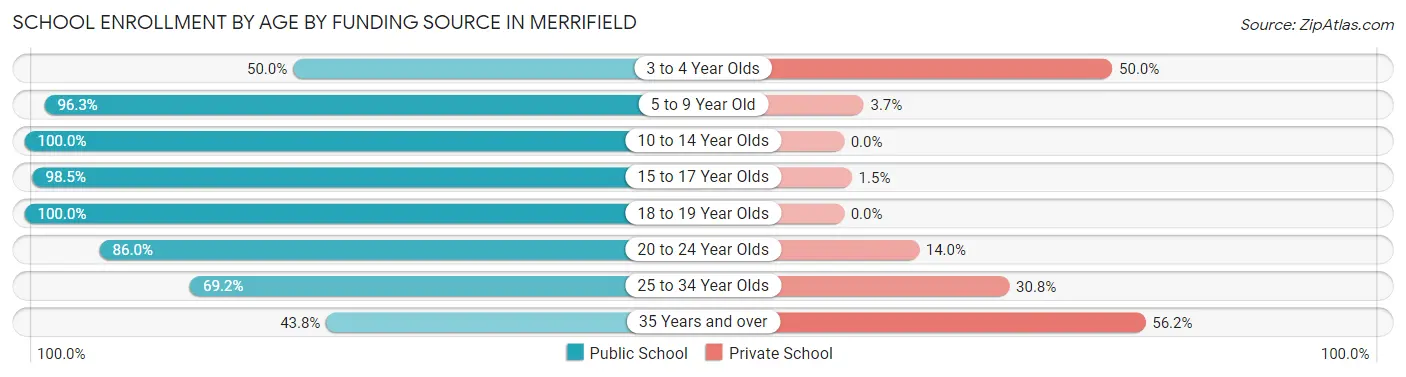
| Age Bracket | Public School | Private School |
| 3 to 4 Year Olds | 120 (50.0%) | 120 (50.0%) |
| 5 to 9 Year Old | 1,144 (96.3%) | 44 (3.7%) |
| 10 to 14 Year Olds | 475 (100.0%) | 0 (0.0%) |
| 15 to 17 Year Olds | 596 (98.5%) | 9 (1.5%) |
| 18 to 19 Year Olds | 153 (100.0%) | 0 (0.0%) |
| 20 to 24 Year Olds | 504 (86.0%) | 82 (14.0%) |
| 25 to 34 Year Olds | 321 (69.2%) | 143 (30.8%) |
| 35 Years and over | 188 (43.8%) | 241 (56.2%) |
| Total | 3,502 (84.6%) | 638 (15.4%) |
Educational Attainment by Field of Study in Merrifield
Social sciences (2,223 | 17.3%), business (2,151 | 16.7%), computers & mathematics (1,721 | 13.4%), engineering (1,380 | 10.7%), and science & technology (875 | 6.8%) are the most common fields of study among 12,864 individuals in Merrifield who have obtained a bachelor's degree or higher.
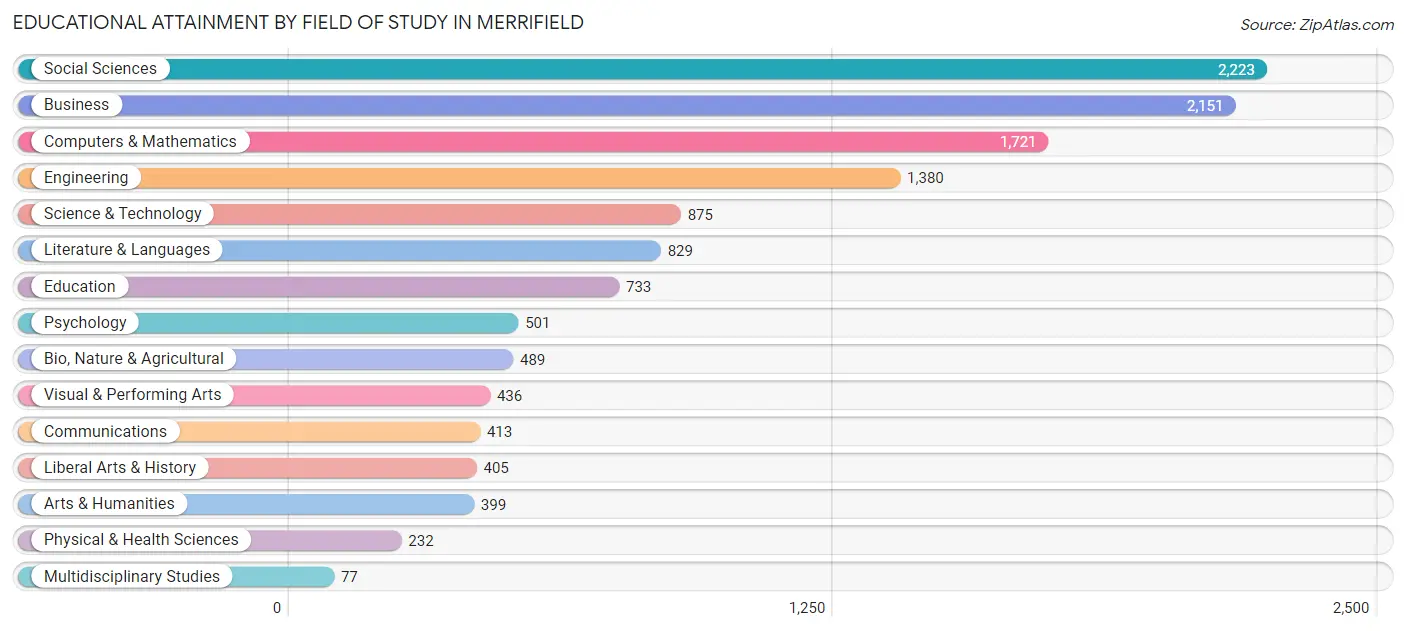
| Field of Study | # Graduates | % Graduates |
| Computers & Mathematics | 1,721 | 13.4% |
| Bio, Nature & Agricultural | 489 | 3.8% |
| Physical & Health Sciences | 232 | 1.8% |
| Psychology | 501 | 3.9% |
| Social Sciences | 2,223 | 17.3% |
| Engineering | 1,380 | 10.7% |
| Multidisciplinary Studies | 77 | 0.6% |
| Science & Technology | 875 | 6.8% |
| Business | 2,151 | 16.7% |
| Education | 733 | 5.7% |
| Literature & Languages | 829 | 6.4% |
| Liberal Arts & History | 405 | 3.2% |
| Visual & Performing Arts | 436 | 3.4% |
| Communications | 413 | 3.2% |
| Arts & Humanities | 399 | 3.1% |
| Total | 12,864 | 100.0% |
Transportation & Commute in Merrifield
Vehicle Availability by Sex in Merrifield
The most prevalent vehicle ownership categories in Merrifield are males with 1 vehicle (3,034, accounting for 43.1%) and females with 1 vehicle (2,969, making up 49.6%).
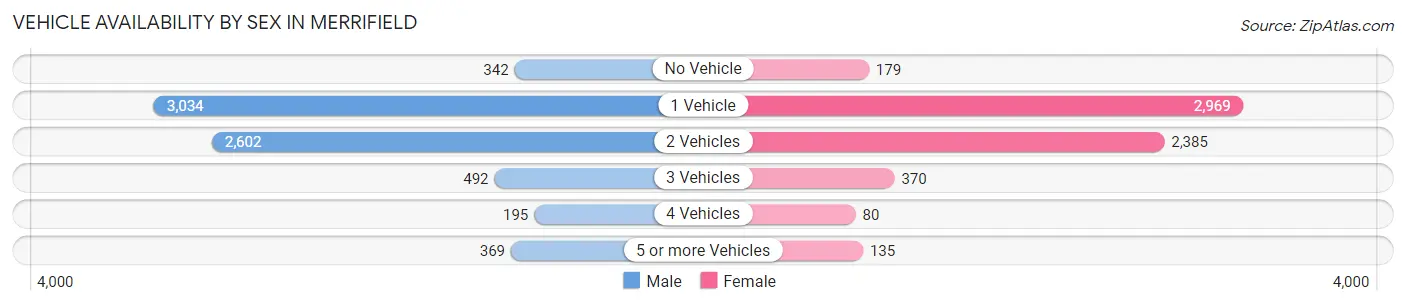
| Vehicles Available | Male | Female |
| No Vehicle | 342 (4.9%) | 179 (2.9%) |
| 1 Vehicle | 3,034 (43.1%) | 2,969 (48.5%) |
| 2 Vehicles | 2,602 (37.0%) | 2,385 (39.0%) |
| 3 Vehicles | 492 (7.0%) | 370 (6.0%) |
| 4 Vehicles | 195 (2.8%) | 80 (1.3%) |
| 5 or more Vehicles | 369 (5.2%) | 135 (2.2%) |
| Total | 7,034 (100.0%) | 6,118 (100.0%) |
Commute Time in Merrifield
The most frequently occuring commute durations in Merrifield are 30 to 34 minutes (1,702 commuters, 17.7%), 20 to 24 minutes (1,644 commuters, 17.1%), and 45 to 59 minutes (1,114 commuters, 11.6%).
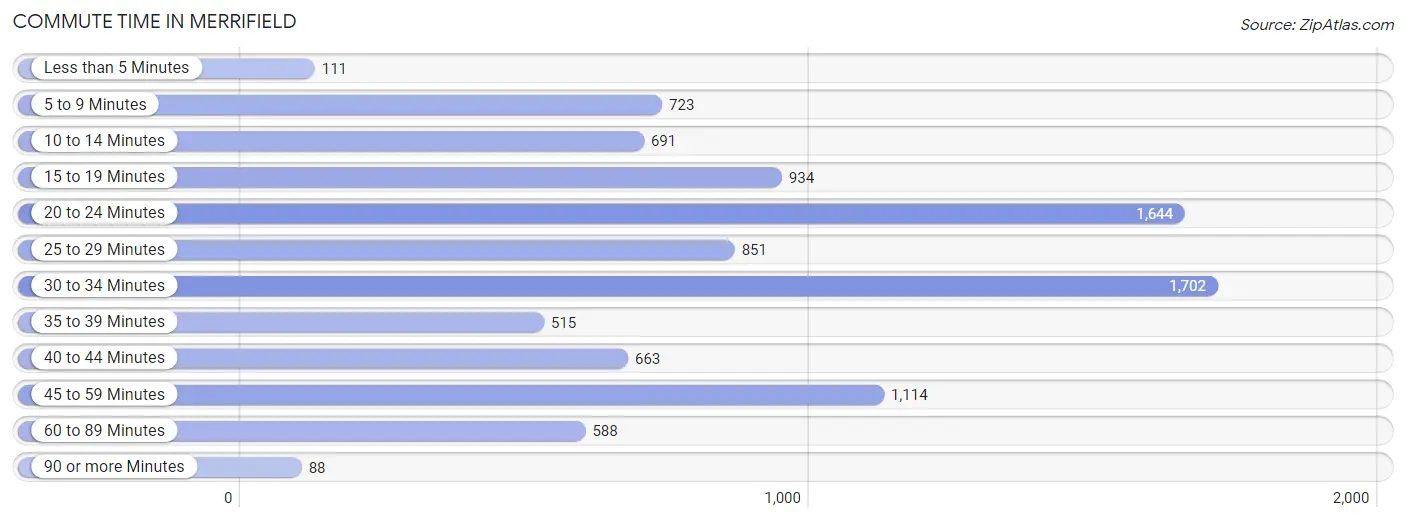
| Commute Time | # Commuters | % Commuters |
| Less than 5 Minutes | 111 | 1.1% |
| 5 to 9 Minutes | 723 | 7.5% |
| 10 to 14 Minutes | 691 | 7.2% |
| 15 to 19 Minutes | 934 | 9.7% |
| 20 to 24 Minutes | 1,644 | 17.1% |
| 25 to 29 Minutes | 851 | 8.8% |
| 30 to 34 Minutes | 1,702 | 17.7% |
| 35 to 39 Minutes | 515 | 5.3% |
| 40 to 44 Minutes | 663 | 6.9% |
| 45 to 59 Minutes | 1,114 | 11.6% |
| 60 to 89 Minutes | 588 | 6.1% |
| 90 or more Minutes | 88 | 0.9% |
Commute Time by Sex in Merrifield
The most common commute times in Merrifield are 30 to 34 minutes (958 commuters, 18.6%) for males and 30 to 34 minutes (744 commuters, 16.6%) for females.
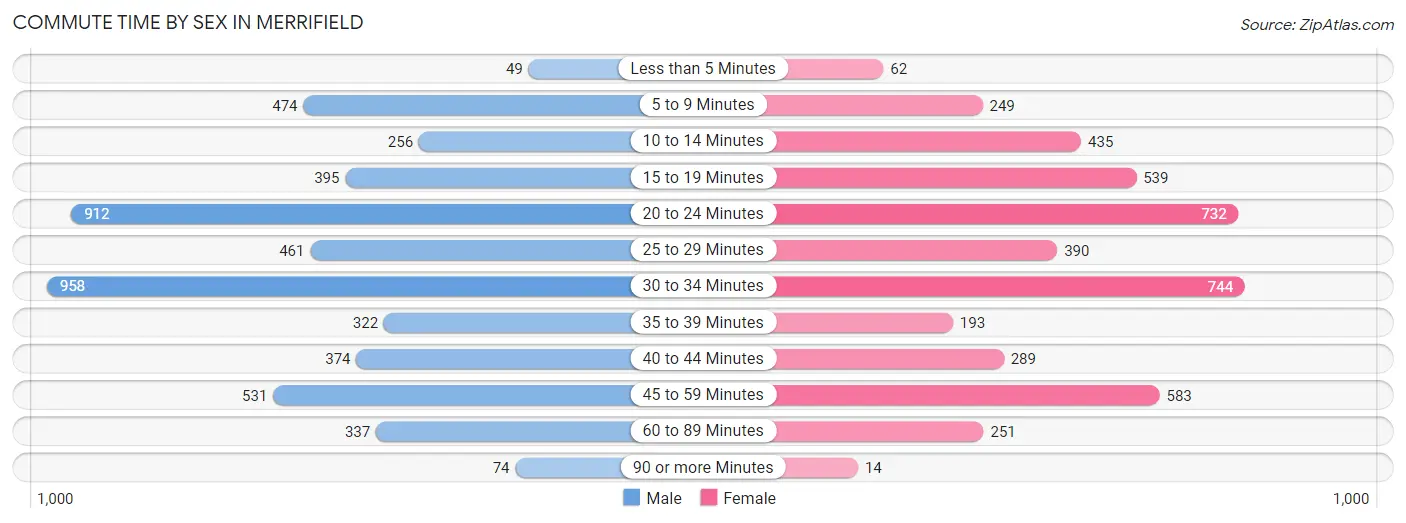
| Commute Time | Male | Female |
| Less than 5 Minutes | 49 (0.9%) | 62 (1.4%) |
| 5 to 9 Minutes | 474 (9.2%) | 249 (5.6%) |
| 10 to 14 Minutes | 256 (5.0%) | 435 (9.7%) |
| 15 to 19 Minutes | 395 (7.7%) | 539 (12.0%) |
| 20 to 24 Minutes | 912 (17.7%) | 732 (16.3%) |
| 25 to 29 Minutes | 461 (9.0%) | 390 (8.7%) |
| 30 to 34 Minutes | 958 (18.6%) | 744 (16.6%) |
| 35 to 39 Minutes | 322 (6.3%) | 193 (4.3%) |
| 40 to 44 Minutes | 374 (7.3%) | 289 (6.5%) |
| 45 to 59 Minutes | 531 (10.3%) | 583 (13.0%) |
| 60 to 89 Minutes | 337 (6.6%) | 251 (5.6%) |
| 90 or more Minutes | 74 (1.4%) | 14 (0.3%) |
Time of Departure to Work by Sex in Merrifield
The most frequent times of departure to work in Merrifield are 7:00 AM to 7:29 AM (909, 17.7%) for males and 8:00 AM to 8:29 AM (873, 19.5%) for females.
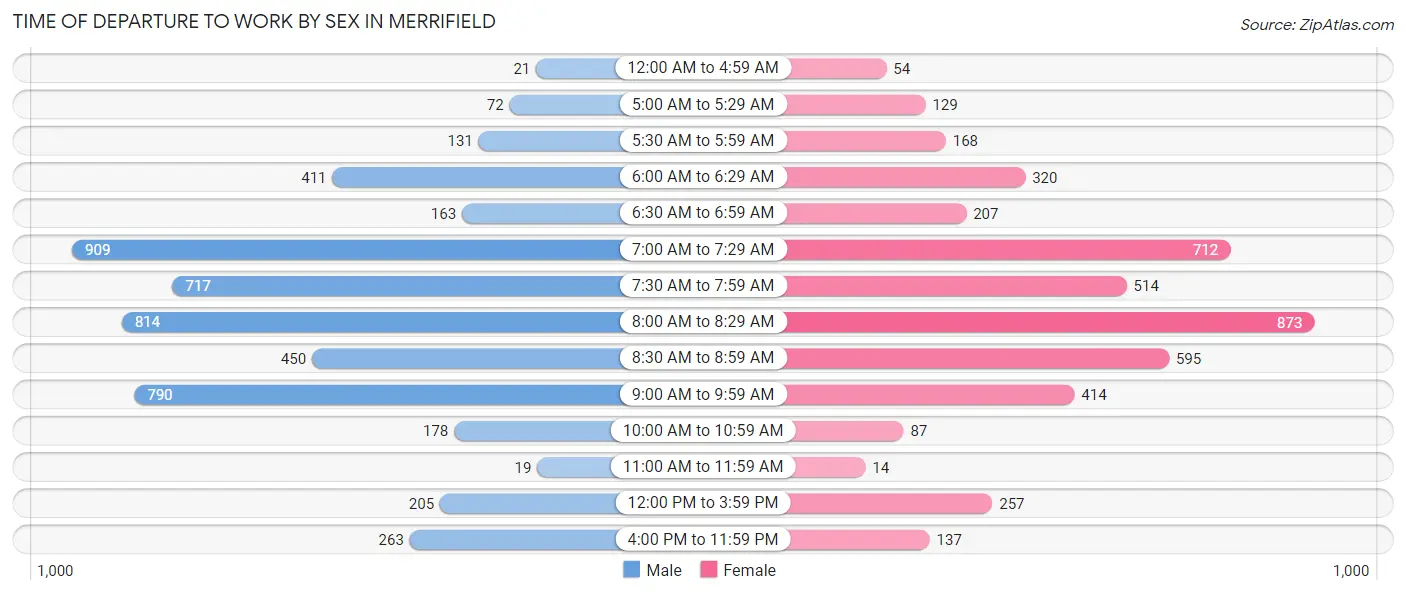
| Time of Departure | Male | Female |
| 12:00 AM to 4:59 AM | 21 (0.4%) | 54 (1.2%) |
| 5:00 AM to 5:29 AM | 72 (1.4%) | 129 (2.9%) |
| 5:30 AM to 5:59 AM | 131 (2.5%) | 168 (3.7%) |
| 6:00 AM to 6:29 AM | 411 (8.0%) | 320 (7.1%) |
| 6:30 AM to 6:59 AM | 163 (3.2%) | 207 (4.6%) |
| 7:00 AM to 7:29 AM | 909 (17.7%) | 712 (15.9%) |
| 7:30 AM to 7:59 AM | 717 (13.9%) | 514 (11.5%) |
| 8:00 AM to 8:29 AM | 814 (15.8%) | 873 (19.5%) |
| 8:30 AM to 8:59 AM | 450 (8.7%) | 595 (13.3%) |
| 9:00 AM to 9:59 AM | 790 (15.4%) | 414 (9.2%) |
| 10:00 AM to 10:59 AM | 178 (3.5%) | 87 (1.9%) |
| 11:00 AM to 11:59 AM | 19 (0.4%) | 14 (0.3%) |
| 12:00 PM to 3:59 PM | 205 (4.0%) | 257 (5.7%) |
| 4:00 PM to 11:59 PM | 263 (5.1%) | 137 (3.1%) |
| Total | 5,143 (100.0%) | 4,481 (100.0%) |
Housing Occupancy in Merrifield
Occupancy by Ownership in Merrifield
Of the total 9,121 dwellings in Merrifield, owner-occupied units account for 3,445 (37.8%), while renter-occupied units make up 5,676 (62.2%).
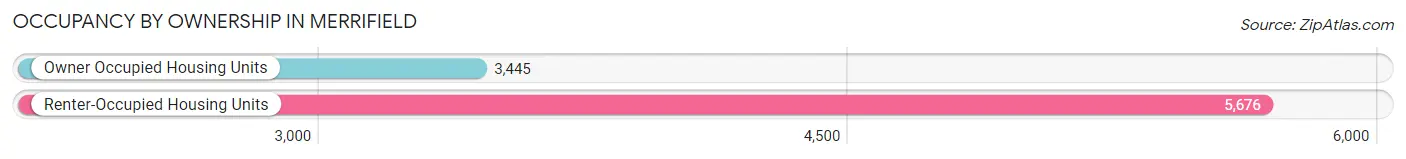
| Occupancy | # Housing Units | % Housing Units |
| Owner Occupied Housing Units | 3,445 | 37.8% |
| Renter-Occupied Housing Units | 5,676 | 62.2% |
| Total Occupied Housing Units | 9,121 | 100.0% |
Occupancy by Household Size in Merrifield
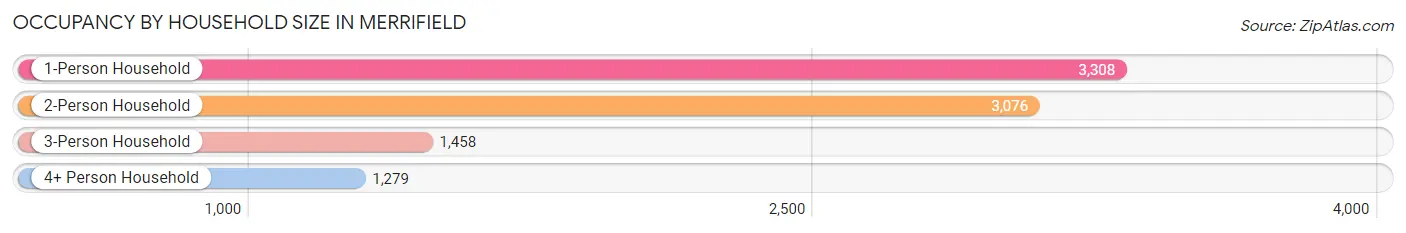
| Household Size | # Housing Units | % Housing Units |
| 1-Person Household | 3,308 | 36.3% |
| 2-Person Household | 3,076 | 33.7% |
| 3-Person Household | 1,458 | 16.0% |
| 4+ Person Household | 1,279 | 14.0% |
| Total Housing Units | 9,121 | 100.0% |
Occupancy by Ownership by Household Size in Merrifield
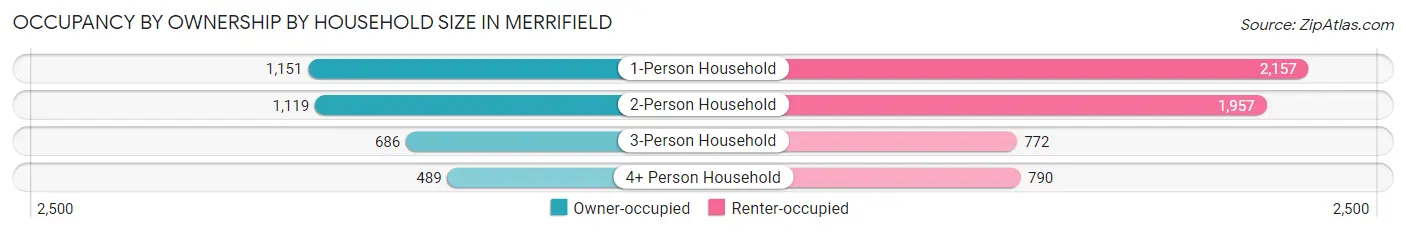
| Household Size | Owner-occupied | Renter-occupied |
| 1-Person Household | 1,151 (34.8%) | 2,157 (65.2%) |
| 2-Person Household | 1,119 (36.4%) | 1,957 (63.6%) |
| 3-Person Household | 686 (47.0%) | 772 (52.9%) |
| 4+ Person Household | 489 (38.2%) | 790 (61.8%) |
| Total Housing Units | 3,445 (37.8%) | 5,676 (62.2%) |
Occupancy by Educational Attainment in Merrifield
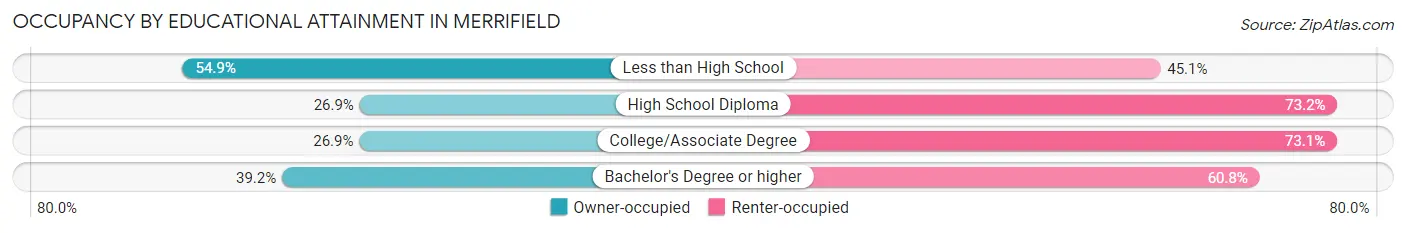
| Household Size | Owner-occupied | Renter-occupied |
| Less than High School | 128 (54.9%) | 105 (45.1%) |
| High School Diploma | 127 (26.9%) | 346 (73.2%) |
| College/Associate Degree | 233 (26.9%) | 633 (73.1%) |
| Bachelor's Degree or higher | 2,957 (39.2%) | 4,592 (60.8%) |
Occupancy by Age of Householder in Merrifield
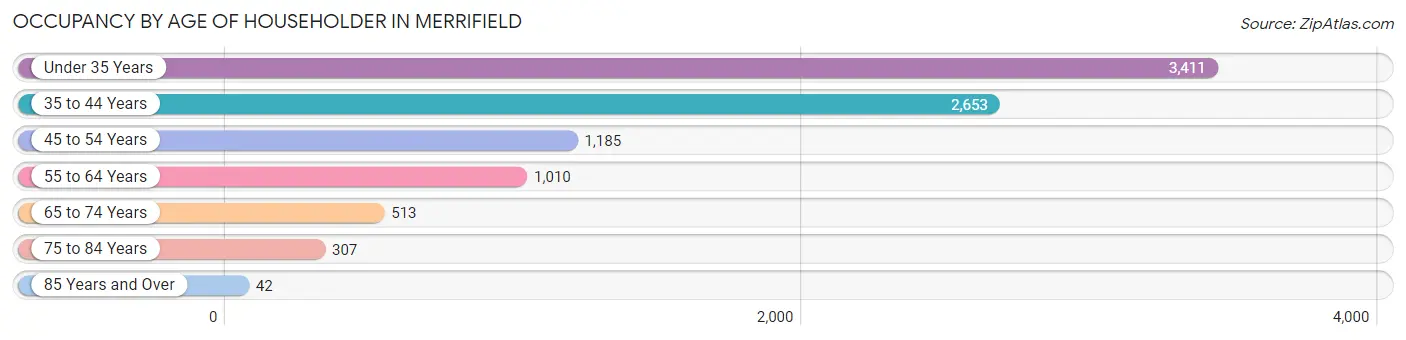
| Age Bracket | # Households | % Households |
| Under 35 Years | 3,411 | 37.4% |
| 35 to 44 Years | 2,653 | 29.1% |
| 45 to 54 Years | 1,185 | 13.0% |
| 55 to 64 Years | 1,010 | 11.1% |
| 65 to 74 Years | 513 | 5.6% |
| 75 to 84 Years | 307 | 3.4% |
| 85 Years and Over | 42 | 0.5% |
| Total | 9,121 | 100.0% |
Housing Finances in Merrifield
Median Income by Occupancy in Merrifield
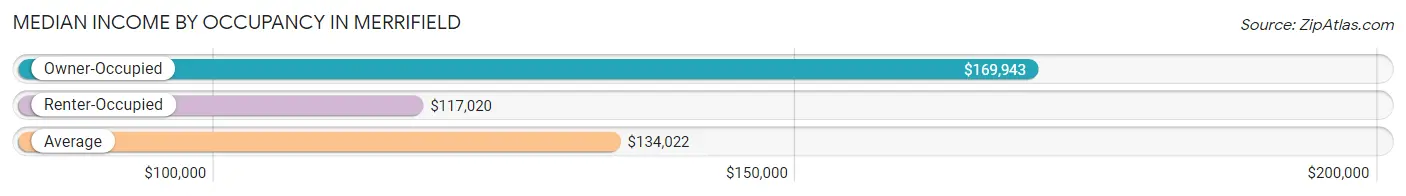
| Occupancy Type | # Households | Median Income |
| Owner-Occupied | 3,445 (37.8%) | $169,943 |
| Renter-Occupied | 5,676 (62.2%) | $117,020 |
| Average | 9,121 (100.0%) | $134,022 |
Occupancy by Householder Income Bracket in Merrifield
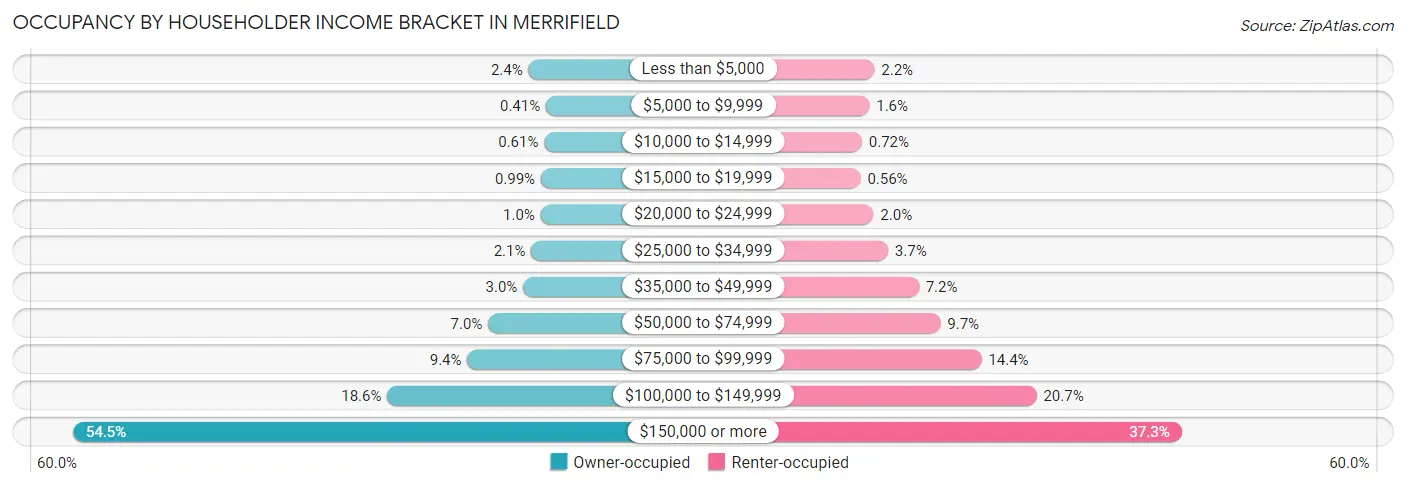
| Income Bracket | Owner-occupied | Renter-occupied |
| Less than $5,000 | 83 (2.4%) | 122 (2.1%) |
| $5,000 to $9,999 | 14 (0.4%) | 89 (1.6%) |
| $10,000 to $14,999 | 21 (0.6%) | 41 (0.7%) |
| $15,000 to $19,999 | 34 (1.0%) | 32 (0.6%) |
| $20,000 to $24,999 | 35 (1.0%) | 116 (2.0%) |
| $25,000 to $34,999 | 72 (2.1%) | 210 (3.7%) |
| $35,000 to $49,999 | 104 (3.0%) | 410 (7.2%) |
| $50,000 to $74,999 | 242 (7.0%) | 550 (9.7%) |
| $75,000 to $99,999 | 324 (9.4%) | 817 (14.4%) |
| $100,000 to $149,999 | 639 (18.5%) | 1,174 (20.7%) |
| $150,000 or more | 1,877 (54.5%) | 2,115 (37.3%) |
| Total | 3,445 (100.0%) | 5,676 (100.0%) |
Monthly Housing Cost Tiers in Merrifield
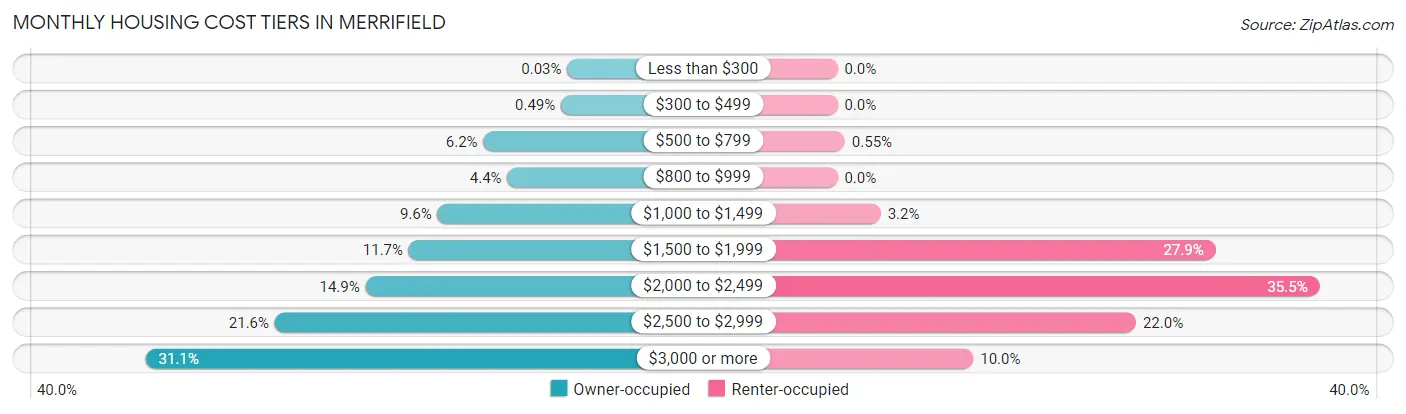
| Monthly Cost | Owner-occupied | Renter-occupied |
| Less than $300 | 1 (0.0%) | 0 (0.0%) |
| $300 to $499 | 17 (0.5%) | 0 (0.0%) |
| $500 to $799 | 214 (6.2%) | 31 (0.5%) |
| $800 to $999 | 153 (4.4%) | 0 (0.0%) |
| $1,000 to $1,499 | 330 (9.6%) | 181 (3.2%) |
| $1,500 to $1,999 | 403 (11.7%) | 1,581 (27.9%) |
| $2,000 to $2,499 | 513 (14.9%) | 2,015 (35.5%) |
| $2,500 to $2,999 | 743 (21.6%) | 1,248 (22.0%) |
| $3,000 or more | 1,071 (31.1%) | 568 (10.0%) |
| Total | 3,445 (100.0%) | 5,676 (100.0%) |
Physical Housing Characteristics in Merrifield
Housing Structures in Merrifield
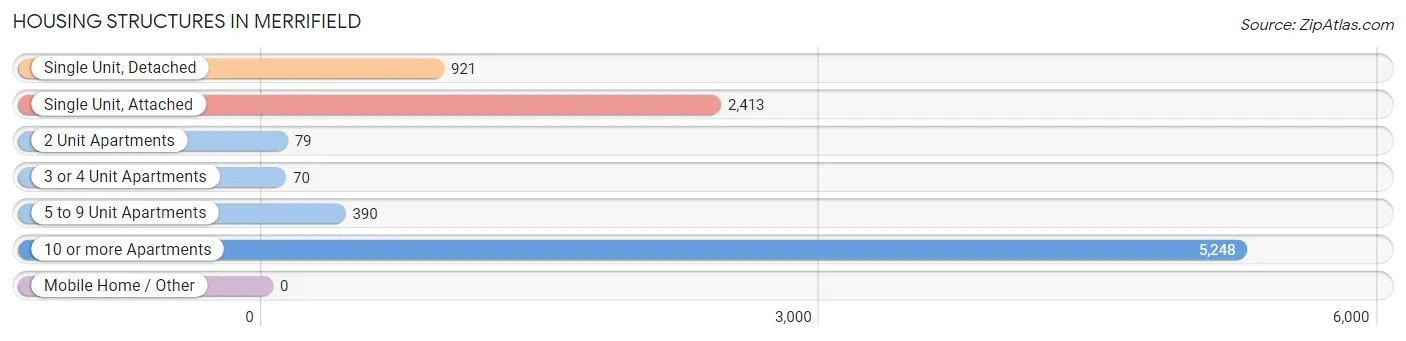
| Structure Type | # Housing Units | % Housing Units |
| Single Unit, Detached | 921 | 10.1% |
| Single Unit, Attached | 2,413 | 26.5% |
| 2 Unit Apartments | 79 | 0.9% |
| 3 or 4 Unit Apartments | 70 | 0.8% |
| 5 to 9 Unit Apartments | 390 | 4.3% |
| 10 or more Apartments | 5,248 | 57.5% |
| Mobile Home / Other | 0 | 0.0% |
| Total | 9,121 | 100.0% |
Housing Structures by Occupancy in Merrifield
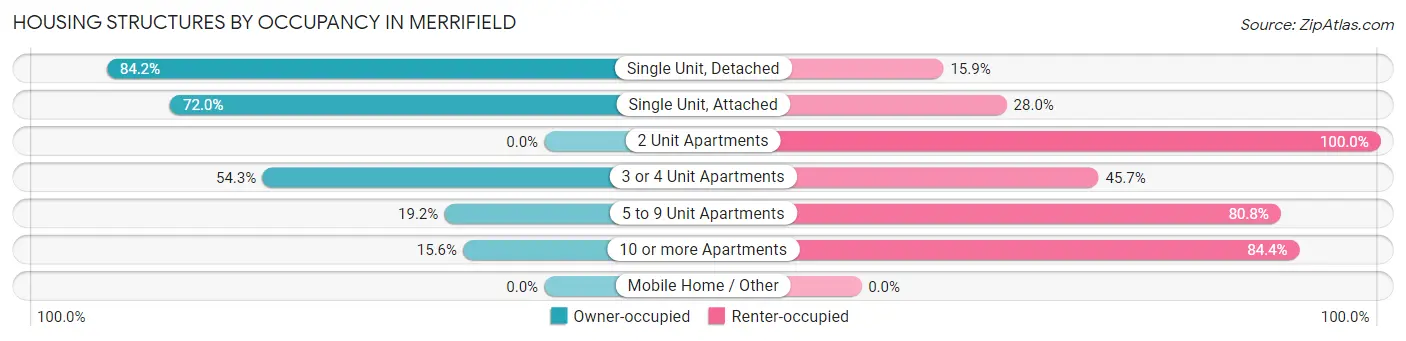
| Structure Type | Owner-occupied | Renter-occupied |
| Single Unit, Detached | 775 (84.2%) | 146 (15.9%) |
| Single Unit, Attached | 1,737 (72.0%) | 676 (28.0%) |
| 2 Unit Apartments | 0 (0.0%) | 79 (100.0%) |
| 3 or 4 Unit Apartments | 38 (54.3%) | 32 (45.7%) |
| 5 to 9 Unit Apartments | 75 (19.2%) | 315 (80.8%) |
| 10 or more Apartments | 820 (15.6%) | 4,428 (84.4%) |
| Mobile Home / Other | 0 (0.0%) | 0 (0.0%) |
| Total | 3,445 (37.8%) | 5,676 (62.2%) |
Housing Structures by Number of Rooms in Merrifield
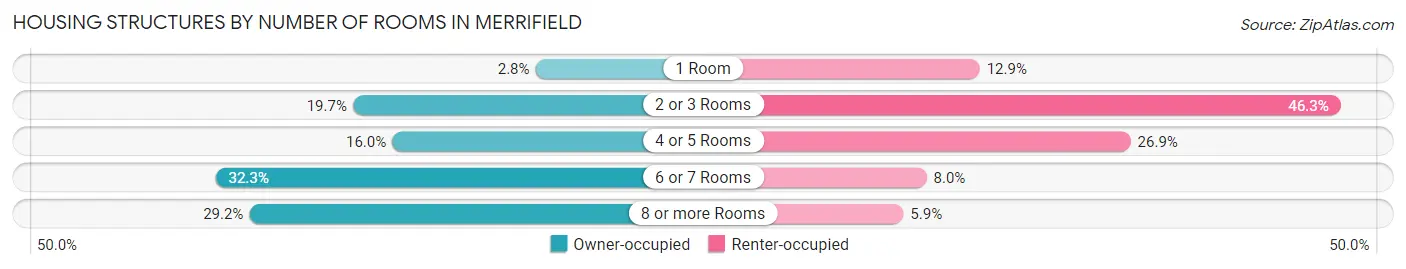
| Number of Rooms | Owner-occupied | Renter-occupied |
| 1 Room | 95 (2.8%) | 734 (12.9%) |
| 2 or 3 Rooms | 677 (19.7%) | 2,628 (46.3%) |
| 4 or 5 Rooms | 552 (16.0%) | 1,526 (26.9%) |
| 6 or 7 Rooms | 1,114 (32.3%) | 455 (8.0%) |
| 8 or more Rooms | 1,007 (29.2%) | 333 (5.9%) |
| Total | 3,445 (100.0%) | 5,676 (100.0%) |
Housing Structure by Heating Type in Merrifield
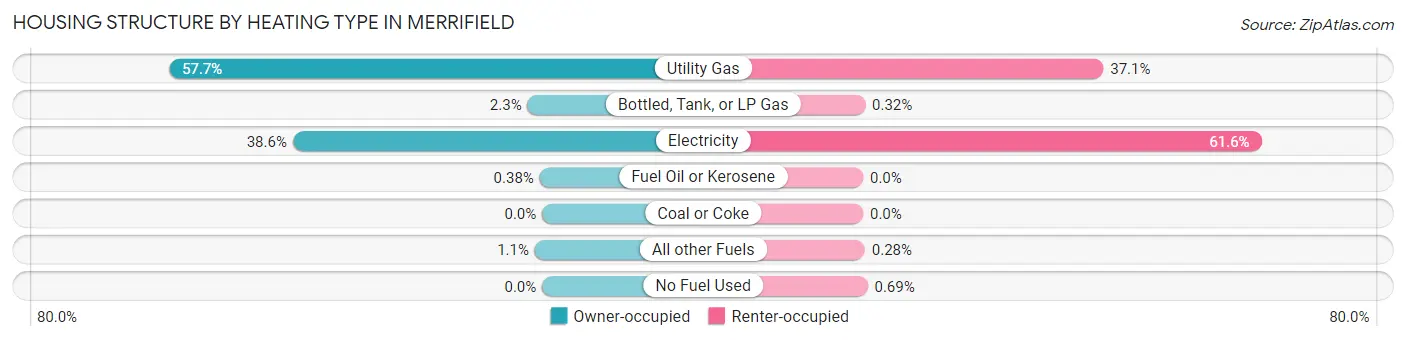
| Heating Type | Owner-occupied | Renter-occupied |
| Utility Gas | 1,987 (57.7%) | 2,108 (37.1%) |
| Bottled, Tank, or LP Gas | 78 (2.3%) | 18 (0.3%) |
| Electricity | 1,328 (38.6%) | 3,495 (61.6%) |
| Fuel Oil or Kerosene | 13 (0.4%) | 0 (0.0%) |
| Coal or Coke | 0 (0.0%) | 0 (0.0%) |
| All other Fuels | 39 (1.1%) | 16 (0.3%) |
| No Fuel Used | 0 (0.0%) | 39 (0.7%) |
| Total | 3,445 (100.0%) | 5,676 (100.0%) |
Household Vehicle Usage in Merrifield
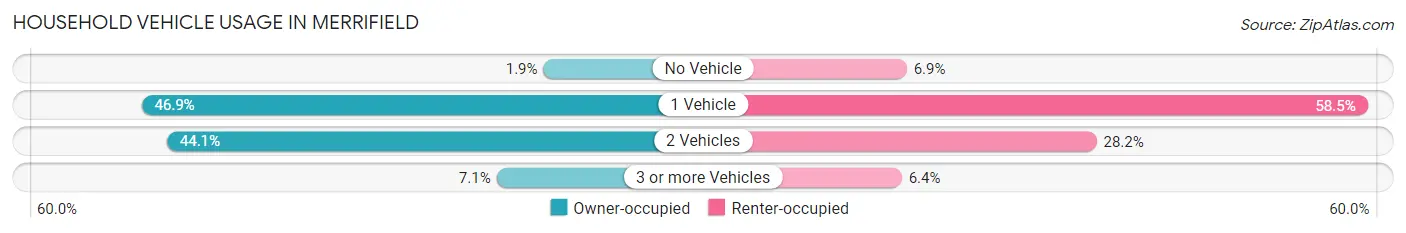
| Vehicles per Household | Owner-occupied | Renter-occupied |
| No Vehicle | 65 (1.9%) | 393 (6.9%) |
| 1 Vehicle | 1,616 (46.9%) | 3,322 (58.5%) |
| 2 Vehicles | 1,518 (44.1%) | 1,600 (28.2%) |
| 3 or more Vehicles | 246 (7.1%) | 361 (6.4%) |
| Total | 3,445 (100.0%) | 5,676 (100.0%) |
Real Estate & Mortgages in Merrifield
Real Estate and Mortgage Overview in Merrifield
| Characteristic | Without Mortgage | With Mortgage |
| Housing Units | 676 | 2,769 |
| Median Property Value | $638,100 | $590,000 |
| Median Household Income | $104,375 | $1,654 |
| Monthly Housing Costs | $954 | $1,071 |
| Real Estate Taxes | $7,441 | $127 |
Property Value by Mortgage Status in Merrifield
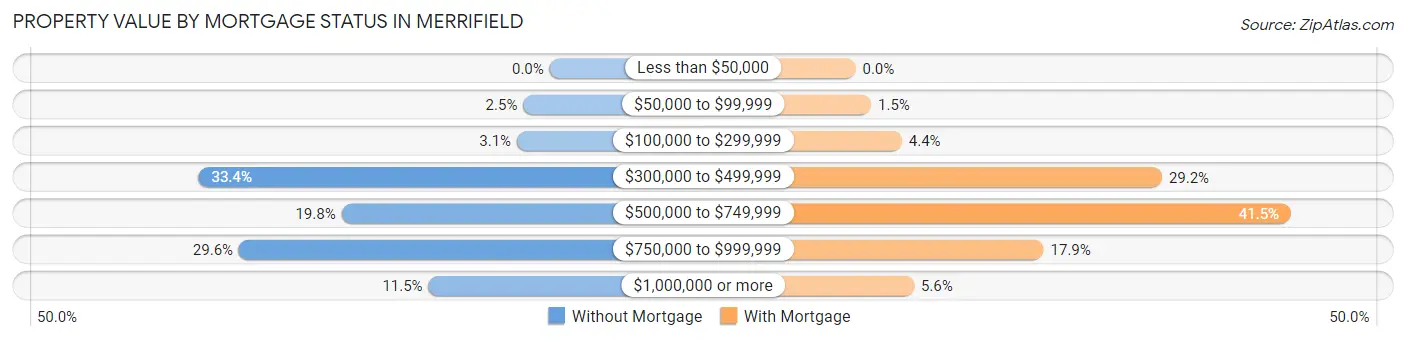
| Property Value | Without Mortgage | With Mortgage |
| Less than $50,000 | 0 (0.0%) | 0 (0.0%) |
| $50,000 to $99,999 | 17 (2.5%) | 41 (1.5%) |
| $100,000 to $299,999 | 21 (3.1%) | 122 (4.4%) |
| $300,000 to $499,999 | 226 (33.4%) | 808 (29.2%) |
| $500,000 to $749,999 | 134 (19.8%) | 1,148 (41.5%) |
| $750,000 to $999,999 | 200 (29.6%) | 496 (17.9%) |
| $1,000,000 or more | 78 (11.5%) | 154 (5.6%) |
| Total | 676 (100.0%) | 2,769 (100.0%) |
Household Income by Mortgage Status in Merrifield
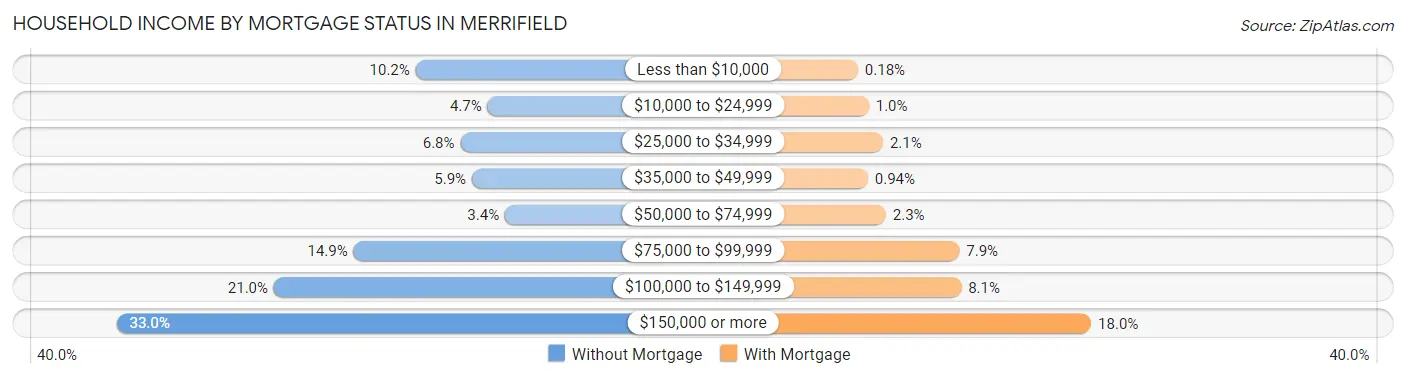
| Household Income | Without Mortgage | With Mortgage |
| Less than $10,000 | 69 (10.2%) | 5 (0.2%) |
| $10,000 to $24,999 | 32 (4.7%) | 28 (1.0%) |
| $25,000 to $34,999 | 46 (6.8%) | 58 (2.1%) |
| $35,000 to $49,999 | 40 (5.9%) | 26 (0.9%) |
| $50,000 to $74,999 | 23 (3.4%) | 64 (2.3%) |
| $75,000 to $99,999 | 101 (14.9%) | 219 (7.9%) |
| $100,000 to $149,999 | 142 (21.0%) | 223 (8.1%) |
| $150,000 or more | 223 (33.0%) | 497 (17.9%) |
| Total | 676 (100.0%) | 2,769 (100.0%) |
Property Value to Household Income Ratio in Merrifield
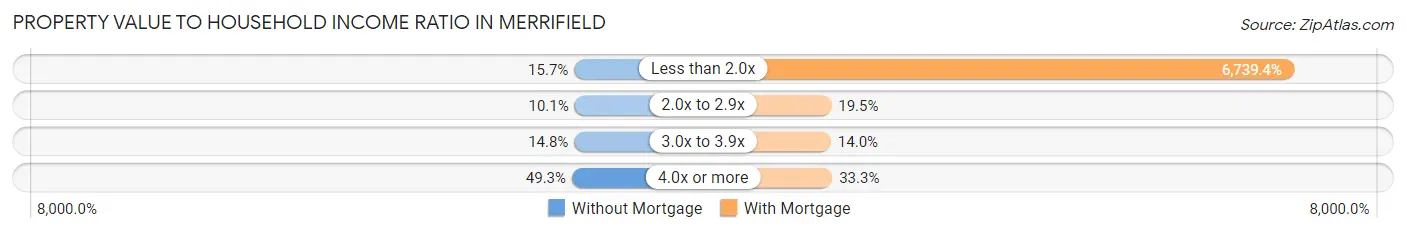
| Value-to-Income Ratio | Without Mortgage | With Mortgage |
| Less than 2.0x | 106 (15.7%) | 186,615 (6,739.4%) |
| 2.0x to 2.9x | 68 (10.1%) | 540 (19.5%) |
| 3.0x to 3.9x | 100 (14.8%) | 388 (14.0%) |
| 4.0x or more | 333 (49.3%) | 921 (33.3%) |
| Total | 676 (100.0%) | 2,769 (100.0%) |
Real Estate Taxes by Mortgage Status in Merrifield
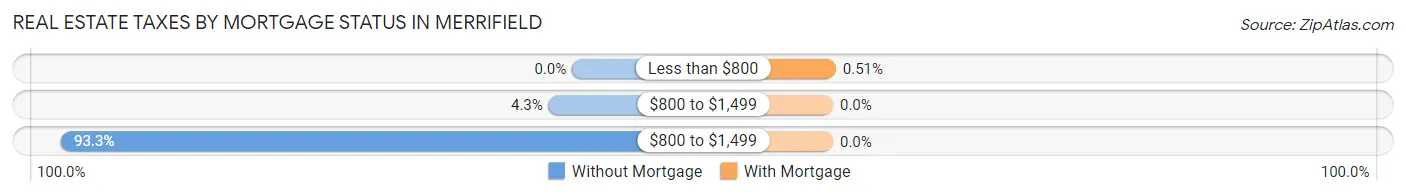
| Property Taxes | Without Mortgage | With Mortgage |
| Less than $800 | 0 (0.0%) | 14 (0.5%) |
| $800 to $1,499 | 29 (4.3%) | 0 (0.0%) |
| $800 to $1,499 | 631 (93.3%) | 0 (0.0%) |
| Total | 676 (100.0%) | 2,769 (100.0%) |
Health & Disability in Merrifield
Health Insurance Coverage by Age in Merrifield
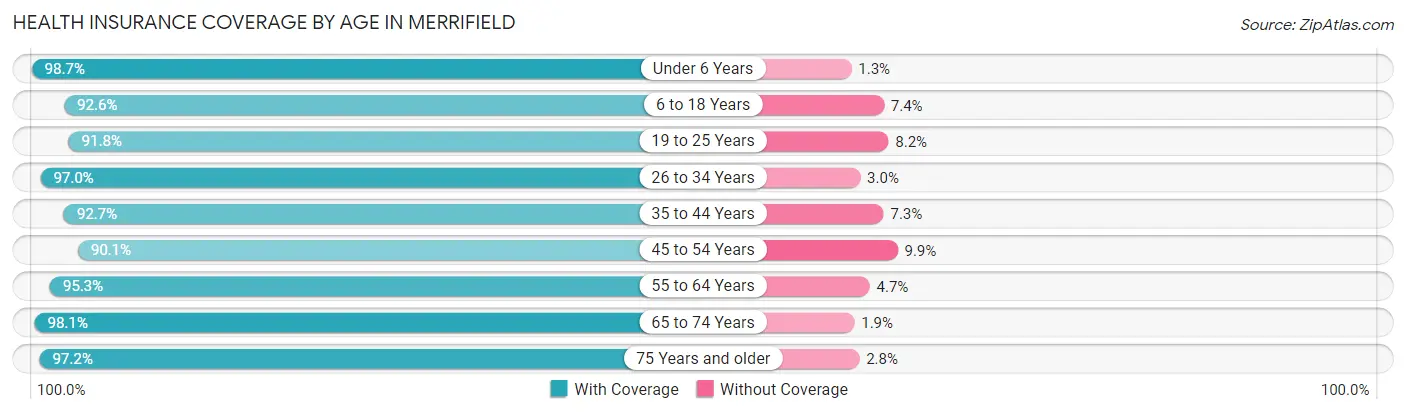
| Age Bracket | With Coverage | Without Coverage |
| Under 6 Years | 1,280 (98.7%) | 17 (1.3%) |
| 6 to 18 Years | 2,132 (92.6%) | 170 (7.4%) |
| 19 to 25 Years | 1,864 (91.8%) | 167 (8.2%) |
| 26 to 34 Years | 4,925 (97.0%) | 150 (3.0%) |
| 35 to 44 Years | 3,723 (92.7%) | 294 (7.3%) |
| 45 to 54 Years | 1,751 (90.1%) | 193 (9.9%) |
| 55 to 64 Years | 1,452 (95.3%) | 72 (4.7%) |
| 65 to 74 Years | 898 (98.1%) | 17 (1.9%) |
| 75 Years and older | 560 (97.2%) | 16 (2.8%) |
| Total | 18,585 (94.4%) | 1,096 (5.6%) |
Health Insurance Coverage by Citizenship Status in Merrifield
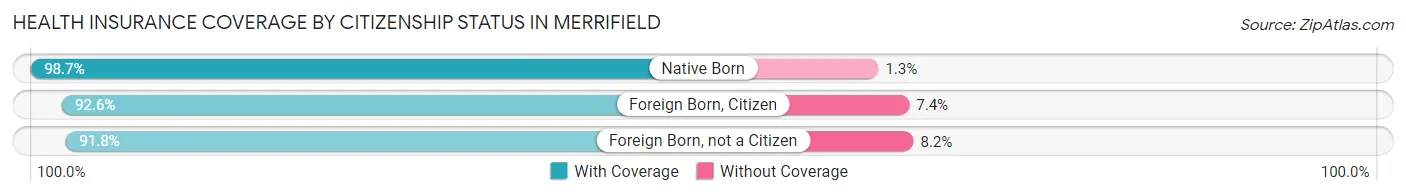
| Citizenship Status | With Coverage | Without Coverage |
| Native Born | 1,280 (98.7%) | 17 (1.3%) |
| Foreign Born, Citizen | 2,132 (92.6%) | 170 (7.4%) |
| Foreign Born, not a Citizen | 1,864 (91.8%) | 167 (8.2%) |
Health Insurance Coverage by Household Income in Merrifield
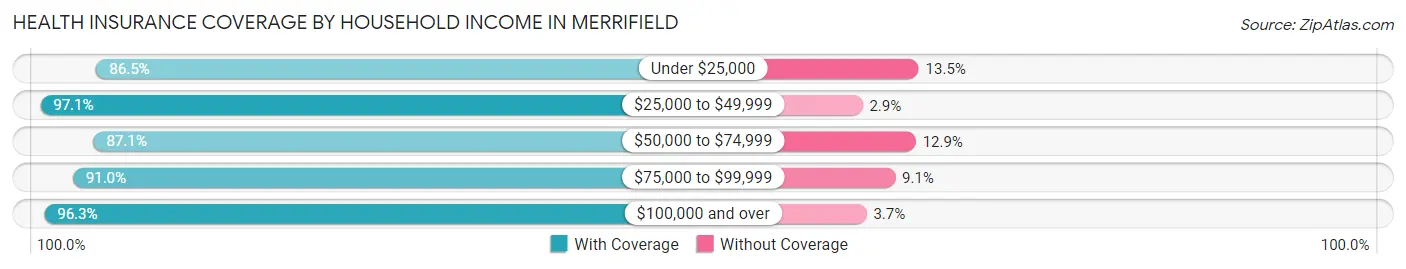
| Household Income | With Coverage | Without Coverage |
| Under $25,000 | 945 (86.5%) | 147 (13.5%) |
| $25,000 to $49,999 | 1,355 (97.1%) | 41 (2.9%) |
| $50,000 to $74,999 | 1,268 (87.1%) | 188 (12.9%) |
| $75,000 to $99,999 | 2,371 (90.9%) | 236 (9.0%) |
| $100,000 and over | 12,644 (96.3%) | 484 (3.7%) |
Public vs Private Health Insurance Coverage by Age in Merrifield
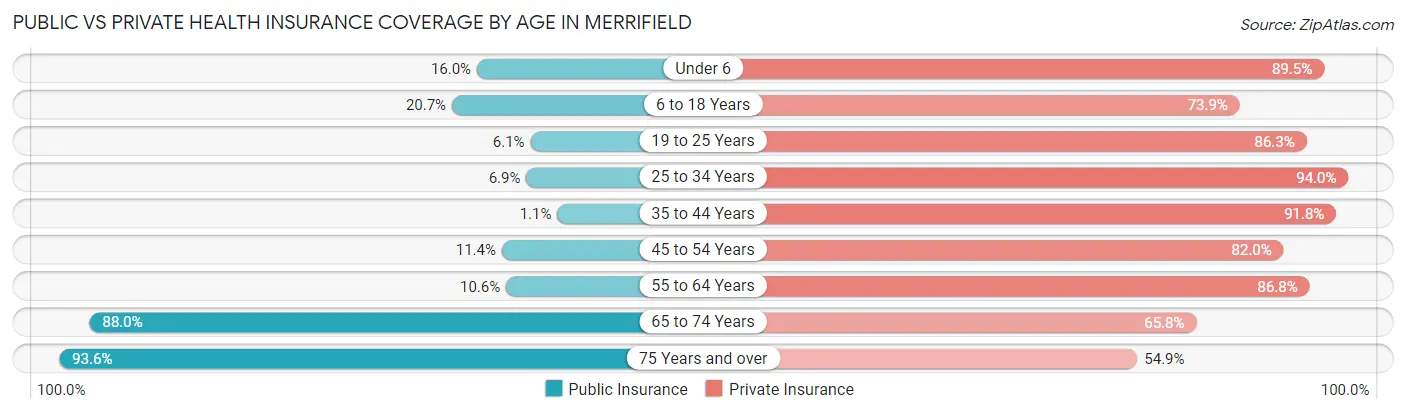
| Age Bracket | Public Insurance | Private Insurance |
| Under 6 | 208 (16.0%) | 1,161 (89.5%) |
| 6 to 18 Years | 476 (20.7%) | 1,700 (73.9%) |
| 19 to 25 Years | 124 (6.1%) | 1,752 (86.3%) |
| 25 to 34 Years | 349 (6.9%) | 4,771 (94.0%) |
| 35 to 44 Years | 45 (1.1%) | 3,686 (91.8%) |
| 45 to 54 Years | 222 (11.4%) | 1,594 (82.0%) |
| 55 to 64 Years | 162 (10.6%) | 1,323 (86.8%) |
| 65 to 74 Years | 805 (88.0%) | 602 (65.8%) |
| 75 Years and over | 539 (93.6%) | 316 (54.9%) |
| Total | 2,930 (14.9%) | 16,905 (85.9%) |
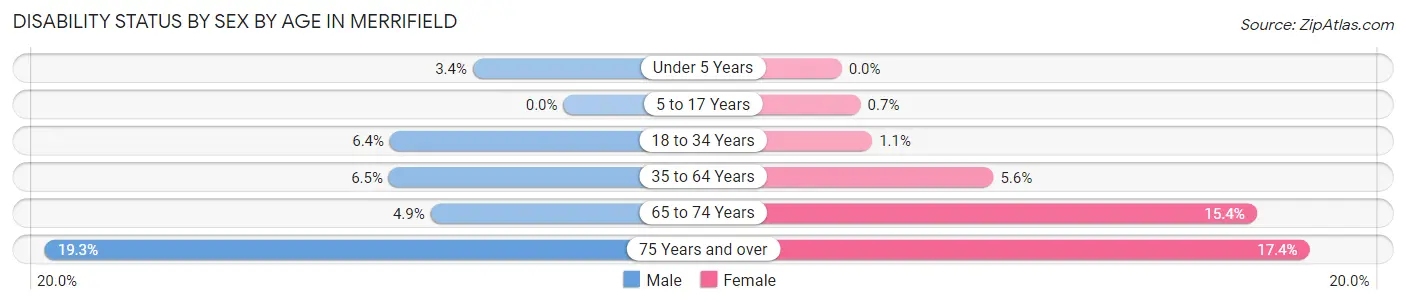
Disability Status by Sex by Age in Merrifield
| Age Bracket | Male | Female |
| Under 5 Years | 19 (3.4%) | 0 (0.0%) |
| 5 to 17 Years | 0 (0.0%) | 7 (0.7%) |
| 18 to 34 Years | 224 (6.4%) | 43 (1.1%) |
| 35 to 64 Years | 257 (6.5%) | 198 (5.6%) |
| 65 to 74 Years | 23 (4.9%) | 69 (15.4%) |
| 75 Years and over | 41 (19.3%) | 63 (17.4%) |
Disability Class by Sex by Age in Merrifield
Disability Class: Hearing Difficulty
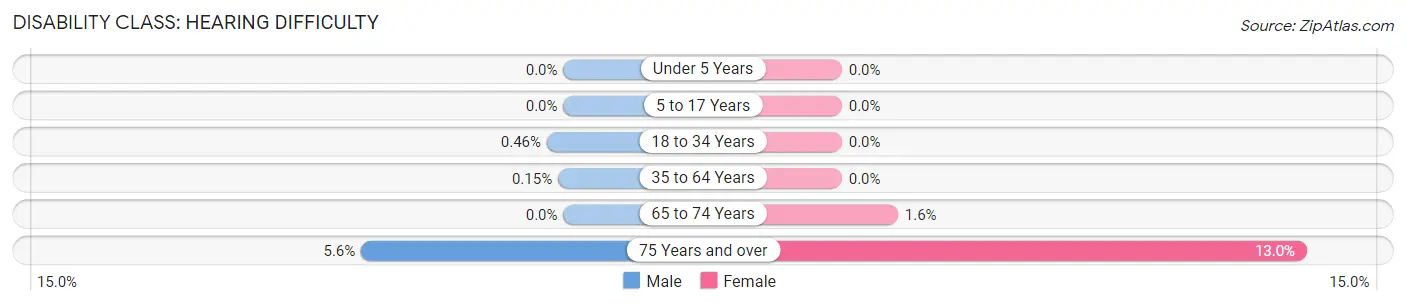
| Age Bracket | Male | Female |
| Under 5 Years | 0 (0.0%) | 0 (0.0%) |
| 5 to 17 Years | 0 (0.0%) | 0 (0.0%) |
| 18 to 34 Years | 16 (0.5%) | 0 (0.0%) |
| 35 to 64 Years | 6 (0.2%) | 0 (0.0%) |
| 65 to 74 Years | 0 (0.0%) | 7 (1.6%) |
| 75 Years and over | 12 (5.6%) | 47 (13.0%) |
Disability Class: Vision Difficulty
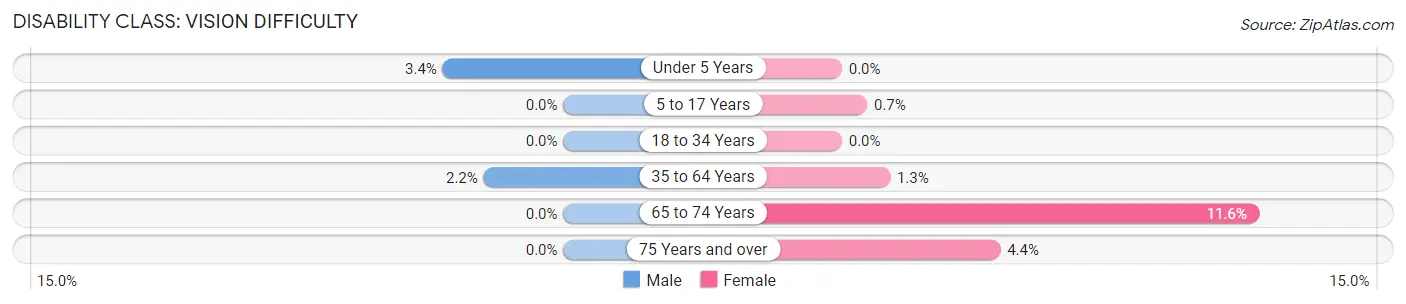
| Age Bracket | Male | Female |
| Under 5 Years | 19 (3.4%) | 0 (0.0%) |
| 5 to 17 Years | 0 (0.0%) | 7 (0.7%) |
| 18 to 34 Years | 0 (0.0%) | 0 (0.0%) |
| 35 to 64 Years | 88 (2.2%) | 47 (1.3%) |
| 65 to 74 Years | 0 (0.0%) | 52 (11.6%) |
| 75 Years and over | 0 (0.0%) | 16 (4.4%) |
Disability Class: Cognitive Difficulty
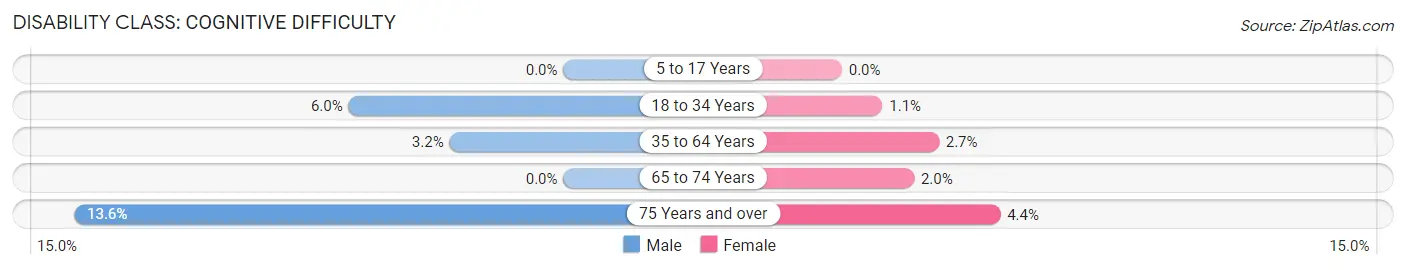
| Age Bracket | Male | Female |
| 5 to 17 Years | 0 (0.0%) | 0 (0.0%) |
| 18 to 34 Years | 208 (6.0%) | 43 (1.1%) |
| 35 to 64 Years | 126 (3.2%) | 95 (2.7%) |
| 65 to 74 Years | 0 (0.0%) | 9 (2.0%) |
| 75 Years and over | 29 (13.6%) | 16 (4.4%) |
Disability Class: Ambulatory Difficulty
| Age Bracket | Male | Female |
| 5 to 17 Years | 0 (0.0%) | 0 (0.0%) |
| 18 to 34 Years | 16 (0.5%) | 0 (0.0%) |
| 35 to 64 Years | 37 (0.9%) | 137 (3.9%) |
| 65 to 74 Years | 23 (4.9%) | 68 (15.2%) |
| 75 Years and over | 11 (5.2%) | 32 (8.8%) |
Disability Class: Self-Care Difficulty
| Age Bracket | Male | Female |
| 5 to 17 Years | 0 (0.0%) | 0 (0.0%) |
| 18 to 34 Years | 19 (0.5%) | 0 (0.0%) |
| 35 to 64 Years | 0 (0.0%) | 29 (0.8%) |
| 65 to 74 Years | 10 (2.1%) | 9 (2.0%) |
| 75 Years and over | 0 (0.0%) | 32 (8.8%) |
Technology Access in Merrifield
Computing Device Access in Merrifield
| Device Type | # Households | % Households |
| Desktop or Laptop | 8,721 | 95.6% |
| Smartphone | 8,778 | 96.2% |
| Tablet | 6,959 | 76.3% |
| No Computing Device | 126 | 1.4% |
| Total | 9,121 | 100.0% |
Internet Access in Merrifield
| Internet Type | # Households | % Households |
| Dial-Up Internet | 0 | 0.0% |
| Broadband Home | 8,283 | 90.8% |
| Cellular Data Only | 576 | 6.3% |
| Satellite Internet | 417 | 4.6% |
| No Internet | 206 | 2.3% |
| Total | 9,121 | 100.0% |
Merrifield Summary
Merrifield, Virginia is a census-designated place (CDP) located in Fairfax County, Virginia. It is situated in the northern part of the county, just south of the city of Falls Church. The population of Merrifield was estimated to be 11,717 in 2019.
History
Merrifield was originally part of the Fairfax County plantation of William Fitzhugh, who was granted the land in 1690. The area was known as “Fitzhugh’s Crossroads” and was a popular stop for travelers on the road between Alexandria and Leesburg. In the late 19th century, the area was known as “Merrifield’s Crossroads” after the Merrifield family, who owned a large farm in the area.
In the early 20th century, the area began to develop as a residential suburb of Washington, D.C. The area was annexed by the City of Falls Church in 1948, and the name was changed to Merrifield. The area was later re-annexed by Fairfax County in 1961.
Geography
Merrifield is located in northern Fairfax County, just south of the City of Falls Church. It is bordered to the north by the City of Fairfax, to the east by Dunn Loring, to the south by Bailey’s Crossroads, and to the west by Seven Corners. The area is approximately 4.5 square miles in size.
The terrain of Merrifield is mostly flat, with some rolling hills in the northern part of the area. The area is drained by Accotink Creek, which flows through the center of the CDP.
Economy
Merrifield is home to a variety of businesses, including retail stores, restaurants, and office buildings. The area is also home to several large employers, including the United States Postal Service, the Department of Defense, and the Department of Homeland Security.
The area is also home to several shopping centers, including the Merrifield Town Center, the Mosaic District, and the Dunn Loring Metro Station. The area is also home to several parks, including the Merrifield Park and the Merrifield Garden Center.
Demographics
As of the 2019 American Community Survey, the population of Merrifield was estimated to be 11,717. The racial makeup of the area was 57.3% White, 15.2% Black or African American, 0.3% Native American, 16.2% Asian, 0.1% Pacific Islander, and 4.9% from other races. Hispanic or Latino of any race were 11.2% of the population.
The median household income in Merrifield was $90,945 in 2019, and the median home value was $521,400. The median age of residents was 37.7 years. The area is served by the Fairfax County Public Schools system.
Common Questions
What is Per Capita Income in Merrifield?
Per Capita income in Merrifield is $73,188.
What is the Median Family Income in Merrifield?
Median Family Income in Merrifield is $166,076.
What is the Median Household income in Merrifield?
Median Household Income in Merrifield is $134,022.
What is Income or Wage Gap in Merrifield?
Income or Wage Gap in Merrifield is 22.8%.
Women in Merrifield earn 77.2 cents for every dollar earned by a man.
What is Family Income Deficit in Merrifield?
Family Income Deficit in Merrifield is $14,230.
Families that are below poverty line in Merrifield earn $14,230 less on average than the poverty threshold level.
What is Inequality or Gini Index in Merrifield?
Inequality or Gini Index in Merrifield is 0.40.
What is the Total Population of Merrifield?
Total Population of Merrifield is 19,923.
What is the Total Male Population of Merrifield?
Total Male Population of Merrifield is 10,207.
What is the Total Female Population of Merrifield?
Total Female Population of Merrifield is 9,716.
What is the Ratio of Males per 100 Females in Merrifield?
There are 105.05 Males per 100 Females in Merrifield.
What is the Ratio of Females per 100 Males in Merrifield?
There are 95.19 Females per 100 Males in Merrifield.
What is the Median Population Age in Merrifield?
Median Population Age in Merrifield is 33.8 Years.
What is the Average Family Size in Merrifield
Average Family Size in Merrifield is 2.9 People.
What is the Average Household Size in Merrifield
Average Household Size in Merrifield is 2.2 People.
How Large is the Labor Force in Merrifield?
There are 13,766 People in the Labor Forcein in Merrifield.
What is the Percentage of People in the Labor Force in Merrifield?
82.0% of People are in the Labor Force in Merrifield.
What is the Unemployment Rate in Merrifield?
Unemployment Rate in Merrifield is 2.1%.