Shawneeland, VA Map & Demographics
Shawneeland Map
Shawneeland Overview
$41,286
PER CAPITA INCOME
$96,136
AVG FAMILY INCOME
$79,583
AVG HOUSEHOLD INCOME
2.6%
WAGE / INCOME GAP [ % ]
97.4¢/ $1
WAGE / INCOME GAP [ $ ]
0.42
INEQUALITY / GINI INDEX
2,347
TOTAL POPULATION
1,160
MALE POPULATION
1,187
FEMALE POPULATION
97.73
MALES / 100 FEMALES
102.33
FEMALES / 100 MALES
36.4
MEDIAN AGE
3.2
AVG FAMILY SIZE
2.6
AVG HOUSEHOLD SIZE
1,184
LABOR FORCE [ PEOPLE ]
67.2%
PERCENT IN LABOR FORCE
3.5%
UNEMPLOYMENT RATE
Income in Shawneeland
Income Overview in Shawneeland
Per Capita Income in Shawneeland is $41,286, while median incomes of families and households are $96,136 and $79,583 respectively.
| Characteristic | Number | Measure |
| Per Capita Income | 2,347 | $41,286 |
| Median Family Income | 556 | $96,136 |
| Mean Family Income | 556 | $115,117 |
| Median Household Income | 900 | $79,583 |
| Mean Household Income | 900 | $103,861 |
| Income Deficit | 556 | $0 |
| Wage / Income Gap (%) | 2,347 | 2.63% |
| Wage / Income Gap ($) | 2,347 | 97.37¢ per $1 |
| Gini / Inequality Index | 2,347 | 0.42 |
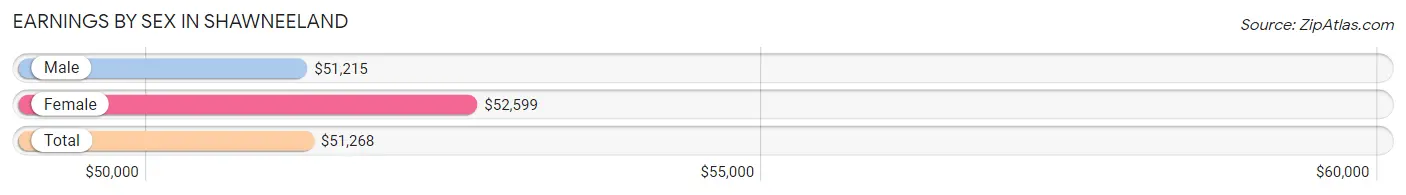
Earnings by Sex in Shawneeland
Average Earnings in Shawneeland are $51,268, $51,215 for men and $52,599 for women, a difference of 2.6%.
| Sex | Number | Average Earnings |
| Male | 769 (65.6%) | $51,215 |
| Female | 403 (34.4%) | $52,599 |
| Total | 1,172 (100.0%) | $51,268 |
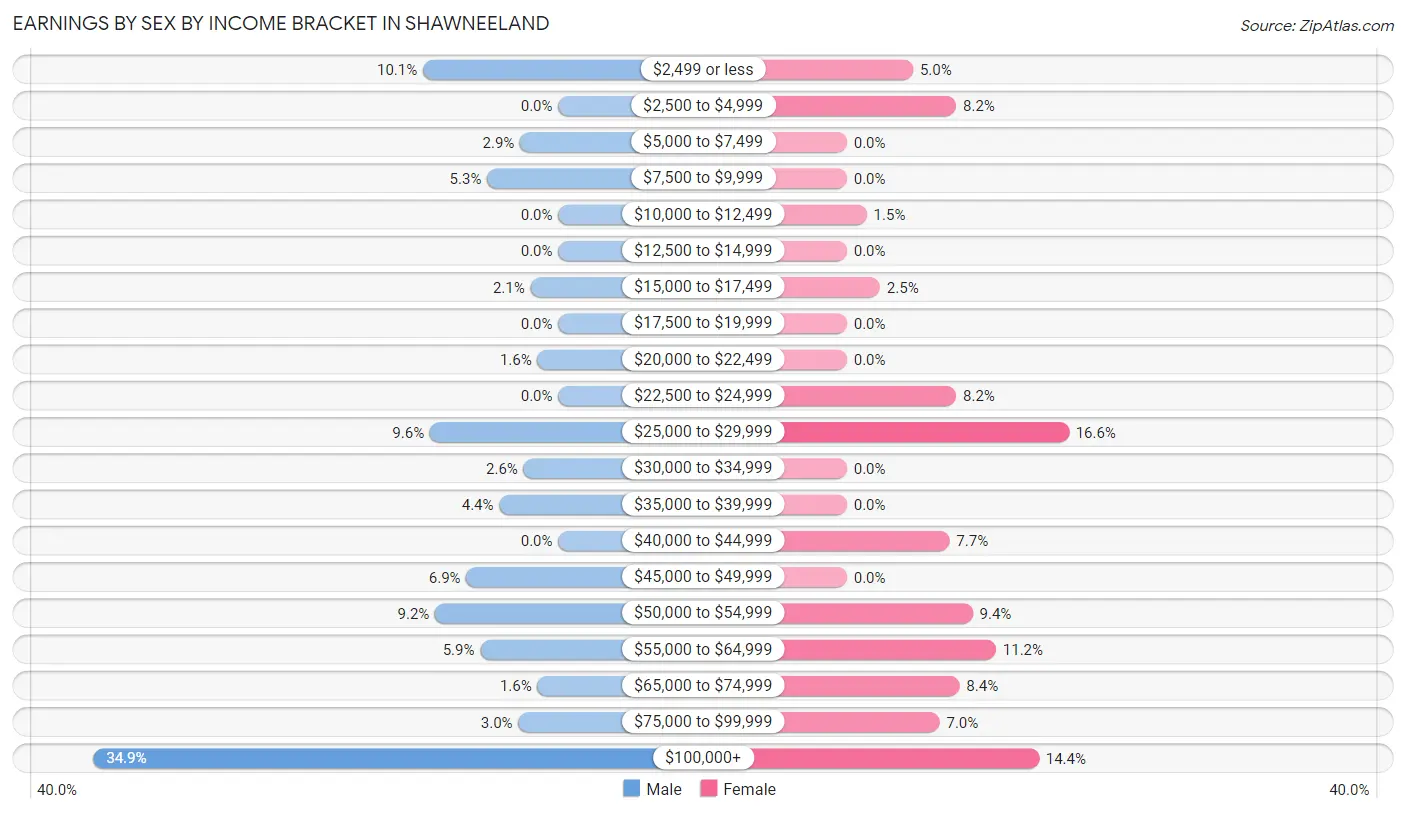
Earnings by Sex by Income Bracket in Shawneeland
The most common earnings brackets in Shawneeland are $100,000+ for men (268 | 34.8%) and $25,000 to $29,999 for women (67 | 16.6%).
| Income | Male | Female |
| $2,499 or less | 78 (10.1%) | 20 (5.0%) |
| $2,500 to $4,999 | 0 (0.0%) | 33 (8.2%) |
| $5,000 to $7,499 | 22 (2.9%) | 0 (0.0%) |
| $7,500 to $9,999 | 41 (5.3%) | 0 (0.0%) |
| $10,000 to $12,499 | 0 (0.0%) | 6 (1.5%) |
| $12,500 to $14,999 | 0 (0.0%) | 0 (0.0%) |
| $15,000 to $17,499 | 16 (2.1%) | 10 (2.5%) |
| $17,500 to $19,999 | 0 (0.0%) | 0 (0.0%) |
| $20,000 to $22,499 | 12 (1.6%) | 0 (0.0%) |
| $22,500 to $24,999 | 0 (0.0%) | 33 (8.2%) |
| $25,000 to $29,999 | 74 (9.6%) | 67 (16.6%) |
| $30,000 to $34,999 | 20 (2.6%) | 0 (0.0%) |
| $35,000 to $39,999 | 34 (4.4%) | 0 (0.0%) |
| $40,000 to $44,999 | 0 (0.0%) | 31 (7.7%) |
| $45,000 to $49,999 | 53 (6.9%) | 0 (0.0%) |
| $50,000 to $54,999 | 71 (9.2%) | 38 (9.4%) |
| $55,000 to $64,999 | 45 (5.9%) | 45 (11.2%) |
| $65,000 to $74,999 | 12 (1.6%) | 34 (8.4%) |
| $75,000 to $99,999 | 23 (3.0%) | 28 (7.0%) |
| $100,000+ | 268 (34.8%) | 58 (14.4%) |
| Total | 769 (100.0%) | 403 (100.0%) |
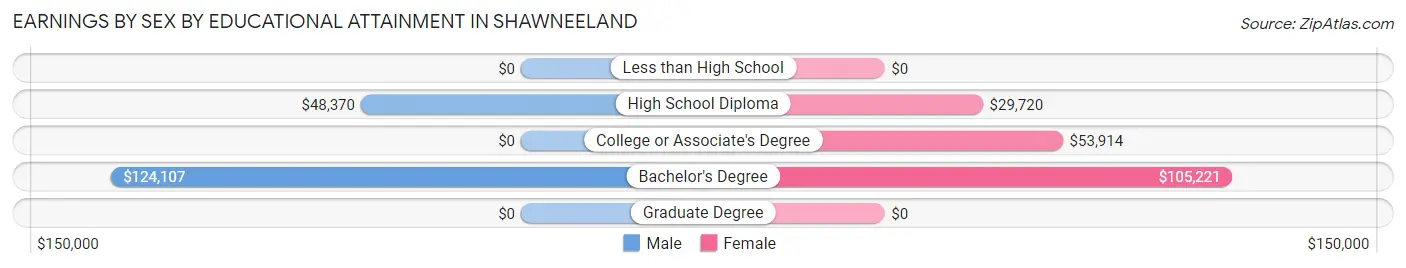
Earnings by Sex by Educational Attainment in Shawneeland
Average earnings in Shawneeland are $60,978 for men and $53,684 for women, a difference of 12.0%. Men with an educational attainment of bachelor's degree enjoy the highest average annual earnings of $124,107, while those with high school diploma education earn the least with $48,370. Women with an educational attainment of bachelor's degree earn the most with the average annual earnings of $105,221, while those with high school diploma education have the smallest earnings of $29,720.
| Educational Attainment | Male Income | Female Income |
| Less than High School | - | - |
| High School Diploma | $48,370 | $29,720 |
| College or Associate's Degree | - | - |
| Bachelor's Degree | $124,107 | $105,221 |
| Graduate Degree | - | - |
| Total | $60,978 | $53,684 |
Family Income in Shawneeland
Family Income Brackets in Shawneeland
According to the Shawneeland family income data, there are 119 families falling into the $100,000 to $149,999 income range, which is the most common income bracket and makes up 21.4% of all families.
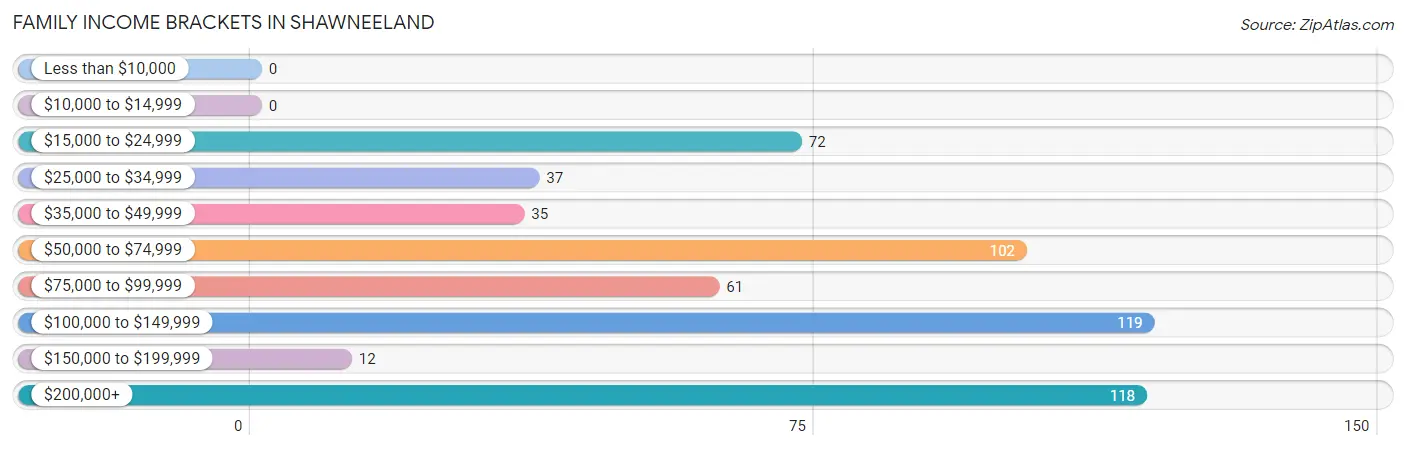
| Income Bracket | # Families | % Families |
| Less than $10,000 | 0 | 0.0% |
| $10,000 to $14,999 | 0 | 0.0% |
| $15,000 to $24,999 | 72 | 12.9% |
| $25,000 to $34,999 | 37 | 6.7% |
| $35,000 to $49,999 | 35 | 6.3% |
| $50,000 to $74,999 | 102 | 18.3% |
| $75,000 to $99,999 | 61 | 11.0% |
| $100,000 to $149,999 | 119 | 21.4% |
| $150,000 to $199,999 | 12 | 2.2% |
| $200,000+ | 118 | 21.2% |
Family Income by Famaliy Size in Shawneeland
4-person families (109 | 19.6%) account for the highest median family income in Shawneeland with $208,054 per family, while 4-person families (109 | 19.6%) have the highest median income of $52,014 per family member.
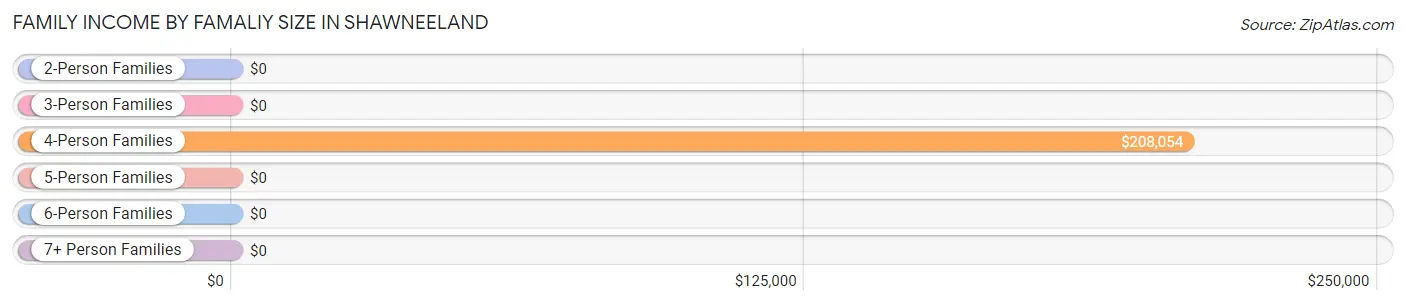
| Income Bracket | # Families | Median Income |
| 2-Person Families | 245 (44.1%) | $0 |
| 3-Person Families | 101 (18.2%) | $0 |
| 4-Person Families | 109 (19.6%) | $208,054 |
| 5-Person Families | 59 (10.6%) | $0 |
| 6-Person Families | 42 (7.5%) | $0 |
| 7+ Person Families | 0 (0.0%) | $0 |
| Total | 556 (100.0%) | $96,136 |
Family Income by Number of Earners in Shawneeland
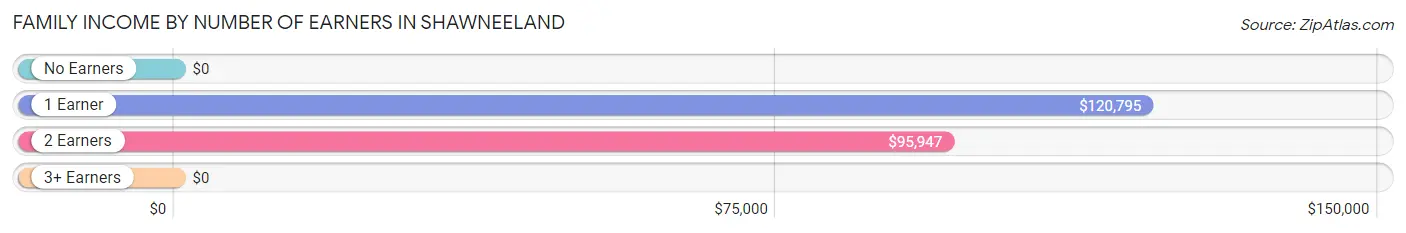
| Number of Earners | # Families | Median Income |
| No Earners | 89 (16.0%) | $0 |
| 1 Earner | 311 (55.9%) | $120,795 |
| 2 Earners | 125 (22.5%) | $95,947 |
| 3+ Earners | 31 (5.6%) | $0 |
| Total | 556 (100.0%) | $96,136 |
Household Income in Shawneeland
Household Income Brackets in Shawneeland
With 203 households falling in the category, the $100,000 to $149,999 income range is the most frequent in Shawneeland, accounting for 22.6% of all households.
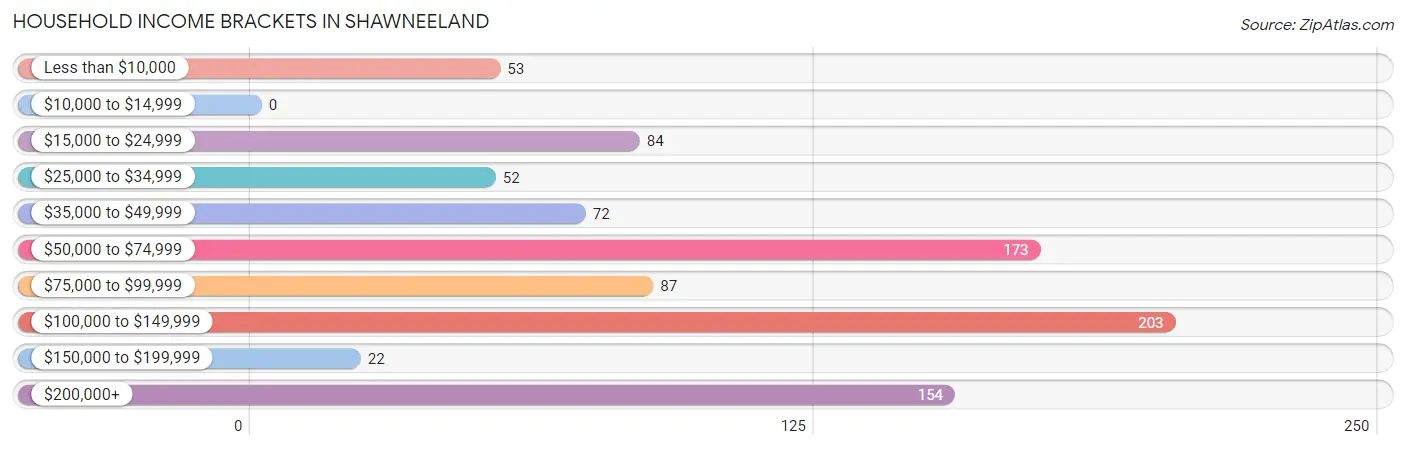
| Income Bracket | # Households | % Households |
| Less than $10,000 | 53 | 5.9% |
| $10,000 to $14,999 | 0 | 0.0% |
| $15,000 to $24,999 | 84 | 9.3% |
| $25,000 to $34,999 | 52 | 5.8% |
| $35,000 to $49,999 | 72 | 8.0% |
| $50,000 to $74,999 | 173 | 19.2% |
| $75,000 to $99,999 | 87 | 9.7% |
| $100,000 to $149,999 | 203 | 22.6% |
| $150,000 to $199,999 | 22 | 2.4% |
| $200,000+ | 154 | 17.1% |
Household Income by Householder Age in Shawneeland
The median household income in Shawneeland is $79,583, with the highest median household income of $137,522 found in the 25 to 44 years age bracket for the primary householder. A total of 427 households (47.4%) fall into this category. Meanwhile, the 15 to 24 years age bracket for the primary householder has the lowest median household income of $0, with 57 households (6.3%) in this group.
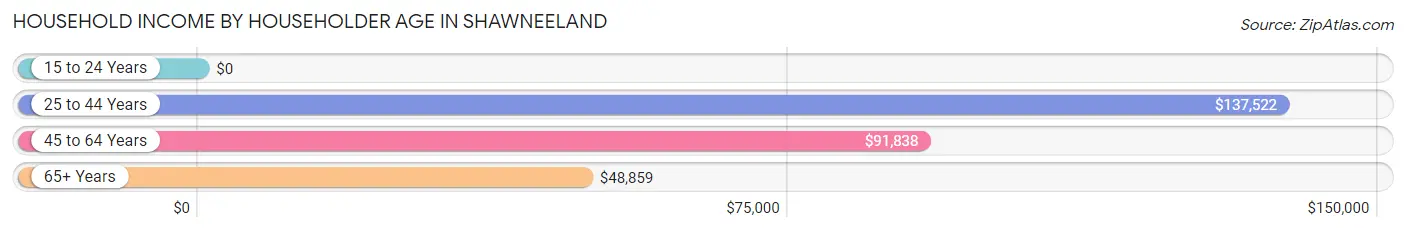
| Income Bracket | # Households | Median Income |
| 15 to 24 Years | 57 (6.3%) | $0 |
| 25 to 44 Years | 427 (47.4%) | $137,522 |
| 45 to 64 Years | 227 (25.2%) | $91,838 |
| 65+ Years | 189 (21.0%) | $48,859 |
| Total | 900 (100.0%) | $79,583 |
Poverty in Shawneeland
Income Below Poverty by Sex and Age in Shawneeland
With 10.3% poverty level for males and 0.5% for females among the residents of Shawneeland, 16 and 17 year old males and 65 to 74 year old females are the most vulnerable to poverty, with 25 males (56.8%) and 6 females (19.4%) in their respective age groups living below the poverty level.
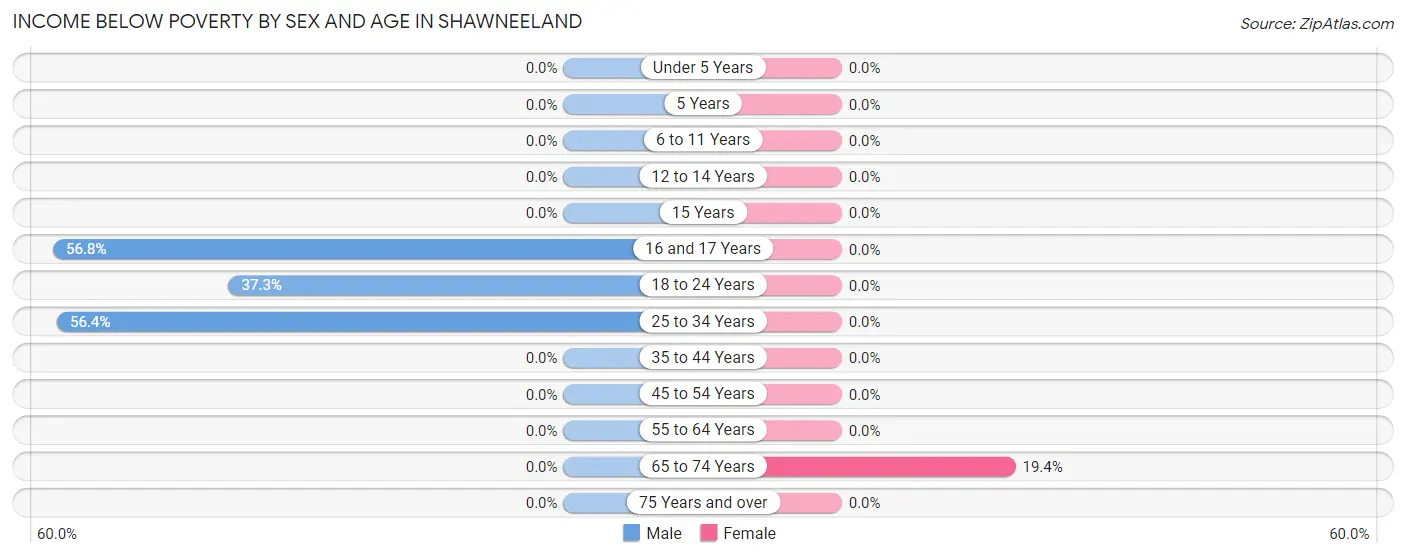
| Age Bracket | Male | Female |
| Under 5 Years | 0 (0.0%) | 0 (0.0%) |
| 5 Years | 0 (0.0%) | 0 (0.0%) |
| 6 to 11 Years | 0 (0.0%) | 0 (0.0%) |
| 12 to 14 Years | 0 (0.0%) | 0 (0.0%) |
| 15 Years | 0 (0.0%) | 0 (0.0%) |
| 16 and 17 Years | 25 (56.8%) | 0 (0.0%) |
| 18 to 24 Years | 41 (37.3%) | 0 (0.0%) |
| 25 to 34 Years | 53 (56.4%) | 0 (0.0%) |
| 35 to 44 Years | 0 (0.0%) | 0 (0.0%) |
| 45 to 54 Years | 0 (0.0%) | 0 (0.0%) |
| 55 to 64 Years | 0 (0.0%) | 0 (0.0%) |
| 65 to 74 Years | 0 (0.0%) | 6 (19.4%) |
| 75 Years and over | 0 (0.0%) | 0 (0.0%) |
| Total | 119 (10.3%) | 6 (0.5%) |
Income Above Poverty by Sex and Age in Shawneeland
According to the poverty statistics in Shawneeland, males aged under 5 years and females aged under 5 years are the age groups that are most secure financially, with 100.0% of males and 100.0% of females in these age groups living above the poverty line.
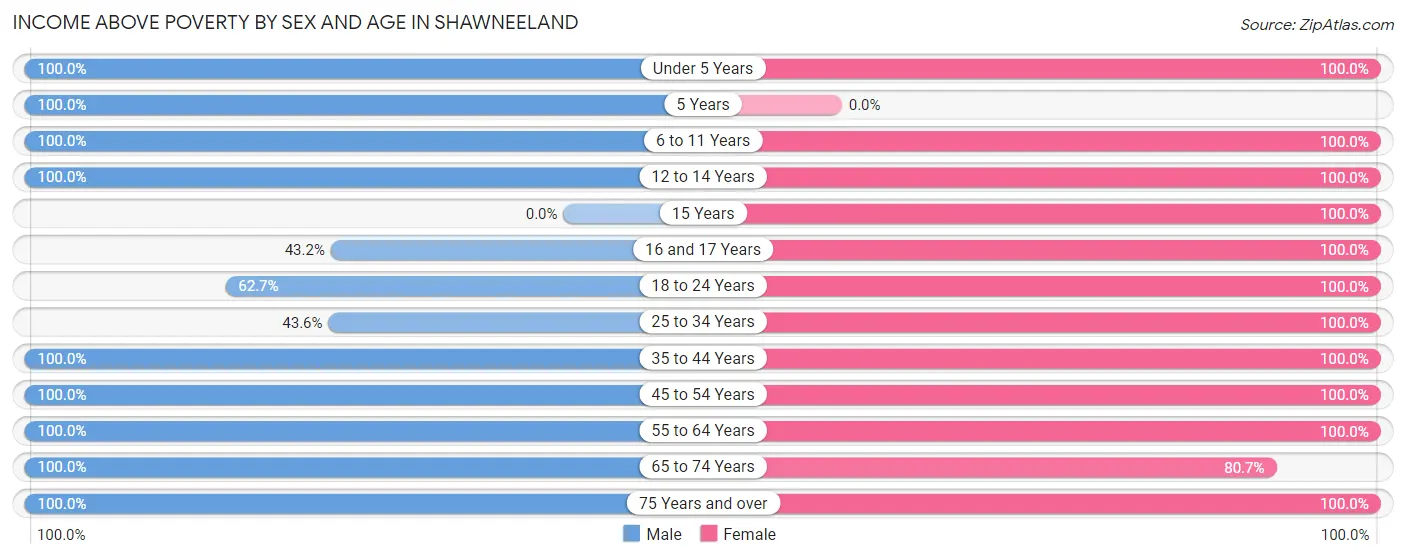
| Age Bracket | Male | Female |
| Under 5 Years | 67 (100.0%) | 139 (100.0%) |
| 5 Years | 60 (100.0%) | 0 (0.0%) |
| 6 to 11 Years | 30 (100.0%) | 94 (100.0%) |
| 12 to 14 Years | 76 (100.0%) | 105 (100.0%) |
| 15 Years | 0 (0.0%) | 14 (100.0%) |
| 16 and 17 Years | 19 (43.2%) | 28 (100.0%) |
| 18 to 24 Years | 69 (62.7%) | 109 (100.0%) |
| 25 to 34 Years | 41 (43.6%) | 109 (100.0%) |
| 35 to 44 Years | 232 (100.0%) | 241 (100.0%) |
| 45 to 54 Years | 187 (100.0%) | 82 (100.0%) |
| 55 to 64 Years | 109 (100.0%) | 168 (100.0%) |
| 65 to 74 Years | 68 (100.0%) | 25 (80.6%) |
| 75 Years and over | 83 (100.0%) | 67 (100.0%) |
| Total | 1,041 (89.7%) | 1,181 (99.5%) |
Income Below Poverty Among Married-Couple Families in Shawneeland
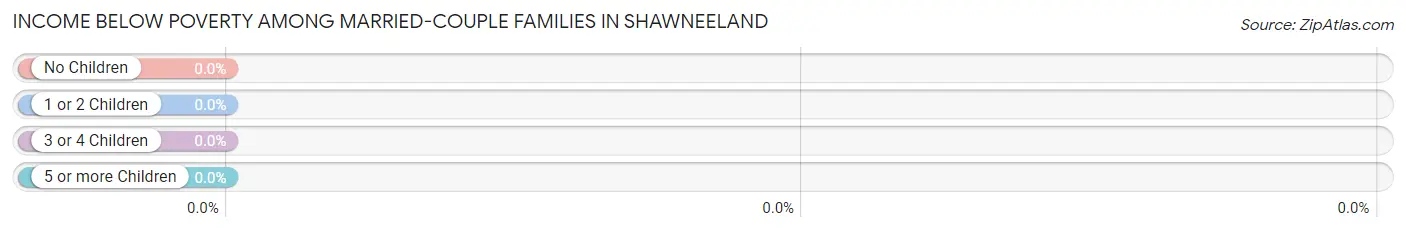
| Children | Above Poverty | Below Poverty |
| No Children | 152 (100.0%) | 0 (0.0%) |
| 1 or 2 Children | 145 (100.0%) | 0 (0.0%) |
| 3 or 4 Children | 101 (100.0%) | 0 (0.0%) |
| 5 or more Children | 0 (0.0%) | 0 (0.0%) |
| Total | 398 (100.0%) | 0 (0.0%) |
Income Below Poverty Among Single-Parent Households in Shawneeland
| Children | Single Father | Single Mother |
| No Children | 0 (0.0%) | 0 (0.0%) |
| 1 or 2 Children | 0 (0.0%) | 0 (0.0%) |
| 3 or 4 Children | 0 (0.0%) | 0 (0.0%) |
| 5 or more Children | 0 (0.0%) | 0 (0.0%) |
| Total | 0 (0.0%) | 0 (0.0%) |
Income Below Poverty Among Married-Couple vs Single-Parent Households in Shawneeland
| Children | Married-Couple Families | Single-Parent Households |
| No Children | 0 (0.0%) | 0 (0.0%) |
| 1 or 2 Children | 0 (0.0%) | 0 (0.0%) |
| 3 or 4 Children | 0 (0.0%) | 0 (0.0%) |
| 5 or more Children | 0 (0.0%) | 0 (0.0%) |
| Total | 0 (0.0%) | 0 (0.0%) |
Race in Shawneeland
The most populous races in Shawneeland are White / Caucasian (2,206 | 94.0%), Two or more Races (107 | 4.6%), and Asian (21 | 0.9%).
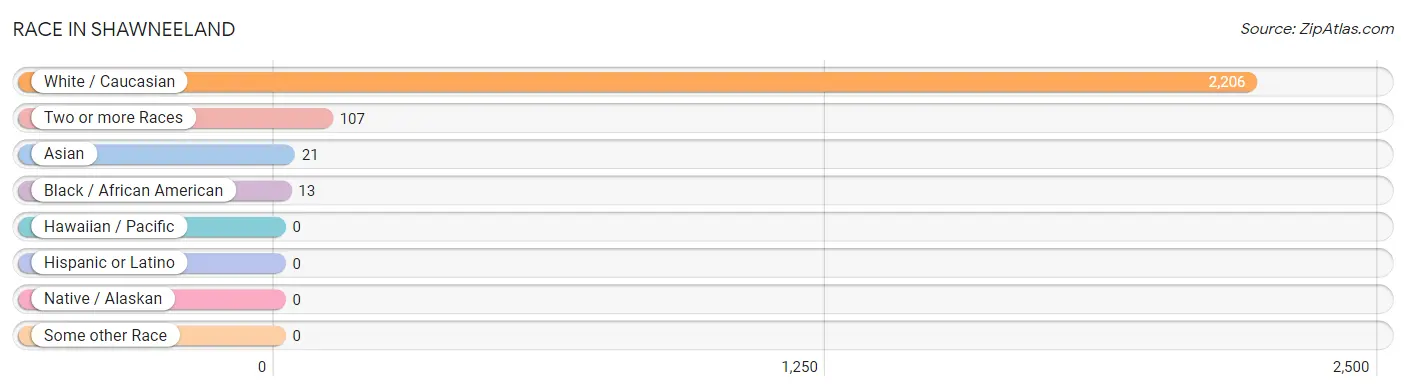
| Race | # Population | % Population |
| Asian | 21 | 0.9% |
| Black / African American | 13 | 0.5% |
| Hawaiian / Pacific | 0 | 0.0% |
| Hispanic or Latino | 0 | 0.0% |
| Native / Alaskan | 0 | 0.0% |
| White / Caucasian | 2,206 | 94.0% |
| Two or more Races | 107 | 4.6% |
| Some other Race | 0 | 0.0% |
| Total | 2,347 | 100.0% |
Ancestry in Shawneeland
The most populous ancestries reported in Shawneeland are German (759 | 32.3%), Irish (552 | 23.5%), Italian (275 | 11.7%), English (197 | 8.4%), and American (108 | 4.6%), together accounting for 80.6% of all Shawneeland residents.
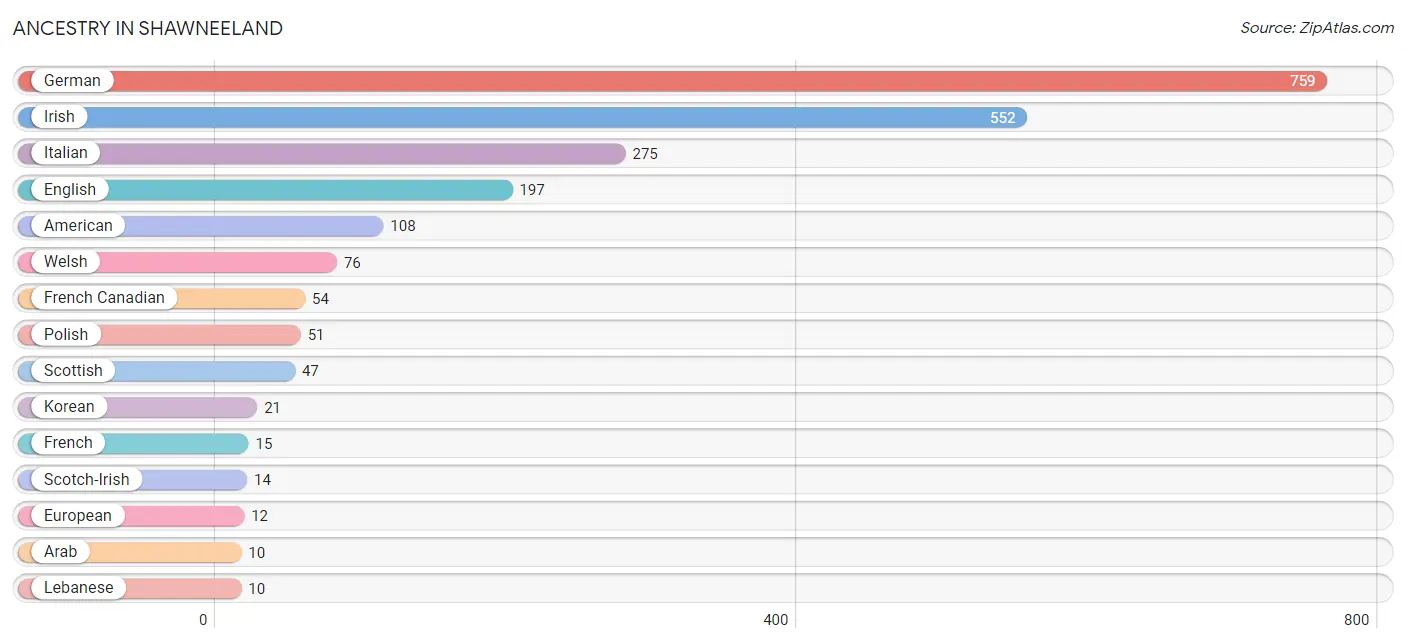
| Ancestry | # Population | % Population |
| American | 108 | 4.6% |
| Arab | 10 | 0.4% |
| English | 197 | 8.4% |
| European | 12 | 0.5% |
| French | 15 | 0.6% |
| French Canadian | 54 | 2.3% |
| German | 759 | 32.3% |
| Irish | 552 | 23.5% |
| Italian | 275 | 11.7% |
| Korean | 21 | 0.9% |
| Lebanese | 10 | 0.4% |
| Polish | 51 | 2.2% |
| Scotch-Irish | 14 | 0.6% |
| Scottish | 47 | 2.0% |
| Welsh | 76 | 3.2% | View All 15 Rows |
Immigrants in Shawneeland
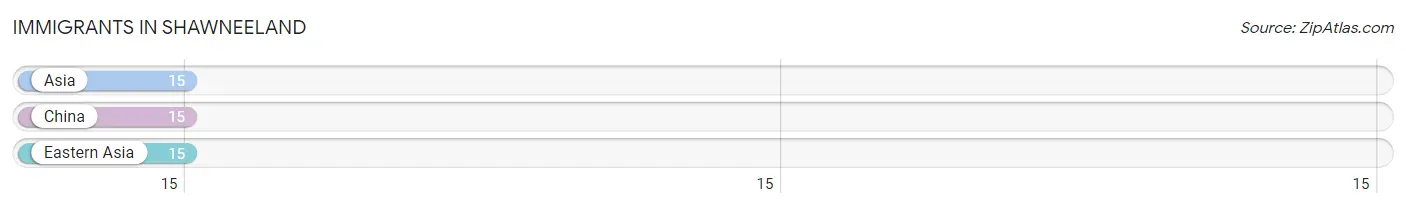
The most numerous immigrant groups reported in Shawneeland came from Asia (15 | 0.6%), China (15 | 0.6%), and Eastern Asia (15 | 0.6%), together accounting for 1.9% of all Shawneeland residents.
| Immigration Origin | # Population | % Population |
| Asia | 15 | 0.6% |
| China | 15 | 0.6% |
| Eastern Asia | 15 | 0.6% | View All 3 Rows |
Sex and Age in Shawneeland
Sex and Age in Shawneeland
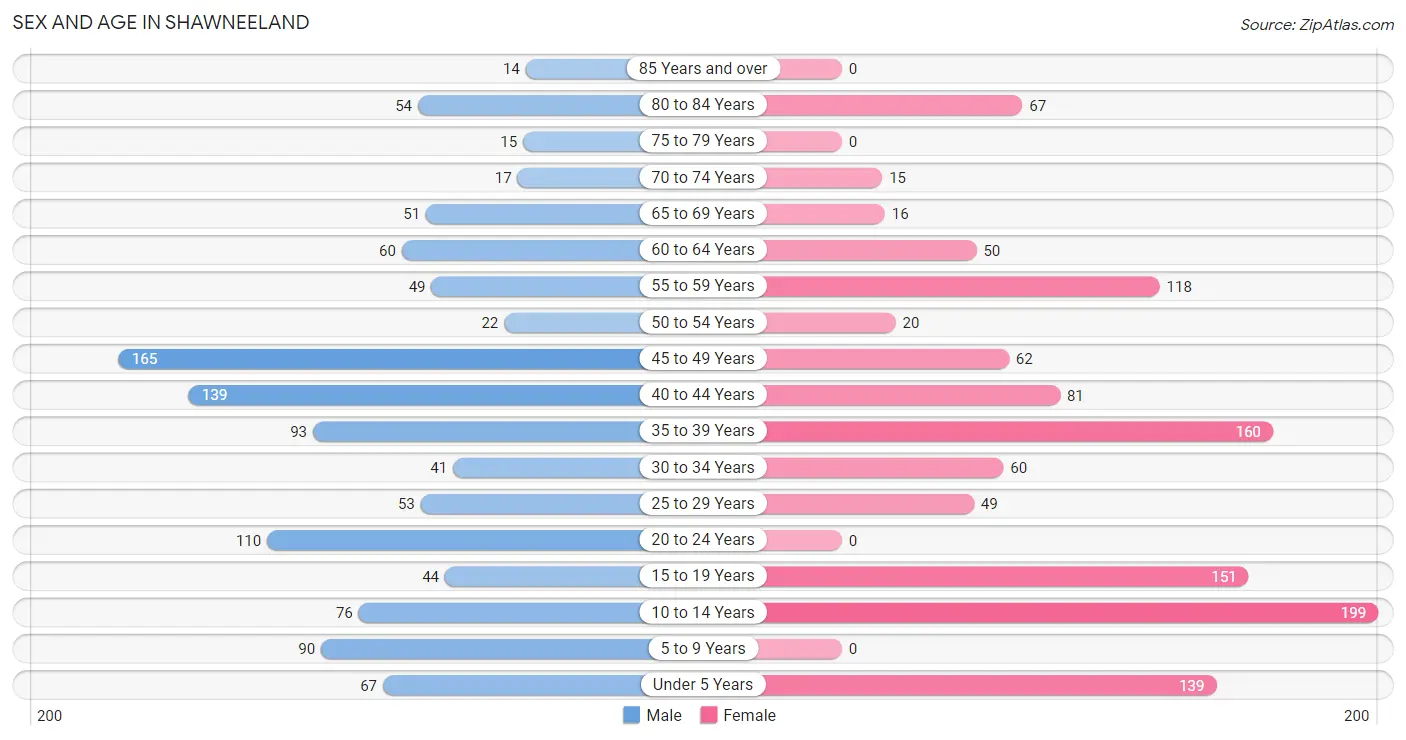
The most populous age groups in Shawneeland are 45 to 49 Years (165 | 14.2%) for men and 10 to 14 Years (199 | 16.8%) for women.
| Age Bracket | Male | Female |
| Under 5 Years | 67 (5.8%) | 139 (11.7%) |
| 5 to 9 Years | 90 (7.8%) | 0 (0.0%) |
| 10 to 14 Years | 76 (6.6%) | 199 (16.8%) |
| 15 to 19 Years | 44 (3.8%) | 151 (12.7%) |
| 20 to 24 Years | 110 (9.5%) | 0 (0.0%) |
| 25 to 29 Years | 53 (4.6%) | 49 (4.1%) |
| 30 to 34 Years | 41 (3.5%) | 60 (5.1%) |
| 35 to 39 Years | 93 (8.0%) | 160 (13.5%) |
| 40 to 44 Years | 139 (12.0%) | 81 (6.8%) |
| 45 to 49 Years | 165 (14.2%) | 62 (5.2%) |
| 50 to 54 Years | 22 (1.9%) | 20 (1.7%) |
| 55 to 59 Years | 49 (4.2%) | 118 (9.9%) |
| 60 to 64 Years | 60 (5.2%) | 50 (4.2%) |
| 65 to 69 Years | 51 (4.4%) | 16 (1.3%) |
| 70 to 74 Years | 17 (1.5%) | 15 (1.3%) |
| 75 to 79 Years | 15 (1.3%) | 0 (0.0%) |
| 80 to 84 Years | 54 (4.7%) | 67 (5.6%) |
| 85 Years and over | 14 (1.2%) | 0 (0.0%) |
| Total | 1,160 (100.0%) | 1,187 (100.0%) |
Families and Households in Shawneeland
Median Family Size in Shawneeland
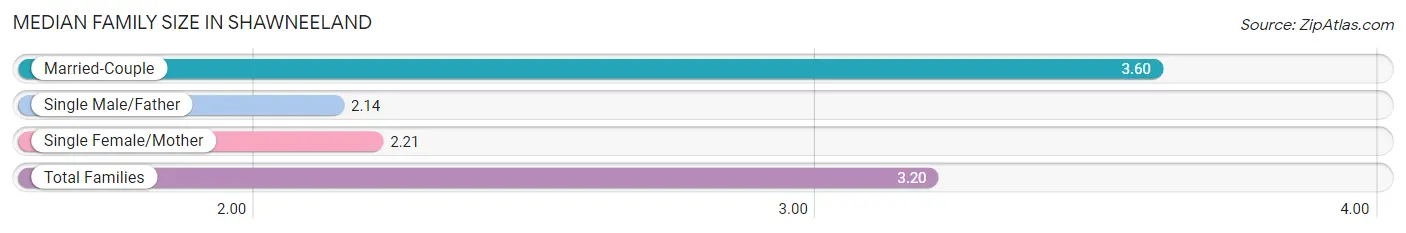
The median family size in Shawneeland is 3.20 persons per family, with married-couple families (398 | 71.6%) accounting for the largest median family size of 3.6 persons per family. On the other hand, single male/father families (73 | 13.1%) represent the smallest median family size with 2.14 persons per family.
| Family Type | # Families | Family Size |
| Married-Couple | 398 (71.6%) | 3.60 |
| Single Male/Father | 73 (13.1%) | 2.14 |
| Single Female/Mother | 85 (15.3%) | 2.21 |
| Total Families | 556 (100.0%) | 3.20 |
Median Household Size in Shawneeland
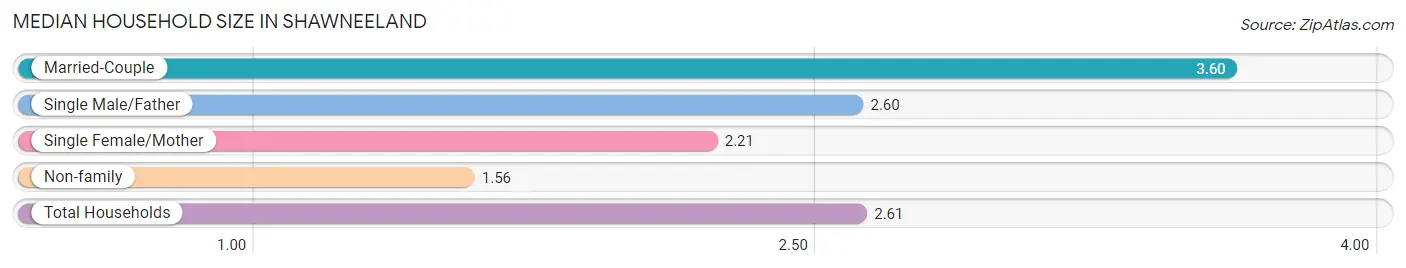
The median household size in Shawneeland is 2.61 persons per household, with married-couple households (398 | 44.2%) accounting for the largest median household size of 3.6 persons per household. non-family households (344 | 38.2%) represent the smallest median household size with 1.56 persons per household.
| Household Type | # Households | Household Size |
| Married-Couple | 398 (44.2%) | 3.60 |
| Single Male/Father | 73 (8.1%) | 2.60 |
| Single Female/Mother | 85 (9.4%) | 2.21 |
| Non-family | 344 (38.2%) | 1.56 |
| Total Households | 900 (100.0%) | 2.61 |
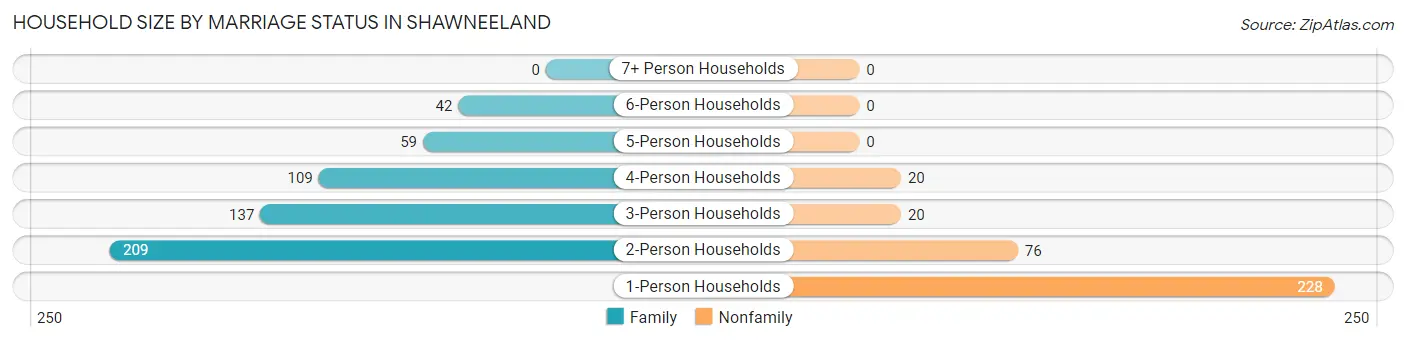
Household Size by Marriage Status in Shawneeland
Out of a total of 900 households in Shawneeland, 556 (61.8%) are family households, while 344 (38.2%) are nonfamily households. The most numerous type of family households are 2-person households, comprising 209, and the most common type of nonfamily households are 1-person households, comprising 228.
| Household Size | Family Households | Nonfamily Households |
| 1-Person Households | - | 228 (25.3%) |
| 2-Person Households | 209 (23.2%) | 76 (8.4%) |
| 3-Person Households | 137 (15.2%) | 20 (2.2%) |
| 4-Person Households | 109 (12.1%) | 20 (2.2%) |
| 5-Person Households | 59 (6.6%) | 0 (0.0%) |
| 6-Person Households | 42 (4.7%) | 0 (0.0%) |
| 7+ Person Households | 0 (0.0%) | 0 (0.0%) |
| Total | 556 (61.8%) | 344 (38.2%) |
Female Fertility in Shawneeland
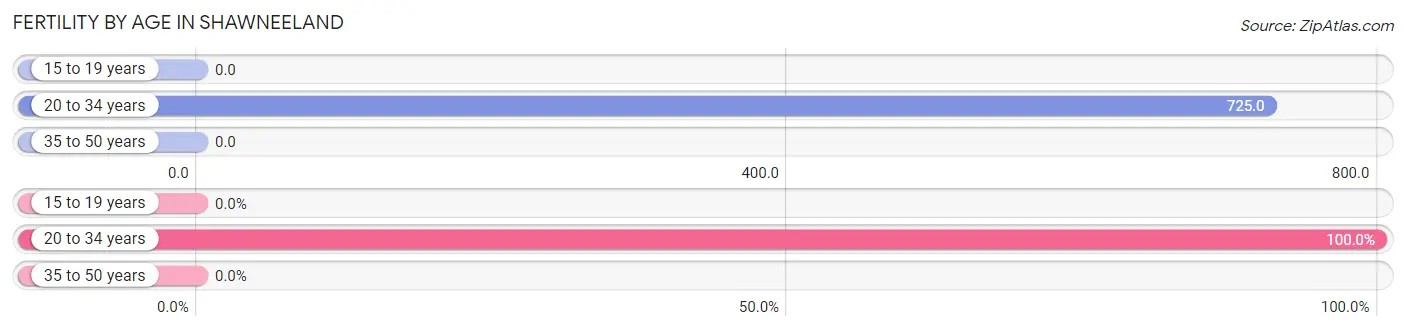
Fertility by Age in Shawneeland
Average fertility rate in Shawneeland is 140.0 births per 1,000 women. Women in the age bracket of 20 to 34 years have the highest fertility rate with 725.0 births per 1,000 women. Women in the age bracket of 20 to 34 years acount for 100.0% of all women with births.
| Age Bracket | Women with Births | Births / 1,000 Women |
| 15 to 19 years | 0 (0.0%) | 0.0 |
| 20 to 34 years | 79 (100.0%) | 725.0 |
| 35 to 50 years | 0 (0.0%) | 0.0 |
| Total | 79 (100.0%) | 140.0 |
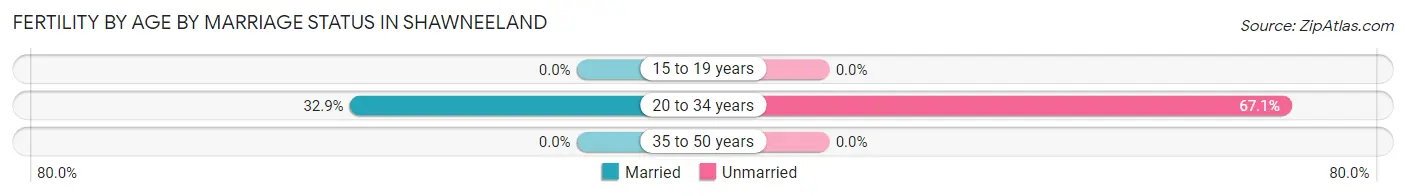
Fertility by Age by Marriage Status in Shawneeland
32.9% of women with births (79) in Shawneeland are married. The highest percentage of unmarried women with births falls into 20 to 34 years age bracket with 67.1% of them unmarried at the time of birth, while the lowest percentage of unmarried women with births belong to 20 to 34 years age bracket with 67.1% of them unmarried.
| Age Bracket | Married | Unmarried |
| 15 to 19 years | 0 (0.0%) | 0 (0.0%) |
| 20 to 34 years | 26 (32.9%) | 53 (67.1%) |
| 35 to 50 years | 0 (0.0%) | 0 (0.0%) |
| Total | 26 (32.9%) | 53 (67.1%) |
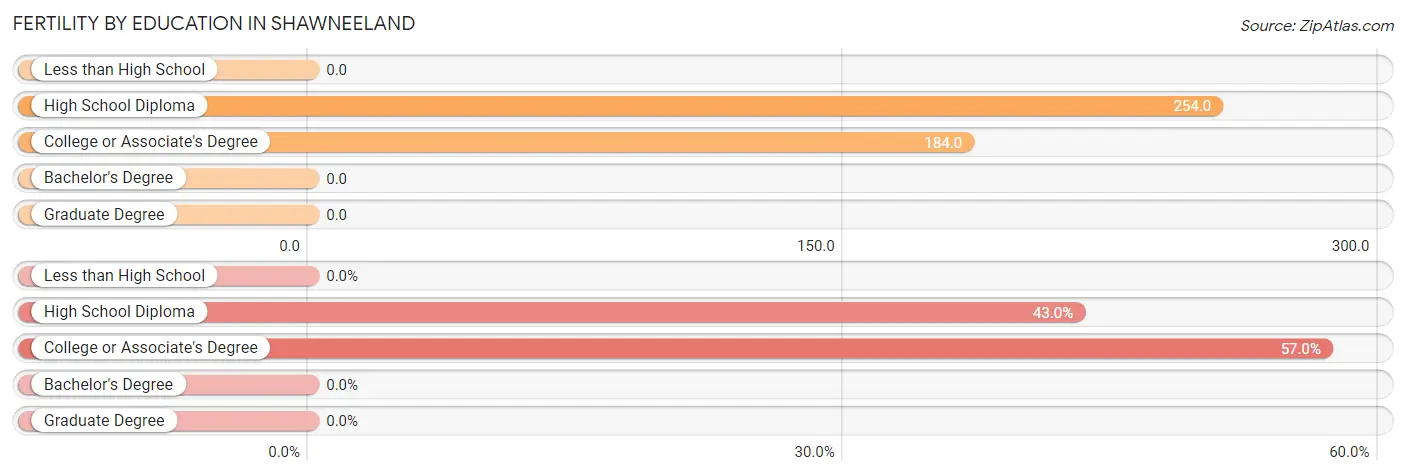
Fertility by Education in Shawneeland
| Educational Attainment | Women with Births | Births / 1,000 Women |
| Less than High School | 0 (0.0%) | 0.0 |
| High School Diploma | 34 (43.0%) | 254.0 |
| College or Associate's Degree | 45 (57.0%) | 184.0 |
| Bachelor's Degree | 0 (0.0%) | 0.0 |
| Graduate Degree | 0 (0.0%) | 0.0 |
| Total | 79 (100.0%) | 140.0 |
Fertility by Education by Marriage Status in Shawneeland
67.1% of women with births in Shawneeland are unmarried. Women with the educational attainment of college or associate's degree are most likely to be married with 57.8% of them married at childbirth, while women with the educational attainment of high school diploma are least likely to be married with 100.0% of them unmarried at childbirth.
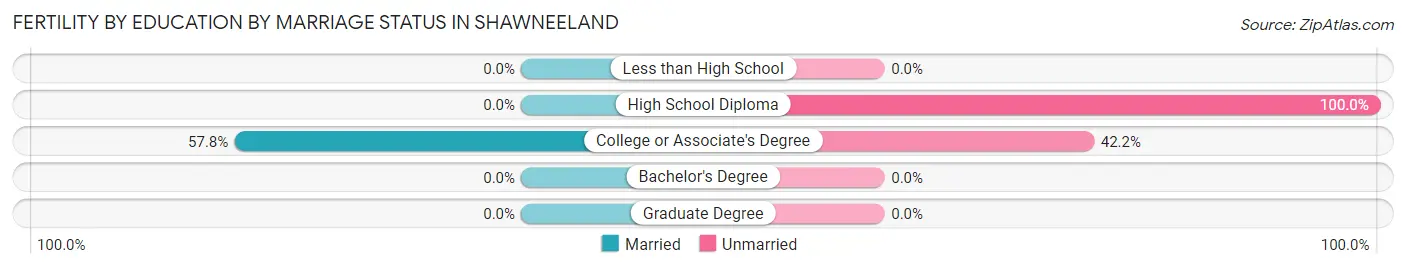
| Educational Attainment | Married | Unmarried |
| Less than High School | 0 (0.0%) | 0 (0.0%) |
| High School Diploma | 0 (0.0%) | 34 (100.0%) |
| College or Associate's Degree | 26 (57.8%) | 19 (42.2%) |
| Bachelor's Degree | 0 (0.0%) | 0 (0.0%) |
| Graduate Degree | 0 (0.0%) | 0 (0.0%) |
| Total | 26 (32.9%) | 53 (67.1%) |
Employment Characteristics in Shawneeland
Employment by Class of Employer in Shawneeland
Among the 1,095 employed individuals in Shawneeland, private company employees (874 | 79.8%), federal government employees (77 | 7.0%), and self-employed (not incorporated) (64 | 5.8%) make up the most common classes of employment.
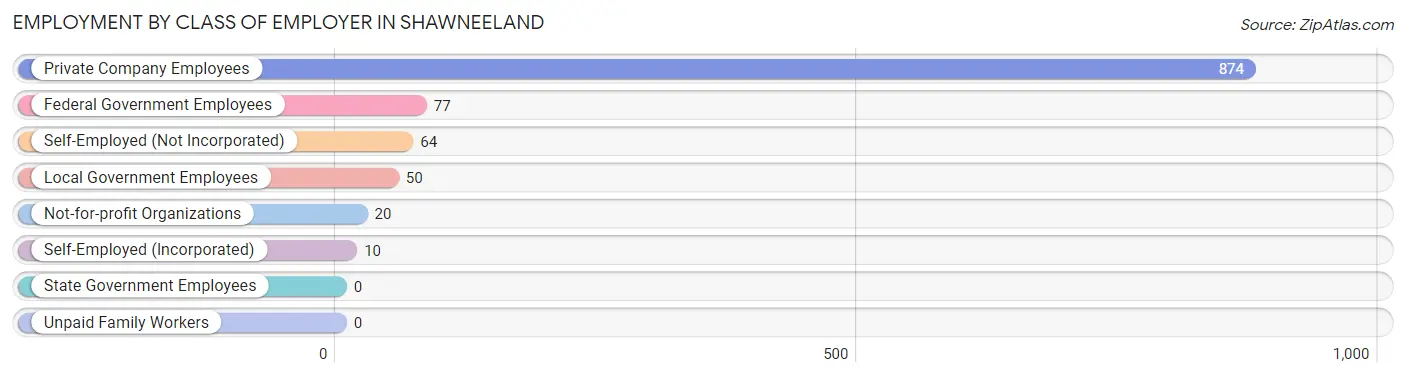
| Employer Class | # Employees | % Employees |
| Private Company Employees | 874 | 79.8% |
| Self-Employed (Incorporated) | 10 | 0.9% |
| Self-Employed (Not Incorporated) | 64 | 5.8% |
| Not-for-profit Organizations | 20 | 1.8% |
| Local Government Employees | 50 | 4.6% |
| State Government Employees | 0 | 0.0% |
| Federal Government Employees | 77 | 7.0% |
| Unpaid Family Workers | 0 | 0.0% |
| Total | 1,095 | 100.0% |
Employment Status by Age in Shawneeland
According to the labor force statistics for Shawneeland, out of the total population over 16 years of age (1,762), 67.2% or 1,184 individuals are in the labor force, with 3.5% or 41 of them unemployed. The age group with the highest labor force participation rate is 20 to 24 years, with 100.0% or 110 individuals in the labor force. Within the labor force, the 45 to 54 years age range has the highest percentage of unemployed individuals, with 12.6% or 34 of them being unemployed.
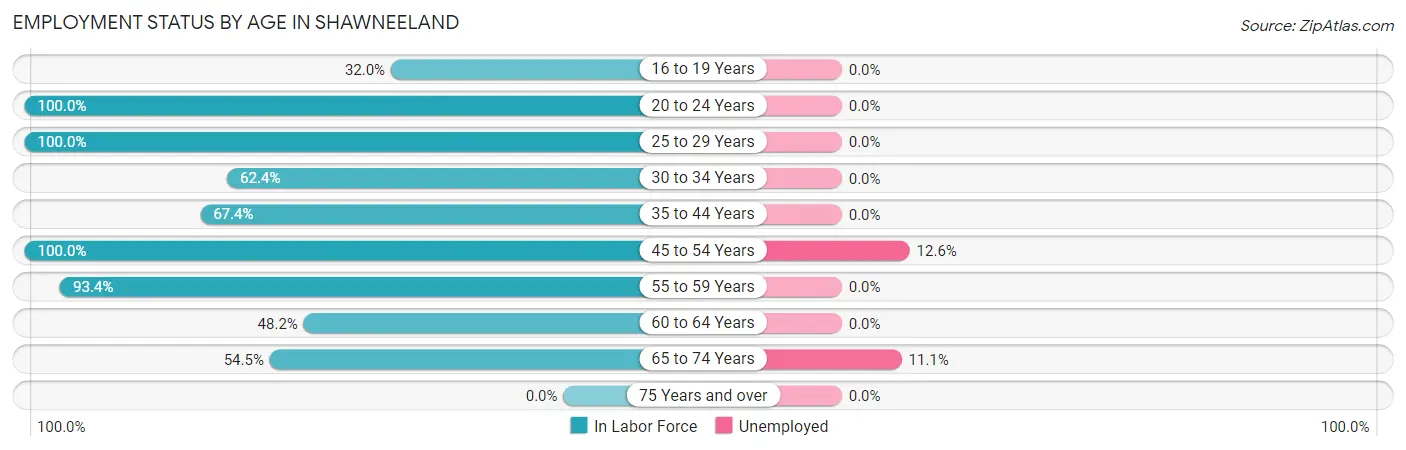
| Age Bracket | In Labor Force | Unemployed |
| 16 to 19 Years | 58 (32.0%) | 0 (0.0%) |
| 20 to 24 Years | 110 (100.0%) | 0 (0.0%) |
| 25 to 29 Years | 102 (100.0%) | 0 (0.0%) |
| 30 to 34 Years | 63 (62.4%) | 0 (0.0%) |
| 35 to 44 Years | 319 (67.4%) | 0 (0.0%) |
| 45 to 54 Years | 269 (100.0%) | 34 (12.6%) |
| 55 to 59 Years | 156 (93.4%) | 0 (0.0%) |
| 60 to 64 Years | 53 (48.2%) | 0 (0.0%) |
| 65 to 74 Years | 54 (54.5%) | 6 (11.1%) |
| 75 Years and over | 0 (0.0%) | 0 (0.0%) |
| Total | 1,184 (67.2%) | 41 (3.5%) |
Employment Status by Educational Attainment in Shawneeland
According to labor force statistics for Shawneeland, 78.7% of individuals (962) out of the total population between 25 and 64 years of age (1,222) are in the labor force, with 3.5% or 34 of them being unemployed. The group with the highest labor force participation rate are those with the educational attainment of less than high school, with 100.0% or 113 individuals in the labor force. Within the labor force, individuals with college / associate degree education have the highest percentage of unemployment, with 8.7% or 34 of them being unemployed.
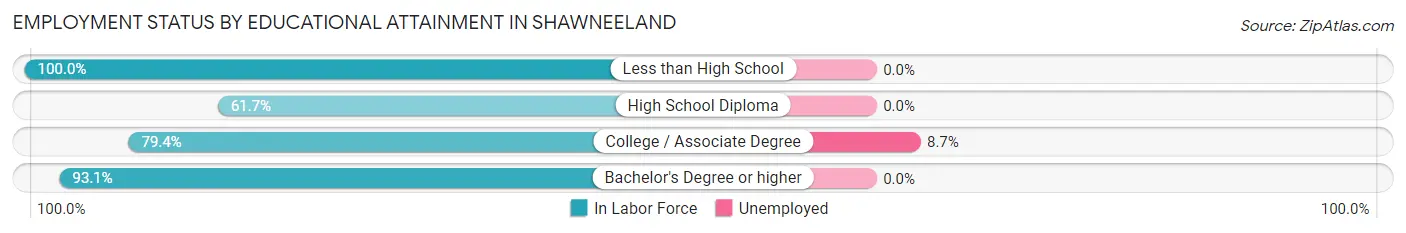
| Educational Attainment | In Labor Force | Unemployed |
| Less than High School | 113 (100.0%) | 0 (0.0%) |
| High School Diploma | 227 (61.7%) | 0 (0.0%) |
| College / Associate Degree | 392 (79.4%) | 43 (8.7%) |
| Bachelor's Degree or higher | 230 (93.1%) | 0 (0.0%) |
| Total | 962 (78.7%) | 43 (3.5%) |
Employment Occupations by Sex in Shawneeland
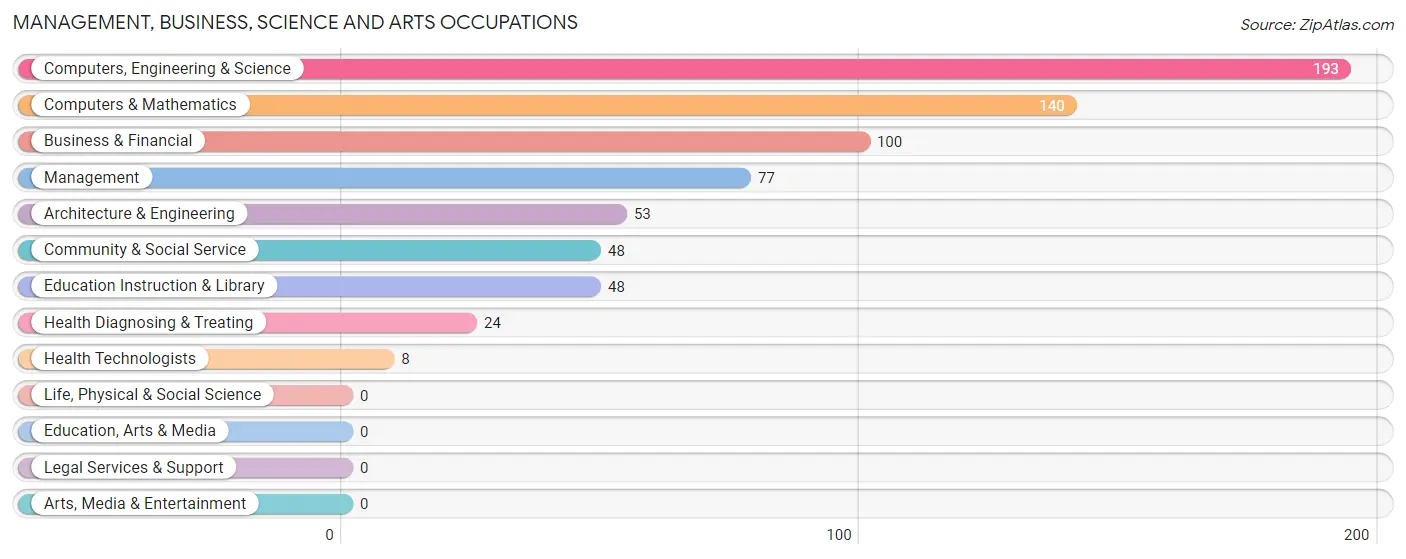
Management, Business, Science and Arts Occupations
The most common Management, Business, Science and Arts occupations in Shawneeland are Computers, Engineering & Science (193 | 17.5%), Computers & Mathematics (140 | 12.7%), Business & Financial (100 | 9.1%), Management (77 | 7.0%), and Architecture & Engineering (53 | 4.8%).
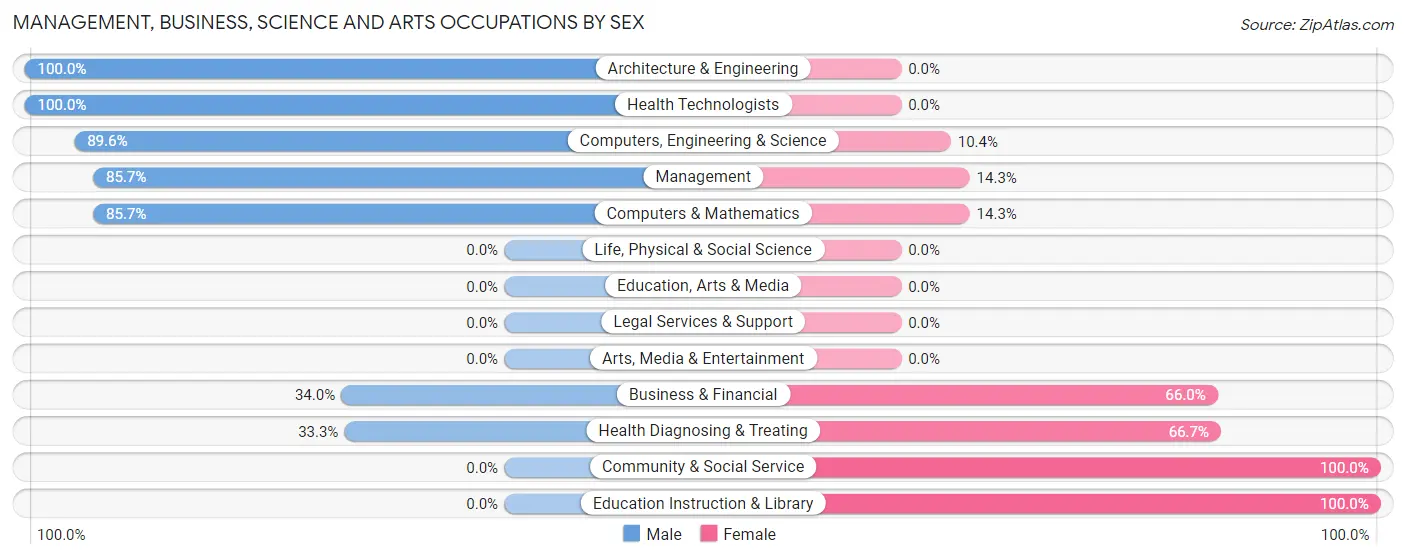
Management, Business, Science and Arts Occupations by Sex
Within the Management, Business, Science and Arts occupations in Shawneeland, the most male-oriented occupations are Architecture & Engineering (100.0%), Health Technologists (100.0%), and Computers, Engineering & Science (89.6%), while the most female-oriented occupations are Community & Social Service (100.0%), Education Instruction & Library (100.0%), and Health Diagnosing & Treating (66.7%).
| Occupation | Male | Female |
| Management | 66 (85.7%) | 11 (14.3%) |
| Business & Financial | 34 (34.0%) | 66 (66.0%) |
| Computers, Engineering & Science | 173 (89.6%) | 20 (10.4%) |
| Computers & Mathematics | 120 (85.7%) | 20 (14.3%) |
| Architecture & Engineering | 53 (100.0%) | 0 (0.0%) |
| Life, Physical & Social Science | 0 (0.0%) | 0 (0.0%) |
| Community & Social Service | 0 (0.0%) | 48 (100.0%) |
| Education, Arts & Media | 0 (0.0%) | 0 (0.0%) |
| Legal Services & Support | 0 (0.0%) | 0 (0.0%) |
| Education Instruction & Library | 0 (0.0%) | 48 (100.0%) |
| Arts, Media & Entertainment | 0 (0.0%) | 0 (0.0%) |
| Health Diagnosing & Treating | 8 (33.3%) | 16 (66.7%) |
| Health Technologists | 8 (100.0%) | 0 (0.0%) |
| Total (Category) | 281 (63.6%) | 161 (36.4%) |
| Total (Overall) | 706 (64.0%) | 397 (36.0%) |
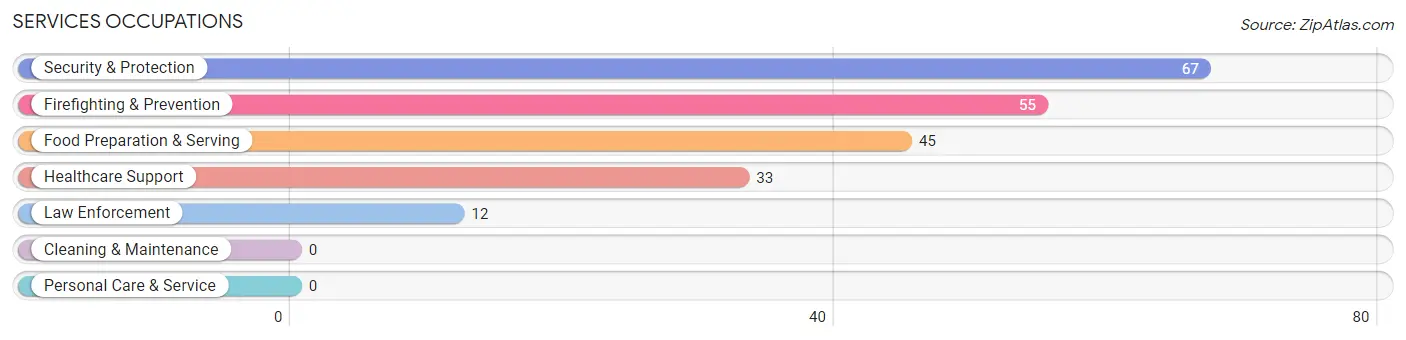
Services Occupations
The most common Services occupations in Shawneeland are Security & Protection (67 | 6.1%), Firefighting & Prevention (55 | 5.0%), Food Preparation & Serving (45 | 4.1%), Healthcare Support (33 | 3.0%), and Law Enforcement (12 | 1.1%).
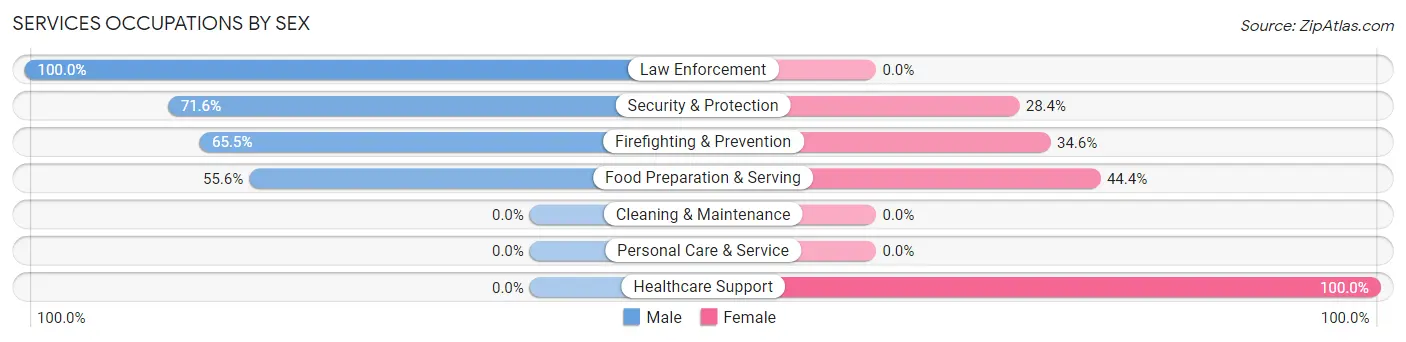
Services Occupations by Sex
Within the Services occupations in Shawneeland, the most male-oriented occupations are Law Enforcement (100.0%), Security & Protection (71.6%), and Firefighting & Prevention (65.4%), while the most female-oriented occupations are Healthcare Support (100.0%), Food Preparation & Serving (44.4%), and Firefighting & Prevention (34.5%).
| Occupation | Male | Female |
| Healthcare Support | 0 (0.0%) | 33 (100.0%) |
| Security & Protection | 48 (71.6%) | 19 (28.4%) |
| Firefighting & Prevention | 36 (65.4%) | 19 (34.5%) |
| Law Enforcement | 12 (100.0%) | 0 (0.0%) |
| Food Preparation & Serving | 25 (55.6%) | 20 (44.4%) |
| Cleaning & Maintenance | 0 (0.0%) | 0 (0.0%) |
| Personal Care & Service | 0 (0.0%) | 0 (0.0%) |
| Total (Category) | 73 (50.3%) | 72 (49.7%) |
| Total (Overall) | 706 (64.0%) | 397 (36.0%) |
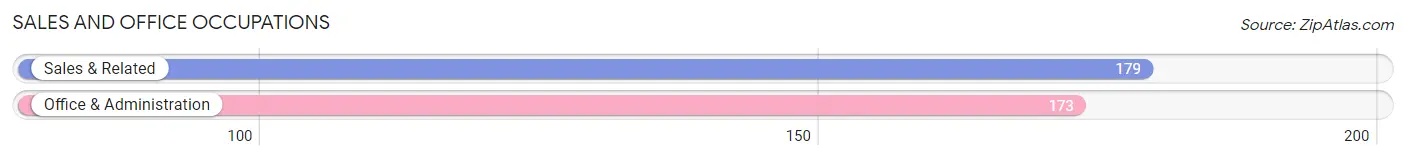
Sales and Office Occupations
The most common Sales and Office occupations in Shawneeland are Sales & Related (179 | 16.2%), and Office & Administration (173 | 15.7%).
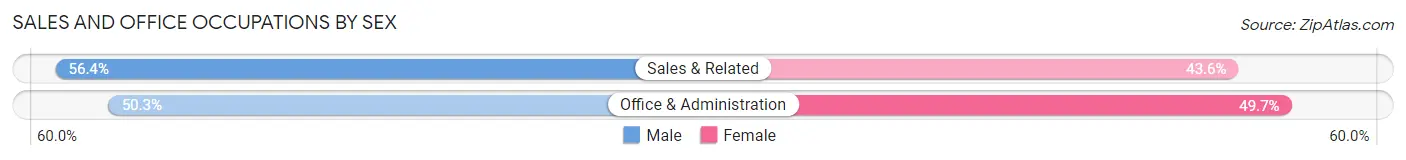
Sales and Office Occupations by Sex
| Occupation | Male | Female |
| Sales & Related | 101 (56.4%) | 78 (43.6%) |
| Office & Administration | 87 (50.3%) | 86 (49.7%) |
| Total (Category) | 188 (53.4%) | 164 (46.6%) |
| Total (Overall) | 706 (64.0%) | 397 (36.0%) |
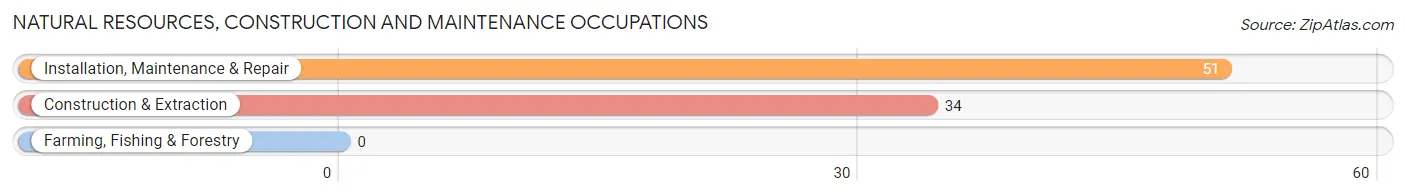
Natural Resources, Construction and Maintenance Occupations
The most common Natural Resources, Construction and Maintenance occupations in Shawneeland are Installation, Maintenance & Repair (51 | 4.6%), and Construction & Extraction (34 | 3.1%).
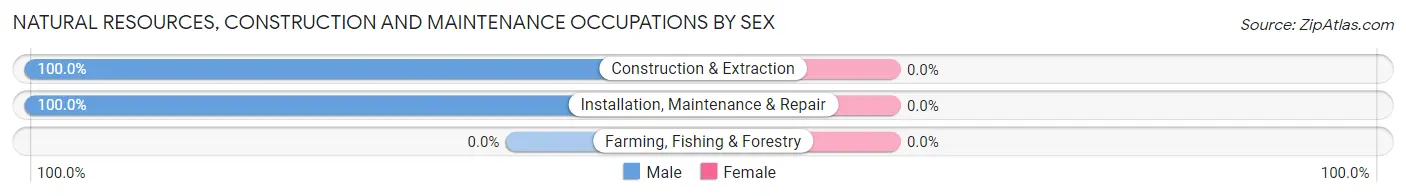
Natural Resources, Construction and Maintenance Occupations by Sex
| Occupation | Male | Female |
| Farming, Fishing & Forestry | 0 (0.0%) | 0 (0.0%) |
| Construction & Extraction | 34 (100.0%) | 0 (0.0%) |
| Installation, Maintenance & Repair | 51 (100.0%) | 0 (0.0%) |
| Total (Category) | 85 (100.0%) | 0 (0.0%) |
| Total (Overall) | 706 (64.0%) | 397 (36.0%) |
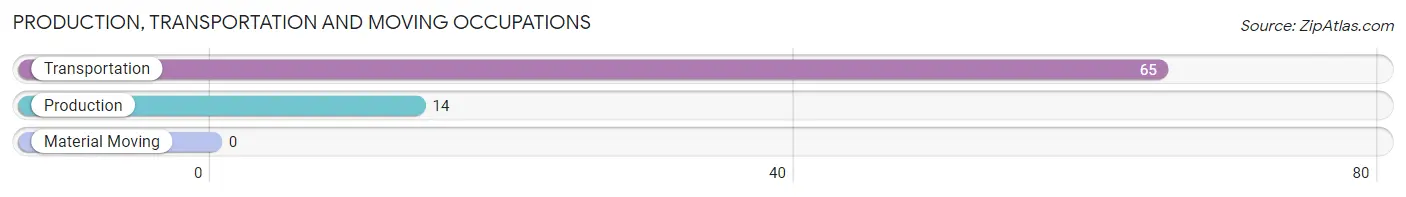
Production, Transportation and Moving Occupations
The most common Production, Transportation and Moving occupations in Shawneeland are Transportation (65 | 5.9%), and Production (14 | 1.3%).
Production, Transportation and Moving Occupations by Sex
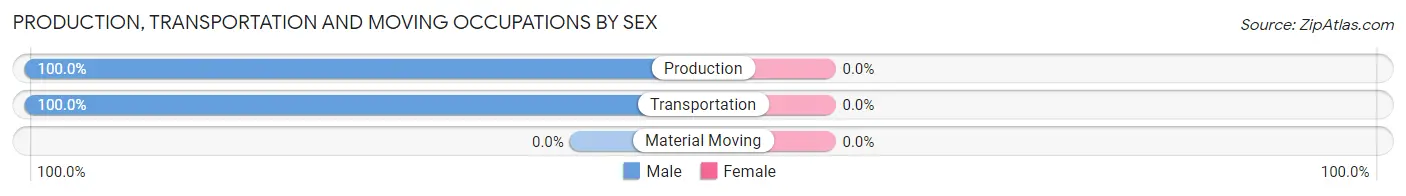
| Occupation | Male | Female |
| Production | 14 (100.0%) | 0 (0.0%) |
| Transportation | 65 (100.0%) | 0 (0.0%) |
| Material Moving | 0 (0.0%) | 0 (0.0%) |
| Total (Category) | 79 (100.0%) | 0 (0.0%) |
| Total (Overall) | 706 (64.0%) | 397 (36.0%) |
Employment Industries by Sex in Shawneeland
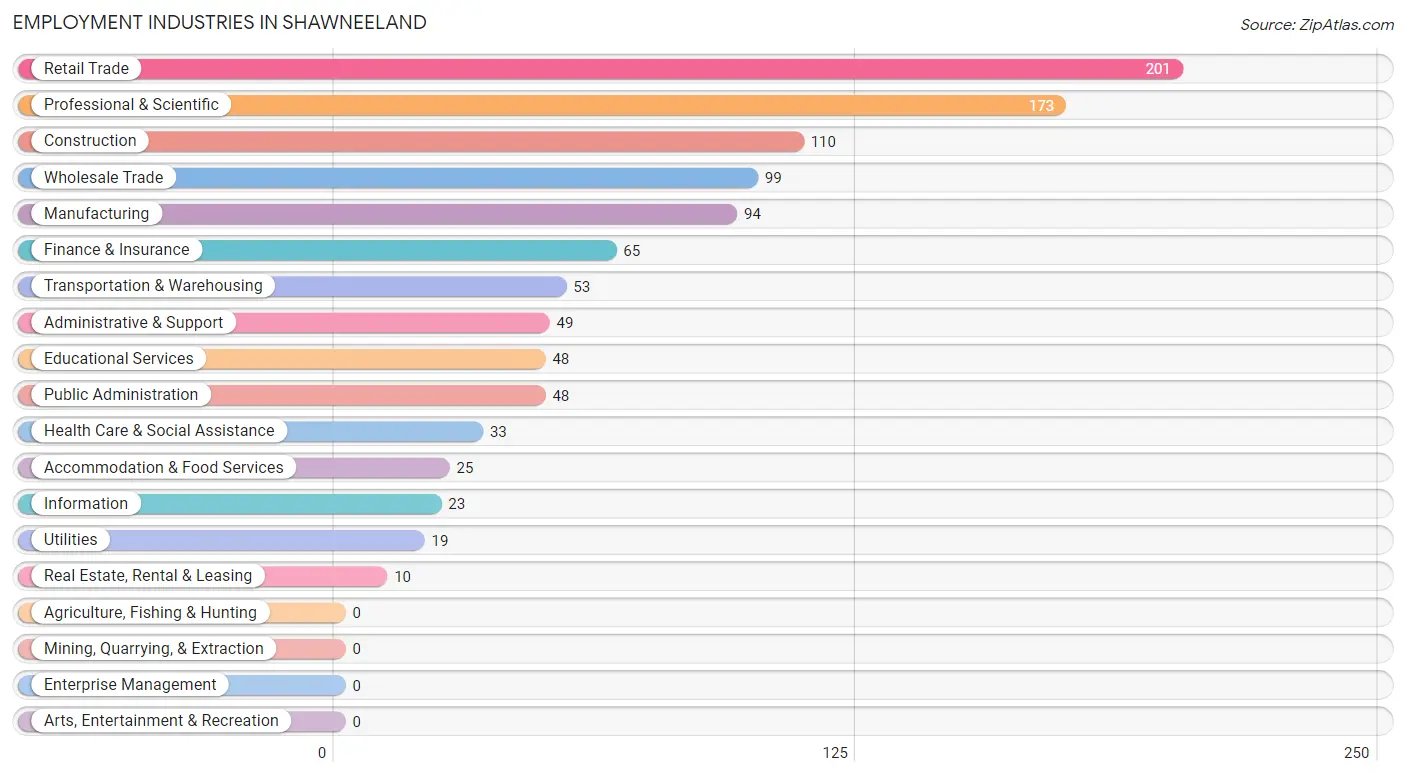
Employment Industries in Shawneeland
The major employment industries in Shawneeland include Retail Trade (201 | 18.2%), Professional & Scientific (173 | 15.7%), Construction (110 | 10.0%), Wholesale Trade (99 | 9.0%), and Manufacturing (94 | 8.5%).
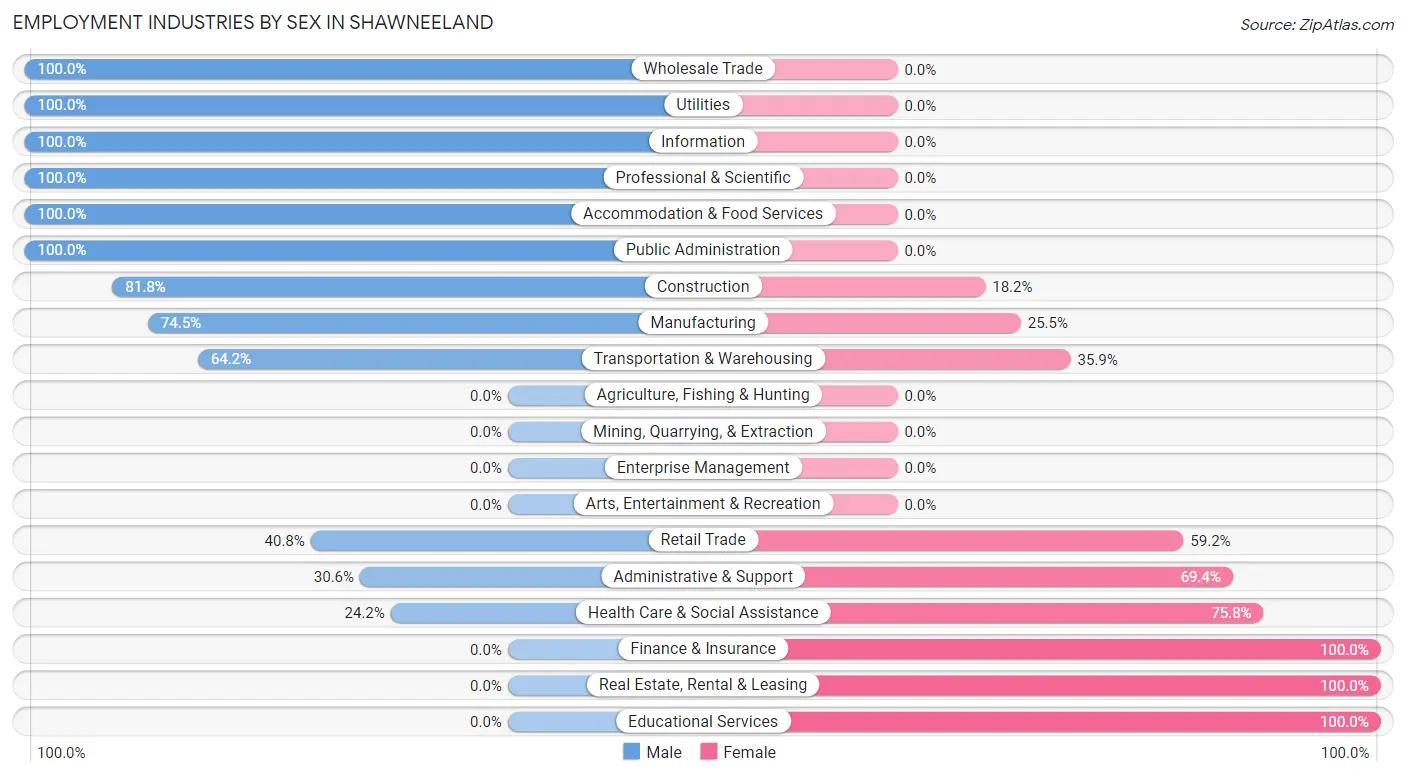
Employment Industries by Sex in Shawneeland
The Shawneeland industries that see more men than women are Wholesale Trade (100.0%), Utilities (100.0%), and Information (100.0%), whereas the industries that tend to have a higher number of women are Finance & Insurance (100.0%), Real Estate, Rental & Leasing (100.0%), and Educational Services (100.0%).
| Industry | Male | Female |
| Agriculture, Fishing & Hunting | 0 (0.0%) | 0 (0.0%) |
| Mining, Quarrying, & Extraction | 0 (0.0%) | 0 (0.0%) |
| Construction | 90 (81.8%) | 20 (18.2%) |
| Manufacturing | 70 (74.5%) | 24 (25.5%) |
| Wholesale Trade | 99 (100.0%) | 0 (0.0%) |
| Retail Trade | 82 (40.8%) | 119 (59.2%) |
| Transportation & Warehousing | 34 (64.1%) | 19 (35.8%) |
| Utilities | 19 (100.0%) | 0 (0.0%) |
| Information | 23 (100.0%) | 0 (0.0%) |
| Finance & Insurance | 0 (0.0%) | 65 (100.0%) |
| Real Estate, Rental & Leasing | 0 (0.0%) | 10 (100.0%) |
| Professional & Scientific | 173 (100.0%) | 0 (0.0%) |
| Enterprise Management | 0 (0.0%) | 0 (0.0%) |
| Administrative & Support | 15 (30.6%) | 34 (69.4%) |
| Educational Services | 0 (0.0%) | 48 (100.0%) |
| Health Care & Social Assistance | 8 (24.2%) | 25 (75.8%) |
| Arts, Entertainment & Recreation | 0 (0.0%) | 0 (0.0%) |
| Accommodation & Food Services | 25 (100.0%) | 0 (0.0%) |
| Public Administration | 48 (100.0%) | 0 (0.0%) |
| Total | 706 (64.0%) | 397 (36.0%) |
Education in Shawneeland
School Enrollment in Shawneeland
The most common levels of schooling among the 611 students in Shawneeland are middle school (232 | 38.0%), high school (162 | 26.5%), and elementary school (73 | 11.9%).
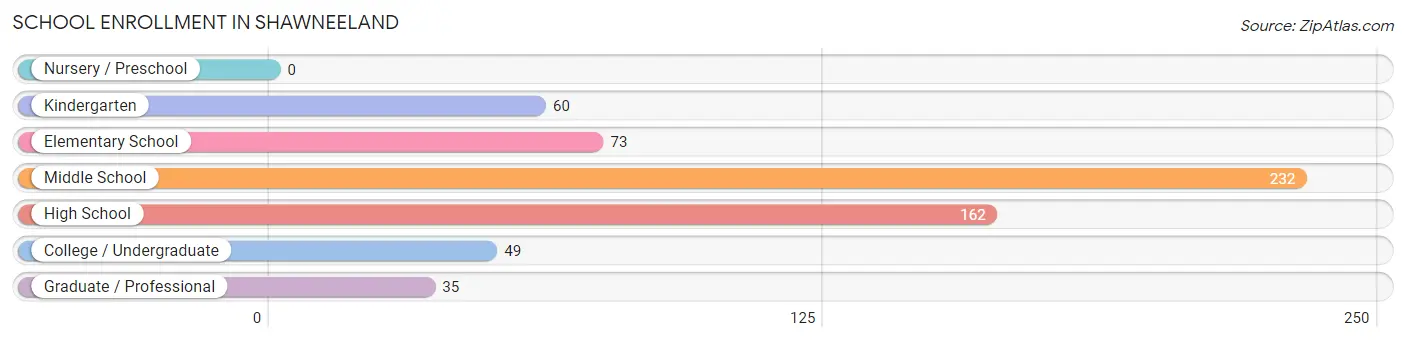
| School Level | # Students | % Students |
| Nursery / Preschool | 0 | 0.0% |
| Kindergarten | 60 | 9.8% |
| Elementary School | 73 | 11.9% |
| Middle School | 232 | 38.0% |
| High School | 162 | 26.5% |
| College / Undergraduate | 49 | 8.0% |
| Graduate / Professional | 35 | 5.7% |
| Total | 611 | 100.0% |
School Enrollment by Age by Funding Source in Shawneeland
Out of a total of 611 students who are enrolled in schools in Shawneeland, 69 (11.3%) attend a private institution, while the remaining 542 (88.7%) are enrolled in public schools. The age group of 5 to 9 year old has the highest likelihood of being enrolled in private schools, with 24 (26.7% in the age bracket) enrolled. Conversely, the age group of 15 to 17 year olds has the lowest likelihood of being enrolled in a private school, with 86 (100.0% in the age bracket) attending a public institution.
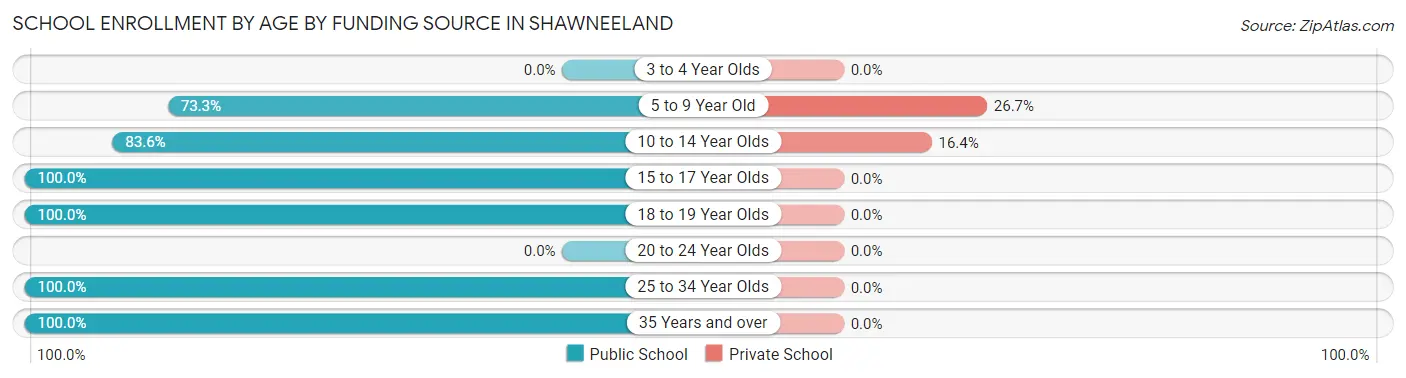
| Age Bracket | Public School | Private School |
| 3 to 4 Year Olds | 0 (0.0%) | 0 (0.0%) |
| 5 to 9 Year Old | 66 (73.3%) | 24 (26.7%) |
| 10 to 14 Year Olds | 230 (83.6%) | 45 (16.4%) |
| 15 to 17 Year Olds | 86 (100.0%) | 0 (0.0%) |
| 18 to 19 Year Olds | 76 (100.0%) | 0 (0.0%) |
| 20 to 24 Year Olds | 0 (0.0%) | 0 (0.0%) |
| 25 to 34 Year Olds | 29 (100.0%) | 0 (0.0%) |
| 35 Years and over | 55 (100.0%) | 0 (0.0%) |
| Total | 542 (88.7%) | 69 (11.3%) |
Educational Attainment by Field of Study in Shawneeland
Business (111 | 31.2%), social sciences (43 | 12.1%), arts & humanities (36 | 10.1%), science & technology (35 | 9.8%), and psychology (34 | 9.6%) are the most common fields of study among 356 individuals in Shawneeland who have obtained a bachelor's degree or higher.
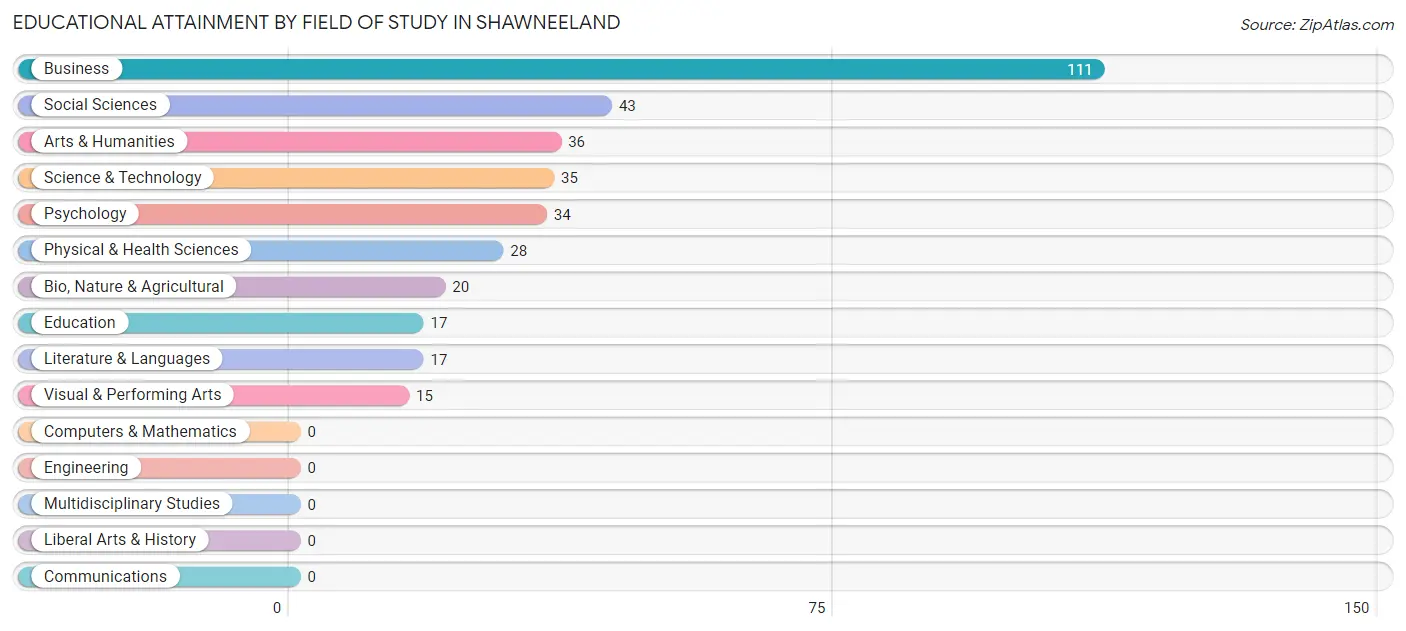
| Field of Study | # Graduates | % Graduates |
| Computers & Mathematics | 0 | 0.0% |
| Bio, Nature & Agricultural | 20 | 5.6% |
| Physical & Health Sciences | 28 | 7.9% |
| Psychology | 34 | 9.6% |
| Social Sciences | 43 | 12.1% |
| Engineering | 0 | 0.0% |
| Multidisciplinary Studies | 0 | 0.0% |
| Science & Technology | 35 | 9.8% |
| Business | 111 | 31.2% |
| Education | 17 | 4.8% |
| Literature & Languages | 17 | 4.8% |
| Liberal Arts & History | 0 | 0.0% |
| Visual & Performing Arts | 15 | 4.2% |
| Communications | 0 | 0.0% |
| Arts & Humanities | 36 | 10.1% |
| Total | 356 | 100.0% |
Transportation & Commute in Shawneeland
Vehicle Availability by Sex in Shawneeland
The most prevalent vehicle ownership categories in Shawneeland are males with 2 vehicles (333, accounting for 44.6%) and females with 2 vehicles (179, making up 95.7%).
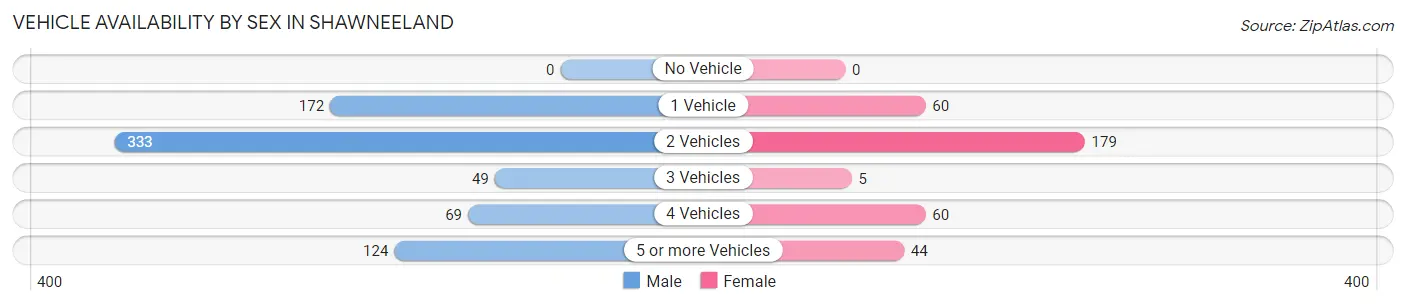
| Vehicles Available | Male | Female |
| No Vehicle | 0 (0.0%) | 0 (0.0%) |
| 1 Vehicle | 172 (23.0%) | 60 (17.2%) |
| 2 Vehicles | 333 (44.6%) | 179 (51.4%) |
| 3 Vehicles | 49 (6.6%) | 5 (1.4%) |
| 4 Vehicles | 69 (9.2%) | 60 (17.2%) |
| 5 or more Vehicles | 124 (16.6%) | 44 (12.6%) |
| Total | 747 (100.0%) | 348 (100.0%) |
Commute Time in Shawneeland
The most frequently occuring commute durations in Shawneeland are 25 to 29 minutes (235 commuters, 22.5%), 30 to 34 minutes (203 commuters, 19.4%), and 90 or more minutes (175 commuters, 16.7%).
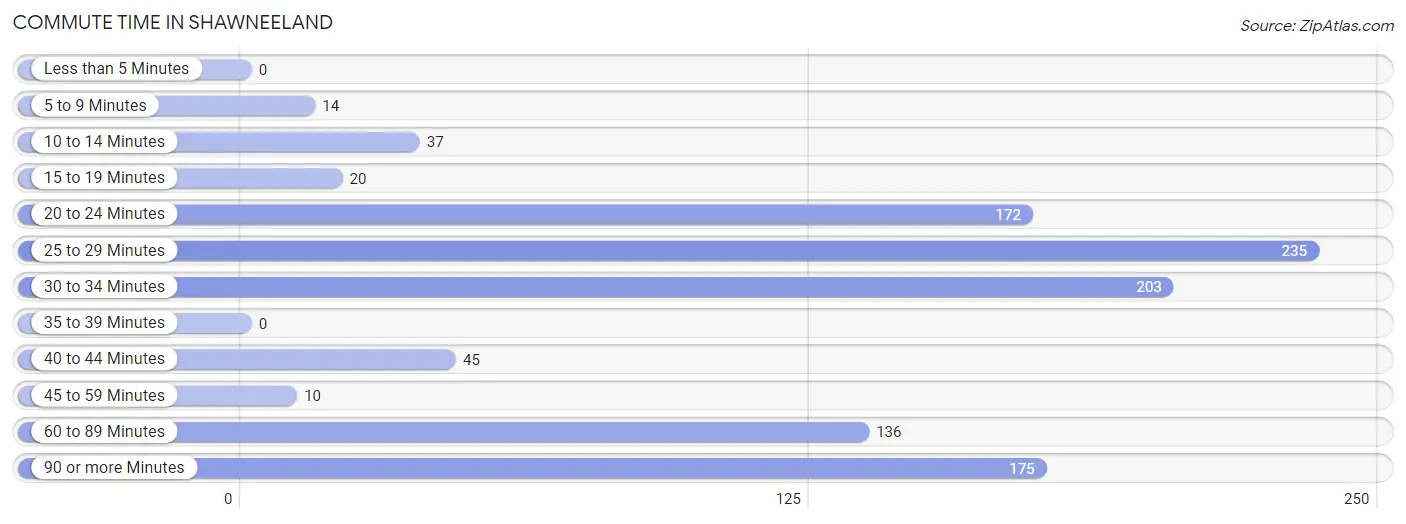
| Commute Time | # Commuters | % Commuters |
| Less than 5 Minutes | 0 | 0.0% |
| 5 to 9 Minutes | 14 | 1.3% |
| 10 to 14 Minutes | 37 | 3.5% |
| 15 to 19 Minutes | 20 | 1.9% |
| 20 to 24 Minutes | 172 | 16.4% |
| 25 to 29 Minutes | 235 | 22.5% |
| 30 to 34 Minutes | 203 | 19.4% |
| 35 to 39 Minutes | 0 | 0.0% |
| 40 to 44 Minutes | 45 | 4.3% |
| 45 to 59 Minutes | 10 | 1.0% |
| 60 to 89 Minutes | 136 | 13.0% |
| 90 or more Minutes | 175 | 16.7% |
Commute Time by Sex in Shawneeland
The most common commute times in Shawneeland are 90 or more minutes (156 commuters, 21.8%) for males and 25 to 29 minutes (148 commuters, 44.7%) for females.
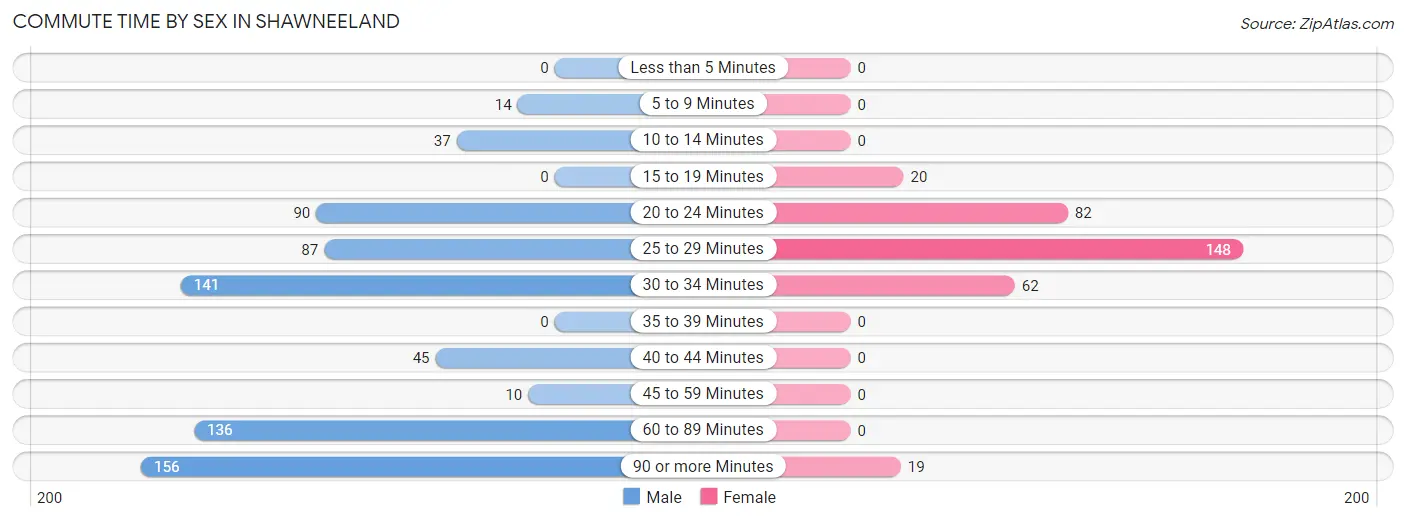
| Commute Time | Male | Female |
| Less than 5 Minutes | 0 (0.0%) | 0 (0.0%) |
| 5 to 9 Minutes | 14 (2.0%) | 0 (0.0%) |
| 10 to 14 Minutes | 37 (5.2%) | 0 (0.0%) |
| 15 to 19 Minutes | 0 (0.0%) | 20 (6.0%) |
| 20 to 24 Minutes | 90 (12.6%) | 82 (24.8%) |
| 25 to 29 Minutes | 87 (12.1%) | 148 (44.7%) |
| 30 to 34 Minutes | 141 (19.7%) | 62 (18.7%) |
| 35 to 39 Minutes | 0 (0.0%) | 0 (0.0%) |
| 40 to 44 Minutes | 45 (6.3%) | 0 (0.0%) |
| 45 to 59 Minutes | 10 (1.4%) | 0 (0.0%) |
| 60 to 89 Minutes | 136 (19.0%) | 0 (0.0%) |
| 90 or more Minutes | 156 (21.8%) | 19 (5.7%) |
Time of Departure to Work by Sex in Shawneeland
The most frequent times of departure to work in Shawneeland are 6:30 AM to 6:59 AM (177, 24.7%) for males and 8:30 AM to 8:59 AM (96, 29.0%) for females.
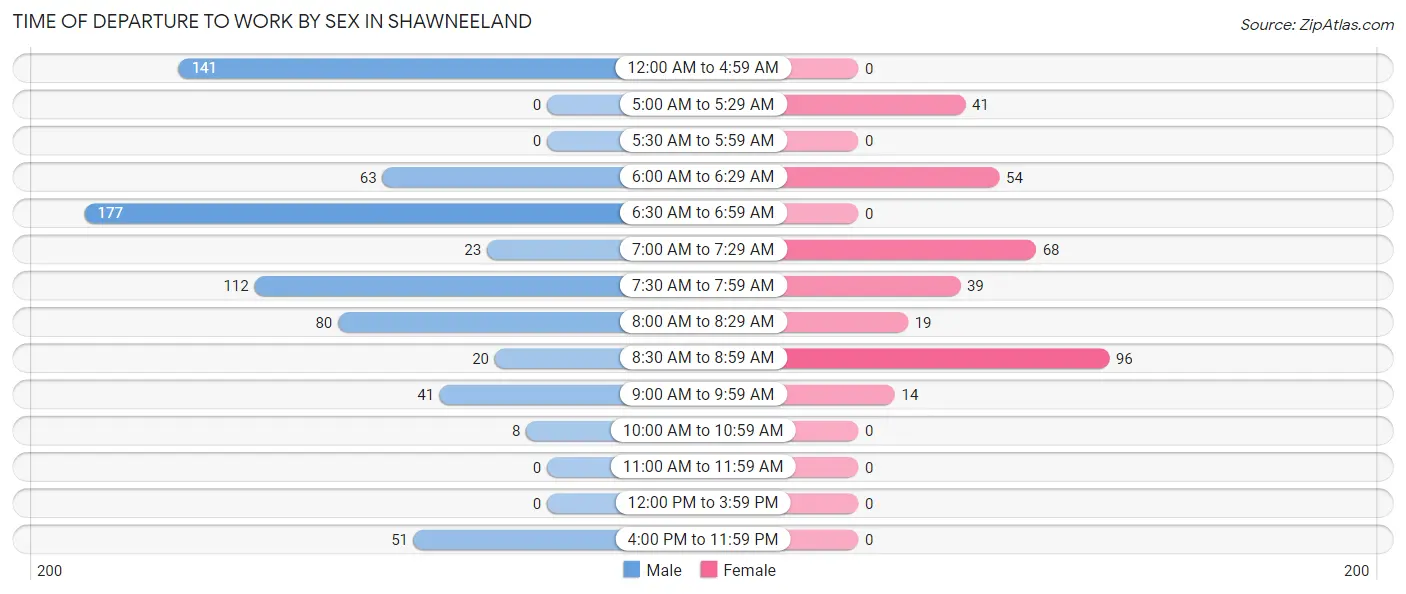
| Time of Departure | Male | Female |
| 12:00 AM to 4:59 AM | 141 (19.7%) | 0 (0.0%) |
| 5:00 AM to 5:29 AM | 0 (0.0%) | 41 (12.4%) |
| 5:30 AM to 5:59 AM | 0 (0.0%) | 0 (0.0%) |
| 6:00 AM to 6:29 AM | 63 (8.8%) | 54 (16.3%) |
| 6:30 AM to 6:59 AM | 177 (24.7%) | 0 (0.0%) |
| 7:00 AM to 7:29 AM | 23 (3.2%) | 68 (20.5%) |
| 7:30 AM to 7:59 AM | 112 (15.6%) | 39 (11.8%) |
| 8:00 AM to 8:29 AM | 80 (11.2%) | 19 (5.7%) |
| 8:30 AM to 8:59 AM | 20 (2.8%) | 96 (29.0%) |
| 9:00 AM to 9:59 AM | 41 (5.7%) | 14 (4.2%) |
| 10:00 AM to 10:59 AM | 8 (1.1%) | 0 (0.0%) |
| 11:00 AM to 11:59 AM | 0 (0.0%) | 0 (0.0%) |
| 12:00 PM to 3:59 PM | 0 (0.0%) | 0 (0.0%) |
| 4:00 PM to 11:59 PM | 51 (7.1%) | 0 (0.0%) |
| Total | 716 (100.0%) | 331 (100.0%) |
Housing Occupancy in Shawneeland
Occupancy by Ownership in Shawneeland
Of the total 900 dwellings in Shawneeland, owner-occupied units account for 826 (91.8%), while renter-occupied units make up 74 (8.2%).
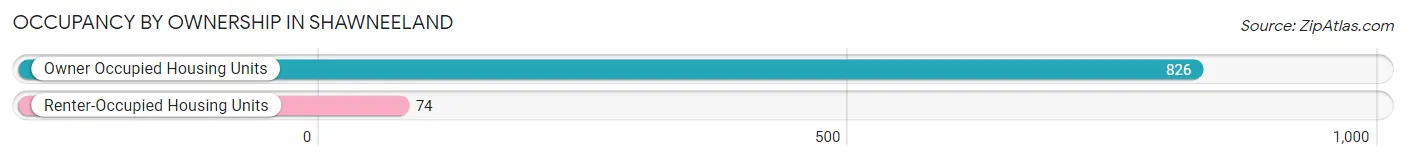
| Occupancy | # Housing Units | % Housing Units |
| Owner Occupied Housing Units | 826 | 91.8% |
| Renter-Occupied Housing Units | 74 | 8.2% |
| Total Occupied Housing Units | 900 | 100.0% |
Occupancy by Household Size in Shawneeland
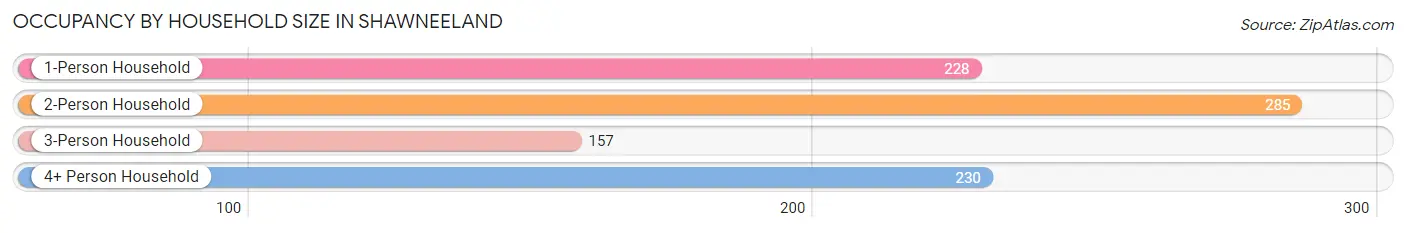
| Household Size | # Housing Units | % Housing Units |
| 1-Person Household | 228 | 25.3% |
| 2-Person Household | 285 | 31.7% |
| 3-Person Household | 157 | 17.4% |
| 4+ Person Household | 230 | 25.6% |
| Total Housing Units | 900 | 100.0% |
Occupancy by Ownership by Household Size in Shawneeland
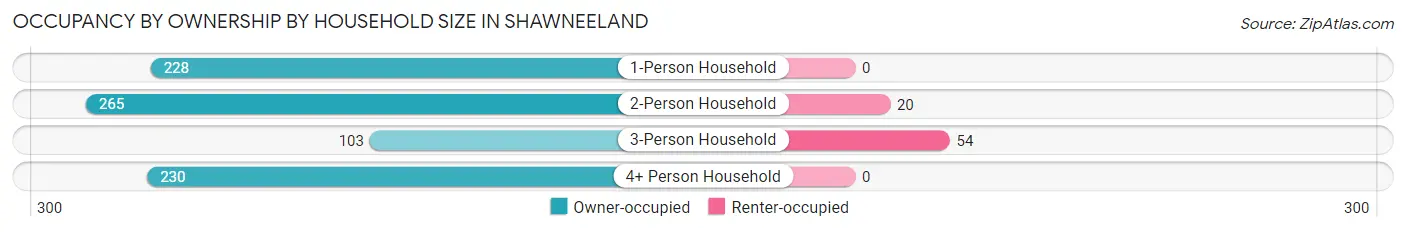
| Household Size | Owner-occupied | Renter-occupied |
| 1-Person Household | 228 (100.0%) | 0 (0.0%) |
| 2-Person Household | 265 (93.0%) | 20 (7.0%) |
| 3-Person Household | 103 (65.6%) | 54 (34.4%) |
| 4+ Person Household | 230 (100.0%) | 0 (0.0%) |
| Total Housing Units | 826 (91.8%) | 74 (8.2%) |
Occupancy by Educational Attainment in Shawneeland
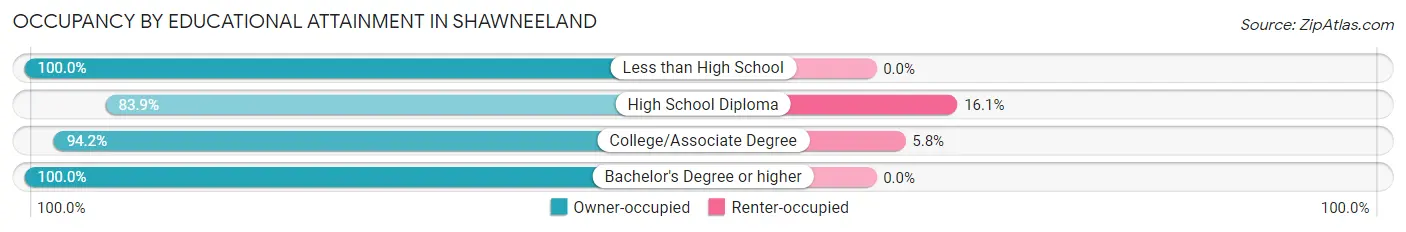
| Household Size | Owner-occupied | Renter-occupied |
| Less than High School | 87 (100.0%) | 0 (0.0%) |
| High School Diploma | 282 (83.9%) | 54 (16.1%) |
| College/Associate Degree | 326 (94.2%) | 20 (5.8%) |
| Bachelor's Degree or higher | 131 (100.0%) | 0 (0.0%) |
Occupancy by Age of Householder in Shawneeland
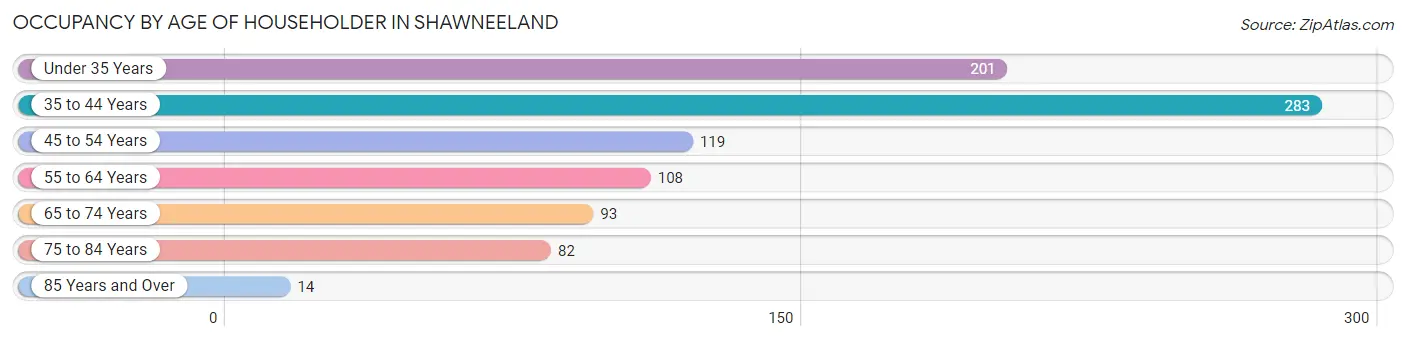
| Age Bracket | # Households | % Households |
| Under 35 Years | 201 | 22.3% |
| 35 to 44 Years | 283 | 31.4% |
| 45 to 54 Years | 119 | 13.2% |
| 55 to 64 Years | 108 | 12.0% |
| 65 to 74 Years | 93 | 10.3% |
| 75 to 84 Years | 82 | 9.1% |
| 85 Years and Over | 14 | 1.6% |
| Total | 900 | 100.0% |
Housing Finances in Shawneeland
Median Income by Occupancy in Shawneeland
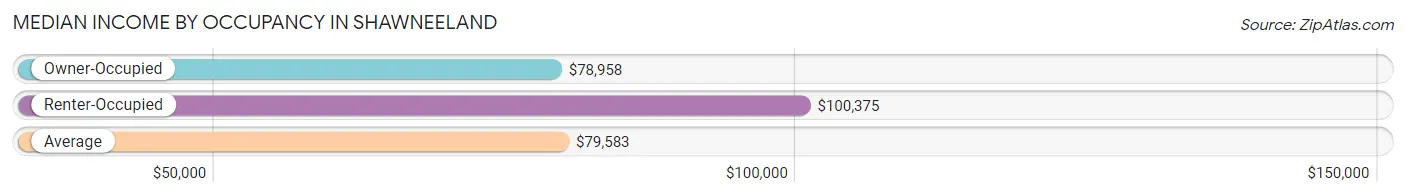
| Occupancy Type | # Households | Median Income |
| Owner-Occupied | 826 (91.8%) | $78,958 |
| Renter-Occupied | 74 (8.2%) | $100,375 |
| Average | 900 (100.0%) | $79,583 |
Occupancy by Householder Income Bracket in Shawneeland
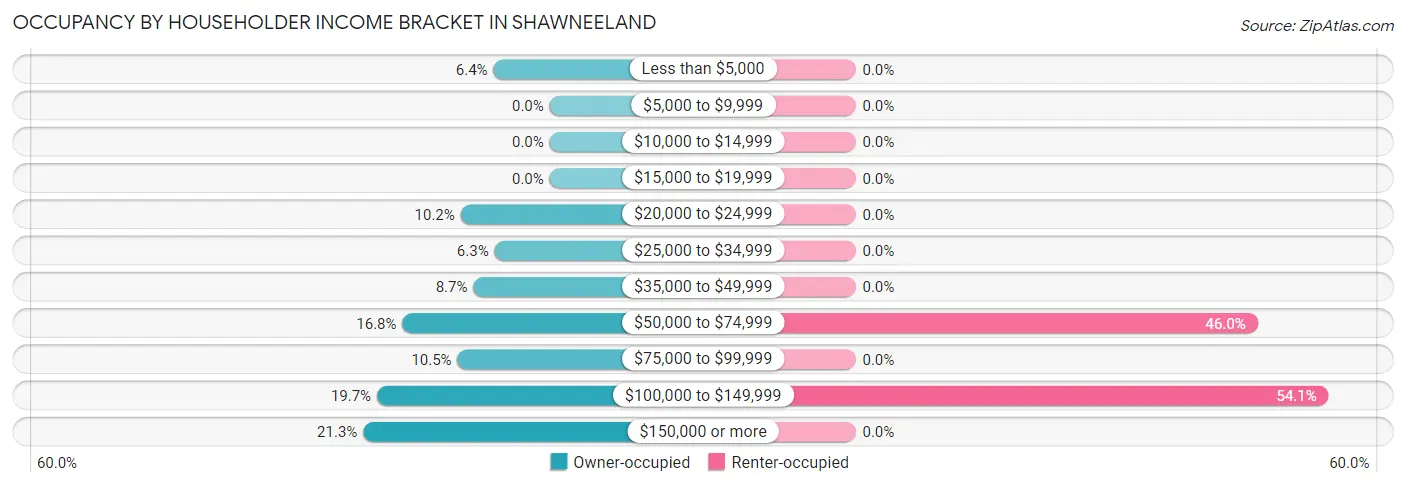
| Income Bracket | Owner-occupied | Renter-occupied |
| Less than $5,000 | 53 (6.4%) | 0 (0.0%) |
| $5,000 to $9,999 | 0 (0.0%) | 0 (0.0%) |
| $10,000 to $14,999 | 0 (0.0%) | 0 (0.0%) |
| $15,000 to $19,999 | 0 (0.0%) | 0 (0.0%) |
| $20,000 to $24,999 | 84 (10.2%) | 0 (0.0%) |
| $25,000 to $34,999 | 52 (6.3%) | 0 (0.0%) |
| $35,000 to $49,999 | 72 (8.7%) | 0 (0.0%) |
| $50,000 to $74,999 | 139 (16.8%) | 34 (46.0%) |
| $75,000 to $99,999 | 87 (10.5%) | 0 (0.0%) |
| $100,000 to $149,999 | 163 (19.7%) | 40 (54.0%) |
| $150,000 or more | 176 (21.3%) | 0 (0.0%) |
| Total | 826 (100.0%) | 74 (100.0%) |
Monthly Housing Cost Tiers in Shawneeland
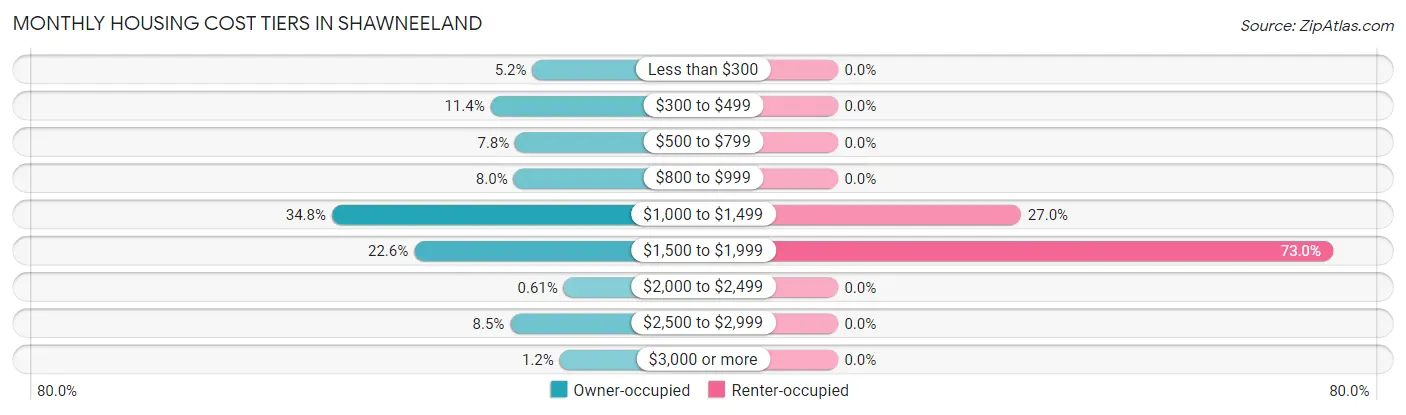
| Monthly Cost | Owner-occupied | Renter-occupied |
| Less than $300 | 43 (5.2%) | 0 (0.0%) |
| $300 to $499 | 94 (11.4%) | 0 (0.0%) |
| $500 to $799 | 64 (7.7%) | 0 (0.0%) |
| $800 to $999 | 66 (8.0%) | 0 (0.0%) |
| $1,000 to $1,499 | 287 (34.7%) | 20 (27.0%) |
| $1,500 to $1,999 | 187 (22.6%) | 54 (73.0%) |
| $2,000 to $2,499 | 5 (0.6%) | 0 (0.0%) |
| $2,500 to $2,999 | 70 (8.5%) | 0 (0.0%) |
| $3,000 or more | 10 (1.2%) | 0 (0.0%) |
| Total | 826 (100.0%) | 74 (100.0%) |
Physical Housing Characteristics in Shawneeland
Housing Structures in Shawneeland
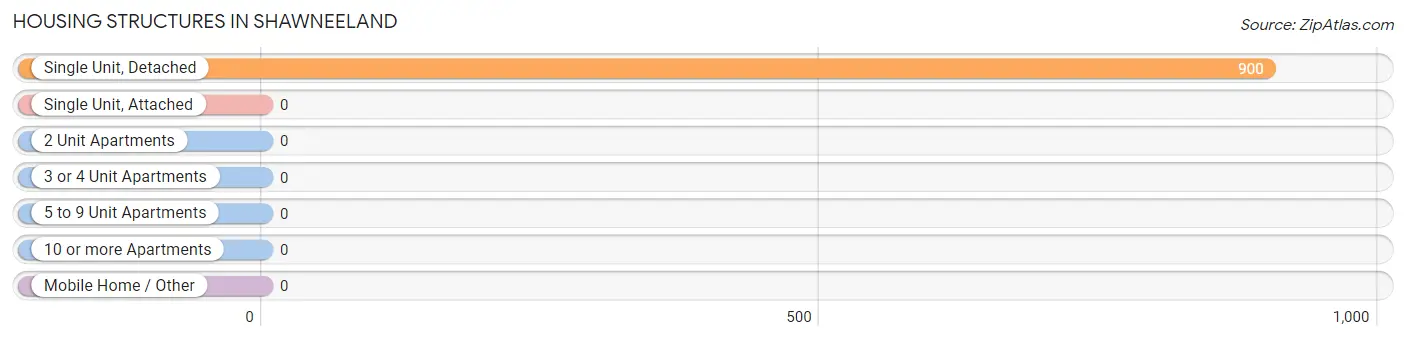
| Structure Type | # Housing Units | % Housing Units |
| Single Unit, Detached | 900 | 100.0% |
| Single Unit, Attached | 0 | 0.0% |
| 2 Unit Apartments | 0 | 0.0% |
| 3 or 4 Unit Apartments | 0 | 0.0% |
| 5 to 9 Unit Apartments | 0 | 0.0% |
| 10 or more Apartments | 0 | 0.0% |
| Mobile Home / Other | 0 | 0.0% |
| Total | 900 | 100.0% |
Housing Structures by Occupancy in Shawneeland
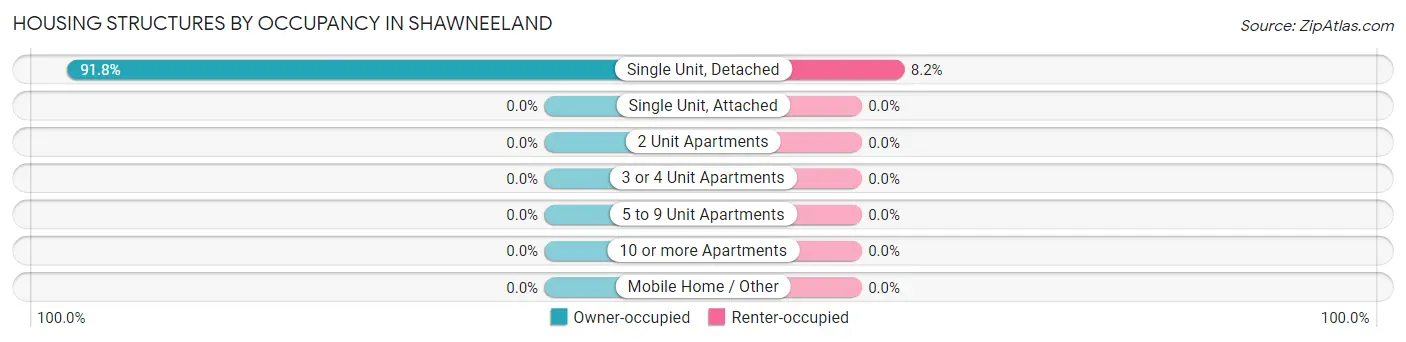
| Structure Type | Owner-occupied | Renter-occupied |
| Single Unit, Detached | 826 (91.8%) | 74 (8.2%) |
| Single Unit, Attached | 0 (0.0%) | 0 (0.0%) |
| 2 Unit Apartments | 0 (0.0%) | 0 (0.0%) |
| 3 or 4 Unit Apartments | 0 (0.0%) | 0 (0.0%) |
| 5 to 9 Unit Apartments | 0 (0.0%) | 0 (0.0%) |
| 10 or more Apartments | 0 (0.0%) | 0 (0.0%) |
| Mobile Home / Other | 0 (0.0%) | 0 (0.0%) |
| Total | 826 (91.8%) | 74 (8.2%) |
Housing Structures by Number of Rooms in Shawneeland
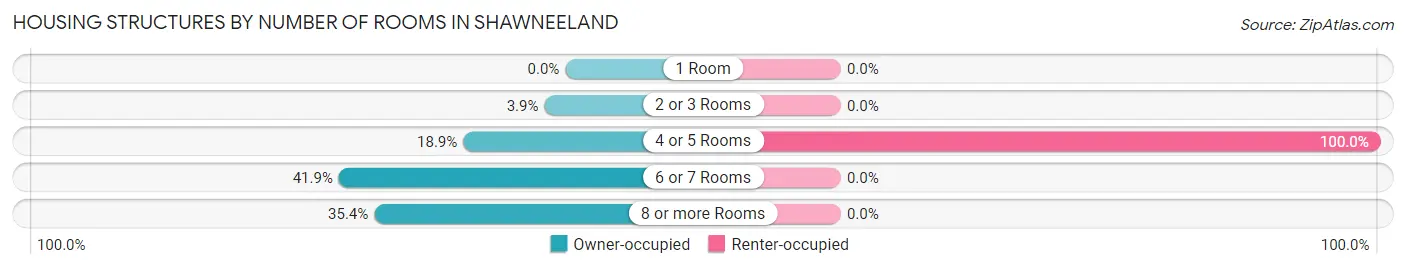
| Number of Rooms | Owner-occupied | Renter-occupied |
| 1 Room | 0 (0.0%) | 0 (0.0%) |
| 2 or 3 Rooms | 32 (3.9%) | 0 (0.0%) |
| 4 or 5 Rooms | 156 (18.9%) | 74 (100.0%) |
| 6 or 7 Rooms | 346 (41.9%) | 0 (0.0%) |
| 8 or more Rooms | 292 (35.3%) | 0 (0.0%) |
| Total | 826 (100.0%) | 74 (100.0%) |
Housing Structure by Heating Type in Shawneeland
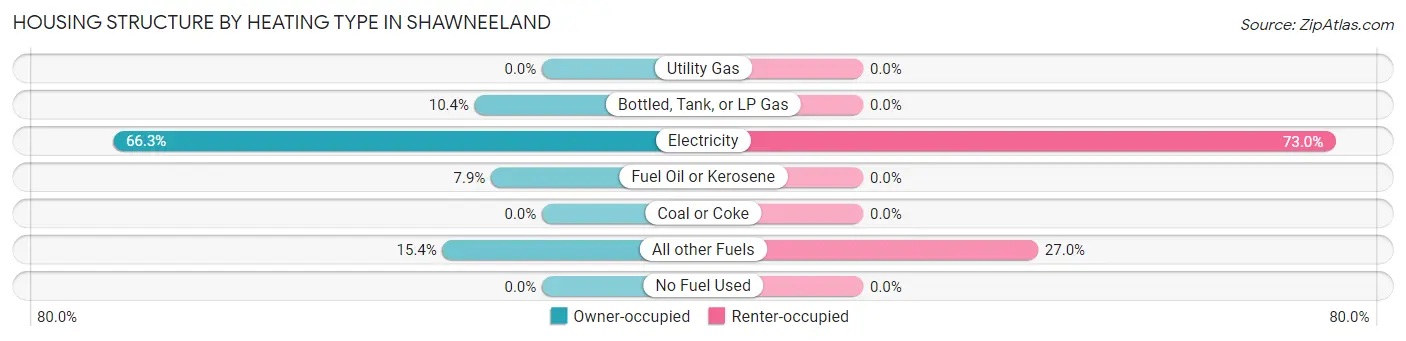
| Heating Type | Owner-occupied | Renter-occupied |
| Utility Gas | 0 (0.0%) | 0 (0.0%) |
| Bottled, Tank, or LP Gas | 86 (10.4%) | 0 (0.0%) |
| Electricity | 548 (66.3%) | 54 (73.0%) |
| Fuel Oil or Kerosene | 65 (7.9%) | 0 (0.0%) |
| Coal or Coke | 0 (0.0%) | 0 (0.0%) |
| All other Fuels | 127 (15.4%) | 20 (27.0%) |
| No Fuel Used | 0 (0.0%) | 0 (0.0%) |
| Total | 826 (100.0%) | 74 (100.0%) |
Household Vehicle Usage in Shawneeland

| Vehicles per Household | Owner-occupied | Renter-occupied |
| No Vehicle | 0 (0.0%) | 0 (0.0%) |
| 1 Vehicle | 278 (33.7%) | 0 (0.0%) |
| 2 Vehicles | 350 (42.4%) | 20 (27.0%) |
| 3 or more Vehicles | 198 (24.0%) | 54 (73.0%) |
| Total | 826 (100.0%) | 74 (100.0%) |
Real Estate & Mortgages in Shawneeland
Real Estate and Mortgage Overview in Shawneeland
| Characteristic | Without Mortgage | With Mortgage |
| Housing Units | 153 | 673 |
| Median Property Value | $167,200 | $236,100 |
| Median Household Income | $65,625 | $159 |
| Monthly Housing Costs | $416 | $10 |
| Real Estate Taxes | $1,658 | $0 |
Property Value by Mortgage Status in Shawneeland
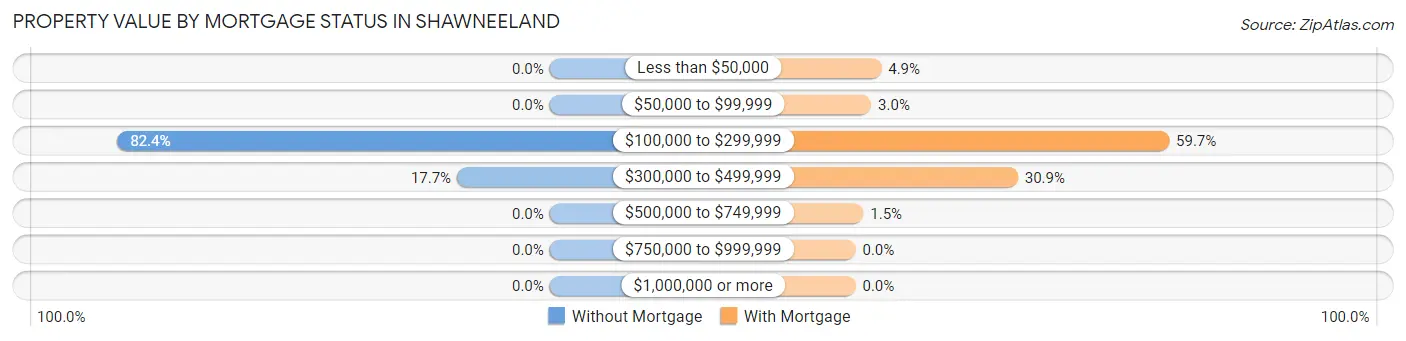
| Property Value | Without Mortgage | With Mortgage |
| Less than $50,000 | 0 (0.0%) | 33 (4.9%) |
| $50,000 to $99,999 | 0 (0.0%) | 20 (3.0%) |
| $100,000 to $299,999 | 126 (82.4%) | 402 (59.7%) |
| $300,000 to $499,999 | 27 (17.6%) | 208 (30.9%) |
| $500,000 to $749,999 | 0 (0.0%) | 10 (1.5%) |
| $750,000 to $999,999 | 0 (0.0%) | 0 (0.0%) |
| $1,000,000 or more | 0 (0.0%) | 0 (0.0%) |
| Total | 153 (100.0%) | 673 (100.0%) |
Household Income by Mortgage Status in Shawneeland
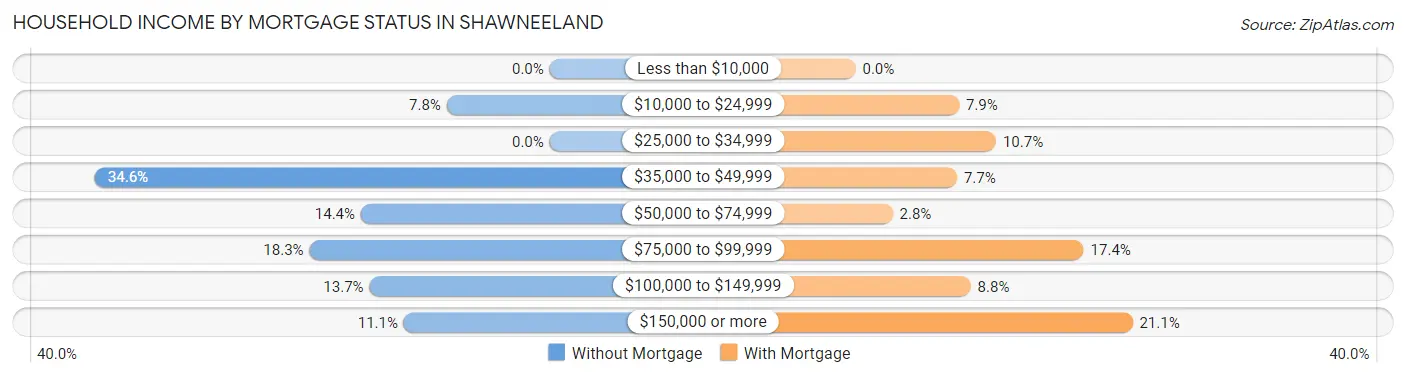
| Household Income | Without Mortgage | With Mortgage |
| Less than $10,000 | 0 (0.0%) | 0 (0.0%) |
| $10,000 to $24,999 | 12 (7.8%) | 53 (7.9%) |
| $25,000 to $34,999 | 0 (0.0%) | 72 (10.7%) |
| $35,000 to $49,999 | 53 (34.6%) | 52 (7.7%) |
| $50,000 to $74,999 | 22 (14.4%) | 19 (2.8%) |
| $75,000 to $99,999 | 28 (18.3%) | 117 (17.4%) |
| $100,000 to $149,999 | 21 (13.7%) | 59 (8.8%) |
| $150,000 or more | 17 (11.1%) | 142 (21.1%) |
| Total | 153 (100.0%) | 673 (100.0%) |
Property Value to Household Income Ratio in Shawneeland
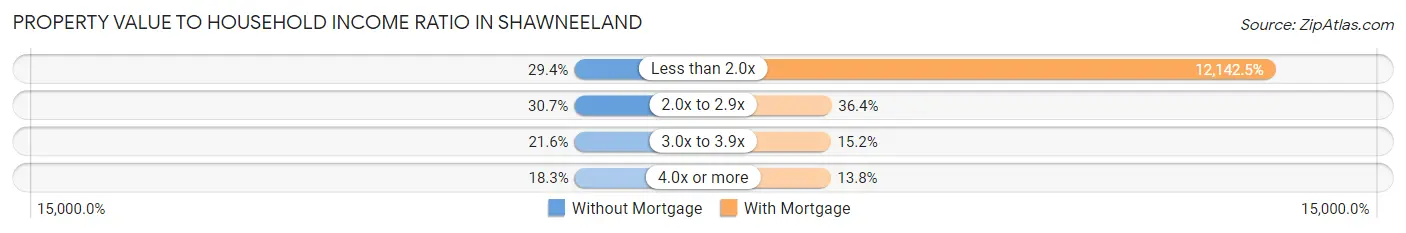
| Value-to-Income Ratio | Without Mortgage | With Mortgage |
| Less than 2.0x | 45 (29.4%) | 81,719 (12,142.5%) |
| 2.0x to 2.9x | 47 (30.7%) | 245 (36.4%) |
| 3.0x to 3.9x | 33 (21.6%) | 102 (15.2%) |
| 4.0x or more | 28 (18.3%) | 93 (13.8%) |
| Total | 153 (100.0%) | 673 (100.0%) |
Real Estate Taxes by Mortgage Status in Shawneeland
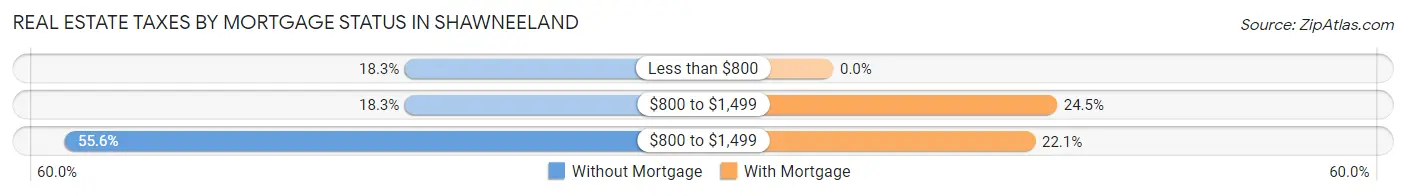
| Property Taxes | Without Mortgage | With Mortgage |
| Less than $800 | 28 (18.3%) | 0 (0.0%) |
| $800 to $1,499 | 28 (18.3%) | 165 (24.5%) |
| $800 to $1,499 | 85 (55.6%) | 149 (22.1%) |
| Total | 153 (100.0%) | 673 (100.0%) |
Health & Disability in Shawneeland
Health Insurance Coverage by Age in Shawneeland
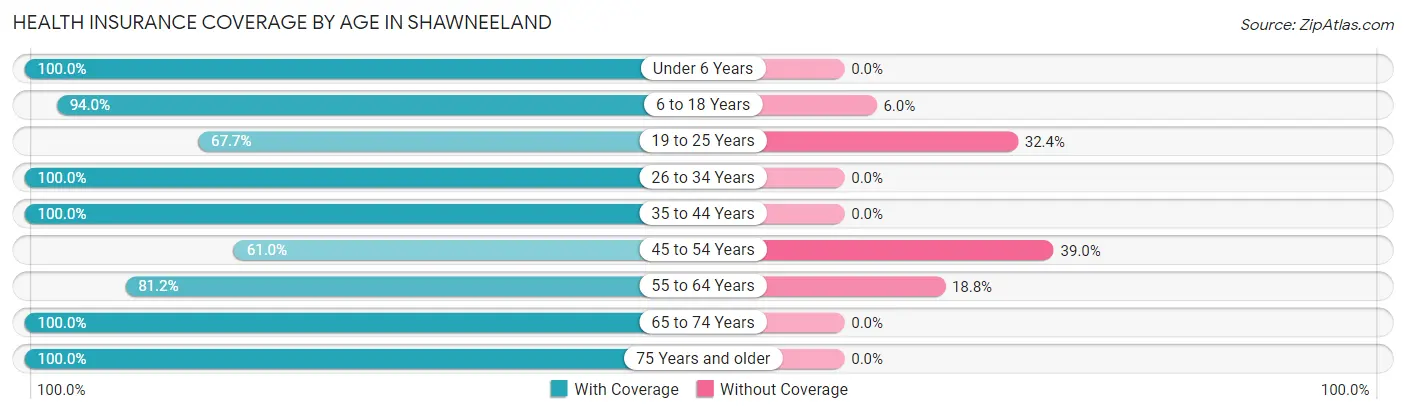
| Age Bracket | With Coverage | Without Coverage |
| Under 6 Years | 266 (100.0%) | 0 (0.0%) |
| 6 to 18 Years | 439 (94.0%) | 28 (6.0%) |
| 19 to 25 Years | 69 (67.6%) | 33 (32.4%) |
| 26 to 34 Years | 203 (100.0%) | 0 (0.0%) |
| 35 to 44 Years | 473 (100.0%) | 0 (0.0%) |
| 45 to 54 Years | 164 (61.0%) | 105 (39.0%) |
| 55 to 64 Years | 225 (81.2%) | 52 (18.8%) |
| 65 to 74 Years | 99 (100.0%) | 0 (0.0%) |
| 75 Years and older | 150 (100.0%) | 0 (0.0%) |
| Total | 2,088 (90.5%) | 218 (9.5%) |
Health Insurance Coverage by Citizenship Status in Shawneeland
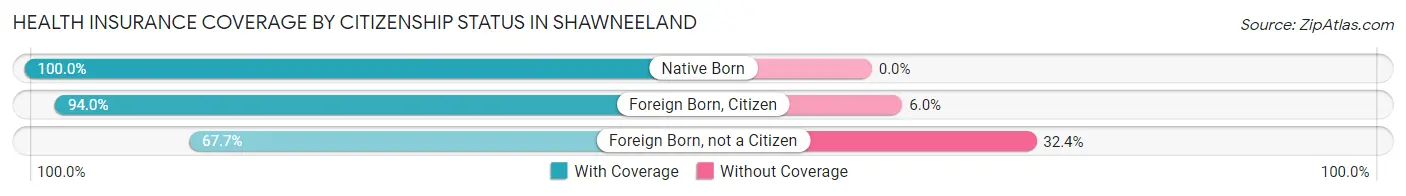
| Citizenship Status | With Coverage | Without Coverage |
| Native Born | 266 (100.0%) | 0 (0.0%) |
| Foreign Born, Citizen | 439 (94.0%) | 28 (6.0%) |
| Foreign Born, not a Citizen | 69 (67.6%) | 33 (32.4%) |
Health Insurance Coverage by Household Income in Shawneeland
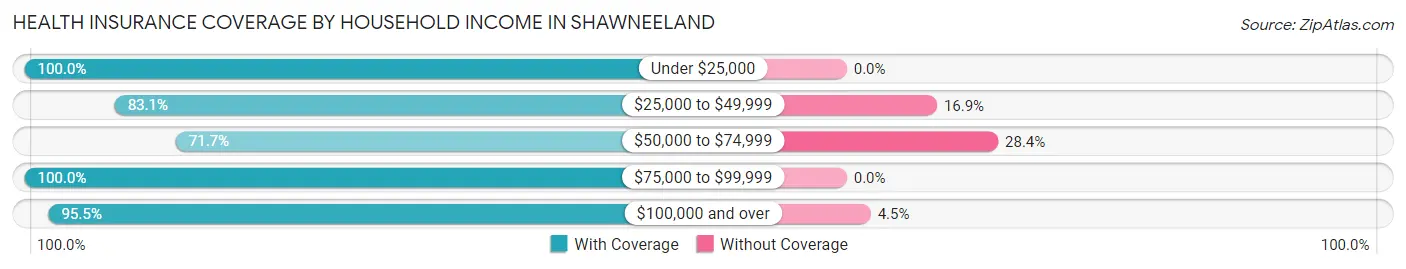
| Household Income | With Coverage | Without Coverage |
| Under $25,000 | 204 (100.0%) | 0 (0.0%) |
| $25,000 to $49,999 | 182 (83.1%) | 37 (16.9%) |
| $50,000 to $74,999 | 326 (71.7%) | 129 (28.3%) |
| $75,000 to $99,999 | 267 (100.0%) | 0 (0.0%) |
| $100,000 and over | 1,109 (95.5%) | 52 (4.5%) |
Public vs Private Health Insurance Coverage by Age in Shawneeland
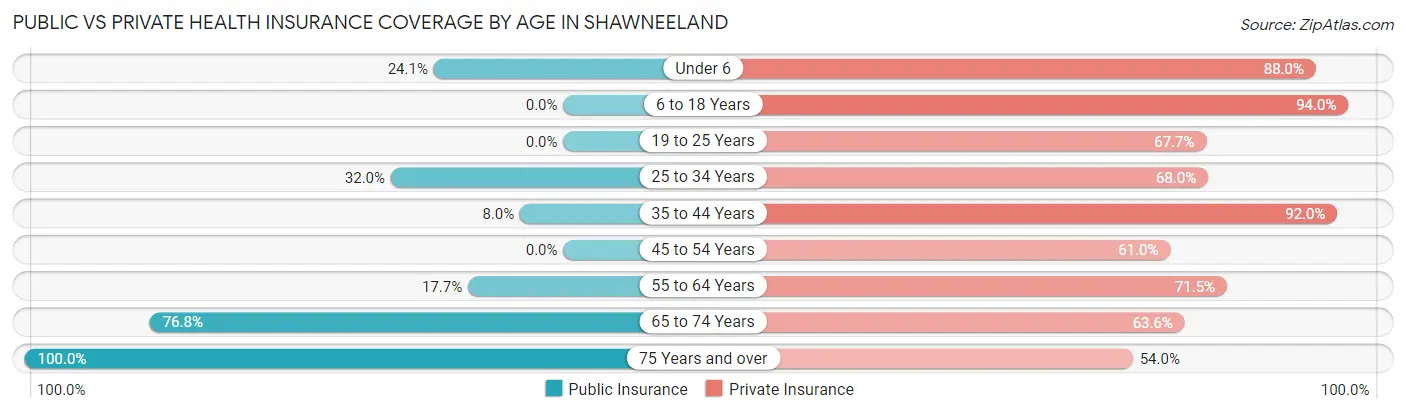
| Age Bracket | Public Insurance | Private Insurance |
| Under 6 | 64 (24.1%) | 234 (88.0%) |
| 6 to 18 Years | 0 (0.0%) | 439 (94.0%) |
| 19 to 25 Years | 0 (0.0%) | 69 (67.6%) |
| 25 to 34 Years | 65 (32.0%) | 138 (68.0%) |
| 35 to 44 Years | 38 (8.0%) | 435 (92.0%) |
| 45 to 54 Years | 0 (0.0%) | 164 (61.0%) |
| 55 to 64 Years | 49 (17.7%) | 198 (71.5%) |
| 65 to 74 Years | 76 (76.8%) | 63 (63.6%) |
| 75 Years and over | 150 (100.0%) | 81 (54.0%) |
| Total | 442 (19.2%) | 1,821 (79.0%) |
Disability Status by Sex by Age in Shawneeland
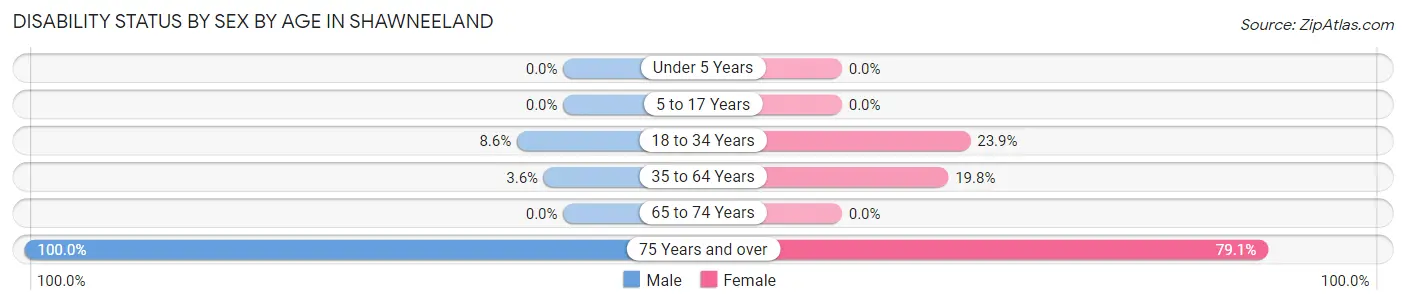
| Age Bracket | Male | Female |
| Under 5 Years | 0 (0.0%) | 0 (0.0%) |
| 5 to 17 Years | 0 (0.0%) | 0 (0.0%) |
| 18 to 34 Years | 14 (8.6%) | 52 (23.8%) |
| 35 to 64 Years | 19 (3.6%) | 97 (19.8%) |
| 65 to 74 Years | 0 (0.0%) | 0 (0.0%) |
| 75 Years and over | 83 (100.0%) | 53 (79.1%) |
Disability Class by Sex by Age in Shawneeland
Disability Class: Hearing Difficulty
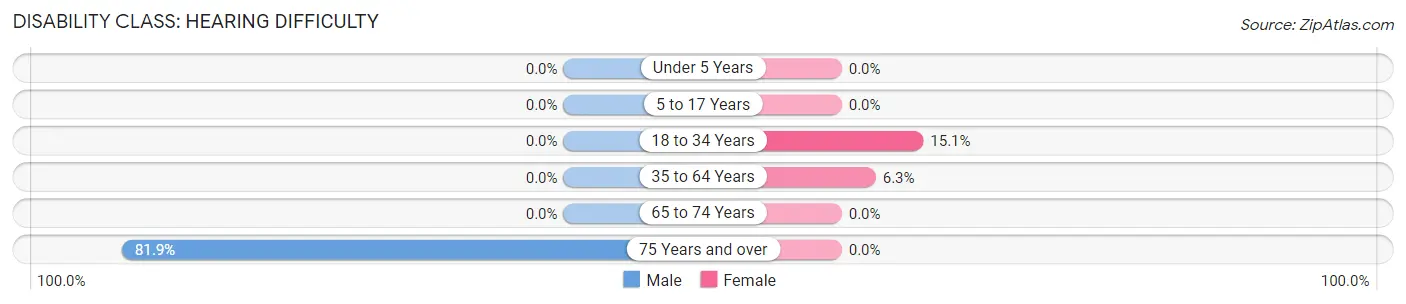
| Age Bracket | Male | Female |
| Under 5 Years | 0 (0.0%) | 0 (0.0%) |
| 5 to 17 Years | 0 (0.0%) | 0 (0.0%) |
| 18 to 34 Years | 0 (0.0%) | 33 (15.1%) |
| 35 to 64 Years | 0 (0.0%) | 31 (6.3%) |
| 65 to 74 Years | 0 (0.0%) | 0 (0.0%) |
| 75 Years and over | 68 (81.9%) | 0 (0.0%) |
Disability Class: Vision Difficulty
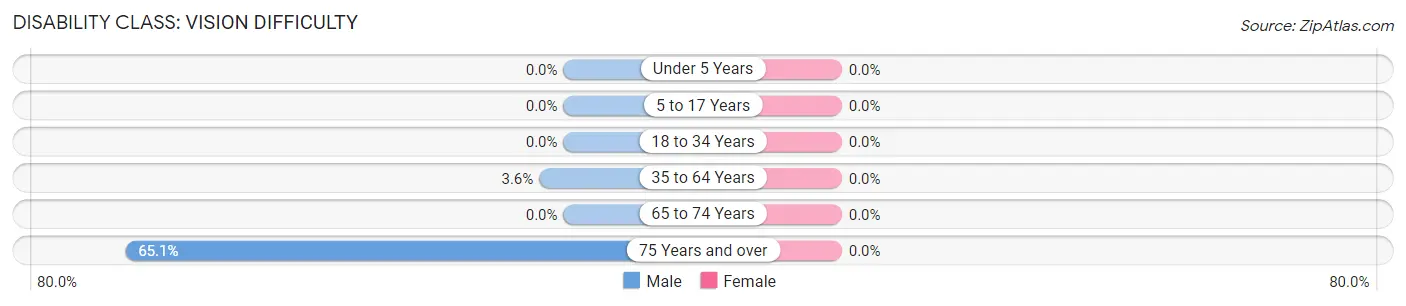
| Age Bracket | Male | Female |
| Under 5 Years | 0 (0.0%) | 0 (0.0%) |
| 5 to 17 Years | 0 (0.0%) | 0 (0.0%) |
| 18 to 34 Years | 0 (0.0%) | 0 (0.0%) |
| 35 to 64 Years | 19 (3.6%) | 0 (0.0%) |
| 65 to 74 Years | 0 (0.0%) | 0 (0.0%) |
| 75 Years and over | 54 (65.1%) | 0 (0.0%) |
Disability Class: Cognitive Difficulty
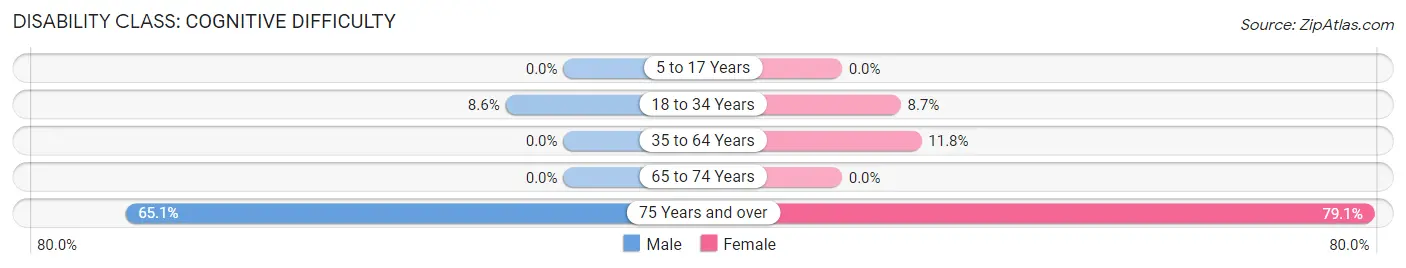
| Age Bracket | Male | Female |
| 5 to 17 Years | 0 (0.0%) | 0 (0.0%) |
| 18 to 34 Years | 14 (8.6%) | 19 (8.7%) |
| 35 to 64 Years | 0 (0.0%) | 58 (11.8%) |
| 65 to 74 Years | 0 (0.0%) | 0 (0.0%) |
| 75 Years and over | 54 (65.1%) | 53 (79.1%) |
Disability Class: Ambulatory Difficulty
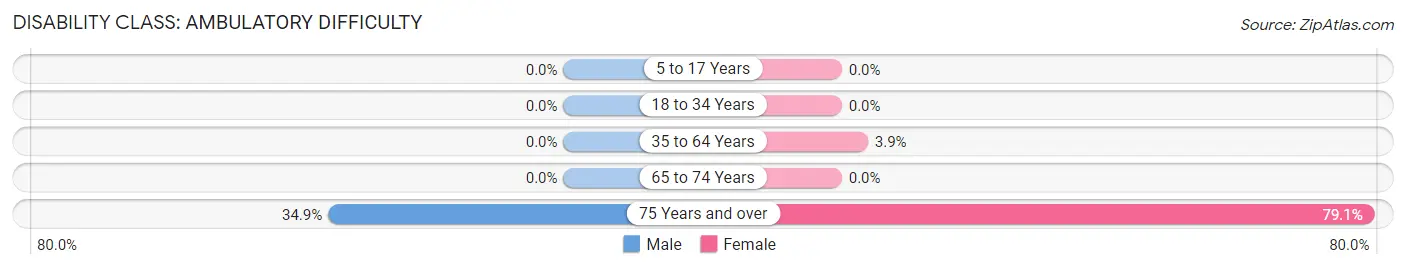
| Age Bracket | Male | Female |
| 5 to 17 Years | 0 (0.0%) | 0 (0.0%) |
| 18 to 34 Years | 0 (0.0%) | 0 (0.0%) |
| 35 to 64 Years | 0 (0.0%) | 19 (3.9%) |
| 65 to 74 Years | 0 (0.0%) | 0 (0.0%) |
| 75 Years and over | 29 (34.9%) | 53 (79.1%) |
Disability Class: Self-Care Difficulty
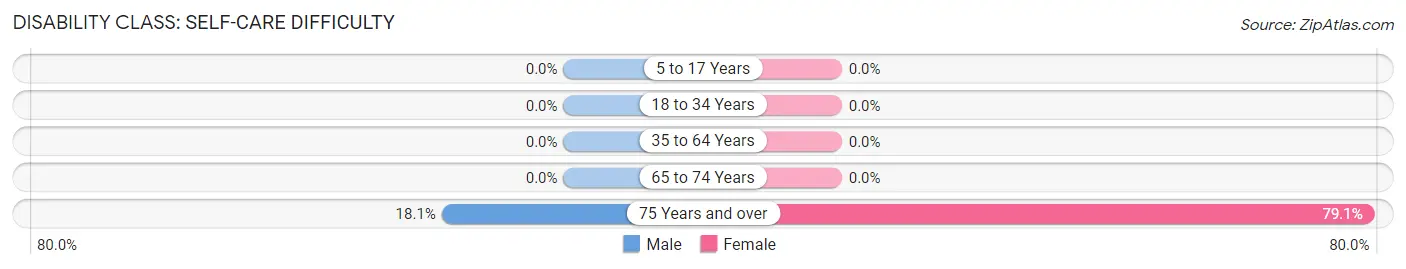
| Age Bracket | Male | Female |
| 5 to 17 Years | 0 (0.0%) | 0 (0.0%) |
| 18 to 34 Years | 0 (0.0%) | 0 (0.0%) |
| 35 to 64 Years | 0 (0.0%) | 0 (0.0%) |
| 65 to 74 Years | 0 (0.0%) | 0 (0.0%) |
| 75 Years and over | 15 (18.1%) | 53 (79.1%) |
Technology Access in Shawneeland
Computing Device Access in Shawneeland
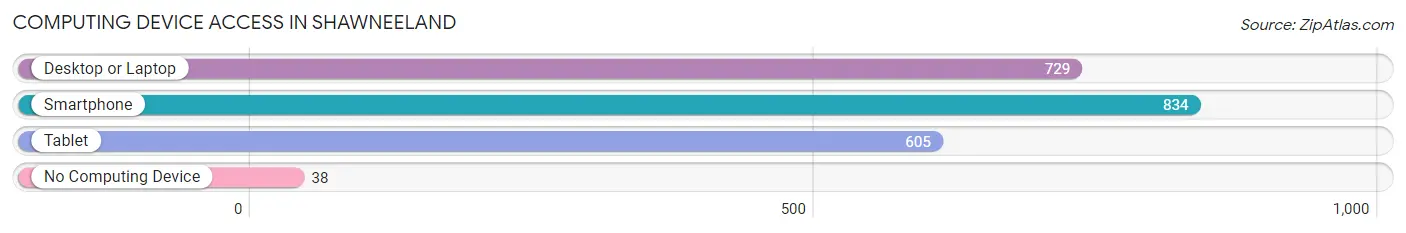
| Device Type | # Households | % Households |
| Desktop or Laptop | 729 | 81.0% |
| Smartphone | 834 | 92.7% |
| Tablet | 605 | 67.2% |
| No Computing Device | 38 | 4.2% |
| Total | 900 | 100.0% |
Internet Access in Shawneeland
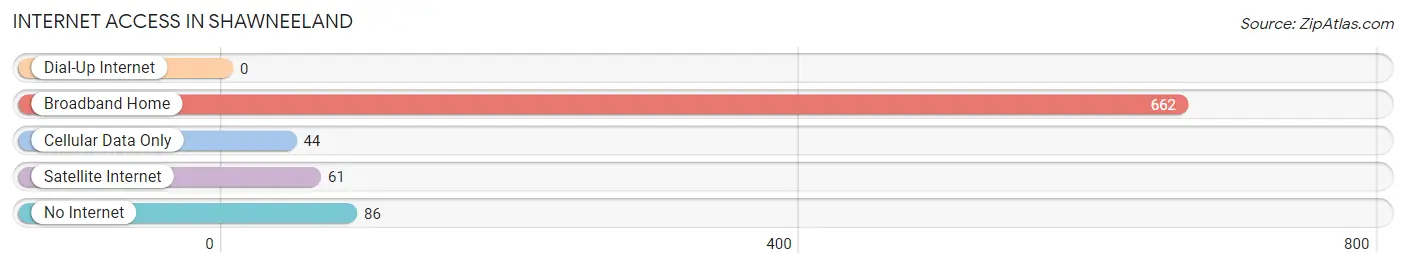
| Internet Type | # Households | % Households |
| Dial-Up Internet | 0 | 0.0% |
| Broadband Home | 662 | 73.6% |
| Cellular Data Only | 44 | 4.9% |
| Satellite Internet | 61 | 6.8% |
| No Internet | 86 | 9.6% |
| Total | 900 | 100.0% |
Shawneeland Summary
Shawneeland is a small unincorporated community located in the northern part of Fauquier County, Virginia. It is situated in the foothills of the Blue Ridge Mountains, approximately 25 miles west of Washington, D.C. The community is home to a population of approximately 500 people, and is known for its rural charm and close-knit community.
History
Shawneeland was first settled in the late 1700s by a group of Shawnee Indians who had migrated from the Ohio Valley. The Shawnee were a nomadic tribe who had been pushed out of their homeland by European settlers. The Shawnee were welcomed by the local settlers, and the two groups lived peacefully together for many years.
In the early 1800s, the Shawnee began to move away from the area, and the community was taken over by European settlers. The community was named after the Shawnee, and the name has remained ever since.
Geography
Shawneeland is located in the northern part of Fauquier County, Virginia. It is situated in the foothills of the Blue Ridge Mountains, approximately 25 miles west of Washington, D.C. The community is surrounded by rolling hills and lush forests, and is home to a variety of wildlife.
The climate in Shawneeland is temperate, with hot summers and cold winters. The average annual temperature is around 55 degrees Fahrenheit. The area receives an average of 40 inches of precipitation per year, with most of it falling in the form of rain.
Economy
The economy of Shawneeland is largely based on agriculture. The area is home to several farms, which produce a variety of crops, including corn, soybeans, wheat, and hay. The community also has a few small businesses, including a general store, a gas station, and a restaurant.
The community is also home to a number of small manufacturing companies, which produce a variety of products, including furniture, clothing, and electronics.
Demographics
As of the 2010 census, the population of Shawneeland was 498. The racial makeup of the community was 97.2% White, 0.6% African American, 0.2% Native American, 0.2% Asian, 0.2% from other races, and 1.8% from two or more races. Hispanic or Latino of any race were 1.2% of the population.
The median household income in Shawneeland was $50,000, and the median family income was $54,000. The per capita income was $20,000. About 8.5% of families and 10.2% of the population were below the poverty line, including 14.3% of those under age 18 and none of those age 65 or over.
Common Questions
What is Per Capita Income in Shawneeland?
Per Capita income in Shawneeland is $41,286.
What is the Median Family Income in Shawneeland?
Median Family Income in Shawneeland is $96,136.
What is the Median Household income in Shawneeland?
Median Household Income in Shawneeland is $79,583.
What is Income or Wage Gap in Shawneeland?
Income or Wage Gap in Shawneeland is 2.6%.
Women in Shawneeland earn 97.4 cents for every dollar earned by a man.
What is Inequality or Gini Index in Shawneeland?
Inequality or Gini Index in Shawneeland is 0.42.
What is the Total Population of Shawneeland?
Total Population of Shawneeland is 2,347.
What is the Total Male Population of Shawneeland?
Total Male Population of Shawneeland is 1,160.
What is the Total Female Population of Shawneeland?
Total Female Population of Shawneeland is 1,187.
What is the Ratio of Males per 100 Females in Shawneeland?
There are 97.73 Males per 100 Females in Shawneeland.
What is the Ratio of Females per 100 Males in Shawneeland?
There are 102.33 Females per 100 Males in Shawneeland.
What is the Median Population Age in Shawneeland?
Median Population Age in Shawneeland is 36.4 Years.
What is the Average Family Size in Shawneeland
Average Family Size in Shawneeland is 3.2 People.
What is the Average Household Size in Shawneeland
Average Household Size in Shawneeland is 2.6 People.
How Large is the Labor Force in Shawneeland?
There are 1,184 People in the Labor Forcein in Shawneeland.
What is the Percentage of People in the Labor Force in Shawneeland?
67.2% of People are in the Labor Force in Shawneeland.
What is the Unemployment Rate in Shawneeland?
Unemployment Rate in Shawneeland is 3.5%.