Oak Grove, VA Map & Demographics
Oak Grove Map
Oak Grove Overview
$53,380
PER CAPITA INCOME
$143,542
AVG FAMILY INCOME
$175,161
AVG HOUSEHOLD INCOME
36.2%
WAGE / INCOME GAP [ % ]
63.8¢/ $1
WAGE / INCOME GAP [ $ ]
0.29
INEQUALITY / GINI INDEX
2,533
TOTAL POPULATION
1,258
MALE POPULATION
1,275
FEMALE POPULATION
98.67
MALES / 100 FEMALES
101.35
FEMALES / 100 MALES
33.1
MEDIAN AGE
3.4
AVG FAMILY SIZE
3.3
AVG HOUSEHOLD SIZE
1,590
LABOR FORCE [ PEOPLE ]
77.0%
PERCENT IN LABOR FORCE
0.9%
UNEMPLOYMENT RATE
Oak Grove Area Codes
Income in Oak Grove
Income Overview in Oak Grove
Per Capita Income in Oak Grove is $53,380, while median incomes of families and households are $143,542 and $175,161 respectively.
| Characteristic | Number | Measure |
| Per Capita Income | 2,533 | $53,380 |
| Median Family Income | 709 | $143,542 |
| Mean Family Income | 709 | $169,576 |
| Median Household Income | 764 | $175,161 |
| Mean Household Income | 764 | $176,423 |
| Income Deficit | 709 | $0 |
| Wage / Income Gap (%) | 2,533 | 36.16% |
| Wage / Income Gap ($) | 2,533 | 63.84¢ per $1 |
| Gini / Inequality Index | 2,533 | 0.29 |
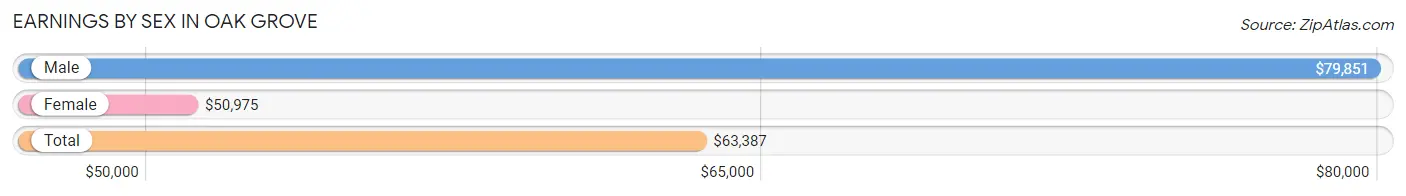
Earnings by Sex in Oak Grove
Average Earnings in Oak Grove are $63,387, $79,851 for men and $50,975 for women, a difference of 36.2%.
| Sex | Number | Average Earnings |
| Male | 848 (53.3%) | $79,851 |
| Female | 742 (46.7%) | $50,975 |
| Total | 1,590 (100.0%) | $63,387 |
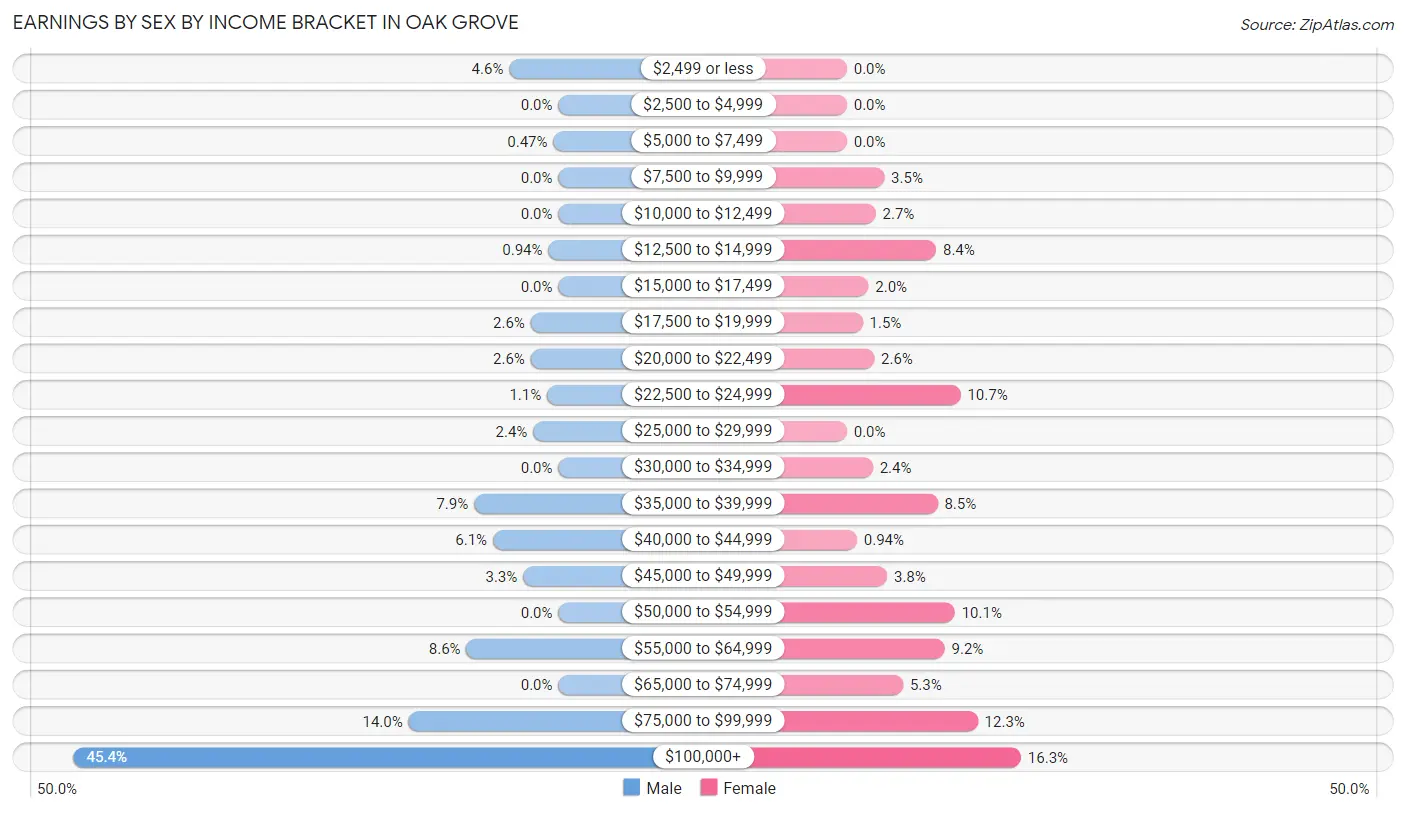
Earnings by Sex by Income Bracket in Oak Grove
The most common earnings brackets in Oak Grove are $100,000+ for men (385 | 45.4%) and $100,000+ for women (121 | 16.3%).
| Income | Male | Female |
| $2,499 or less | 39 (4.6%) | 0 (0.0%) |
| $2,500 to $4,999 | 0 (0.0%) | 0 (0.0%) |
| $5,000 to $7,499 | 4 (0.5%) | 0 (0.0%) |
| $7,500 to $9,999 | 0 (0.0%) | 26 (3.5%) |
| $10,000 to $12,499 | 0 (0.0%) | 20 (2.7%) |
| $12,500 to $14,999 | 8 (0.9%) | 62 (8.4%) |
| $15,000 to $17,499 | 0 (0.0%) | 15 (2.0%) |
| $17,500 to $19,999 | 22 (2.6%) | 11 (1.5%) |
| $20,000 to $22,499 | 22 (2.6%) | 19 (2.6%) |
| $22,500 to $24,999 | 9 (1.1%) | 79 (10.6%) |
| $25,000 to $29,999 | 20 (2.4%) | 0 (0.0%) |
| $30,000 to $34,999 | 0 (0.0%) | 18 (2.4%) |
| $35,000 to $39,999 | 67 (7.9%) | 63 (8.5%) |
| $40,000 to $44,999 | 52 (6.1%) | 7 (0.9%) |
| $45,000 to $49,999 | 28 (3.3%) | 28 (3.8%) |
| $50,000 to $54,999 | 0 (0.0%) | 75 (10.1%) |
| $55,000 to $64,999 | 73 (8.6%) | 68 (9.2%) |
| $65,000 to $74,999 | 0 (0.0%) | 39 (5.3%) |
| $75,000 to $99,999 | 119 (14.0%) | 91 (12.3%) |
| $100,000+ | 385 (45.4%) | 121 (16.3%) |
| Total | 848 (100.0%) | 742 (100.0%) |
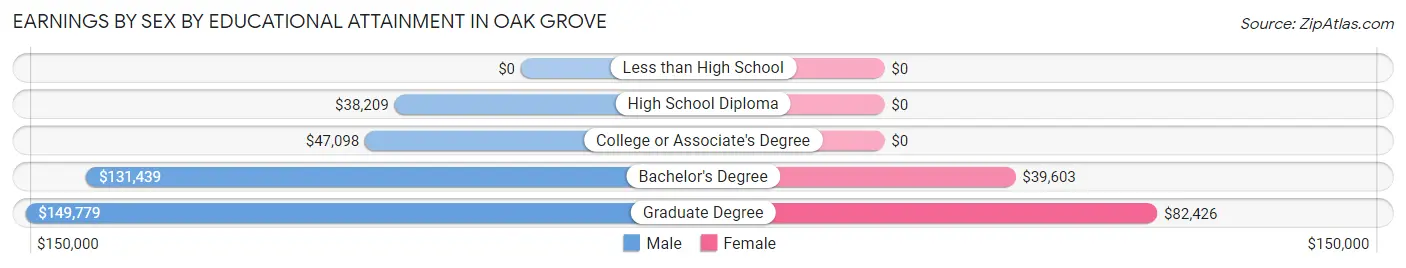
Earnings by Sex by Educational Attainment in Oak Grove
Average earnings in Oak Grove are $87,014 for men and $52,034 for women, a difference of 40.2%. Men with an educational attainment of graduate degree enjoy the highest average annual earnings of $149,779, while those with high school diploma education earn the least with $38,209. Women with an educational attainment of graduate degree earn the most with the average annual earnings of $82,426, while those with bachelor's degree education have the smallest earnings of $39,603.
| Educational Attainment | Male Income | Female Income |
| Less than High School | - | - |
| High School Diploma | $38,209 | $0 |
| College or Associate's Degree | $47,098 | $0 |
| Bachelor's Degree | $131,439 | $39,603 |
| Graduate Degree | $149,779 | $82,426 |
| Total | $87,014 | $52,034 |
Family Income in Oak Grove
Family Income Brackets in Oak Grove
According to the Oak Grove family income data, there are 262 families falling into the $200,000+ income range, which is the most common income bracket and makes up 36.9% of all families.
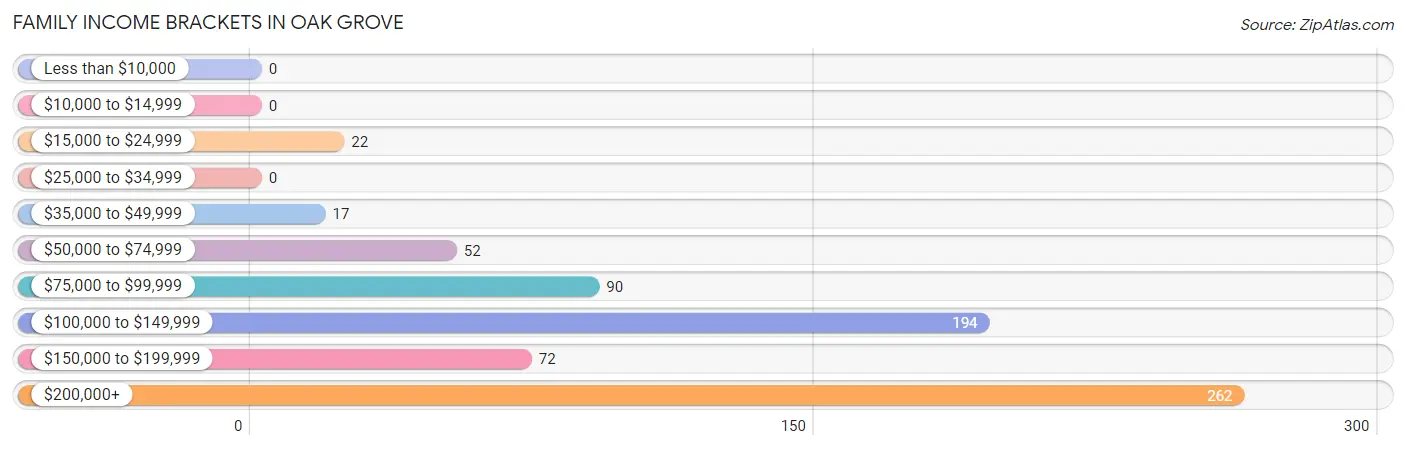
| Income Bracket | # Families | % Families |
| Less than $10,000 | 0 | 0.0% |
| $10,000 to $14,999 | 0 | 0.0% |
| $15,000 to $24,999 | 22 | 3.1% |
| $25,000 to $34,999 | 0 | 0.0% |
| $35,000 to $49,999 | 17 | 2.4% |
| $50,000 to $74,999 | 52 | 7.3% |
| $75,000 to $99,999 | 90 | 12.7% |
| $100,000 to $149,999 | 194 | 27.4% |
| $150,000 to $199,999 | 72 | 10.2% |
| $200,000+ | 262 | 37.0% |
Family Income by Famaliy Size in Oak Grove
2-person families (124 | 17.5%) account for the highest median family income in Oak Grove with $162,639 per family, while 2-person families (124 | 17.5%) have the highest median income of $81,320 per family member.
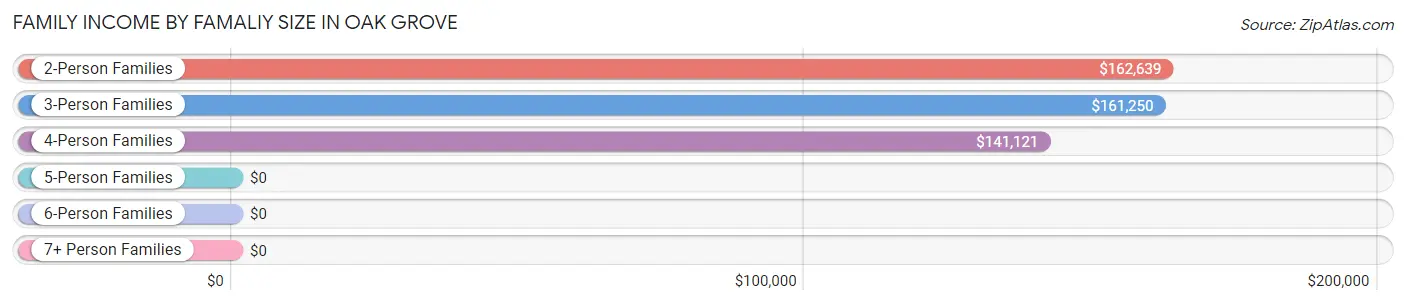
| Income Bracket | # Families | Median Income |
| 2-Person Families | 124 (17.5%) | $162,639 |
| 3-Person Families | 348 (49.1%) | $161,250 |
| 4-Person Families | 148 (20.9%) | $141,121 |
| 5-Person Families | 50 (7.0%) | $0 |
| 6-Person Families | 23 (3.2%) | $0 |
| 7+ Person Families | 16 (2.3%) | $0 |
| Total | 709 (100.0%) | $143,542 |
Family Income by Number of Earners in Oak Grove
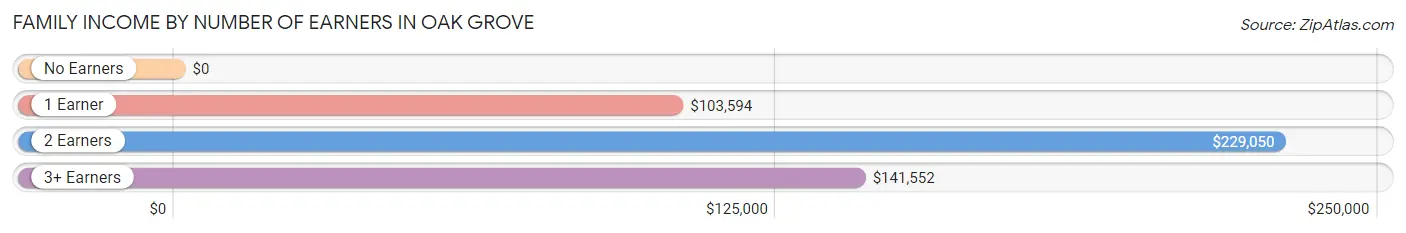
| Number of Earners | # Families | Median Income |
| No Earners | 13 (1.8%) | $0 |
| 1 Earner | 190 (26.8%) | $103,594 |
| 2 Earners | 356 (50.2%) | $229,050 |
| 3+ Earners | 150 (21.2%) | $141,552 |
| Total | 709 (100.0%) | $143,542 |
Household Income in Oak Grove
Household Income Brackets in Oak Grove
With 296 households falling in the category, the $200,000+ income range is the most frequent in Oak Grove, accounting for 38.7% of all households.
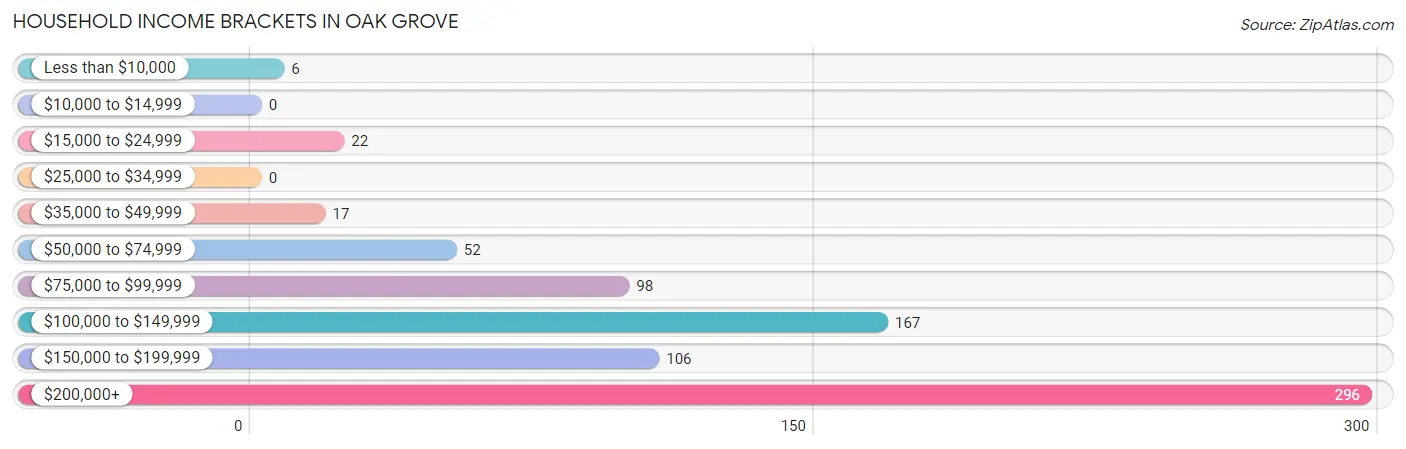
| Income Bracket | # Households | % Households |
| Less than $10,000 | 6 | 0.8% |
| $10,000 to $14,999 | 0 | 0.0% |
| $15,000 to $24,999 | 22 | 2.9% |
| $25,000 to $34,999 | 0 | 0.0% |
| $35,000 to $49,999 | 17 | 2.2% |
| $50,000 to $74,999 | 52 | 6.8% |
| $75,000 to $99,999 | 98 | 12.8% |
| $100,000 to $149,999 | 167 | 21.9% |
| $150,000 to $199,999 | 106 | 13.9% |
| $200,000+ | 296 | 38.7% |
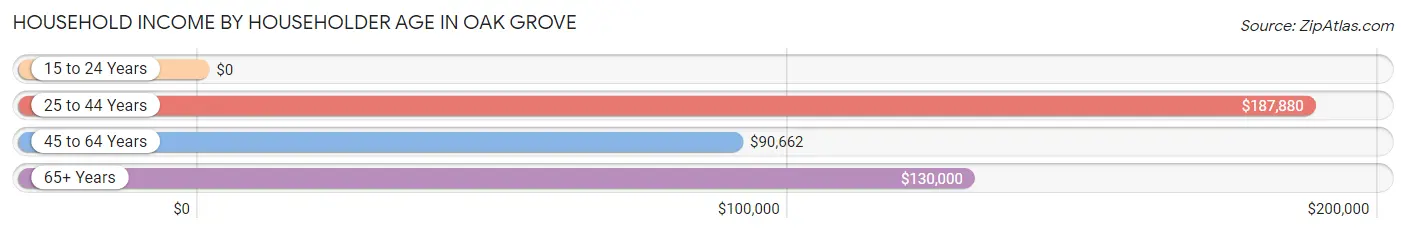
Household Income by Householder Age in Oak Grove
The median household income in Oak Grove is $175,161, with the highest median household income of $187,880 found in the 25 to 44 years age bracket for the primary householder. A total of 493 households (64.5%) fall into this category.
| Income Bracket | # Households | Median Income |
| 15 to 24 Years | 0 (0.0%) | $0 |
| 25 to 44 Years | 493 (64.5%) | $187,880 |
| 45 to 64 Years | 223 (29.2%) | $90,662 |
| 65+ Years | 48 (6.3%) | $130,000 |
| Total | 764 (100.0%) | $175,161 |
Poverty in Oak Grove
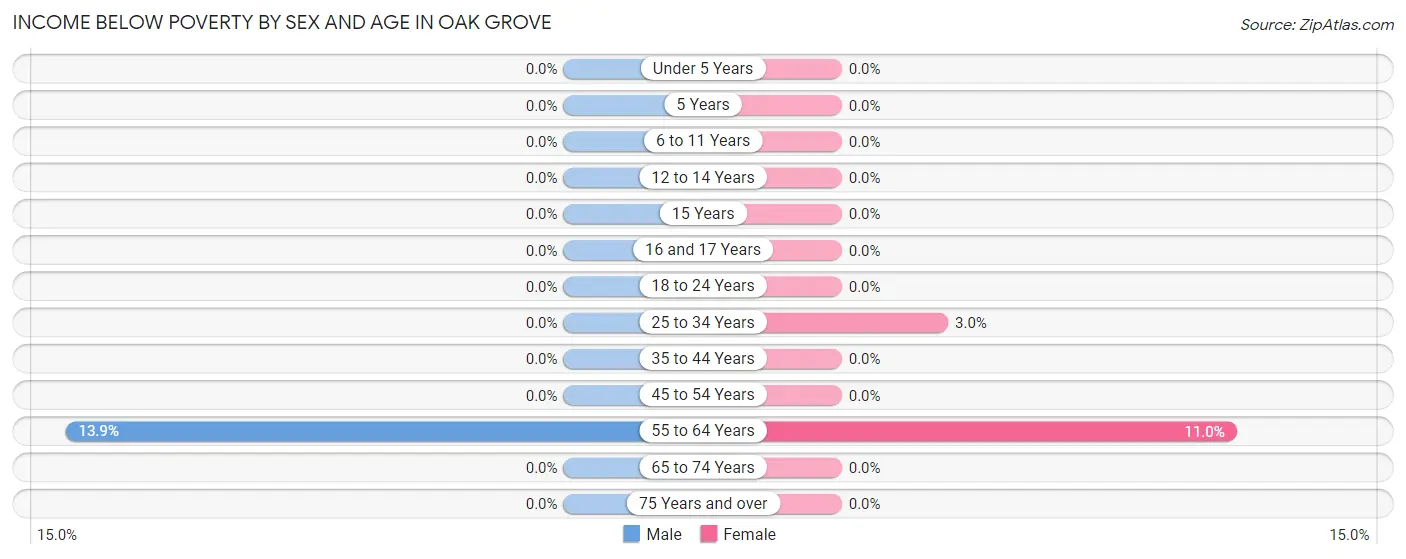
Income Below Poverty by Sex and Age in Oak Grove
With 2.2% poverty level for males and 2.4% for females among the residents of Oak Grove, 55 to 64 year old males and 55 to 64 year old females are the most vulnerable to poverty, with 28 males (13.9%) and 20 females (11.0%) in their respective age groups living below the poverty level.
| Age Bracket | Male | Female |
| Under 5 Years | 0 (0.0%) | 0 (0.0%) |
| 5 Years | 0 (0.0%) | 0 (0.0%) |
| 6 to 11 Years | 0 (0.0%) | 0 (0.0%) |
| 12 to 14 Years | 0 (0.0%) | 0 (0.0%) |
| 15 Years | 0 (0.0%) | 0 (0.0%) |
| 16 and 17 Years | 0 (0.0%) | 0 (0.0%) |
| 18 to 24 Years | 0 (0.0%) | 0 (0.0%) |
| 25 to 34 Years | 0 (0.0%) | 11 (3.0%) |
| 35 to 44 Years | 0 (0.0%) | 0 (0.0%) |
| 45 to 54 Years | 0 (0.0%) | 0 (0.0%) |
| 55 to 64 Years | 28 (13.9%) | 20 (11.0%) |
| 65 to 74 Years | 0 (0.0%) | 0 (0.0%) |
| 75 Years and over | 0 (0.0%) | 0 (0.0%) |
| Total | 28 (2.2%) | 31 (2.4%) |
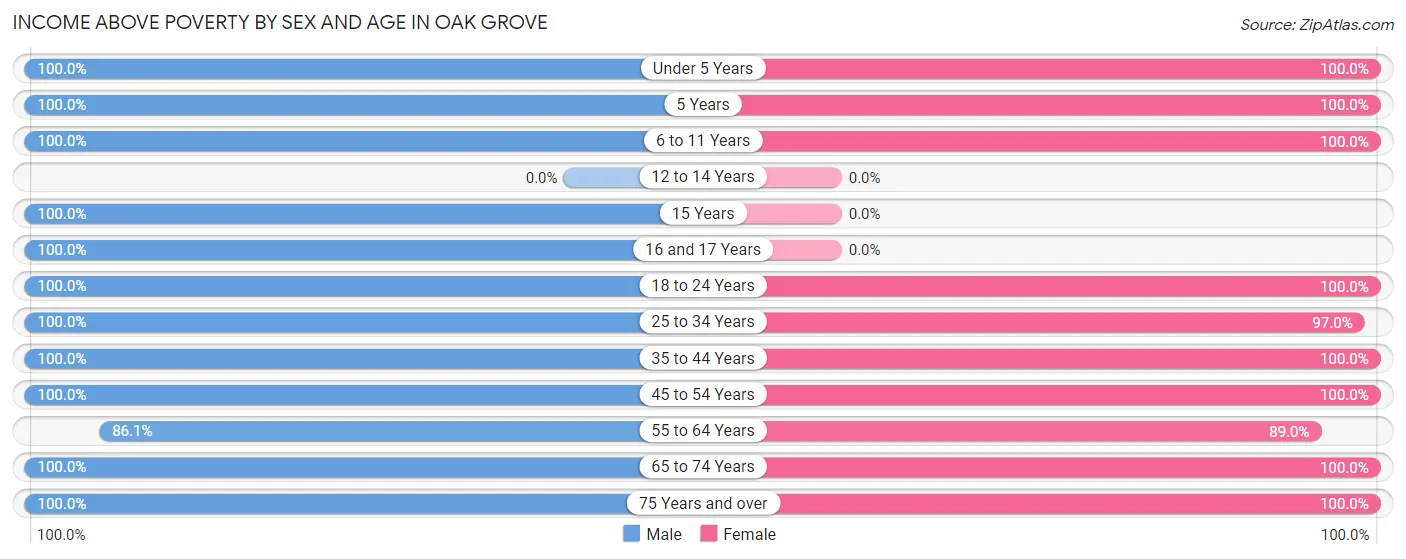
Income Above Poverty by Sex and Age in Oak Grove
According to the poverty statistics in Oak Grove, males aged under 5 years and females aged under 5 years are the age groups that are most secure financially, with 100.0% of males and 100.0% of females in these age groups living above the poverty line.
| Age Bracket | Male | Female |
| Under 5 Years | 126 (100.0%) | 222 (100.0%) |
| 5 Years | 4 (100.0%) | 1 (100.0%) |
| 6 to 11 Years | 18 (100.0%) | 76 (100.0%) |
| 12 to 14 Years | 0 (0.0%) | 0 (0.0%) |
| 15 Years | 21 (100.0%) | 0 (0.0%) |
| 16 and 17 Years | 20 (100.0%) | 0 (0.0%) |
| 18 to 24 Years | 222 (100.0%) | 50 (100.0%) |
| 25 to 34 Years | 278 (100.0%) | 360 (97.0%) |
| 35 to 44 Years | 234 (100.0%) | 90 (100.0%) |
| 45 to 54 Years | 76 (100.0%) | 177 (100.0%) |
| 55 to 64 Years | 174 (86.1%) | 162 (89.0%) |
| 65 to 74 Years | 27 (100.0%) | 87 (100.0%) |
| 75 Years and over | 30 (100.0%) | 19 (100.0%) |
| Total | 1,230 (97.8%) | 1,244 (97.6%) |
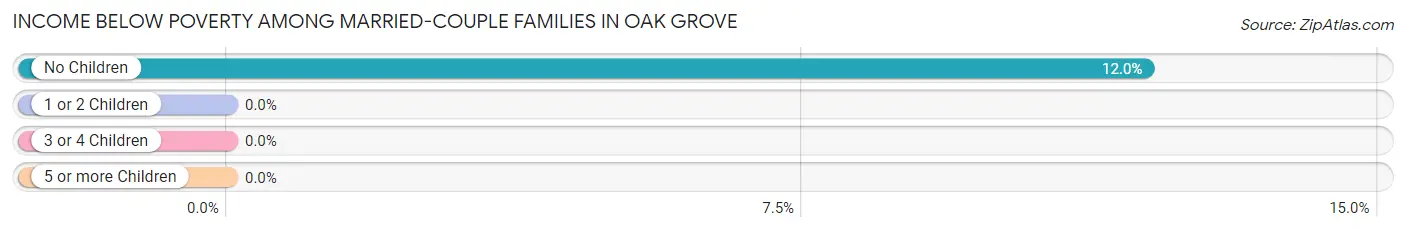
Income Below Poverty Among Married-Couple Families in Oak Grove
The poverty statistics for married-couple families in Oak Grove show that 4.3% or 22 of the total 507 families live below the poverty line. Families with no children have the highest poverty rate of 12.0%, comprising of 22 families. On the other hand, families with 1 or 2 children have the lowest poverty rate of 0.0%, which includes 0 families.
| Children | Above Poverty | Below Poverty |
| No Children | 162 (88.0%) | 22 (12.0%) |
| 1 or 2 Children | 291 (100.0%) | 0 (0.0%) |
| 3 or 4 Children | 32 (100.0%) | 0 (0.0%) |
| 5 or more Children | 0 (0.0%) | 0 (0.0%) |
| Total | 485 (95.7%) | 22 (4.3%) |
Income Below Poverty Among Single-Parent Households in Oak Grove
| Children | Single Father | Single Mother |
| No Children | 0 (0.0%) | 0 (0.0%) |
| 1 or 2 Children | 0 (0.0%) | 0 (0.0%) |
| 3 or 4 Children | 0 (0.0%) | 0 (0.0%) |
| 5 or more Children | 0 (0.0%) | 0 (0.0%) |
| Total | 0 (0.0%) | 0 (0.0%) |
Income Below Poverty Among Married-Couple vs Single-Parent Households in Oak Grove
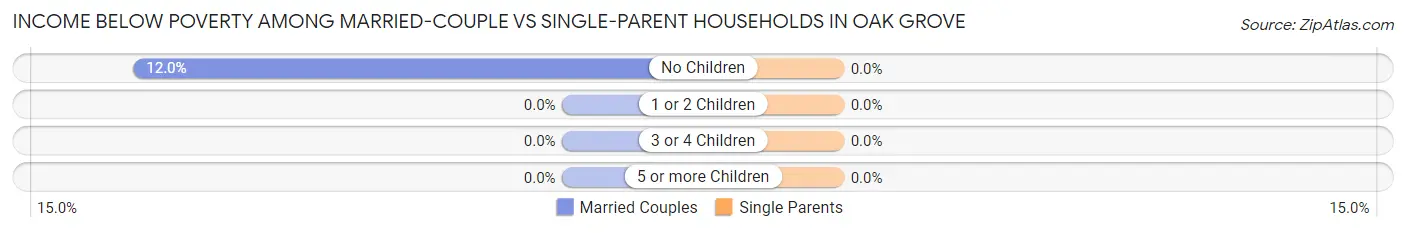
| Children | Married-Couple Families | Single-Parent Households |
| No Children | 22 (12.0%) | 0 (0.0%) |
| 1 or 2 Children | 0 (0.0%) | 0 (0.0%) |
| 3 or 4 Children | 0 (0.0%) | 0 (0.0%) |
| 5 or more Children | 0 (0.0%) | 0 (0.0%) |
| Total | 22 (4.3%) | 0 (0.0%) |
Race in Oak Grove
The most populous races in Oak Grove are White / Caucasian (1,062 | 41.9%), Asian (979 | 38.7%), and Hispanic or Latino (438 | 17.3%).
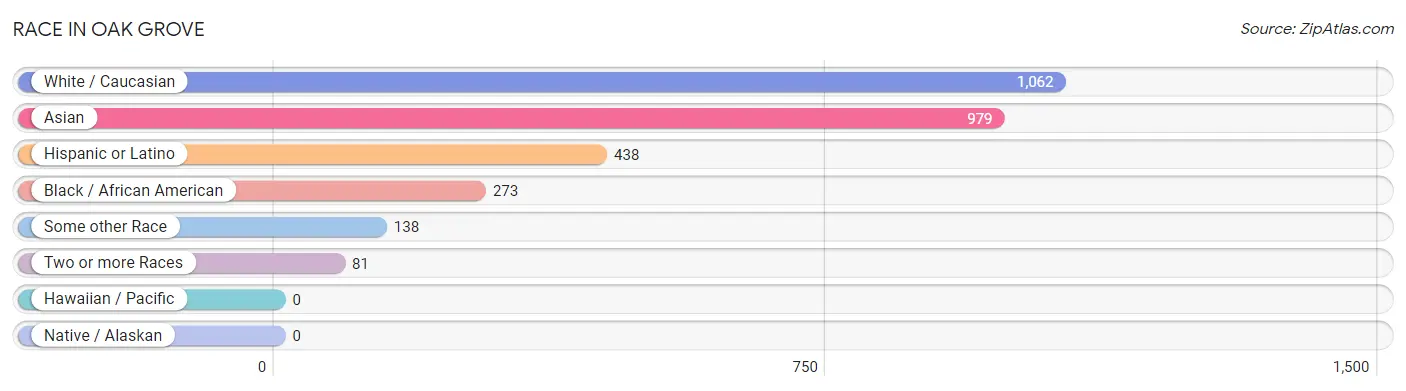
| Race | # Population | % Population |
| Asian | 979 | 38.7% |
| Black / African American | 273 | 10.8% |
| Hawaiian / Pacific | 0 | 0.0% |
| Hispanic or Latino | 438 | 17.3% |
| Native / Alaskan | 0 | 0.0% |
| White / Caucasian | 1,062 | 41.9% |
| Two or more Races | 81 | 3.2% |
| Some other Race | 138 | 5.4% |
| Total | 2,533 | 100.0% |
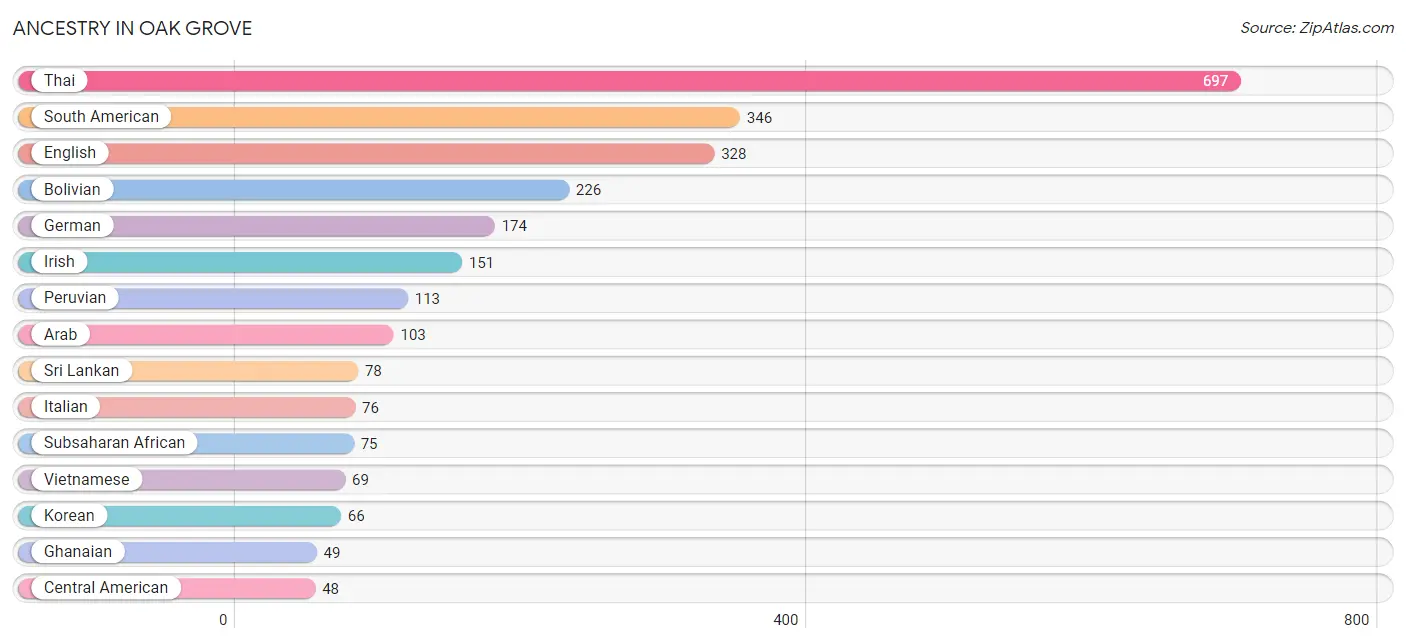
Ancestry in Oak Grove
The most populous ancestries reported in Oak Grove are Thai (697 | 27.5%), South American (346 | 13.7%), English (328 | 13.0%), Bolivian (226 | 8.9%), and German (174 | 6.9%), together accounting for 69.9% of all Oak Grove residents.
| Ancestry | # Population | % Population |
| American | 35 | 1.4% |
| Arab | 103 | 4.1% |
| Bhutanese | 9 | 0.4% |
| Bolivian | 226 | 8.9% |
| British | 14 | 0.5% |
| Central American | 48 | 1.9% |
| Central American Indian | 12 | 0.5% |
| Czech | 6 | 0.2% |
| Eastern European | 26 | 1.0% |
| English | 328 | 13.0% |
| European | 24 | 0.9% |
| French | 17 | 0.7% |
| German | 174 | 6.9% |
| Ghanaian | 49 | 1.9% |
| Indian (Asian) | 34 | 1.3% |
| Iraqi | 18 | 0.7% |
| Irish | 151 | 6.0% |
| Italian | 76 | 3.0% |
| Korean | 66 | 2.6% |
| Lithuanian | 17 | 0.7% |
| Mexican | 33 | 1.3% |
| Nicaraguan | 6 | 0.2% |
| Nigerian | 26 | 1.0% |
| Peruvian | 113 | 4.5% |
| Polish | 35 | 1.4% |
| Salvadoran | 42 | 1.7% |
| Scotch-Irish | 12 | 0.5% |
| Scottish | 5 | 0.2% |
| South American | 346 | 13.7% |
| South American Indian | 9 | 0.4% |
| Sri Lankan | 78 | 3.1% |
| Subsaharan African | 75 | 3.0% |
| Syrian | 8 | 0.3% |
| Thai | 697 | 27.5% |
| Turkish | 15 | 0.6% |
| Venezuelan | 7 | 0.3% |
| Vietnamese | 69 | 2.7% | View All 37 Rows |
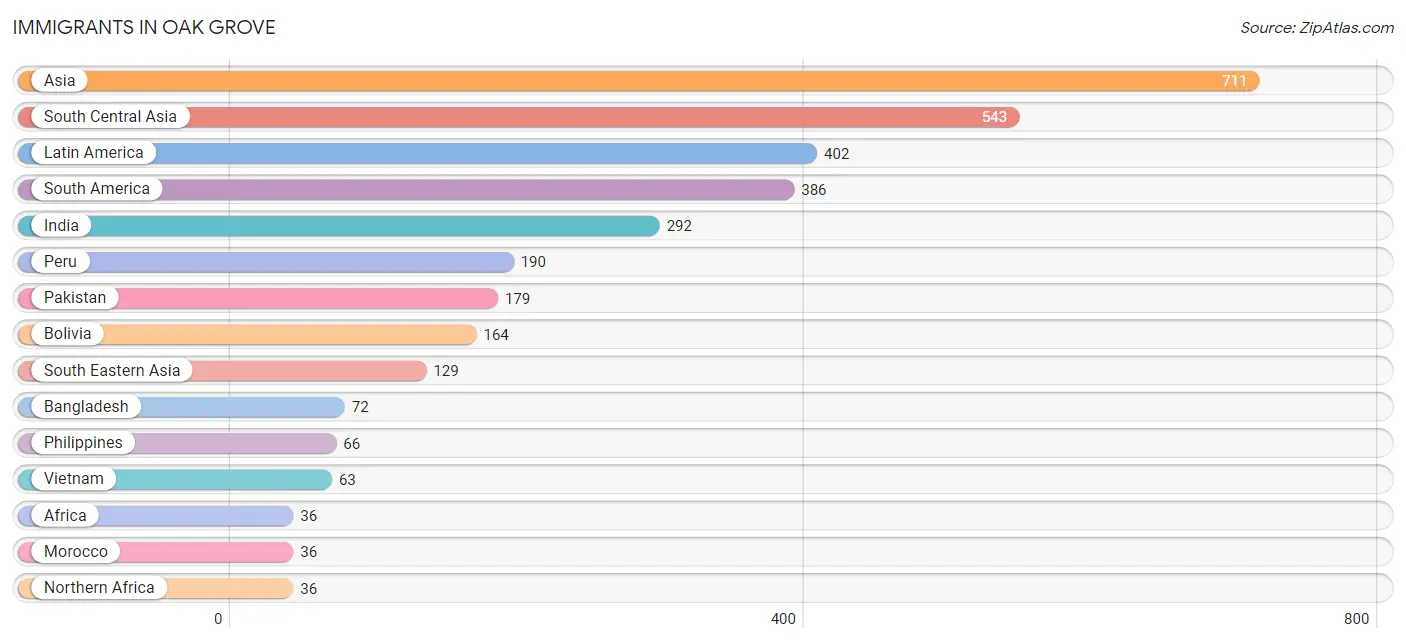
Immigrants in Oak Grove
The most numerous immigrant groups reported in Oak Grove came from Asia (711 | 28.1%), South Central Asia (543 | 21.4%), Latin America (402 | 15.9%), South America (386 | 15.2%), and India (292 | 11.5%), together accounting for 92.1% of all Oak Grove residents.
| Immigration Origin | # Population | % Population |
| Africa | 36 | 1.4% |
| Asia | 711 | 28.1% |
| Bangladesh | 72 | 2.8% |
| Bolivia | 164 | 6.5% |
| Central America | 16 | 0.6% |
| Chile | 14 | 0.5% |
| China | 13 | 0.5% |
| Eastern Asia | 13 | 0.5% |
| Europe | 29 | 1.1% |
| Germany | 15 | 0.6% |
| India | 292 | 11.5% |
| Iraq | 18 | 0.7% |
| Latin America | 402 | 15.9% |
| Mexico | 10 | 0.4% |
| Morocco | 36 | 1.4% |
| Nicaragua | 6 | 0.2% |
| Northern Africa | 36 | 1.4% |
| Northern Europe | 14 | 0.5% |
| Pakistan | 179 | 7.1% |
| Peru | 190 | 7.5% |
| Philippines | 66 | 2.6% |
| South America | 386 | 15.2% |
| South Central Asia | 543 | 21.4% |
| South Eastern Asia | 129 | 5.1% |
| Syria | 8 | 0.3% |
| Venezuela | 18 | 0.7% |
| Vietnam | 63 | 2.5% |
| Western Asia | 26 | 1.0% |
| Western Europe | 15 | 0.6% | View All 29 Rows |
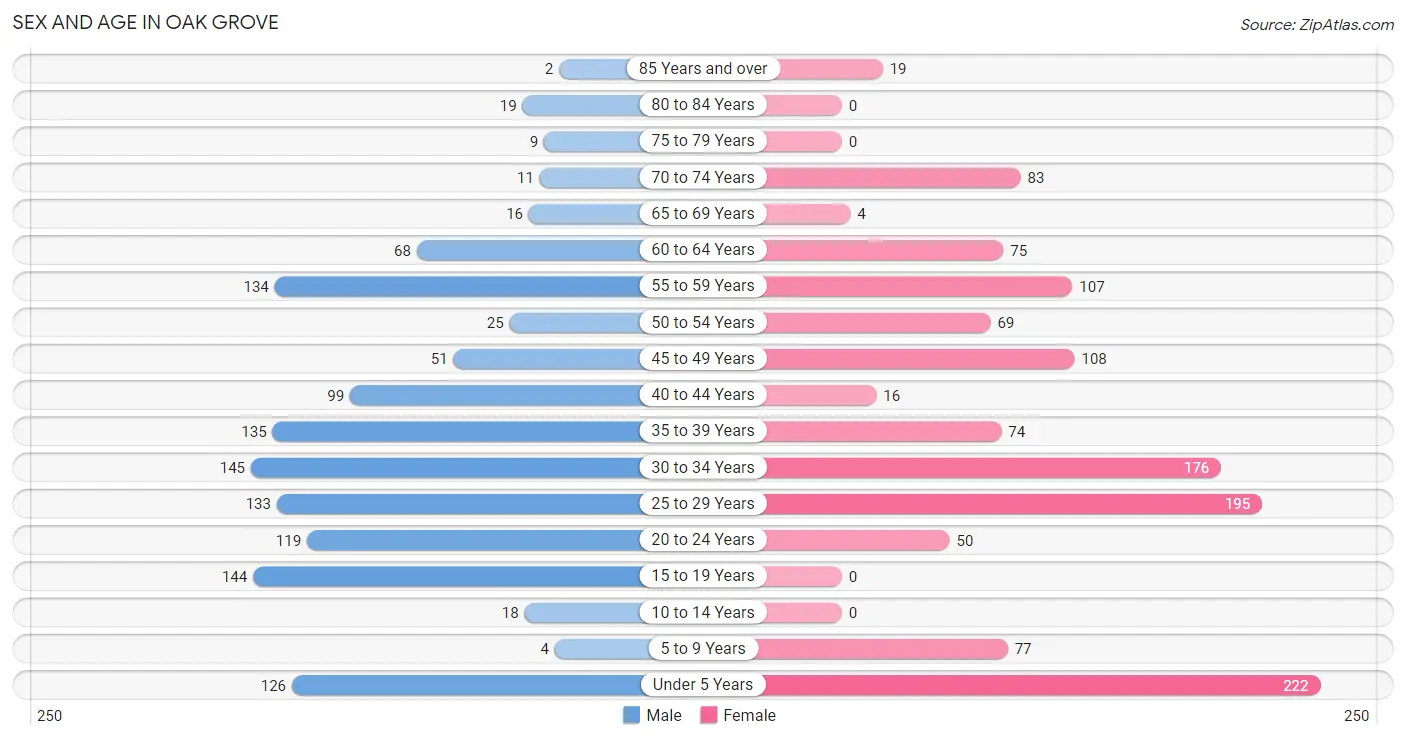
Sex and Age in Oak Grove
Sex and Age in Oak Grove
The most populous age groups in Oak Grove are 30 to 34 Years (145 | 11.5%) for men and Under 5 Years (222 | 17.4%) for women.
| Age Bracket | Male | Female |
| Under 5 Years | 126 (10.0%) | 222 (17.4%) |
| 5 to 9 Years | 4 (0.3%) | 77 (6.0%) |
| 10 to 14 Years | 18 (1.4%) | 0 (0.0%) |
| 15 to 19 Years | 144 (11.5%) | 0 (0.0%) |
| 20 to 24 Years | 119 (9.5%) | 50 (3.9%) |
| 25 to 29 Years | 133 (10.6%) | 195 (15.3%) |
| 30 to 34 Years | 145 (11.5%) | 176 (13.8%) |
| 35 to 39 Years | 135 (10.7%) | 74 (5.8%) |
| 40 to 44 Years | 99 (7.9%) | 16 (1.3%) |
| 45 to 49 Years | 51 (4.1%) | 108 (8.5%) |
| 50 to 54 Years | 25 (2.0%) | 69 (5.4%) |
| 55 to 59 Years | 134 (10.6%) | 107 (8.4%) |
| 60 to 64 Years | 68 (5.4%) | 75 (5.9%) |
| 65 to 69 Years | 16 (1.3%) | 4 (0.3%) |
| 70 to 74 Years | 11 (0.9%) | 83 (6.5%) |
| 75 to 79 Years | 9 (0.7%) | 0 (0.0%) |
| 80 to 84 Years | 19 (1.5%) | 0 (0.0%) |
| 85 Years and over | 2 (0.2%) | 19 (1.5%) |
| Total | 1,258 (100.0%) | 1,275 (100.0%) |
Families and Households in Oak Grove
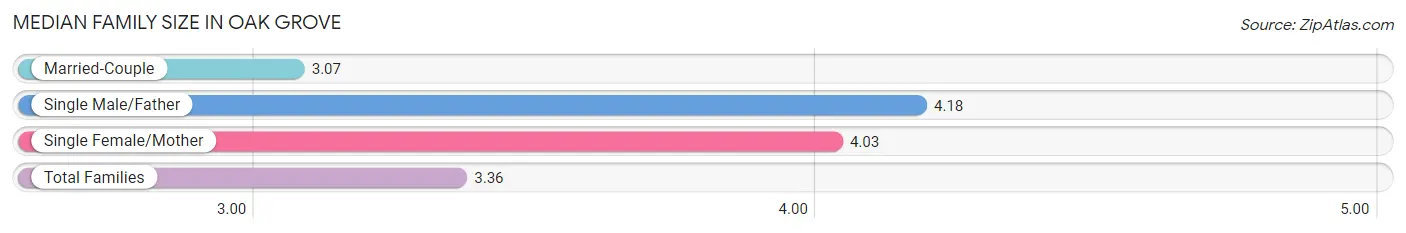
Median Family Size in Oak Grove
The median family size in Oak Grove is 3.36 persons per family, with single male/father families (57 | 8.0%) accounting for the largest median family size of 4.18 persons per family. On the other hand, married-couple families (507 | 71.5%) represent the smallest median family size with 3.07 persons per family.
| Family Type | # Families | Family Size |
| Married-Couple | 507 (71.5%) | 3.07 |
| Single Male/Father | 57 (8.0%) | 4.18 |
| Single Female/Mother | 145 (20.4%) | 4.03 |
| Total Families | 709 (100.0%) | 3.36 |
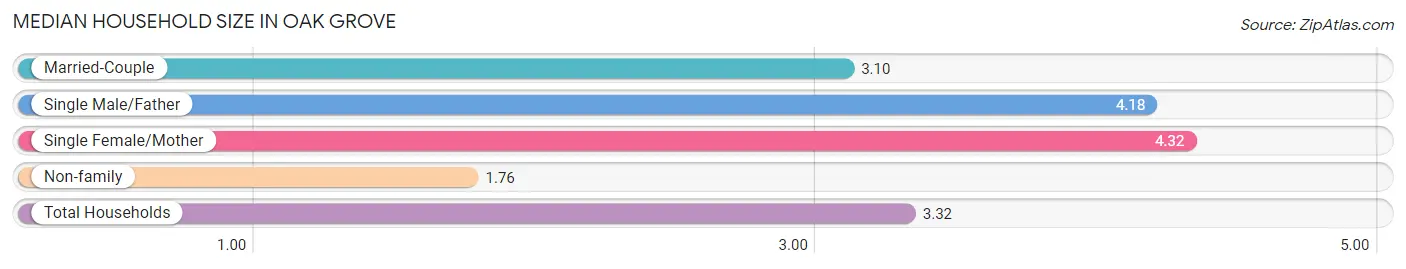
Median Household Size in Oak Grove
The median household size in Oak Grove is 3.32 persons per household, with single female/mother households (145 | 19.0%) accounting for the largest median household size of 4.32 persons per household. non-family households (55 | 7.2%) represent the smallest median household size with 1.76 persons per household.
| Household Type | # Households | Household Size |
| Married-Couple | 507 (66.4%) | 3.10 |
| Single Male/Father | 57 (7.5%) | 4.18 |
| Single Female/Mother | 145 (19.0%) | 4.32 |
| Non-family | 55 (7.2%) | 1.76 |
| Total Households | 764 (100.0%) | 3.32 |
Household Size by Marriage Status in Oak Grove
Out of a total of 764 households in Oak Grove, 709 (92.8%) are family households, while 55 (7.2%) are nonfamily households. The most numerous type of family households are 3-person households, comprising 311, and the most common type of nonfamily households are 2-person households, comprising 41.
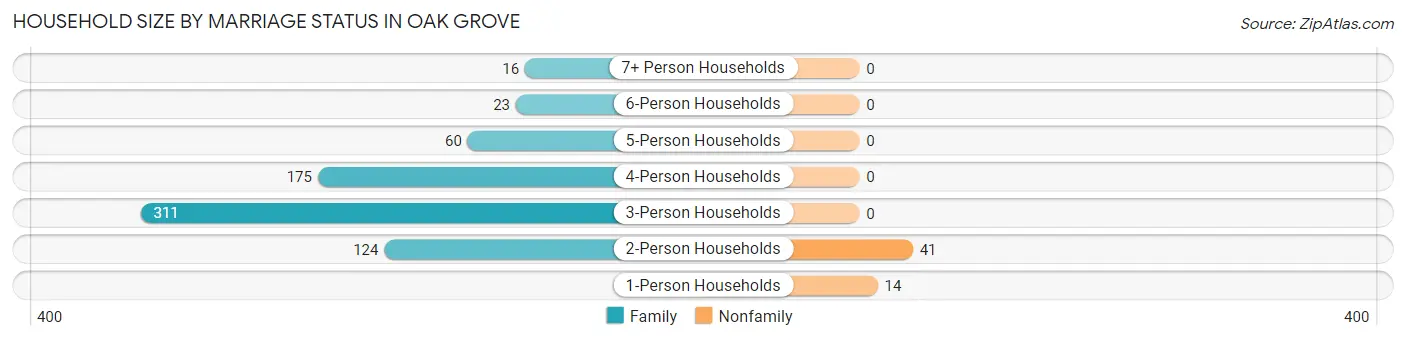
| Household Size | Family Households | Nonfamily Households |
| 1-Person Households | - | 14 (1.8%) |
| 2-Person Households | 124 (16.2%) | 41 (5.4%) |
| 3-Person Households | 311 (40.7%) | 0 (0.0%) |
| 4-Person Households | 175 (22.9%) | 0 (0.0%) |
| 5-Person Households | 60 (7.9%) | 0 (0.0%) |
| 6-Person Households | 23 (3.0%) | 0 (0.0%) |
| 7+ Person Households | 16 (2.1%) | 0 (0.0%) |
| Total | 709 (92.8%) | 55 (7.2%) |
Female Fertility in Oak Grove
Fertility by Age in Oak Grove
Average fertility rate in Oak Grove is 69.0 births per 1,000 women. Women in the age bracket of 20 to 34 years have the highest fertility rate with 88.0 births per 1,000 women. Women in the age bracket of 20 to 34 years acount for 86.1% of all women with births.
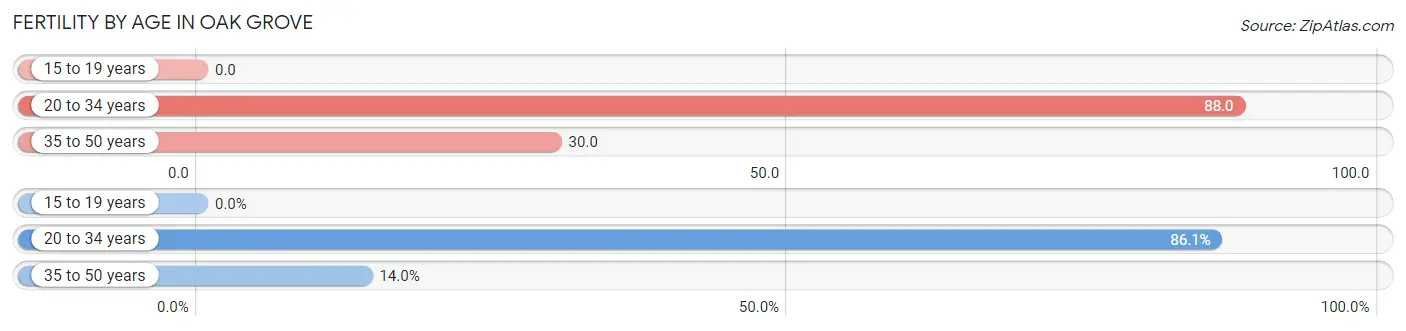
| Age Bracket | Women with Births | Births / 1,000 Women |
| 15 to 19 years | 0 (0.0%) | 0.0 |
| 20 to 34 years | 37 (86.1%) | 88.0 |
| 35 to 50 years | 6 (14.0%) | 30.0 |
| Total | 43 (100.0%) | 69.0 |
Fertility by Age by Marriage Status in Oak Grove
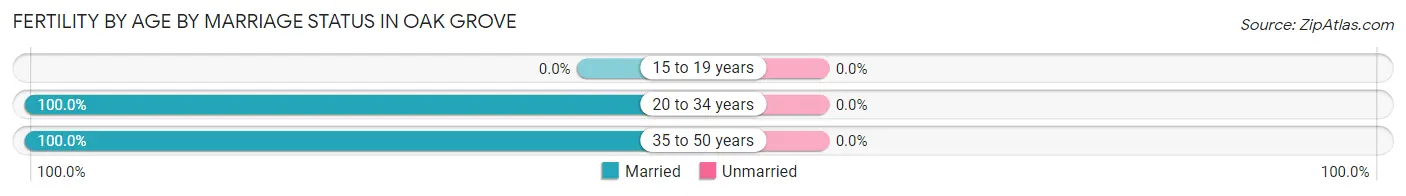
| Age Bracket | Married | Unmarried |
| 15 to 19 years | 0 (0.0%) | 0 (0.0%) |
| 20 to 34 years | 37 (100.0%) | 0 (0.0%) |
| 35 to 50 years | 6 (100.0%) | 0 (0.0%) |
| Total | 43 (100.0%) | 0 (0.0%) |
Fertility by Education in Oak Grove
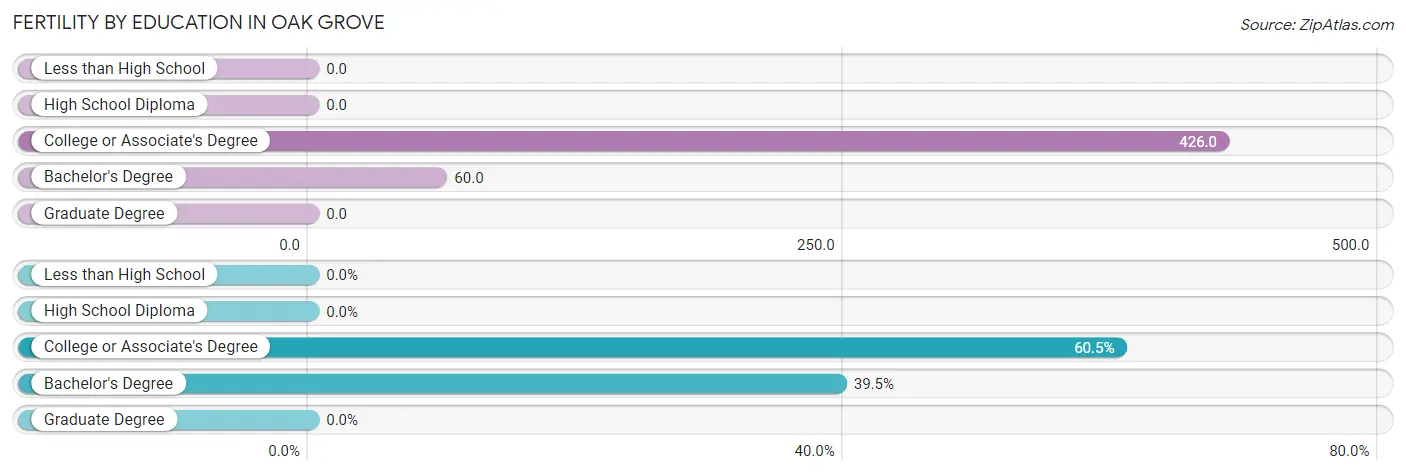
| Educational Attainment | Women with Births | Births / 1,000 Women |
| Less than High School | 0 (0.0%) | 0.0 |
| High School Diploma | 0 (0.0%) | 0.0 |
| College or Associate's Degree | 26 (60.5%) | 426.0 |
| Bachelor's Degree | 17 (39.5%) | 60.0 |
| Graduate Degree | 0 (0.0%) | 0.0 |
| Total | 43 (100.0%) | 69.0 |
Fertility by Education by Marriage Status in Oak Grove
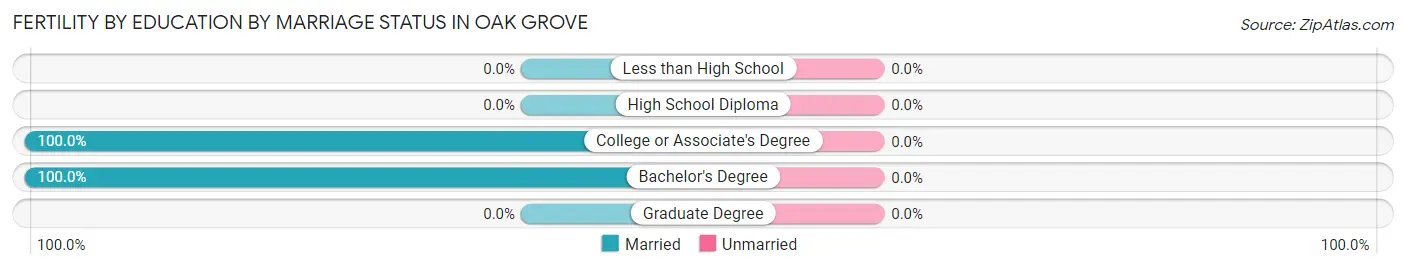
| Educational Attainment | Married | Unmarried |
| Less than High School | 0 (0.0%) | 0 (0.0%) |
| High School Diploma | 0 (0.0%) | 0 (0.0%) |
| College or Associate's Degree | 26 (100.0%) | 0 (0.0%) |
| Bachelor's Degree | 17 (100.0%) | 0 (0.0%) |
| Graduate Degree | 0 (0.0%) | 0 (0.0%) |
| Total | 43 (100.0%) | 0 (0.0%) |
Employment Characteristics in Oak Grove
Employment by Class of Employer in Oak Grove
Among the 1,520 employed individuals in Oak Grove, private company employees (1,167 | 76.8%), federal government employees (124 | 8.2%), and self-employed (not incorporated) (79 | 5.2%) make up the most common classes of employment.
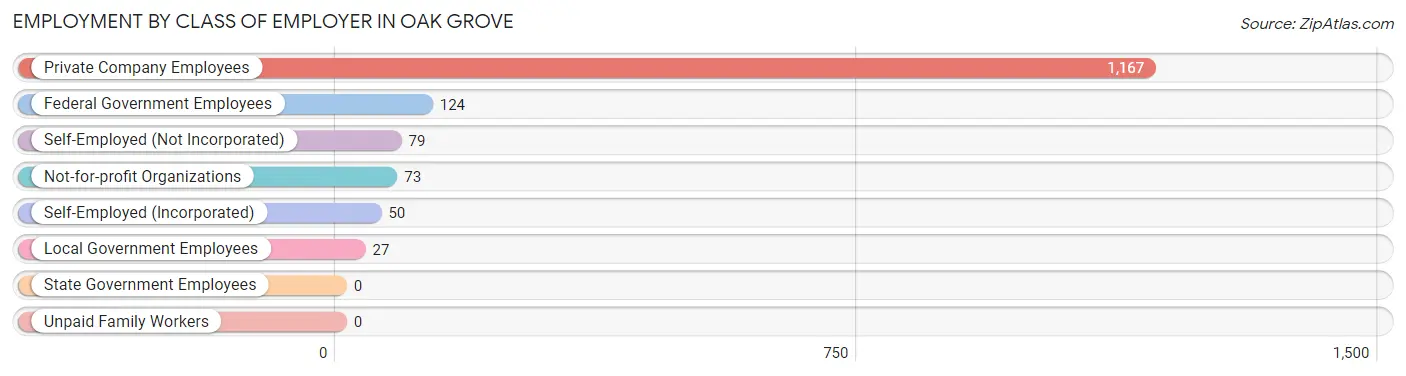
| Employer Class | # Employees | % Employees |
| Private Company Employees | 1,167 | 76.8% |
| Self-Employed (Incorporated) | 50 | 3.3% |
| Self-Employed (Not Incorporated) | 79 | 5.2% |
| Not-for-profit Organizations | 73 | 4.8% |
| Local Government Employees | 27 | 1.8% |
| State Government Employees | 0 | 0.0% |
| Federal Government Employees | 124 | 8.2% |
| Unpaid Family Workers | 0 | 0.0% |
| Total | 1,520 | 100.0% |
Employment Status by Age in Oak Grove
According to the labor force statistics for Oak Grove, out of the total population over 16 years of age (2,065), 77.0% or 1,590 individuals are in the labor force, with 0.9% or 14 of them unemployed. The age group with the highest labor force participation rate is 25 to 29 years, with 95.4% or 313 individuals in the labor force. Within the labor force, the 20 to 24 years age range has the highest percentage of unemployed individuals, with 17.2% or 15 of them being unemployed.
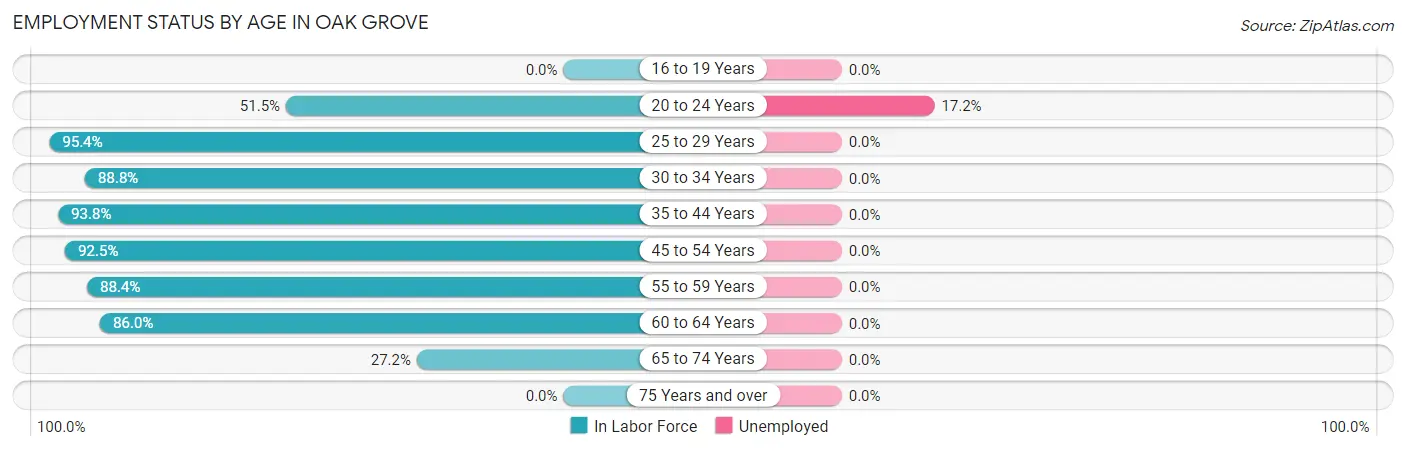
| Age Bracket | In Labor Force | Unemployed |
| 16 to 19 Years | 0 (0.0%) | 0 (0.0%) |
| 20 to 24 Years | 87 (51.5%) | 15 (17.2%) |
| 25 to 29 Years | 313 (95.4%) | 0 (0.0%) |
| 30 to 34 Years | 285 (88.8%) | 0 (0.0%) |
| 35 to 44 Years | 304 (93.8%) | 0 (0.0%) |
| 45 to 54 Years | 234 (92.5%) | 0 (0.0%) |
| 55 to 59 Years | 213 (88.4%) | 0 (0.0%) |
| 60 to 64 Years | 123 (86.0%) | 0 (0.0%) |
| 65 to 74 Years | 31 (27.2%) | 0 (0.0%) |
| 75 Years and over | 0 (0.0%) | 0 (0.0%) |
| Total | 1,590 (77.0%) | 14 (0.9%) |
Employment Status by Educational Attainment in Oak Grove
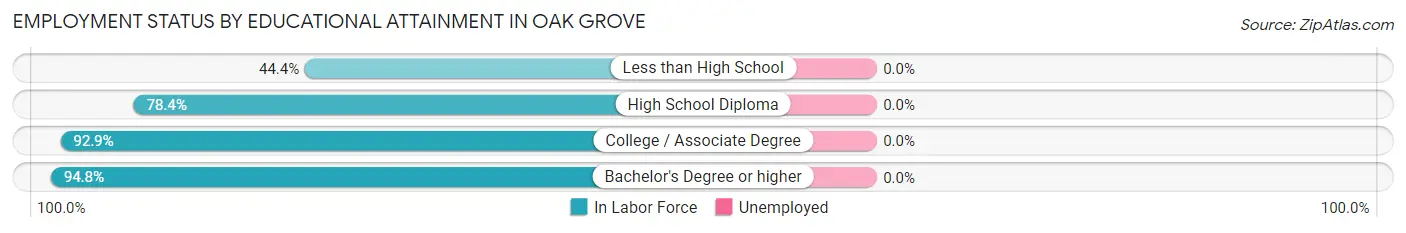
| Educational Attainment | In Labor Force | Unemployed |
| Less than High School | 16 (44.4%) | 0 (0.0%) |
| High School Diploma | 149 (78.4%) | 0 (0.0%) |
| College / Associate Degree | 261 (92.9%) | 0 (0.0%) |
| Bachelor's Degree or higher | 1,046 (94.8%) | 0 (0.0%) |
| Total | 1,472 (91.4%) | 0 (0.0%) |
Employment Occupations by Sex in Oak Grove
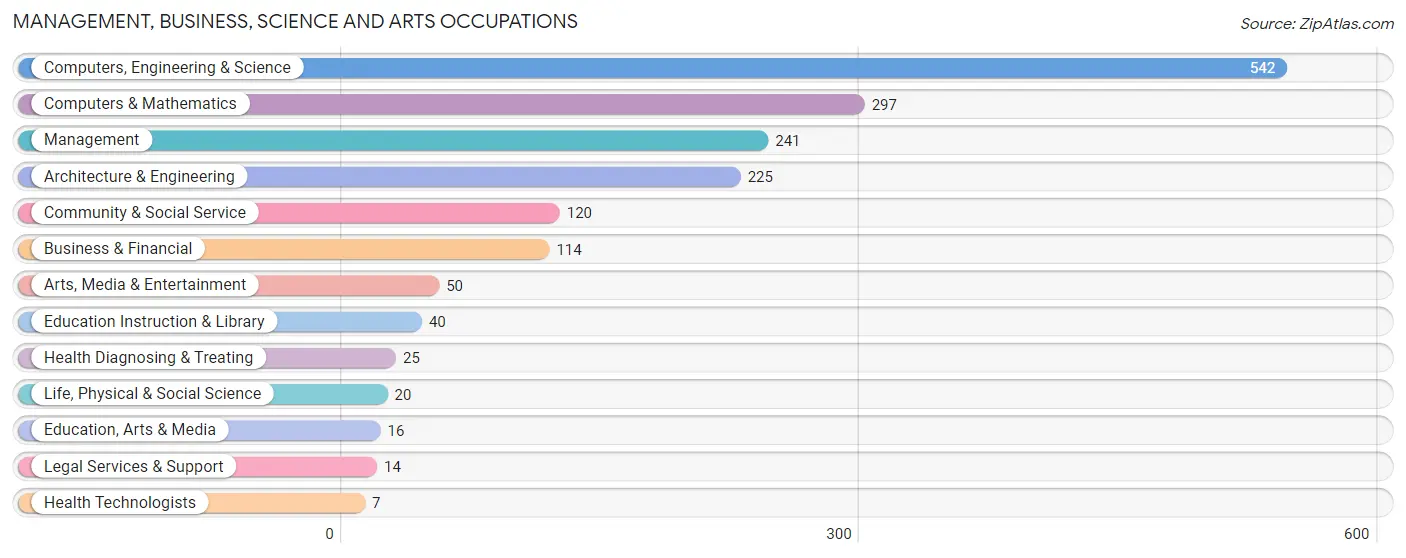
Management, Business, Science and Arts Occupations
The most common Management, Business, Science and Arts occupations in Oak Grove are Computers, Engineering & Science (542 | 34.4%), Computers & Mathematics (297 | 18.9%), Management (241 | 15.3%), Architecture & Engineering (225 | 14.3%), and Community & Social Service (120 | 7.6%).
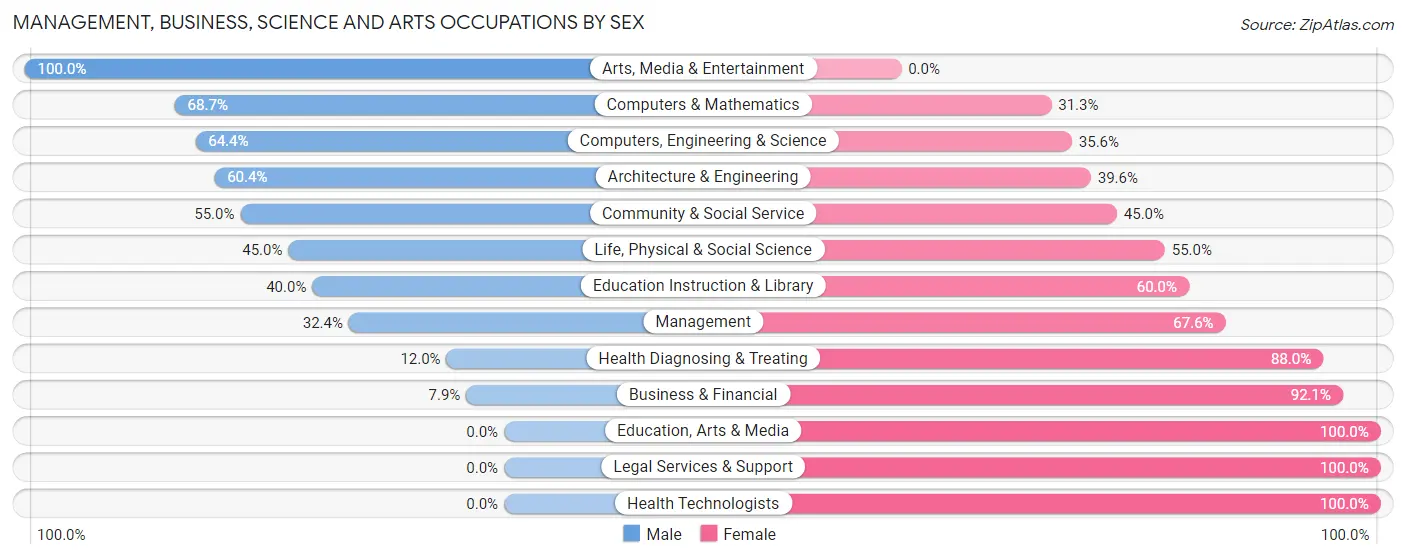
Management, Business, Science and Arts Occupations by Sex
Within the Management, Business, Science and Arts occupations in Oak Grove, the most male-oriented occupations are Arts, Media & Entertainment (100.0%), Computers & Mathematics (68.7%), and Computers, Engineering & Science (64.4%), while the most female-oriented occupations are Education, Arts & Media (100.0%), Legal Services & Support (100.0%), and Health Technologists (100.0%).
| Occupation | Male | Female |
| Management | 78 (32.4%) | 163 (67.6%) |
| Business & Financial | 9 (7.9%) | 105 (92.1%) |
| Computers, Engineering & Science | 349 (64.4%) | 193 (35.6%) |
| Computers & Mathematics | 204 (68.7%) | 93 (31.3%) |
| Architecture & Engineering | 136 (60.4%) | 89 (39.6%) |
| Life, Physical & Social Science | 9 (45.0%) | 11 (55.0%) |
| Community & Social Service | 66 (55.0%) | 54 (45.0%) |
| Education, Arts & Media | 0 (0.0%) | 16 (100.0%) |
| Legal Services & Support | 0 (0.0%) | 14 (100.0%) |
| Education Instruction & Library | 16 (40.0%) | 24 (60.0%) |
| Arts, Media & Entertainment | 50 (100.0%) | 0 (0.0%) |
| Health Diagnosing & Treating | 3 (12.0%) | 22 (88.0%) |
| Health Technologists | 0 (0.0%) | 7 (100.0%) |
| Total (Category) | 505 (48.5%) | 537 (51.5%) |
| Total (Overall) | 833 (52.9%) | 742 (47.1%) |
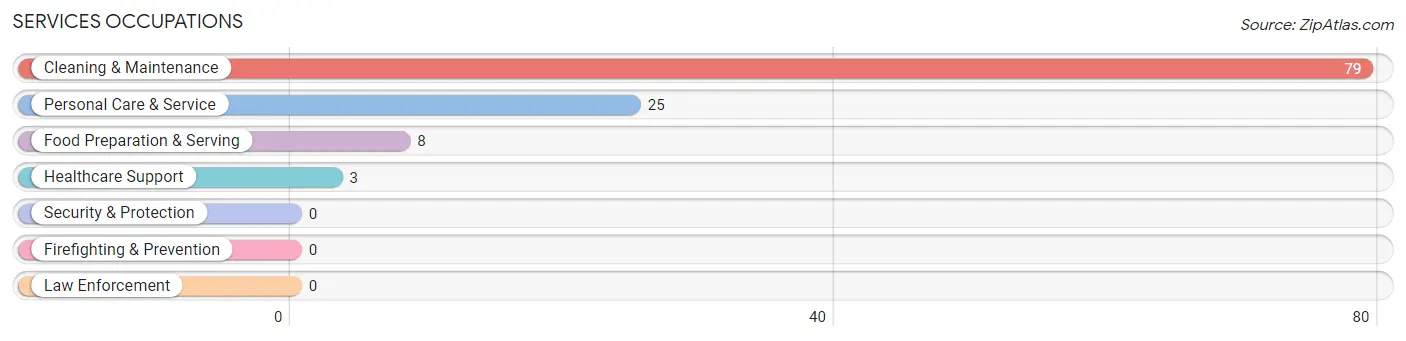
Services Occupations
The most common Services occupations in Oak Grove are Cleaning & Maintenance (79 | 5.0%), Personal Care & Service (25 | 1.6%), Food Preparation & Serving (8 | 0.5%), and Healthcare Support (3 | 0.2%).
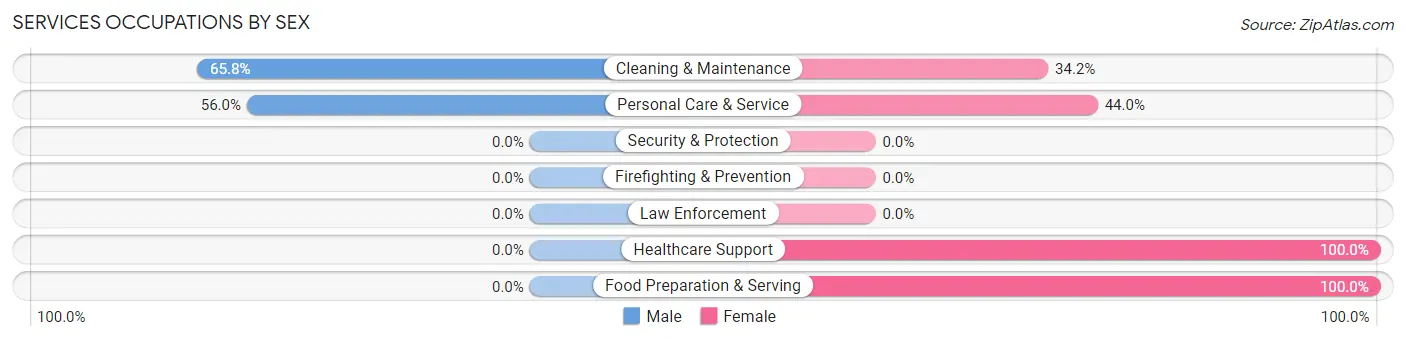
Services Occupations by Sex
Within the Services occupations in Oak Grove, the most male-oriented occupations are Cleaning & Maintenance (65.8%), and Personal Care & Service (56.0%), while the most female-oriented occupations are Healthcare Support (100.0%), Food Preparation & Serving (100.0%), and Personal Care & Service (44.0%).
| Occupation | Male | Female |
| Healthcare Support | 0 (0.0%) | 3 (100.0%) |
| Security & Protection | 0 (0.0%) | 0 (0.0%) |
| Firefighting & Prevention | 0 (0.0%) | 0 (0.0%) |
| Law Enforcement | 0 (0.0%) | 0 (0.0%) |
| Food Preparation & Serving | 0 (0.0%) | 8 (100.0%) |
| Cleaning & Maintenance | 52 (65.8%) | 27 (34.2%) |
| Personal Care & Service | 14 (56.0%) | 11 (44.0%) |
| Total (Category) | 66 (57.4%) | 49 (42.6%) |
| Total (Overall) | 833 (52.9%) | 742 (47.1%) |
Sales and Office Occupations
The most common Sales and Office occupations in Oak Grove are Sales & Related (119 | 7.6%), and Office & Administration (93 | 5.9%).

Sales and Office Occupations by Sex

| Occupation | Male | Female |
| Sales & Related | 56 (47.1%) | 63 (52.9%) |
| Office & Administration | 0 (0.0%) | 93 (100.0%) |
| Total (Category) | 56 (26.4%) | 156 (73.6%) |
| Total (Overall) | 833 (52.9%) | 742 (47.1%) |
Natural Resources, Construction and Maintenance Occupations
The most common Natural Resources, Construction and Maintenance occupations in Oak Grove are , and Construction & Extraction (175 | 11.1%).
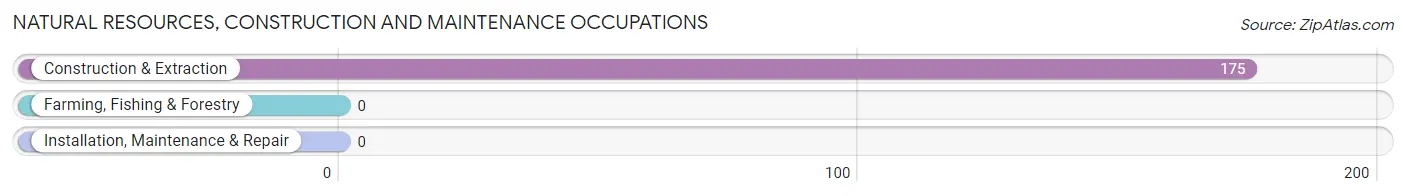
Natural Resources, Construction and Maintenance Occupations by Sex

| Occupation | Male | Female |
| Farming, Fishing & Forestry | 0 (0.0%) | 0 (0.0%) |
| Construction & Extraction | 175 (100.0%) | 0 (0.0%) |
| Installation, Maintenance & Repair | 0 (0.0%) | 0 (0.0%) |
| Total (Category) | 175 (100.0%) | 0 (0.0%) |
| Total (Overall) | 833 (52.9%) | 742 (47.1%) |
Production, Transportation and Moving Occupations
The most common Production, Transportation and Moving occupations in Oak Grove are Production (23 | 1.5%), and Material Moving (8 | 0.5%).
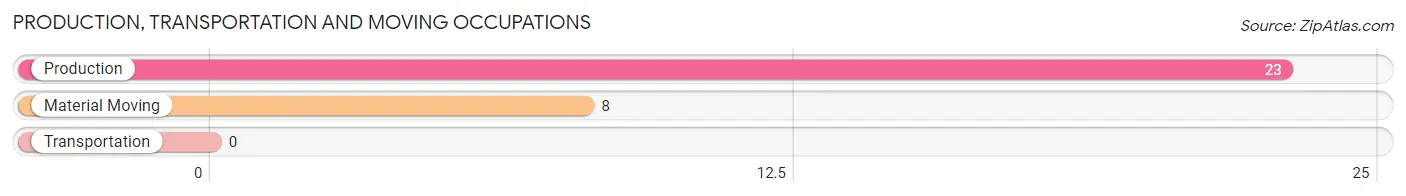
Production, Transportation and Moving Occupations by Sex

| Occupation | Male | Female |
| Production | 23 (100.0%) | 0 (0.0%) |
| Transportation | 0 (0.0%) | 0 (0.0%) |
| Material Moving | 8 (100.0%) | 0 (0.0%) |
| Total (Category) | 31 (100.0%) | 0 (0.0%) |
| Total (Overall) | 833 (52.9%) | 742 (47.1%) |
Employment Industries by Sex in Oak Grove
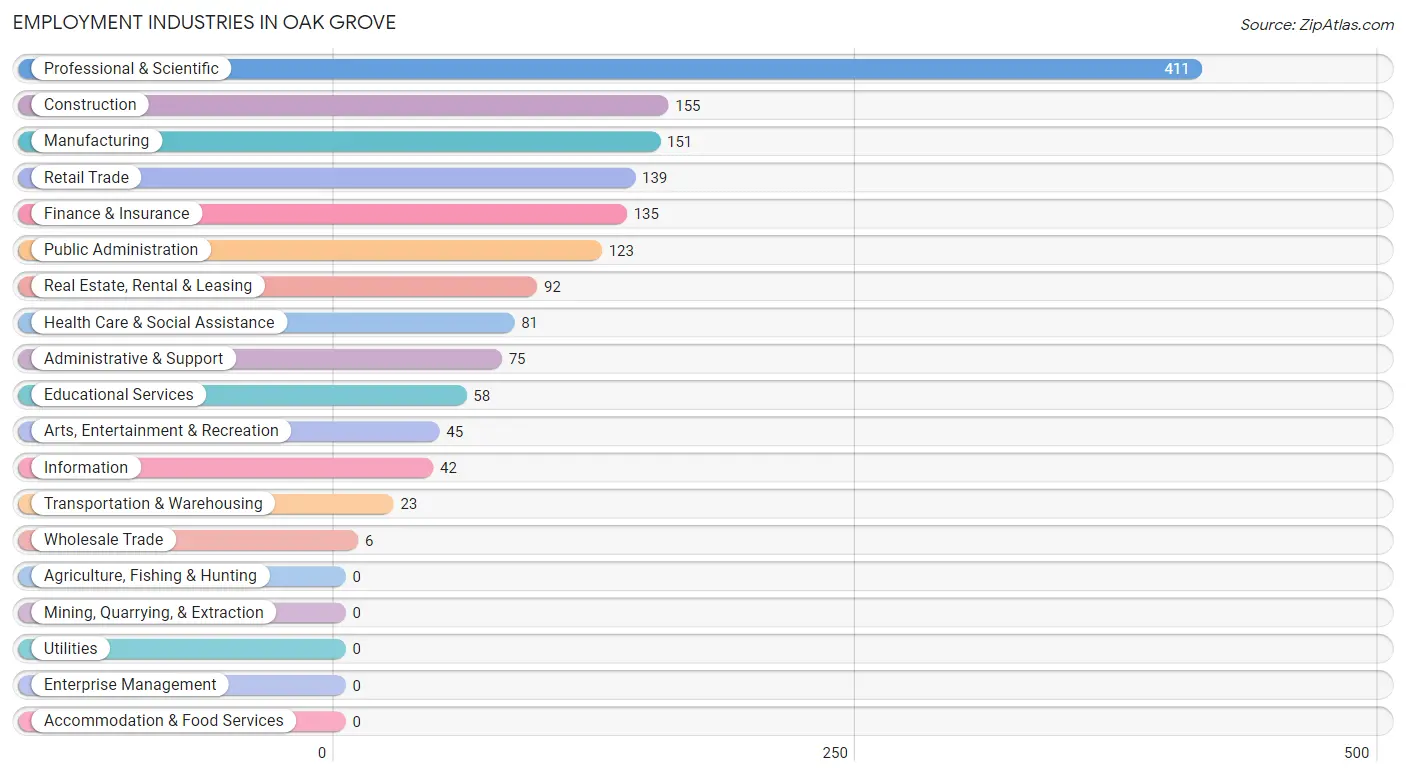
Employment Industries in Oak Grove
The major employment industries in Oak Grove include Professional & Scientific (411 | 26.1%), Construction (155 | 9.8%), Manufacturing (151 | 9.6%), Retail Trade (139 | 8.8%), and Finance & Insurance (135 | 8.6%).
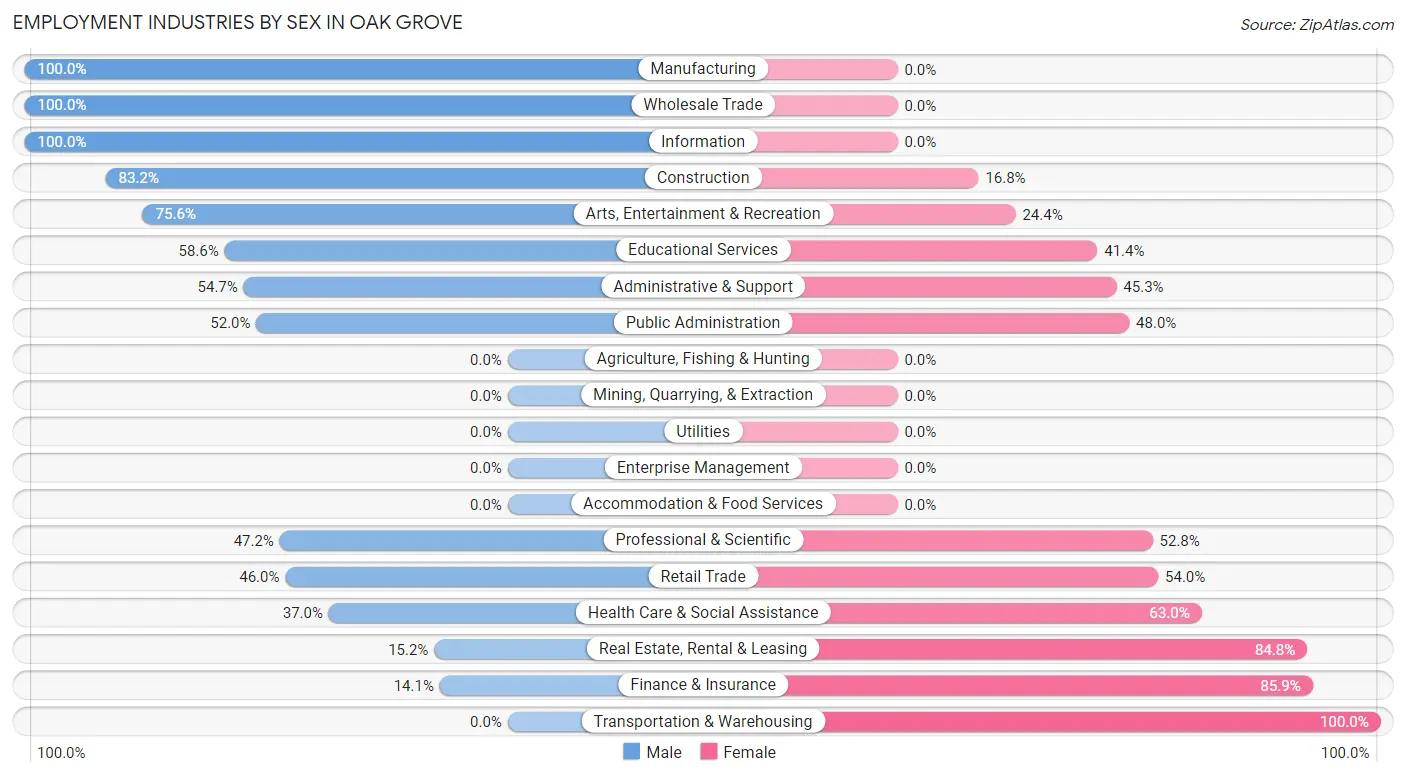
Employment Industries by Sex in Oak Grove
The Oak Grove industries that see more men than women are Manufacturing (100.0%), Wholesale Trade (100.0%), and Information (100.0%), whereas the industries that tend to have a higher number of women are Transportation & Warehousing (100.0%), Finance & Insurance (85.9%), and Real Estate, Rental & Leasing (84.8%).
| Industry | Male | Female |
| Agriculture, Fishing & Hunting | 0 (0.0%) | 0 (0.0%) |
| Mining, Quarrying, & Extraction | 0 (0.0%) | 0 (0.0%) |
| Construction | 129 (83.2%) | 26 (16.8%) |
| Manufacturing | 151 (100.0%) | 0 (0.0%) |
| Wholesale Trade | 6 (100.0%) | 0 (0.0%) |
| Retail Trade | 64 (46.0%) | 75 (54.0%) |
| Transportation & Warehousing | 0 (0.0%) | 23 (100.0%) |
| Utilities | 0 (0.0%) | 0 (0.0%) |
| Information | 42 (100.0%) | 0 (0.0%) |
| Finance & Insurance | 19 (14.1%) | 116 (85.9%) |
| Real Estate, Rental & Leasing | 14 (15.2%) | 78 (84.8%) |
| Professional & Scientific | 194 (47.2%) | 217 (52.8%) |
| Enterprise Management | 0 (0.0%) | 0 (0.0%) |
| Administrative & Support | 41 (54.7%) | 34 (45.3%) |
| Educational Services | 34 (58.6%) | 24 (41.4%) |
| Health Care & Social Assistance | 30 (37.0%) | 51 (63.0%) |
| Arts, Entertainment & Recreation | 34 (75.6%) | 11 (24.4%) |
| Accommodation & Food Services | 0 (0.0%) | 0 (0.0%) |
| Public Administration | 64 (52.0%) | 59 (48.0%) |
| Total | 833 (52.9%) | 742 (47.1%) |
Education in Oak Grove
School Enrollment in Oak Grove
The most common levels of schooling among the 518 students in Oak Grove are college / undergraduate (144 | 27.8%), high school (117 | 22.6%), and nursery / preschool (91 | 17.6%).
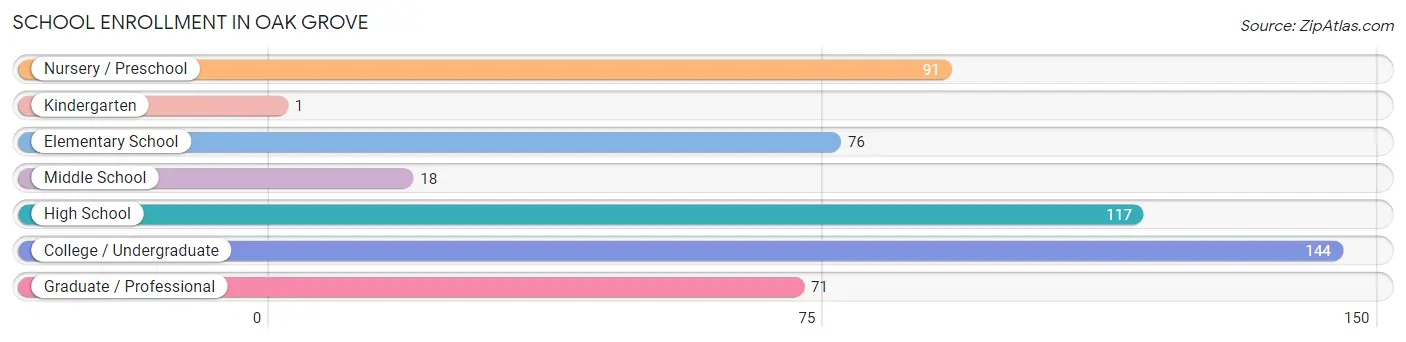
| School Level | # Students | % Students |
| Nursery / Preschool | 91 | 17.6% |
| Kindergarten | 1 | 0.2% |
| Elementary School | 76 | 14.7% |
| Middle School | 18 | 3.5% |
| High School | 117 | 22.6% |
| College / Undergraduate | 144 | 27.8% |
| Graduate / Professional | 71 | 13.7% |
| Total | 518 | 100.0% |
School Enrollment by Age by Funding Source in Oak Grove
Out of a total of 518 students who are enrolled in schools in Oak Grove, 104 (20.1%) attend a private institution, while the remaining 414 (79.9%) are enrolled in public schools. The age group of 3 to 4 year olds has the highest likelihood of being enrolled in private schools, with 91 (100.0% in the age bracket) enrolled. Conversely, the age group of 10 to 14 year olds has the lowest likelihood of being enrolled in a private school, with 18 (100.0% in the age bracket) attending a public institution.
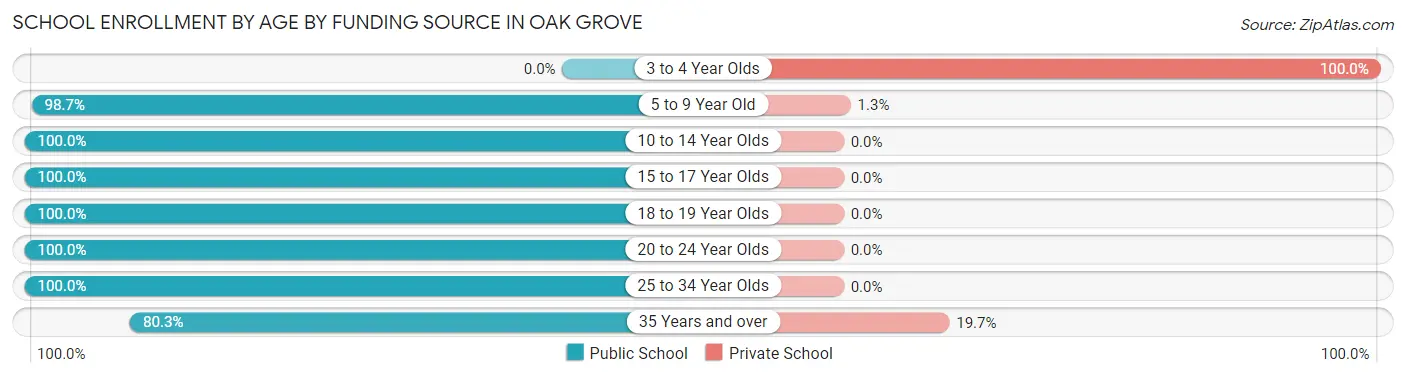
| Age Bracket | Public School | Private School |
| 3 to 4 Year Olds | 0 (0.0%) | 91 (100.0%) |
| 5 to 9 Year Old | 76 (98.7%) | 1 (1.3%) |
| 10 to 14 Year Olds | 18 (100.0%) | 0 (0.0%) |
| 15 to 17 Year Olds | 41 (100.0%) | 0 (0.0%) |
| 18 to 19 Year Olds | 76 (100.0%) | 0 (0.0%) |
| 20 to 24 Year Olds | 130 (100.0%) | 0 (0.0%) |
| 25 to 34 Year Olds | 24 (100.0%) | 0 (0.0%) |
| 35 Years and over | 49 (80.3%) | 12 (19.7%) |
| Total | 414 (79.9%) | 104 (20.1%) |
Educational Attainment by Field of Study in Oak Grove
Engineering (267 | 20.9%), business (243 | 19.1%), science & technology (234 | 18.3%), social sciences (221 | 17.3%), and computers & mathematics (78 | 6.1%) are the most common fields of study among 1,275 individuals in Oak Grove who have obtained a bachelor's degree or higher.
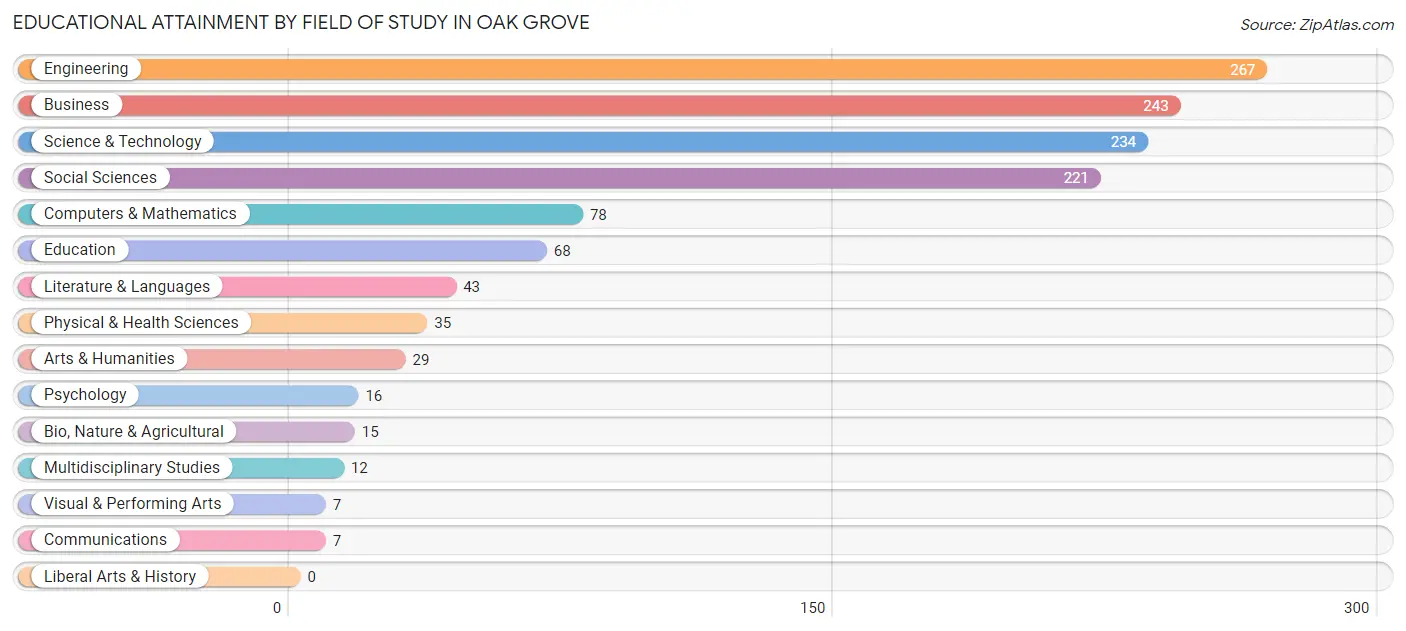
| Field of Study | # Graduates | % Graduates |
| Computers & Mathematics | 78 | 6.1% |
| Bio, Nature & Agricultural | 15 | 1.2% |
| Physical & Health Sciences | 35 | 2.8% |
| Psychology | 16 | 1.3% |
| Social Sciences | 221 | 17.3% |
| Engineering | 267 | 20.9% |
| Multidisciplinary Studies | 12 | 0.9% |
| Science & Technology | 234 | 18.3% |
| Business | 243 | 19.1% |
| Education | 68 | 5.3% |
| Literature & Languages | 43 | 3.4% |
| Liberal Arts & History | 0 | 0.0% |
| Visual & Performing Arts | 7 | 0.5% |
| Communications | 7 | 0.5% |
| Arts & Humanities | 29 | 2.3% |
| Total | 1,275 | 100.0% |
Transportation & Commute in Oak Grove
Vehicle Availability by Sex in Oak Grove
The most prevalent vehicle ownership categories in Oak Grove are males with 2 vehicles (264, accounting for 33.3%) and females with 2 vehicles (186, making up 36.3%).
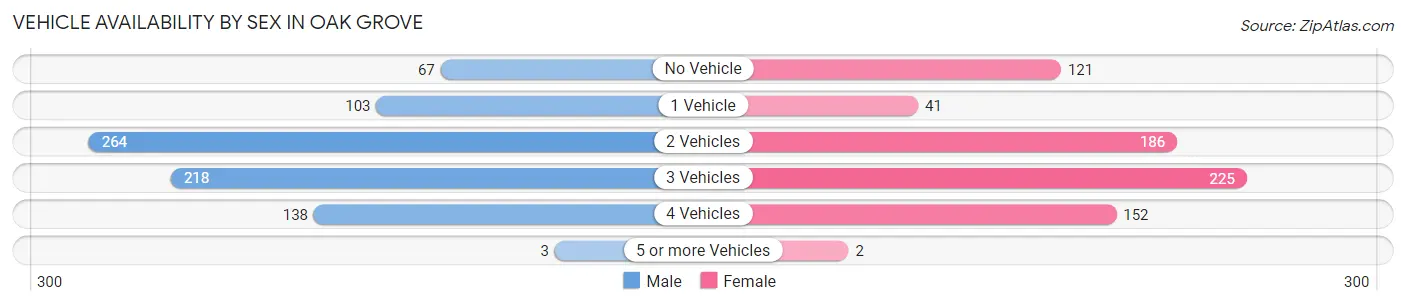
| Vehicles Available | Male | Female |
| No Vehicle | 67 (8.5%) | 121 (16.6%) |
| 1 Vehicle | 103 (13.0%) | 41 (5.6%) |
| 2 Vehicles | 264 (33.3%) | 186 (25.6%) |
| 3 Vehicles | 218 (27.5%) | 225 (30.9%) |
| 4 Vehicles | 138 (17.4%) | 152 (20.9%) |
| 5 or more Vehicles | 3 (0.4%) | 2 (0.3%) |
| Total | 793 (100.0%) | 727 (100.0%) |
Commute Time in Oak Grove
The most frequently occuring commute durations in Oak Grove are 60 to 89 minutes (229 commuters, 18.5%), 40 to 44 minutes (200 commuters, 16.1%), and 20 to 24 minutes (159 commuters, 12.8%).
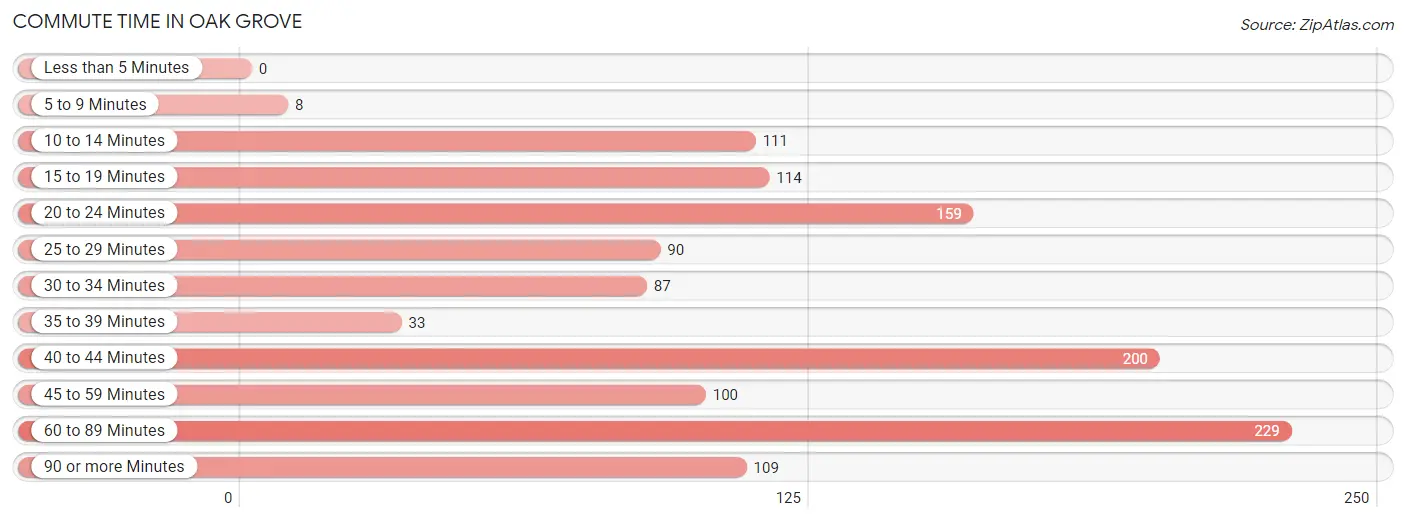
| Commute Time | # Commuters | % Commuters |
| Less than 5 Minutes | 0 | 0.0% |
| 5 to 9 Minutes | 8 | 0.6% |
| 10 to 14 Minutes | 111 | 8.9% |
| 15 to 19 Minutes | 114 | 9.2% |
| 20 to 24 Minutes | 159 | 12.8% |
| 25 to 29 Minutes | 90 | 7.3% |
| 30 to 34 Minutes | 87 | 7.0% |
| 35 to 39 Minutes | 33 | 2.7% |
| 40 to 44 Minutes | 200 | 16.1% |
| 45 to 59 Minutes | 100 | 8.1% |
| 60 to 89 Minutes | 229 | 18.5% |
| 90 or more Minutes | 109 | 8.8% |
Commute Time by Sex in Oak Grove
The most common commute times in Oak Grove are 10 to 14 minutes (111 commuters, 16.4%) for males and 40 to 44 minutes (133 commuters, 23.7%) for females.
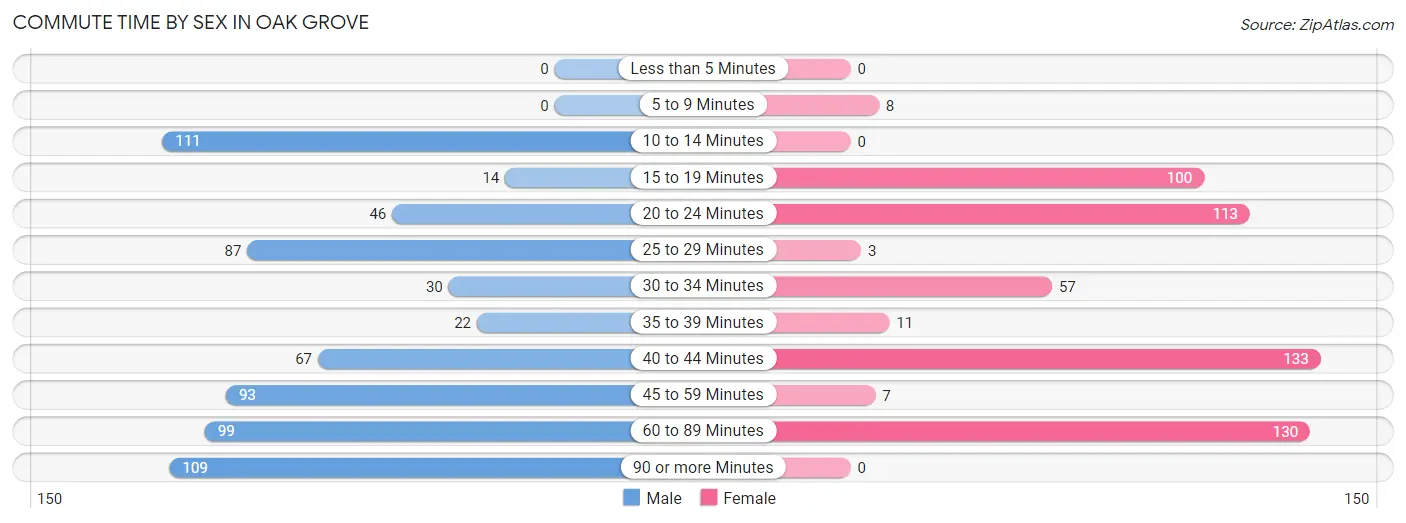
| Commute Time | Male | Female |
| Less than 5 Minutes | 0 (0.0%) | 0 (0.0%) |
| 5 to 9 Minutes | 0 (0.0%) | 8 (1.4%) |
| 10 to 14 Minutes | 111 (16.4%) | 0 (0.0%) |
| 15 to 19 Minutes | 14 (2.1%) | 100 (17.8%) |
| 20 to 24 Minutes | 46 (6.8%) | 113 (20.1%) |
| 25 to 29 Minutes | 87 (12.8%) | 3 (0.5%) |
| 30 to 34 Minutes | 30 (4.4%) | 57 (10.1%) |
| 35 to 39 Minutes | 22 (3.2%) | 11 (2.0%) |
| 40 to 44 Minutes | 67 (9.9%) | 133 (23.7%) |
| 45 to 59 Minutes | 93 (13.7%) | 7 (1.3%) |
| 60 to 89 Minutes | 99 (14.6%) | 130 (23.1%) |
| 90 or more Minutes | 109 (16.1%) | 0 (0.0%) |
Time of Departure to Work by Sex in Oak Grove
The most frequent times of departure to work in Oak Grove are 8:30 AM to 8:59 AM (185, 27.3%) for males and 8:00 AM to 8:29 AM (115, 20.5%) for females.
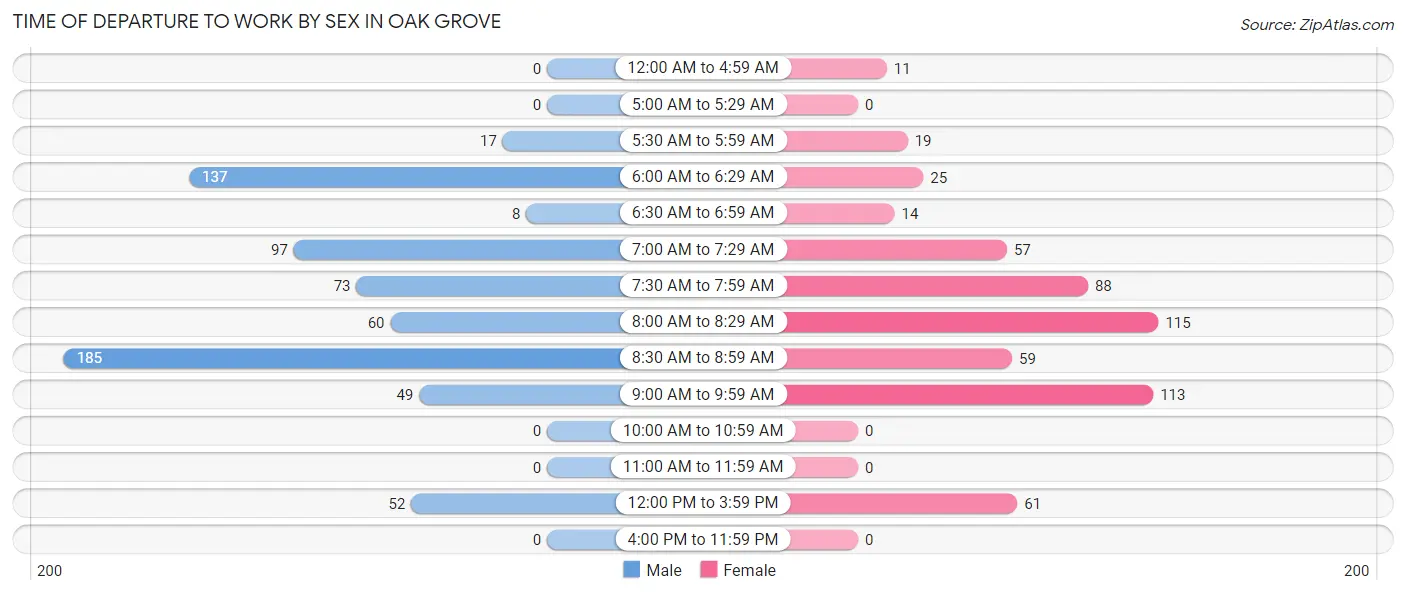
| Time of Departure | Male | Female |
| 12:00 AM to 4:59 AM | 0 (0.0%) | 11 (2.0%) |
| 5:00 AM to 5:29 AM | 0 (0.0%) | 0 (0.0%) |
| 5:30 AM to 5:59 AM | 17 (2.5%) | 19 (3.4%) |
| 6:00 AM to 6:29 AM | 137 (20.2%) | 25 (4.4%) |
| 6:30 AM to 6:59 AM | 8 (1.2%) | 14 (2.5%) |
| 7:00 AM to 7:29 AM | 97 (14.3%) | 57 (10.1%) |
| 7:30 AM to 7:59 AM | 73 (10.8%) | 88 (15.7%) |
| 8:00 AM to 8:29 AM | 60 (8.8%) | 115 (20.5%) |
| 8:30 AM to 8:59 AM | 185 (27.3%) | 59 (10.5%) |
| 9:00 AM to 9:59 AM | 49 (7.2%) | 113 (20.1%) |
| 10:00 AM to 10:59 AM | 0 (0.0%) | 0 (0.0%) |
| 11:00 AM to 11:59 AM | 0 (0.0%) | 0 (0.0%) |
| 12:00 PM to 3:59 PM | 52 (7.7%) | 61 (10.8%) |
| 4:00 PM to 11:59 PM | 0 (0.0%) | 0 (0.0%) |
| Total | 678 (100.0%) | 562 (100.0%) |
Housing Occupancy in Oak Grove
Occupancy by Ownership in Oak Grove
Of the total 764 dwellings in Oak Grove, owner-occupied units account for 422 (55.2%), while renter-occupied units make up 342 (44.8%).
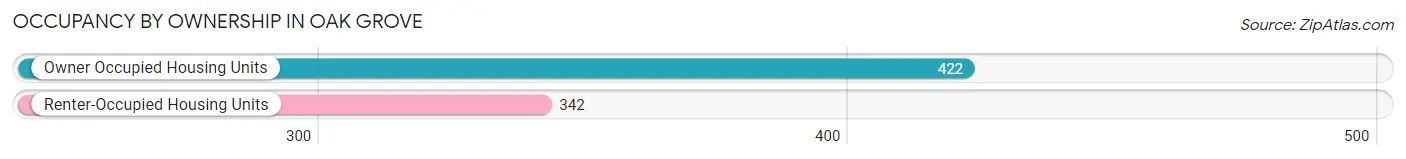
| Occupancy | # Housing Units | % Housing Units |
| Owner Occupied Housing Units | 422 | 55.2% |
| Renter-Occupied Housing Units | 342 | 44.8% |
| Total Occupied Housing Units | 764 | 100.0% |
Occupancy by Household Size in Oak Grove
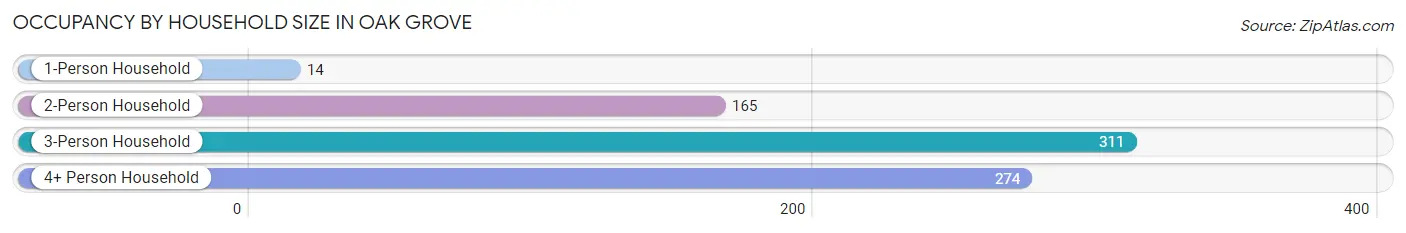
| Household Size | # Housing Units | % Housing Units |
| 1-Person Household | 14 | 1.8% |
| 2-Person Household | 165 | 21.6% |
| 3-Person Household | 311 | 40.7% |
| 4+ Person Household | 274 | 35.9% |
| Total Housing Units | 764 | 100.0% |
Occupancy by Ownership by Household Size in Oak Grove
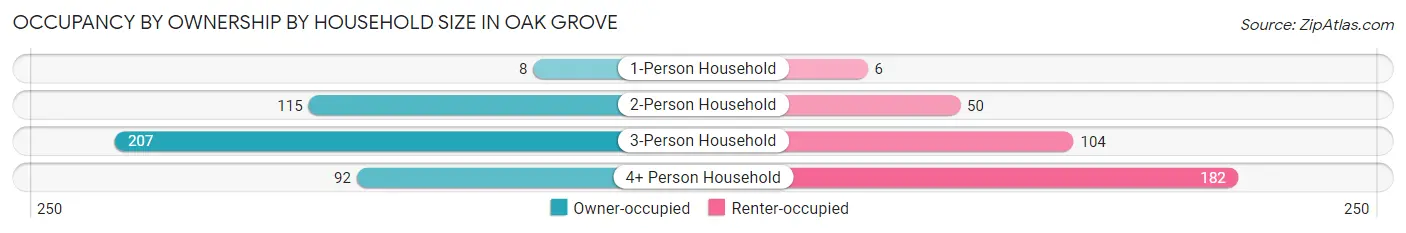
| Household Size | Owner-occupied | Renter-occupied |
| 1-Person Household | 8 (57.1%) | 6 (42.9%) |
| 2-Person Household | 115 (69.7%) | 50 (30.3%) |
| 3-Person Household | 207 (66.6%) | 104 (33.4%) |
| 4+ Person Household | 92 (33.6%) | 182 (66.4%) |
| Total Housing Units | 422 (55.2%) | 342 (44.8%) |
Occupancy by Educational Attainment in Oak Grove
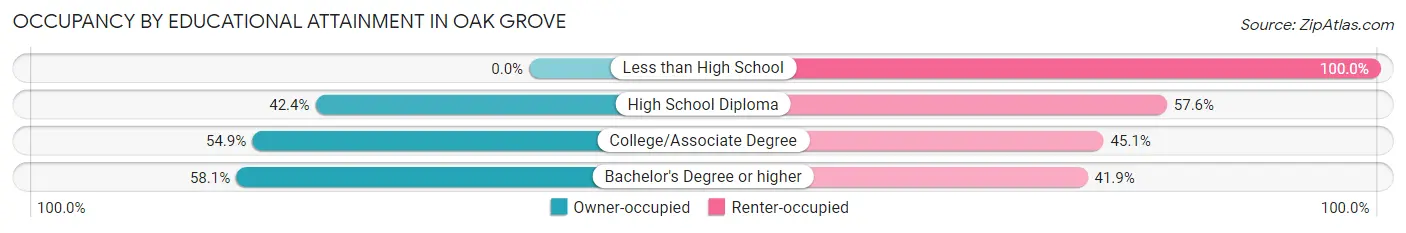
| Household Size | Owner-occupied | Renter-occupied |
| Less than High School | 0 (0.0%) | 16 (100.0%) |
| High School Diploma | 25 (42.4%) | 34 (57.6%) |
| College/Associate Degree | 56 (54.9%) | 46 (45.1%) |
| Bachelor's Degree or higher | 341 (58.1%) | 246 (41.9%) |
Occupancy by Age of Householder in Oak Grove
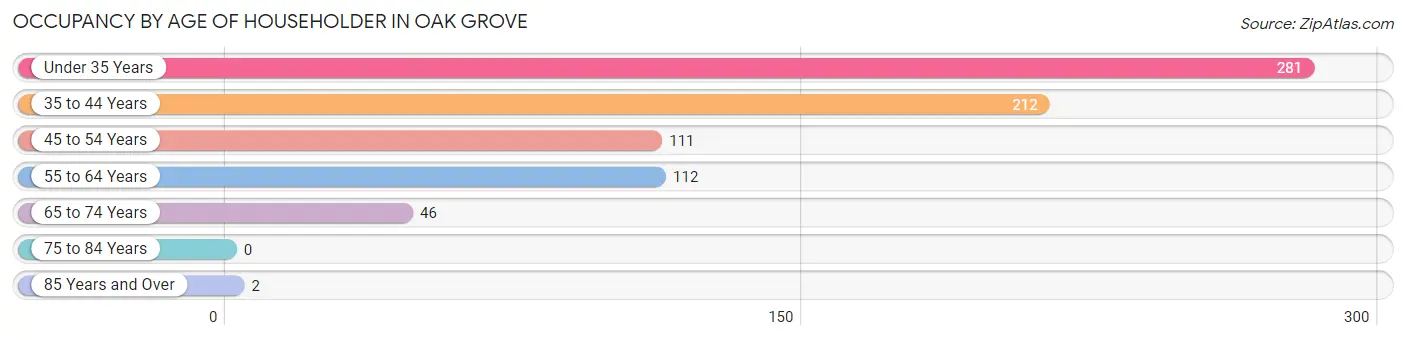
| Age Bracket | # Households | % Households |
| Under 35 Years | 281 | 36.8% |
| 35 to 44 Years | 212 | 27.8% |
| 45 to 54 Years | 111 | 14.5% |
| 55 to 64 Years | 112 | 14.7% |
| 65 to 74 Years | 46 | 6.0% |
| 75 to 84 Years | 0 | 0.0% |
| 85 Years and Over | 2 | 0.3% |
| Total | 764 | 100.0% |
Housing Finances in Oak Grove
Median Income by Occupancy in Oak Grove
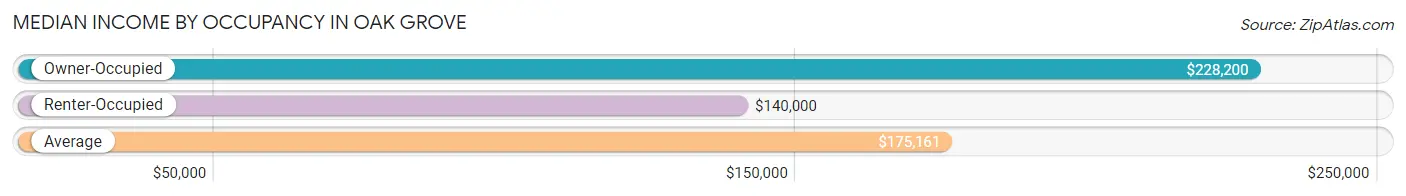
| Occupancy Type | # Households | Median Income |
| Owner-Occupied | 422 (55.2%) | $228,200 |
| Renter-Occupied | 342 (44.8%) | $140,000 |
| Average | 764 (100.0%) | $175,161 |
Occupancy by Householder Income Bracket in Oak Grove
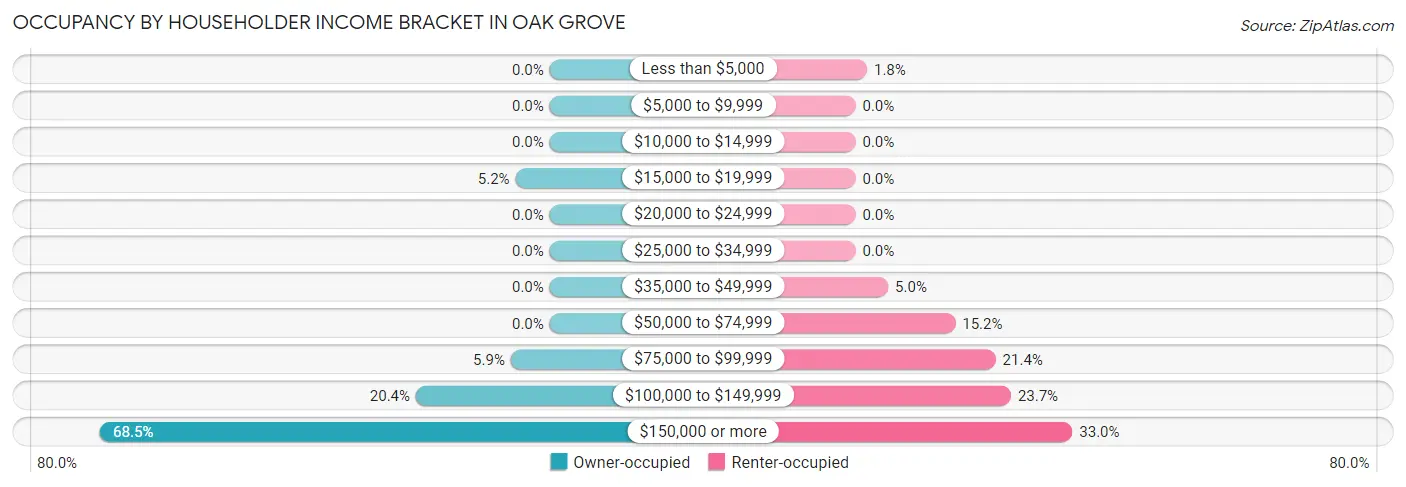
| Income Bracket | Owner-occupied | Renter-occupied |
| Less than $5,000 | 0 (0.0%) | 6 (1.8%) |
| $5,000 to $9,999 | 0 (0.0%) | 0 (0.0%) |
| $10,000 to $14,999 | 0 (0.0%) | 0 (0.0%) |
| $15,000 to $19,999 | 22 (5.2%) | 0 (0.0%) |
| $20,000 to $24,999 | 0 (0.0%) | 0 (0.0%) |
| $25,000 to $34,999 | 0 (0.0%) | 0 (0.0%) |
| $35,000 to $49,999 | 0 (0.0%) | 17 (5.0%) |
| $50,000 to $74,999 | 0 (0.0%) | 52 (15.2%) |
| $75,000 to $99,999 | 25 (5.9%) | 73 (21.3%) |
| $100,000 to $149,999 | 86 (20.4%) | 81 (23.7%) |
| $150,000 or more | 289 (68.5%) | 113 (33.0%) |
| Total | 422 (100.0%) | 342 (100.0%) |
Monthly Housing Cost Tiers in Oak Grove
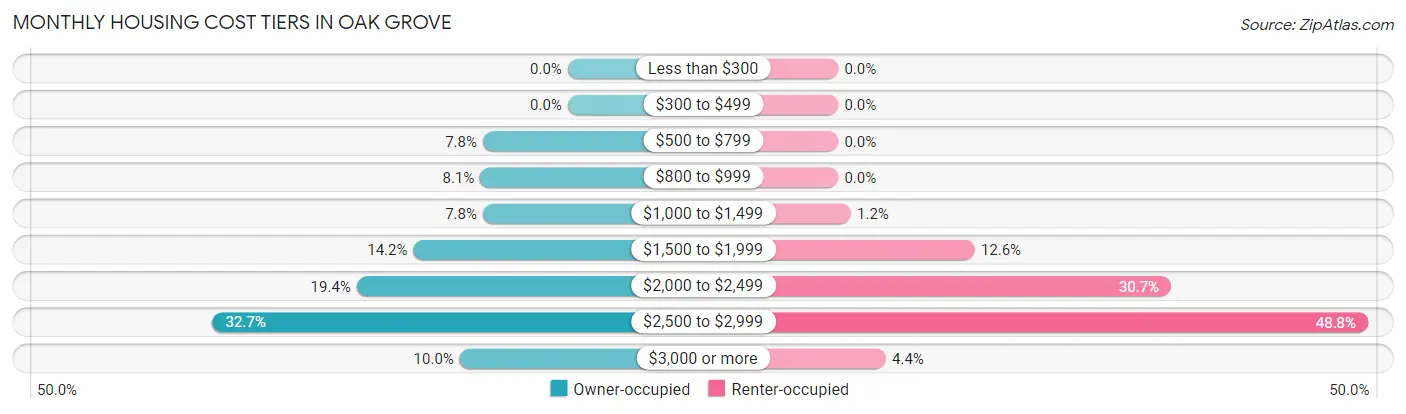
| Monthly Cost | Owner-occupied | Renter-occupied |
| Less than $300 | 0 (0.0%) | 0 (0.0%) |
| $300 to $499 | 0 (0.0%) | 0 (0.0%) |
| $500 to $799 | 33 (7.8%) | 0 (0.0%) |
| $800 to $999 | 34 (8.1%) | 0 (0.0%) |
| $1,000 to $1,499 | 33 (7.8%) | 4 (1.2%) |
| $1,500 to $1,999 | 60 (14.2%) | 43 (12.6%) |
| $2,000 to $2,499 | 82 (19.4%) | 105 (30.7%) |
| $2,500 to $2,999 | 138 (32.7%) | 167 (48.8%) |
| $3,000 or more | 42 (10.0%) | 15 (4.4%) |
| Total | 422 (100.0%) | 342 (100.0%) |
Physical Housing Characteristics in Oak Grove
Housing Structures in Oak Grove
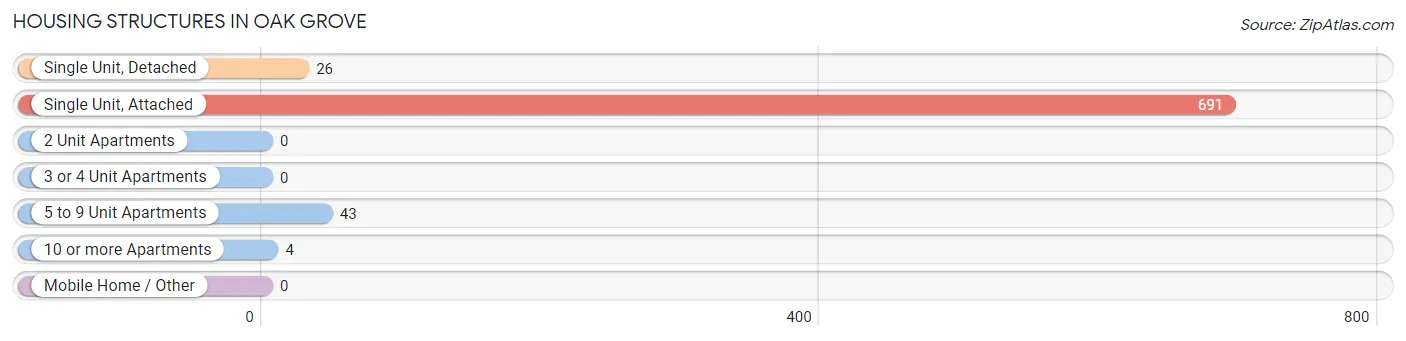
| Structure Type | # Housing Units | % Housing Units |
| Single Unit, Detached | 26 | 3.4% |
| Single Unit, Attached | 691 | 90.4% |
| 2 Unit Apartments | 0 | 0.0% |
| 3 or 4 Unit Apartments | 0 | 0.0% |
| 5 to 9 Unit Apartments | 43 | 5.6% |
| 10 or more Apartments | 4 | 0.5% |
| Mobile Home / Other | 0 | 0.0% |
| Total | 764 | 100.0% |
Housing Structures by Occupancy in Oak Grove
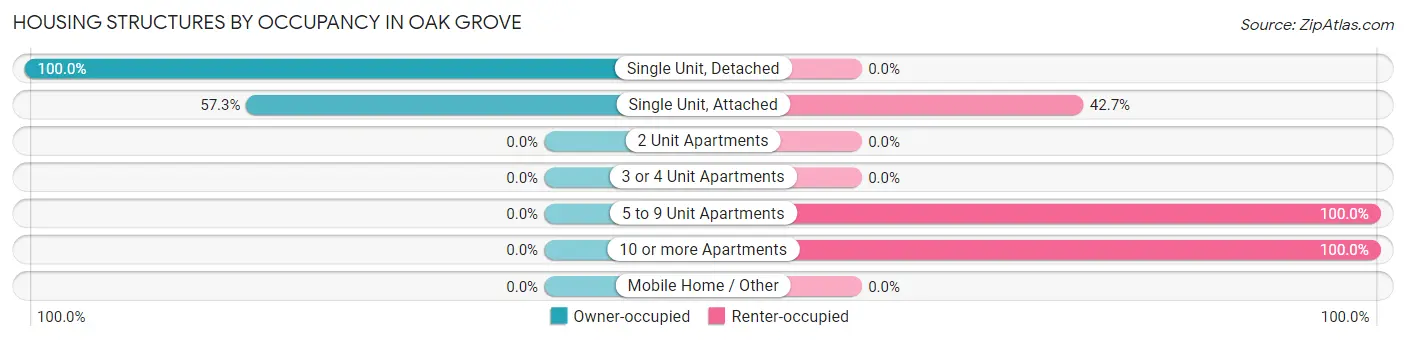
| Structure Type | Owner-occupied | Renter-occupied |
| Single Unit, Detached | 26 (100.0%) | 0 (0.0%) |
| Single Unit, Attached | 396 (57.3%) | 295 (42.7%) |
| 2 Unit Apartments | 0 (0.0%) | 0 (0.0%) |
| 3 or 4 Unit Apartments | 0 (0.0%) | 0 (0.0%) |
| 5 to 9 Unit Apartments | 0 (0.0%) | 43 (100.0%) |
| 10 or more Apartments | 0 (0.0%) | 4 (100.0%) |
| Mobile Home / Other | 0 (0.0%) | 0 (0.0%) |
| Total | 422 (55.2%) | 342 (44.8%) |
Housing Structures by Number of Rooms in Oak Grove
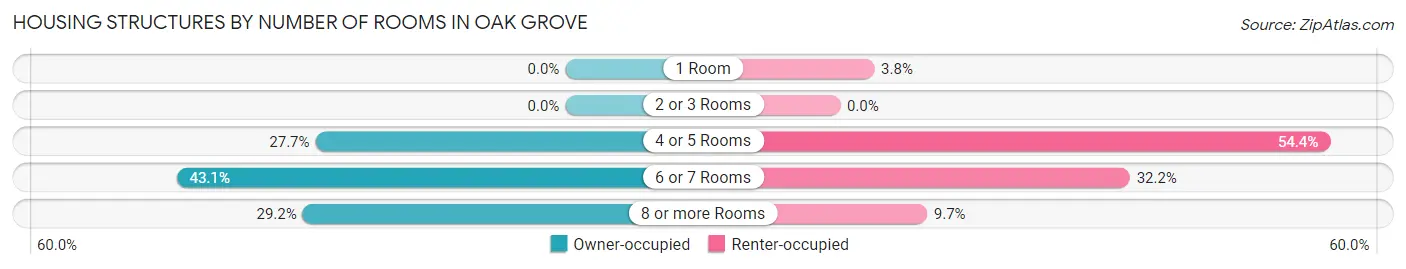
| Number of Rooms | Owner-occupied | Renter-occupied |
| 1 Room | 0 (0.0%) | 13 (3.8%) |
| 2 or 3 Rooms | 0 (0.0%) | 0 (0.0%) |
| 4 or 5 Rooms | 117 (27.7%) | 186 (54.4%) |
| 6 or 7 Rooms | 182 (43.1%) | 110 (32.2%) |
| 8 or more Rooms | 123 (29.1%) | 33 (9.7%) |
| Total | 422 (100.0%) | 342 (100.0%) |
Housing Structure by Heating Type in Oak Grove
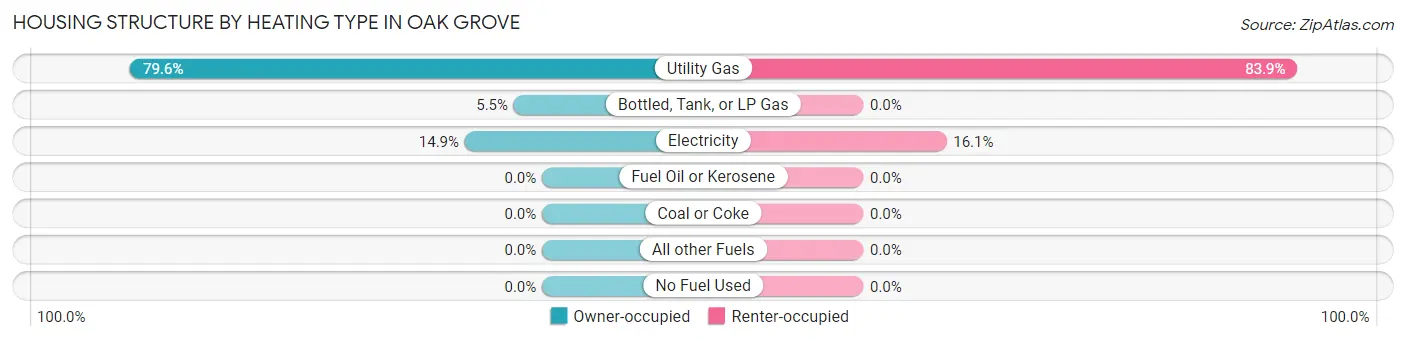
| Heating Type | Owner-occupied | Renter-occupied |
| Utility Gas | 336 (79.6%) | 287 (83.9%) |
| Bottled, Tank, or LP Gas | 23 (5.4%) | 0 (0.0%) |
| Electricity | 63 (14.9%) | 55 (16.1%) |
| Fuel Oil or Kerosene | 0 (0.0%) | 0 (0.0%) |
| Coal or Coke | 0 (0.0%) | 0 (0.0%) |
| All other Fuels | 0 (0.0%) | 0 (0.0%) |
| No Fuel Used | 0 (0.0%) | 0 (0.0%) |
| Total | 422 (100.0%) | 342 (100.0%) |
Household Vehicle Usage in Oak Grove
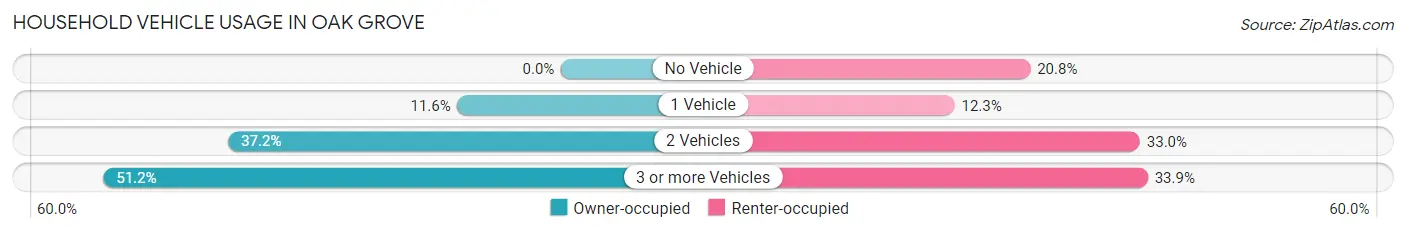
| Vehicles per Household | Owner-occupied | Renter-occupied |
| No Vehicle | 0 (0.0%) | 71 (20.8%) |
| 1 Vehicle | 49 (11.6%) | 42 (12.3%) |
| 2 Vehicles | 157 (37.2%) | 113 (33.0%) |
| 3 or more Vehicles | 216 (51.2%) | 116 (33.9%) |
| Total | 422 (100.0%) | 342 (100.0%) |
Real Estate & Mortgages in Oak Grove
Real Estate and Mortgage Overview in Oak Grove
| Characteristic | Without Mortgage | With Mortgage |
| Housing Units | 100 | 322 |
| Median Property Value | $600,700 | $532,400 |
| Median Household Income | $225,543 | $224 |
| Monthly Housing Costs | $894 | $42 |
| Real Estate Taxes | $5,313 | $0 |
Property Value by Mortgage Status in Oak Grove
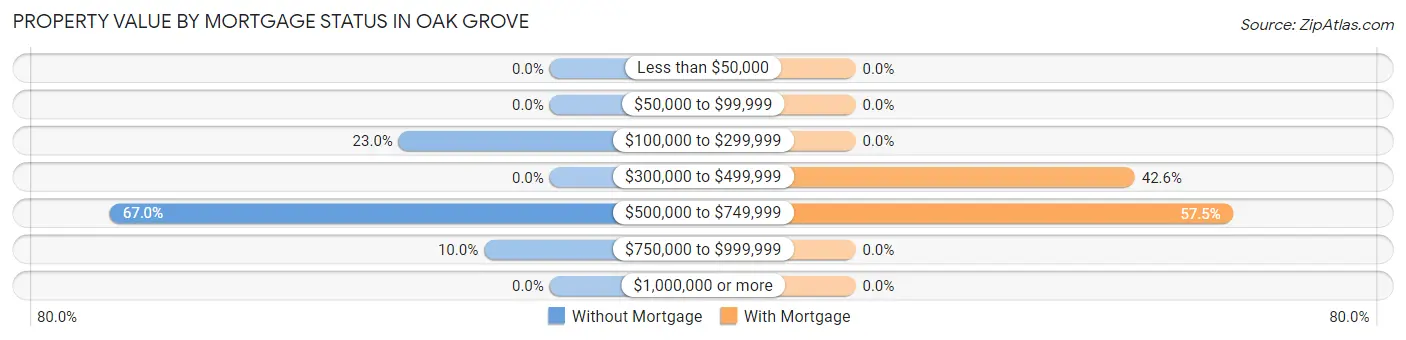
| Property Value | Without Mortgage | With Mortgage |
| Less than $50,000 | 0 (0.0%) | 0 (0.0%) |
| $50,000 to $99,999 | 0 (0.0%) | 0 (0.0%) |
| $100,000 to $299,999 | 23 (23.0%) | 0 (0.0%) |
| $300,000 to $499,999 | 0 (0.0%) | 137 (42.5%) |
| $500,000 to $749,999 | 67 (67.0%) | 185 (57.5%) |
| $750,000 to $999,999 | 10 (10.0%) | 0 (0.0%) |
| $1,000,000 or more | 0 (0.0%) | 0 (0.0%) |
| Total | 100 (100.0%) | 322 (100.0%) |
Household Income by Mortgage Status in Oak Grove
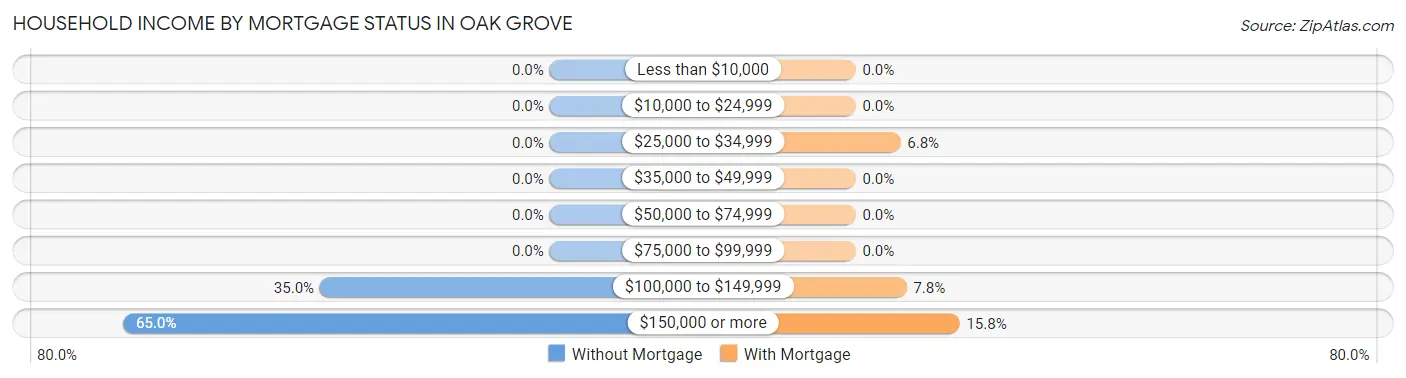
| Household Income | Without Mortgage | With Mortgage |
| Less than $10,000 | 0 (0.0%) | 0 (0.0%) |
| $10,000 to $24,999 | 0 (0.0%) | 0 (0.0%) |
| $25,000 to $34,999 | 0 (0.0%) | 22 (6.8%) |
| $35,000 to $49,999 | 0 (0.0%) | 0 (0.0%) |
| $50,000 to $74,999 | 0 (0.0%) | 0 (0.0%) |
| $75,000 to $99,999 | 0 (0.0%) | 0 (0.0%) |
| $100,000 to $149,999 | 35 (35.0%) | 25 (7.8%) |
| $150,000 or more | 65 (65.0%) | 51 (15.8%) |
| Total | 100 (100.0%) | 322 (100.0%) |
Property Value to Household Income Ratio in Oak Grove
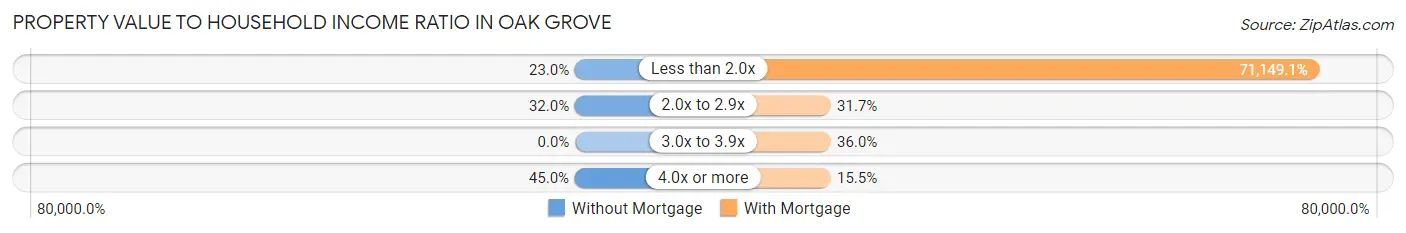
| Value-to-Income Ratio | Without Mortgage | With Mortgage |
| Less than 2.0x | 23 (23.0%) | 229,100 (71,149.1%) |
| 2.0x to 2.9x | 32 (32.0%) | 102 (31.7%) |
| 3.0x to 3.9x | 0 (0.0%) | 116 (36.0%) |
| 4.0x or more | 45 (45.0%) | 50 (15.5%) |
| Total | 100 (100.0%) | 322 (100.0%) |
Real Estate Taxes by Mortgage Status in Oak Grove
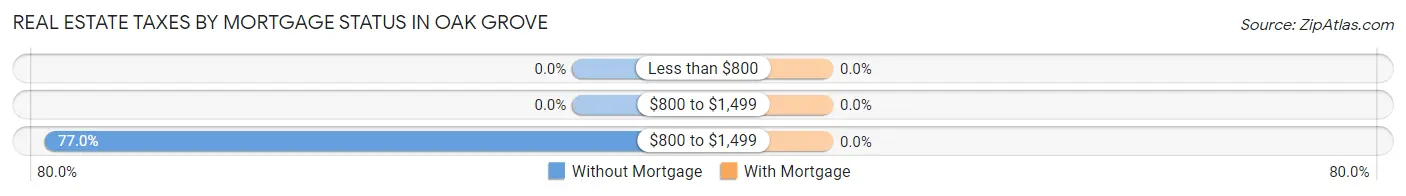
| Property Taxes | Without Mortgage | With Mortgage |
| Less than $800 | 0 (0.0%) | 0 (0.0%) |
| $800 to $1,499 | 0 (0.0%) | 0 (0.0%) |
| $800 to $1,499 | 77 (77.0%) | 0 (0.0%) |
| Total | 100 (100.0%) | 322 (100.0%) |
Health & Disability in Oak Grove
Health Insurance Coverage by Age in Oak Grove
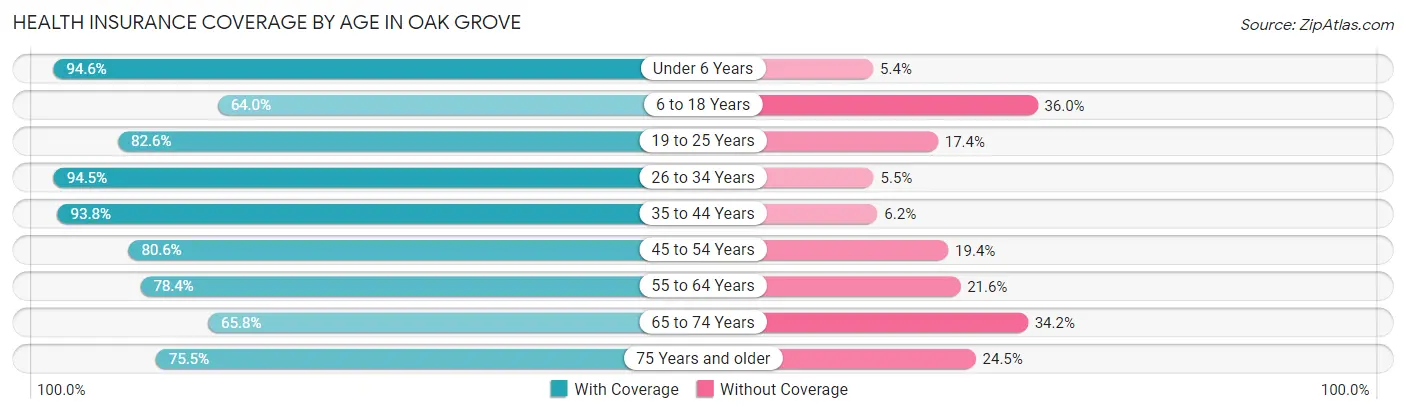
| Age Bracket | With Coverage | Without Coverage |
| Under 6 Years | 334 (94.6%) | 19 (5.4%) |
| 6 to 18 Years | 135 (64.0%) | 76 (36.0%) |
| 19 to 25 Years | 199 (82.6%) | 42 (17.4%) |
| 26 to 34 Years | 571 (94.5%) | 33 (5.5%) |
| 35 to 44 Years | 304 (93.8%) | 20 (6.2%) |
| 45 to 54 Years | 204 (80.6%) | 49 (19.4%) |
| 55 to 64 Years | 301 (78.4%) | 83 (21.6%) |
| 65 to 74 Years | 75 (65.8%) | 39 (34.2%) |
| 75 Years and older | 37 (75.5%) | 12 (24.5%) |
| Total | 2,160 (85.3%) | 373 (14.7%) |
Health Insurance Coverage by Citizenship Status in Oak Grove

| Citizenship Status | With Coverage | Without Coverage |
| Native Born | 334 (94.6%) | 19 (5.4%) |
| Foreign Born, Citizen | 135 (64.0%) | 76 (36.0%) |
| Foreign Born, not a Citizen | 199 (82.6%) | 42 (17.4%) |
Health Insurance Coverage by Household Income in Oak Grove
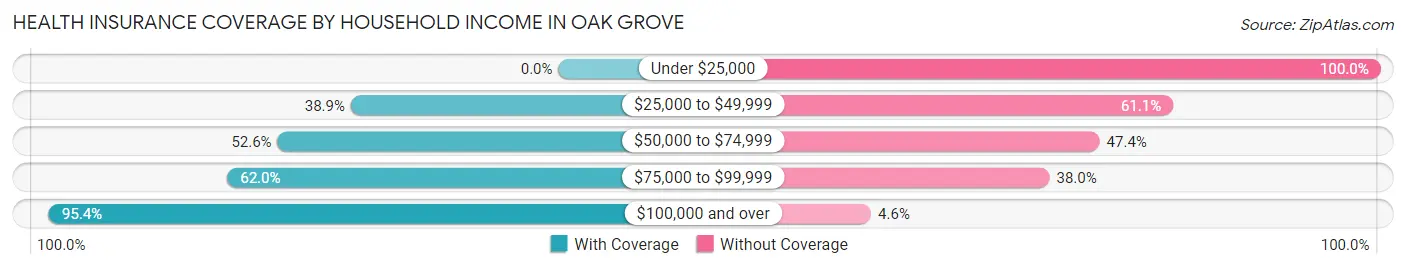
| Household Income | With Coverage | Without Coverage |
| Under $25,000 | 0 (0.0%) | 48 (100.0%) |
| $25,000 to $49,999 | 14 (38.9%) | 22 (61.1%) |
| $50,000 to $74,999 | 100 (52.6%) | 90 (47.4%) |
| $75,000 to $99,999 | 204 (62.0%) | 125 (38.0%) |
| $100,000 and over | 1,842 (95.4%) | 88 (4.6%) |
Public vs Private Health Insurance Coverage by Age in Oak Grove
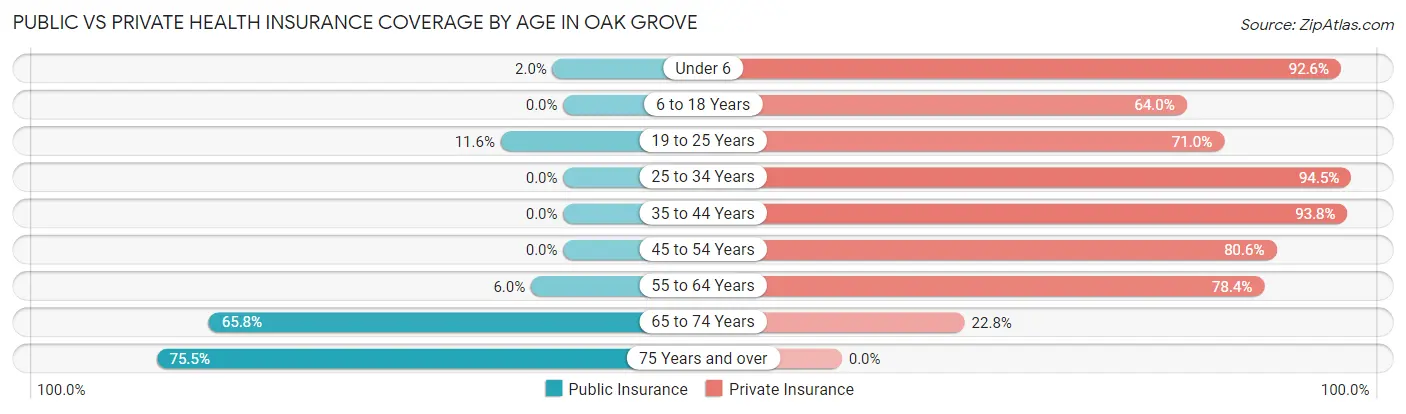
| Age Bracket | Public Insurance | Private Insurance |
| Under 6 | 7 (2.0%) | 327 (92.6%) |
| 6 to 18 Years | 0 (0.0%) | 135 (64.0%) |
| 19 to 25 Years | 28 (11.6%) | 171 (71.0%) |
| 25 to 34 Years | 0 (0.0%) | 571 (94.5%) |
| 35 to 44 Years | 0 (0.0%) | 304 (93.8%) |
| 45 to 54 Years | 0 (0.0%) | 204 (80.6%) |
| 55 to 64 Years | 23 (6.0%) | 301 (78.4%) |
| 65 to 74 Years | 75 (65.8%) | 26 (22.8%) |
| 75 Years and over | 37 (75.5%) | 0 (0.0%) |
| Total | 170 (6.7%) | 2,039 (80.5%) |
Disability Status by Sex by Age in Oak Grove
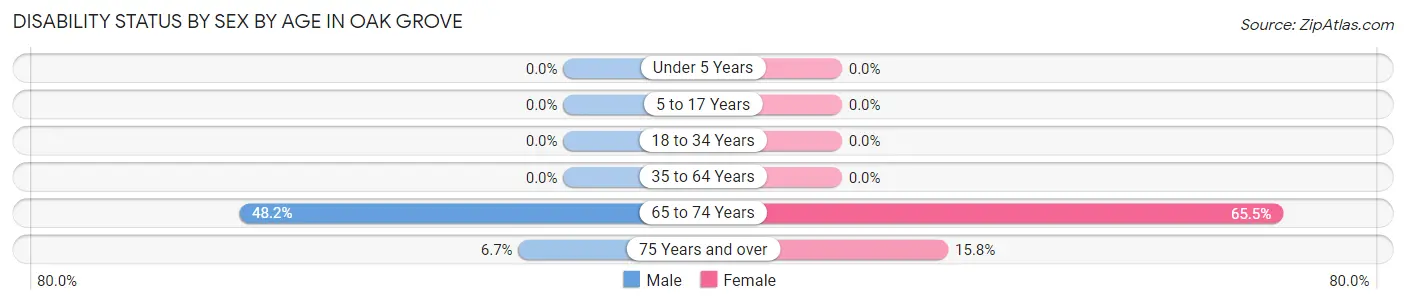
| Age Bracket | Male | Female |
| Under 5 Years | 0 (0.0%) | 0 (0.0%) |
| 5 to 17 Years | 0 (0.0%) | 0 (0.0%) |
| 18 to 34 Years | 0 (0.0%) | 0 (0.0%) |
| 35 to 64 Years | 0 (0.0%) | 0 (0.0%) |
| 65 to 74 Years | 13 (48.1%) | 57 (65.5%) |
| 75 Years and over | 2 (6.7%) | 3 (15.8%) |
Disability Class by Sex by Age in Oak Grove
Disability Class: Hearing Difficulty
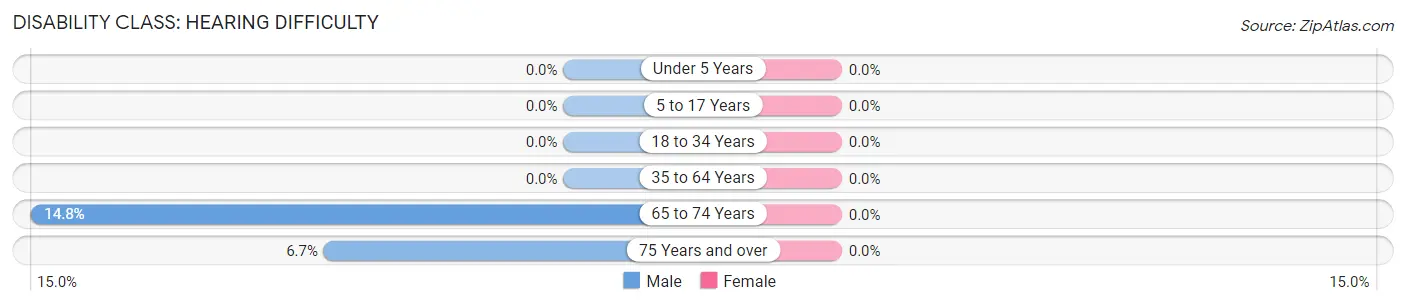
| Age Bracket | Male | Female |
| Under 5 Years | 0 (0.0%) | 0 (0.0%) |
| 5 to 17 Years | 0 (0.0%) | 0 (0.0%) |
| 18 to 34 Years | 0 (0.0%) | 0 (0.0%) |
| 35 to 64 Years | 0 (0.0%) | 0 (0.0%) |
| 65 to 74 Years | 4 (14.8%) | 0 (0.0%) |
| 75 Years and over | 2 (6.7%) | 0 (0.0%) |
Disability Class: Vision Difficulty
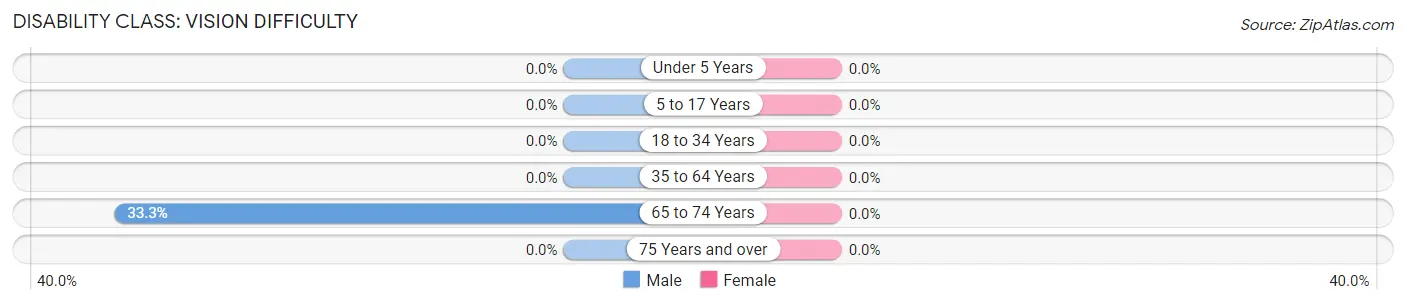
| Age Bracket | Male | Female |
| Under 5 Years | 0 (0.0%) | 0 (0.0%) |
| 5 to 17 Years | 0 (0.0%) | 0 (0.0%) |
| 18 to 34 Years | 0 (0.0%) | 0 (0.0%) |
| 35 to 64 Years | 0 (0.0%) | 0 (0.0%) |
| 65 to 74 Years | 9 (33.3%) | 0 (0.0%) |
| 75 Years and over | 0 (0.0%) | 0 (0.0%) |
Disability Class: Cognitive Difficulty
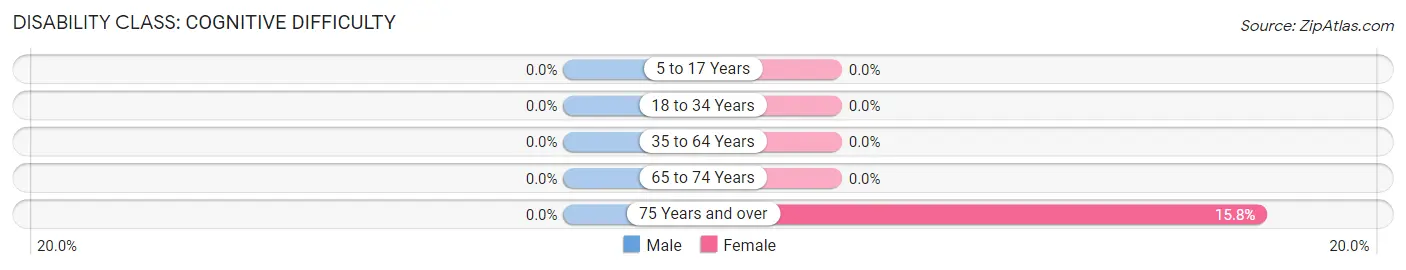
| Age Bracket | Male | Female |
| 5 to 17 Years | 0 (0.0%) | 0 (0.0%) |
| 18 to 34 Years | 0 (0.0%) | 0 (0.0%) |
| 35 to 64 Years | 0 (0.0%) | 0 (0.0%) |
| 65 to 74 Years | 0 (0.0%) | 0 (0.0%) |
| 75 Years and over | 0 (0.0%) | 3 (15.8%) |
Disability Class: Ambulatory Difficulty
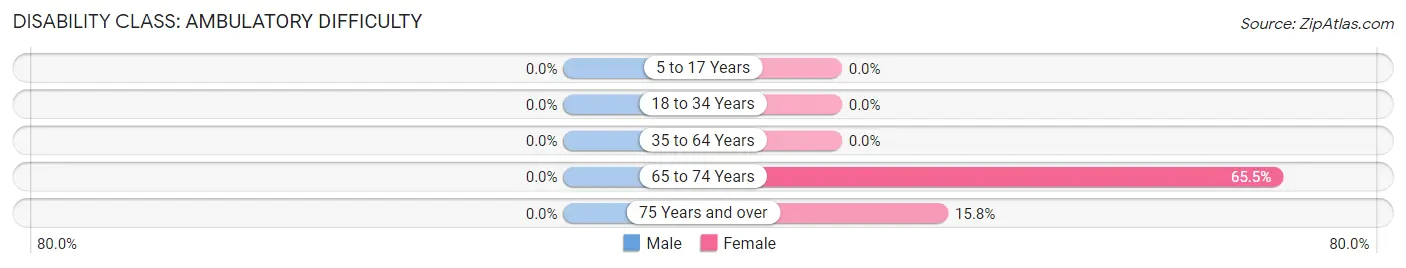
| Age Bracket | Male | Female |
| 5 to 17 Years | 0 (0.0%) | 0 (0.0%) |
| 18 to 34 Years | 0 (0.0%) | 0 (0.0%) |
| 35 to 64 Years | 0 (0.0%) | 0 (0.0%) |
| 65 to 74 Years | 0 (0.0%) | 57 (65.5%) |
| 75 Years and over | 0 (0.0%) | 3 (15.8%) |
Disability Class: Self-Care Difficulty
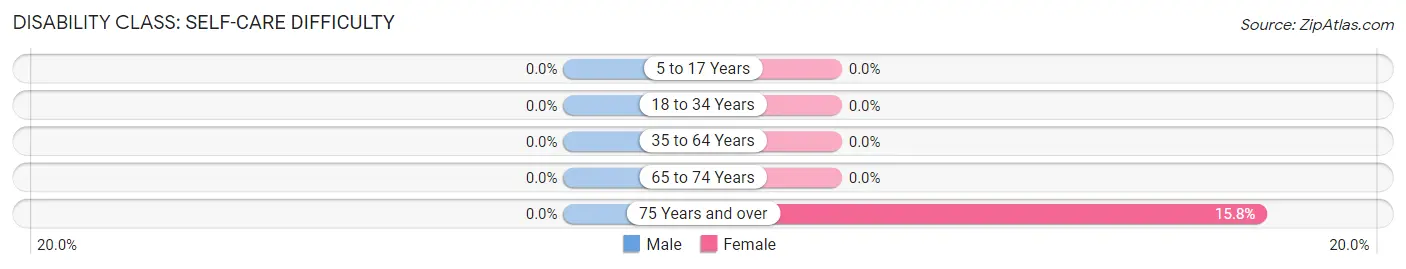
| Age Bracket | Male | Female |
| 5 to 17 Years | 0 (0.0%) | 0 (0.0%) |
| 18 to 34 Years | 0 (0.0%) | 0 (0.0%) |
| 35 to 64 Years | 0 (0.0%) | 0 (0.0%) |
| 65 to 74 Years | 0 (0.0%) | 0 (0.0%) |
| 75 Years and over | 0 (0.0%) | 3 (15.8%) |
Technology Access in Oak Grove
Computing Device Access in Oak Grove
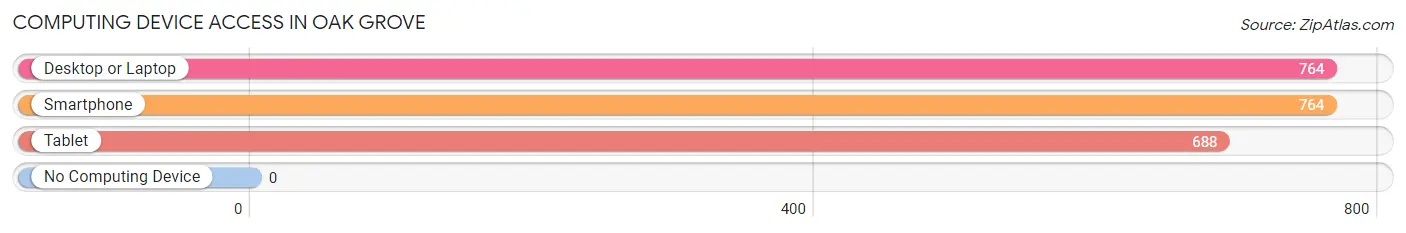
| Device Type | # Households | % Households |
| Desktop or Laptop | 764 | 100.0% |
| Smartphone | 764 | 100.0% |
| Tablet | 688 | 90.0% |
| No Computing Device | 0 | 0.0% |
| Total | 764 | 100.0% |
Internet Access in Oak Grove
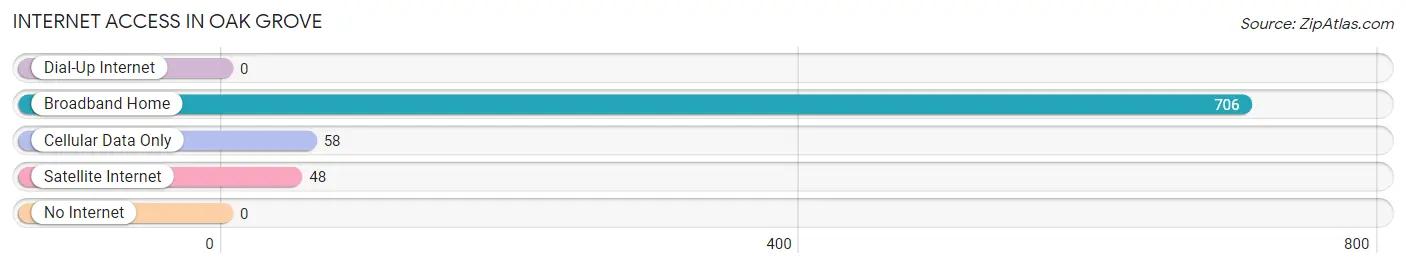
| Internet Type | # Households | % Households |
| Dial-Up Internet | 0 | 0.0% |
| Broadband Home | 706 | 92.4% |
| Cellular Data Only | 58 | 7.6% |
| Satellite Internet | 48 | 6.3% |
| No Internet | 0 | 0.0% |
| Total | 764 | 100.0% |
Oak Grove Summary
History
Oak Grove is an unincorporated community located in the northern part of Prince William County, Virginia. It is situated on the banks of the Occoquan River, about 25 miles southwest of Washington, D.C. The area was first settled in the late 1700s by a group of Quakers from Pennsylvania. The Quakers established a small farming community and built a meeting house, which still stands today.
In the early 1800s, the area was known as “Oak Grove” due to the abundance of oak trees in the area. The community grew slowly over the years, and by the mid-1800s, it had become a thriving agricultural center. The area was home to several mills, including a grist mill, a saw mill, and a woolen mill.
In the late 1800s, the area began to experience rapid growth due to the construction of the Washington and Old Dominion Railroad. The railroad brought new people and businesses to the area, and the population of Oak Grove began to grow.
In the early 1900s, the area was home to several large farms, as well as a number of small businesses. The area was also home to a number of churches, including the Oak Grove United Methodist Church, which was established in 1891.
In the mid-1900s, the area began to experience a decline in population as people moved away from rural areas to the cities. However, the area has experienced a resurgence in recent years, as people have moved back to the area to take advantage of its rural charm and proximity to Washington, D.C.
Geography
Oak Grove is located in the northern part of Prince William County, Virginia. It is situated on the banks of the Occoquan River, about 25 miles southwest of Washington, D.C. The area is mostly rural, with rolling hills and wooded areas. The climate is temperate, with hot summers and cold winters.
The area is home to a number of parks and recreational areas, including Occoquan Regional Park, which offers a variety of outdoor activities, such as hiking, biking, and fishing. The area is also home to a number of historic sites, including the Oak Grove United Methodist Church, which was established in 1891.
Economy
Oak Grove is primarily a rural area, and the economy is largely based on agriculture. The area is home to several large farms, as well as a number of small businesses. The area is also home to a number of churches, including the Oak Grove United Methodist Church, which was established in 1891.
The area is also home to a number of government agencies, including the Prince William County Government Center, which is located in nearby Manassas. The area is also home to a number of technology companies, including the Oak Grove Technology Park, which is located in nearby Manassas.
Demographics
As of the 2010 census, the population of Oak Grove was 1,845. The racial makeup of the area was 79.3% White, 14.2% African American, 0.3% Native American, 1.2% Asian, and 4.9% from other races. The median household income was $76,944, and the median age was 37.
Conclusion
Oak Grove is an unincorporated community located in the northern part of Prince William County, Virginia. It is situated on the banks of the Occoquan River, about 25 miles southwest of Washington, D.C. The area was first settled in the late 1700s by a group of Quakers from Pennsylvania. The area has experienced a resurgence in recent years, as people have moved back to the area to take advantage of its rural charm and proximity to Washington, D.C. The economy is largely based on agriculture, and the area is also home to a number of government agencies and technology companies. As of the 2010 census, the population of Oak Grove was 1,845. The racial makeup of the area was 79.3% White, 14.2% African American, 0.3% Native American, 1.2% Asian, and 4.9% from other races. The median household income was $76,944, and the median age was 37.
Common Questions
What is Per Capita Income in Oak Grove?
Per Capita income in Oak Grove is $53,380.
What is the Median Family Income in Oak Grove?
Median Family Income in Oak Grove is $143,542.
What is the Median Household income in Oak Grove?
Median Household Income in Oak Grove is $175,161.
What is Income or Wage Gap in Oak Grove?
Income or Wage Gap in Oak Grove is 36.2%.
Women in Oak Grove earn 63.8 cents for every dollar earned by a man.
What is Inequality or Gini Index in Oak Grove?
Inequality or Gini Index in Oak Grove is 0.29.
What is the Total Population of Oak Grove?
Total Population of Oak Grove is 2,533.
What is the Total Male Population of Oak Grove?
Total Male Population of Oak Grove is 1,258.
What is the Total Female Population of Oak Grove?
Total Female Population of Oak Grove is 1,275.
What is the Ratio of Males per 100 Females in Oak Grove?
There are 98.67 Males per 100 Females in Oak Grove.
What is the Ratio of Females per 100 Males in Oak Grove?
There are 101.35 Females per 100 Males in Oak Grove.
What is the Median Population Age in Oak Grove?
Median Population Age in Oak Grove is 33.1 Years.
What is the Average Family Size in Oak Grove
Average Family Size in Oak Grove is 3.4 People.
What is the Average Household Size in Oak Grove
Average Household Size in Oak Grove is 3.3 People.
How Large is the Labor Force in Oak Grove?
There are 1,590 People in the Labor Forcein in Oak Grove.
What is the Percentage of People in the Labor Force in Oak Grove?
77.0% of People are in the Labor Force in Oak Grove.
What is the Unemployment Rate in Oak Grove?
Unemployment Rate in Oak Grove is 0.9%.