Cities with the Highest Percentage of Immigrants from Bangladesh in Virginia
RELATED REPORTS & OPTIONS
Bangladesh
Virginia
Compare Cities
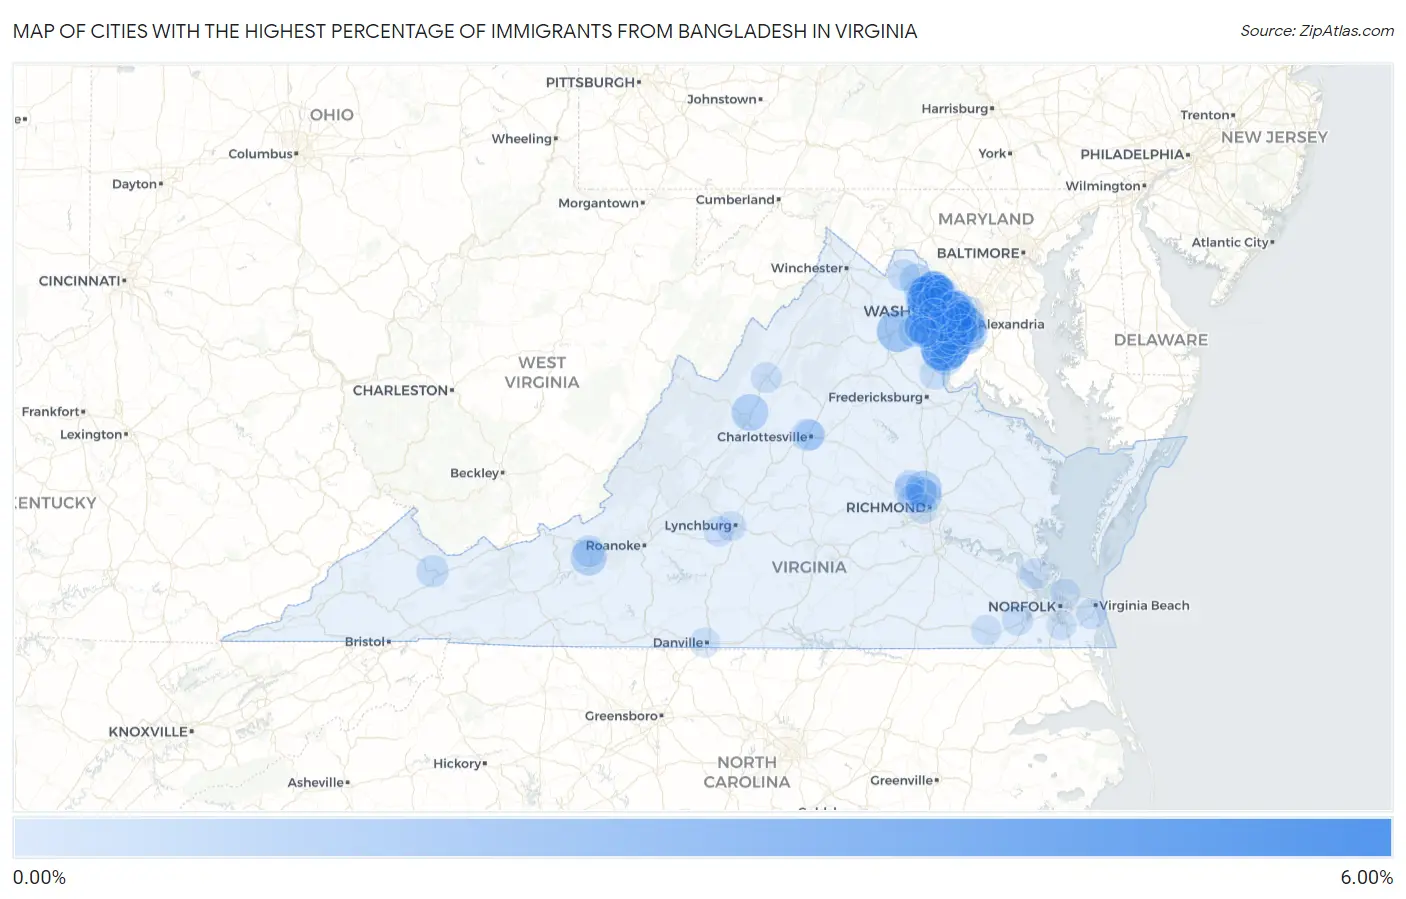
Map of Cities with the Highest Percentage of Immigrants from Bangladesh in Virginia
0.00%
6.00%
Cities with the Highest Percentage of Immigrants from Bangladesh in Virginia
| City | Bangladesh | vs State | vs National | |
| 1. | Kincora | 5.99% | 0.14%(+5.85)#1 | 0.082%(+5.91)#10 |
| 2. | Potomac Mills | 3.24% | 0.14%(+3.10)#2 | 0.082%(+3.16)#22 |
| 3. | Oak Grove | 2.84% | 0.14%(+2.70)#3 | 0.082%(+2.76)#28 |
| 4. | Sterling | 2.52% | 0.14%(+2.38)#4 | 0.082%(+2.44)#37 |
| 5. | Merrifield | 2.42% | 0.14%(+2.28)#5 | 0.082%(+2.34)#40 |
| 6. | New Baltimore | 1.88% | 0.14%(+1.74)#6 | 0.082%(+1.80)#50 |
| 7. | Chantilly | 1.71% | 0.14%(+1.57)#7 | 0.082%(+1.63)#58 |
| 8. | Goose Creek | 1.42% | 0.14%(+1.28)#8 | 0.082%(+1.33)#77 |
| 9. | Woodbridge | 1.35% | 0.14%(+1.21)#9 | 0.082%(+1.26)#82 |
| 10. | Springfield | 1.32% | 0.14%(+1.18)#10 | 0.082%(+1.23)#84 |
| 11. | Lorton | 1.27% | 0.14%(+1.13)#11 | 0.082%(+1.19)#86 |
| 12. | Hutchison | 1.18% | 0.14%(+1.04)#12 | 0.082%(+1.10)#94 |
| 13. | Verona | 1.11% | 0.14%(+0.973)#13 | 0.082%(+1.03)#100 |
| 14. | Montclair | 1.03% | 0.14%(+0.893)#14 | 0.082%(+0.950)#112 |
| 15. | Manassas Park | 1.00% | 0.14%(+0.865)#15 | 0.082%(+0.923)#115 |
| 16. | Merrimac | 0.99% | 0.14%(+0.853)#16 | 0.082%(+0.911)#117 |
| 17. | Glen Allen | 0.97% | 0.14%(+0.833)#17 | 0.082%(+0.891)#120 |
| 18. | Pimmit Hills | 0.94% | 0.14%(+0.799)#18 | 0.082%(+0.856)#127 |
| 19. | Sudley | 0.92% | 0.14%(+0.783)#19 | 0.082%(+0.841)#131 |
| 20. | Fair Lakes | 0.89% | 0.14%(+0.746)#20 | 0.082%(+0.804)#138 |
| 21. | Cascades | 0.89% | 0.14%(+0.745)#21 | 0.082%(+0.803)#140 |
| 22. | Hybla Valley | 0.85% | 0.14%(+0.711)#22 | 0.082%(+0.769)#152 |
| 23. | Woodlawn Cdp Fairfax County | 0.73% | 0.14%(+0.587)#23 | 0.082%(+0.645)#180 |
| 24. | Sugarland Run | 0.73% | 0.14%(+0.586)#24 | 0.082%(+0.644)#181 |
| 25. | Newington | 0.67% | 0.14%(+0.531)#25 | 0.082%(+0.589)#195 |
| 26. | Mount Vernon | 0.64% | 0.14%(+0.499)#26 | 0.082%(+0.557)#201 |
| 27. | Lakeside | 0.63% | 0.14%(+0.487)#27 | 0.082%(+0.545)#205 |
| 28. | Dulles Town Center | 0.59% | 0.14%(+0.455)#28 | 0.082%(+0.513)#218 |
| 29. | Leesylvania | 0.56% | 0.14%(+0.417)#29 | 0.082%(+0.474)#232 |
| 30. | Cherry Hill | 0.55% | 0.14%(+0.407)#30 | 0.082%(+0.465)#236 |
| 31. | Countryside | 0.53% | 0.14%(+0.389)#31 | 0.082%(+0.447)#240 |
| 32. | Leesburg | 0.51% | 0.14%(+0.372)#32 | 0.082%(+0.430)#245 |
| 33. | University Of Virginia | 0.42% | 0.14%(+0.285)#33 | 0.082%(+0.343)#290 |
| 34. | Centreville | 0.42% | 0.14%(+0.279)#34 | 0.082%(+0.336)#295 |
| 35. | Arlington | 0.40% | 0.14%(+0.255)#35 | 0.082%(+0.313)#316 |
| 36. | Woodburn | 0.38% | 0.14%(+0.242)#36 | 0.082%(+0.300)#328 |
| 37. | Dale City | 0.38% | 0.14%(+0.242)#37 | 0.082%(+0.299)#329 |
| 38. | Richlands | 0.38% | 0.14%(+0.240)#38 | 0.082%(+0.298)#332 |
| 39. | Burke | 0.37% | 0.14%(+0.227)#39 | 0.082%(+0.284)#347 |
| 40. | Newington Forest | 0.36% | 0.14%(+0.224)#40 | 0.082%(+0.282)#348 |
| 41. | Herndon | 0.35% | 0.14%(+0.212)#41 | 0.082%(+0.270)#356 |
| 42. | Oakton | 0.35% | 0.14%(+0.208)#42 | 0.082%(+0.266)#359 |
| 43. | Lincolnia | 0.33% | 0.14%(+0.193)#43 | 0.082%(+0.251)#373 |
| 44. | Broadlands | 0.32% | 0.14%(+0.183)#44 | 0.082%(+0.240)#386 |
| 45. | Bailey S Crossroads | 0.30% | 0.14%(+0.159)#45 | 0.082%(+0.217)#411 |
| 46. | Hamilton | 0.30% | 0.14%(+0.157)#46 | 0.082%(+0.215)#415 |
| 47. | West Springfield | 0.29% | 0.14%(+0.151)#47 | 0.082%(+0.209)#420 |
| 48. | South Riding | 0.29% | 0.14%(+0.148)#48 | 0.082%(+0.206)#427 |
| 49. | Rose Hill Cdp Fairfax County | 0.28% | 0.14%(+0.139)#49 | 0.082%(+0.196)#438 |
| 50. | Blacksburg | 0.28% | 0.14%(+0.137)#50 | 0.082%(+0.195)#439 |
| 51. | West Falls Church | 0.28% | 0.14%(+0.137)#51 | 0.082%(+0.194)#442 |
| 52. | Laurel | 0.27% | 0.14%(+0.125)#52 | 0.082%(+0.183)#459 |
| 53. | Linton Hall | 0.26% | 0.14%(+0.125)#53 | 0.082%(+0.183)#461 |
| 54. | Alexandria | 0.26% | 0.14%(+0.117)#54 | 0.082%(+0.175)#468 |
| 55. | Groveton | 0.25% | 0.14%(+0.113)#55 | 0.082%(+0.171)#473 |
| 56. | Huntington | 0.25% | 0.14%(+0.112)#56 | 0.082%(+0.170)#476 |
| 57. | Kings Park West | 0.25% | 0.14%(+0.109)#57 | 0.082%(+0.167)#481 |
| 58. | Tysons | 0.25% | 0.14%(+0.107)#58 | 0.082%(+0.164)#487 |
| 59. | Aquia Harbour | 0.24% | 0.14%(+0.105)#59 | 0.082%(+0.163)#489 |
| 60. | Bull Run | 0.23% | 0.14%(+0.095)#60 | 0.082%(+0.153)#507 |
| 61. | Midlothian | 0.21% | 0.14%(+0.069)#61 | 0.082%(+0.127)#540 |
| 62. | Ashburn | 0.20% | 0.14%(+0.063)#62 | 0.082%(+0.120)#550 |
| 63. | Reston | 0.19% | 0.14%(+0.048)#63 | 0.082%(+0.106)#573 |
| 64. | Lake Ridge | 0.19% | 0.14%(+0.046)#64 | 0.082%(+0.104)#579 |
| 65. | Vienna | 0.18% | 0.14%(+0.043)#65 | 0.082%(+0.101)#587 |
| 66. | Loudoun Valley Estates | 0.18% | 0.14%(+0.041)#66 | 0.082%(+0.099)#593 |
| 67. | Suffolk | 0.18% | 0.14%(+0.040)#67 | 0.082%(+0.097)#595 |
| 68. | Falls Church | 0.17% | 0.14%(+0.032)#68 | 0.082%(+0.090)#614 |
| 69. | Short Pump | 0.16% | 0.14%(+0.019)#69 | 0.082%(+0.076)#642 |
| 70. | Burke Centre | 0.15% | 0.14%(+0.005)#70 | 0.082%(+0.063)#669 |
| 71. | Annandale | 0.14% | 0.14%(+0.004)#71 | 0.082%(+0.062)#674 |
| 72. | Seven Corners | 0.13% | 0.14%(-0.008)#72 | 0.082%(+0.049)#706 |
| 73. | Harrisonburg | 0.13% | 0.14%(-0.012)#73 | 0.082%(+0.045)#715 |
| 74. | Dranesville | 0.12% | 0.14%(-0.016)#74 | 0.082%(+0.041)#727 |
| 75. | Laurel Hill | 0.12% | 0.14%(-0.017)#75 | 0.082%(+0.041)#732 |
| 76. | North Springfield | 0.12% | 0.14%(-0.024)#76 | 0.082%(+0.034)#754 |
| 77. | Fairfax Station | 0.11% | 0.14%(-0.026)#77 | 0.082%(+0.032)#762 |
| 78. | Lake Barcroft | 0.11% | 0.14%(-0.026)#78 | 0.082%(+0.031)#765 |
| 79. | Newport News | 0.11% | 0.14%(-0.028)#79 | 0.082%(+0.029)#772 |
| 80. | Fair Oaks | 0.11% | 0.14%(-0.032)#80 | 0.082%(+0.026)#783 |
| 81. | Charlottesville | 0.11% | 0.14%(-0.034)#81 | 0.082%(+0.024)#793 |
| 82. | Wyndham | 0.091% | 0.14%(-0.049)#82 | 0.082%(+0.009)#845 |
| 83. | Virginia Beach | 0.087% | 0.14%(-0.053)#83 | 0.082%(+0.005)#864 |
| 84. | Kingstowne | 0.071% | 0.14%(-0.068)#84 | 0.082%(-0.011)#931 |
| 85. | Forest | 0.061% | 0.14%(-0.079)#85 | 0.082%(-0.021)#983 |
| 86. | Fairfax | 0.049% | 0.14%(-0.090)#86 | 0.082%(-0.032)#1,031 |
| 87. | Mcnair | 0.045% | 0.14%(-0.095)#87 | 0.082%(-0.037)#1,065 |
| 88. | Danville | 0.040% | 0.14%(-0.100)#88 | 0.082%(-0.042)#1,095 |
| 89. | Franklin | 0.037% | 0.14%(-0.103)#89 | 0.082%(-0.045)#1,115 |
| 90. | Richmond | 0.033% | 0.14%(-0.106)#90 | 0.082%(-0.049)#1,140 |
| 91. | Great Falls | 0.033% | 0.14%(-0.106)#91 | 0.082%(-0.049)#1,141 |
| 92. | Norfolk | 0.033% | 0.14%(-0.106)#92 | 0.082%(-0.049)#1,142 |
| 93. | Lowes Island | 0.027% | 0.14%(-0.113)#93 | 0.082%(-0.055)#1,193 |
| 94. | Buckhall | 0.025% | 0.14%(-0.115)#94 | 0.082%(-0.057)#1,201 |
| 95. | Chesapeake | 0.016% | 0.14%(-0.123)#95 | 0.082%(-0.066)#1,277 |
| 96. | Greenbriar | 0.013% | 0.14%(-0.127)#96 | 0.082%(-0.069)#1,302 |
| 97. | Manassas | 0.012% | 0.14%(-0.128)#97 | 0.082%(-0.070)#1,311 |
| 98. | Tuckahoe | 0.010% | 0.14%(-0.129)#98 | 0.082%(-0.072)#1,324 |
| 99. | Mclean | 0.010% | 0.14%(-0.130)#99 | 0.082%(-0.072)#1,326 |
| 100. | Lynchburg | 0.0088% | 0.14%(-0.131)#100 | 0.082%(-0.073)#1,339 |
Common Questions
What are the Top 10 Cities with the Highest Percentage of Immigrants from Bangladesh in Virginia?
Top 10 Cities with the Highest Percentage of Immigrants from Bangladesh in Virginia are:
#1
3.24%
#2
2.84%
#3
2.52%
#4
2.42%
#5
1.88%
#6
1.71%
#7
1.35%
#8
1.32%
#9
1.27%
#10
1.11%
What city has the Highest Percentage of Immigrants from Bangladesh in Virginia?
Potomac Mills has the Highest Percentage of Immigrants from Bangladesh in Virginia with 3.24%.
What is the Percentage of Immigrants from Bangladesh in the State of Virginia?
Percentage of Immigrants from Bangladesh in Virginia is 0.14%.
What is the Percentage of Immigrants from Bangladesh in the United States?
Percentage of Immigrants from Bangladesh in the United States is 0.082%.