Zip Codes with the Highest Percentage of Population Employed in Architecture & Engineering in Arlington, VA
RELATED REPORTS & OPTIONS
Architecture & Engineering
Arlington
Compare Zip Codes
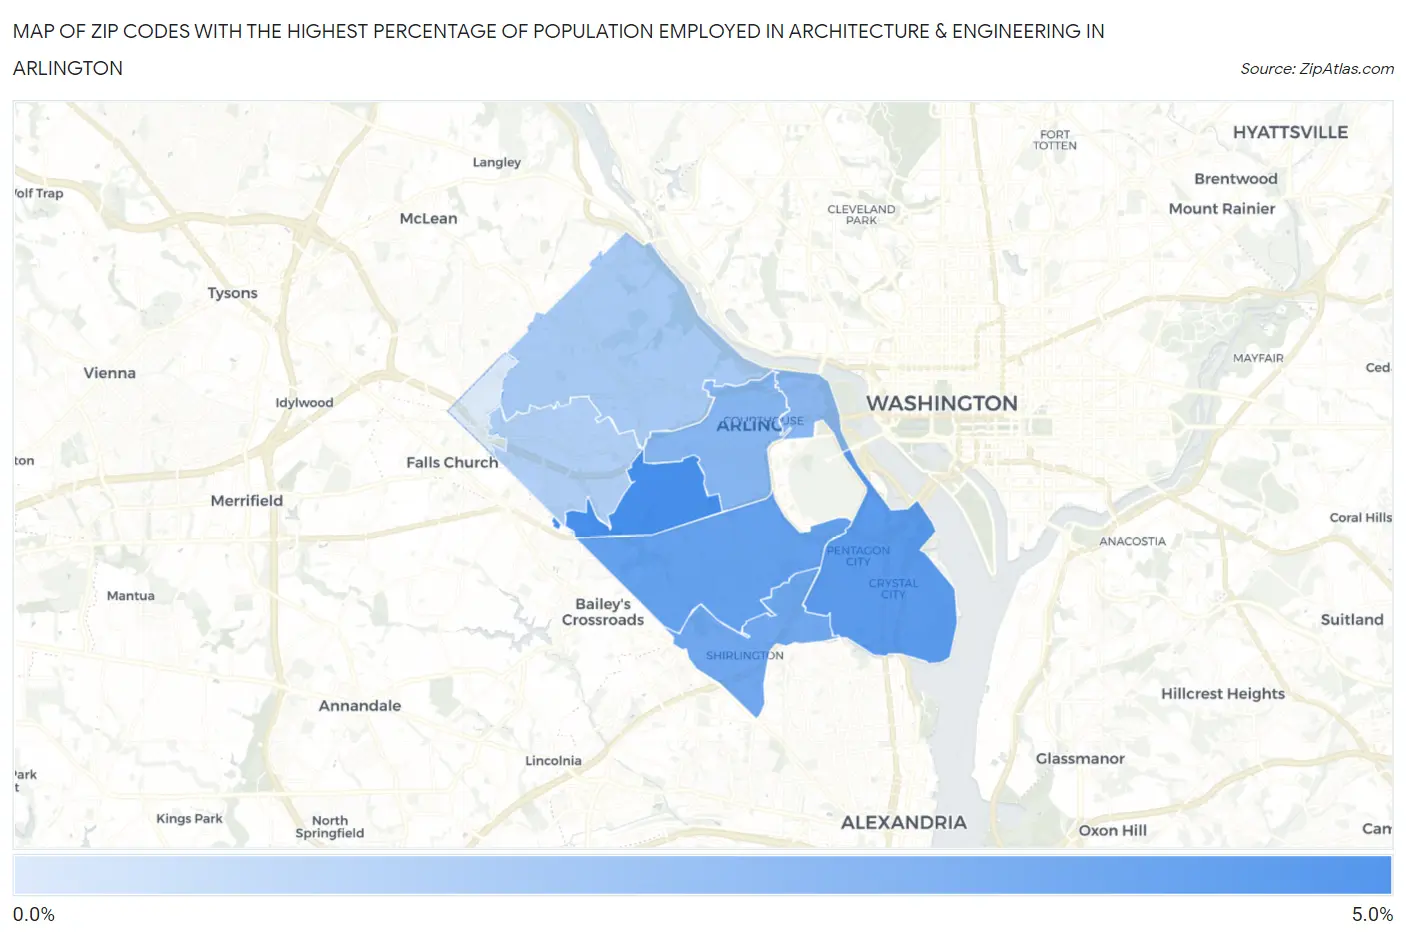
Map of Zip Codes with the Highest Percentage of Population Employed in Architecture & Engineering in Arlington
0.51%
4.1%
Zip Codes with the Highest Percentage of Population Employed in Architecture & Engineering in Arlington, VA
| Zip Code | % Employed | vs State | vs National | |
| 1. | 22203 | 4.1% | 2.3%(+1.75)#84 | 2.1%(+1.91)#2,687 |
| 2. | 22202 | 3.6% | 2.3%(+1.26)#113 | 2.1%(+1.41)#3,590 |
| 3. | 22204 | 3.3% | 2.3%(+1.04)#128 | 2.1%(+1.20)#4,076 |
| 4. | 22206 | 3.1% | 2.3%(+0.760)#146 | 2.1%(+0.915)#4,838 |
| 5. | 22201 | 2.5% | 2.3%(+0.189)#211 | 2.1%(+0.344)#7,022 |
| 6. | 22209 | 2.4% | 2.3%(+0.138)#216 | 2.1%(+0.293)#7,266 |
| 7. | 22207 | 1.7% | 2.3%(-0.559)#323 | 2.1%(-0.403)#11,189 |
| 8. | 22205 | 1.5% | 2.3%(-0.796)#357 | 2.1%(-0.640)#12,822 |
| 9. | 22213 | 0.51% | 2.3%(-1.80)#519 | 2.1%(-1.64)#20,248 |
1
Common Questions
What are the Top 5 Zip Codes with the Highest Percentage of Population Employed in Architecture & Engineering in Arlington, VA?
Top 5 Zip Codes with the Highest Percentage of Population Employed in Architecture & Engineering in Arlington, VA are:
What zip code has the Highest Percentage of Population Employed in Architecture & Engineering in Arlington, VA?
22203 has the Highest Percentage of Population Employed in Architecture & Engineering in Arlington, VA with 4.1%.
What is the Percentage of Population Employed in Architecture & Engineering in Arlington, VA?
Percentage of Population Employed in Architecture & Engineering in Arlington is 2.9%.
What is the Percentage of Population Employed in Architecture & Engineering in Virginia?
Percentage of Population Employed in Architecture & Engineering in Virginia is 2.3%.
What is the Percentage of Population Employed in Architecture & Engineering in the United States?
Percentage of Population Employed in Architecture & Engineering in the United States is 2.1%.