Belmont Estates, VA Map & Demographics
Belmont Estates Map
Belmont Estates Overview
$47,996
PER CAPITA INCOME
$98,603
AVG FAMILY INCOME
$95,917
AVG HOUSEHOLD INCOME
0.34
INEQUALITY / GINI INDEX
1,192
TOTAL POPULATION
625
MALE POPULATION
567
FEMALE POPULATION
110.23
MALES / 100 FEMALES
90.72
FEMALES / 100 MALES
64.1
MEDIAN AGE
2.6
AVG FAMILY SIZE
2.5
AVG HOUSEHOLD SIZE
431
LABOR FORCE [ PEOPLE ]
42.7%
PERCENT IN LABOR FORCE
Income in Belmont Estates
Income Overview in Belmont Estates
Per Capita Income in Belmont Estates is $47,996, while median incomes of families and households are $98,603 and $95,917 respectively.
| Characteristic | Number | Measure |
| Per Capita Income | 1,192 | $47,996 |
| Median Family Income | 437 | $98,603 |
| Mean Family Income | 437 | $122,369 |
| Median Household Income | 471 | $95,917 |
| Mean Household Income | 471 | $117,926 |
| Income Deficit | 437 | $0 |
| Wage / Income Gap (%) | 1,192 | 0.00% |
| Wage / Income Gap ($) | 1,192 | 100.00¢ per $1 |
| Gini / Inequality Index | 1,192 | 0.34 |
Earnings by Sex in Belmont Estates
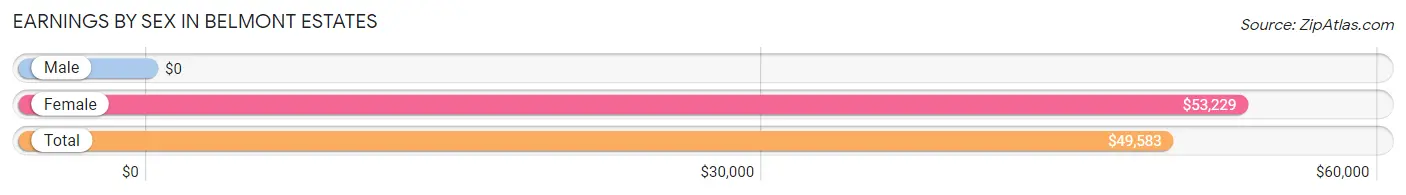
| Sex | Number | Average Earnings |
| Male | 242 (54.4%) | $0 |
| Female | 203 (45.6%) | $53,229 |
| Total | 445 (100.0%) | $49,583 |
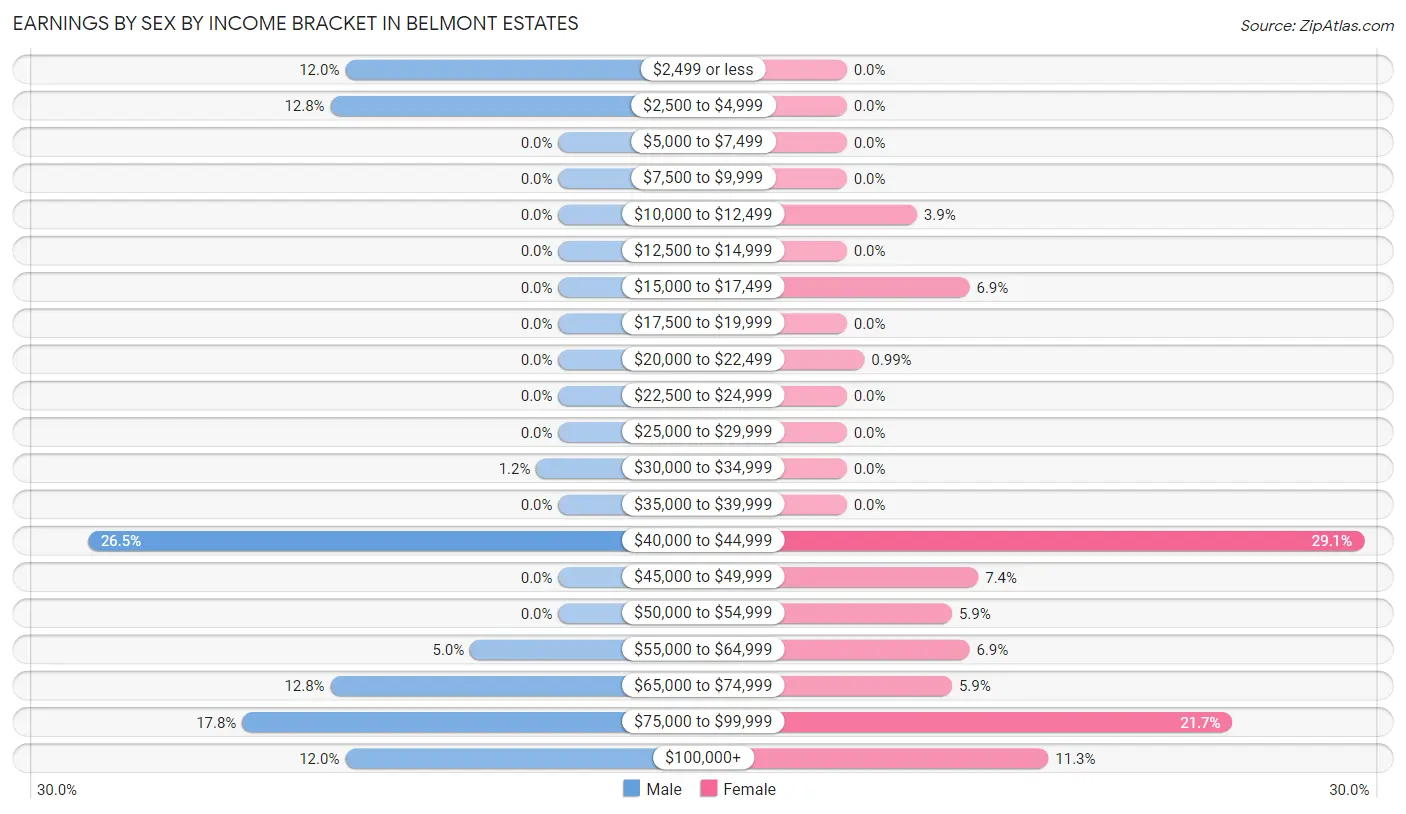
Earnings by Sex by Income Bracket in Belmont Estates
The most common earnings brackets in Belmont Estates are $40,000 to $44,999 for men (64 | 26.5%) and $40,000 to $44,999 for women (59 | 29.1%).
| Income | Male | Female |
| $2,499 or less | 29 (12.0%) | 0 (0.0%) |
| $2,500 to $4,999 | 31 (12.8%) | 0 (0.0%) |
| $5,000 to $7,499 | 0 (0.0%) | 0 (0.0%) |
| $7,500 to $9,999 | 0 (0.0%) | 0 (0.0%) |
| $10,000 to $12,499 | 0 (0.0%) | 8 (3.9%) |
| $12,500 to $14,999 | 0 (0.0%) | 0 (0.0%) |
| $15,000 to $17,499 | 0 (0.0%) | 14 (6.9%) |
| $17,500 to $19,999 | 0 (0.0%) | 0 (0.0%) |
| $20,000 to $22,499 | 0 (0.0%) | 2 (1.0%) |
| $22,500 to $24,999 | 0 (0.0%) | 0 (0.0%) |
| $25,000 to $29,999 | 0 (0.0%) | 0 (0.0%) |
| $30,000 to $34,999 | 3 (1.2%) | 0 (0.0%) |
| $35,000 to $39,999 | 0 (0.0%) | 0 (0.0%) |
| $40,000 to $44,999 | 64 (26.5%) | 59 (29.1%) |
| $45,000 to $49,999 | 0 (0.0%) | 15 (7.4%) |
| $50,000 to $54,999 | 0 (0.0%) | 12 (5.9%) |
| $55,000 to $64,999 | 12 (5.0%) | 14 (6.9%) |
| $65,000 to $74,999 | 31 (12.8%) | 12 (5.9%) |
| $75,000 to $99,999 | 43 (17.8%) | 44 (21.7%) |
| $100,000+ | 29 (12.0%) | 23 (11.3%) |
| Total | 242 (100.0%) | 203 (100.0%) |
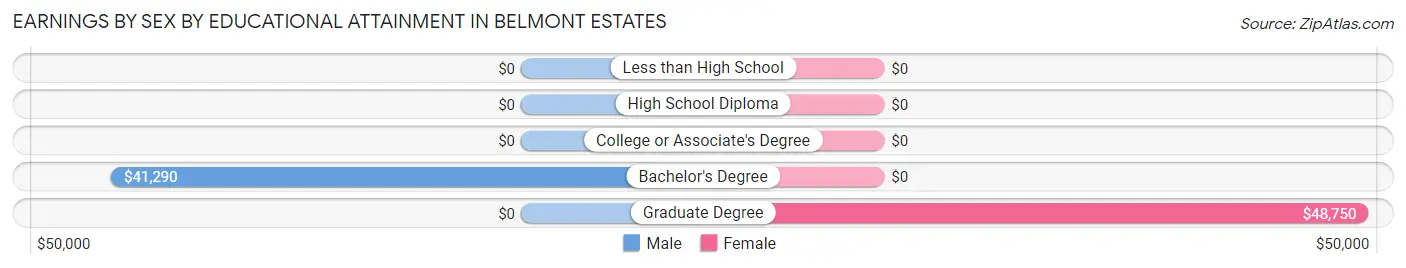
Earnings by Sex by Educational Attainment in Belmont Estates
Average earnings in Belmont Estates are $63,021 for men and $53,229 for women, a difference of 15.5%. Men with an educational attainment of bachelor's degree enjoy the highest average annual earnings of $41,290, while those with bachelor's degree education earn the least with $41,290. Women with an educational attainment of graduate degree earn the most with the average annual earnings of $48,750, while those with graduate degree education have the smallest earnings of $48,750.
| Educational Attainment | Male Income | Female Income |
| Less than High School | - | - |
| High School Diploma | - | - |
| College or Associate's Degree | - | - |
| Bachelor's Degree | $41,290 | $0 |
| Graduate Degree | - | - |
| Total | $63,021 | $53,229 |
Family Income in Belmont Estates
Family Income Brackets in Belmont Estates
According to the Belmont Estates family income data, there are 135 families falling into the $100,000 to $149,999 income range, which is the most common income bracket and makes up 30.9% of all families.
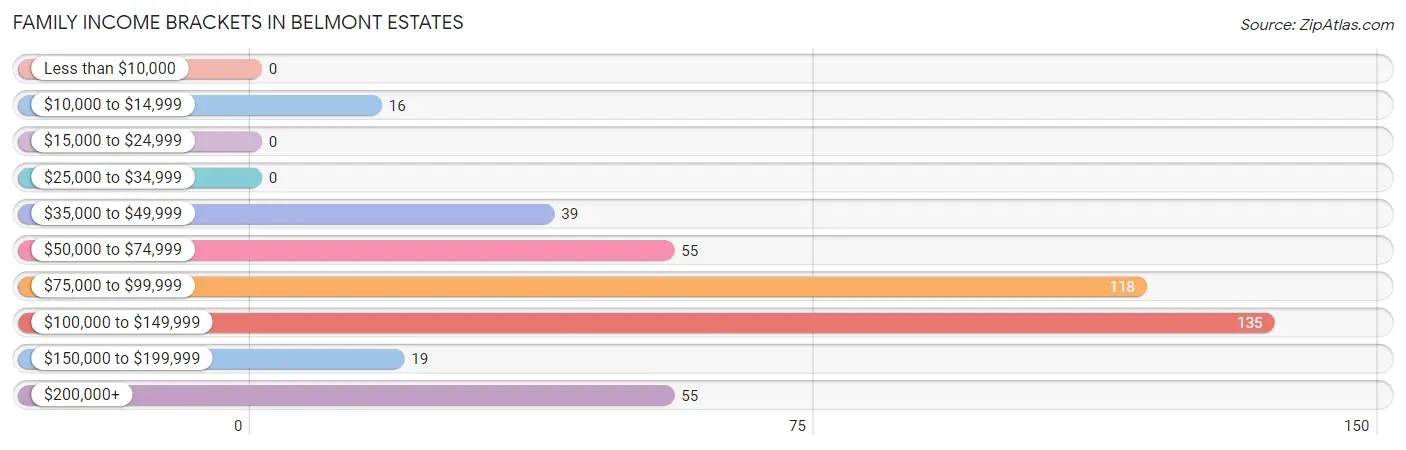
| Income Bracket | # Families | % Families |
| Less than $10,000 | 0 | 0.0% |
| $10,000 to $14,999 | 16 | 3.7% |
| $15,000 to $24,999 | 0 | 0.0% |
| $25,000 to $34,999 | 0 | 0.0% |
| $35,000 to $49,999 | 39 | 8.9% |
| $50,000 to $74,999 | 55 | 12.6% |
| $75,000 to $99,999 | 118 | 27.0% |
| $100,000 to $149,999 | 135 | 30.9% |
| $150,000 to $199,999 | 19 | 4.3% |
| $200,000+ | 55 | 12.6% |
Family Income by Famaliy Size in Belmont Estates
2-person families (320 | 73.2%) account for the highest median family income in Belmont Estates with $98,971 per family, while 2-person families (320 | 73.2%) have the highest median income of $49,486 per family member.
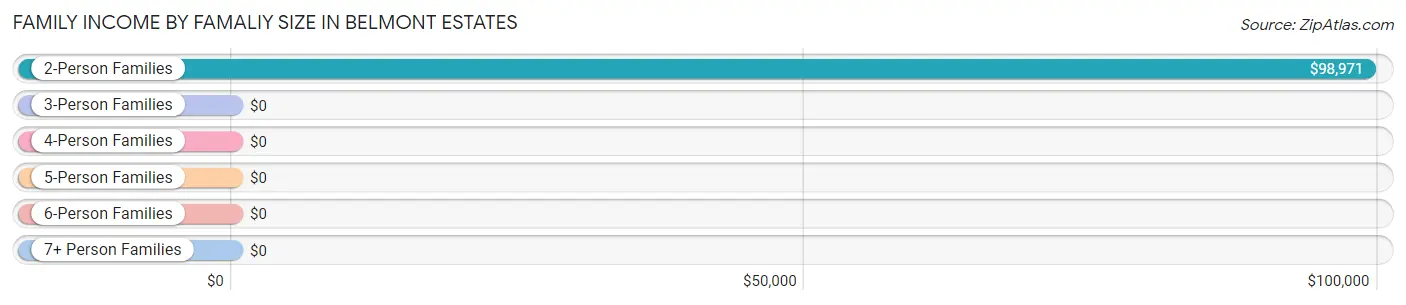
| Income Bracket | # Families | Median Income |
| 2-Person Families | 320 (73.2%) | $98,971 |
| 3-Person Families | 29 (6.6%) | $0 |
| 4-Person Families | 78 (17.8%) | $0 |
| 5-Person Families | 0 (0.0%) | $0 |
| 6-Person Families | 0 (0.0%) | $0 |
| 7+ Person Families | 10 (2.3%) | $0 |
| Total | 437 (100.0%) | $98,603 |
Family Income by Number of Earners in Belmont Estates
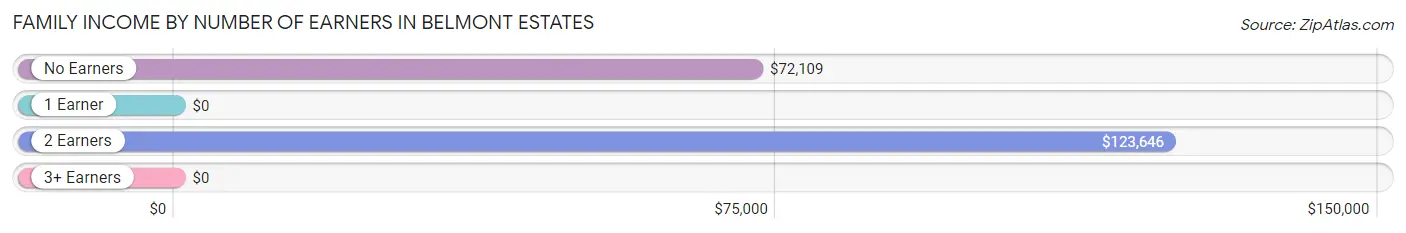
| Number of Earners | # Families | Median Income |
| No Earners | 211 (48.3%) | $72,109 |
| 1 Earner | 30 (6.9%) | $0 |
| 2 Earners | 177 (40.5%) | $123,646 |
| 3+ Earners | 19 (4.3%) | $0 |
| Total | 437 (100.0%) | $98,603 |
Household Income in Belmont Estates
Household Income Brackets in Belmont Estates
With 135 households falling in the category, the $100,000 to $149,999 income range is the most frequent in Belmont Estates, accounting for 28.7% of all households.
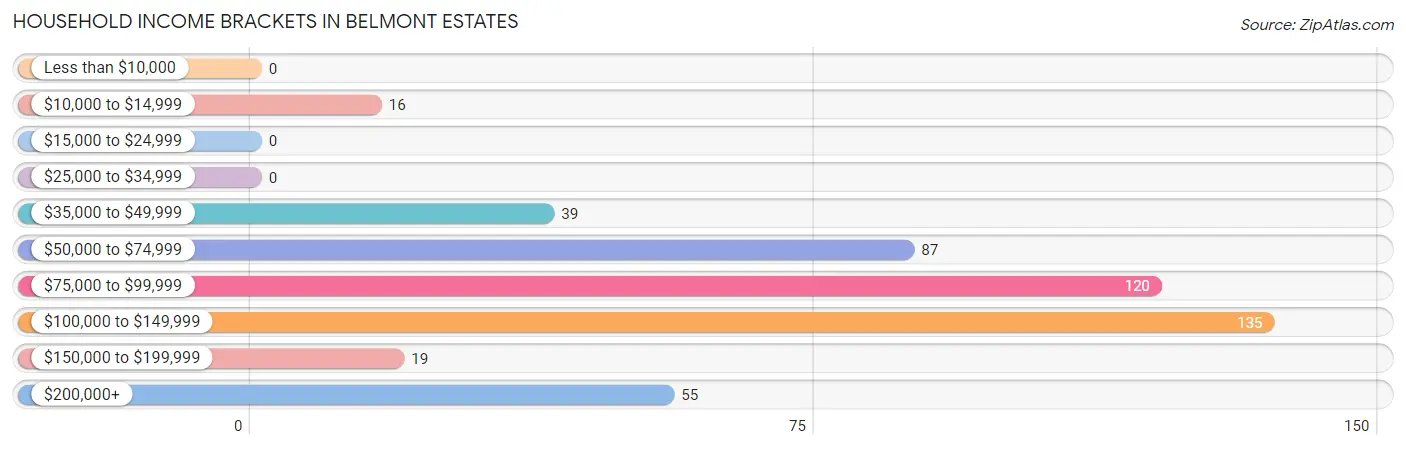
| Income Bracket | # Households | % Households |
| Less than $10,000 | 0 | 0.0% |
| $10,000 to $14,999 | 16 | 3.4% |
| $15,000 to $24,999 | 0 | 0.0% |
| $25,000 to $34,999 | 0 | 0.0% |
| $35,000 to $49,999 | 39 | 8.3% |
| $50,000 to $74,999 | 87 | 18.5% |
| $75,000 to $99,999 | 120 | 25.5% |
| $100,000 to $149,999 | 135 | 28.7% |
| $150,000 to $199,999 | 19 | 4.0% |
| $200,000+ | 55 | 11.7% |
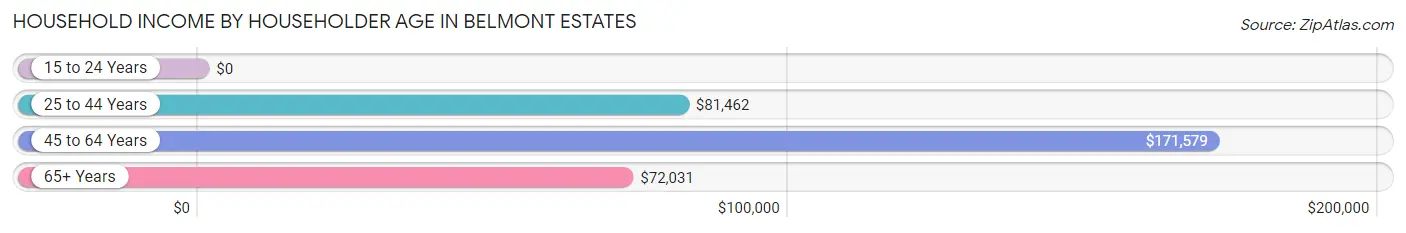
Household Income by Householder Age in Belmont Estates
The median household income in Belmont Estates is $95,917, with the highest median household income of $171,579 found in the 45 to 64 years age bracket for the primary householder. A total of 124 households (26.3%) fall into this category.
| Income Bracket | # Households | Median Income |
| 15 to 24 Years | 0 (0.0%) | $0 |
| 25 to 44 Years | 69 (14.6%) | $81,462 |
| 45 to 64 Years | 124 (26.3%) | $171,579 |
| 65+ Years | 278 (59.0%) | $72,031 |
| Total | 471 (100.0%) | $95,917 |
Poverty in Belmont Estates
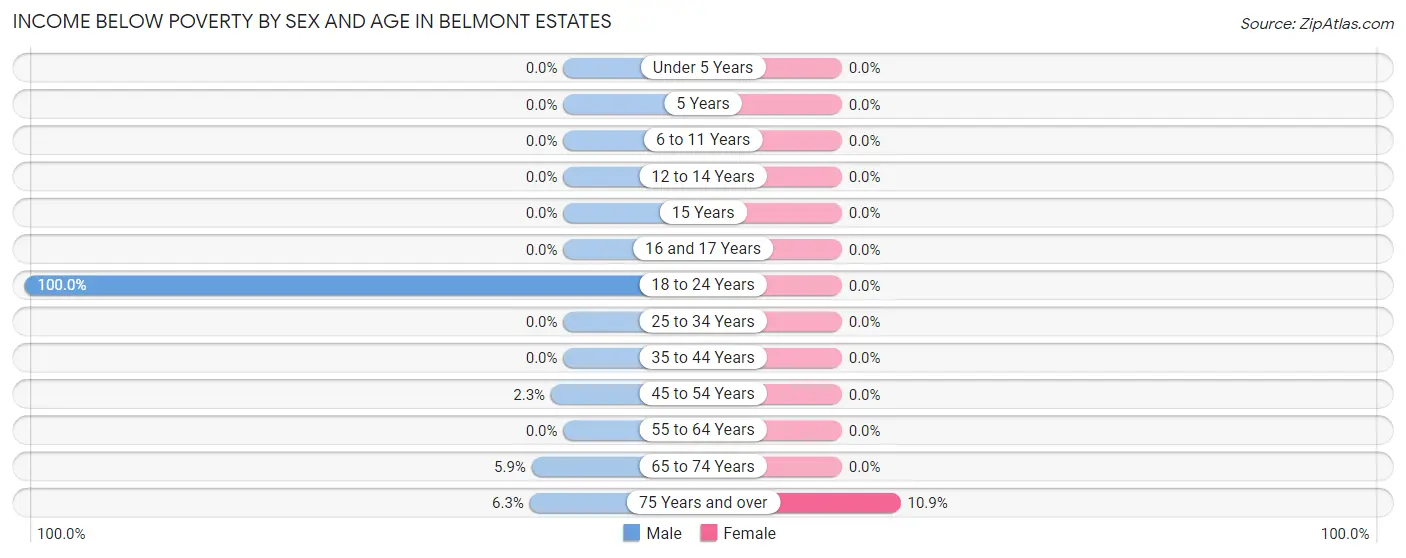
Income Below Poverty by Sex and Age in Belmont Estates
With 4.0% poverty level for males and 3.2% for females among the residents of Belmont Estates, 18 to 24 year old males and 75 year old and over females are the most vulnerable to poverty, with 3 males (100.0%) and 18 females (10.9%) in their respective age groups living below the poverty level.
| Age Bracket | Male | Female |
| Under 5 Years | 0 (0.0%) | 0 (0.0%) |
| 5 Years | 0 (0.0%) | 0 (0.0%) |
| 6 to 11 Years | 0 (0.0%) | 0 (0.0%) |
| 12 to 14 Years | 0 (0.0%) | 0 (0.0%) |
| 15 Years | 0 (0.0%) | 0 (0.0%) |
| 16 and 17 Years | 0 (0.0%) | 0 (0.0%) |
| 18 to 24 Years | 3 (100.0%) | 0 (0.0%) |
| 25 to 34 Years | 0 (0.0%) | 0 (0.0%) |
| 35 to 44 Years | 0 (0.0%) | 0 (0.0%) |
| 45 to 54 Years | 3 (2.3%) | 0 (0.0%) |
| 55 to 64 Years | 0 (0.0%) | 0 (0.0%) |
| 65 to 74 Years | 3 (5.9%) | 0 (0.0%) |
| 75 Years and over | 16 (6.2%) | 18 (10.9%) |
| Total | 25 (4.0%) | 18 (3.2%) |
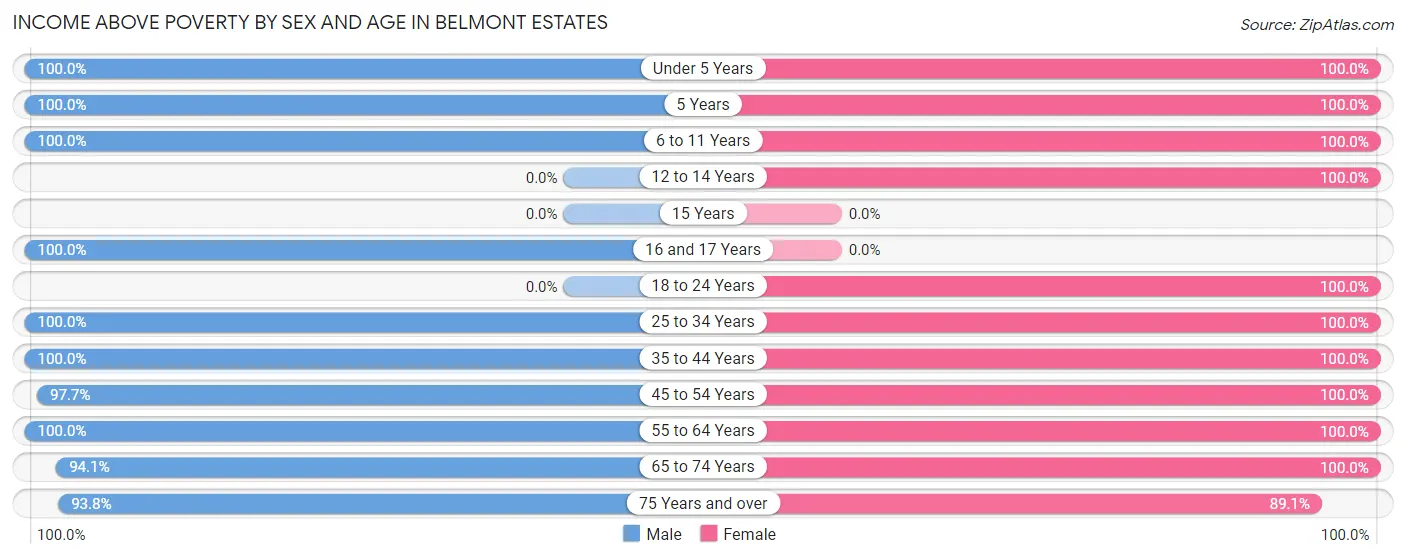
Income Above Poverty by Sex and Age in Belmont Estates
According to the poverty statistics in Belmont Estates, males aged under 5 years and females aged under 5 years are the age groups that are most secure financially, with 100.0% of males and 100.0% of females in these age groups living above the poverty line.
| Age Bracket | Male | Female |
| Under 5 Years | 5 (100.0%) | 2 (100.0%) |
| 5 Years | 6 (100.0%) | 3 (100.0%) |
| 6 to 11 Years | 83 (100.0%) | 64 (100.0%) |
| 12 to 14 Years | 0 (0.0%) | 19 (100.0%) |
| 15 Years | 0 (0.0%) | 0 (0.0%) |
| 16 and 17 Years | 17 (100.0%) | 0 (0.0%) |
| 18 to 24 Years | 0 (0.0%) | 4 (100.0%) |
| 25 to 34 Years | 5 (100.0%) | 2 (100.0%) |
| 35 to 44 Years | 8 (100.0%) | 67 (100.0%) |
| 45 to 54 Years | 127 (97.7%) | 89 (100.0%) |
| 55 to 64 Years | 61 (100.0%) | 58 (100.0%) |
| 65 to 74 Years | 48 (94.1%) | 94 (100.0%) |
| 75 Years and over | 240 (93.8%) | 147 (89.1%) |
| Total | 600 (96.0%) | 549 (96.8%) |
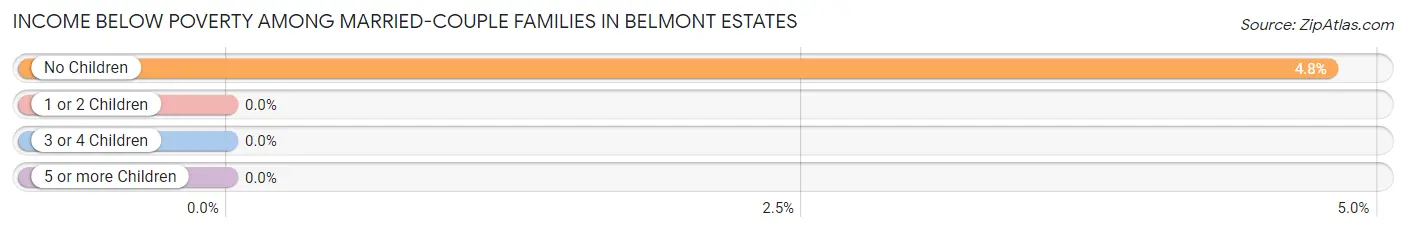
Income Below Poverty Among Married-Couple Families in Belmont Estates
The poverty statistics for married-couple families in Belmont Estates show that 3.7% or 16 of the total 435 families live below the poverty line. Families with no children have the highest poverty rate of 4.8%, comprising of 16 families. On the other hand, families with 1 or 2 children have the lowest poverty rate of 0.0%, which includes 0 families.
| Children | Above Poverty | Below Poverty |
| No Children | 318 (95.2%) | 16 (4.8%) |
| 1 or 2 Children | 93 (100.0%) | 0 (0.0%) |
| 3 or 4 Children | 8 (100.0%) | 0 (0.0%) |
| 5 or more Children | 0 (0.0%) | 0 (0.0%) |
| Total | 419 (96.3%) | 16 (3.7%) |
Income Below Poverty Among Single-Parent Households in Belmont Estates
| Children | Single Father | Single Mother |
| No Children | 0 (0.0%) | 0 (0.0%) |
| 1 or 2 Children | 0 (0.0%) | 0 (0.0%) |
| 3 or 4 Children | 0 (0.0%) | 0 (0.0%) |
| 5 or more Children | 0 (0.0%) | 0 (0.0%) |
| Total | 0 (0.0%) | 0 (0.0%) |
Income Below Poverty Among Married-Couple vs Single-Parent Households in Belmont Estates
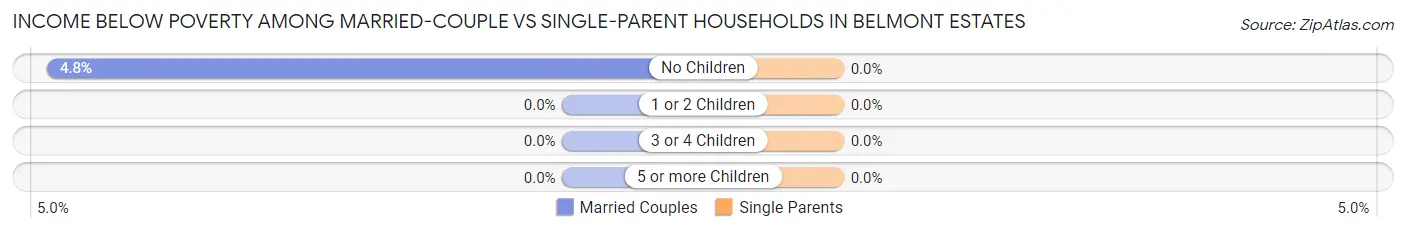
| Children | Married-Couple Families | Single-Parent Households |
| No Children | 16 (4.8%) | 0 (0.0%) |
| 1 or 2 Children | 0 (0.0%) | 0 (0.0%) |
| 3 or 4 Children | 0 (0.0%) | 0 (0.0%) |
| 5 or more Children | 0 (0.0%) | 0 (0.0%) |
| Total | 16 (3.7%) | 0 (0.0%) |
Race in Belmont Estates
The most populous races in Belmont Estates are White / Caucasian (1,114 | 93.5%), Hispanic or Latino (56 | 4.7%), and Some other Race (47 | 3.9%).
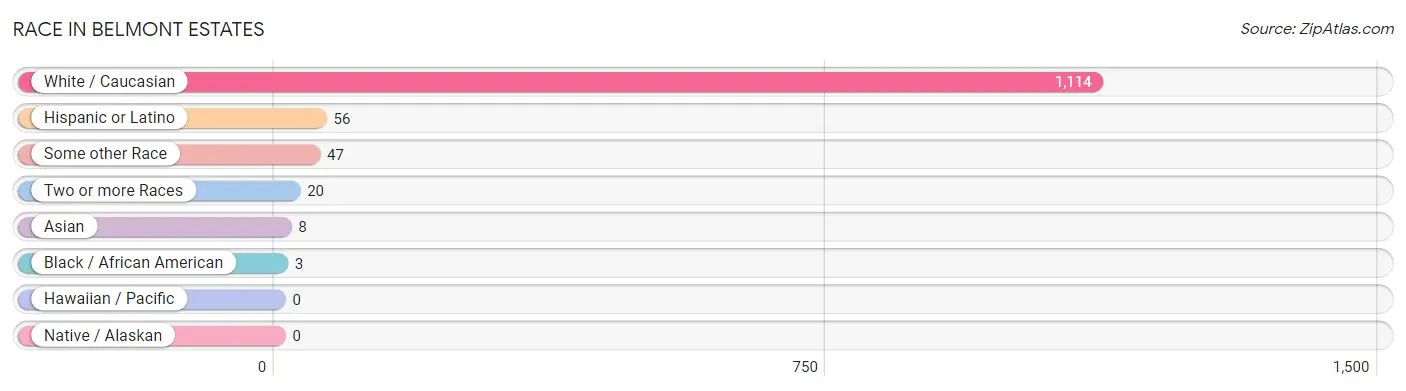
| Race | # Population | % Population |
| Asian | 8 | 0.7% |
| Black / African American | 3 | 0.3% |
| Hawaiian / Pacific | 0 | 0.0% |
| Hispanic or Latino | 56 | 4.7% |
| Native / Alaskan | 0 | 0.0% |
| White / Caucasian | 1,114 | 93.5% |
| Two or more Races | 20 | 1.7% |
| Some other Race | 47 | 3.9% |
| Total | 1,192 | 100.0% |
Ancestry in Belmont Estates
The most populous ancestries reported in Belmont Estates are European (285 | 23.9%), German (172 | 14.4%), American (125 | 10.5%), Scottish (83 | 7.0%), and English (67 | 5.6%), together accounting for 61.4% of all Belmont Estates residents.
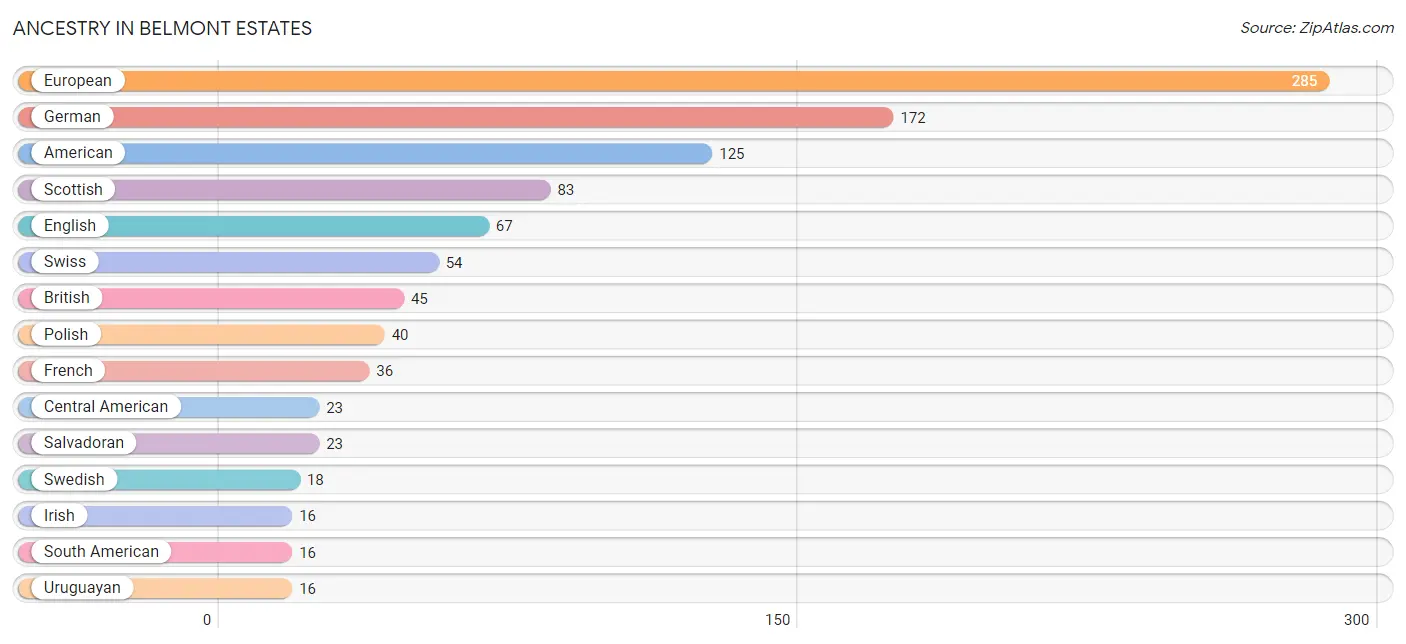
| Ancestry | # Population | % Population |
| American | 125 | 10.5% |
| Austrian | 11 | 0.9% |
| British | 45 | 3.8% |
| Central American | 23 | 1.9% |
| English | 67 | 5.6% |
| European | 285 | 23.9% |
| French | 36 | 3.0% |
| German | 172 | 14.4% |
| Hungarian | 12 | 1.0% |
| Irish | 16 | 1.3% |
| Japanese | 8 | 0.7% |
| Polish | 40 | 3.4% |
| Romanian | 5 | 0.4% |
| Salvadoran | 23 | 1.9% |
| Scotch-Irish | 8 | 0.7% |
| Scottish | 83 | 7.0% |
| Slovak | 12 | 1.0% |
| South American | 16 | 1.3% |
| Sri Lankan | 8 | 0.7% |
| Swedish | 18 | 1.5% |
| Swiss | 54 | 4.5% |
| Uruguayan | 16 | 1.3% | View All 22 Rows |
Immigrants in Belmont Estates
The most numerous immigrant groups reported in Belmont Estates came from Central America (16 | 1.3%), El Salvador (16 | 1.3%), and Latin America (16 | 1.3%), together accounting for 4.0% of all Belmont Estates residents.
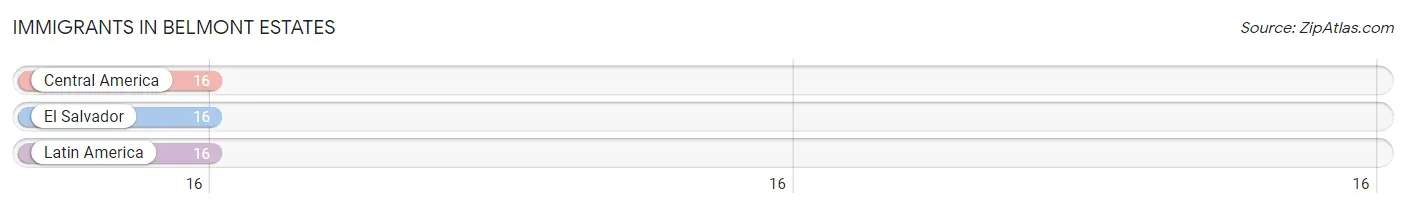
| Immigration Origin | # Population | % Population |
| Central America | 16 | 1.3% |
| El Salvador | 16 | 1.3% |
| Latin America | 16 | 1.3% | View All 3 Rows |
Sex and Age in Belmont Estates
Sex and Age in Belmont Estates
The most populous age groups in Belmont Estates are 75 to 79 Years (200 | 32.0%) for men and 75 to 79 Years (91 | 16.1%) for women.
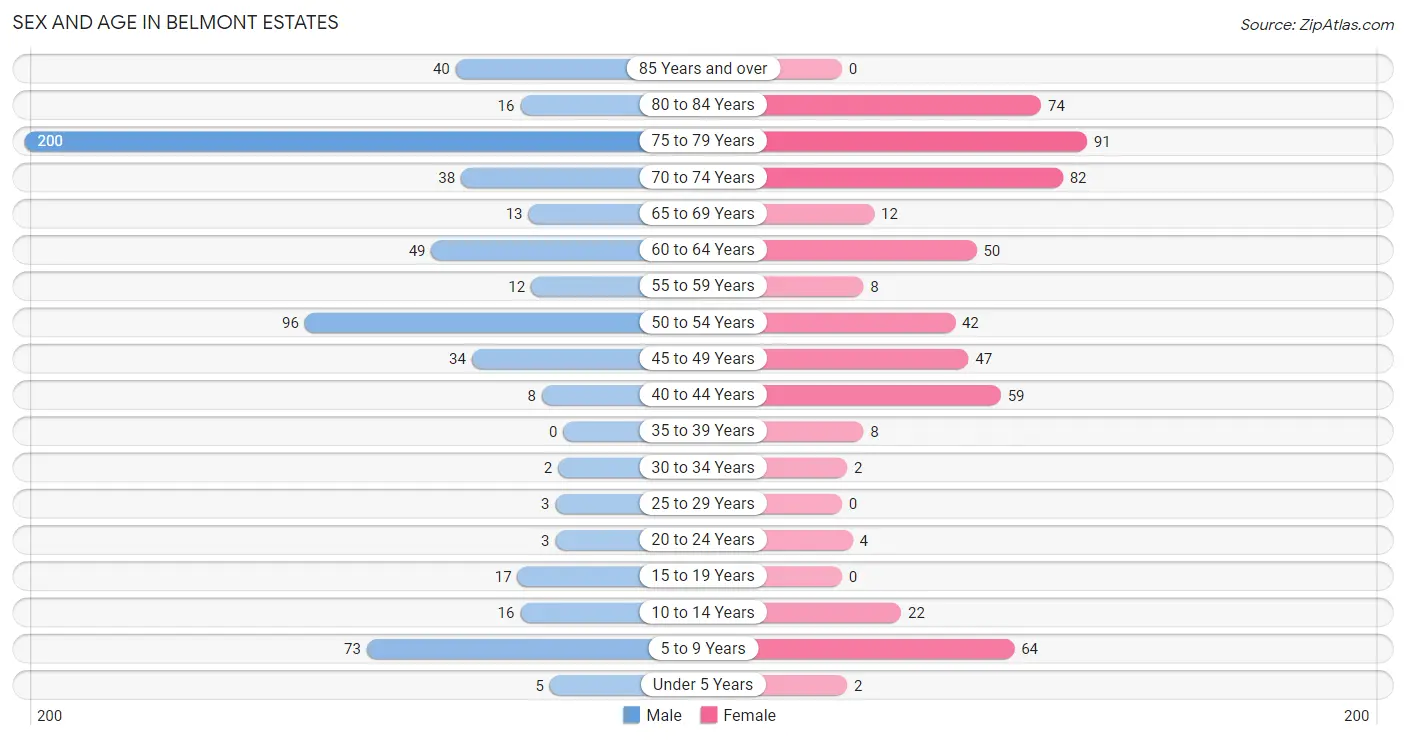
| Age Bracket | Male | Female |
| Under 5 Years | 5 (0.8%) | 2 (0.4%) |
| 5 to 9 Years | 73 (11.7%) | 64 (11.3%) |
| 10 to 14 Years | 16 (2.6%) | 22 (3.9%) |
| 15 to 19 Years | 17 (2.7%) | 0 (0.0%) |
| 20 to 24 Years | 3 (0.5%) | 4 (0.7%) |
| 25 to 29 Years | 3 (0.5%) | 0 (0.0%) |
| 30 to 34 Years | 2 (0.3%) | 2 (0.4%) |
| 35 to 39 Years | 0 (0.0%) | 8 (1.4%) |
| 40 to 44 Years | 8 (1.3%) | 59 (10.4%) |
| 45 to 49 Years | 34 (5.4%) | 47 (8.3%) |
| 50 to 54 Years | 96 (15.4%) | 42 (7.4%) |
| 55 to 59 Years | 12 (1.9%) | 8 (1.4%) |
| 60 to 64 Years | 49 (7.8%) | 50 (8.8%) |
| 65 to 69 Years | 13 (2.1%) | 12 (2.1%) |
| 70 to 74 Years | 38 (6.1%) | 82 (14.5%) |
| 75 to 79 Years | 200 (32.0%) | 91 (16.1%) |
| 80 to 84 Years | 16 (2.6%) | 74 (13.1%) |
| 85 Years and over | 40 (6.4%) | 0 (0.0%) |
| Total | 625 (100.0%) | 567 (100.0%) |
Families and Households in Belmont Estates
Median Family Size in Belmont Estates
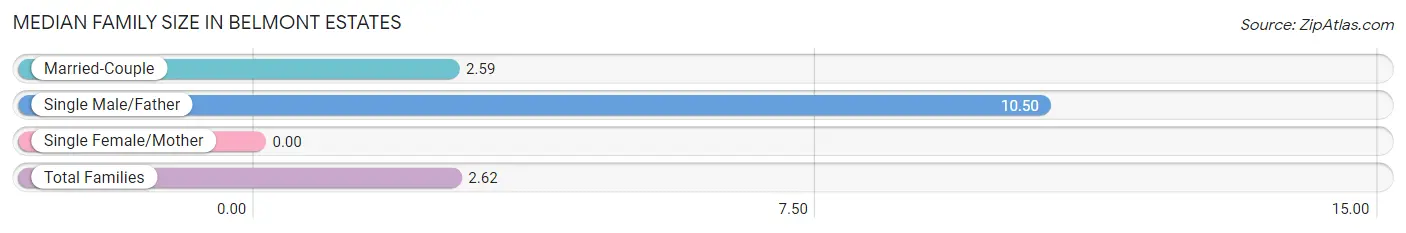
| Family Type | # Families | Family Size |
| Married-Couple | 435 (99.5%) | 2.59 |
| Single Male/Father | 2 (0.5%) | 10.50 |
| Single Female/Mother | 0 (0.0%) | - |
| Total Families | 437 (100.0%) | 2.62 |
Median Household Size in Belmont Estates
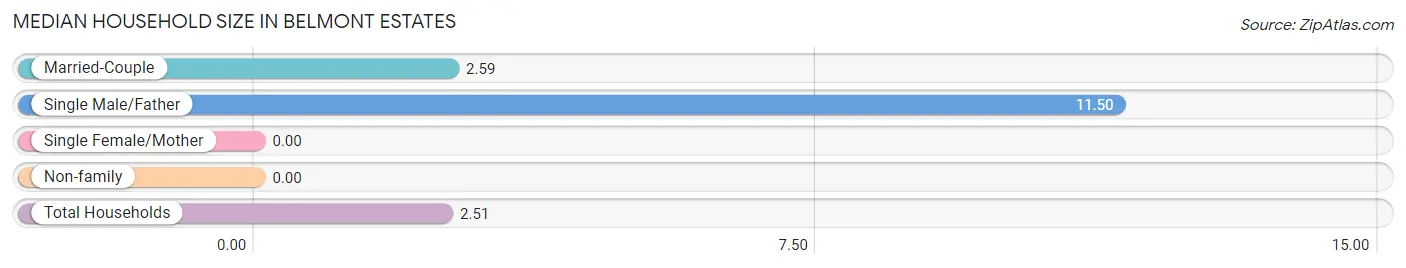
| Household Type | # Households | Household Size |
| Married-Couple | 435 (92.4%) | 2.59 |
| Single Male/Father | 2 (0.4%) | 11.50 |
| Single Female/Mother | 0 (0.0%) | - |
| Non-family | 34 (7.2%) | - |
| Total Households | 471 (100.0%) | 2.51 |
Household Size by Marriage Status in Belmont Estates
Out of a total of 471 households in Belmont Estates, 437 (92.8%) are family households, while 34 (7.2%) are nonfamily households. The most numerous type of family households are 2-person households, comprising 320, and the most common type of nonfamily households are 1-person households, comprising 34.
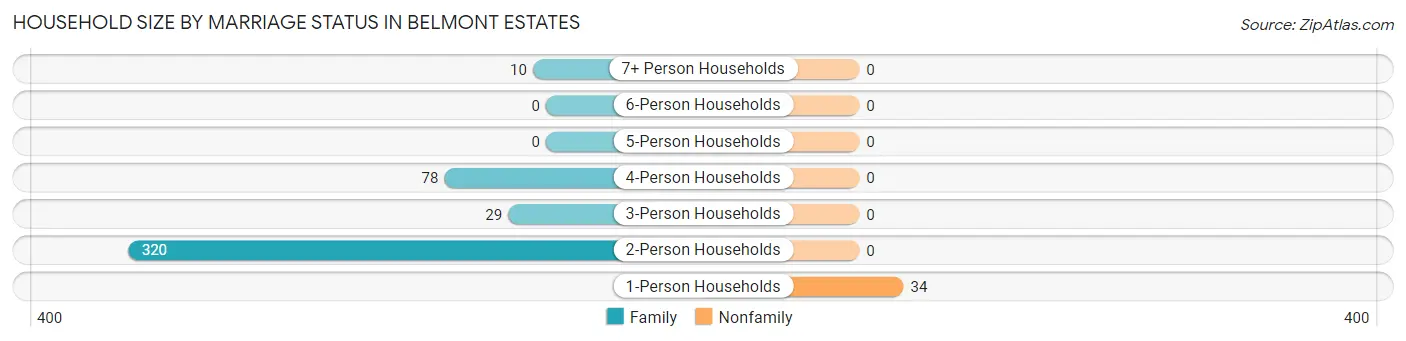
| Household Size | Family Households | Nonfamily Households |
| 1-Person Households | - | 34 (7.2%) |
| 2-Person Households | 320 (67.9%) | 0 (0.0%) |
| 3-Person Households | 29 (6.2%) | 0 (0.0%) |
| 4-Person Households | 78 (16.6%) | 0 (0.0%) |
| 5-Person Households | 0 (0.0%) | 0 (0.0%) |
| 6-Person Households | 0 (0.0%) | 0 (0.0%) |
| 7+ Person Households | 10 (2.1%) | 0 (0.0%) |
| Total | 437 (92.8%) | 34 (7.2%) |
Female Fertility in Belmont Estates
Fertility by Age in Belmont Estates
| Age Bracket | Women with Births | Births / 1,000 Women |
| 15 to 19 years | 0 (0.0%) | 0.0 |
| 20 to 34 years | 0 (0.0%) | 0.0 |
| 35 to 50 years | 0 (0.0%) | 0.0 |
| Total | 0 (0.0%) | 0.0 |
Fertility by Age by Marriage Status in Belmont Estates
| Age Bracket | Married | Unmarried |
| 15 to 19 years | 0 (0.0%) | 0 (0.0%) |
| 20 to 34 years | 0 (0.0%) | 0 (0.0%) |
| 35 to 50 years | 0 (0.0%) | 0 (0.0%) |
| Total | 0 (0.0%) | 0 (0.0%) |
Fertility by Education in Belmont Estates
| Educational Attainment | Women with Births | Births / 1,000 Women |
| Less than High School | 0 (0.0%) | 0.0 |
| High School Diploma | 0 (0.0%) | 0.0 |
| College or Associate's Degree | 0 (0.0%) | 0.0 |
| Bachelor's Degree | 0 (0.0%) | 0.0 |
| Graduate Degree | 0 (0.0%) | 0.0 |
| Total | 0 (0.0%) | 0.0 |
Fertility by Education by Marriage Status in Belmont Estates
| Educational Attainment | Married | Unmarried |
| Less than High School | 0 (0.0%) | 0 (0.0%) |
| High School Diploma | 0 (0.0%) | 0 (0.0%) |
| College or Associate's Degree | 0 (0.0%) | 0 (0.0%) |
| Bachelor's Degree | 0 (0.0%) | 0 (0.0%) |
| Graduate Degree | 0 (0.0%) | 0 (0.0%) |
| Total | 0 (0.0%) | 0 (0.0%) |
Employment Characteristics in Belmont Estates
Employment by Class of Employer in Belmont Estates
Among the 431 employed individuals in Belmont Estates, private company employees (173 | 40.1%), not-for-profit organizations (150 | 34.8%), and state government employees (53 | 12.3%) make up the most common classes of employment.
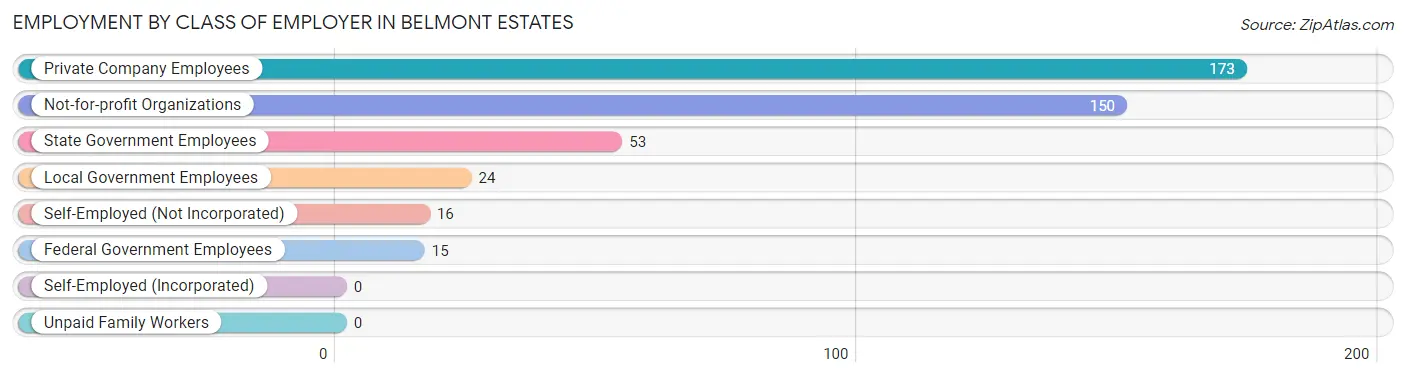
| Employer Class | # Employees | % Employees |
| Private Company Employees | 173 | 40.1% |
| Self-Employed (Incorporated) | 0 | 0.0% |
| Self-Employed (Not Incorporated) | 16 | 3.7% |
| Not-for-profit Organizations | 150 | 34.8% |
| Local Government Employees | 24 | 5.6% |
| State Government Employees | 53 | 12.3% |
| Federal Government Employees | 15 | 3.5% |
| Unpaid Family Workers | 0 | 0.0% |
| Total | 431 | 100.0% |
Employment Status by Age in Belmont Estates
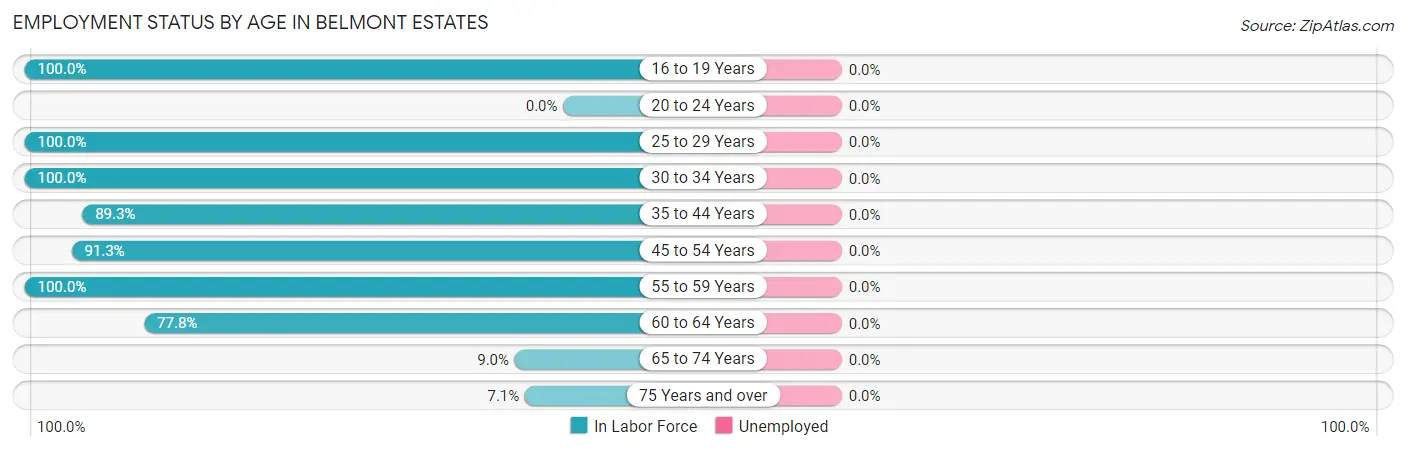
| Age Bracket | In Labor Force | Unemployed |
| 16 to 19 Years | 17 (100.0%) | 0 (0.0%) |
| 20 to 24 Years | 0 (0.0%) | 0 (0.0%) |
| 25 to 29 Years | 3 (100.0%) | 0 (0.0%) |
| 30 to 34 Years | 4 (100.0%) | 0 (0.0%) |
| 35 to 44 Years | 67 (89.3%) | 0 (0.0%) |
| 45 to 54 Years | 200 (91.3%) | 0 (0.0%) |
| 55 to 59 Years | 20 (100.0%) | 0 (0.0%) |
| 60 to 64 Years | 77 (77.8%) | 0 (0.0%) |
| 65 to 74 Years | 13 (9.0%) | 0 (0.0%) |
| 75 Years and over | 30 (7.1%) | 0 (0.0%) |
| Total | 431 (42.7%) | 0 (0.0%) |
Employment Status by Educational Attainment in Belmont Estates
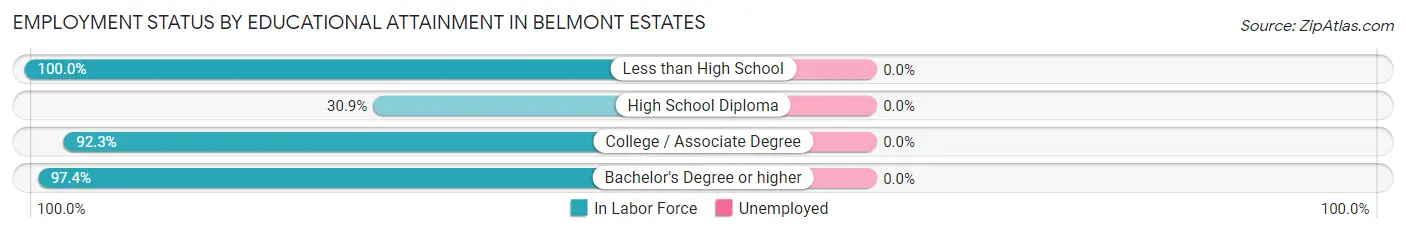
| Educational Attainment | In Labor Force | Unemployed |
| Less than High School | 21 (100.0%) | 0 (0.0%) |
| High School Diploma | 17 (30.9%) | 0 (0.0%) |
| College / Associate Degree | 36 (92.3%) | 0 (0.0%) |
| Bachelor's Degree or higher | 297 (97.4%) | 0 (0.0%) |
| Total | 371 (88.3%) | 0 (0.0%) |
Employment Occupations by Sex in Belmont Estates
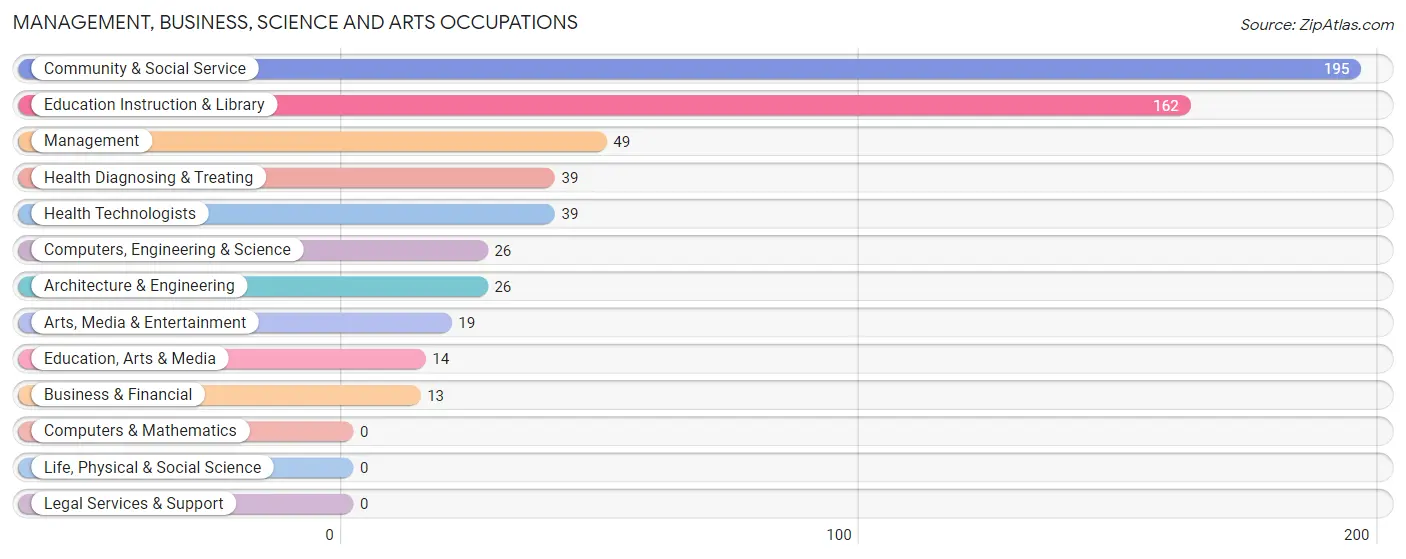
Management, Business, Science and Arts Occupations
The most common Management, Business, Science and Arts occupations in Belmont Estates are Community & Social Service (195 | 45.2%), Education Instruction & Library (162 | 37.6%), Management (49 | 11.4%), Health Diagnosing & Treating (39 | 9.0%), and Health Technologists (39 | 9.0%).
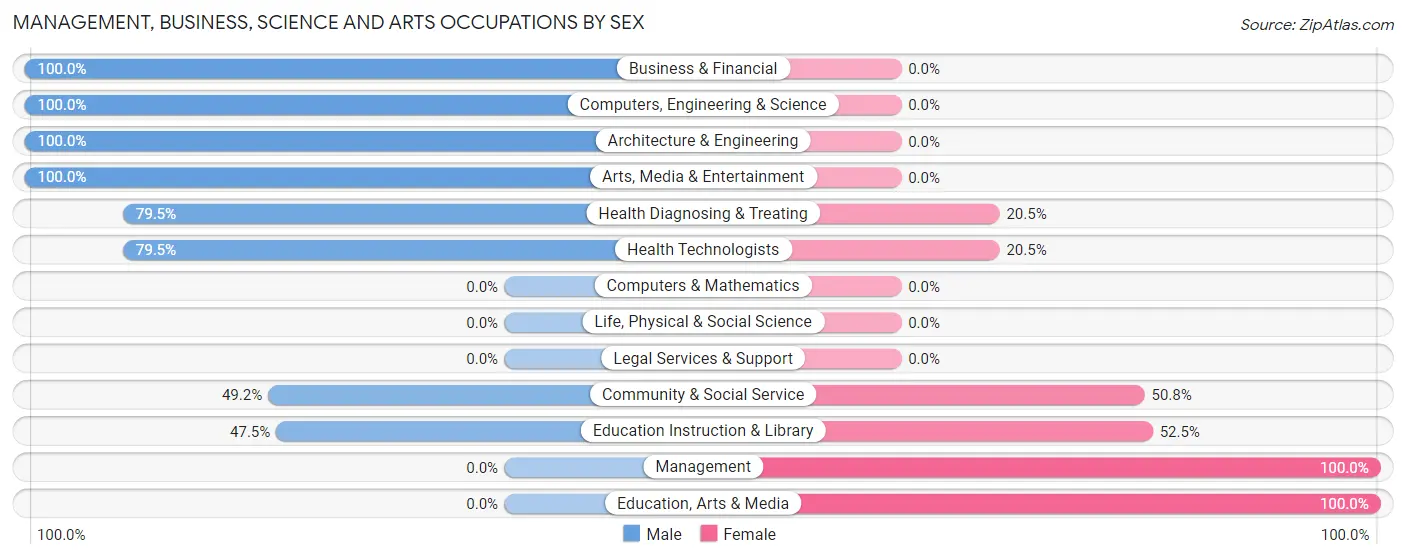
Management, Business, Science and Arts Occupations by Sex
Within the Management, Business, Science and Arts occupations in Belmont Estates, the most male-oriented occupations are Business & Financial (100.0%), Computers, Engineering & Science (100.0%), and Architecture & Engineering (100.0%), while the most female-oriented occupations are Management (100.0%), Education, Arts & Media (100.0%), and Education Instruction & Library (52.5%).
| Occupation | Male | Female |
| Management | 0 (0.0%) | 49 (100.0%) |
| Business & Financial | 13 (100.0%) | 0 (0.0%) |
| Computers, Engineering & Science | 26 (100.0%) | 0 (0.0%) |
| Computers & Mathematics | 0 (0.0%) | 0 (0.0%) |
| Architecture & Engineering | 26 (100.0%) | 0 (0.0%) |
| Life, Physical & Social Science | 0 (0.0%) | 0 (0.0%) |
| Community & Social Service | 96 (49.2%) | 99 (50.8%) |
| Education, Arts & Media | 0 (0.0%) | 14 (100.0%) |
| Legal Services & Support | 0 (0.0%) | 0 (0.0%) |
| Education Instruction & Library | 77 (47.5%) | 85 (52.5%) |
| Arts, Media & Entertainment | 19 (100.0%) | 0 (0.0%) |
| Health Diagnosing & Treating | 31 (79.5%) | 8 (20.5%) |
| Health Technologists | 31 (79.5%) | 8 (20.5%) |
| Total (Category) | 166 (51.5%) | 156 (48.4%) |
| Total (Overall) | 228 (52.9%) | 203 (47.1%) |
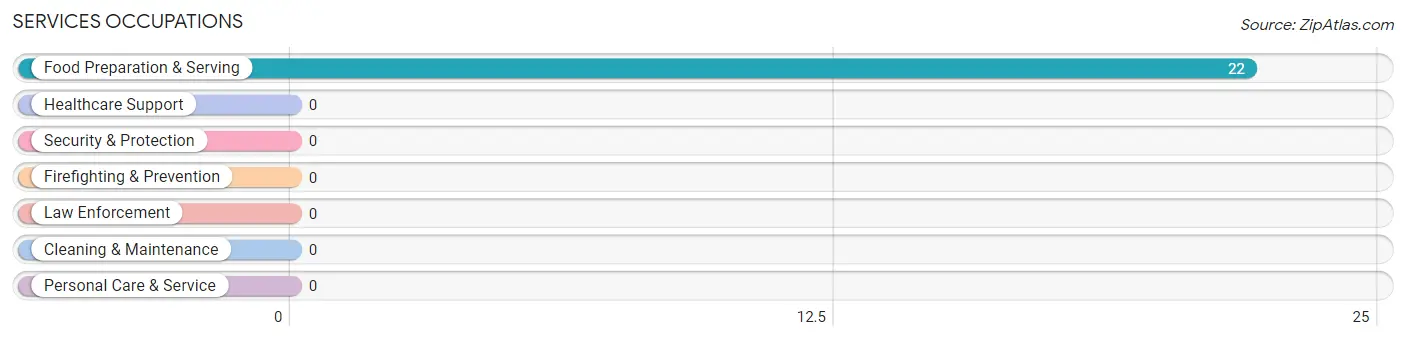
Services Occupations
The most common Services occupations in Belmont Estates are , and Food Preparation & Serving (22 | 5.1%).
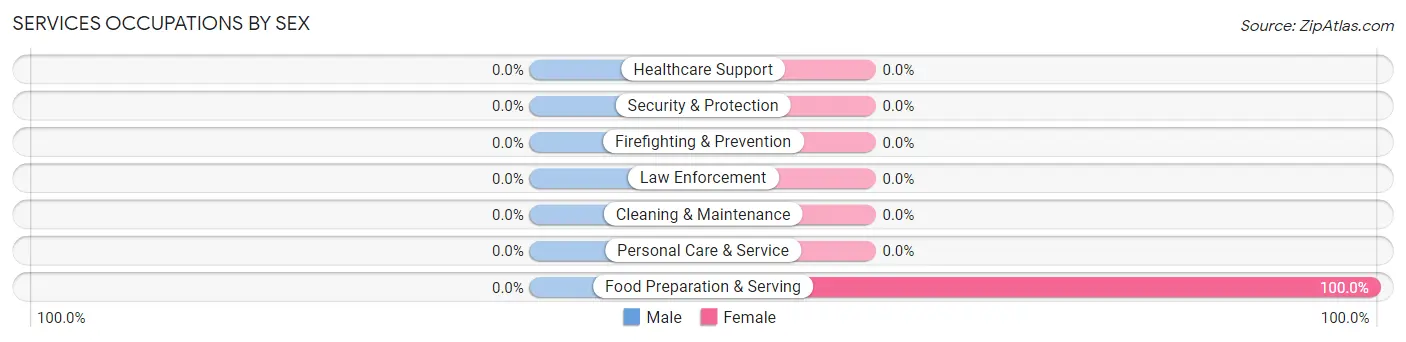
Services Occupations by Sex
| Occupation | Male | Female |
| Healthcare Support | 0 (0.0%) | 0 (0.0%) |
| Security & Protection | 0 (0.0%) | 0 (0.0%) |
| Firefighting & Prevention | 0 (0.0%) | 0 (0.0%) |
| Law Enforcement | 0 (0.0%) | 0 (0.0%) |
| Food Preparation & Serving | 0 (0.0%) | 22 (100.0%) |
| Cleaning & Maintenance | 0 (0.0%) | 0 (0.0%) |
| Personal Care & Service | 0 (0.0%) | 0 (0.0%) |
| Total (Category) | 0 (0.0%) | 22 (100.0%) |
| Total (Overall) | 228 (52.9%) | 203 (47.1%) |
Sales and Office Occupations
The most common Sales and Office occupations in Belmont Estates are Sales & Related (52 | 12.1%), and Office & Administration (12 | 2.8%).
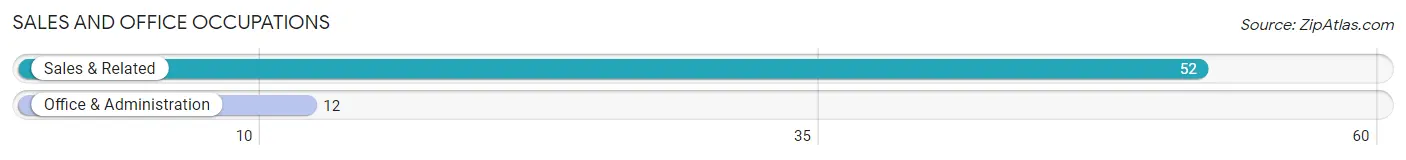
Sales and Office Occupations by Sex

| Occupation | Male | Female |
| Sales & Related | 41 (78.8%) | 11 (21.1%) |
| Office & Administration | 0 (0.0%) | 12 (100.0%) |
| Total (Category) | 41 (64.1%) | 23 (35.9%) |
| Total (Overall) | 228 (52.9%) | 203 (47.1%) |
Natural Resources, Construction and Maintenance Occupations
The most common Natural Resources, Construction and Maintenance occupations in Belmont Estates are , and Construction & Extraction (16 | 3.7%).
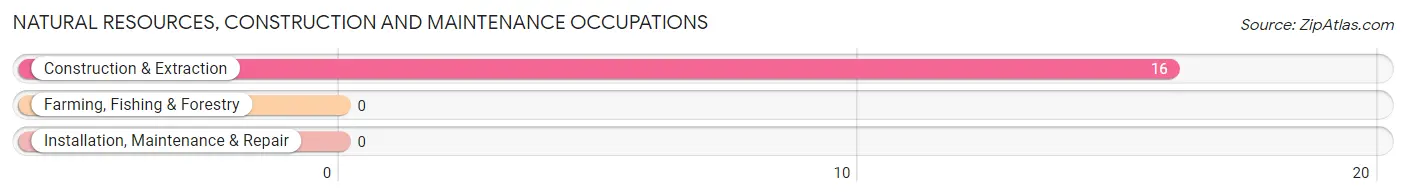
Natural Resources, Construction and Maintenance Occupations by Sex
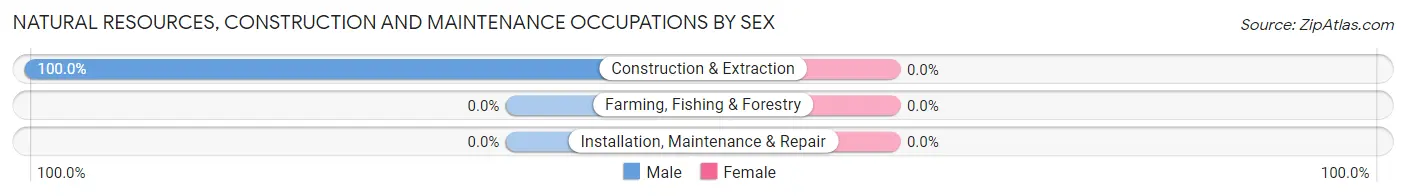
| Occupation | Male | Female |
| Farming, Fishing & Forestry | 0 (0.0%) | 0 (0.0%) |
| Construction & Extraction | 16 (100.0%) | 0 (0.0%) |
| Installation, Maintenance & Repair | 0 (0.0%) | 0 (0.0%) |
| Total (Category) | 16 (100.0%) | 0 (0.0%) |
| Total (Overall) | 228 (52.9%) | 203 (47.1%) |
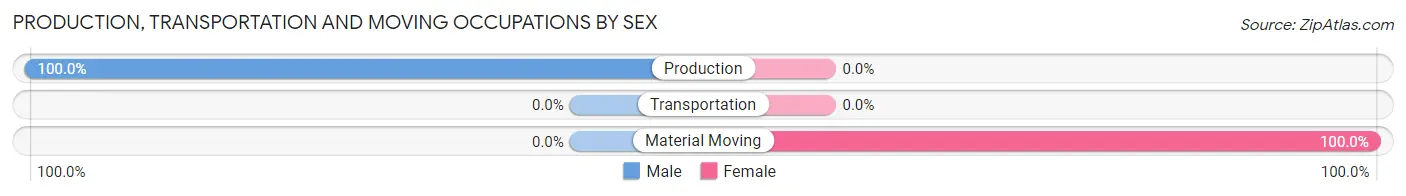
Production, Transportation and Moving Occupations
The most common Production, Transportation and Moving occupations in Belmont Estates are Production (5 | 1.2%), and Material Moving (2 | 0.5%).
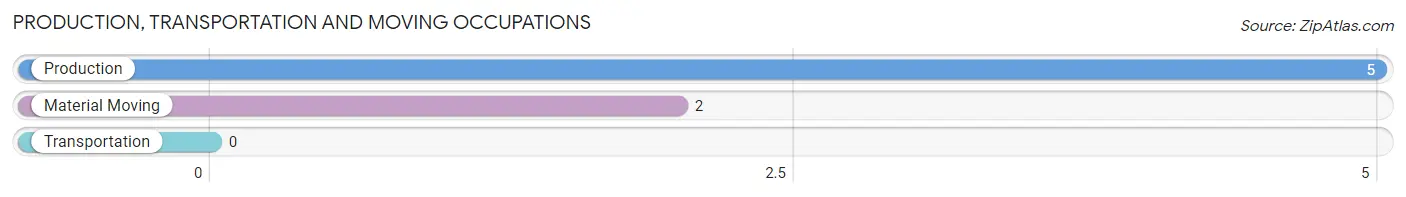
Production, Transportation and Moving Occupations by Sex
| Occupation | Male | Female |
| Production | 5 (100.0%) | 0 (0.0%) |
| Transportation | 0 (0.0%) | 0 (0.0%) |
| Material Moving | 0 (0.0%) | 2 (100.0%) |
| Total (Category) | 5 (71.4%) | 2 (28.6%) |
| Total (Overall) | 228 (52.9%) | 203 (47.1%) |
Employment Industries by Sex in Belmont Estates
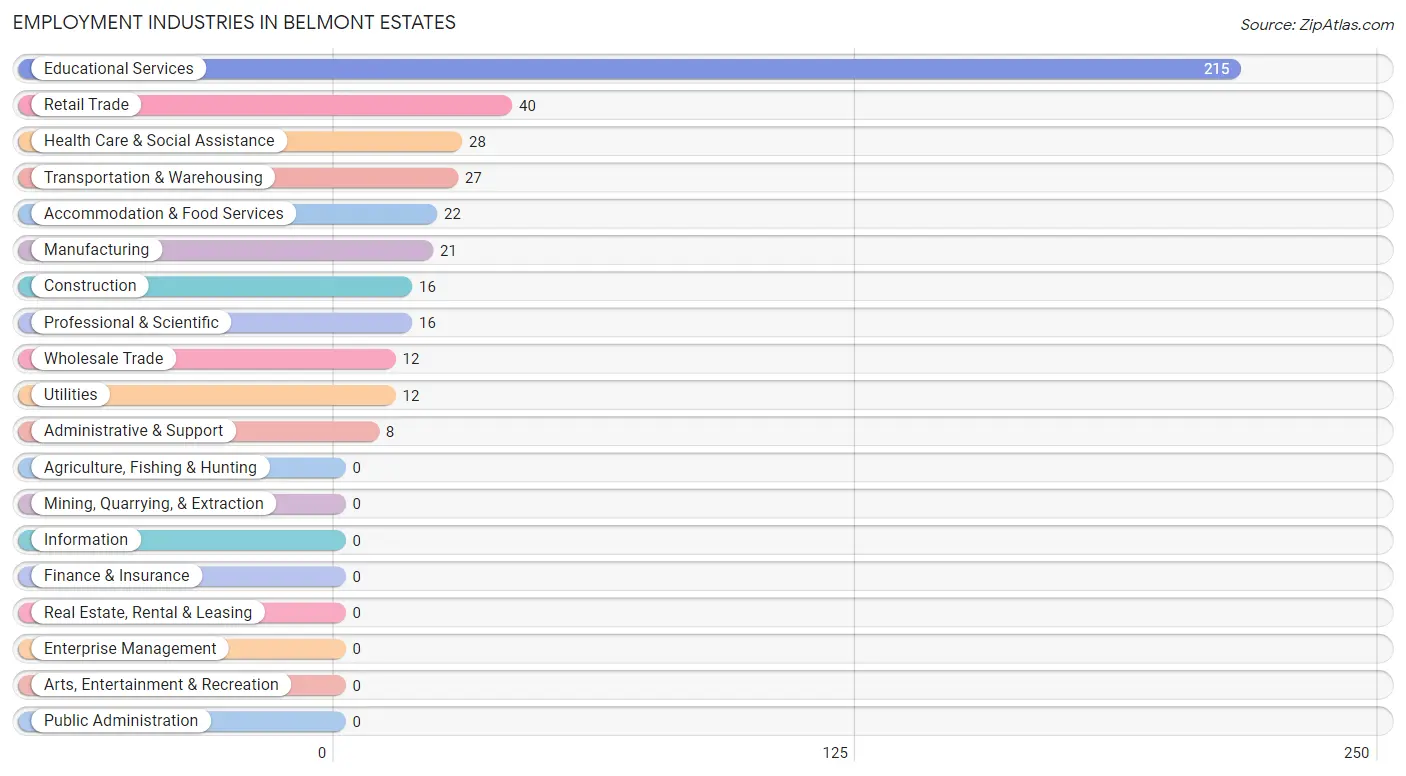
Employment Industries in Belmont Estates
The major employment industries in Belmont Estates include Educational Services (215 | 49.9%), Retail Trade (40 | 9.3%), Health Care & Social Assistance (28 | 6.5%), Transportation & Warehousing (27 | 6.3%), and Accommodation & Food Services (22 | 5.1%).
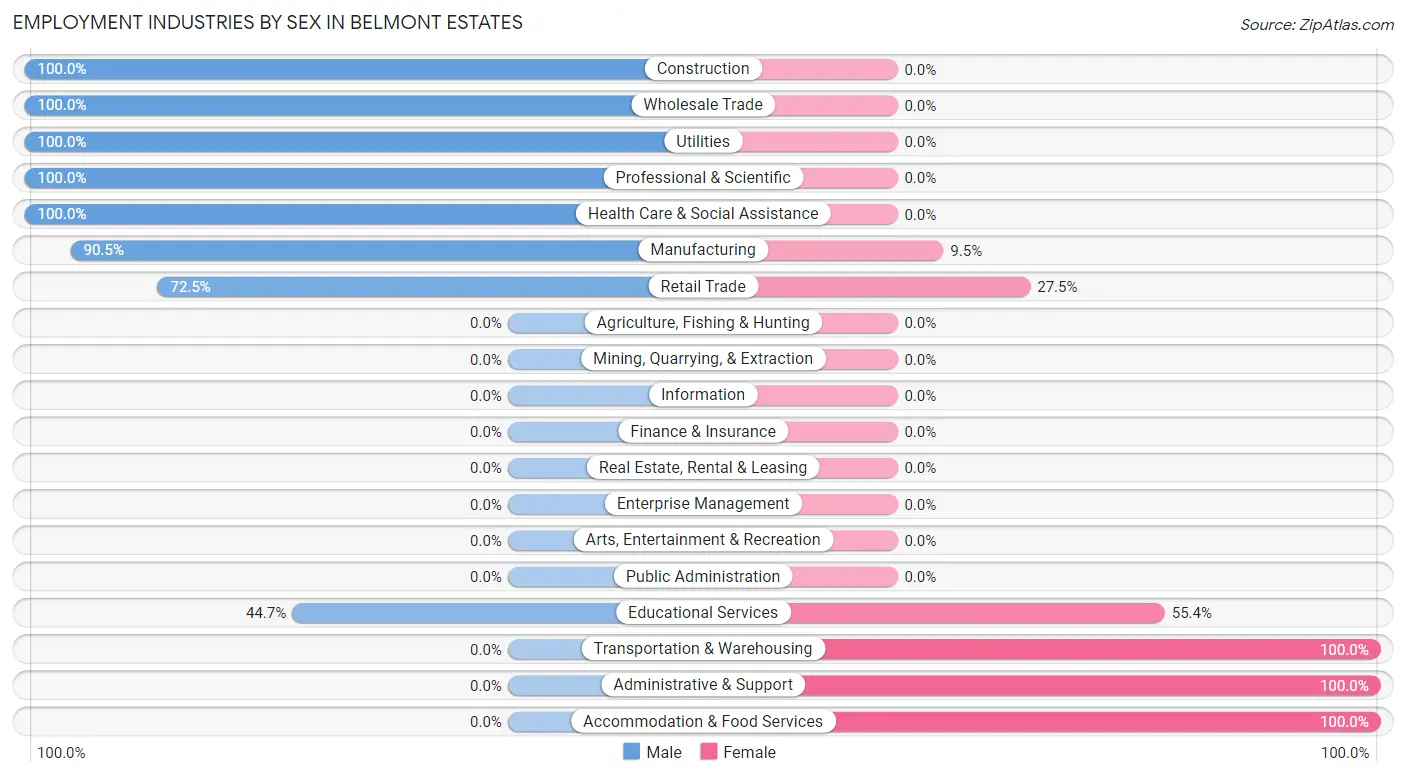
Employment Industries by Sex in Belmont Estates
The Belmont Estates industries that see more men than women are Construction (100.0%), Wholesale Trade (100.0%), and Utilities (100.0%), whereas the industries that tend to have a higher number of women are Transportation & Warehousing (100.0%), Administrative & Support (100.0%), and Accommodation & Food Services (100.0%).
| Industry | Male | Female |
| Agriculture, Fishing & Hunting | 0 (0.0%) | 0 (0.0%) |
| Mining, Quarrying, & Extraction | 0 (0.0%) | 0 (0.0%) |
| Construction | 16 (100.0%) | 0 (0.0%) |
| Manufacturing | 19 (90.5%) | 2 (9.5%) |
| Wholesale Trade | 12 (100.0%) | 0 (0.0%) |
| Retail Trade | 29 (72.5%) | 11 (27.5%) |
| Transportation & Warehousing | 0 (0.0%) | 27 (100.0%) |
| Utilities | 12 (100.0%) | 0 (0.0%) |
| Information | 0 (0.0%) | 0 (0.0%) |
| Finance & Insurance | 0 (0.0%) | 0 (0.0%) |
| Real Estate, Rental & Leasing | 0 (0.0%) | 0 (0.0%) |
| Professional & Scientific | 16 (100.0%) | 0 (0.0%) |
| Enterprise Management | 0 (0.0%) | 0 (0.0%) |
| Administrative & Support | 0 (0.0%) | 8 (100.0%) |
| Educational Services | 96 (44.7%) | 119 (55.3%) |
| Health Care & Social Assistance | 28 (100.0%) | 0 (0.0%) |
| Arts, Entertainment & Recreation | 0 (0.0%) | 0 (0.0%) |
| Accommodation & Food Services | 0 (0.0%) | 22 (100.0%) |
| Public Administration | 0 (0.0%) | 0 (0.0%) |
| Total | 228 (52.9%) | 203 (47.1%) |
Education in Belmont Estates
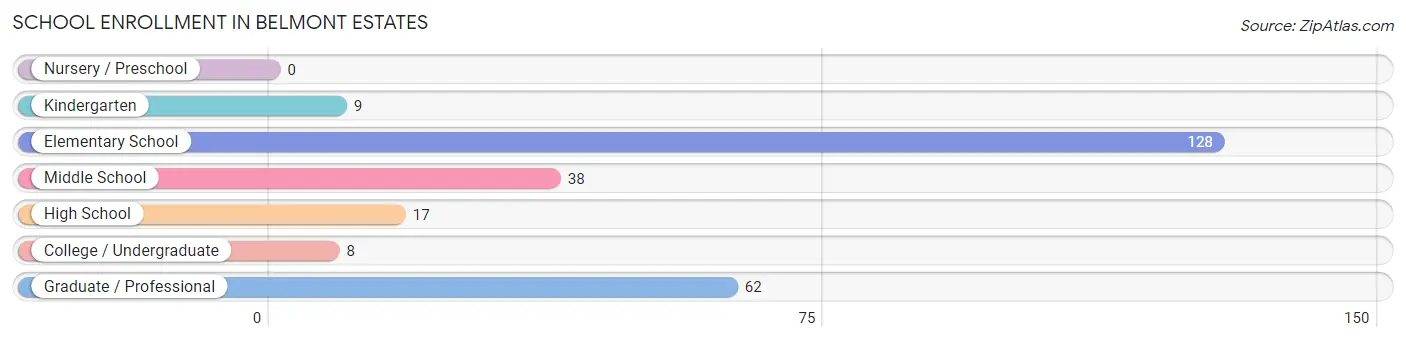
School Enrollment in Belmont Estates
The most common levels of schooling among the 262 students in Belmont Estates are elementary school (128 | 48.8%), graduate / professional (62 | 23.7%), and middle school (38 | 14.5%).
| School Level | # Students | % Students |
| Nursery / Preschool | 0 | 0.0% |
| Kindergarten | 9 | 3.4% |
| Elementary School | 128 | 48.8% |
| Middle School | 38 | 14.5% |
| High School | 17 | 6.5% |
| College / Undergraduate | 8 | 3.0% |
| Graduate / Professional | 62 | 23.7% |
| Total | 262 | 100.0% |
School Enrollment by Age by Funding Source in Belmont Estates
Out of a total of 262 students who are enrolled in schools in Belmont Estates, 132 (50.4%) attend a private institution, while the remaining 130 (49.6%) are enrolled in public schools. The age group of 5 to 9 year old has the highest likelihood of being enrolled in private schools, with 124 (90.5% in the age bracket) enrolled. Conversely, the age group of 10 to 14 year olds has the lowest likelihood of being enrolled in a private school, with 38 (100.0% in the age bracket) attending a public institution.
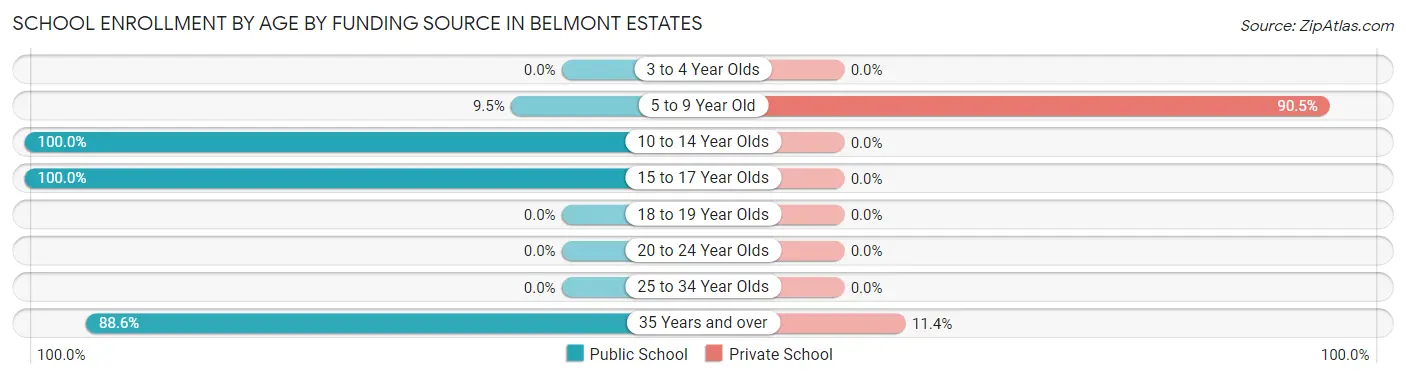
| Age Bracket | Public School | Private School |
| 3 to 4 Year Olds | 0 (0.0%) | 0 (0.0%) |
| 5 to 9 Year Old | 13 (9.5%) | 124 (90.5%) |
| 10 to 14 Year Olds | 38 (100.0%) | 0 (0.0%) |
| 15 to 17 Year Olds | 17 (100.0%) | 0 (0.0%) |
| 18 to 19 Year Olds | 0 (0.0%) | 0 (0.0%) |
| 20 to 24 Year Olds | 0 (0.0%) | 0 (0.0%) |
| 25 to 34 Year Olds | 0 (0.0%) | 0 (0.0%) |
| 35 Years and over | 62 (88.6%) | 8 (11.4%) |
| Total | 130 (49.6%) | 132 (50.4%) |
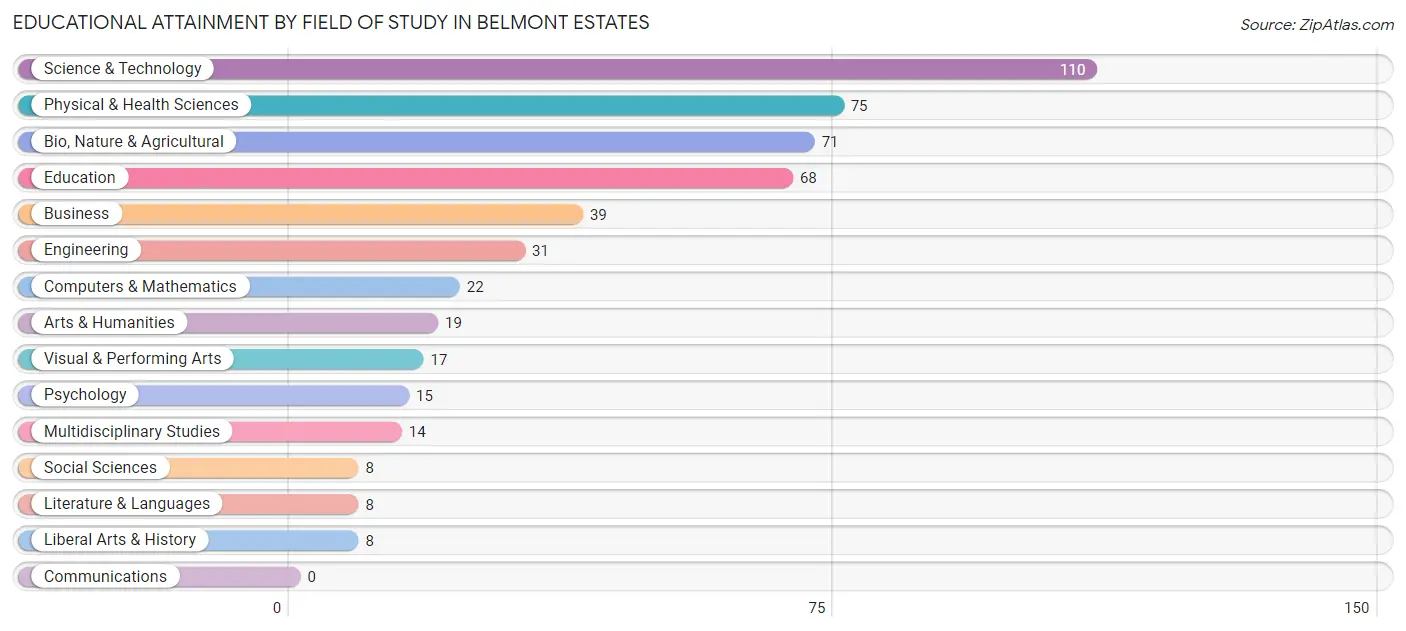
Educational Attainment by Field of Study in Belmont Estates
Science & technology (110 | 21.8%), physical & health sciences (75 | 14.8%), bio, nature & agricultural (71 | 14.1%), education (68 | 13.5%), and business (39 | 7.7%) are the most common fields of study among 505 individuals in Belmont Estates who have obtained a bachelor's degree or higher.
| Field of Study | # Graduates | % Graduates |
| Computers & Mathematics | 22 | 4.4% |
| Bio, Nature & Agricultural | 71 | 14.1% |
| Physical & Health Sciences | 75 | 14.8% |
| Psychology | 15 | 3.0% |
| Social Sciences | 8 | 1.6% |
| Engineering | 31 | 6.1% |
| Multidisciplinary Studies | 14 | 2.8% |
| Science & Technology | 110 | 21.8% |
| Business | 39 | 7.7% |
| Education | 68 | 13.5% |
| Literature & Languages | 8 | 1.6% |
| Liberal Arts & History | 8 | 1.6% |
| Visual & Performing Arts | 17 | 3.4% |
| Communications | 0 | 0.0% |
| Arts & Humanities | 19 | 3.8% |
| Total | 505 | 100.0% |
Transportation & Commute in Belmont Estates
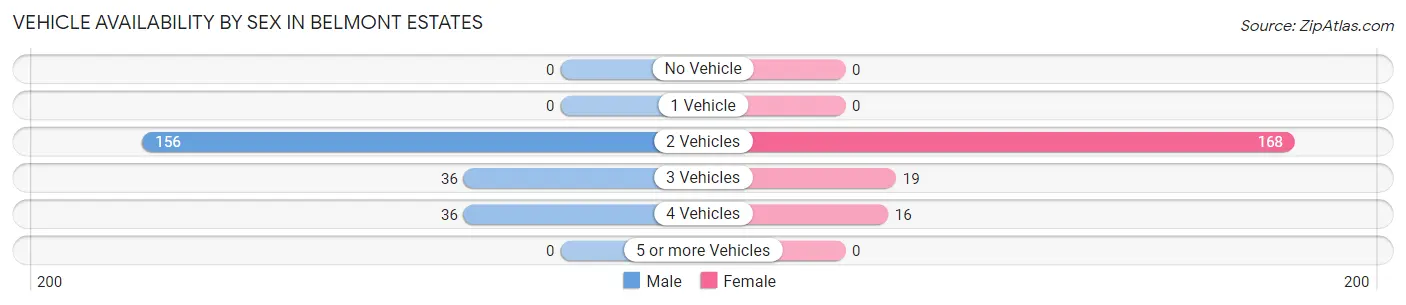
Vehicle Availability by Sex in Belmont Estates
The most prevalent vehicle ownership categories in Belmont Estates are males with 2 vehicles (156, accounting for 68.4%) and females with 2 vehicles (168, making up 76.8%).
| Vehicles Available | Male | Female |
| No Vehicle | 0 (0.0%) | 0 (0.0%) |
| 1 Vehicle | 0 (0.0%) | 0 (0.0%) |
| 2 Vehicles | 156 (68.4%) | 168 (82.8%) |
| 3 Vehicles | 36 (15.8%) | 19 (9.4%) |
| 4 Vehicles | 36 (15.8%) | 16 (7.9%) |
| 5 or more Vehicles | 0 (0.0%) | 0 (0.0%) |
| Total | 228 (100.0%) | 203 (100.0%) |
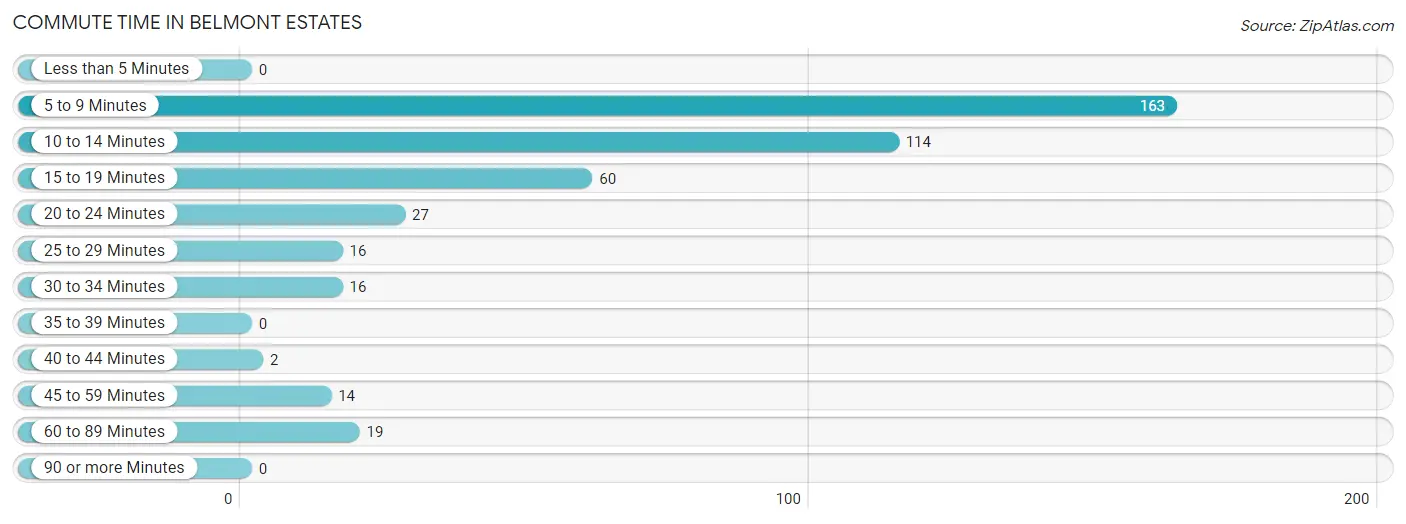
Commute Time in Belmont Estates
The most frequently occuring commute durations in Belmont Estates are 5 to 9 minutes (163 commuters, 37.8%), 10 to 14 minutes (114 commuters, 26.5%), and 15 to 19 minutes (60 commuters, 13.9%).
| Commute Time | # Commuters | % Commuters |
| Less than 5 Minutes | 0 | 0.0% |
| 5 to 9 Minutes | 163 | 37.8% |
| 10 to 14 Minutes | 114 | 26.5% |
| 15 to 19 Minutes | 60 | 13.9% |
| 20 to 24 Minutes | 27 | 6.3% |
| 25 to 29 Minutes | 16 | 3.7% |
| 30 to 34 Minutes | 16 | 3.7% |
| 35 to 39 Minutes | 0 | 0.0% |
| 40 to 44 Minutes | 2 | 0.5% |
| 45 to 59 Minutes | 14 | 3.3% |
| 60 to 89 Minutes | 19 | 4.4% |
| 90 or more Minutes | 0 | 0.0% |
Commute Time by Sex in Belmont Estates
The most common commute times in Belmont Estates are 5 to 9 minutes (90 commuters, 39.5%) for males and 5 to 9 minutes (73 commuters, 36.0%) for females.
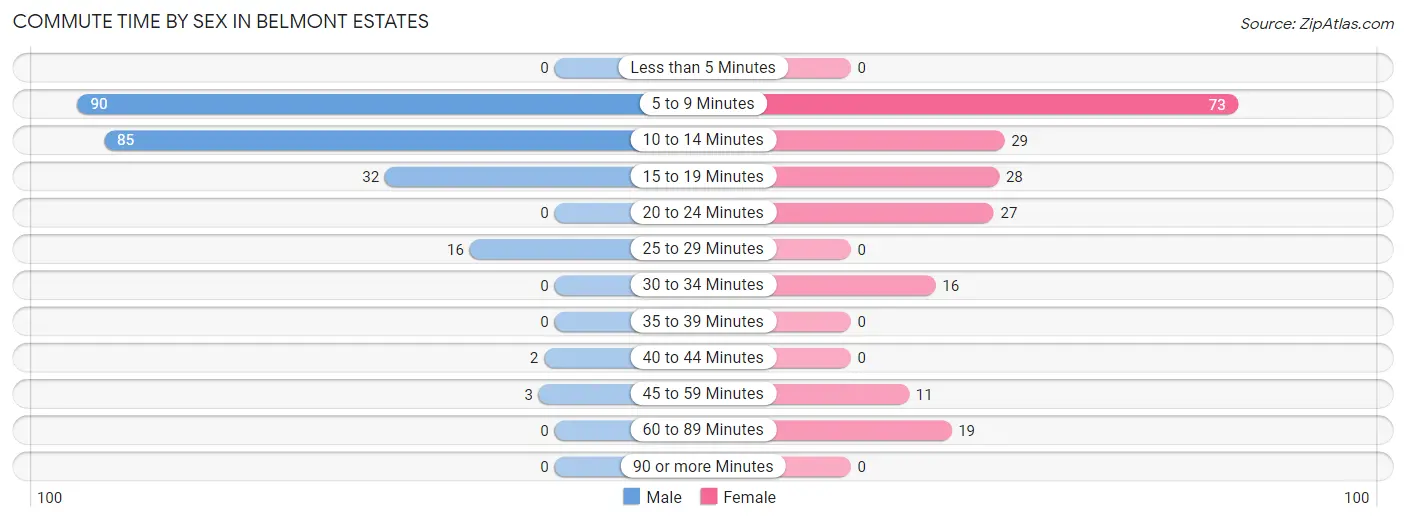
| Commute Time | Male | Female |
| Less than 5 Minutes | 0 (0.0%) | 0 (0.0%) |
| 5 to 9 Minutes | 90 (39.5%) | 73 (36.0%) |
| 10 to 14 Minutes | 85 (37.3%) | 29 (14.3%) |
| 15 to 19 Minutes | 32 (14.0%) | 28 (13.8%) |
| 20 to 24 Minutes | 0 (0.0%) | 27 (13.3%) |
| 25 to 29 Minutes | 16 (7.0%) | 0 (0.0%) |
| 30 to 34 Minutes | 0 (0.0%) | 16 (7.9%) |
| 35 to 39 Minutes | 0 (0.0%) | 0 (0.0%) |
| 40 to 44 Minutes | 2 (0.9%) | 0 (0.0%) |
| 45 to 59 Minutes | 3 (1.3%) | 11 (5.4%) |
| 60 to 89 Minutes | 0 (0.0%) | 19 (9.4%) |
| 90 or more Minutes | 0 (0.0%) | 0 (0.0%) |
Time of Departure to Work by Sex in Belmont Estates
The most frequent times of departure to work in Belmont Estates are 7:30 AM to 7:59 AM (93, 40.8%) for males and 7:30 AM to 7:59 AM (86, 42.4%) for females.
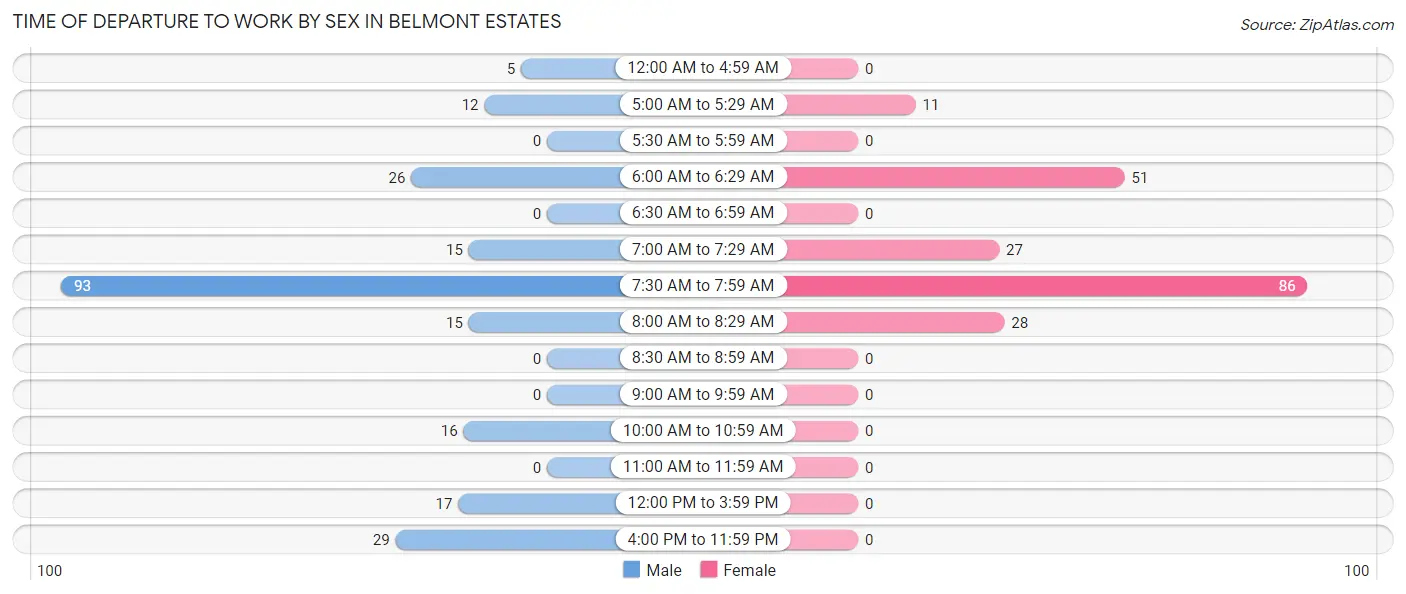
| Time of Departure | Male | Female |
| 12:00 AM to 4:59 AM | 5 (2.2%) | 0 (0.0%) |
| 5:00 AM to 5:29 AM | 12 (5.3%) | 11 (5.4%) |
| 5:30 AM to 5:59 AM | 0 (0.0%) | 0 (0.0%) |
| 6:00 AM to 6:29 AM | 26 (11.4%) | 51 (25.1%) |
| 6:30 AM to 6:59 AM | 0 (0.0%) | 0 (0.0%) |
| 7:00 AM to 7:29 AM | 15 (6.6%) | 27 (13.3%) |
| 7:30 AM to 7:59 AM | 93 (40.8%) | 86 (42.4%) |
| 8:00 AM to 8:29 AM | 15 (6.6%) | 28 (13.8%) |
| 8:30 AM to 8:59 AM | 0 (0.0%) | 0 (0.0%) |
| 9:00 AM to 9:59 AM | 0 (0.0%) | 0 (0.0%) |
| 10:00 AM to 10:59 AM | 16 (7.0%) | 0 (0.0%) |
| 11:00 AM to 11:59 AM | 0 (0.0%) | 0 (0.0%) |
| 12:00 PM to 3:59 PM | 17 (7.5%) | 0 (0.0%) |
| 4:00 PM to 11:59 PM | 29 (12.7%) | 0 (0.0%) |
| Total | 228 (100.0%) | 203 (100.0%) |
Housing Occupancy in Belmont Estates
Occupancy by Ownership in Belmont Estates
Of the total 471 dwellings in Belmont Estates, owner-occupied units account for 471 (100.0%), while renter-occupied units make up 0 (0.0%).
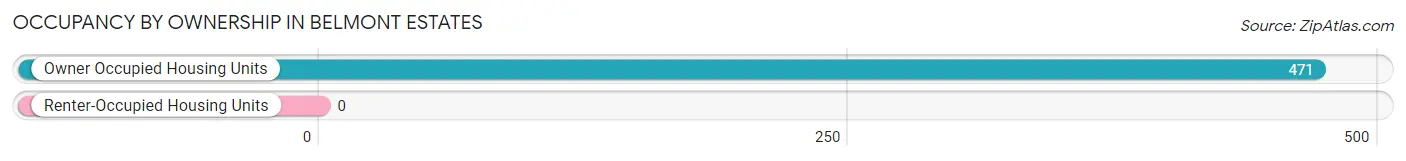
| Occupancy | # Housing Units | % Housing Units |
| Owner Occupied Housing Units | 471 | 100.0% |
| Renter-Occupied Housing Units | 0 | 0.0% |
| Total Occupied Housing Units | 471 | 100.0% |
Occupancy by Household Size in Belmont Estates
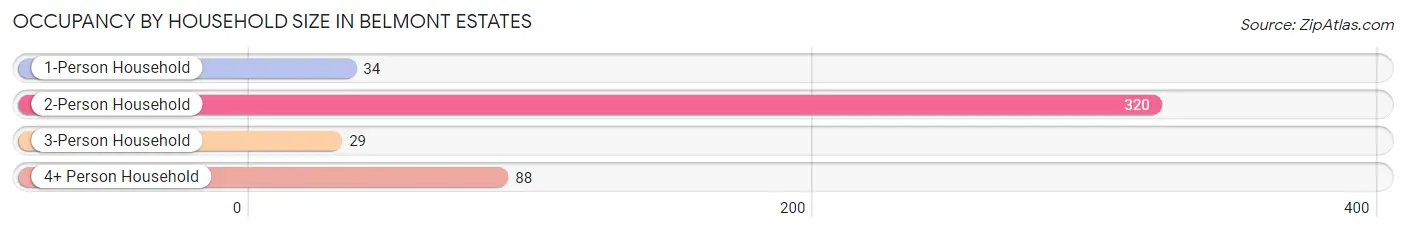
| Household Size | # Housing Units | % Housing Units |
| 1-Person Household | 34 | 7.2% |
| 2-Person Household | 320 | 67.9% |
| 3-Person Household | 29 | 6.2% |
| 4+ Person Household | 88 | 18.7% |
| Total Housing Units | 471 | 100.0% |
Occupancy by Ownership by Household Size in Belmont Estates
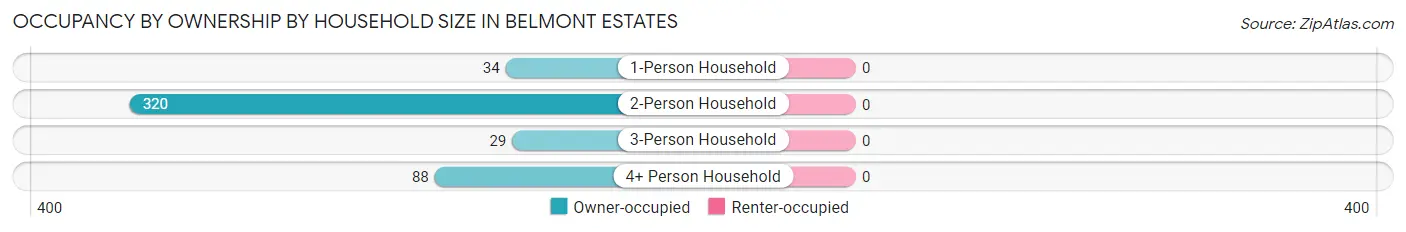
| Household Size | Owner-occupied | Renter-occupied |
| 1-Person Household | 34 (100.0%) | 0 (0.0%) |
| 2-Person Household | 320 (100.0%) | 0 (0.0%) |
| 3-Person Household | 29 (100.0%) | 0 (0.0%) |
| 4+ Person Household | 88 (100.0%) | 0 (0.0%) |
| Total Housing Units | 471 (100.0%) | 0 (0.0%) |
Occupancy by Educational Attainment in Belmont Estates
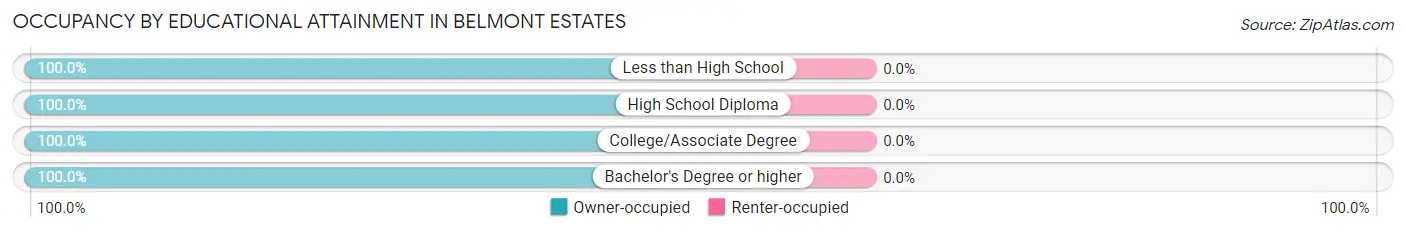
| Household Size | Owner-occupied | Renter-occupied |
| Less than High School | 41 (100.0%) | 0 (0.0%) |
| High School Diploma | 90 (100.0%) | 0 (0.0%) |
| College/Associate Degree | 84 (100.0%) | 0 (0.0%) |
| Bachelor's Degree or higher | 256 (100.0%) | 0 (0.0%) |
Occupancy by Age of Householder in Belmont Estates
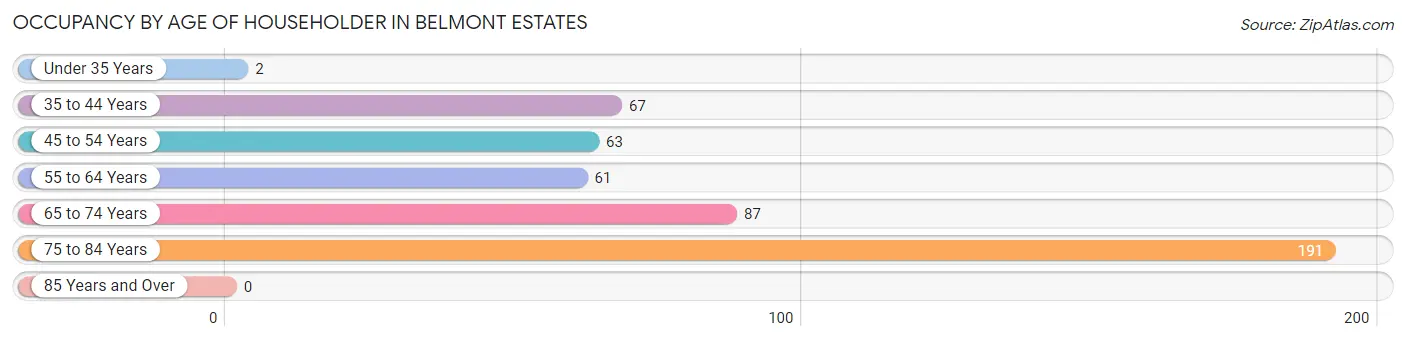
| Age Bracket | # Households | % Households |
| Under 35 Years | 2 | 0.4% |
| 35 to 44 Years | 67 | 14.2% |
| 45 to 54 Years | 63 | 13.4% |
| 55 to 64 Years | 61 | 13.0% |
| 65 to 74 Years | 87 | 18.5% |
| 75 to 84 Years | 191 | 40.6% |
| 85 Years and Over | 0 | 0.0% |
| Total | 471 | 100.0% |
Housing Finances in Belmont Estates
Median Income by Occupancy in Belmont Estates
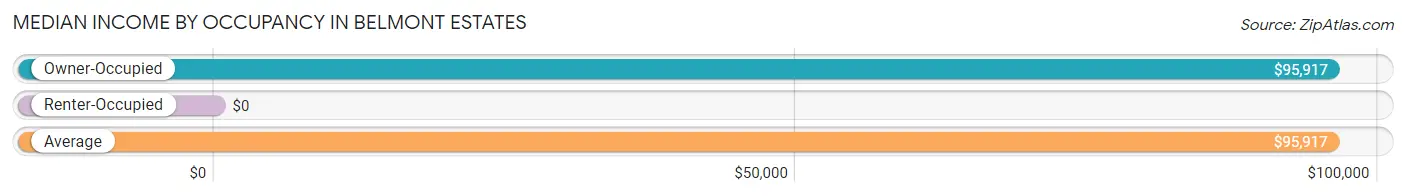
| Occupancy Type | # Households | Median Income |
| Owner-Occupied | 471 (100.0%) | $95,917 |
| Renter-Occupied | 0 (0.0%) | $0 |
| Average | 471 (100.0%) | $95,917 |
Occupancy by Householder Income Bracket in Belmont Estates
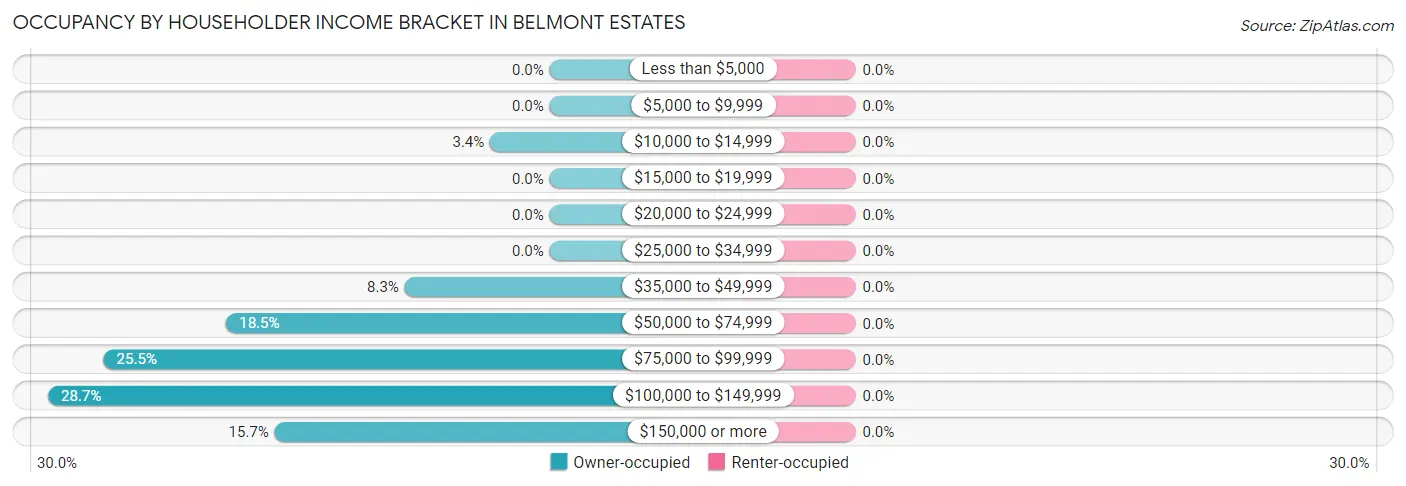
| Income Bracket | Owner-occupied | Renter-occupied |
| Less than $5,000 | 0 (0.0%) | 0 (0.0%) |
| $5,000 to $9,999 | 0 (0.0%) | 0 (0.0%) |
| $10,000 to $14,999 | 16 (3.4%) | 0 (0.0%) |
| $15,000 to $19,999 | 0 (0.0%) | 0 (0.0%) |
| $20,000 to $24,999 | 0 (0.0%) | 0 (0.0%) |
| $25,000 to $34,999 | 0 (0.0%) | 0 (0.0%) |
| $35,000 to $49,999 | 39 (8.3%) | 0 (0.0%) |
| $50,000 to $74,999 | 87 (18.5%) | 0 (0.0%) |
| $75,000 to $99,999 | 120 (25.5%) | 0 (0.0%) |
| $100,000 to $149,999 | 135 (28.7%) | 0 (0.0%) |
| $150,000 or more | 74 (15.7%) | 0 (0.0%) |
| Total | 471 (100.0%) | 0 (0.0%) |
Monthly Housing Cost Tiers in Belmont Estates
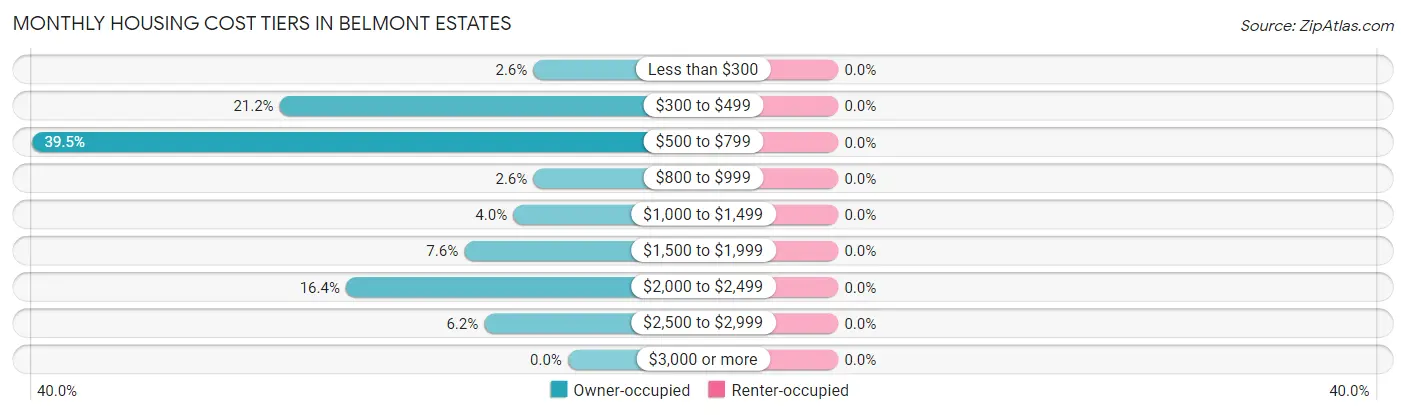
| Monthly Cost | Owner-occupied | Renter-occupied |
| Less than $300 | 12 (2.5%) | 0 (0.0%) |
| $300 to $499 | 100 (21.2%) | 0 (0.0%) |
| $500 to $799 | 186 (39.5%) | 0 (0.0%) |
| $800 to $999 | 12 (2.5%) | 0 (0.0%) |
| $1,000 to $1,499 | 19 (4.0%) | 0 (0.0%) |
| $1,500 to $1,999 | 36 (7.6%) | 0 (0.0%) |
| $2,000 to $2,499 | 77 (16.4%) | 0 (0.0%) |
| $2,500 to $2,999 | 29 (6.2%) | 0 (0.0%) |
| $3,000 or more | 0 (0.0%) | 0 (0.0%) |
| Total | 471 (100.0%) | 0 (0.0%) |
Physical Housing Characteristics in Belmont Estates
Housing Structures in Belmont Estates

| Structure Type | # Housing Units | % Housing Units |
| Single Unit, Detached | 471 | 100.0% |
| Single Unit, Attached | 0 | 0.0% |
| 2 Unit Apartments | 0 | 0.0% |
| 3 or 4 Unit Apartments | 0 | 0.0% |
| 5 to 9 Unit Apartments | 0 | 0.0% |
| 10 or more Apartments | 0 | 0.0% |
| Mobile Home / Other | 0 | 0.0% |
| Total | 471 | 100.0% |
Housing Structures by Occupancy in Belmont Estates
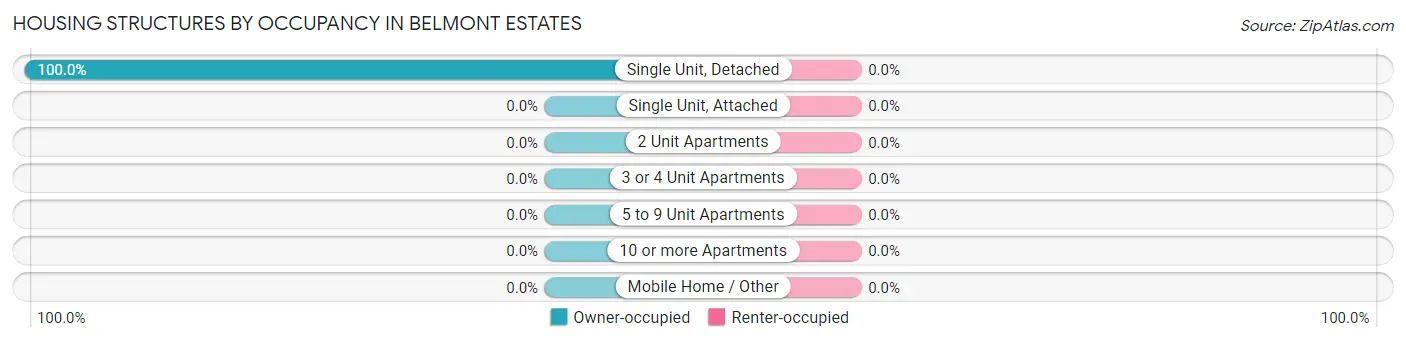
| Structure Type | Owner-occupied | Renter-occupied |
| Single Unit, Detached | 471 (100.0%) | 0 (0.0%) |
| Single Unit, Attached | 0 (0.0%) | 0 (0.0%) |
| 2 Unit Apartments | 0 (0.0%) | 0 (0.0%) |
| 3 or 4 Unit Apartments | 0 (0.0%) | 0 (0.0%) |
| 5 to 9 Unit Apartments | 0 (0.0%) | 0 (0.0%) |
| 10 or more Apartments | 0 (0.0%) | 0 (0.0%) |
| Mobile Home / Other | 0 (0.0%) | 0 (0.0%) |
| Total | 471 (100.0%) | 0 (0.0%) |
Housing Structures by Number of Rooms in Belmont Estates
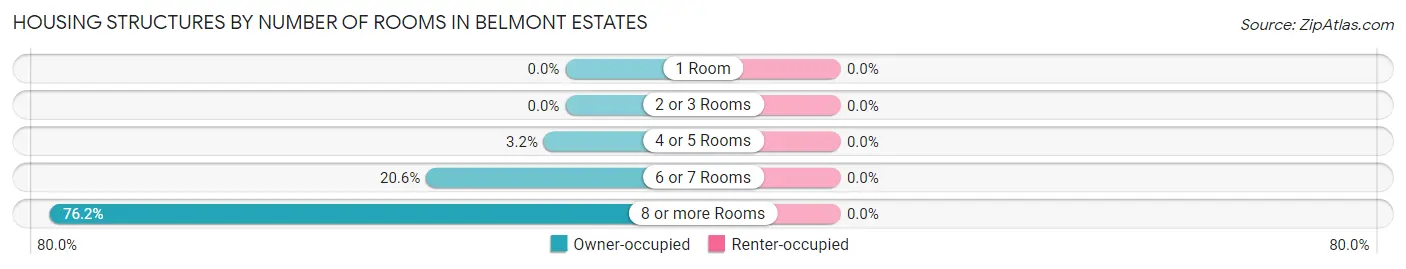
| Number of Rooms | Owner-occupied | Renter-occupied |
| 1 Room | 0 (0.0%) | 0 (0.0%) |
| 2 or 3 Rooms | 0 (0.0%) | 0 (0.0%) |
| 4 or 5 Rooms | 15 (3.2%) | 0 (0.0%) |
| 6 or 7 Rooms | 97 (20.6%) | 0 (0.0%) |
| 8 or more Rooms | 359 (76.2%) | 0 (0.0%) |
| Total | 471 (100.0%) | 0 (0.0%) |
Housing Structure by Heating Type in Belmont Estates
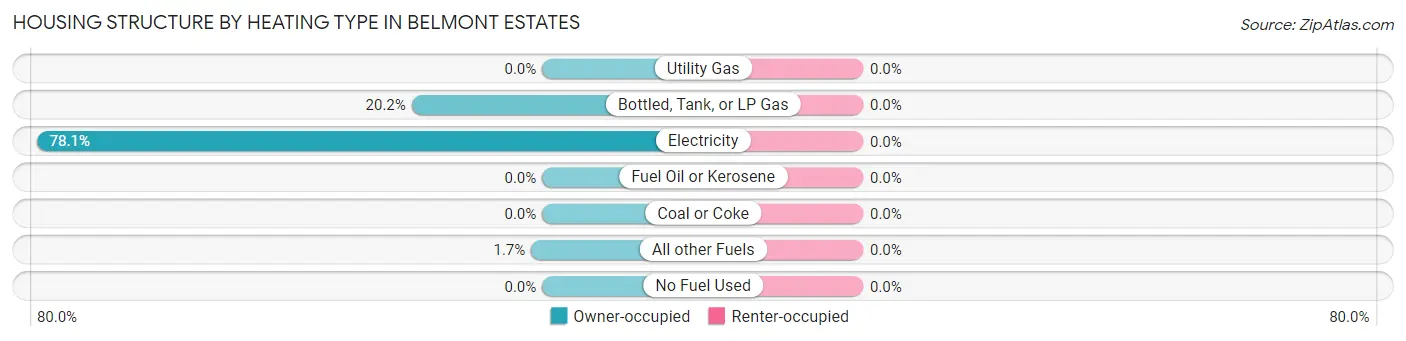
| Heating Type | Owner-occupied | Renter-occupied |
| Utility Gas | 0 (0.0%) | 0 (0.0%) |
| Bottled, Tank, or LP Gas | 95 (20.2%) | 0 (0.0%) |
| Electricity | 368 (78.1%) | 0 (0.0%) |
| Fuel Oil or Kerosene | 0 (0.0%) | 0 (0.0%) |
| Coal or Coke | 0 (0.0%) | 0 (0.0%) |
| All other Fuels | 8 (1.7%) | 0 (0.0%) |
| No Fuel Used | 0 (0.0%) | 0 (0.0%) |
| Total | 471 (100.0%) | 0 (0.0%) |
Household Vehicle Usage in Belmont Estates
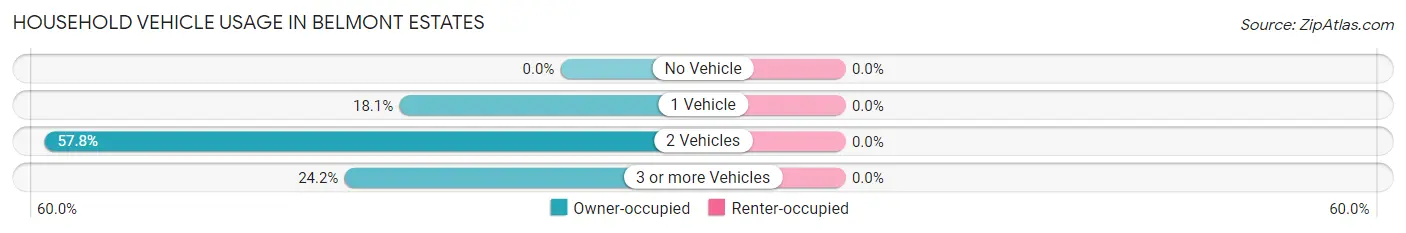
| Vehicles per Household | Owner-occupied | Renter-occupied |
| No Vehicle | 0 (0.0%) | 0 (0.0%) |
| 1 Vehicle | 85 (18.0%) | 0 (0.0%) |
| 2 Vehicles | 272 (57.8%) | 0 (0.0%) |
| 3 or more Vehicles | 114 (24.2%) | 0 (0.0%) |
| Total | 471 (100.0%) | 0 (0.0%) |
Real Estate & Mortgages in Belmont Estates
Real Estate and Mortgage Overview in Belmont Estates
| Characteristic | Without Mortgage | With Mortgage |
| Housing Units | 260 | 211 |
| Median Property Value | $392,500 | $383,800 |
| Median Household Income | $95,667 | $47 |
| Monthly Housing Costs | $590 | $0 |
| Real Estate Taxes | $2,176 | $0 |
Property Value by Mortgage Status in Belmont Estates
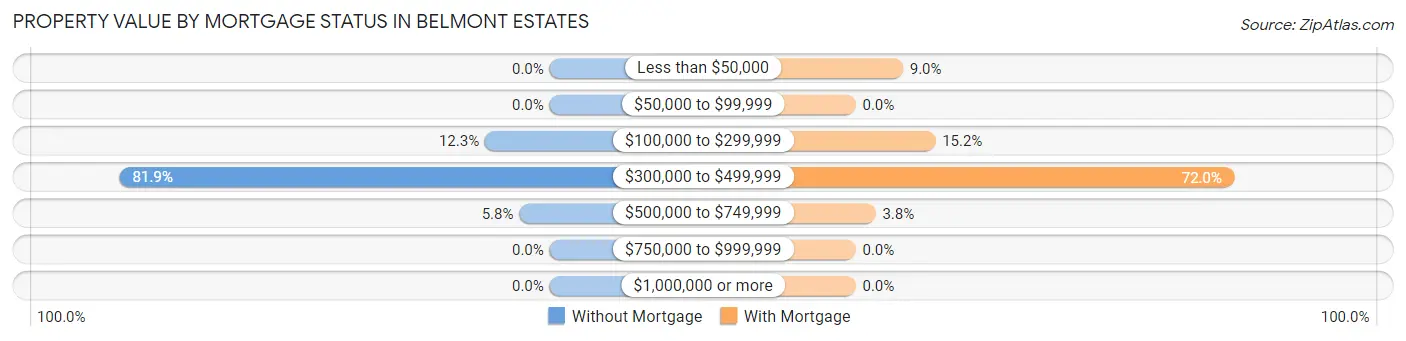
| Property Value | Without Mortgage | With Mortgage |
| Less than $50,000 | 0 (0.0%) | 19 (9.0%) |
| $50,000 to $99,999 | 0 (0.0%) | 0 (0.0%) |
| $100,000 to $299,999 | 32 (12.3%) | 32 (15.2%) |
| $300,000 to $499,999 | 213 (81.9%) | 152 (72.0%) |
| $500,000 to $749,999 | 15 (5.8%) | 8 (3.8%) |
| $750,000 to $999,999 | 0 (0.0%) | 0 (0.0%) |
| $1,000,000 or more | 0 (0.0%) | 0 (0.0%) |
| Total | 260 (100.0%) | 211 (100.0%) |
Household Income by Mortgage Status in Belmont Estates
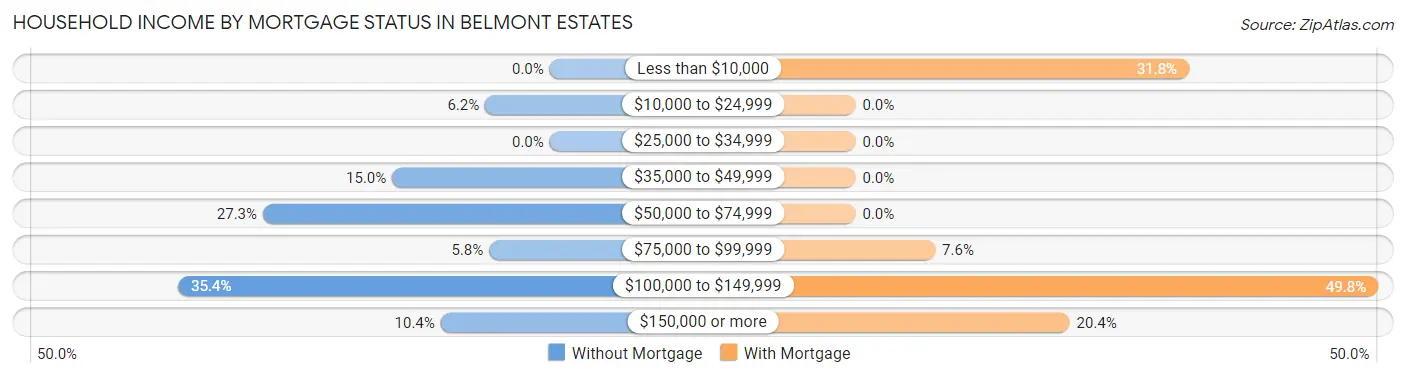
| Household Income | Without Mortgage | With Mortgage |
| Less than $10,000 | 0 (0.0%) | 67 (31.8%) |
| $10,000 to $24,999 | 16 (6.1%) | 0 (0.0%) |
| $25,000 to $34,999 | 0 (0.0%) | 0 (0.0%) |
| $35,000 to $49,999 | 39 (15.0%) | 0 (0.0%) |
| $50,000 to $74,999 | 71 (27.3%) | 0 (0.0%) |
| $75,000 to $99,999 | 15 (5.8%) | 16 (7.6%) |
| $100,000 to $149,999 | 92 (35.4%) | 105 (49.8%) |
| $150,000 or more | 27 (10.4%) | 43 (20.4%) |
| Total | 260 (100.0%) | 211 (100.0%) |
Property Value to Household Income Ratio in Belmont Estates
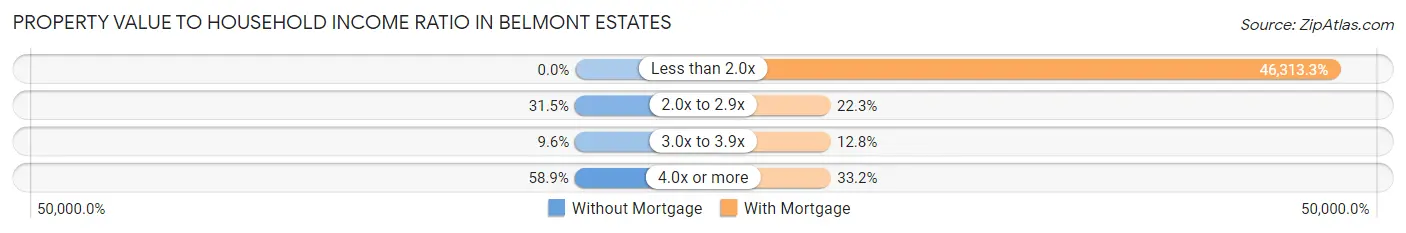
| Value-to-Income Ratio | Without Mortgage | With Mortgage |
| Less than 2.0x | 0 (0.0%) | 97,721 (46,313.3%) |
| 2.0x to 2.9x | 82 (31.5%) | 47 (22.3%) |
| 3.0x to 3.9x | 25 (9.6%) | 27 (12.8%) |
| 4.0x or more | 153 (58.9%) | 70 (33.2%) |
| Total | 260 (100.0%) | 211 (100.0%) |
Real Estate Taxes by Mortgage Status in Belmont Estates
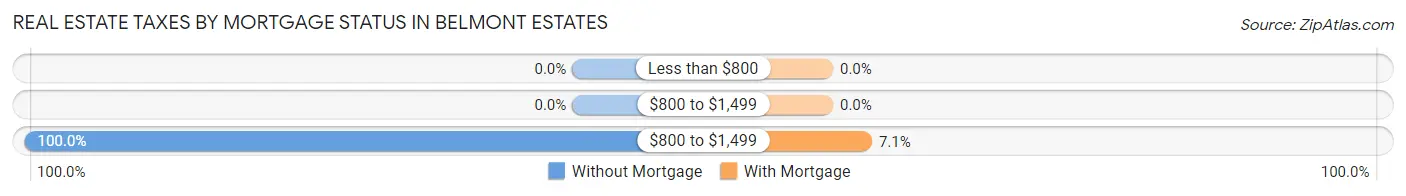
| Property Taxes | Without Mortgage | With Mortgage |
| Less than $800 | 0 (0.0%) | 0 (0.0%) |
| $800 to $1,499 | 0 (0.0%) | 0 (0.0%) |
| $800 to $1,499 | 260 (100.0%) | 15 (7.1%) |
| Total | 260 (100.0%) | 211 (100.0%) |
Health & Disability in Belmont Estates
Health Insurance Coverage by Age in Belmont Estates
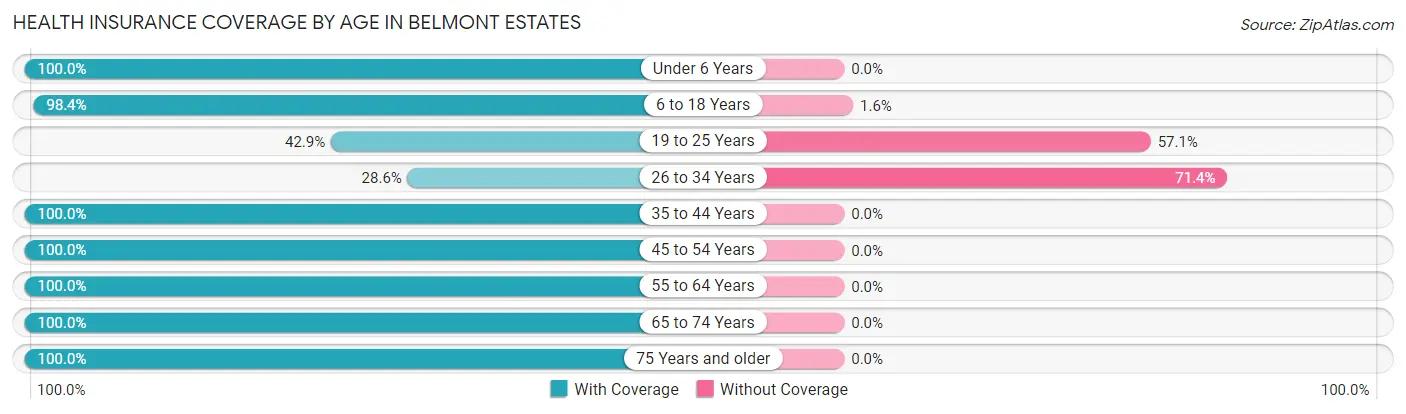
| Age Bracket | With Coverage | Without Coverage |
| Under 6 Years | 16 (100.0%) | 0 (0.0%) |
| 6 to 18 Years | 180 (98.4%) | 3 (1.6%) |
| 19 to 25 Years | 3 (42.9%) | 4 (57.1%) |
| 26 to 34 Years | 2 (28.6%) | 5 (71.4%) |
| 35 to 44 Years | 75 (100.0%) | 0 (0.0%) |
| 45 to 54 Years | 219 (100.0%) | 0 (0.0%) |
| 55 to 64 Years | 119 (100.0%) | 0 (0.0%) |
| 65 to 74 Years | 145 (100.0%) | 0 (0.0%) |
| 75 Years and older | 421 (100.0%) | 0 (0.0%) |
| Total | 1,180 (99.0%) | 12 (1.0%) |
Health Insurance Coverage by Citizenship Status in Belmont Estates
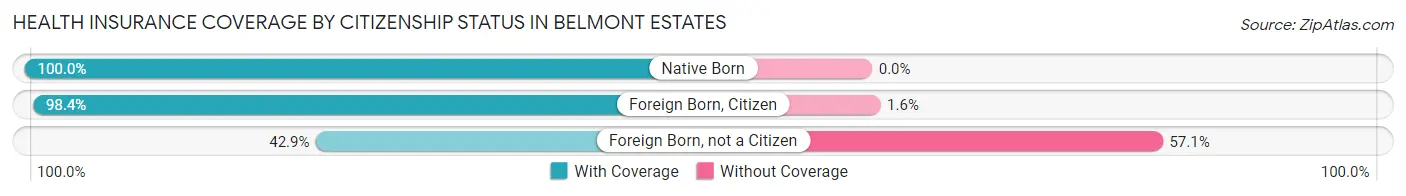
| Citizenship Status | With Coverage | Without Coverage |
| Native Born | 16 (100.0%) | 0 (0.0%) |
| Foreign Born, Citizen | 180 (98.4%) | 3 (1.6%) |
| Foreign Born, not a Citizen | 3 (42.9%) | 4 (57.1%) |
Health Insurance Coverage by Household Income in Belmont Estates
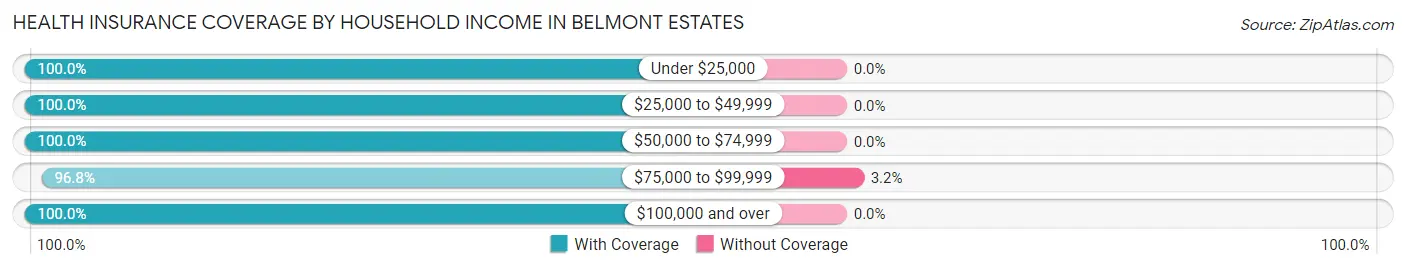
| Household Income | With Coverage | Without Coverage |
| Under $25,000 | 34 (100.0%) | 0 (0.0%) |
| $25,000 to $49,999 | 126 (100.0%) | 0 (0.0%) |
| $50,000 to $74,999 | 141 (100.0%) | 0 (0.0%) |
| $75,000 to $99,999 | 366 (96.8%) | 12 (3.2%) |
| $100,000 and over | 504 (100.0%) | 0 (0.0%) |
Public vs Private Health Insurance Coverage by Age in Belmont Estates
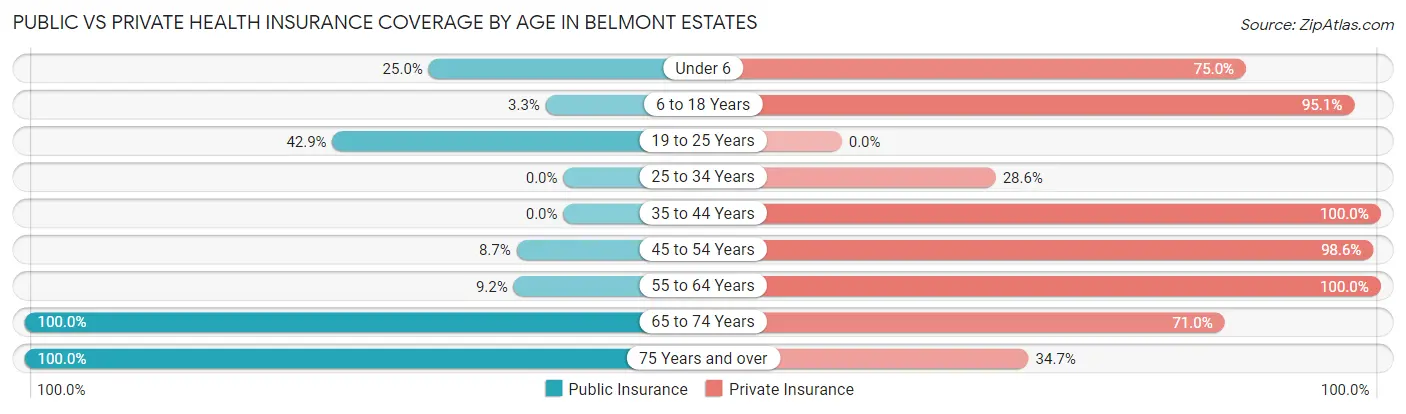
| Age Bracket | Public Insurance | Private Insurance |
| Under 6 | 4 (25.0%) | 12 (75.0%) |
| 6 to 18 Years | 6 (3.3%) | 174 (95.1%) |
| 19 to 25 Years | 3 (42.9%) | 0 (0.0%) |
| 25 to 34 Years | 0 (0.0%) | 2 (28.6%) |
| 35 to 44 Years | 0 (0.0%) | 75 (100.0%) |
| 45 to 54 Years | 19 (8.7%) | 216 (98.6%) |
| 55 to 64 Years | 11 (9.2%) | 119 (100.0%) |
| 65 to 74 Years | 145 (100.0%) | 103 (71.0%) |
| 75 Years and over | 421 (100.0%) | 146 (34.7%) |
| Total | 609 (51.1%) | 847 (71.1%) |
Disability Status by Sex by Age in Belmont Estates
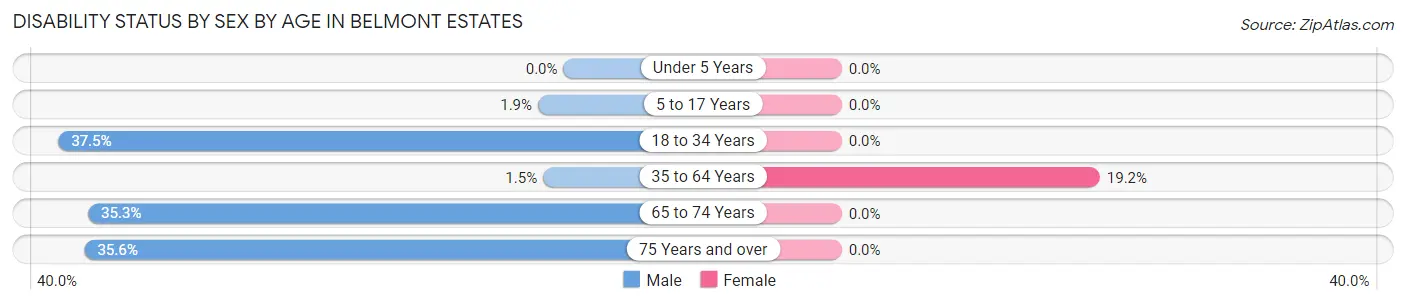
| Age Bracket | Male | Female |
| Under 5 Years | 0 (0.0%) | 0 (0.0%) |
| 5 to 17 Years | 2 (1.9%) | 0 (0.0%) |
| 18 to 34 Years | 3 (37.5%) | 0 (0.0%) |
| 35 to 64 Years | 3 (1.5%) | 41 (19.2%) |
| 65 to 74 Years | 18 (35.3%) | 0 (0.0%) |
| 75 Years and over | 91 (35.5%) | 0 (0.0%) |
Disability Class by Sex by Age in Belmont Estates
Disability Class: Hearing Difficulty
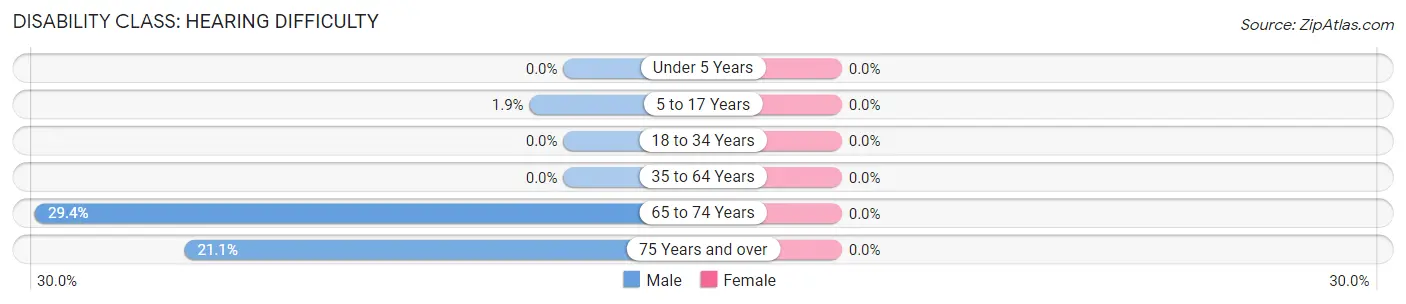
| Age Bracket | Male | Female |
| Under 5 Years | 0 (0.0%) | 0 (0.0%) |
| 5 to 17 Years | 2 (1.9%) | 0 (0.0%) |
| 18 to 34 Years | 0 (0.0%) | 0 (0.0%) |
| 35 to 64 Years | 0 (0.0%) | 0 (0.0%) |
| 65 to 74 Years | 15 (29.4%) | 0 (0.0%) |
| 75 Years and over | 54 (21.1%) | 0 (0.0%) |
Disability Class: Vision Difficulty
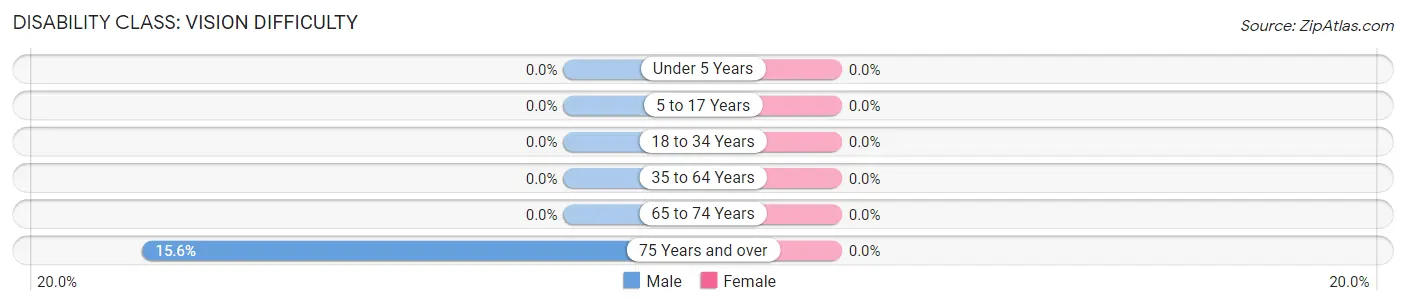
| Age Bracket | Male | Female |
| Under 5 Years | 0 (0.0%) | 0 (0.0%) |
| 5 to 17 Years | 0 (0.0%) | 0 (0.0%) |
| 18 to 34 Years | 0 (0.0%) | 0 (0.0%) |
| 35 to 64 Years | 0 (0.0%) | 0 (0.0%) |
| 65 to 74 Years | 0 (0.0%) | 0 (0.0%) |
| 75 Years and over | 40 (15.6%) | 0 (0.0%) |
Disability Class: Cognitive Difficulty
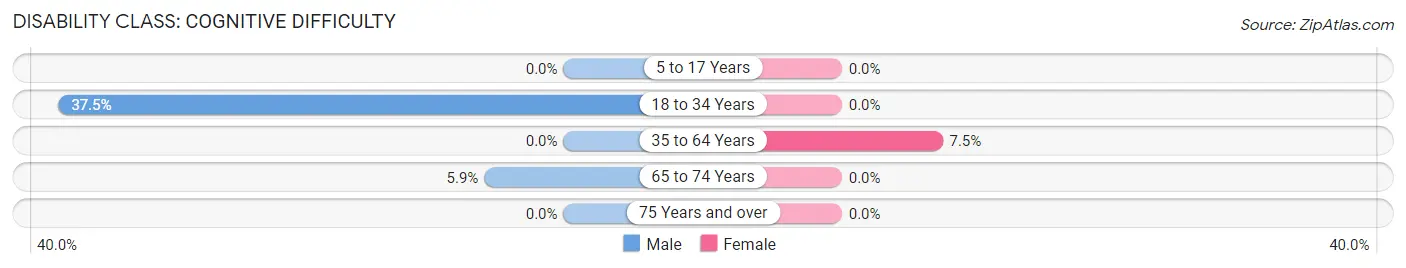
| Age Bracket | Male | Female |
| 5 to 17 Years | 0 (0.0%) | 0 (0.0%) |
| 18 to 34 Years | 3 (37.5%) | 0 (0.0%) |
| 35 to 64 Years | 0 (0.0%) | 16 (7.5%) |
| 65 to 74 Years | 3 (5.9%) | 0 (0.0%) |
| 75 Years and over | 0 (0.0%) | 0 (0.0%) |
Disability Class: Ambulatory Difficulty
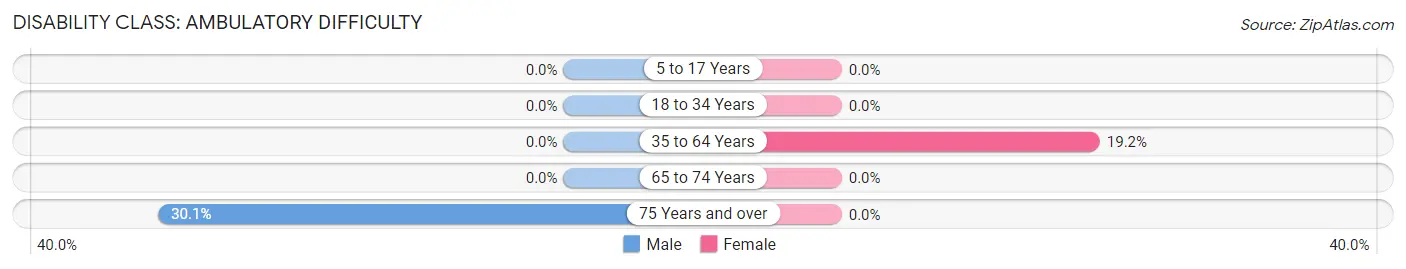
| Age Bracket | Male | Female |
| 5 to 17 Years | 0 (0.0%) | 0 (0.0%) |
| 18 to 34 Years | 0 (0.0%) | 0 (0.0%) |
| 35 to 64 Years | 0 (0.0%) | 41 (19.2%) |
| 65 to 74 Years | 0 (0.0%) | 0 (0.0%) |
| 75 Years and over | 77 (30.1%) | 0 (0.0%) |
Disability Class: Self-Care Difficulty
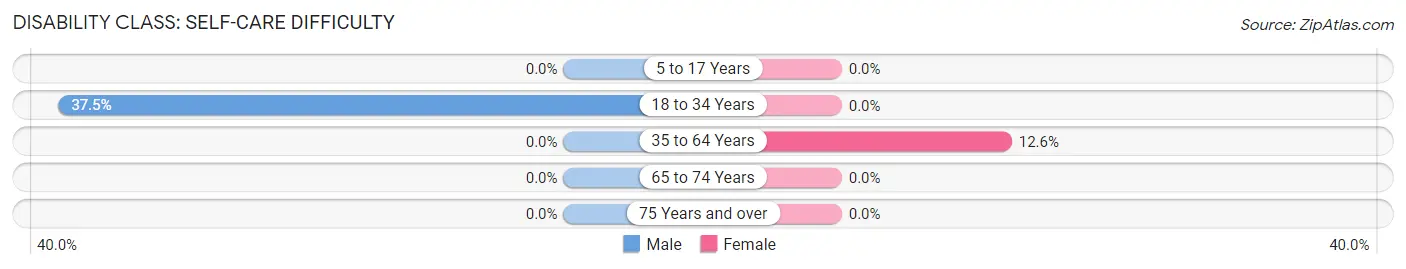
| Age Bracket | Male | Female |
| 5 to 17 Years | 0 (0.0%) | 0 (0.0%) |
| 18 to 34 Years | 3 (37.5%) | 0 (0.0%) |
| 35 to 64 Years | 0 (0.0%) | 27 (12.6%) |
| 65 to 74 Years | 0 (0.0%) | 0 (0.0%) |
| 75 Years and over | 0 (0.0%) | 0 (0.0%) |
Technology Access in Belmont Estates
Computing Device Access in Belmont Estates
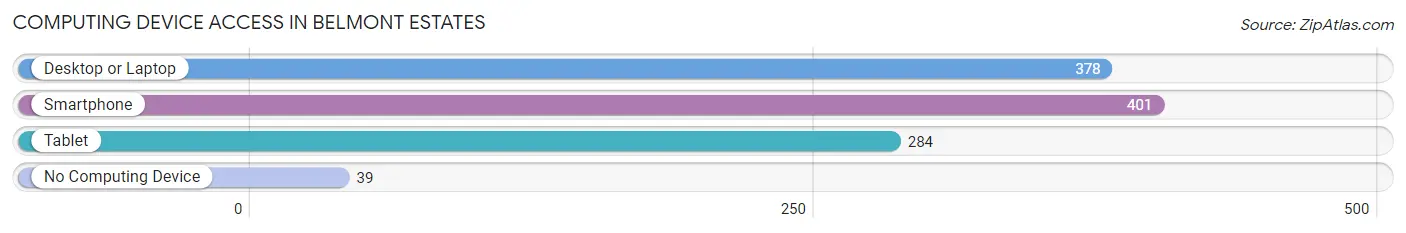
| Device Type | # Households | % Households |
| Desktop or Laptop | 378 | 80.2% |
| Smartphone | 401 | 85.1% |
| Tablet | 284 | 60.3% |
| No Computing Device | 39 | 8.3% |
| Total | 471 | 100.0% |
Internet Access in Belmont Estates
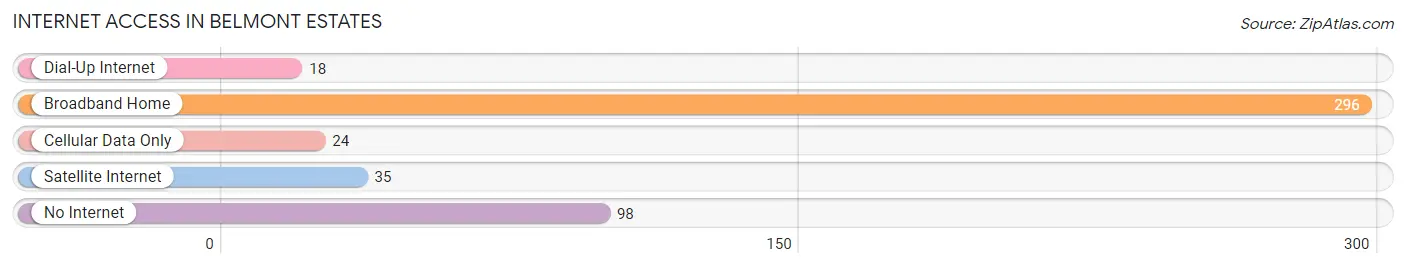
| Internet Type | # Households | % Households |
| Dial-Up Internet | 18 | 3.8% |
| Broadband Home | 296 | 62.8% |
| Cellular Data Only | 24 | 5.1% |
| Satellite Internet | 35 | 7.4% |
| No Internet | 98 | 20.8% |
| Total | 471 | 100.0% |
Belmont Estates Summary
Belmont Estates is a census-designated place (CDP) located in Fairfax County, Virginia. It is situated in the northern part of the county, just south of the city of Fairfax. The population of Belmont Estates was 8,945 at the 2010 census.
Geography
Belmont Estates is located at 38°51'17" North, 77°17'45" West (38.854722, -77.295833). It is bordered by the city of Fairfax to the north, the town of Herndon to the east, the town of Vienna to the south, and the city of Falls Church to the west. The total area of Belmont Estates is 4.3 square miles, all of which is land.
The terrain of Belmont Estates is mostly flat, with some rolling hills in the northern part of the CDP. The area is mostly residential, with some commercial and industrial development along the western edge of the CDP. The climate is temperate, with hot, humid summers and cold, wet winters.
Demographics
As of the 2010 census, there were 8,945 people, 3,541 households, and 2,541 families residing in Belmont Estates. The population density was 2,082.2 people per square mile. The racial makeup of the CDP was 79.2% White, 8.2% African American, 0.3% Native American, 6.7% Asian, 0.1% Pacific Islander, 2.3% from other races, and 3.3% from two or more races. Hispanic or Latino of any race were 6.7% of the population.
There were 3,541 households, out of which 33.2% had children under the age of 18 living with them, 57.2% were married couples living together, 10.2% had a female householder with no husband present, and 28.2% were non-families. 22.2% of all households were made up of individuals, and 6.2% had someone living alone who was 65 years of age or older. The average household size was 2.53 and the average family size was 2.97.
The median age in Belmont Estates was 40.2 years. 24.2% of residents were under the age of 18; 6.7% were between the ages of 18 and 24; 28.2% were from 25 to 44; 28.2% were from 45 to 64; and 12.7% were 65 years of age or older. The gender makeup of the CDP was 48.2% male and 51.8% female.
Economy
The economy of Belmont Estates is largely based on the service industry. The largest employers in the area are government agencies, such as the Fairfax County Public Schools, the Fairfax County Government, and the U.S. Department of Defense. Other major employers include the Inova Fairfax Hospital, the Fairfax County Public Library, and the Fairfax County Police Department.
The median household income in Belmont Estates was $107,945 in 2018, which is significantly higher than the national median of $61,937. The median home value in Belmont Estates was $541,400 in 2018, which is also significantly higher than the national median of $219,700.
The unemployment rate in Belmont Estates was 3.2% in 2018, which is lower than the national average of 3.9%. The poverty rate in Belmont Estates was 3.2% in 2018, which is lower than the national average of 11.8%.
Conclusion
Belmont Estates is a census-designated place located in Fairfax County, Virginia. It is situated in the northern part of the county, just south of the city of Fairfax. The population of Belmont Estates was 8,945 at the 2010 census. The terrain of Belmont Estates is mostly flat, with some rolling hills in the northern part of the CDP. The climate is temperate, with hot, humid summers and cold, wet winters.
As of the 2010 census, the population of Belmont Estates was 8,945. The racial makeup of the CDP was 79.2% White, 8.2% African American, 0.3% Native American, 6.7% Asian, 0.1% Pacific Islander, 2.3% from other races, and 3.3% from two or more races. Hispanic or Latino of any race were 6.7% of the population.
The economy of Belmont Estates is largely based on the service industry. The largest employers in the area are government agencies, such as the Fairfax County Public Schools, the Fairfax County Government, and the U.S. Department of Defense. The median household income in Belmont Estates was $107,945 in 2018, which is significantly higher than the national median of $61,937. The median home value in Belmont Estates was $541,400 in 2018, which is also significantly higher than the national median of $219,700. The unemployment rate in Belmont Estates was 3.2% in 2018, which is lower than the national average of 3.9%. The poverty rate in Belmont Estates was 3.2% in 2018, which is lower than the national average of 11.8%.
Common Questions
What is Per Capita Income in Belmont Estates?
Per Capita income in Belmont Estates is $47,996.
What is the Median Family Income in Belmont Estates?
Median Family Income in Belmont Estates is $98,603.
What is the Median Household income in Belmont Estates?
Median Household Income in Belmont Estates is $95,917.
What is Inequality or Gini Index in Belmont Estates?
Inequality or Gini Index in Belmont Estates is 0.34.
What is the Total Population of Belmont Estates?
Total Population of Belmont Estates is 1,192.
What is the Total Male Population of Belmont Estates?
Total Male Population of Belmont Estates is 625.
What is the Total Female Population of Belmont Estates?
Total Female Population of Belmont Estates is 567.
What is the Ratio of Males per 100 Females in Belmont Estates?
There are 110.23 Males per 100 Females in Belmont Estates.
What is the Ratio of Females per 100 Males in Belmont Estates?
There are 90.72 Females per 100 Males in Belmont Estates.
What is the Median Population Age in Belmont Estates?
Median Population Age in Belmont Estates is 64.1 Years.
What is the Average Family Size in Belmont Estates
Average Family Size in Belmont Estates is 2.6 People.
What is the Average Household Size in Belmont Estates
Average Household Size in Belmont Estates is 2.5 People.
How Large is the Labor Force in Belmont Estates?
There are 431 People in the Labor Forcein in Belmont Estates.
What is the Percentage of People in the Labor Force in Belmont Estates?
42.7% of People are in the Labor Force in Belmont Estates.