Cities with the Highest Percentage of Population Employed in Production in Virginia
RELATED REPORTS & OPTIONS
Production
Virginia
Compare Cities
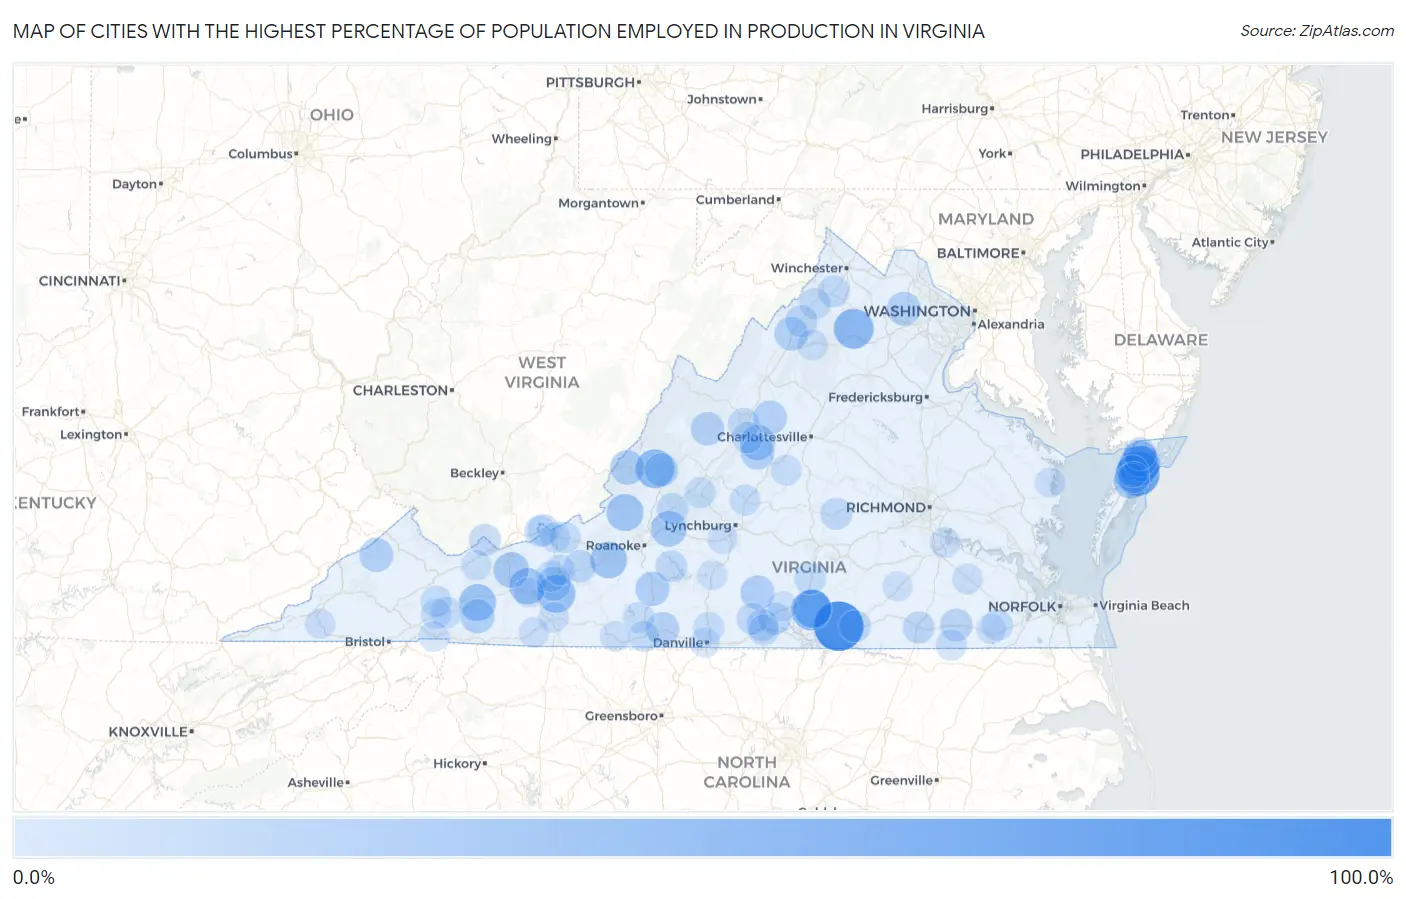
Map of Cities with the Highest Percentage of Population Employed in Production in Virginia
0.0%
100.0%
Cities with the Highest Percentage of Population Employed in Production in Virginia
| City | % Employed | vs State | vs National | |
| 1. | Union Level | 82.9% | 4.1%(+78.8)#1 | 5.5%(+77.5)#55 |
| 2. | Metompkin | 63.2% | 4.1%(+59.0)#2 | 5.5%(+57.7)#101 |
| 3. | Nelsonia | 49.4% | 4.1%(+45.3)#3 | 5.5%(+43.9)#215 |
| 4. | Thynedale | 48.0% | 4.1%(+43.9)#4 | 5.5%(+42.5)#227 |
| 5. | Flint Hill | 46.7% | 4.1%(+42.6)#5 | 5.5%(+41.2)#246 |
| 6. | Selma | 42.9% | 4.1%(+38.8)#6 | 5.5%(+37.5)#292 |
| 7. | Fairview | 40.4% | 4.1%(+36.3)#7 | 5.5%(+34.9)#348 |
| 8. | Allisonia | 40.0% | 4.1%(+35.9)#8 | 5.5%(+34.5)#354 |
| 9. | Falls Mills | 37.1% | 4.1%(+33.0)#9 | 5.5%(+31.7)#437 |
| 10. | Millboro | 36.5% | 4.1%(+32.4)#10 | 5.5%(+31.1)#451 |
| 11. | New Castle | 35.7% | 4.1%(+31.6)#11 | 5.5%(+30.2)#473 |
| 12. | Atkins | 35.7% | 4.1%(+31.6)#12 | 5.5%(+30.2)#478 |
| 13. | Shawsville | 34.9% | 4.1%(+30.8)#13 | 5.5%(+29.4)#507 |
| 14. | Max Meadows | 33.8% | 4.1%(+29.7)#14 | 5.5%(+28.3)#548 |
| 15. | Mappsville | 32.3% | 4.1%(+28.2)#15 | 5.5%(+26.8)#629 |
| 16. | Montvale | 31.5% | 4.1%(+27.4)#16 | 5.5%(+26.1)#675 |
| 17. | Hallwood | 31.1% | 4.1%(+27.0)#17 | 5.5%(+25.6)#702 |
| 18. | Bland | 31.0% | 4.1%(+26.9)#18 | 5.5%(+25.5)#707 |
| 19. | Sherando | 29.4% | 4.1%(+25.3)#19 | 5.5%(+23.9)#815 |
| 20. | Accomac | 29.2% | 4.1%(+25.1)#20 | 5.5%(+23.7)#823 |
| 21. | Stevens Creek | 28.6% | 4.1%(+24.5)#21 | 5.5%(+23.1)#875 |
| 22. | Callaghan | 27.1% | 4.1%(+22.9)#22 | 5.5%(+21.6)#1,027 |
| 23. | Bastian | 26.5% | 4.1%(+22.4)#23 | 5.5%(+21.0)#1,077 |
| 24. | Sugar Grove | 26.2% | 4.1%(+22.1)#24 | 5.5%(+20.7)#1,110 |
| 25. | Henry Fork | 26.0% | 4.1%(+21.9)#25 | 5.5%(+20.6)#1,129 |
| 26. | Abbs Valley | 26.0% | 4.1%(+21.9)#26 | 5.5%(+20.5)#1,138 |
| 27. | Nathalie | 25.5% | 4.1%(+21.3)#27 | 5.5%(+20.0)#1,203 |
| 28. | Haysi | 25.4% | 4.1%(+21.2)#28 | 5.5%(+19.9)#1,215 |
| 29. | Mallow | 25.3% | 4.1%(+21.2)#29 | 5.5%(+19.8)#1,222 |
| 30. | Draper | 25.2% | 4.1%(+21.1)#30 | 5.5%(+19.7)#1,232 |
| 31. | Wintergreen | 25.2% | 4.1%(+21.1)#31 | 5.5%(+19.7)#1,234 |
| 32. | Bull Run Mountain Estates | 25.1% | 4.1%(+21.0)#32 | 5.5%(+19.6)#1,244 |
| 33. | Mount Jackson | 24.8% | 4.1%(+20.7)#33 | 5.5%(+19.4)#1,302 |
| 34. | Crimora | 24.8% | 4.1%(+20.7)#34 | 5.5%(+19.3)#1,310 |
| 35. | Iron Gate | 23.5% | 4.1%(+19.4)#35 | 5.5%(+18.0)#1,509 |
| 36. | Woodlawn Cdp Carroll County | 23.3% | 4.1%(+19.2)#36 | 5.5%(+17.9)#1,525 |
| 37. | Craigsville | 23.3% | 4.1%(+19.2)#37 | 5.5%(+17.9)#1,532 |
| 38. | Laurel Park | 23.3% | 4.1%(+19.2)#38 | 5.5%(+17.8)#1,543 |
| 39. | Capron | 20.7% | 4.1%(+16.6)#39 | 5.5%(+15.2)#2,082 |
| 40. | Makemie Park | 20.7% | 4.1%(+16.5)#40 | 5.5%(+15.2)#2,094 |
| 41. | Moneta | 20.6% | 4.1%(+16.5)#41 | 5.5%(+15.2)#2,099 |
| 42. | Disputanta | 20.3% | 4.1%(+16.2)#42 | 5.5%(+14.9)#2,180 |
| 43. | Plum Creek | 19.7% | 4.1%(+15.6)#43 | 5.5%(+14.3)#2,340 |
| 44. | Allison Gap | 19.1% | 4.1%(+15.0)#44 | 5.5%(+13.7)#2,505 |
| 45. | Scottsburg | 19.0% | 4.1%(+14.9)#45 | 5.5%(+13.5)#2,576 |
| 46. | Edinburg | 18.8% | 4.1%(+14.7)#46 | 5.5%(+13.3)#2,632 |
| 47. | Pocahontas | 18.8% | 4.1%(+14.6)#47 | 5.5%(+13.3)#2,652 |
| 48. | Parksley | 18.6% | 4.1%(+14.5)#48 | 5.5%(+13.2)#2,686 |
| 49. | South Boston | 18.5% | 4.1%(+14.4)#49 | 5.5%(+13.0)#2,735 |
| 50. | Emporia | 18.5% | 4.1%(+14.4)#50 | 5.5%(+13.0)#2,741 |
| 51. | La Crosse | 18.4% | 4.1%(+14.3)#51 | 5.5%(+12.9)#2,775 |
| 52. | Cumberland | 18.3% | 4.1%(+14.2)#52 | 5.5%(+12.8)#2,811 |
| 53. | Middletown | 18.1% | 4.1%(+14.0)#53 | 5.5%(+12.7)#2,883 |
| 54. | Westlake Corner | 17.4% | 4.1%(+13.3)#54 | 5.5%(+12.0)#3,151 |
| 55. | Buchanan | 17.3% | 4.1%(+13.2)#55 | 5.5%(+11.9)#3,197 |
| 56. | Stickleyville | 17.2% | 4.1%(+13.1)#56 | 5.5%(+11.8)#3,237 |
| 57. | Mountain Road | 17.2% | 4.1%(+13.1)#57 | 5.5%(+11.8)#3,245 |
| 58. | Jolivue | 17.2% | 4.1%(+13.1)#58 | 5.5%(+11.7)#3,267 |
| 59. | Keysville | 17.1% | 4.1%(+13.0)#59 | 5.5%(+11.6)#3,321 |
| 60. | Rich Creek | 16.8% | 4.1%(+12.7)#60 | 5.5%(+11.3)#3,456 |
| 61. | Stuarts Draft | 16.8% | 4.1%(+12.6)#61 | 5.5%(+11.3)#3,470 |
| 62. | Toms Brook | 16.7% | 4.1%(+12.6)#62 | 5.5%(+11.2)#3,506 |
| 63. | Glen Lyn | 16.7% | 4.1%(+12.6)#63 | 5.5%(+11.2)#3,522 |
| 64. | Carrsville | 16.4% | 4.1%(+12.3)#64 | 5.5%(+10.9)#3,657 |
| 65. | Mcgaheysville | 16.3% | 4.1%(+12.2)#65 | 5.5%(+10.9)#3,689 |
| 66. | Pembroke | 15.6% | 4.1%(+11.5)#66 | 5.5%(+10.2)#4,048 |
| 67. | Riverdale | 15.6% | 4.1%(+11.5)#67 | 5.5%(+10.1)#4,079 |
| 68. | Branchville | 15.4% | 4.1%(+11.3)#68 | 5.5%(+9.92)#4,174 |
| 69. | Chilhowie | 15.3% | 4.1%(+11.2)#69 | 5.5%(+9.87)#4,209 |
| 70. | Blairs | 15.3% | 4.1%(+11.2)#70 | 5.5%(+9.86)#4,214 |
| 71. | Pastoria | 15.3% | 4.1%(+11.2)#71 | 5.5%(+9.84)#4,226 |
| 72. | Bassett | 15.2% | 4.1%(+11.1)#72 | 5.5%(+9.76)#4,261 |
| 73. | Pulaski | 15.2% | 4.1%(+11.1)#73 | 5.5%(+9.75)#4,264 |
| 74. | Glasgow | 15.0% | 4.1%(+10.9)#74 | 5.5%(+9.57)#4,381 |
| 75. | Amherst | 15.0% | 4.1%(+10.9)#75 | 5.5%(+9.52)#4,421 |
| 76. | Saltville | 15.0% | 4.1%(+10.9)#76 | 5.5%(+9.50)#4,433 |
| 77. | Horse Pasture | 14.9% | 4.1%(+10.8)#77 | 5.5%(+9.44)#4,465 |
| 78. | Luray | 14.4% | 4.1%(+10.3)#78 | 5.5%(+8.98)#4,748 |
| 79. | Schuyler | 14.2% | 4.1%(+10.1)#79 | 5.5%(+8.73)#4,898 |
| 80. | Glade Spring | 13.5% | 4.1%(+9.37)#80 | 5.5%(+8.01)#5,388 |
| 81. | Waverly | 13.4% | 4.1%(+9.30)#81 | 5.5%(+7.94)#5,439 |
| 82. | Patrick Springs | 13.3% | 4.1%(+9.18)#82 | 5.5%(+7.82)#5,534 |
| 83. | Dublin | 13.3% | 4.1%(+9.18)#83 | 5.5%(+7.82)#5,539 |
| 84. | Timberlake | 13.1% | 4.1%(+8.96)#84 | 5.5%(+7.60)#5,706 |
| 85. | Hopewell | 13.0% | 4.1%(+8.91)#85 | 5.5%(+7.55)#5,760 |
| 86. | Hillsville | 13.0% | 4.1%(+8.91)#86 | 5.5%(+7.55)#5,761 |
| 87. | Damascus | 12.9% | 4.1%(+8.74)#87 | 5.5%(+7.38)#5,892 |
| 88. | Pounding Mill | 12.8% | 4.1%(+8.69)#88 | 5.5%(+7.33)#5,938 |
| 89. | Galax | 12.7% | 4.1%(+8.55)#89 | 5.5%(+7.19)#6,042 |
| 90. | Kilmarnock | 12.6% | 4.1%(+8.54)#90 | 5.5%(+7.18)#6,053 |
| 91. | Pearisburg | 12.6% | 4.1%(+8.48)#91 | 5.5%(+7.12)#6,102 |
| 92. | Gratton | 12.5% | 4.1%(+8.39)#92 | 5.5%(+7.03)#6,159 |
| 93. | Duffield | 12.5% | 4.1%(+8.39)#93 | 5.5%(+7.03)#6,203 |
| 94. | Fort Chiswell | 12.4% | 4.1%(+8.24)#94 | 5.5%(+6.88)#6,315 |
| 95. | Danville | 12.2% | 4.1%(+8.10)#95 | 5.5%(+6.74)#6,442 |
| 96. | Camptown | 12.1% | 4.1%(+7.99)#96 | 5.5%(+6.63)#6,524 |
| 97. | Motley | 12.0% | 4.1%(+7.87)#97 | 5.5%(+6.51)#6,653 |
| 98. | Mckenney | 11.9% | 4.1%(+7.81)#98 | 5.5%(+6.45)#6,711 |
| 99. | Camp Barrett | 11.9% | 4.1%(+7.79)#99 | 5.5%(+6.44)#6,720 |
| 100. | Clover | 11.8% | 4.1%(+7.69)#100 | 5.5%(+6.33)#6,827 |
Common Questions
What are the Top 10 Cities with the Highest Percentage of Population Employed in Production in Virginia?
Top 10 Cities with the Highest Percentage of Population Employed in Production in Virginia are:
#1
82.9%
#2
63.2%
#3
49.4%
#4
48.0%
#5
46.7%
#6
42.9%
#7
40.4%
#8
40.0%
#9
35.7%
#10
35.7%
What city has the Highest Percentage of Population Employed in Production in Virginia?
Union Level has the Highest Percentage of Population Employed in Production in Virginia with 82.9%.
What is the Percentage of Population Employed in Production in the State of Virginia?
Percentage of Population Employed in Production in Virginia is 4.1%.
What is the Percentage of Population Employed in Production in the United States?
Percentage of Population Employed in Production in the United States is 5.5%.