Cities with the Highest Percentage of Sudanese Population in Virginia
RELATED REPORTS & OPTIONS
Sudanese
Virginia
Compare Cities
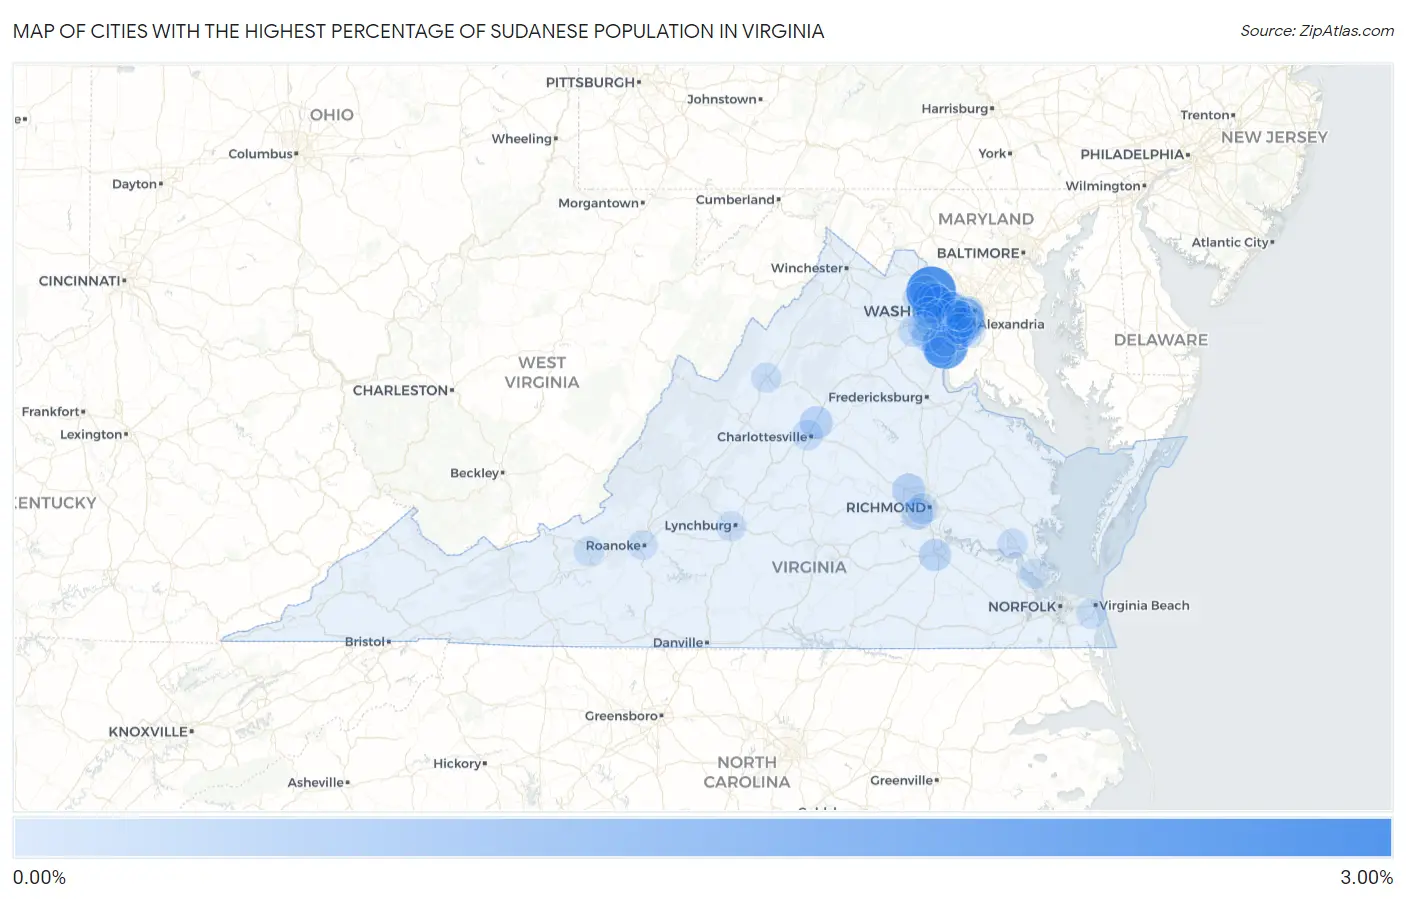
Map of Cities with the Highest Percentage of Sudanese Population in Virginia
0.00%
3.00%
Cities with the Highest Percentage of Sudanese Population in Virginia
| City | Sudanese | vs State | vs National | |
| 1. | Dulles Town Center | 2.63% | 0.060%(+2.57)#1 | 0.022%(+2.61)#12 |
| 2. | Potomac Mills | 2.06% | 0.060%(+2.00)#2 | 0.022%(+2.04)#19 |
| 3. | Mcnair | 1.42% | 0.060%(+1.36)#3 | 0.022%(+1.40)#31 |
| 4. | Bailey S Crossroads | 1.11% | 0.060%(+1.05)#4 | 0.022%(+1.08)#43 |
| 5. | Vienna | 0.93% | 0.060%(+0.873)#5 | 0.022%(+0.911)#50 |
| 6. | Kingstowne | 0.50% | 0.060%(+0.440)#6 | 0.022%(+0.477)#86 |
| 7. | Long Branch | 0.50% | 0.060%(+0.438)#7 | 0.022%(+0.476)#87 |
| 8. | Buckhall | 0.47% | 0.060%(+0.413)#8 | 0.022%(+0.451)#95 |
| 9. | Alexandria | 0.43% | 0.060%(+0.369)#9 | 0.022%(+0.407)#103 |
| 10. | Short Pump | 0.42% | 0.060%(+0.356)#10 | 0.022%(+0.394)#105 |
| 11. | Newington | 0.41% | 0.060%(+0.346)#11 | 0.022%(+0.384)#108 |
| 12. | Hollymead | 0.35% | 0.060%(+0.295)#12 | 0.022%(+0.333)#118 |
| 13. | Herndon | 0.35% | 0.060%(+0.288)#13 | 0.022%(+0.326)#122 |
| 14. | Merrifield | 0.33% | 0.060%(+0.272)#14 | 0.022%(+0.309)#130 |
| 15. | Arlington | 0.31% | 0.060%(+0.252)#15 | 0.022%(+0.289)#143 |
| 16. | Petersburg | 0.29% | 0.060%(+0.232)#16 | 0.022%(+0.270)#148 |
| 17. | Dale City | 0.27% | 0.060%(+0.214)#17 | 0.022%(+0.251)#156 |
| 18. | Manchester | 0.25% | 0.060%(+0.192)#18 | 0.022%(+0.230)#165 |
| 19. | Reston | 0.24% | 0.060%(+0.184)#19 | 0.022%(+0.222)#170 |
| 20. | Brambleton | 0.24% | 0.060%(+0.177)#20 | 0.022%(+0.215)#171 |
| 21. | Ashburn | 0.21% | 0.060%(+0.149)#21 | 0.022%(+0.187)#180 |
| 22. | Tysons | 0.19% | 0.060%(+0.132)#22 | 0.022%(+0.170)#188 |
| 23. | Centreville | 0.19% | 0.060%(+0.132)#23 | 0.022%(+0.169)#189 |
| 24. | Franconia | 0.16% | 0.060%(+0.097)#24 | 0.022%(+0.134)#204 |
| 25. | Linton Hall | 0.14% | 0.060%(+0.083)#25 | 0.022%(+0.121)#213 |
| 26. | Chantilly | 0.14% | 0.060%(+0.083)#26 | 0.022%(+0.121)#214 |
| 27. | Richmond | 0.14% | 0.060%(+0.081)#27 | 0.022%(+0.119)#216 |
| 28. | Montclair | 0.12% | 0.060%(+0.058)#28 | 0.022%(+0.096)#238 |
| 29. | University Of Virginia | 0.10% | 0.060%(+0.044)#29 | 0.022%(+0.082)#252 |
| 30. | Fair Oaks | 0.094% | 0.060%(+0.034)#30 | 0.022%(+0.072)#262 |
| 31. | Springfield | 0.074% | 0.060%(+0.014)#31 | 0.022%(+0.052)#288 |
| 32. | Hybla Valley | 0.066% | 0.060%(+0.007)#32 | 0.022%(+0.044)#301 |
| 33. | Williamsburg | 0.045% | 0.060%(-0.014)#33 | 0.022%(+0.023)#342 |
| 34. | Lake Ridge | 0.038% | 0.060%(-0.022)#34 | 0.022%(+0.016)#363 |
| 35. | Sudley | 0.036% | 0.060%(-0.023)#35 | 0.022%(+0.014)#366 |
| 36. | Harrisonburg | 0.027% | 0.060%(-0.033)#36 | 0.022%(+0.005)#399 |
| 37. | Blacksburg | 0.027% | 0.060%(-0.033)#37 | 0.022%(+0.005)#403 |
| 38. | Lincolnia | 0.025% | 0.060%(-0.034)#38 | 0.022%(+0.003)#412 |
| 39. | Newport News | 0.023% | 0.060%(-0.036)#39 | 0.022%(+0.001)#422 |
| 40. | Lake Barcroft | 0.019% | 0.060%(-0.041)#40 | 0.022%(-0.003)#444 |
| 41. | West Falls Church | 0.016% | 0.060%(-0.044)#41 | 0.022%(-0.006)#456 |
| 42. | Rose Hill Cdp Fairfax County | 0.014% | 0.060%(-0.045)#42 | 0.022%(-0.008)#468 |
| 43. | Roanoke | 0.013% | 0.060%(-0.047)#43 | 0.022%(-0.009)#475 |
| 44. | Lynchburg | 0.011% | 0.060%(-0.048)#44 | 0.022%(-0.011)#485 |
| 45. | Virginia Beach | 0.0048% | 0.060%(-0.055)#45 | 0.022%(-0.017)#526 |
Common Questions
What are the Top 10 Cities with the Highest Percentage of Sudanese Population in Virginia?
Top 10 Cities with the Highest Percentage of Sudanese Population in Virginia are:
#1
2.63%
#2
2.06%
#3
1.42%
#4
1.11%
#5
0.93%
#6
0.50%
#7
0.50%
#8
0.47%
#9
0.43%
#10
0.42%
What city has the Highest Percentage of Sudanese Population in Virginia?
Dulles Town Center has the Highest Percentage of Sudanese Population in Virginia with 2.63%.
What is the Percentage of Sudanese Population in the State of Virginia?
Percentage of Sudanese Population in Virginia is 0.060%.
What is the Percentage of Sudanese Population in the United States?
Percentage of Sudanese Population in the United States is 0.022%.