Zip Codes with the Highest Percentage of Population Employed in Architecture & Engineering in Suffolk, VA
RELATED REPORTS & OPTIONS
Architecture & Engineering
Suffolk
Compare Zip Codes
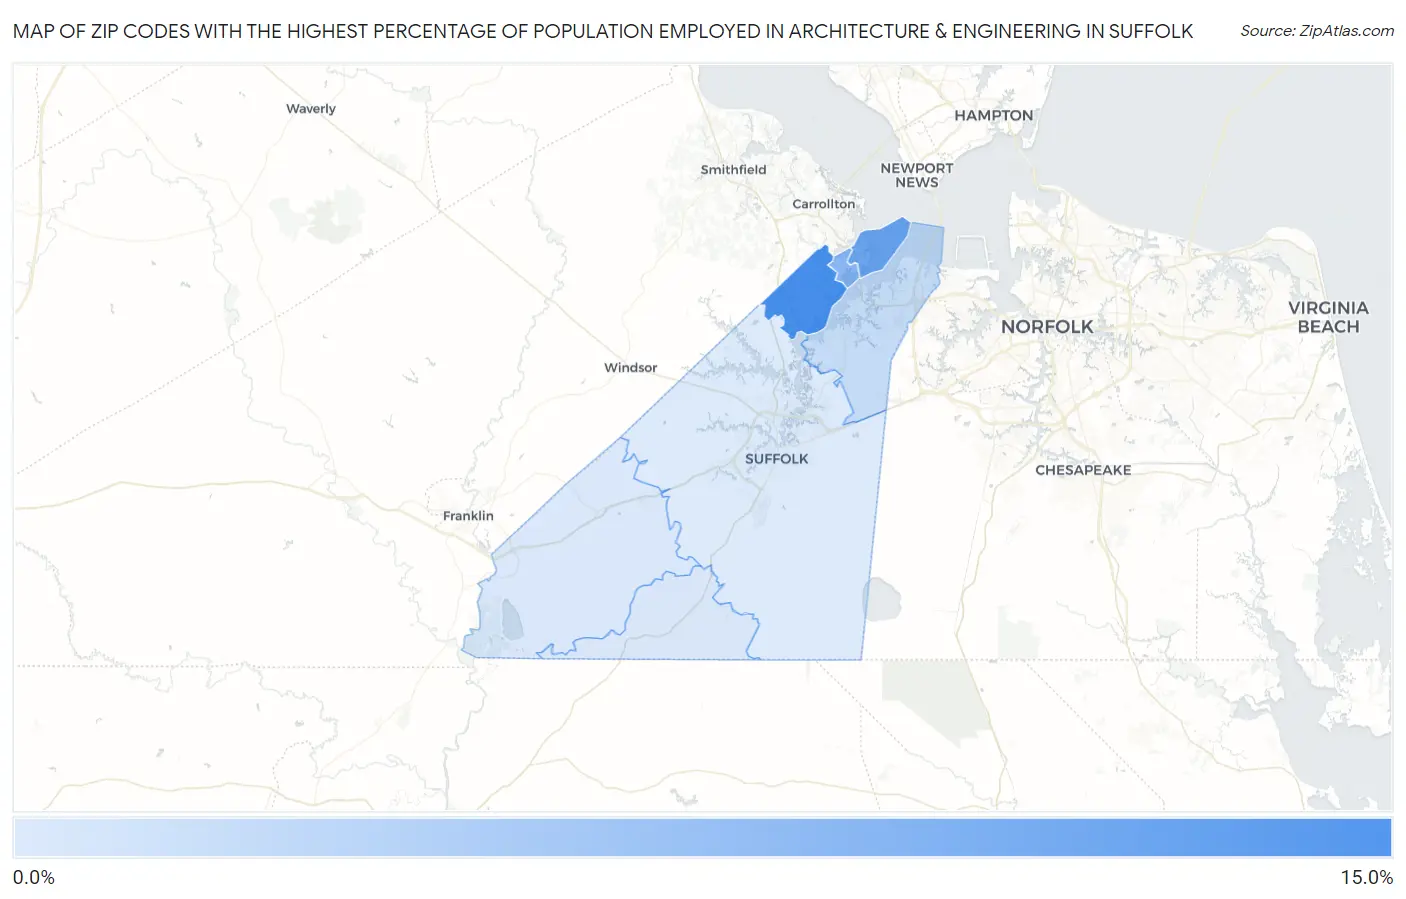
Map of Zip Codes with the Highest Percentage of Population Employed in Architecture & Engineering in Suffolk
3.1%
10.2%
Zip Codes with the Highest Percentage of Population Employed in Architecture & Engineering in Suffolk, VA
| Zip Code | % Employed | vs State | vs National | |
| 1. | 23432 | 10.2% | 2.3%(+7.93)#14 | 2.1%(+8.08)#330 |
| 2. | 23433 | 8.4% | 2.3%(+6.08)#19 | 2.1%(+6.23)#505 |
| 3. | 23436 | 7.0% | 2.3%(+4.68)#26 | 2.1%(+4.84)#754 |
| 4. | 23435 | 4.1% | 2.3%(+1.79)#82 | 2.1%(+1.95)#2,619 |
| 5. | 23438 | 3.3% | 2.3%(+0.963)#134 | 2.1%(+1.12)#4,278 |
| 6. | 23437 | 3.2% | 2.3%(+0.924)#137 | 2.1%(+1.08)#4,385 |
| 7. | 23434 | 3.1% | 2.3%(+0.771)#143 | 2.1%(+0.927)#4,801 |
1
Common Questions
What are the Top 5 Zip Codes with the Highest Percentage of Population Employed in Architecture & Engineering in Suffolk, VA?
Top 5 Zip Codes with the Highest Percentage of Population Employed in Architecture & Engineering in Suffolk, VA are:
What zip code has the Highest Percentage of Population Employed in Architecture & Engineering in Suffolk, VA?
23432 has the Highest Percentage of Population Employed in Architecture & Engineering in Suffolk, VA with 10.2%.
What is the Percentage of Population Employed in Architecture & Engineering in Suffolk, VA?
Percentage of Population Employed in Architecture & Engineering in Suffolk is 3.7%.
What is the Percentage of Population Employed in Architecture & Engineering in Virginia?
Percentage of Population Employed in Architecture & Engineering in Virginia is 2.3%.
What is the Percentage of Population Employed in Architecture & Engineering in the United States?
Percentage of Population Employed in Architecture & Engineering in the United States is 2.1%.