Falmouth, VA Map & Demographics
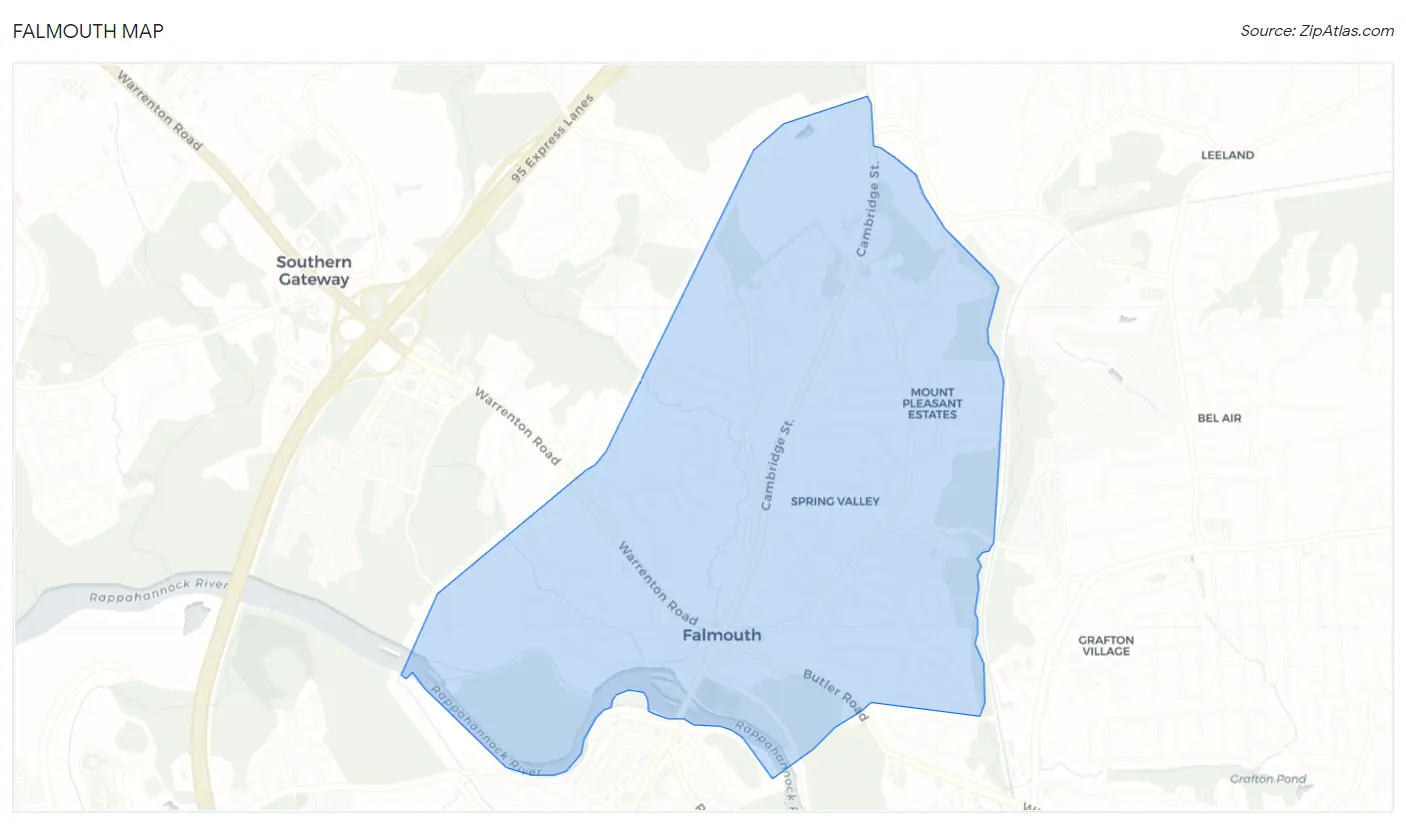
Falmouth Map
Falmouth Overview
$57,406
PER CAPITA INCOME
$153,884
AVG FAMILY INCOME
$121,463
AVG HOUSEHOLD INCOME
48.6%
WAGE / INCOME GAP [ % ]
51.4¢/ $1
WAGE / INCOME GAP [ $ ]
0.38
INEQUALITY / GINI INDEX
4,689
TOTAL POPULATION
2,433
MALE POPULATION
2,256
FEMALE POPULATION
107.85
MALES / 100 FEMALES
92.73
FEMALES / 100 MALES
40.9
MEDIAN AGE
3.1
AVG FAMILY SIZE
2.4
AVG HOUSEHOLD SIZE
2,512
LABOR FORCE [ PEOPLE ]
67.9%
PERCENT IN LABOR FORCE
7.2%
UNEMPLOYMENT RATE
Falmouth Area Codes
Income in Falmouth
Income Overview in Falmouth
Per Capita Income in Falmouth is $57,406, while median incomes of families and households are $153,884 and $121,463 respectively.
| Characteristic | Number | Measure |
| Per Capita Income | 4,689 | $57,406 |
| Median Family Income | 1,177 | $153,884 |
| Mean Family Income | 1,177 | $171,418 |
| Median Household Income | 1,933 | $121,463 |
| Mean Household Income | 1,933 | $139,823 |
| Income Deficit | 1,177 | $0 |
| Wage / Income Gap (%) | 4,689 | 48.56% |
| Wage / Income Gap ($) | 4,689 | 51.44¢ per $1 |
| Gini / Inequality Index | 4,689 | 0.38 |
Earnings by Sex in Falmouth
Average Earnings in Falmouth are $53,661, $82,460 for men and $42,418 for women, a difference of 48.6%.
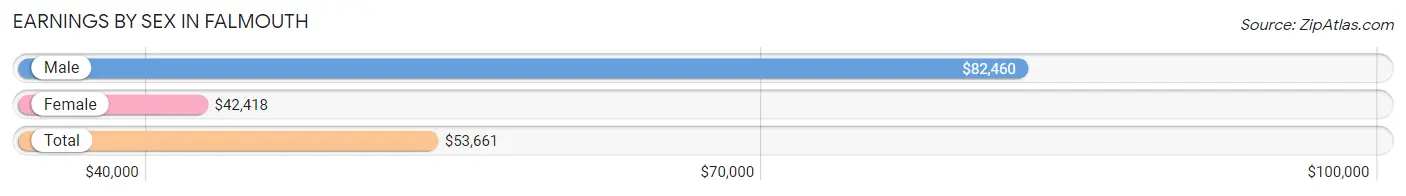
| Sex | Number | Average Earnings |
| Male | 1,345 (52.0%) | $82,460 |
| Female | 1,243 (48.0%) | $42,418 |
| Total | 2,588 (100.0%) | $53,661 |
Earnings by Sex by Income Bracket in Falmouth
The most common earnings brackets in Falmouth are $100,000+ for men (654 | 48.6%) and $100,000+ for women (346 | 27.8%).
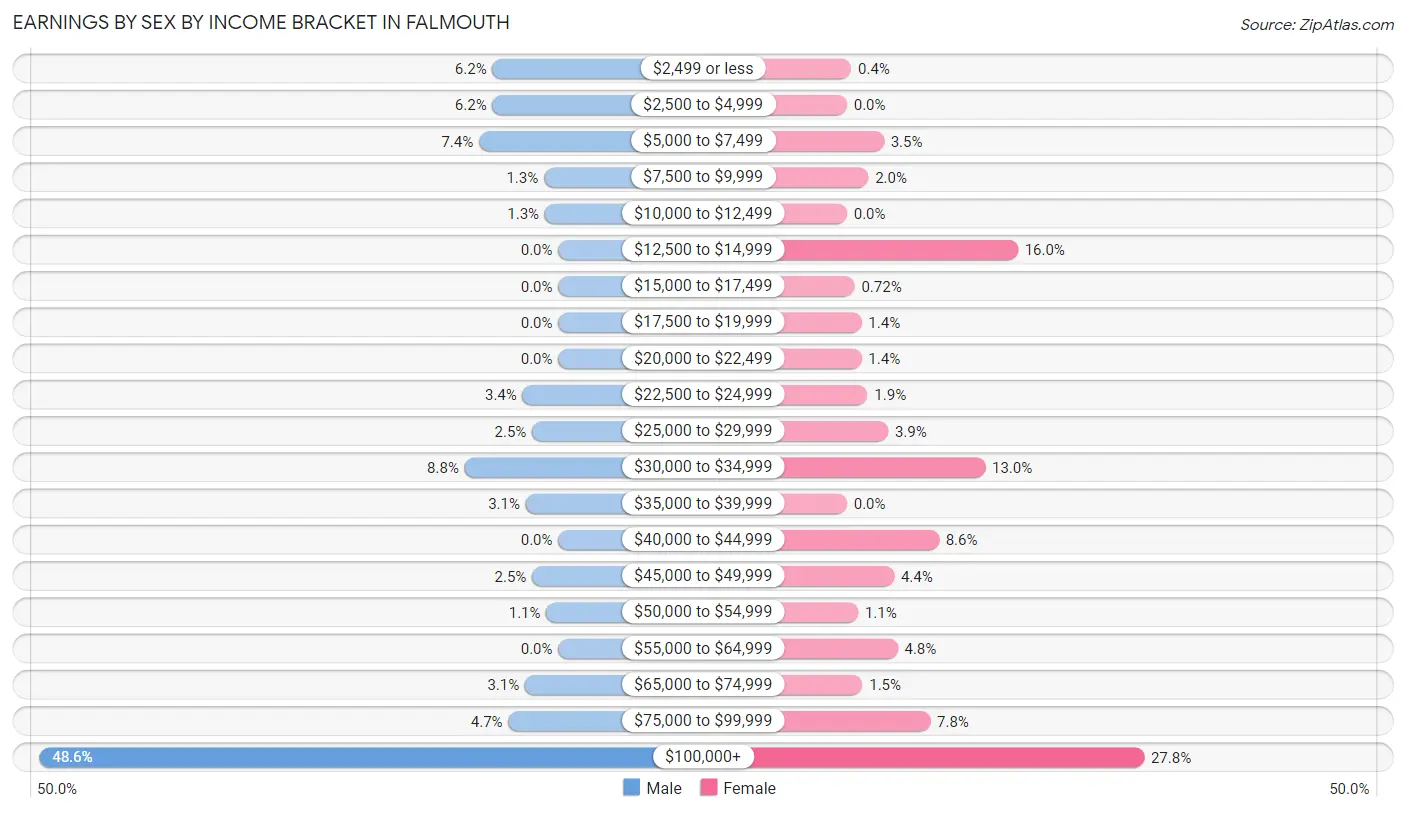
| Income | Male | Female |
| $2,499 or less | 83 (6.2%) | 5 (0.4%) |
| $2,500 to $4,999 | 83 (6.2%) | 0 (0.0%) |
| $5,000 to $7,499 | 100 (7.4%) | 43 (3.5%) |
| $7,500 to $9,999 | 18 (1.3%) | 25 (2.0%) |
| $10,000 to $12,499 | 17 (1.3%) | 0 (0.0%) |
| $12,500 to $14,999 | 0 (0.0%) | 199 (16.0%) |
| $15,000 to $17,499 | 0 (0.0%) | 9 (0.7%) |
| $17,500 to $19,999 | 0 (0.0%) | 17 (1.4%) |
| $20,000 to $22,499 | 0 (0.0%) | 17 (1.4%) |
| $22,500 to $24,999 | 45 (3.4%) | 24 (1.9%) |
| $25,000 to $29,999 | 33 (2.5%) | 48 (3.9%) |
| $30,000 to $34,999 | 118 (8.8%) | 161 (13.0%) |
| $35,000 to $39,999 | 41 (3.0%) | 0 (0.0%) |
| $40,000 to $44,999 | 0 (0.0%) | 107 (8.6%) |
| $45,000 to $49,999 | 33 (2.5%) | 55 (4.4%) |
| $50,000 to $54,999 | 15 (1.1%) | 13 (1.1%) |
| $55,000 to $64,999 | 0 (0.0%) | 59 (4.8%) |
| $65,000 to $74,999 | 42 (3.1%) | 18 (1.5%) |
| $75,000 to $99,999 | 63 (4.7%) | 97 (7.8%) |
| $100,000+ | 654 (48.6%) | 346 (27.8%) |
| Total | 1,345 (100.0%) | 1,243 (100.0%) |
Earnings by Sex by Educational Attainment in Falmouth
Average earnings in Falmouth are $108,068 for men and $45,864 for women, a difference of 57.6%. Men with an educational attainment of bachelor's degree enjoy the highest average annual earnings of $145,667, while those with college or associate's degree education earn the least with $98,194. Women with an educational attainment of graduate degree earn the most with the average annual earnings of $111,197, while those with high school diploma education have the smallest earnings of $33,265.
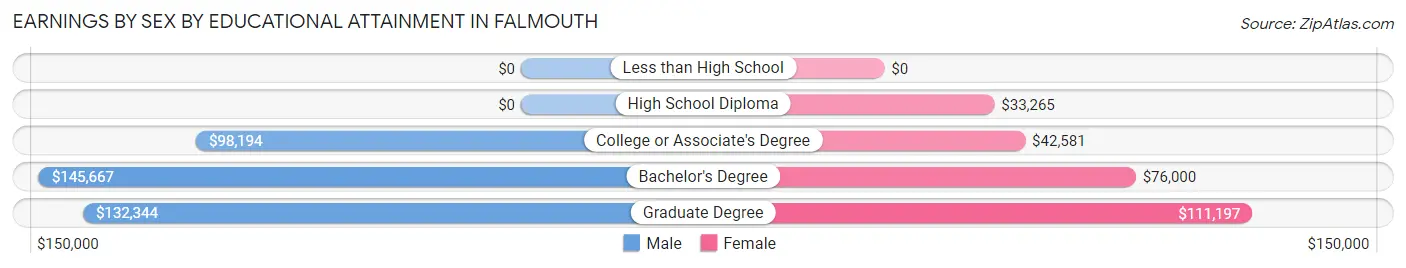
| Educational Attainment | Male Income | Female Income |
| Less than High School | - | - |
| High School Diploma | - | - |
| College or Associate's Degree | $98,194 | $42,581 |
| Bachelor's Degree | $145,667 | $76,000 |
| Graduate Degree | $132,344 | $111,197 |
| Total | $108,068 | $45,864 |
Family Income in Falmouth
Family Income Brackets in Falmouth
According to the Falmouth family income data, there are 355 families falling into the $200,000+ income range, which is the most common income bracket and makes up 30.2% of all families.
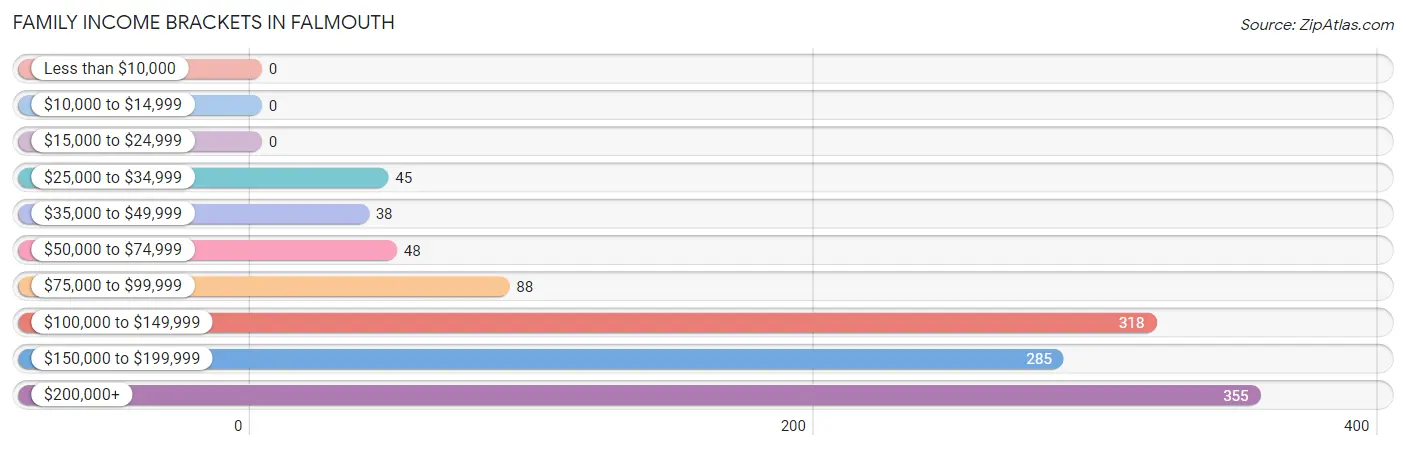
| Income Bracket | # Families | % Families |
| Less than $10,000 | 0 | 0.0% |
| $10,000 to $14,999 | 0 | 0.0% |
| $15,000 to $24,999 | 0 | 0.0% |
| $25,000 to $34,999 | 45 | 3.8% |
| $35,000 to $49,999 | 38 | 3.2% |
| $50,000 to $74,999 | 48 | 4.1% |
| $75,000 to $99,999 | 88 | 7.5% |
| $100,000 to $149,999 | 318 | 27.0% |
| $150,000 to $199,999 | 285 | 24.2% |
| $200,000+ | 355 | 30.2% |
Family Income by Famaliy Size in Falmouth
5-person families (112 | 9.5%) account for the highest median family income in Falmouth with $250,001 per family, while 2-person families (498 | 42.3%) have the highest median income of $76,949 per family member.
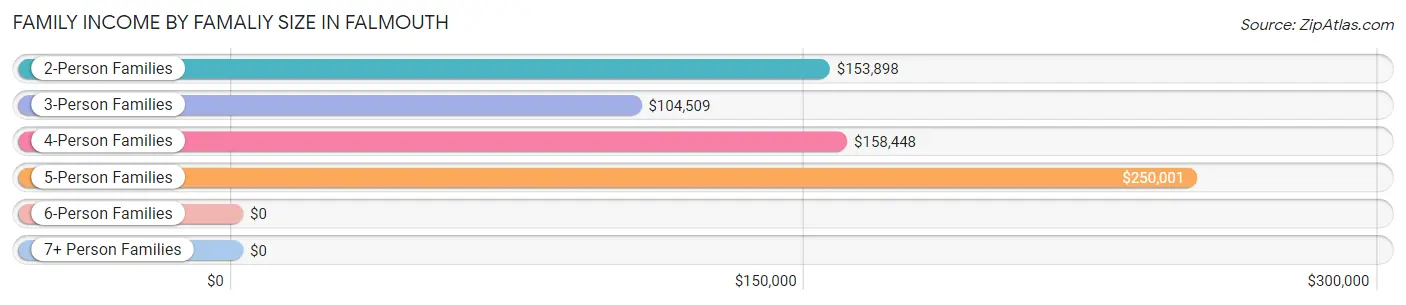
| Income Bracket | # Families | Median Income |
| 2-Person Families | 498 (42.3%) | $153,898 |
| 3-Person Families | 324 (27.5%) | $104,509 |
| 4-Person Families | 176 (14.9%) | $158,448 |
| 5-Person Families | 112 (9.5%) | $250,001 |
| 6-Person Families | 11 (0.9%) | $0 |
| 7+ Person Families | 56 (4.8%) | $0 |
| Total | 1,177 (100.0%) | $153,884 |
Family Income by Number of Earners in Falmouth
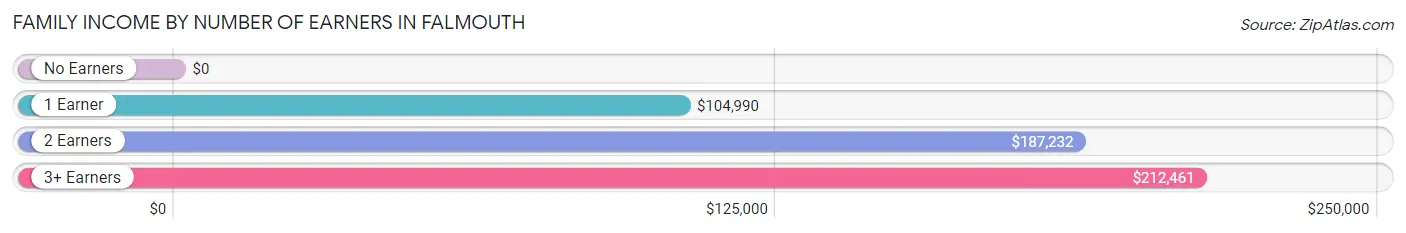
| Number of Earners | # Families | Median Income |
| No Earners | 203 (17.2%) | $0 |
| 1 Earner | 465 (39.5%) | $104,990 |
| 2 Earners | 322 (27.4%) | $187,232 |
| 3+ Earners | 187 (15.9%) | $212,461 |
| Total | 1,177 (100.0%) | $153,884 |
Household Income in Falmouth
Household Income Brackets in Falmouth
With 472 households falling in the category, the $200,000+ income range is the most frequent in Falmouth, accounting for 24.4% of all households. In contrast, only 25 households (1.3%) fall into the $15,000 to $24,999 income bracket, making it the least populous group.
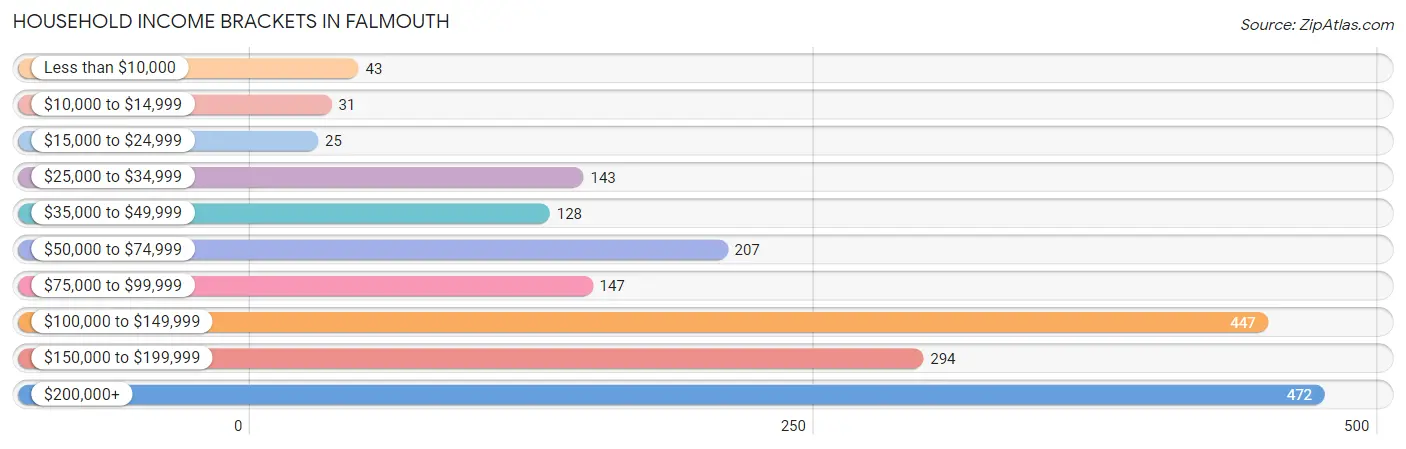
| Income Bracket | # Households | % Households |
| Less than $10,000 | 43 | 2.2% |
| $10,000 to $14,999 | 31 | 1.6% |
| $15,000 to $24,999 | 25 | 1.3% |
| $25,000 to $34,999 | 143 | 7.4% |
| $35,000 to $49,999 | 128 | 6.6% |
| $50,000 to $74,999 | 207 | 10.7% |
| $75,000 to $99,999 | 147 | 7.6% |
| $100,000 to $149,999 | 447 | 23.1% |
| $150,000 to $199,999 | 294 | 15.2% |
| $200,000+ | 472 | 24.4% |
Household Income by Householder Age in Falmouth
The median household income in Falmouth is $121,463, with the highest median household income of $142,457 found in the 25 to 44 years age bracket for the primary householder. A total of 691 households (35.7%) fall into this category.
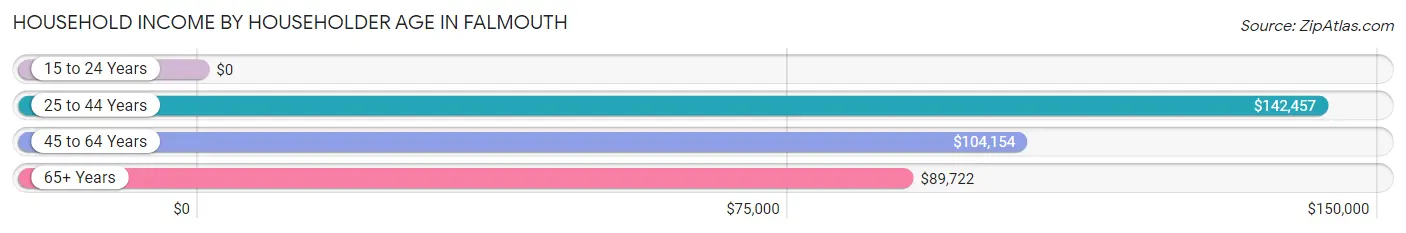
| Income Bracket | # Households | Median Income |
| 15 to 24 Years | 0 (0.0%) | $0 |
| 25 to 44 Years | 691 (35.7%) | $142,457 |
| 45 to 64 Years | 786 (40.7%) | $104,154 |
| 65+ Years | 456 (23.6%) | $89,722 |
| Total | 1,933 (100.0%) | $121,463 |
Poverty in Falmouth
Income Below Poverty by Sex and Age in Falmouth
With 3.4% poverty level for males and 4.3% for females among the residents of Falmouth, 45 to 54 year old males and 18 to 24 year old females are the most vulnerable to poverty, with 83 males (40.3%) and 25 females (21.4%) in their respective age groups living below the poverty level.
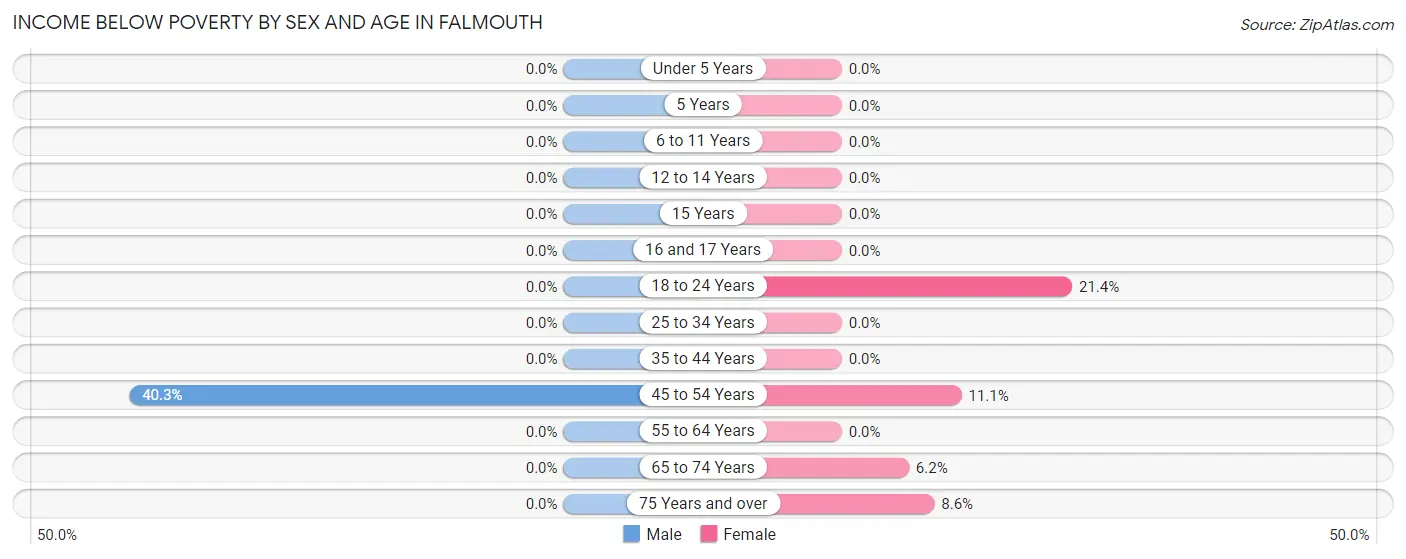
| Age Bracket | Male | Female |
| Under 5 Years | 0 (0.0%) | 0 (0.0%) |
| 5 Years | 0 (0.0%) | 0 (0.0%) |
| 6 to 11 Years | 0 (0.0%) | 0 (0.0%) |
| 12 to 14 Years | 0 (0.0%) | 0 (0.0%) |
| 15 Years | 0 (0.0%) | 0 (0.0%) |
| 16 and 17 Years | 0 (0.0%) | 0 (0.0%) |
| 18 to 24 Years | 0 (0.0%) | 25 (21.4%) |
| 25 to 34 Years | 0 (0.0%) | 0 (0.0%) |
| 35 to 44 Years | 0 (0.0%) | 0 (0.0%) |
| 45 to 54 Years | 83 (40.3%) | 42 (11.1%) |
| 55 to 64 Years | 0 (0.0%) | 0 (0.0%) |
| 65 to 74 Years | 0 (0.0%) | 16 (6.2%) |
| 75 Years and over | 0 (0.0%) | 14 (8.6%) |
| Total | 83 (3.4%) | 97 (4.3%) |
Income Above Poverty by Sex and Age in Falmouth
According to the poverty statistics in Falmouth, males aged under 5 years and females aged under 5 years are the age groups that are most secure financially, with 100.0% of males and 100.0% of females in these age groups living above the poverty line.
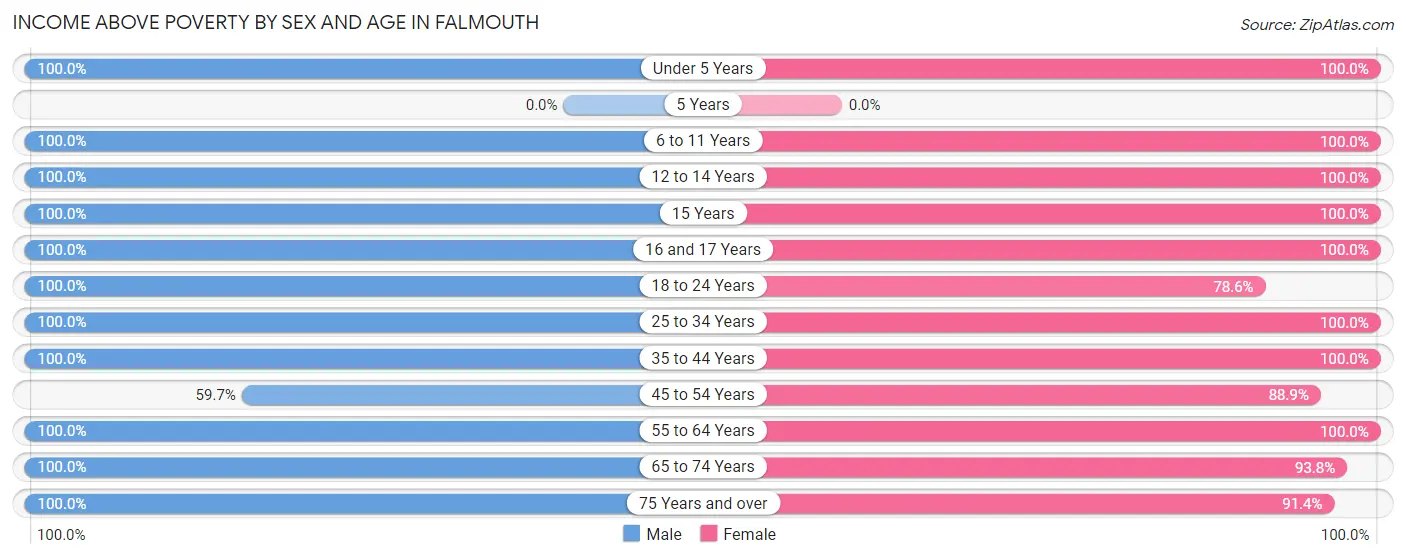
| Age Bracket | Male | Female |
| Under 5 Years | 38 (100.0%) | 124 (100.0%) |
| 5 Years | 0 (0.0%) | 0 (0.0%) |
| 6 to 11 Years | 277 (100.0%) | 140 (100.0%) |
| 12 to 14 Years | 113 (100.0%) | 29 (100.0%) |
| 15 Years | 162 (100.0%) | 107 (100.0%) |
| 16 and 17 Years | 16 (100.0%) | 7 (100.0%) |
| 18 to 24 Years | 238 (100.0%) | 92 (78.6%) |
| 25 to 34 Years | 202 (100.0%) | 459 (100.0%) |
| 35 to 44 Years | 411 (100.0%) | 313 (100.0%) |
| 45 to 54 Years | 123 (59.7%) | 336 (88.9%) |
| 55 to 64 Years | 449 (100.0%) | 162 (100.0%) |
| 65 to 74 Years | 162 (100.0%) | 241 (93.8%) |
| 75 Years and over | 159 (100.0%) | 149 (91.4%) |
| Total | 2,350 (96.6%) | 2,159 (95.7%) |
Income Below Poverty Among Married-Couple Families in Falmouth
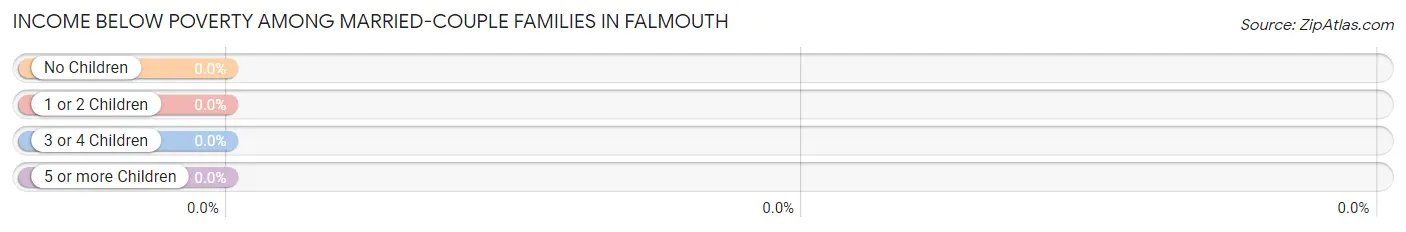
| Children | Above Poverty | Below Poverty |
| No Children | 311 (100.0%) | 0 (0.0%) |
| 1 or 2 Children | 494 (100.0%) | 0 (0.0%) |
| 3 or 4 Children | 40 (100.0%) | 0 (0.0%) |
| 5 or more Children | 0 (0.0%) | 0 (0.0%) |
| Total | 845 (100.0%) | 0 (0.0%) |
Income Below Poverty Among Single-Parent Households in Falmouth
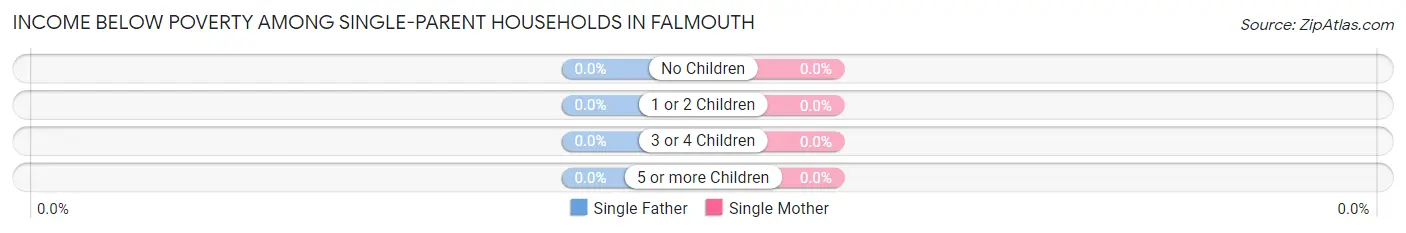
| Children | Single Father | Single Mother |
| No Children | 0 (0.0%) | 0 (0.0%) |
| 1 or 2 Children | 0 (0.0%) | 0 (0.0%) |
| 3 or 4 Children | 0 (0.0%) | 0 (0.0%) |
| 5 or more Children | 0 (0.0%) | 0 (0.0%) |
| Total | 0 (0.0%) | 0 (0.0%) |
Income Below Poverty Among Married-Couple vs Single-Parent Households in Falmouth
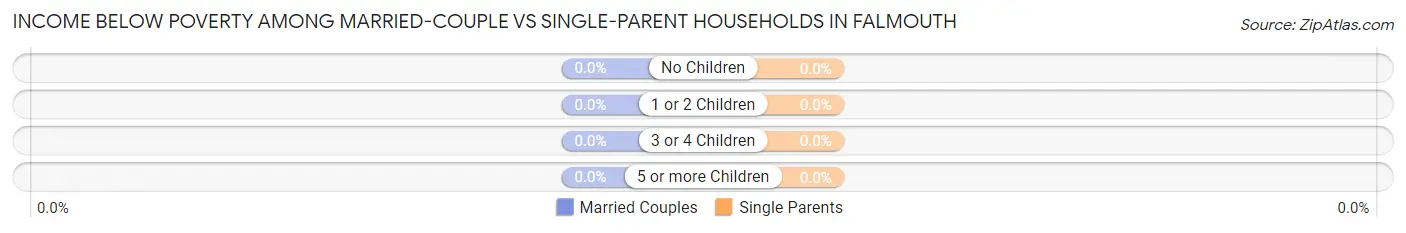
| Children | Married-Couple Families | Single-Parent Households |
| No Children | 0 (0.0%) | 0 (0.0%) |
| 1 or 2 Children | 0 (0.0%) | 0 (0.0%) |
| 3 or 4 Children | 0 (0.0%) | 0 (0.0%) |
| 5 or more Children | 0 (0.0%) | 0 (0.0%) |
| Total | 0 (0.0%) | 0 (0.0%) |
Race in Falmouth
The most populous races in Falmouth are White / Caucasian (2,759 | 58.8%), Black / African American (1,271 | 27.1%), and Hispanic or Latino (505 | 10.8%).
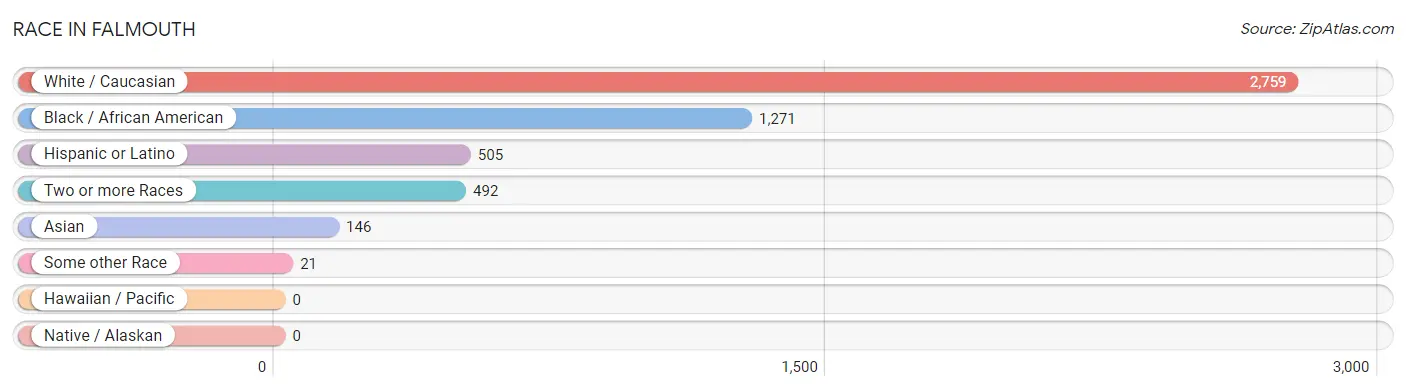
| Race | # Population | % Population |
| Asian | 146 | 3.1% |
| Black / African American | 1,271 | 27.1% |
| Hawaiian / Pacific | 0 | 0.0% |
| Hispanic or Latino | 505 | 10.8% |
| Native / Alaskan | 0 | 0.0% |
| White / Caucasian | 2,759 | 58.8% |
| Two or more Races | 492 | 10.5% |
| Some other Race | 21 | 0.4% |
| Total | 4,689 | 100.0% |
Ancestry in Falmouth
The most populous ancestries reported in Falmouth are German (642 | 13.7%), English (452 | 9.6%), Irish (365 | 7.8%), Subsaharan African (358 | 7.6%), and American (350 | 7.5%), together accounting for 46.2% of all Falmouth residents.
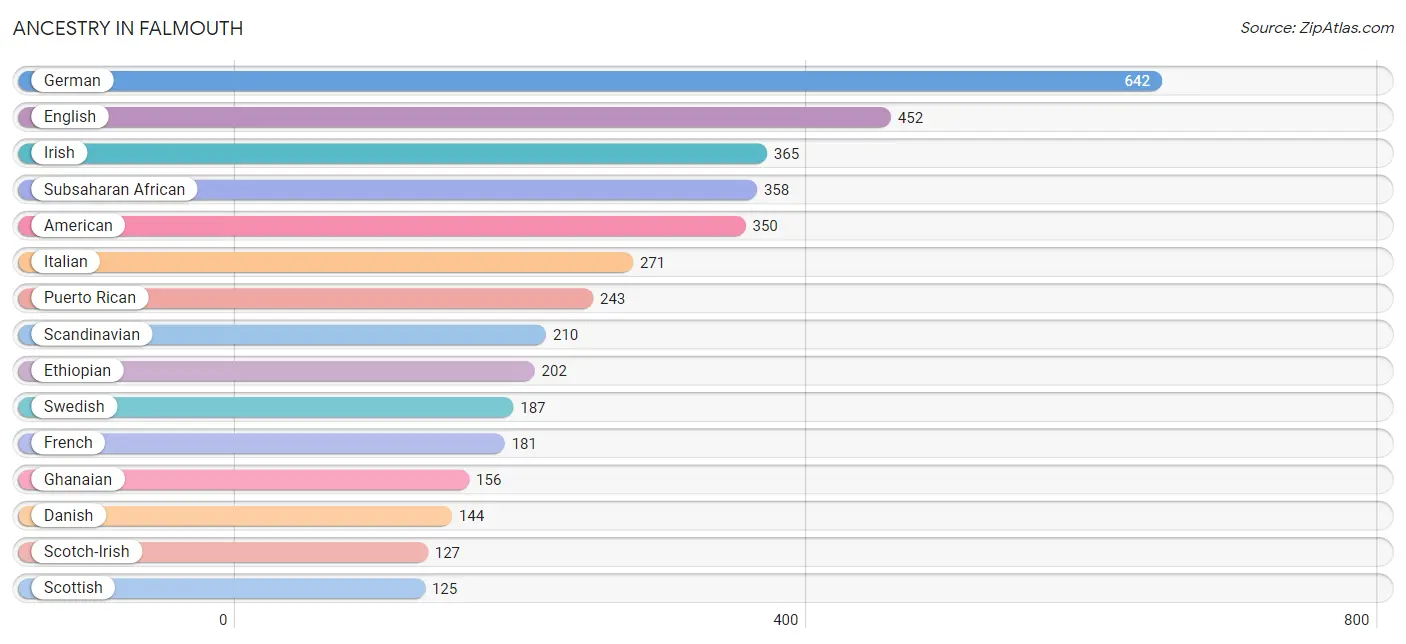
| Ancestry | # Population | % Population |
| American | 350 | 7.5% |
| Bhutanese | 25 | 0.5% |
| British | 76 | 1.6% |
| Burmese | 64 | 1.4% |
| Canadian | 8 | 0.2% |
| Czech | 7 | 0.2% |
| Danish | 144 | 3.1% |
| Dutch | 9 | 0.2% |
| Eastern European | 15 | 0.3% |
| English | 452 | 9.6% |
| Ethiopian | 202 | 4.3% |
| European | 123 | 2.6% |
| Finnish | 15 | 0.3% |
| French | 181 | 3.9% |
| French Canadian | 13 | 0.3% |
| German | 642 | 13.7% |
| Ghanaian | 156 | 3.3% |
| Guyanese | 54 | 1.1% |
| Hungarian | 15 | 0.3% |
| Irish | 365 | 7.8% |
| Italian | 271 | 5.8% |
| Jamaican | 19 | 0.4% |
| Korean | 25 | 0.5% |
| Malaysian | 57 | 1.2% |
| Mexican | 112 | 2.4% |
| Polish | 32 | 0.7% |
| Portuguese | 14 | 0.3% |
| Puerto Rican | 243 | 5.2% |
| Romanian | 28 | 0.6% |
| Scandinavian | 210 | 4.5% |
| Scotch-Irish | 127 | 2.7% |
| Scottish | 125 | 2.7% |
| Slovak | 26 | 0.5% |
| South American | 116 | 2.5% |
| Subsaharan African | 358 | 7.6% |
| Swedish | 187 | 4.0% |
| Swiss | 14 | 0.3% |
| Thai | 92 | 2.0% |
| Venezuelan | 116 | 2.5% |
| Welsh | 19 | 0.4% | View All 40 Rows |
Immigrants in Falmouth
The most numerous immigrant groups reported in Falmouth came from Africa (299 | 6.4%), Latin America (163 | 3.5%), Ghana (156 | 3.3%), Western Africa (156 | 3.3%), and Eastern Africa (143 | 3.0%), together accounting for 19.6% of all Falmouth residents.
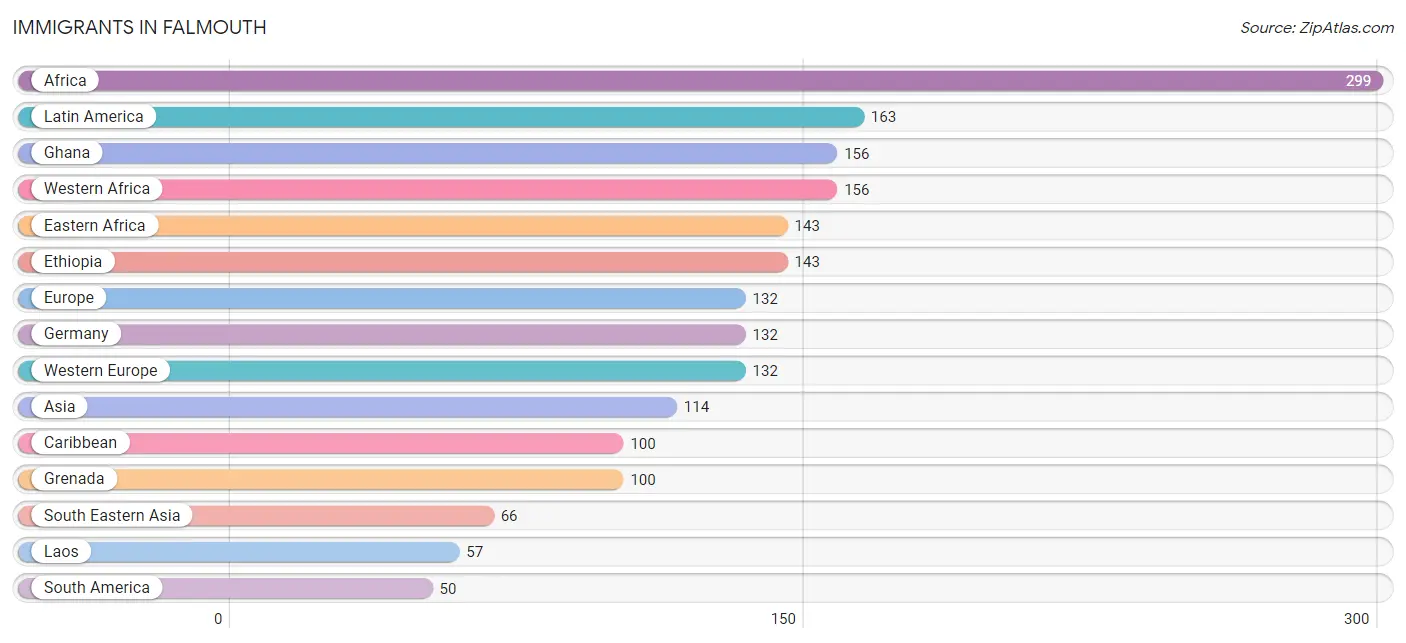
| Immigration Origin | # Population | % Population |
| Africa | 299 | 6.4% |
| Asia | 114 | 2.4% |
| Caribbean | 100 | 2.1% |
| Central America | 13 | 0.3% |
| Costa Rica | 13 | 0.3% |
| Eastern Africa | 143 | 3.0% |
| Eastern Asia | 25 | 0.5% |
| Ethiopia | 143 | 3.0% |
| Europe | 132 | 2.8% |
| Germany | 132 | 2.8% |
| Ghana | 156 | 3.3% |
| Grenada | 100 | 2.1% |
| Guyana | 29 | 0.6% |
| India | 23 | 0.5% |
| Japan | 25 | 0.5% |
| Laos | 57 | 1.2% |
| Latin America | 163 | 3.5% |
| Peru | 21 | 0.4% |
| Philippines | 9 | 0.2% |
| South America | 50 | 1.1% |
| South Central Asia | 23 | 0.5% |
| South Eastern Asia | 66 | 1.4% |
| Western Africa | 156 | 3.3% |
| Western Europe | 132 | 2.8% | View All 24 Rows |
Sex and Age in Falmouth
Sex and Age in Falmouth
The most populous age groups in Falmouth are 40 to 44 Years (350 | 14.4%) for men and 30 to 34 Years (351 | 15.6%) for women.
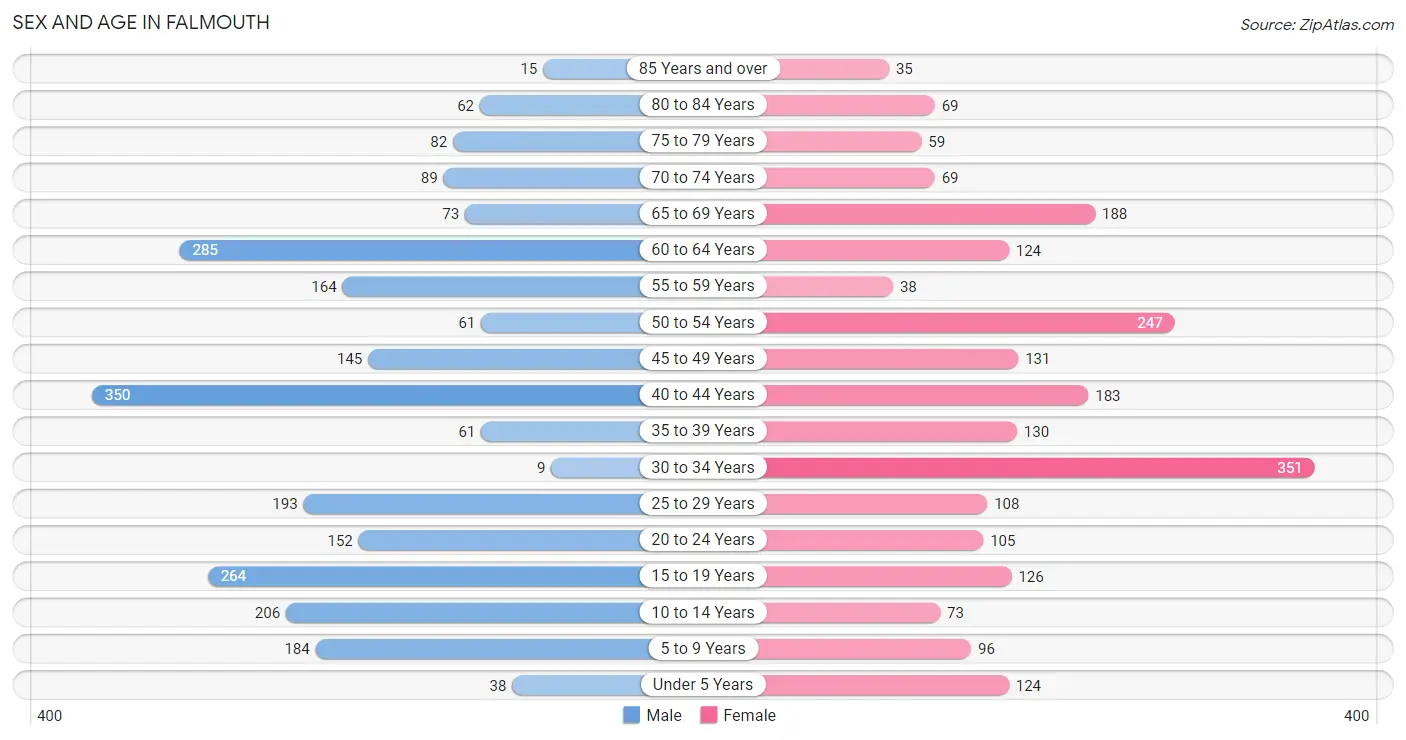
| Age Bracket | Male | Female |
| Under 5 Years | 38 (1.6%) | 124 (5.5%) |
| 5 to 9 Years | 184 (7.6%) | 96 (4.3%) |
| 10 to 14 Years | 206 (8.5%) | 73 (3.2%) |
| 15 to 19 Years | 264 (10.8%) | 126 (5.6%) |
| 20 to 24 Years | 152 (6.2%) | 105 (4.6%) |
| 25 to 29 Years | 193 (7.9%) | 108 (4.8%) |
| 30 to 34 Years | 9 (0.4%) | 351 (15.6%) |
| 35 to 39 Years | 61 (2.5%) | 130 (5.8%) |
| 40 to 44 Years | 350 (14.4%) | 183 (8.1%) |
| 45 to 49 Years | 145 (6.0%) | 131 (5.8%) |
| 50 to 54 Years | 61 (2.5%) | 247 (11.0%) |
| 55 to 59 Years | 164 (6.7%) | 38 (1.7%) |
| 60 to 64 Years | 285 (11.7%) | 124 (5.5%) |
| 65 to 69 Years | 73 (3.0%) | 188 (8.3%) |
| 70 to 74 Years | 89 (3.7%) | 69 (3.1%) |
| 75 to 79 Years | 82 (3.4%) | 59 (2.6%) |
| 80 to 84 Years | 62 (2.5%) | 69 (3.1%) |
| 85 Years and over | 15 (0.6%) | 35 (1.5%) |
| Total | 2,433 (100.0%) | 2,256 (100.0%) |
Families and Households in Falmouth
Median Family Size in Falmouth
The median family size in Falmouth is 3.10 persons per family, with married-couple families (845 | 71.8%) accounting for the largest median family size of 3.33 persons per family. On the other hand, single male/father families (141 | 12.0%) represent the smallest median family size with 1.96 persons per family.
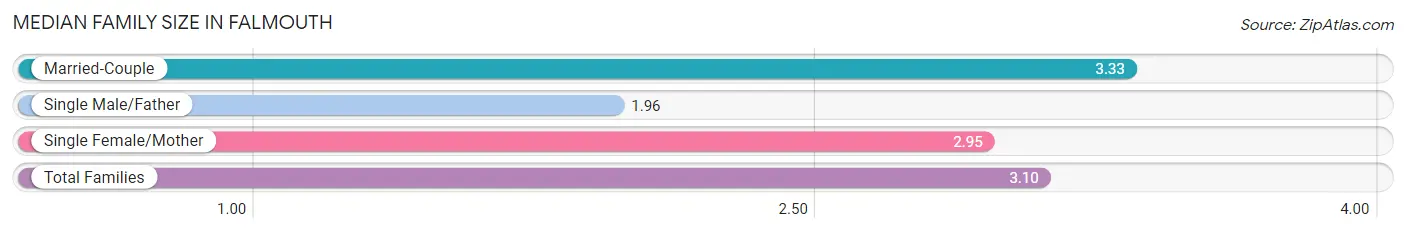
| Family Type | # Families | Family Size |
| Married-Couple | 845 (71.8%) | 3.33 |
| Single Male/Father | 141 (12.0%) | 1.96 |
| Single Female/Mother | 191 (16.2%) | 2.95 |
| Total Families | 1,177 (100.0%) | 3.10 |
Median Household Size in Falmouth
The median household size in Falmouth is 2.43 persons per household, with married-couple households (845 | 43.7%) accounting for the largest median household size of 3.33 persons per household. non-family households (756 | 39.1%) represent the smallest median household size with 1.35 persons per household.
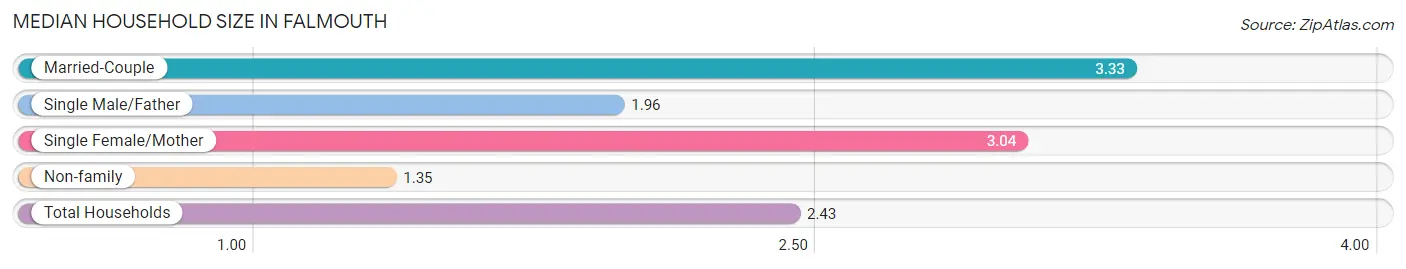
| Household Type | # Households | Household Size |
| Married-Couple | 845 (43.7%) | 3.33 |
| Single Male/Father | 141 (7.3%) | 1.96 |
| Single Female/Mother | 191 (9.9%) | 3.04 |
| Non-family | 756 (39.1%) | 1.35 |
| Total Households | 1,933 (100.0%) | 2.43 |
Household Size by Marriage Status in Falmouth
Out of a total of 1,933 households in Falmouth, 1,177 (60.9%) are family households, while 756 (39.1%) are nonfamily households. The most numerous type of family households are 2-person households, comprising 485, and the most common type of nonfamily households are 1-person households, comprising 548.
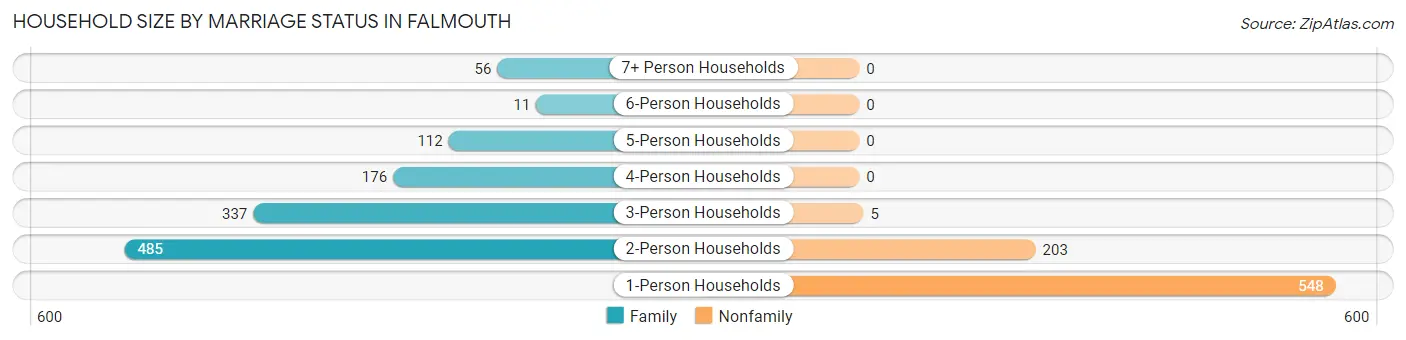
| Household Size | Family Households | Nonfamily Households |
| 1-Person Households | - | 548 (28.3%) |
| 2-Person Households | 485 (25.1%) | 203 (10.5%) |
| 3-Person Households | 337 (17.4%) | 5 (0.3%) |
| 4-Person Households | 176 (9.1%) | 0 (0.0%) |
| 5-Person Households | 112 (5.8%) | 0 (0.0%) |
| 6-Person Households | 11 (0.6%) | 0 (0.0%) |
| 7+ Person Households | 56 (2.9%) | 0 (0.0%) |
| Total | 1,177 (60.9%) | 756 (39.1%) |
Female Fertility in Falmouth
Fertility by Age in Falmouth
Average fertility rate in Falmouth is 56.0 births per 1,000 women. Women in the age bracket of 35 to 50 years have the highest fertility rate with 125.0 births per 1,000 women. Women in the age bracket of 35 to 50 years acount for 100.0% of all women with births.
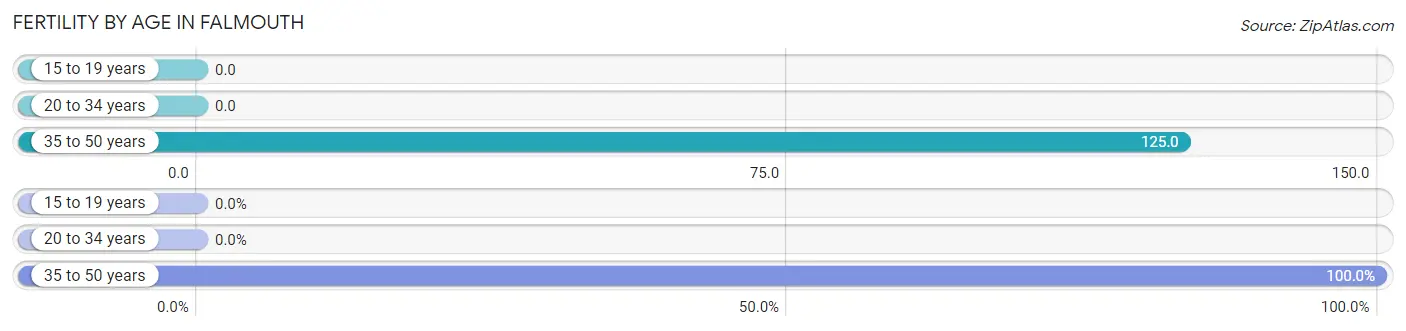
| Age Bracket | Women with Births | Births / 1,000 Women |
| 15 to 19 years | 0 (0.0%) | 0.0 |
| 20 to 34 years | 0 (0.0%) | 0.0 |
| 35 to 50 years | 71 (100.0%) | 125.0 |
| Total | 71 (100.0%) | 56.0 |
Fertility by Age by Marriage Status in Falmouth
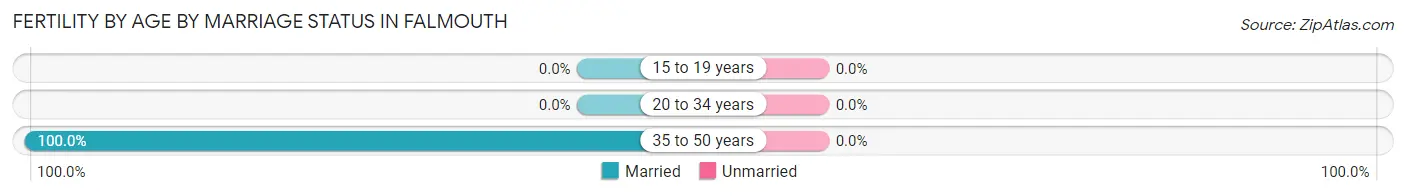
| Age Bracket | Married | Unmarried |
| 15 to 19 years | 0 (0.0%) | 0 (0.0%) |
| 20 to 34 years | 0 (0.0%) | 0 (0.0%) |
| 35 to 50 years | 71 (100.0%) | 0 (0.0%) |
| Total | 71 (100.0%) | 0 (0.0%) |
Fertility by Education in Falmouth
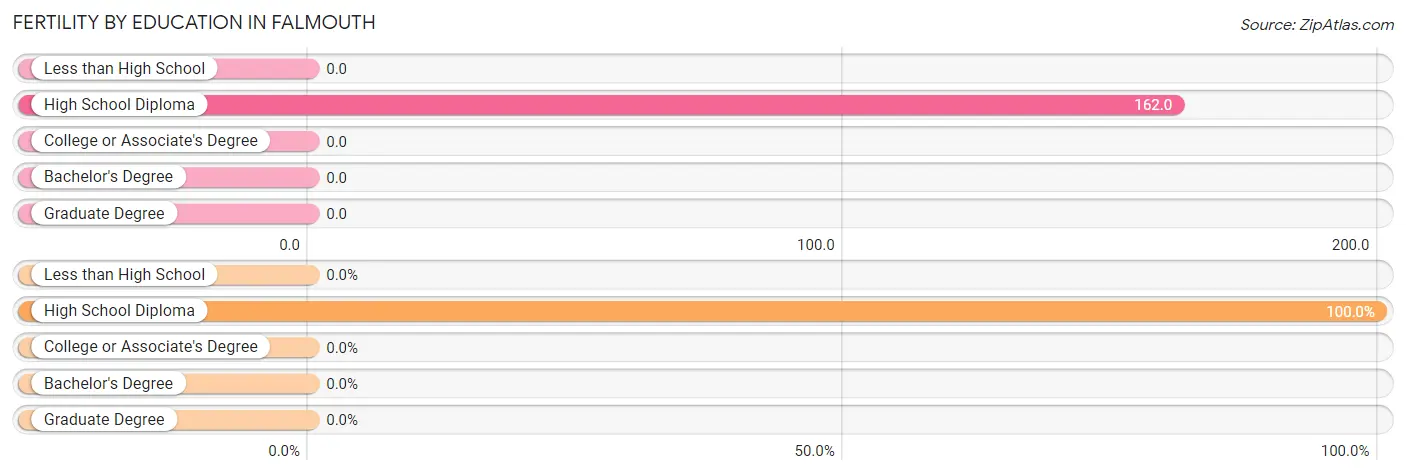
| Educational Attainment | Women with Births | Births / 1,000 Women |
| Less than High School | 0 (0.0%) | 0.0 |
| High School Diploma | 71 (100.0%) | 162.0 |
| College or Associate's Degree | 0 (0.0%) | 0.0 |
| Bachelor's Degree | 0 (0.0%) | 0.0 |
| Graduate Degree | 0 (0.0%) | 0.0 |
| Total | 71 (100.0%) | 56.0 |
Fertility by Education by Marriage Status in Falmouth
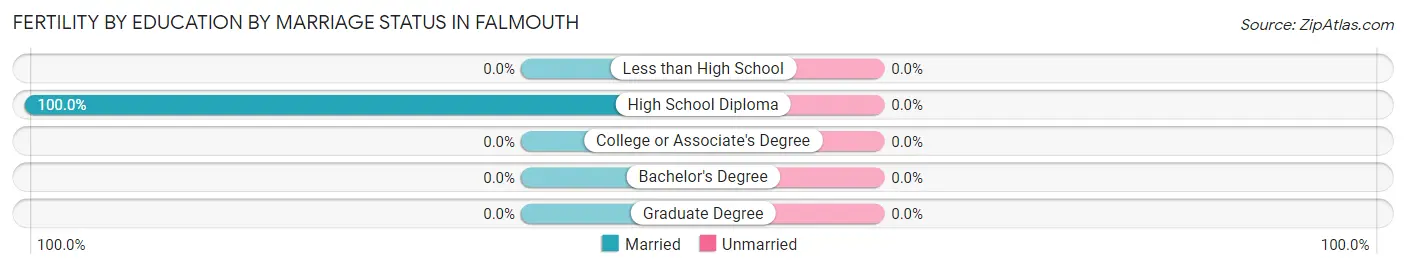
| Educational Attainment | Married | Unmarried |
| Less than High School | 0 (0.0%) | 0 (0.0%) |
| High School Diploma | 71 (100.0%) | 0 (0.0%) |
| College or Associate's Degree | 0 (0.0%) | 0 (0.0%) |
| Bachelor's Degree | 0 (0.0%) | 0 (0.0%) |
| Graduate Degree | 0 (0.0%) | 0 (0.0%) |
| Total | 71 (100.0%) | 0 (0.0%) |
Employment Characteristics in Falmouth
Employment by Class of Employer in Falmouth
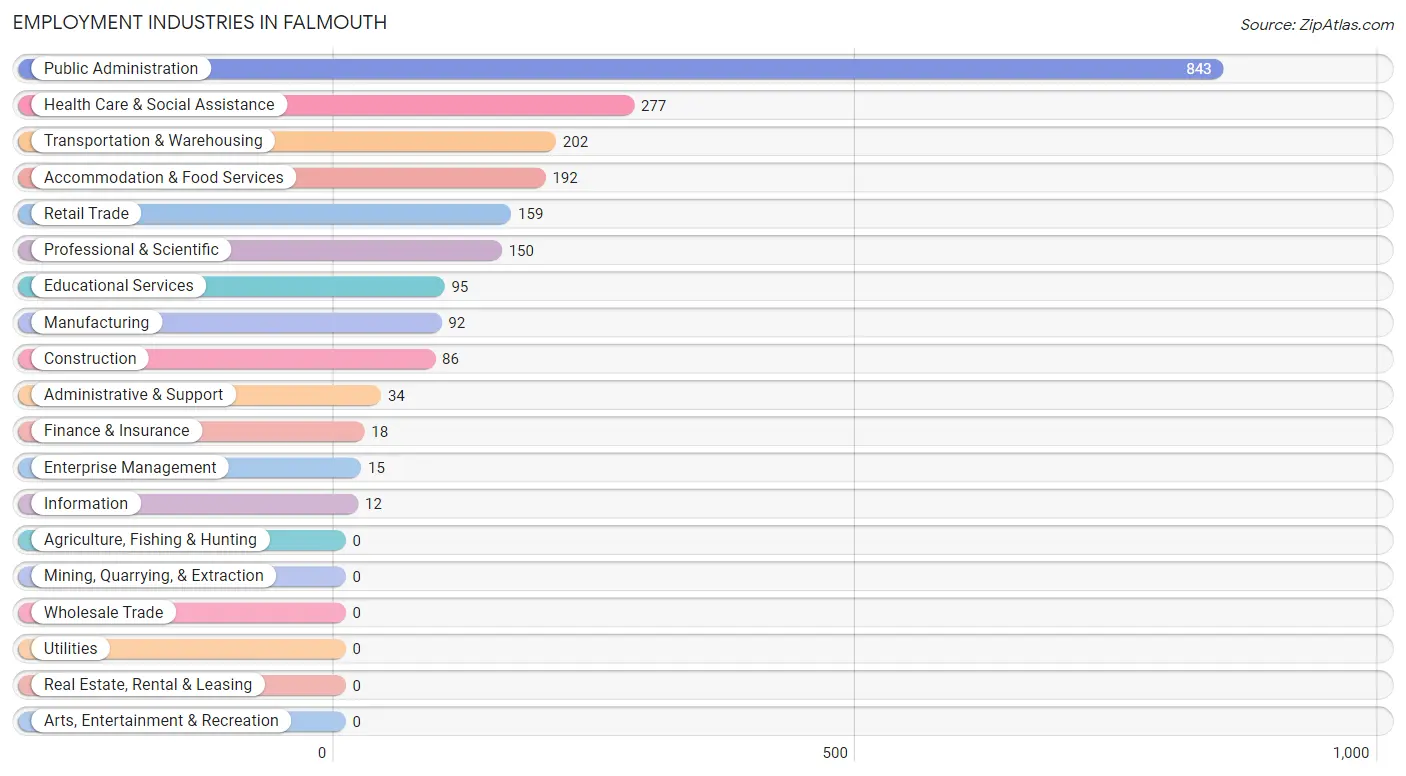
Among the 2,192 employed individuals in Falmouth, federal government employees (884 | 40.3%), private company employees (872 | 39.8%), and not-for-profit organizations (179 | 8.2%) make up the most common classes of employment.
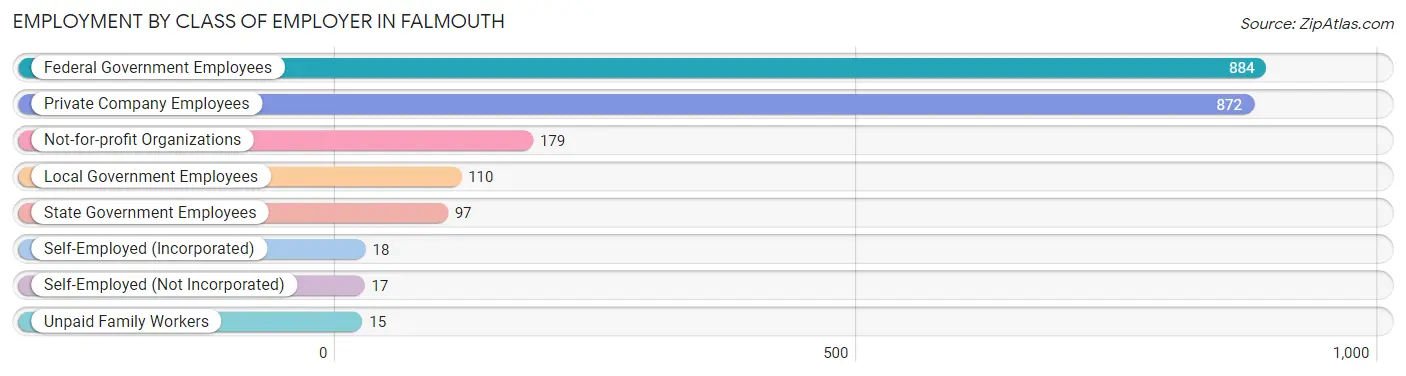
| Employer Class | # Employees | % Employees |
| Private Company Employees | 872 | 39.8% |
| Self-Employed (Incorporated) | 18 | 0.8% |
| Self-Employed (Not Incorporated) | 17 | 0.8% |
| Not-for-profit Organizations | 179 | 8.2% |
| Local Government Employees | 110 | 5.0% |
| State Government Employees | 97 | 4.4% |
| Federal Government Employees | 884 | 40.3% |
| Unpaid Family Workers | 15 | 0.7% |
| Total | 2,192 | 100.0% |
Employment Status by Age in Falmouth
According to the labor force statistics for Falmouth, out of the total population over 16 years of age (3,699), 67.9% or 2,512 individuals are in the labor force, with 7.2% or 181 of them unemployed. The age group with the highest labor force participation rate is 20 to 24 years, with 100.0% or 257 individuals in the labor force. Within the labor force, the 16 to 19 years age range has the highest percentage of unemployed individuals, with 52.9% or 18 of them being unemployed.
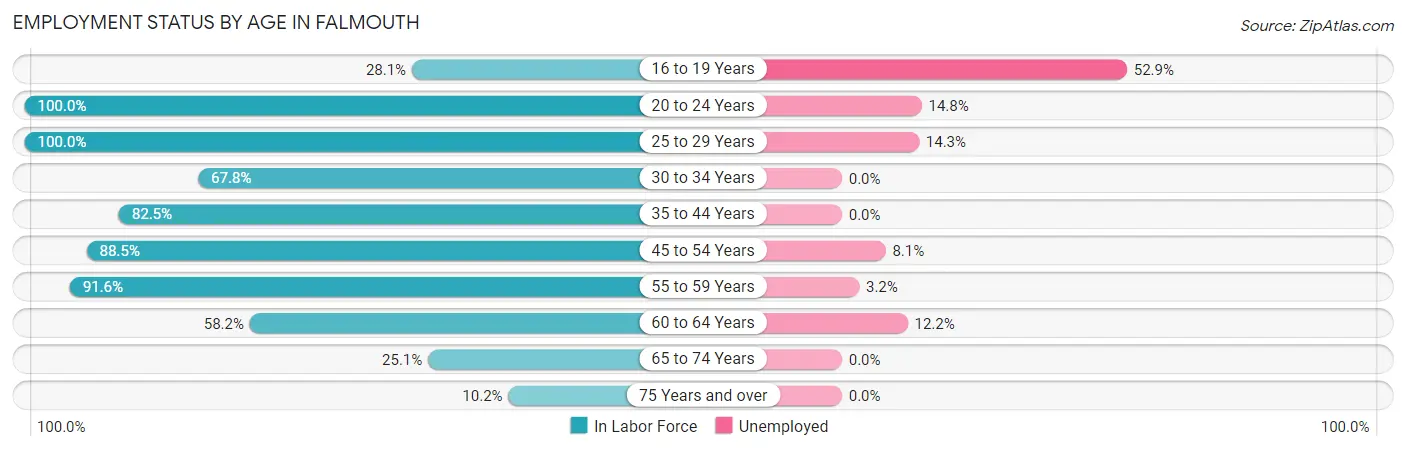
| Age Bracket | In Labor Force | Unemployed |
| 16 to 19 Years | 34 (28.1%) | 18 (52.9%) |
| 20 to 24 Years | 257 (100.0%) | 38 (14.8%) |
| 25 to 29 Years | 301 (100.0%) | 43 (14.3%) |
| 30 to 34 Years | 244 (67.8%) | 0 (0.0%) |
| 35 to 44 Years | 597 (82.5%) | 0 (0.0%) |
| 45 to 54 Years | 517 (88.5%) | 42 (8.1%) |
| 55 to 59 Years | 185 (91.6%) | 6 (3.2%) |
| 60 to 64 Years | 238 (58.2%) | 29 (12.2%) |
| 65 to 74 Years | 105 (25.1%) | 0 (0.0%) |
| 75 Years and over | 33 (10.2%) | 0 (0.0%) |
| Total | 2,512 (67.9%) | 181 (7.2%) |
Employment Status by Educational Attainment in Falmouth
According to labor force statistics for Falmouth, 80.7% of individuals (2,082) out of the total population between 25 and 64 years of age (2,580) are in the labor force, with 6.0% or 125 of them being unemployed. The group with the highest labor force participation rate are those with the educational attainment of bachelor's degree or higher, with 88.5% or 1,018 individuals in the labor force. Within the labor force, individuals with college / associate degree education have the highest percentage of unemployment, with 26.8% or 98 of them being unemployed.
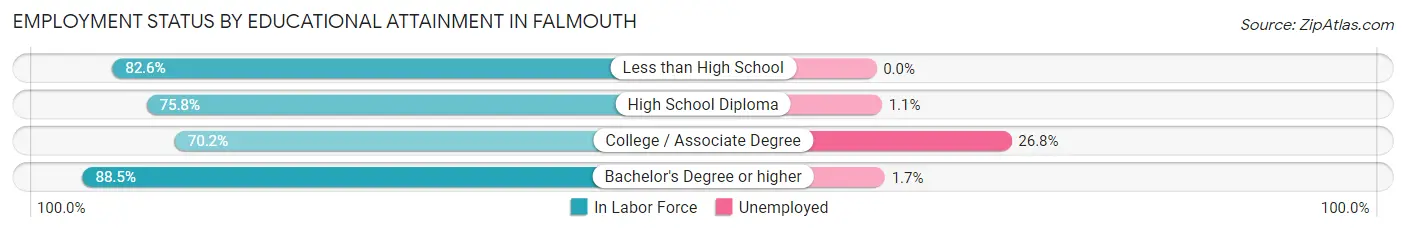
| Educational Attainment | In Labor Force | Unemployed |
| Less than High School | 114 (82.6%) | 0 (0.0%) |
| High School Diploma | 585 (75.8%) | 8 (1.1%) |
| College / Associate Degree | 365 (70.2%) | 139 (26.8%) |
| Bachelor's Degree or higher | 1,018 (88.5%) | 20 (1.7%) |
| Total | 2,082 (80.7%) | 155 (6.0%) |
Employment Occupations by Sex in Falmouth
Management, Business, Science and Arts Occupations
The most common Management, Business, Science and Arts occupations in Falmouth are Management (351 | 15.5%), Computers, Engineering & Science (281 | 12.4%), Community & Social Service (237 | 10.5%), Computers & Mathematics (166 | 7.3%), and Health Diagnosing & Treating (142 | 6.3%).
Management, Business, Science and Arts Occupations by Sex
Within the Management, Business, Science and Arts occupations in Falmouth, the most male-oriented occupations are Business & Financial (100.0%), Architecture & Engineering (100.0%), and Arts, Media & Entertainment (100.0%), while the most female-oriented occupations are Legal Services & Support (100.0%), Education Instruction & Library (88.0%), and Management (68.1%).
| Occupation | Male | Female |
| Management | 112 (31.9%) | 239 (68.1%) |
| Business & Financial | 88 (100.0%) | 0 (0.0%) |
| Computers, Engineering & Science | 238 (84.7%) | 43 (15.3%) |
| Computers & Mathematics | 139 (83.7%) | 27 (16.3%) |
| Architecture & Engineering | 78 (100.0%) | 0 (0.0%) |
| Life, Physical & Social Science | 21 (56.8%) | 16 (43.2%) |
| Community & Social Service | 103 (43.5%) | 134 (56.5%) |
| Education, Arts & Media | 15 (36.6%) | 26 (63.4%) |
| Legal Services & Support | 0 (0.0%) | 27 (100.0%) |
| Education Instruction & Library | 11 (12.0%) | 81 (88.0%) |
| Arts, Media & Entertainment | 77 (100.0%) | 0 (0.0%) |
| Health Diagnosing & Treating | 49 (34.5%) | 93 (65.5%) |
| Health Technologists | 26 (40.6%) | 38 (59.4%) |
| Total (Category) | 590 (53.7%) | 509 (46.3%) |
| Total (Overall) | 1,230 (54.3%) | 1,033 (45.7%) |
Services Occupations
The most common Services occupations in Falmouth are Food Preparation & Serving (188 | 8.3%), Healthcare Support (72 | 3.2%), Security & Protection (48 | 2.1%), Firefighting & Prevention (38 | 1.7%), and Personal Care & Service (32 | 1.4%).
Services Occupations by Sex
Within the Services occupations in Falmouth, the most male-oriented occupations are Cleaning & Maintenance (100.0%), Food Preparation & Serving (97.3%), and Firefighting & Prevention (89.5%), while the most female-oriented occupations are Healthcare Support (100.0%), Law Enforcement (100.0%), and Security & Protection (29.2%).
| Occupation | Male | Female |
| Healthcare Support | 0 (0.0%) | 72 (100.0%) |
| Security & Protection | 34 (70.8%) | 14 (29.2%) |
| Firefighting & Prevention | 34 (89.5%) | 4 (10.5%) |
| Law Enforcement | 0 (0.0%) | 10 (100.0%) |
| Food Preparation & Serving | 183 (97.3%) | 5 (2.7%) |
| Cleaning & Maintenance | 16 (100.0%) | 0 (0.0%) |
| Personal Care & Service | 25 (78.1%) | 7 (21.9%) |
| Total (Category) | 258 (72.5%) | 98 (27.5%) |
| Total (Overall) | 1,230 (54.3%) | 1,033 (45.7%) |
Sales and Office Occupations
The most common Sales and Office occupations in Falmouth are Office & Administration (255 | 11.3%), and Sales & Related (73 | 3.2%).
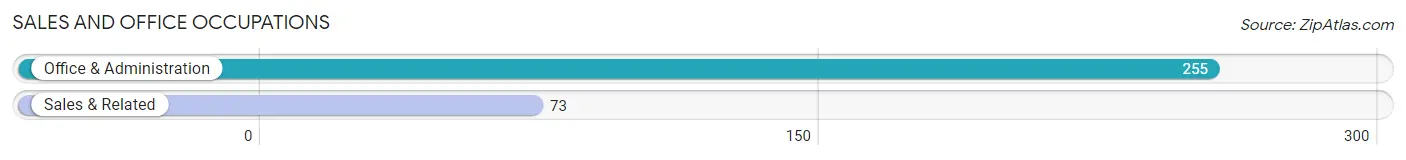
Sales and Office Occupations by Sex

| Occupation | Male | Female |
| Sales & Related | 48 (65.7%) | 25 (34.3%) |
| Office & Administration | 36 (14.1%) | 219 (85.9%) |
| Total (Category) | 84 (25.6%) | 244 (74.4%) |
| Total (Overall) | 1,230 (54.3%) | 1,033 (45.7%) |
Natural Resources, Construction and Maintenance Occupations
The most common Natural Resources, Construction and Maintenance occupations in Falmouth are Construction & Extraction (98 | 4.3%), and Installation, Maintenance & Repair (51 | 2.2%).
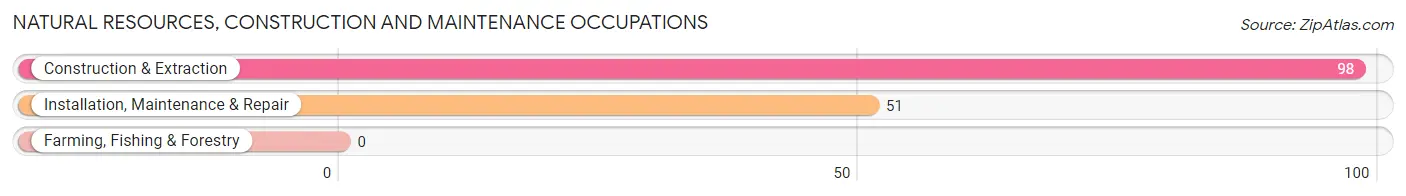
Natural Resources, Construction and Maintenance Occupations by Sex
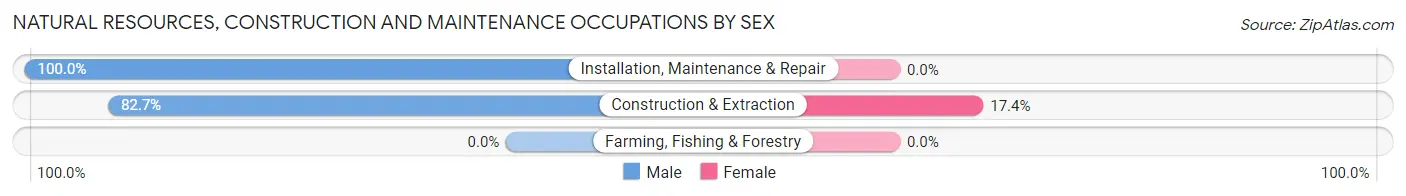
| Occupation | Male | Female |
| Farming, Fishing & Forestry | 0 (0.0%) | 0 (0.0%) |
| Construction & Extraction | 81 (82.7%) | 17 (17.3%) |
| Installation, Maintenance & Repair | 51 (100.0%) | 0 (0.0%) |
| Total (Category) | 132 (88.6%) | 17 (11.4%) |
| Total (Overall) | 1,230 (54.3%) | 1,033 (45.7%) |
Production, Transportation and Moving Occupations
The most common Production, Transportation and Moving occupations in Falmouth are Transportation (218 | 9.6%), Production (61 | 2.7%), and Material Moving (52 | 2.3%).
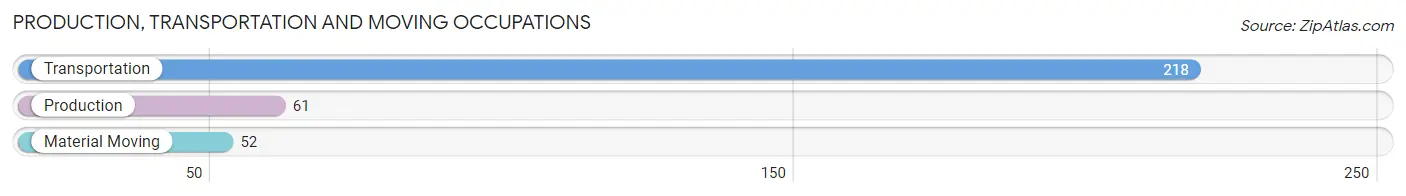
Production, Transportation and Moving Occupations by Sex
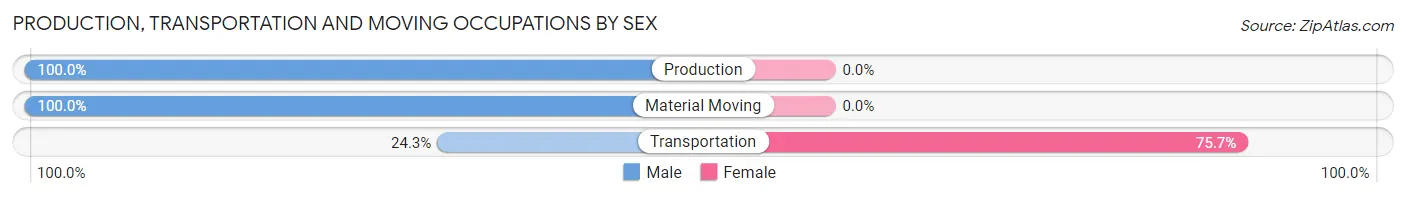
| Occupation | Male | Female |
| Production | 61 (100.0%) | 0 (0.0%) |
| Transportation | 53 (24.3%) | 165 (75.7%) |
| Material Moving | 52 (100.0%) | 0 (0.0%) |
| Total (Category) | 166 (50.1%) | 165 (49.8%) |
| Total (Overall) | 1,230 (54.3%) | 1,033 (45.7%) |
Employment Industries by Sex in Falmouth
Employment Industries in Falmouth
The major employment industries in Falmouth include Public Administration (843 | 37.2%), Health Care & Social Assistance (277 | 12.2%), Transportation & Warehousing (202 | 8.9%), Accommodation & Food Services (192 | 8.5%), and Retail Trade (159 | 7.0%).
Employment Industries by Sex in Falmouth
The Falmouth industries that see more men than women are Construction (100.0%), Finance & Insurance (100.0%), and Administrative & Support (100.0%), whereas the industries that tend to have a higher number of women are Information (100.0%), Enterprise Management (100.0%), and Educational Services (100.0%).
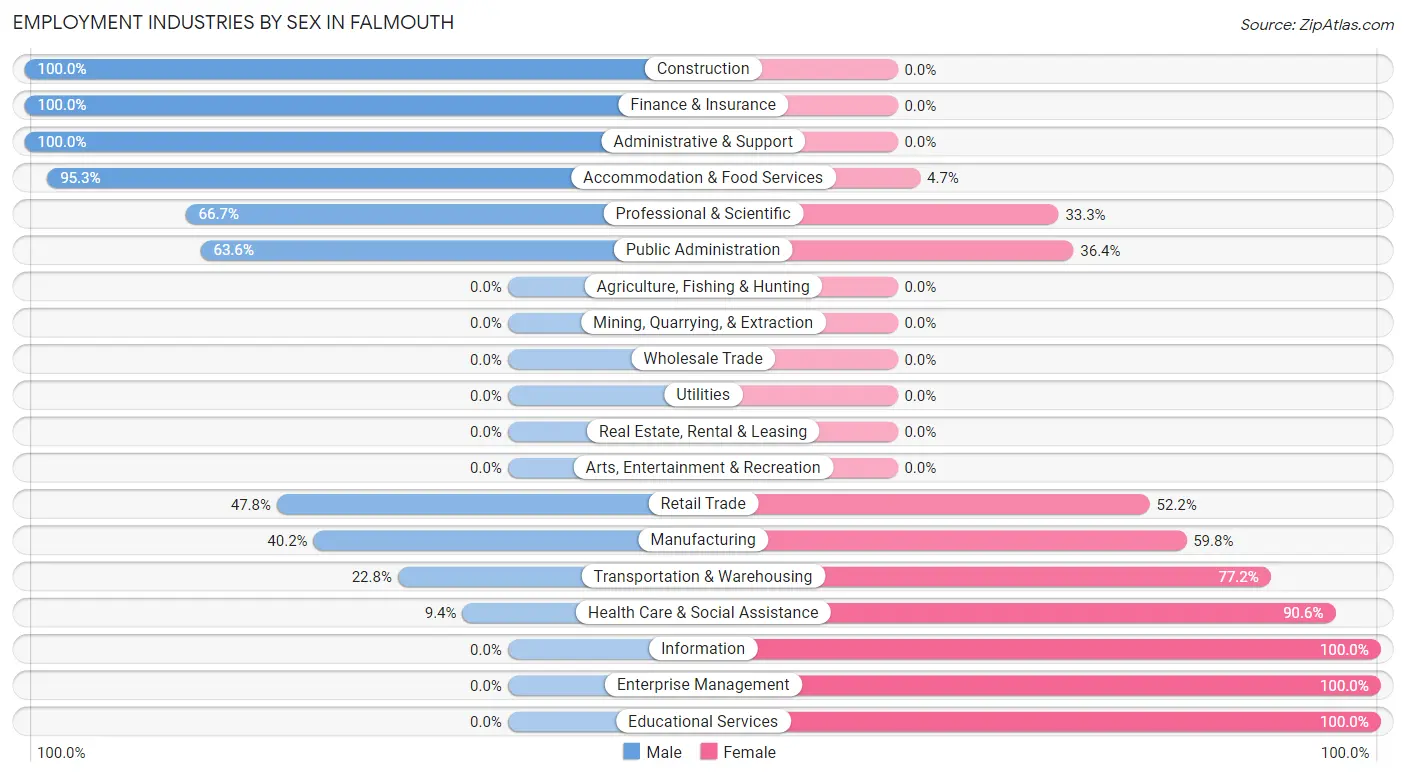
| Industry | Male | Female |
| Agriculture, Fishing & Hunting | 0 (0.0%) | 0 (0.0%) |
| Mining, Quarrying, & Extraction | 0 (0.0%) | 0 (0.0%) |
| Construction | 86 (100.0%) | 0 (0.0%) |
| Manufacturing | 37 (40.2%) | 55 (59.8%) |
| Wholesale Trade | 0 (0.0%) | 0 (0.0%) |
| Retail Trade | 76 (47.8%) | 83 (52.2%) |
| Transportation & Warehousing | 46 (22.8%) | 156 (77.2%) |
| Utilities | 0 (0.0%) | 0 (0.0%) |
| Information | 0 (0.0%) | 12 (100.0%) |
| Finance & Insurance | 18 (100.0%) | 0 (0.0%) |
| Real Estate, Rental & Leasing | 0 (0.0%) | 0 (0.0%) |
| Professional & Scientific | 100 (66.7%) | 50 (33.3%) |
| Enterprise Management | 0 (0.0%) | 15 (100.0%) |
| Administrative & Support | 34 (100.0%) | 0 (0.0%) |
| Educational Services | 0 (0.0%) | 95 (100.0%) |
| Health Care & Social Assistance | 26 (9.4%) | 251 (90.6%) |
| Arts, Entertainment & Recreation | 0 (0.0%) | 0 (0.0%) |
| Accommodation & Food Services | 183 (95.3%) | 9 (4.7%) |
| Public Administration | 536 (63.6%) | 307 (36.4%) |
| Total | 1,230 (54.3%) | 1,033 (45.7%) |
Education in Falmouth
School Enrollment in Falmouth
The most common levels of schooling among the 1,376 students in Falmouth are middle school (353 | 25.7%), high school (280 | 20.3%), and college / undergraduate (246 | 17.9%).
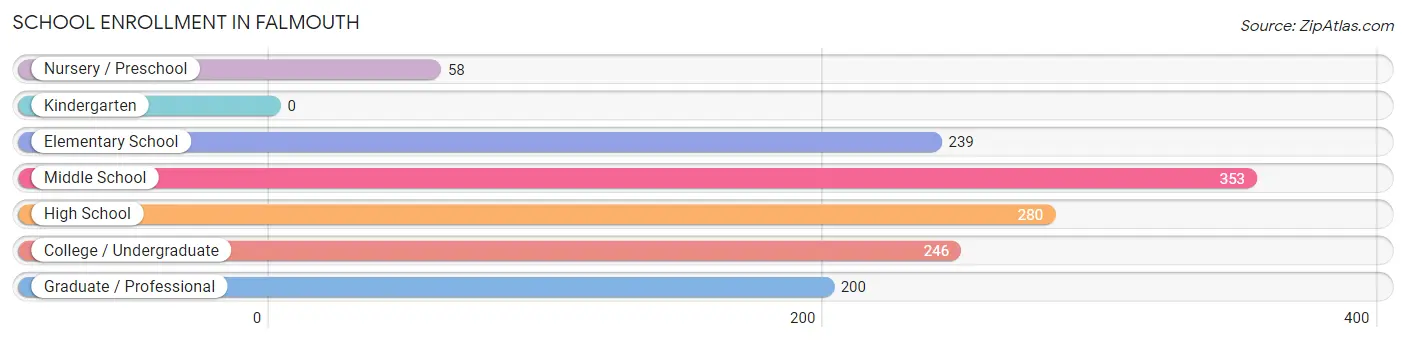
| School Level | # Students | % Students |
| Nursery / Preschool | 58 | 4.2% |
| Kindergarten | 0 | 0.0% |
| Elementary School | 239 | 17.4% |
| Middle School | 353 | 25.7% |
| High School | 280 | 20.3% |
| College / Undergraduate | 246 | 17.9% |
| Graduate / Professional | 200 | 14.5% |
| Total | 1,376 | 100.0% |
School Enrollment by Age by Funding Source in Falmouth
Out of a total of 1,376 students who are enrolled in schools in Falmouth, 363 (26.4%) attend a private institution, while the remaining 1,013 (73.6%) are enrolled in public schools. The age group of 3 to 4 year olds has the highest likelihood of being enrolled in private schools, with 58 (100.0% in the age bracket) enrolled. Conversely, the age group of 18 to 19 year olds has the lowest likelihood of being enrolled in a private school, with 98 (100.0% in the age bracket) attending a public institution.
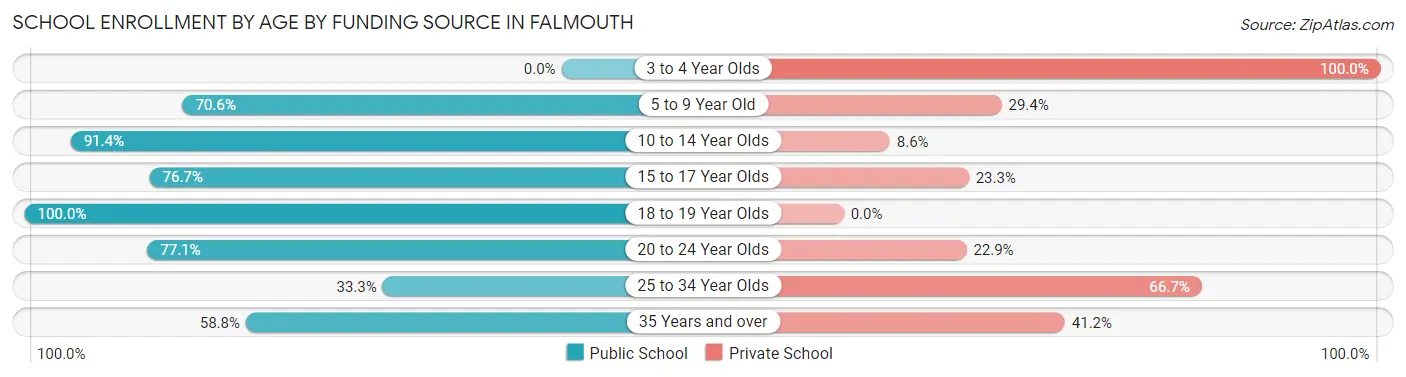
| Age Bracket | Public School | Private School |
| 3 to 4 Year Olds | 0 (0.0%) | 58 (100.0%) |
| 5 to 9 Year Old | 156 (70.6%) | 65 (29.4%) |
| 10 to 14 Year Olds | 255 (91.4%) | 24 (8.6%) |
| 15 to 17 Year Olds | 224 (76.7%) | 68 (23.3%) |
| 18 to 19 Year Olds | 98 (100.0%) | 0 (0.0%) |
| 20 to 24 Year Olds | 145 (77.1%) | 43 (22.9%) |
| 25 to 34 Year Olds | 8 (33.3%) | 16 (66.7%) |
| 35 Years and over | 127 (58.8%) | 89 (41.2%) |
| Total | 1,013 (73.6%) | 363 (26.4%) |
Educational Attainment by Field of Study in Falmouth
Business (280 | 16.3%), bio, nature & agricultural (179 | 10.4%), education (172 | 10.0%), liberal arts & history (170 | 9.9%), and literature & languages (158 | 9.2%) are the most common fields of study among 1,723 individuals in Falmouth who have obtained a bachelor's degree or higher.
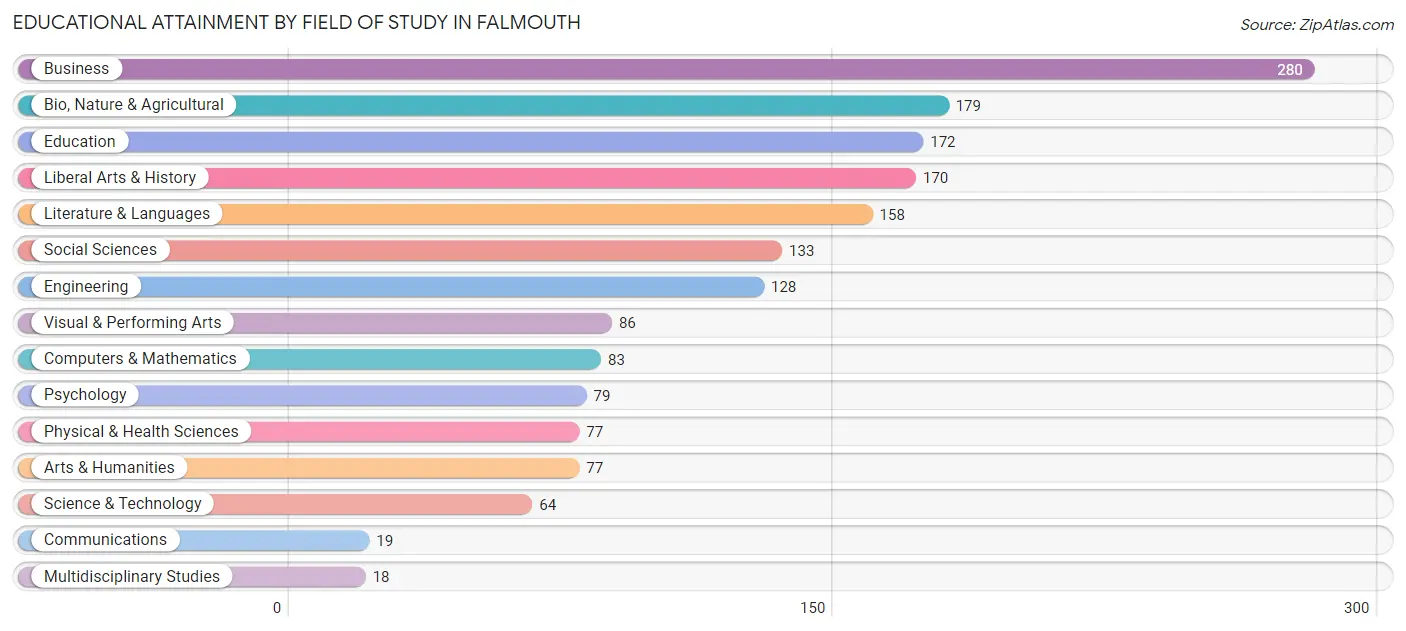
| Field of Study | # Graduates | % Graduates |
| Computers & Mathematics | 83 | 4.8% |
| Bio, Nature & Agricultural | 179 | 10.4% |
| Physical & Health Sciences | 77 | 4.5% |
| Psychology | 79 | 4.6% |
| Social Sciences | 133 | 7.7% |
| Engineering | 128 | 7.4% |
| Multidisciplinary Studies | 18 | 1.0% |
| Science & Technology | 64 | 3.7% |
| Business | 280 | 16.3% |
| Education | 172 | 10.0% |
| Literature & Languages | 158 | 9.2% |
| Liberal Arts & History | 170 | 9.9% |
| Visual & Performing Arts | 86 | 5.0% |
| Communications | 19 | 1.1% |
| Arts & Humanities | 77 | 4.5% |
| Total | 1,723 | 100.0% |
Transportation & Commute in Falmouth
Vehicle Availability by Sex in Falmouth
The most prevalent vehicle ownership categories in Falmouth are males with 2 vehicles (375, accounting for 29.9%) and females with 2 vehicles (400, making up 40.0%).
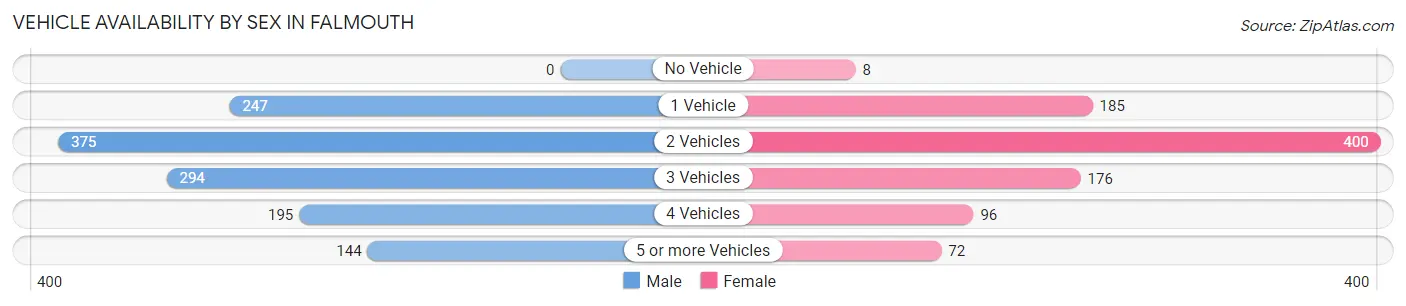
| Vehicles Available | Male | Female |
| No Vehicle | 0 (0.0%) | 8 (0.9%) |
| 1 Vehicle | 247 (19.7%) | 185 (19.7%) |
| 2 Vehicles | 375 (29.9%) | 400 (42.7%) |
| 3 Vehicles | 294 (23.4%) | 176 (18.8%) |
| 4 Vehicles | 195 (15.5%) | 96 (10.2%) |
| 5 or more Vehicles | 144 (11.5%) | 72 (7.7%) |
| Total | 1,255 (100.0%) | 937 (100.0%) |
Commute Time in Falmouth
The most frequently occuring commute durations in Falmouth are 15 to 19 minutes (432 commuters, 22.7%), 20 to 24 minutes (292 commuters, 15.3%), and 10 to 14 minutes (258 commuters, 13.5%).
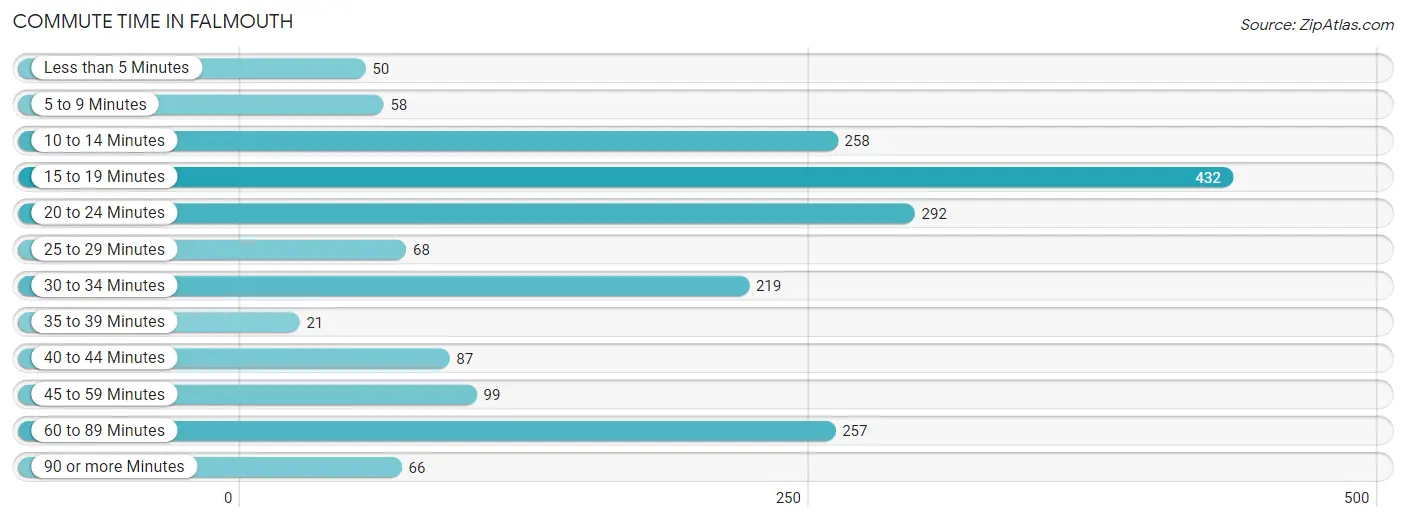
| Commute Time | # Commuters | % Commuters |
| Less than 5 Minutes | 50 | 2.6% |
| 5 to 9 Minutes | 58 | 3.0% |
| 10 to 14 Minutes | 258 | 13.5% |
| 15 to 19 Minutes | 432 | 22.7% |
| 20 to 24 Minutes | 292 | 15.3% |
| 25 to 29 Minutes | 68 | 3.6% |
| 30 to 34 Minutes | 219 | 11.5% |
| 35 to 39 Minutes | 21 | 1.1% |
| 40 to 44 Minutes | 87 | 4.6% |
| 45 to 59 Minutes | 99 | 5.2% |
| 60 to 89 Minutes | 257 | 13.5% |
| 90 or more Minutes | 66 | 3.5% |
Commute Time by Sex in Falmouth
The most common commute times in Falmouth are 15 to 19 minutes (277 commuters, 26.6%) for males and 20 to 24 minutes (200 commuters, 23.2%) for females.
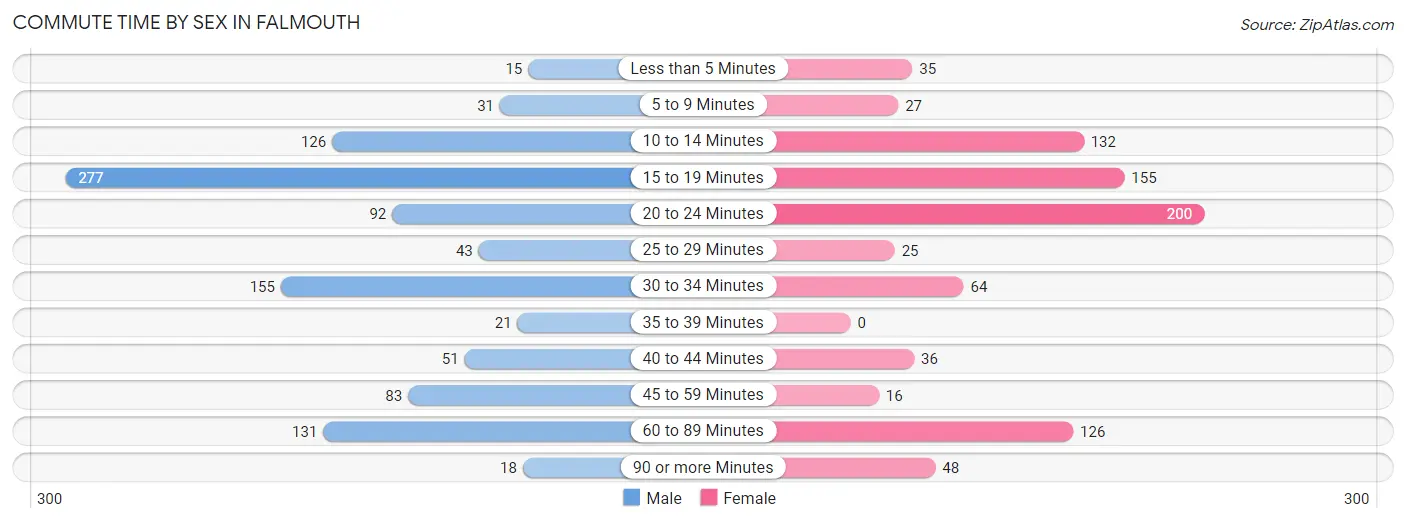
| Commute Time | Male | Female |
| Less than 5 Minutes | 15 (1.4%) | 35 (4.1%) |
| 5 to 9 Minutes | 31 (3.0%) | 27 (3.1%) |
| 10 to 14 Minutes | 126 (12.1%) | 132 (15.3%) |
| 15 to 19 Minutes | 277 (26.6%) | 155 (17.9%) |
| 20 to 24 Minutes | 92 (8.8%) | 200 (23.2%) |
| 25 to 29 Minutes | 43 (4.1%) | 25 (2.9%) |
| 30 to 34 Minutes | 155 (14.9%) | 64 (7.4%) |
| 35 to 39 Minutes | 21 (2.0%) | 0 (0.0%) |
| 40 to 44 Minutes | 51 (4.9%) | 36 (4.2%) |
| 45 to 59 Minutes | 83 (8.0%) | 16 (1.8%) |
| 60 to 89 Minutes | 131 (12.6%) | 126 (14.6%) |
| 90 or more Minutes | 18 (1.7%) | 48 (5.6%) |
Time of Departure to Work by Sex in Falmouth
The most frequent times of departure to work in Falmouth are 7:30 AM to 7:59 AM (231, 22.2%) for males and 6:30 AM to 6:59 AM (135, 15.6%) for females.
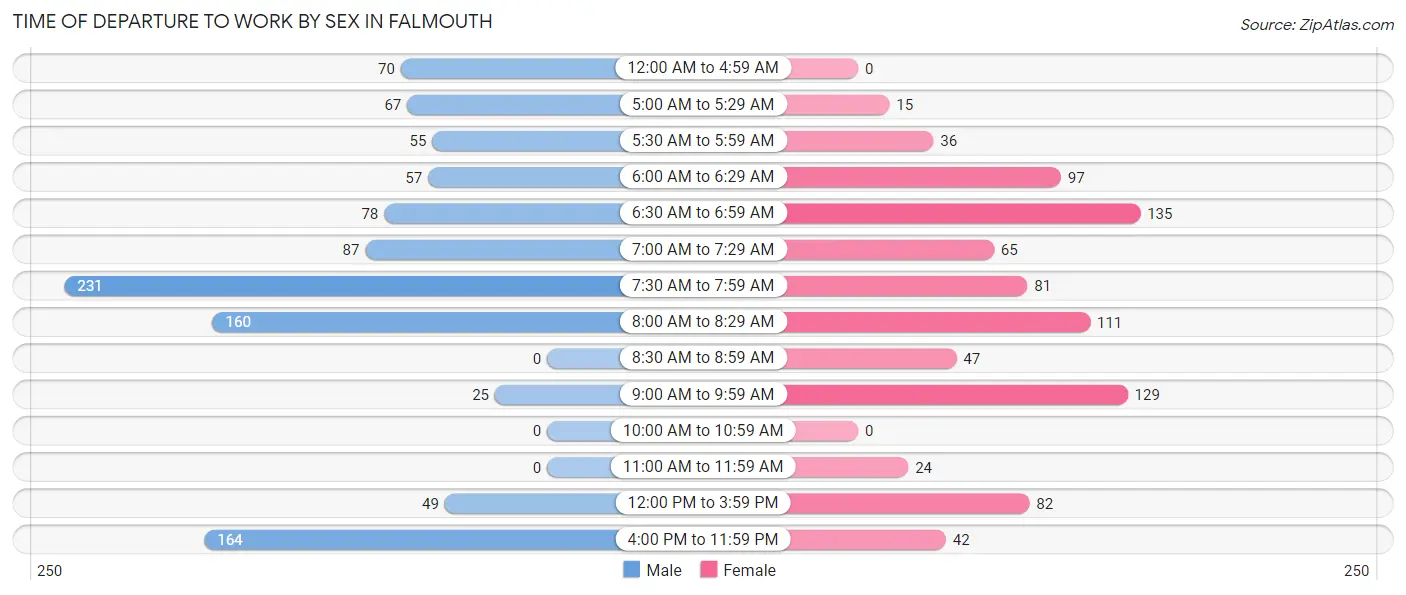
| Time of Departure | Male | Female |
| 12:00 AM to 4:59 AM | 70 (6.7%) | 0 (0.0%) |
| 5:00 AM to 5:29 AM | 67 (6.4%) | 15 (1.7%) |
| 5:30 AM to 5:59 AM | 55 (5.3%) | 36 (4.2%) |
| 6:00 AM to 6:29 AM | 57 (5.5%) | 97 (11.2%) |
| 6:30 AM to 6:59 AM | 78 (7.5%) | 135 (15.6%) |
| 7:00 AM to 7:29 AM | 87 (8.3%) | 65 (7.5%) |
| 7:30 AM to 7:59 AM | 231 (22.2%) | 81 (9.4%) |
| 8:00 AM to 8:29 AM | 160 (15.3%) | 111 (12.9%) |
| 8:30 AM to 8:59 AM | 0 (0.0%) | 47 (5.4%) |
| 9:00 AM to 9:59 AM | 25 (2.4%) | 129 (14.9%) |
| 10:00 AM to 10:59 AM | 0 (0.0%) | 0 (0.0%) |
| 11:00 AM to 11:59 AM | 0 (0.0%) | 24 (2.8%) |
| 12:00 PM to 3:59 PM | 49 (4.7%) | 82 (9.5%) |
| 4:00 PM to 11:59 PM | 164 (15.7%) | 42 (4.9%) |
| Total | 1,043 (100.0%) | 864 (100.0%) |
Housing Occupancy in Falmouth
Occupancy by Ownership in Falmouth
Of the total 1,933 dwellings in Falmouth, owner-occupied units account for 1,506 (77.9%), while renter-occupied units make up 427 (22.1%).
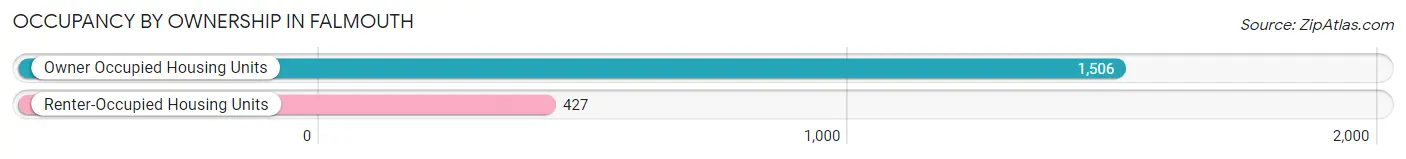
| Occupancy | # Housing Units | % Housing Units |
| Owner Occupied Housing Units | 1,506 | 77.9% |
| Renter-Occupied Housing Units | 427 | 22.1% |
| Total Occupied Housing Units | 1,933 | 100.0% |
Occupancy by Household Size in Falmouth
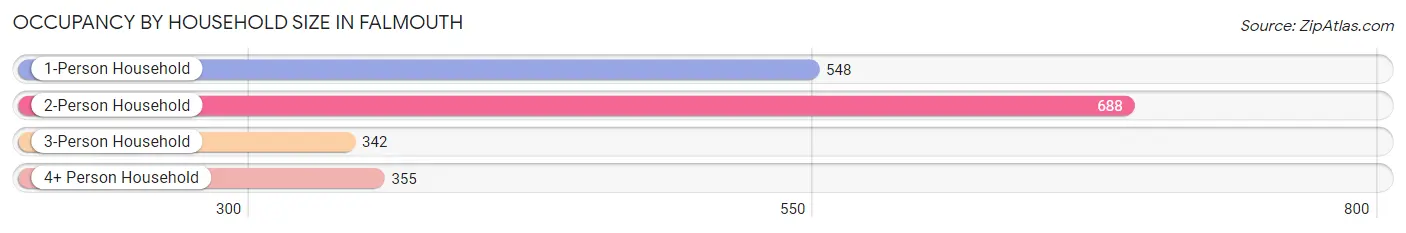
| Household Size | # Housing Units | % Housing Units |
| 1-Person Household | 548 | 28.3% |
| 2-Person Household | 688 | 35.6% |
| 3-Person Household | 342 | 17.7% |
| 4+ Person Household | 355 | 18.4% |
| Total Housing Units | 1,933 | 100.0% |
Occupancy by Ownership by Household Size in Falmouth
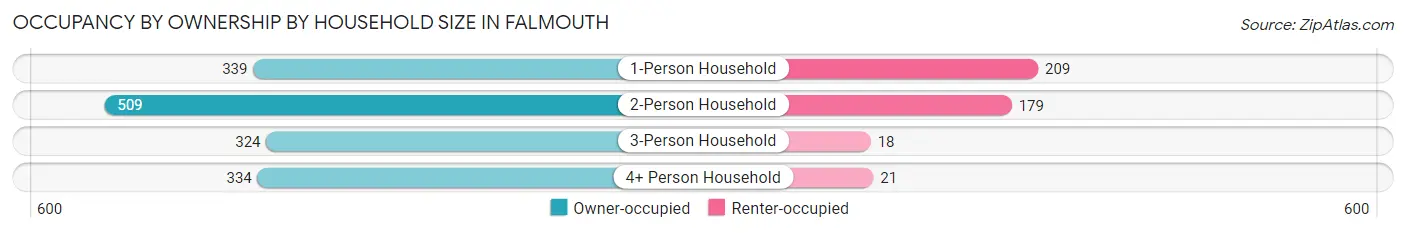
| Household Size | Owner-occupied | Renter-occupied |
| 1-Person Household | 339 (61.9%) | 209 (38.1%) |
| 2-Person Household | 509 (74.0%) | 179 (26.0%) |
| 3-Person Household | 324 (94.7%) | 18 (5.3%) |
| 4+ Person Household | 334 (94.1%) | 21 (5.9%) |
| Total Housing Units | 1,506 (77.9%) | 427 (22.1%) |
Occupancy by Educational Attainment in Falmouth
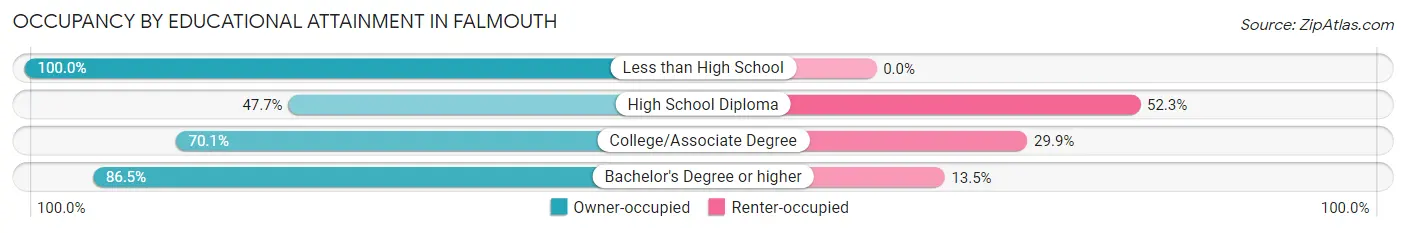
| Household Size | Owner-occupied | Renter-occupied |
| Less than High School | 33 (100.0%) | 0 (0.0%) |
| High School Diploma | 124 (47.7%) | 136 (52.3%) |
| College/Associate Degree | 295 (70.1%) | 126 (29.9%) |
| Bachelor's Degree or higher | 1,054 (86.5%) | 165 (13.5%) |
Occupancy by Age of Householder in Falmouth
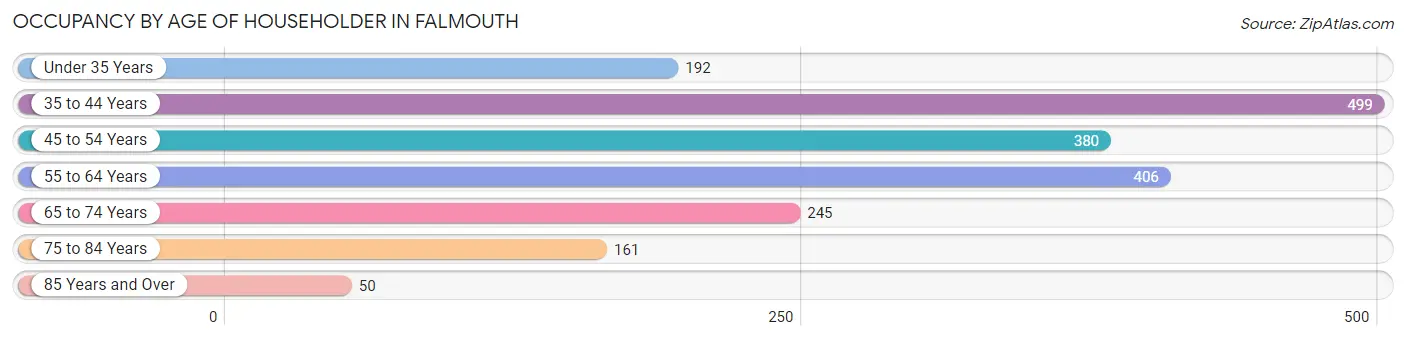
| Age Bracket | # Households | % Households |
| Under 35 Years | 192 | 9.9% |
| 35 to 44 Years | 499 | 25.8% |
| 45 to 54 Years | 380 | 19.7% |
| 55 to 64 Years | 406 | 21.0% |
| 65 to 74 Years | 245 | 12.7% |
| 75 to 84 Years | 161 | 8.3% |
| 85 Years and Over | 50 | 2.6% |
| Total | 1,933 | 100.0% |
Housing Finances in Falmouth
Median Income by Occupancy in Falmouth
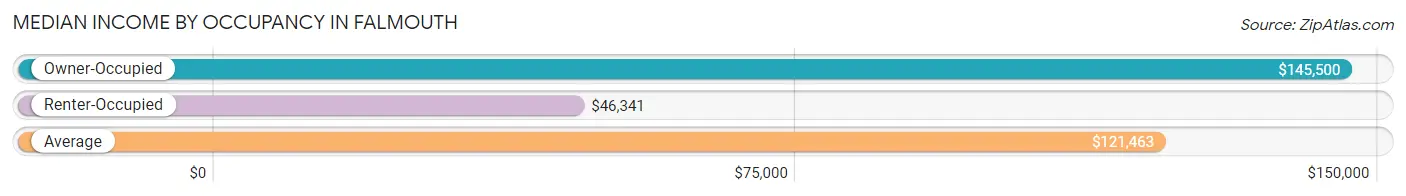
| Occupancy Type | # Households | Median Income |
| Owner-Occupied | 1,506 (77.9%) | $145,500 |
| Renter-Occupied | 427 (22.1%) | $46,341 |
| Average | 1,933 (100.0%) | $121,463 |
Occupancy by Householder Income Bracket in Falmouth
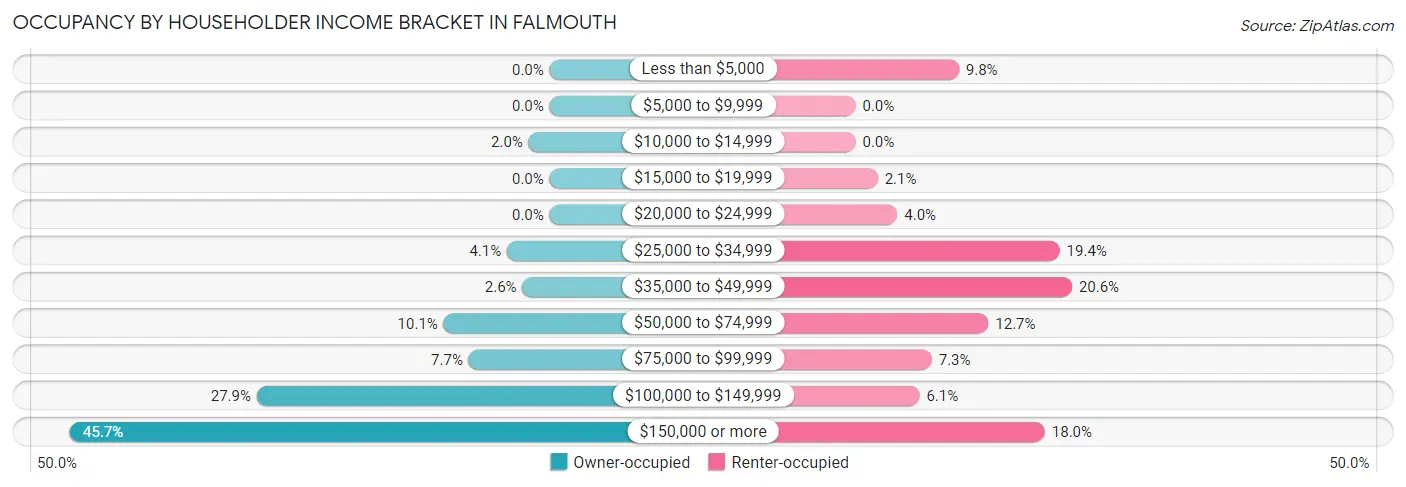
| Income Bracket | Owner-occupied | Renter-occupied |
| Less than $5,000 | 0 (0.0%) | 42 (9.8%) |
| $5,000 to $9,999 | 0 (0.0%) | 0 (0.0%) |
| $10,000 to $14,999 | 30 (2.0%) | 0 (0.0%) |
| $15,000 to $19,999 | 0 (0.0%) | 9 (2.1%) |
| $20,000 to $24,999 | 0 (0.0%) | 17 (4.0%) |
| $25,000 to $34,999 | 61 (4.1%) | 83 (19.4%) |
| $35,000 to $49,999 | 39 (2.6%) | 88 (20.6%) |
| $50,000 to $74,999 | 152 (10.1%) | 54 (12.7%) |
| $75,000 to $99,999 | 116 (7.7%) | 31 (7.3%) |
| $100,000 to $149,999 | 420 (27.9%) | 26 (6.1%) |
| $150,000 or more | 688 (45.7%) | 77 (18.0%) |
| Total | 1,506 (100.0%) | 427 (100.0%) |
Monthly Housing Cost Tiers in Falmouth
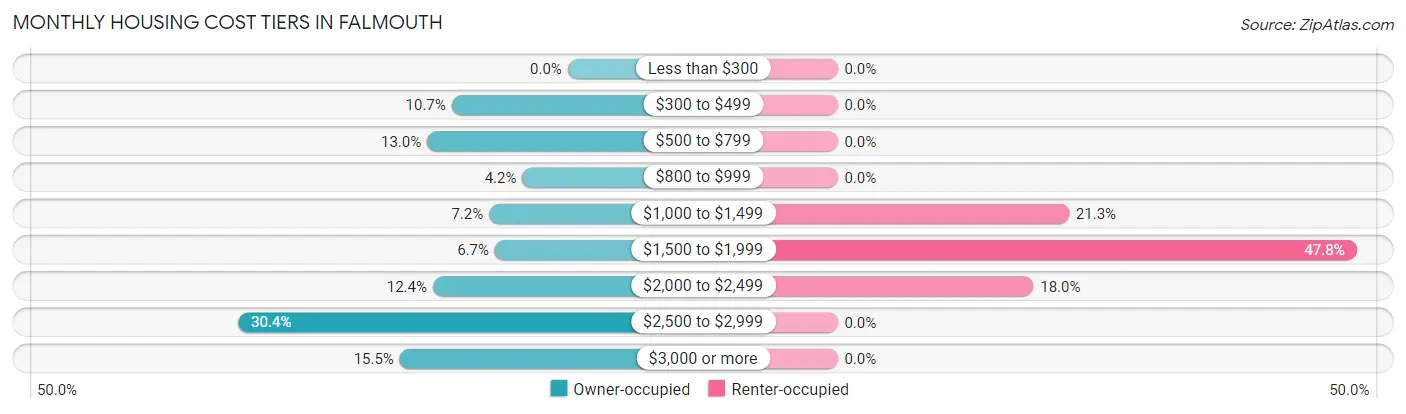
| Monthly Cost | Owner-occupied | Renter-occupied |
| Less than $300 | 0 (0.0%) | 0 (0.0%) |
| $300 to $499 | 161 (10.7%) | 0 (0.0%) |
| $500 to $799 | 195 (13.0%) | 0 (0.0%) |
| $800 to $999 | 63 (4.2%) | 0 (0.0%) |
| $1,000 to $1,499 | 109 (7.2%) | 91 (21.3%) |
| $1,500 to $1,999 | 101 (6.7%) | 204 (47.8%) |
| $2,000 to $2,499 | 187 (12.4%) | 77 (18.0%) |
| $2,500 to $2,999 | 457 (30.3%) | 0 (0.0%) |
| $3,000 or more | 233 (15.5%) | 0 (0.0%) |
| Total | 1,506 (100.0%) | 427 (100.0%) |
Physical Housing Characteristics in Falmouth
Housing Structures in Falmouth
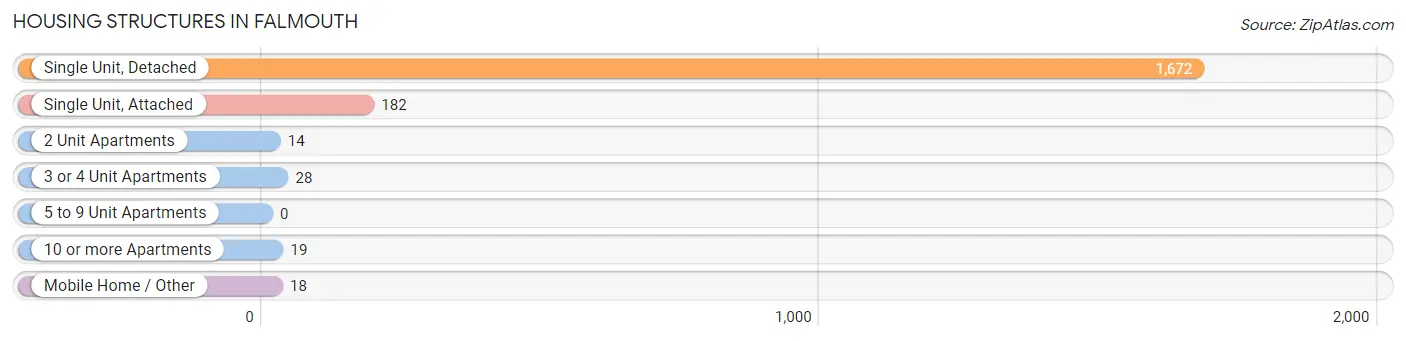
| Structure Type | # Housing Units | % Housing Units |
| Single Unit, Detached | 1,672 | 86.5% |
| Single Unit, Attached | 182 | 9.4% |
| 2 Unit Apartments | 14 | 0.7% |
| 3 or 4 Unit Apartments | 28 | 1.5% |
| 5 to 9 Unit Apartments | 0 | 0.0% |
| 10 or more Apartments | 19 | 1.0% |
| Mobile Home / Other | 18 | 0.9% |
| Total | 1,933 | 100.0% |
Housing Structures by Occupancy in Falmouth
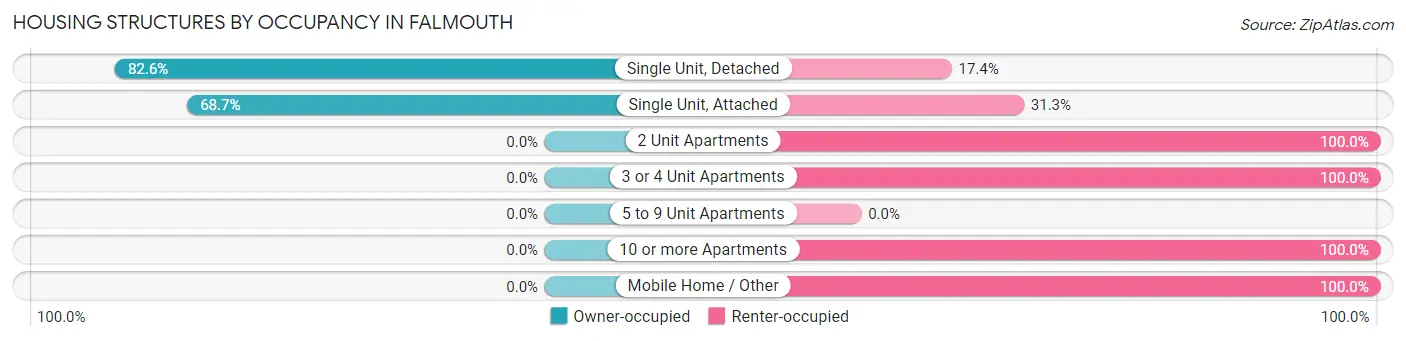
| Structure Type | Owner-occupied | Renter-occupied |
| Single Unit, Detached | 1,381 (82.6%) | 291 (17.4%) |
| Single Unit, Attached | 125 (68.7%) | 57 (31.3%) |
| 2 Unit Apartments | 0 (0.0%) | 14 (100.0%) |
| 3 or 4 Unit Apartments | 0 (0.0%) | 28 (100.0%) |
| 5 to 9 Unit Apartments | 0 (0.0%) | 0 (0.0%) |
| 10 or more Apartments | 0 (0.0%) | 19 (100.0%) |
| Mobile Home / Other | 0 (0.0%) | 18 (100.0%) |
| Total | 1,506 (77.9%) | 427 (22.1%) |
Housing Structures by Number of Rooms in Falmouth
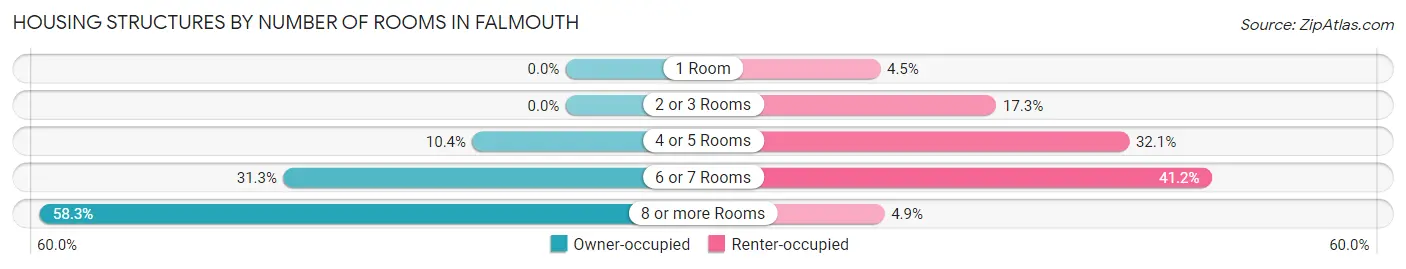
| Number of Rooms | Owner-occupied | Renter-occupied |
| 1 Room | 0 (0.0%) | 19 (4.4%) |
| 2 or 3 Rooms | 0 (0.0%) | 74 (17.3%) |
| 4 or 5 Rooms | 156 (10.4%) | 137 (32.1%) |
| 6 or 7 Rooms | 472 (31.3%) | 176 (41.2%) |
| 8 or more Rooms | 878 (58.3%) | 21 (4.9%) |
| Total | 1,506 (100.0%) | 427 (100.0%) |
Housing Structure by Heating Type in Falmouth
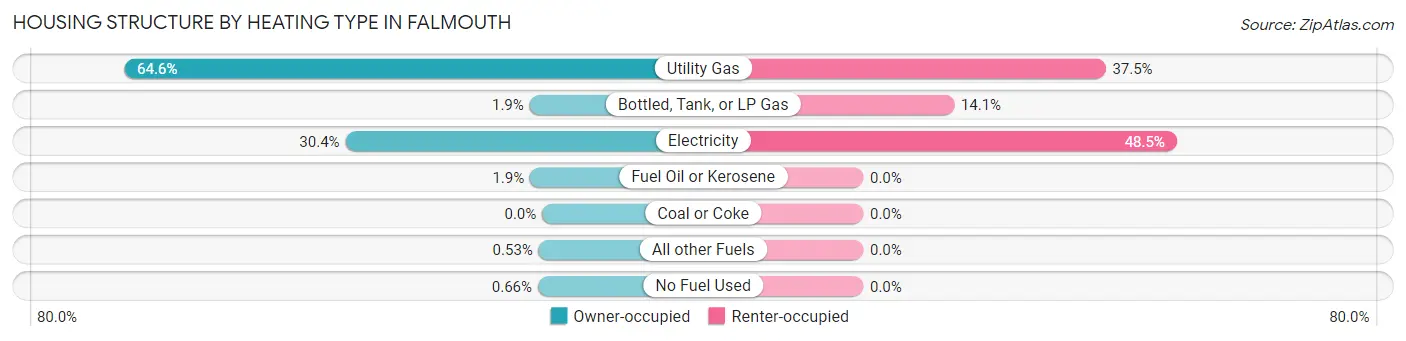
| Heating Type | Owner-occupied | Renter-occupied |
| Utility Gas | 973 (64.6%) | 160 (37.5%) |
| Bottled, Tank, or LP Gas | 29 (1.9%) | 60 (14.1%) |
| Electricity | 458 (30.4%) | 207 (48.5%) |
| Fuel Oil or Kerosene | 28 (1.9%) | 0 (0.0%) |
| Coal or Coke | 0 (0.0%) | 0 (0.0%) |
| All other Fuels | 8 (0.5%) | 0 (0.0%) |
| No Fuel Used | 10 (0.7%) | 0 (0.0%) |
| Total | 1,506 (100.0%) | 427 (100.0%) |
Household Vehicle Usage in Falmouth
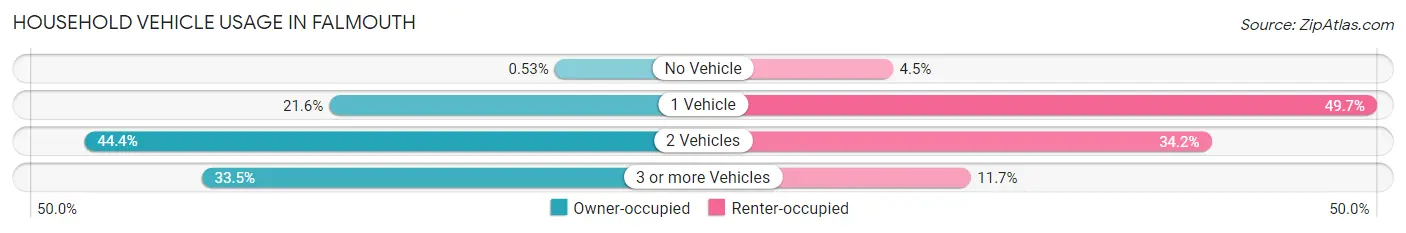
| Vehicles per Household | Owner-occupied | Renter-occupied |
| No Vehicle | 8 (0.5%) | 19 (4.4%) |
| 1 Vehicle | 325 (21.6%) | 212 (49.6%) |
| 2 Vehicles | 669 (44.4%) | 146 (34.2%) |
| 3 or more Vehicles | 504 (33.5%) | 50 (11.7%) |
| Total | 1,506 (100.0%) | 427 (100.0%) |
Real Estate & Mortgages in Falmouth
Real Estate and Mortgage Overview in Falmouth
| Characteristic | Without Mortgage | With Mortgage |
| Housing Units | 407 | 1,099 |
| Median Property Value | $317,300 | $435,000 |
| Median Household Income | $105,486 | $514 |
| Monthly Housing Costs | $530 | $233 |
| Real Estate Taxes | $2,239 | $105 |
Property Value by Mortgage Status in Falmouth
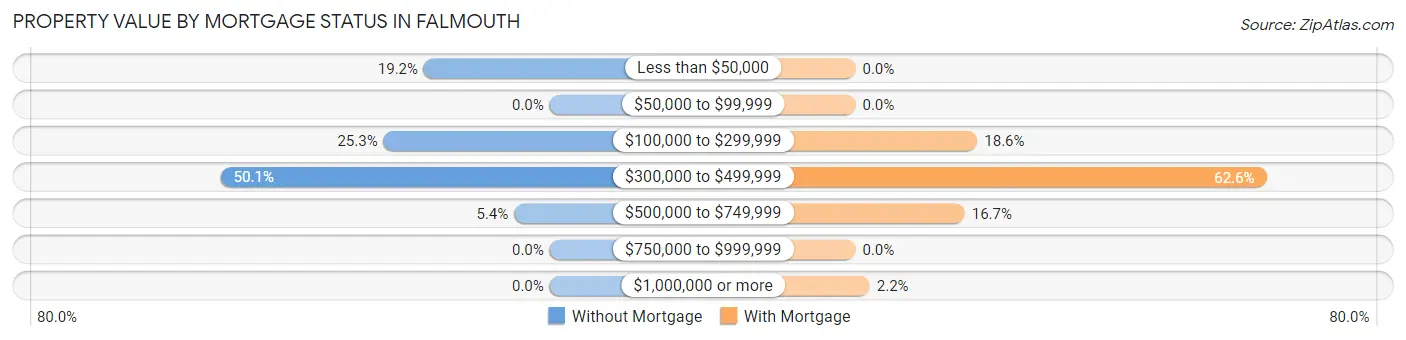
| Property Value | Without Mortgage | With Mortgage |
| Less than $50,000 | 78 (19.2%) | 0 (0.0%) |
| $50,000 to $99,999 | 0 (0.0%) | 0 (0.0%) |
| $100,000 to $299,999 | 103 (25.3%) | 204 (18.6%) |
| $300,000 to $499,999 | 204 (50.1%) | 688 (62.6%) |
| $500,000 to $749,999 | 22 (5.4%) | 183 (16.7%) |
| $750,000 to $999,999 | 0 (0.0%) | 0 (0.0%) |
| $1,000,000 or more | 0 (0.0%) | 24 (2.2%) |
| Total | 407 (100.0%) | 1,099 (100.0%) |
Household Income by Mortgage Status in Falmouth
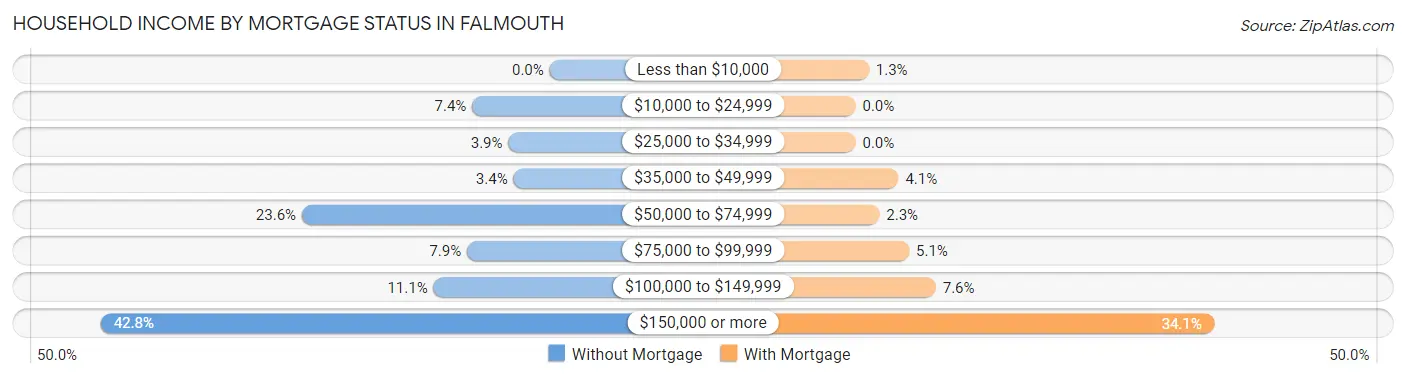
| Household Income | Without Mortgage | With Mortgage |
| Less than $10,000 | 0 (0.0%) | 14 (1.3%) |
| $10,000 to $24,999 | 30 (7.4%) | 0 (0.0%) |
| $25,000 to $34,999 | 16 (3.9%) | 0 (0.0%) |
| $35,000 to $49,999 | 14 (3.4%) | 45 (4.1%) |
| $50,000 to $74,999 | 96 (23.6%) | 25 (2.3%) |
| $75,000 to $99,999 | 32 (7.9%) | 56 (5.1%) |
| $100,000 to $149,999 | 45 (11.1%) | 84 (7.6%) |
| $150,000 or more | 174 (42.7%) | 375 (34.1%) |
| Total | 407 (100.0%) | 1,099 (100.0%) |
Property Value to Household Income Ratio in Falmouth
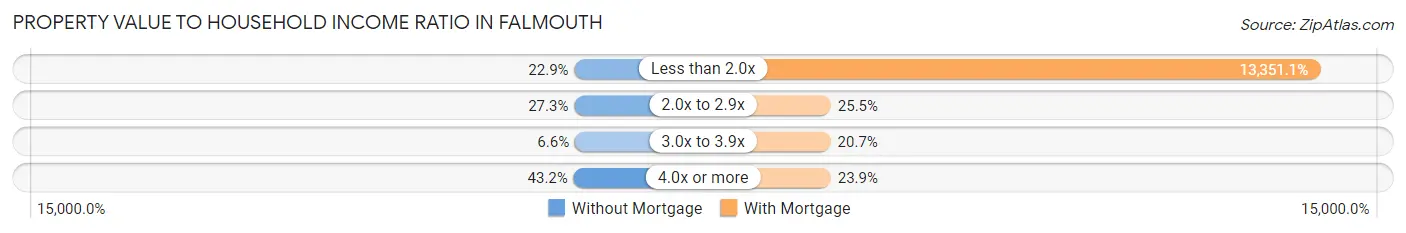
| Value-to-Income Ratio | Without Mortgage | With Mortgage |
| Less than 2.0x | 93 (22.9%) | 146,729 (13,351.1%) |
| 2.0x to 2.9x | 111 (27.3%) | 280 (25.5%) |
| 3.0x to 3.9x | 27 (6.6%) | 227 (20.7%) |
| 4.0x or more | 176 (43.2%) | 263 (23.9%) |
| Total | 407 (100.0%) | 1,099 (100.0%) |
Real Estate Taxes by Mortgage Status in Falmouth
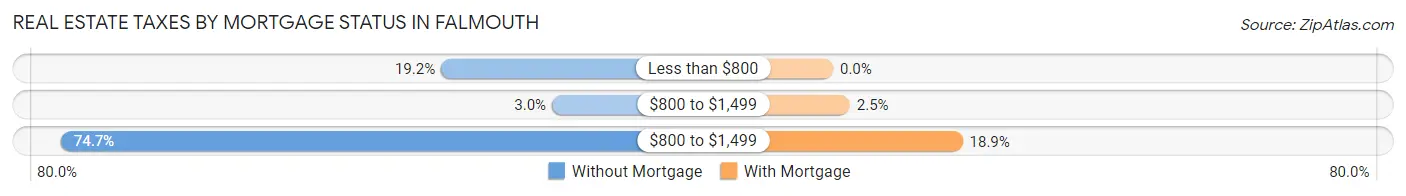
| Property Taxes | Without Mortgage | With Mortgage |
| Less than $800 | 78 (19.2%) | 0 (0.0%) |
| $800 to $1,499 | 12 (2.9%) | 27 (2.5%) |
| $800 to $1,499 | 304 (74.7%) | 208 (18.9%) |
| Total | 407 (100.0%) | 1,099 (100.0%) |
Health & Disability in Falmouth
Health Insurance Coverage by Age in Falmouth
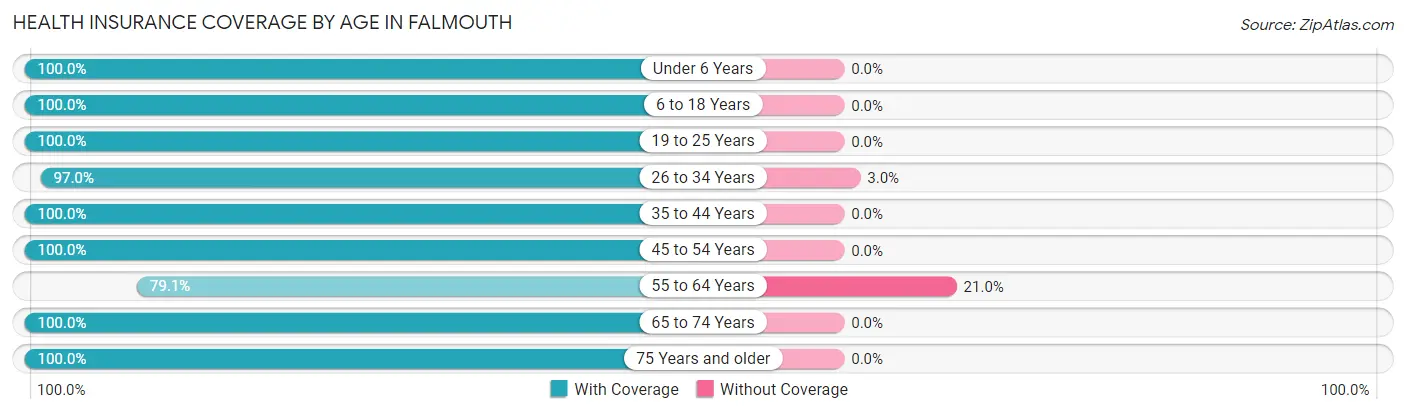
| Age Bracket | With Coverage | Without Coverage |
| Under 6 Years | 162 (100.0%) | 0 (0.0%) |
| 6 to 18 Years | 863 (100.0%) | 0 (0.0%) |
| 19 to 25 Years | 468 (100.0%) | 0 (0.0%) |
| 26 to 34 Years | 520 (97.0%) | 16 (3.0%) |
| 35 to 44 Years | 652 (100.0%) | 0 (0.0%) |
| 45 to 54 Years | 584 (100.0%) | 0 (0.0%) |
| 55 to 64 Years | 483 (79.0%) | 128 (20.9%) |
| 65 to 74 Years | 419 (100.0%) | 0 (0.0%) |
| 75 Years and older | 322 (100.0%) | 0 (0.0%) |
| Total | 4,473 (96.9%) | 144 (3.1%) |
Health Insurance Coverage by Citizenship Status in Falmouth
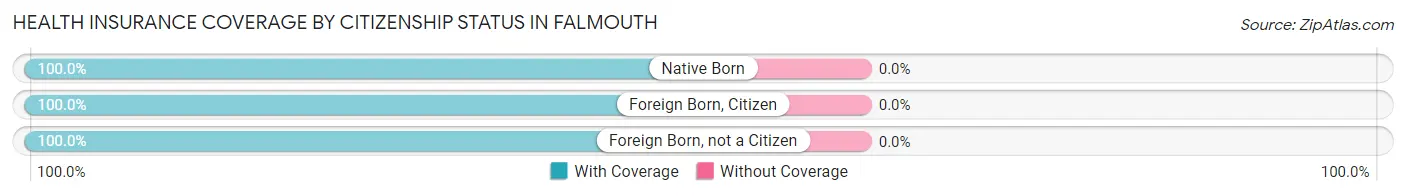
| Citizenship Status | With Coverage | Without Coverage |
| Native Born | 162 (100.0%) | 0 (0.0%) |
| Foreign Born, Citizen | 863 (100.0%) | 0 (0.0%) |
| Foreign Born, not a Citizen | 468 (100.0%) | 0 (0.0%) |
Health Insurance Coverage by Household Income in Falmouth
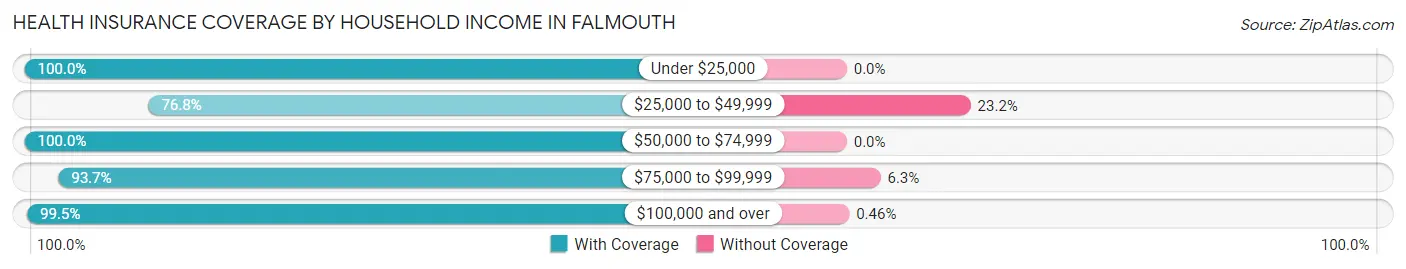
| Household Income | With Coverage | Without Coverage |
| Under $25,000 | 98 (100.0%) | 0 (0.0%) |
| $25,000 to $49,999 | 364 (76.8%) | 110 (23.2%) |
| $50,000 to $74,999 | 262 (100.0%) | 0 (0.0%) |
| $75,000 to $99,999 | 267 (93.7%) | 18 (6.3%) |
| $100,000 and over | 3,482 (99.5%) | 16 (0.5%) |
Public vs Private Health Insurance Coverage by Age in Falmouth
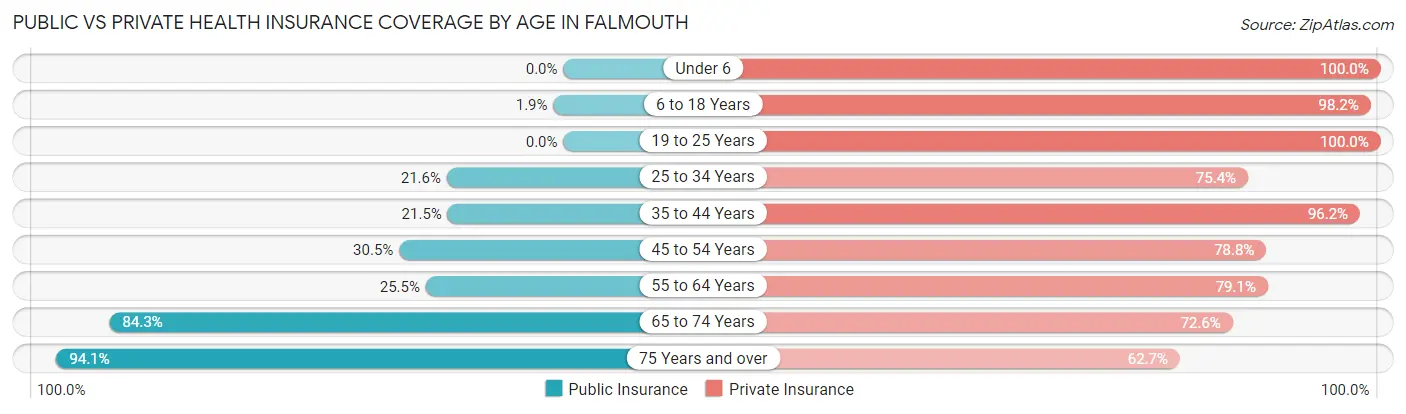
| Age Bracket | Public Insurance | Private Insurance |
| Under 6 | 0 (0.0%) | 162 (100.0%) |
| 6 to 18 Years | 16 (1.8%) | 847 (98.2%) |
| 19 to 25 Years | 0 (0.0%) | 468 (100.0%) |
| 25 to 34 Years | 116 (21.6%) | 404 (75.4%) |
| 35 to 44 Years | 140 (21.5%) | 627 (96.2%) |
| 45 to 54 Years | 178 (30.5%) | 460 (78.8%) |
| 55 to 64 Years | 156 (25.5%) | 483 (79.0%) |
| 65 to 74 Years | 353 (84.3%) | 304 (72.6%) |
| 75 Years and over | 303 (94.1%) | 202 (62.7%) |
| Total | 1,262 (27.3%) | 3,957 (85.7%) |
Disability Status by Sex by Age in Falmouth
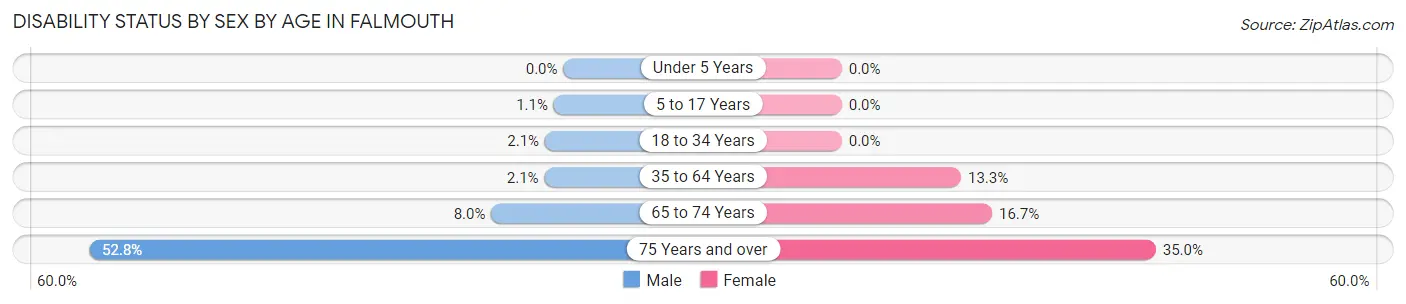
| Age Bracket | Male | Female |
| Under 5 Years | 0 (0.0%) | 0 (0.0%) |
| 5 to 17 Years | 6 (1.1%) | 0 (0.0%) |
| 18 to 34 Years | 9 (2.1%) | 0 (0.0%) |
| 35 to 64 Years | 22 (2.1%) | 107 (13.3%) |
| 65 to 74 Years | 13 (8.0%) | 43 (16.7%) |
| 75 Years and over | 84 (52.8%) | 57 (35.0%) |
Disability Class by Sex by Age in Falmouth
Disability Class: Hearing Difficulty
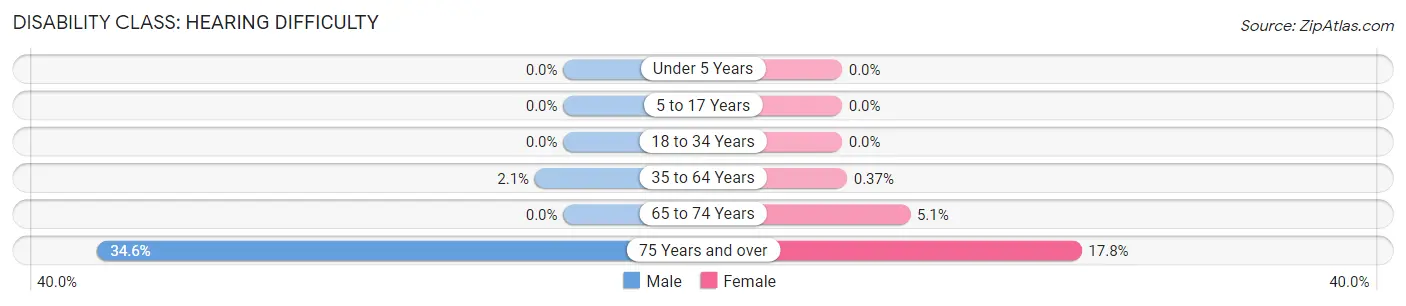
| Age Bracket | Male | Female |
| Under 5 Years | 0 (0.0%) | 0 (0.0%) |
| 5 to 17 Years | 0 (0.0%) | 0 (0.0%) |
| 18 to 34 Years | 0 (0.0%) | 0 (0.0%) |
| 35 to 64 Years | 22 (2.1%) | 3 (0.4%) |
| 65 to 74 Years | 0 (0.0%) | 13 (5.1%) |
| 75 Years and over | 55 (34.6%) | 29 (17.8%) |
Disability Class: Vision Difficulty
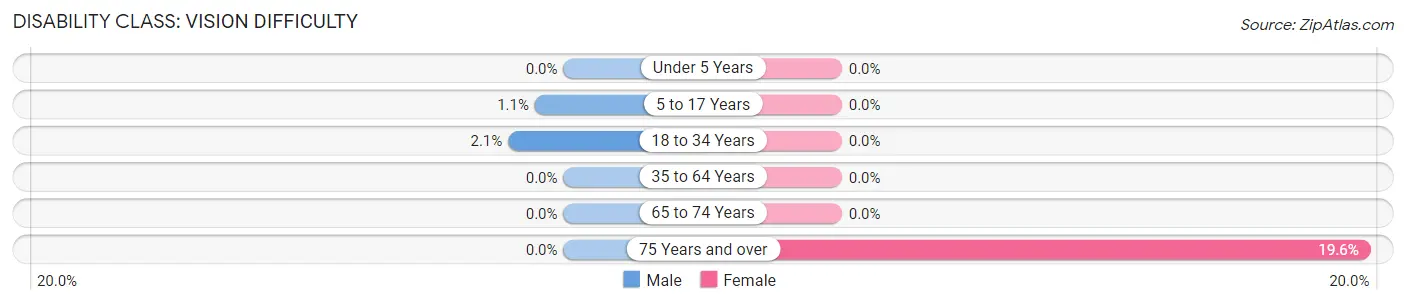
| Age Bracket | Male | Female |
| Under 5 Years | 0 (0.0%) | 0 (0.0%) |
| 5 to 17 Years | 6 (1.1%) | 0 (0.0%) |
| 18 to 34 Years | 9 (2.1%) | 0 (0.0%) |
| 35 to 64 Years | 0 (0.0%) | 0 (0.0%) |
| 65 to 74 Years | 0 (0.0%) | 0 (0.0%) |
| 75 Years and over | 0 (0.0%) | 32 (19.6%) |
Disability Class: Cognitive Difficulty
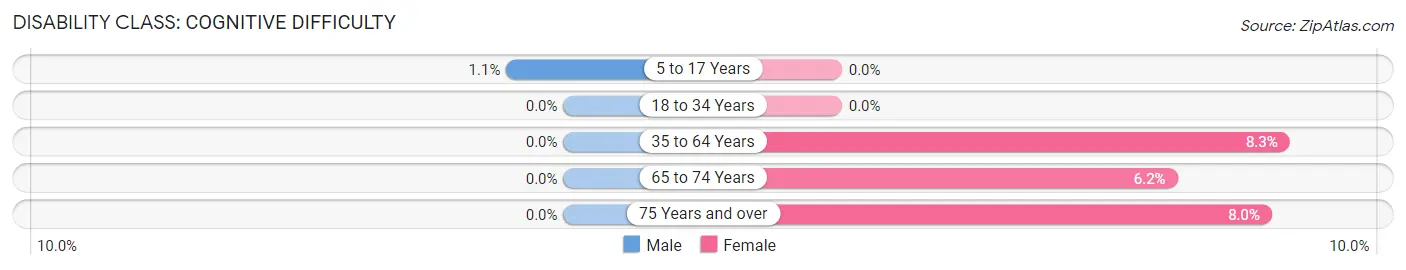
| Age Bracket | Male | Female |
| 5 to 17 Years | 6 (1.1%) | 0 (0.0%) |
| 18 to 34 Years | 0 (0.0%) | 0 (0.0%) |
| 35 to 64 Years | 0 (0.0%) | 67 (8.3%) |
| 65 to 74 Years | 0 (0.0%) | 16 (6.2%) |
| 75 Years and over | 0 (0.0%) | 13 (8.0%) |
Disability Class: Ambulatory Difficulty
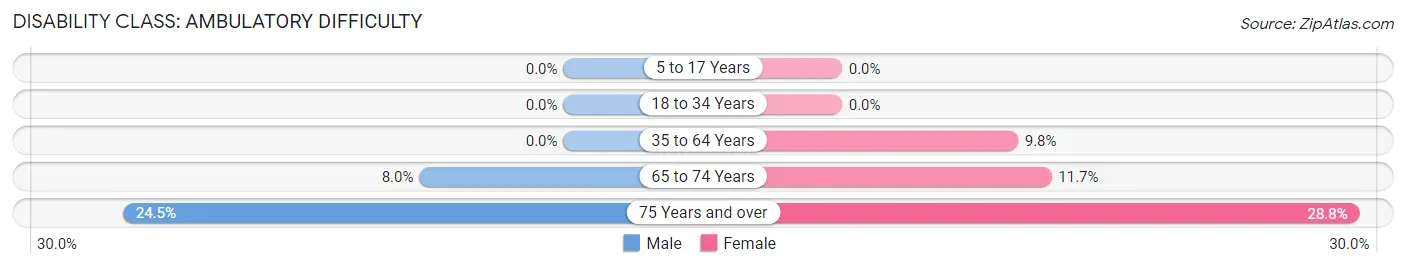
| Age Bracket | Male | Female |
| 5 to 17 Years | 0 (0.0%) | 0 (0.0%) |
| 18 to 34 Years | 0 (0.0%) | 0 (0.0%) |
| 35 to 64 Years | 0 (0.0%) | 79 (9.8%) |
| 65 to 74 Years | 13 (8.0%) | 30 (11.7%) |
| 75 Years and over | 39 (24.5%) | 47 (28.8%) |
Disability Class: Self-Care Difficulty
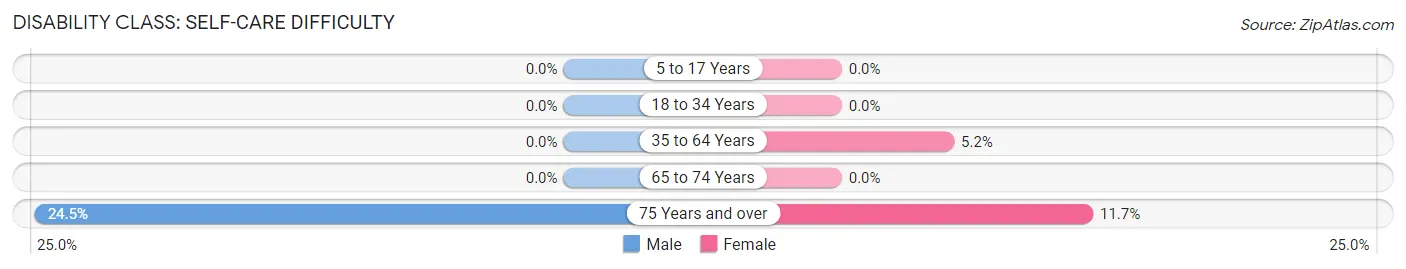
| Age Bracket | Male | Female |
| 5 to 17 Years | 0 (0.0%) | 0 (0.0%) |
| 18 to 34 Years | 0 (0.0%) | 0 (0.0%) |
| 35 to 64 Years | 0 (0.0%) | 42 (5.2%) |
| 65 to 74 Years | 0 (0.0%) | 0 (0.0%) |
| 75 Years and over | 39 (24.5%) | 19 (11.7%) |
Technology Access in Falmouth
Computing Device Access in Falmouth
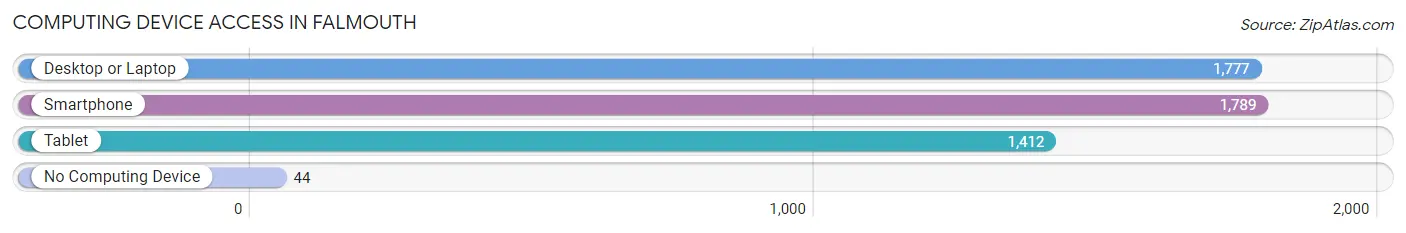
| Device Type | # Households | % Households |
| Desktop or Laptop | 1,777 | 91.9% |
| Smartphone | 1,789 | 92.5% |
| Tablet | 1,412 | 73.1% |
| No Computing Device | 44 | 2.3% |
| Total | 1,933 | 100.0% |
Internet Access in Falmouth
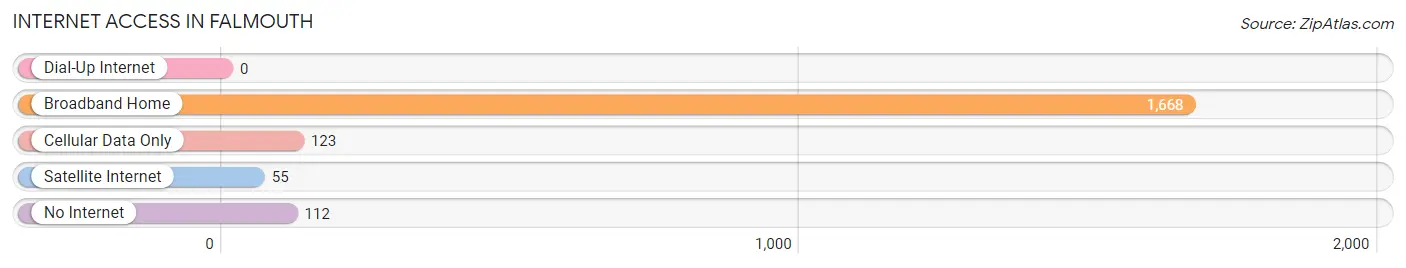
| Internet Type | # Households | % Households |
| Dial-Up Internet | 0 | 0.0% |
| Broadband Home | 1,668 | 86.3% |
| Cellular Data Only | 123 | 6.4% |
| Satellite Internet | 55 | 2.9% |
| No Internet | 112 | 5.8% |
| Total | 1,933 | 100.0% |
Falmouth Summary
Falmouth is a small town located in Stafford County, Virginia, United States. It is situated on the banks of the Rappahannock River, approximately 25 miles south of Washington, D.C. and 40 miles north of Richmond. The town is part of the Washington metropolitan area and is home to a population of approximately 4,000 people.
History
Falmouth was first settled in the early 1700s by English colonists. The town was originally known as "Ferrytown" due to its location on the Rappahannock River, which allowed for easy transportation of goods and people. In 1727, the town was officially incorporated as "Falmouth" in honor of the British port of Falmouth, Cornwall.
During the American Revolutionary War, Falmouth was a major port for the British Navy. The town was also the site of several battles, including the Battle of Fredericksburg in December 1862.
In the late 19th century, Falmouth experienced a period of growth and prosperity. The town was home to several factories, including a cotton mill, a paper mill, and a cannery. The town also had a thriving commercial district, with several stores, banks, and other businesses.
Geography
Falmouth is located in the northern part of Stafford County, Virginia. The town is situated on the banks of the Rappahannock River, approximately 25 miles south of Washington, D.C. and 40 miles north of Richmond. The town is part of the Washington metropolitan area and is home to a population of approximately 4,000 people.
The town is located in a rural area, with rolling hills and forests. The town is surrounded by several small towns and villages, including Fredericksburg, Spotsylvania, and Quantico.
Economy
The economy of Falmouth is largely based on tourism and retail. The town is home to several small businesses, including restaurants, shops, and galleries. The town also has a thriving agricultural industry, with several farms and wineries in the area.
The town is also home to several large employers, including the U.S. Marine Corps Base Quantico, the U.S. Army's Fort A.P. Hill, and the U.S. Navy's Dahlgren Naval Base.
Demographics
As of the 2010 census, the population of Falmouth was 4,094. The racial makeup of the town was 87.3% White, 8.2% African American, 0.7% Native American, 0.7% Asian, 0.1% Pacific Islander, 1.2% from other races, and 2.0% from two or more races. Hispanic or Latino of any race were 3.3% of the population.
The median household income in Falmouth was $60,938, and the median family income was $71,938. The per capita income for the town was $27,938. About 5.3% of families and 7.2% of the population were below the poverty line, including 8.3% of those under age 18 and 5.2% of those age 65 or over.
Common Questions
What is Per Capita Income in Falmouth?
Per Capita income in Falmouth is $57,406.
What is the Median Family Income in Falmouth?
Median Family Income in Falmouth is $153,884.
What is the Median Household income in Falmouth?
Median Household Income in Falmouth is $121,463.
What is Income or Wage Gap in Falmouth?
Income or Wage Gap in Falmouth is 48.6%.
Women in Falmouth earn 51.4 cents for every dollar earned by a man.
What is Inequality or Gini Index in Falmouth?
Inequality or Gini Index in Falmouth is 0.38.
What is the Total Population of Falmouth?
Total Population of Falmouth is 4,689.
What is the Total Male Population of Falmouth?
Total Male Population of Falmouth is 2,433.
What is the Total Female Population of Falmouth?
Total Female Population of Falmouth is 2,256.
What is the Ratio of Males per 100 Females in Falmouth?
There are 107.85 Males per 100 Females in Falmouth.
What is the Ratio of Females per 100 Males in Falmouth?
There are 92.73 Females per 100 Males in Falmouth.
What is the Median Population Age in Falmouth?
Median Population Age in Falmouth is 40.9 Years.
What is the Average Family Size in Falmouth
Average Family Size in Falmouth is 3.1 People.
What is the Average Household Size in Falmouth
Average Household Size in Falmouth is 2.4 People.
How Large is the Labor Force in Falmouth?
There are 2,512 People in the Labor Forcein in Falmouth.
What is the Percentage of People in the Labor Force in Falmouth?
67.9% of People are in the Labor Force in Falmouth.
What is the Unemployment Rate in Falmouth?
Unemployment Rate in Falmouth is 7.2%.