Pantops, VA Map & Demographics
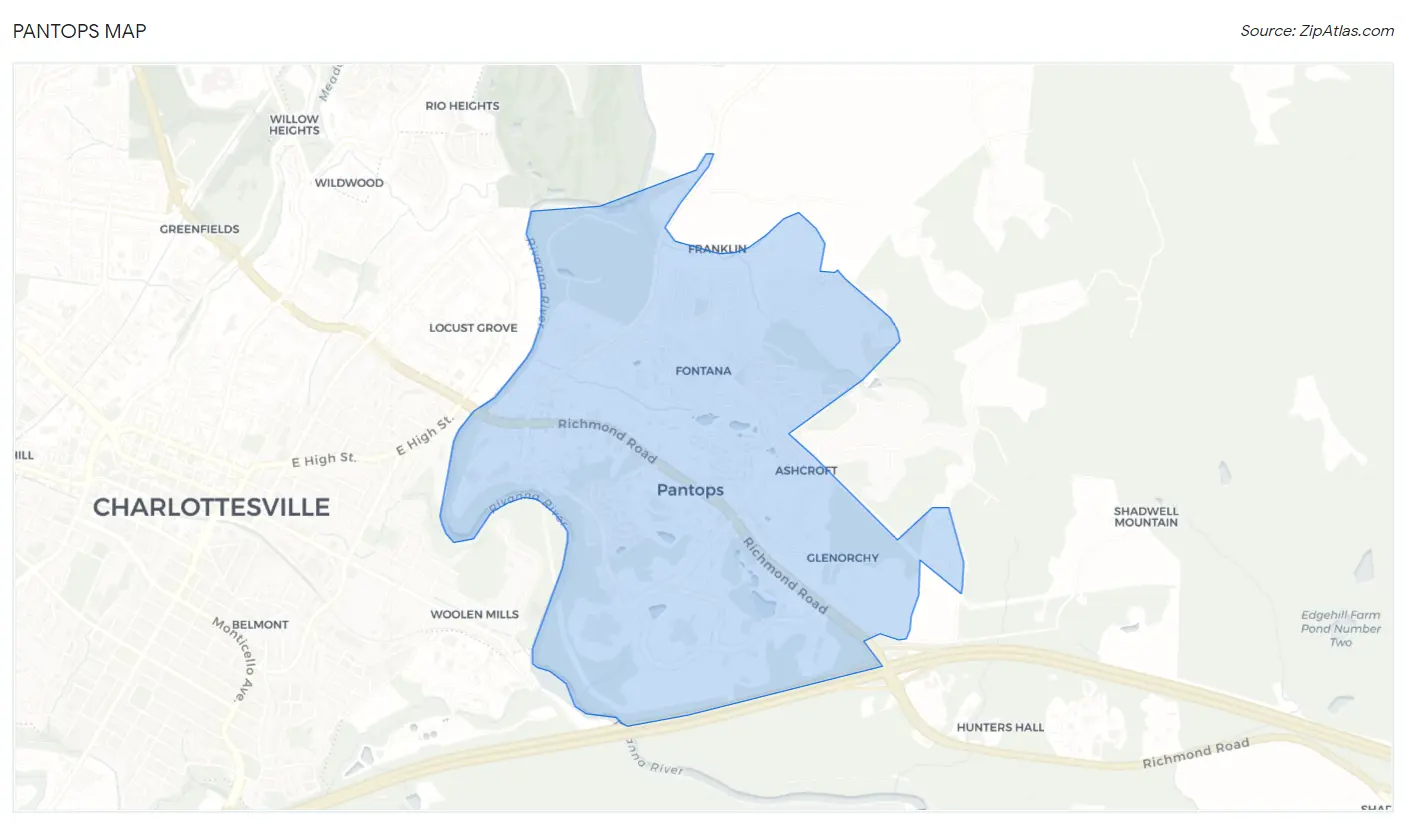
Pantops Map
Pantops Overview
$64,084
PER CAPITA INCOME
$121,830
AVG FAMILY INCOME
$87,417
AVG HOUSEHOLD INCOME
6.3%
WAGE / INCOME GAP [ % ]
93.7¢/ $1
WAGE / INCOME GAP [ $ ]
0.41
INEQUALITY / GINI INDEX
4,189
TOTAL POPULATION
1,833
MALE POPULATION
2,356
FEMALE POPULATION
77.80
MALES / 100 FEMALES
128.53
FEMALES / 100 MALES
42.0
MEDIAN AGE
2.5
AVG FAMILY SIZE
1.8
AVG HOUSEHOLD SIZE
2,301
LABOR FORCE [ PEOPLE ]
63.0%
PERCENT IN LABOR FORCE
3.1%
UNEMPLOYMENT RATE
Income in Pantops
Income Overview in Pantops
Per Capita Income in Pantops is $64,084, while median incomes of families and households are $121,830 and $87,417 respectively.
| Characteristic | Number | Measure |
| Per Capita Income | 4,189 | $64,084 |
| Median Family Income | 1,123 | $121,830 |
| Mean Family Income | 1,123 | $138,218 |
| Median Household Income | 2,310 | $87,417 |
| Mean Household Income | 2,310 | $116,784 |
| Income Deficit | 1,123 | $0 |
| Wage / Income Gap (%) | 4,189 | 6.26% |
| Wage / Income Gap ($) | 4,189 | 93.74¢ per $1 |
| Gini / Inequality Index | 4,189 | 0.41 |
Earnings by Sex in Pantops
Average Earnings in Pantops are $56,662, $58,750 for men and $55,071 for women, a difference of 6.3%.
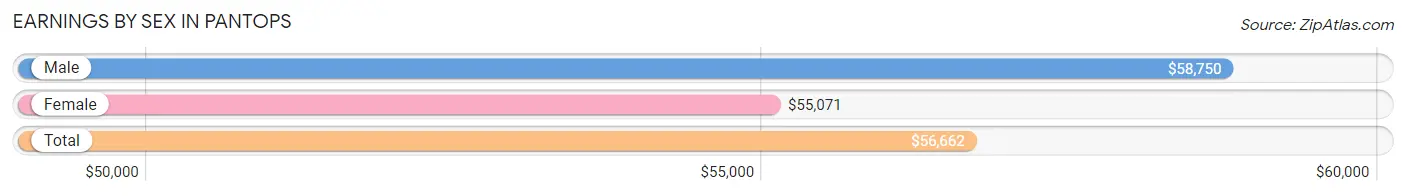
| Sex | Number | Average Earnings |
| Male | 1,071 (45.2%) | $58,750 |
| Female | 1,300 (54.8%) | $55,071 |
| Total | 2,371 (100.0%) | $56,662 |
Earnings by Sex by Income Bracket in Pantops
The most common earnings brackets in Pantops are $100,000+ for men (274 | 25.6%) and $75,000 to $99,999 for women (285 | 21.9%).
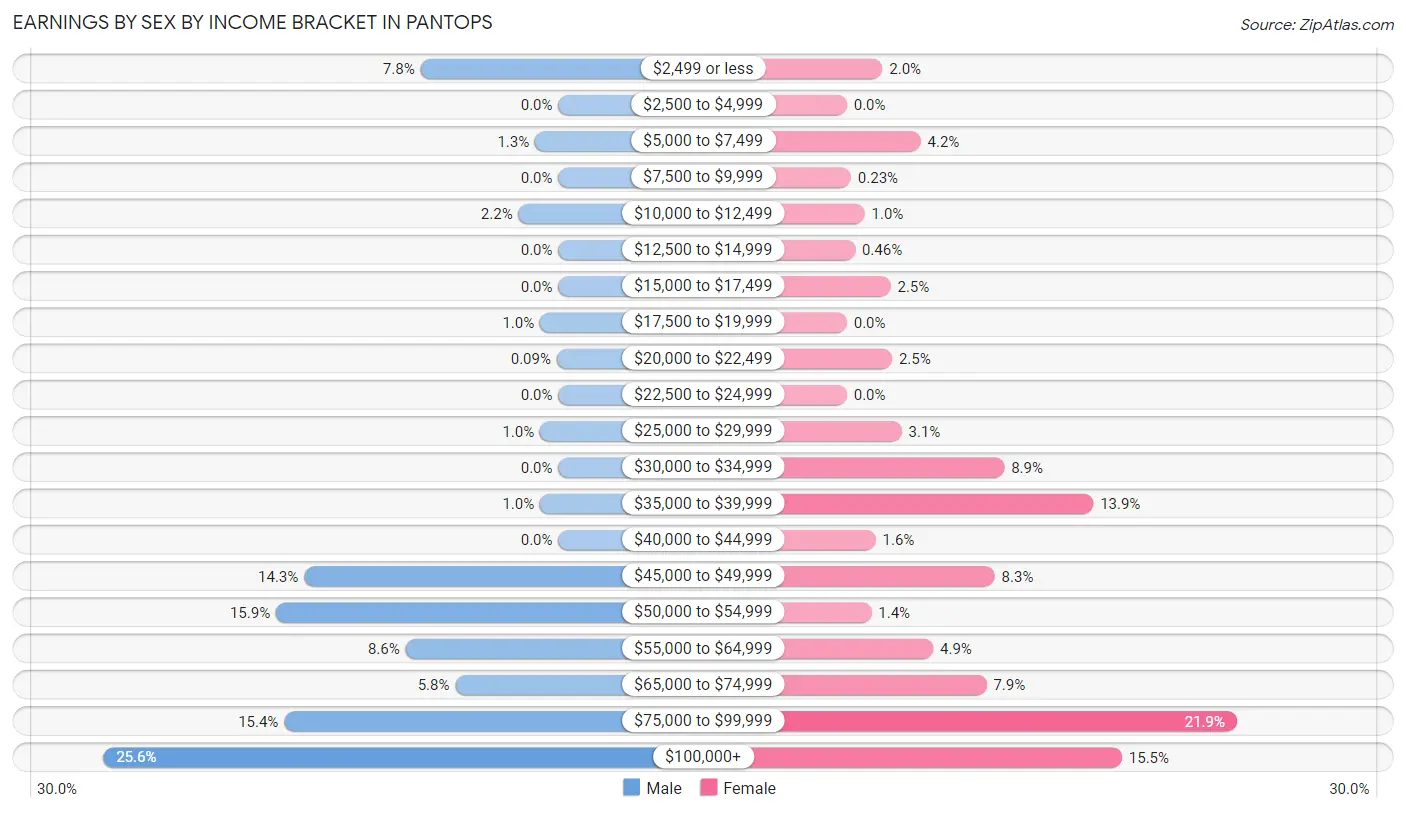
| Income | Male | Female |
| $2,499 or less | 83 (7.7%) | 26 (2.0%) |
| $2,500 to $4,999 | 0 (0.0%) | 0 (0.0%) |
| $5,000 to $7,499 | 14 (1.3%) | 54 (4.2%) |
| $7,500 to $9,999 | 0 (0.0%) | 3 (0.2%) |
| $10,000 to $12,499 | 24 (2.2%) | 13 (1.0%) |
| $12,500 to $14,999 | 0 (0.0%) | 6 (0.5%) |
| $15,000 to $17,499 | 0 (0.0%) | 32 (2.5%) |
| $17,500 to $19,999 | 11 (1.0%) | 0 (0.0%) |
| $20,000 to $22,499 | 1 (0.1%) | 33 (2.5%) |
| $22,500 to $24,999 | 0 (0.0%) | 0 (0.0%) |
| $25,000 to $29,999 | 11 (1.0%) | 40 (3.1%) |
| $30,000 to $34,999 | 0 (0.0%) | 115 (8.8%) |
| $35,000 to $39,999 | 11 (1.0%) | 180 (13.9%) |
| $40,000 to $44,999 | 0 (0.0%) | 21 (1.6%) |
| $45,000 to $49,999 | 153 (14.3%) | 108 (8.3%) |
| $50,000 to $54,999 | 170 (15.9%) | 18 (1.4%) |
| $55,000 to $64,999 | 92 (8.6%) | 63 (4.9%) |
| $65,000 to $74,999 | 62 (5.8%) | 102 (7.9%) |
| $75,000 to $99,999 | 165 (15.4%) | 285 (21.9%) |
| $100,000+ | 274 (25.6%) | 201 (15.5%) |
| Total | 1,071 (100.0%) | 1,300 (100.0%) |
Earnings by Sex by Educational Attainment in Pantops
Average earnings in Pantops are $64,542 for men and $56,679 for women, a difference of 12.2%. Men with an educational attainment of bachelor's degree enjoy the highest average annual earnings of $83,578, while those with high school diploma education earn the least with $50,742. Women with an educational attainment of bachelor's degree earn the most with the average annual earnings of $76,023, while those with high school diploma education have the smallest earnings of $35,951.
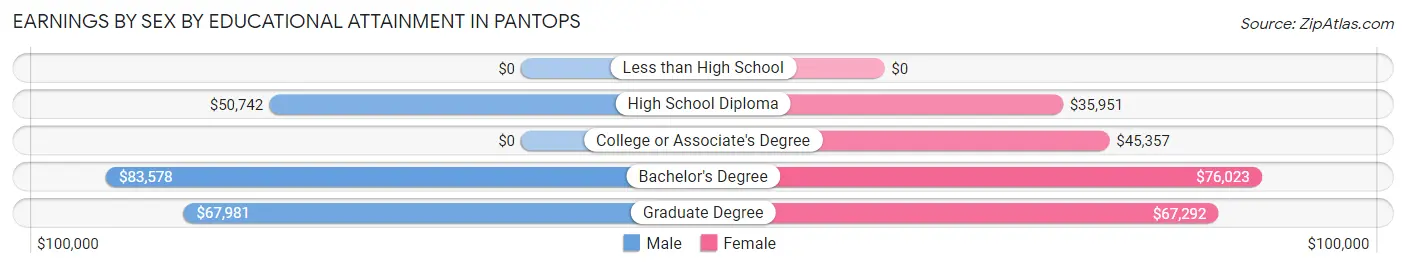
| Educational Attainment | Male Income | Female Income |
| Less than High School | - | - |
| High School Diploma | $50,742 | $35,951 |
| College or Associate's Degree | - | - |
| Bachelor's Degree | $83,578 | $76,023 |
| Graduate Degree | $67,981 | $67,292 |
| Total | $64,542 | $56,679 |
Family Income in Pantops
Family Income Brackets in Pantops
According to the Pantops family income data, there are 310 families falling into the $100,000 to $149,999 income range, which is the most common income bracket and makes up 27.6% of all families. Conversely, the $15,000 to $24,999 income bracket is the least frequent group with only 1 families (0.1%) belonging to this category.
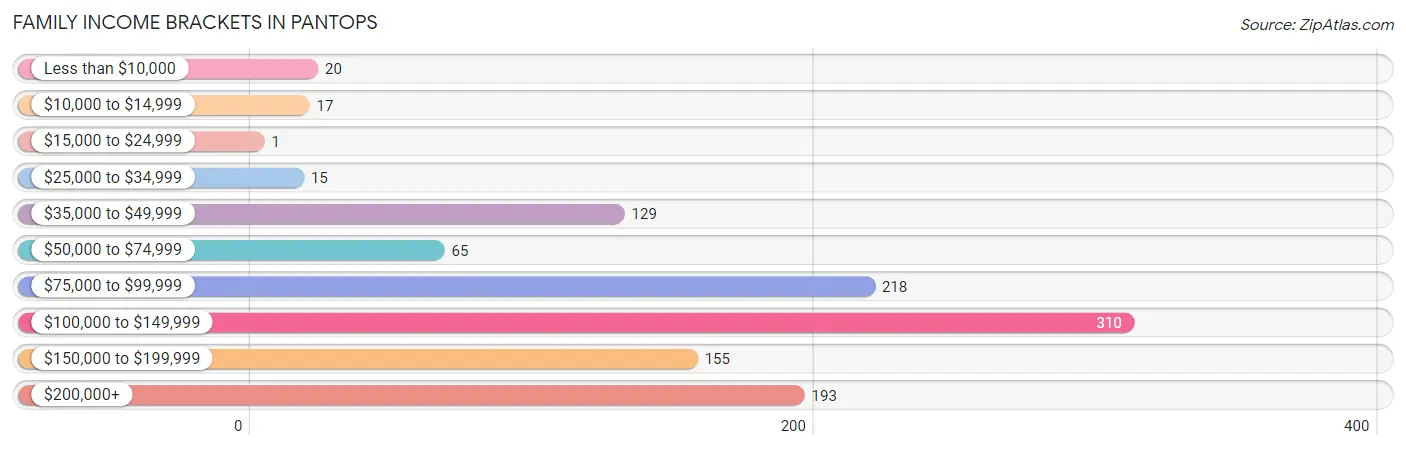
| Income Bracket | # Families | % Families |
| Less than $10,000 | 20 | 1.8% |
| $10,000 to $14,999 | 17 | 1.5% |
| $15,000 to $24,999 | 1 | 0.1% |
| $25,000 to $34,999 | 15 | 1.3% |
| $35,000 to $49,999 | 129 | 11.5% |
| $50,000 to $74,999 | 65 | 5.8% |
| $75,000 to $99,999 | 218 | 19.4% |
| $100,000 to $149,999 | 310 | 27.6% |
| $150,000 to $199,999 | 155 | 13.8% |
| $200,000+ | 193 | 17.2% |
Family Income by Famaliy Size in Pantops
4-person families (138 | 12.3%) account for the highest median family income in Pantops with $149,410 per family, while 3-person families (226 | 20.1%) have the highest median income of $44,583 per family member.
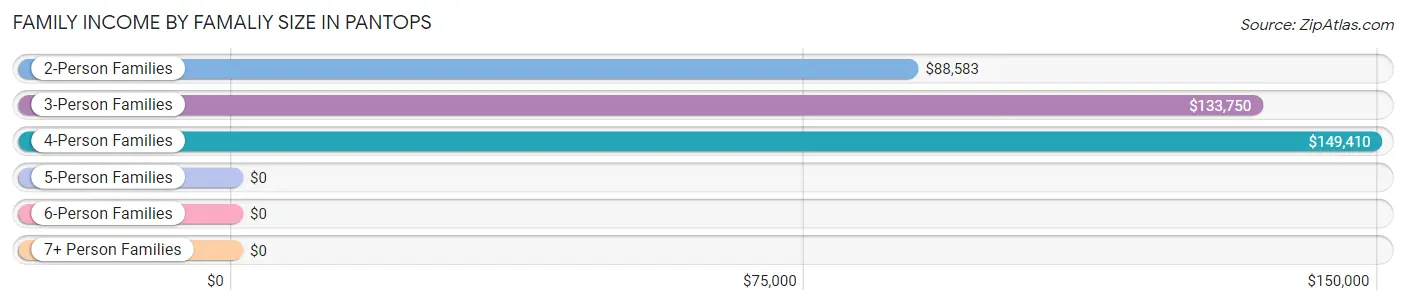
| Income Bracket | # Families | Median Income |
| 2-Person Families | 740 (65.9%) | $88,583 |
| 3-Person Families | 226 (20.1%) | $133,750 |
| 4-Person Families | 138 (12.3%) | $149,410 |
| 5-Person Families | 19 (1.7%) | $0 |
| 6-Person Families | 0 (0.0%) | $0 |
| 7+ Person Families | 0 (0.0%) | $0 |
| Total | 1,123 (100.0%) | $121,830 |
Family Income by Number of Earners in Pantops
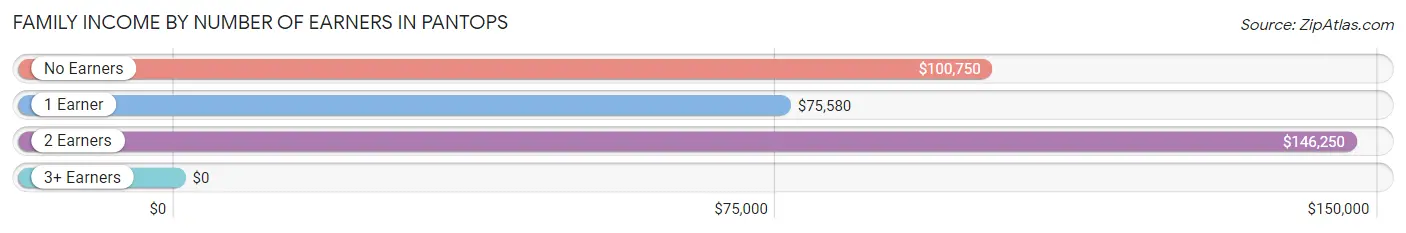
| Number of Earners | # Families | Median Income |
| No Earners | 154 (13.7%) | $100,750 |
| 1 Earner | 297 (26.5%) | $75,580 |
| 2 Earners | 653 (58.2%) | $146,250 |
| 3+ Earners | 19 (1.7%) | $0 |
| Total | 1,123 (100.0%) | $121,830 |
Household Income in Pantops
Household Income Brackets in Pantops
With 494 households falling in the category, the $100,000 to $149,999 income range is the most frequent in Pantops, accounting for 21.4% of all households. In contrast, only 16 households (0.7%) fall into the $10,000 to $14,999 income bracket, making it the least populous group.
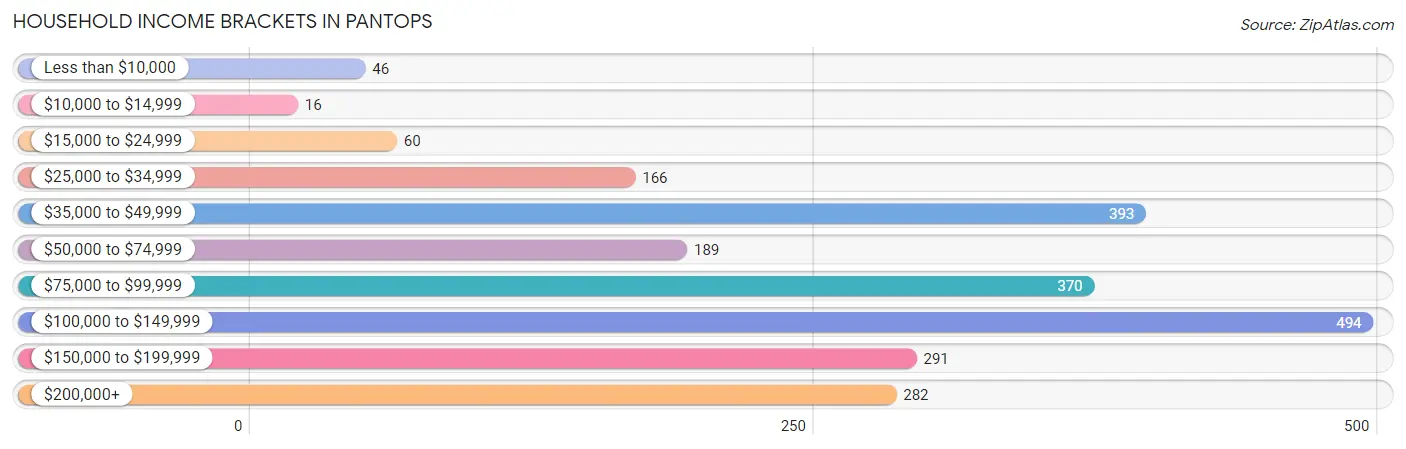
| Income Bracket | # Households | % Households |
| Less than $10,000 | 46 | 2.0% |
| $10,000 to $14,999 | 16 | 0.7% |
| $15,000 to $24,999 | 60 | 2.6% |
| $25,000 to $34,999 | 166 | 7.2% |
| $35,000 to $49,999 | 393 | 17.0% |
| $50,000 to $74,999 | 189 | 8.2% |
| $75,000 to $99,999 | 370 | 16.0% |
| $100,000 to $149,999 | 494 | 21.4% |
| $150,000 to $199,999 | 291 | 12.6% |
| $200,000+ | 282 | 12.2% |
Household Income by Householder Age in Pantops
The median household income in Pantops is $87,417, with the highest median household income of $121,033 found in the 25 to 44 years age bracket for the primary householder. A total of 721 households (31.2%) fall into this category. Meanwhile, the 15 to 24 years age bracket for the primary householder has the lowest median household income of $0, with 34 households (1.5%) in this group.
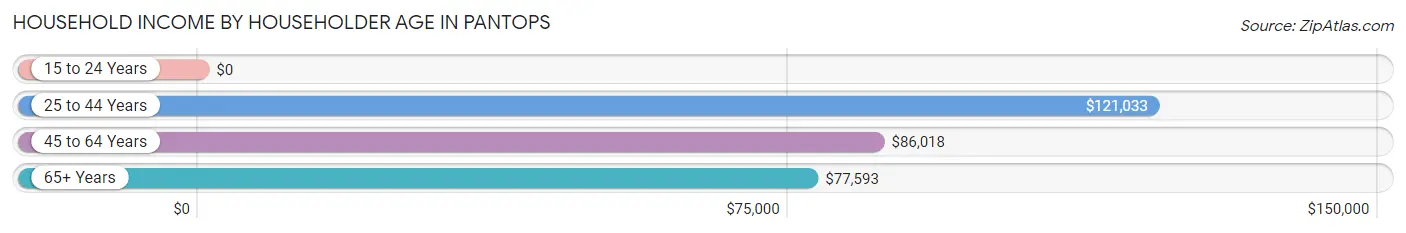
| Income Bracket | # Households | Median Income |
| 15 to 24 Years | 34 (1.5%) | $0 |
| 25 to 44 Years | 721 (31.2%) | $121,033 |
| 45 to 64 Years | 651 (28.2%) | $86,018 |
| 65+ Years | 904 (39.1%) | $77,593 |
| Total | 2,310 (100.0%) | $87,417 |
Poverty in Pantops
Income Below Poverty by Sex and Age in Pantops
With 2.8% poverty level for males and 1.8% for females among the residents of Pantops, 75 year old and over males and 18 to 24 year old females are the most vulnerable to poverty, with 18 males (12.4%) and 8 females (21.6%) in their respective age groups living below the poverty level.
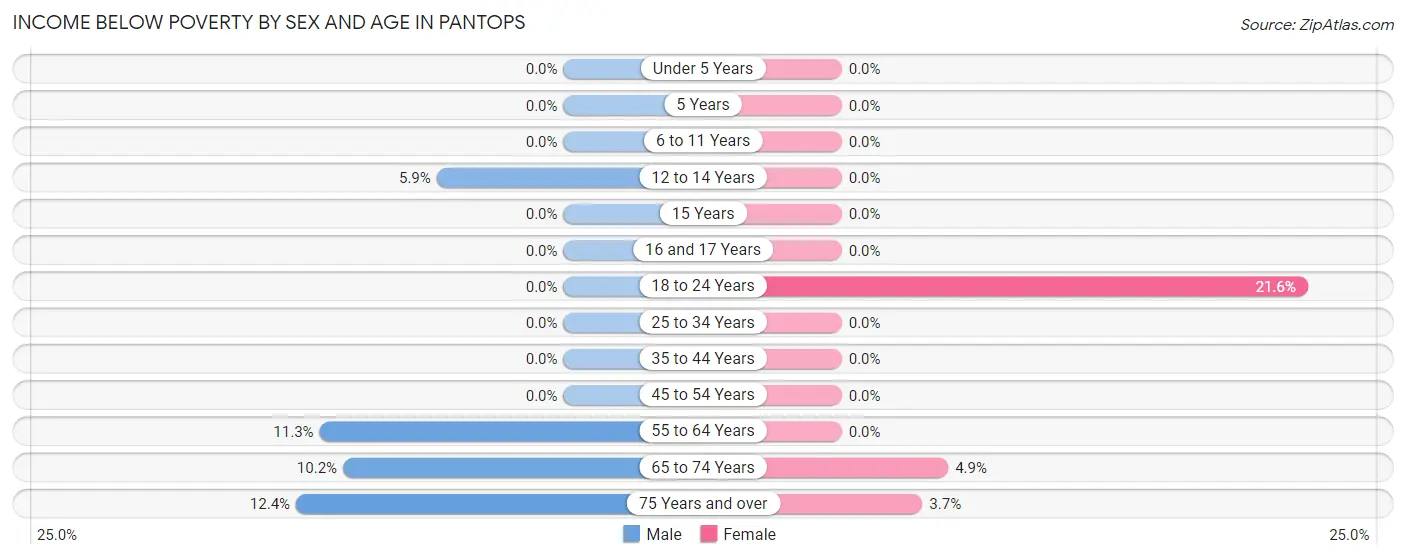
| Age Bracket | Male | Female |
| Under 5 Years | 0 (0.0%) | 0 (0.0%) |
| 5 Years | 0 (0.0%) | 0 (0.0%) |
| 6 to 11 Years | 0 (0.0%) | 0 (0.0%) |
| 12 to 14 Years | 2 (5.9%) | 0 (0.0%) |
| 15 Years | 0 (0.0%) | 0 (0.0%) |
| 16 and 17 Years | 0 (0.0%) | 0 (0.0%) |
| 18 to 24 Years | 0 (0.0%) | 8 (21.6%) |
| 25 to 34 Years | 0 (0.0%) | 0 (0.0%) |
| 35 to 44 Years | 0 (0.0%) | 0 (0.0%) |
| 45 to 54 Years | 0 (0.0%) | 0 (0.0%) |
| 55 to 64 Years | 12 (11.3%) | 0 (0.0%) |
| 65 to 74 Years | 18 (10.2%) | 17 (4.9%) |
| 75 Years and over | 18 (12.4%) | 17 (3.7%) |
| Total | 50 (2.8%) | 42 (1.8%) |
Income Above Poverty by Sex and Age in Pantops
According to the poverty statistics in Pantops, males aged under 5 years and females aged under 5 years are the age groups that are most secure financially, with 100.0% of males and 100.0% of females in these age groups living above the poverty line.
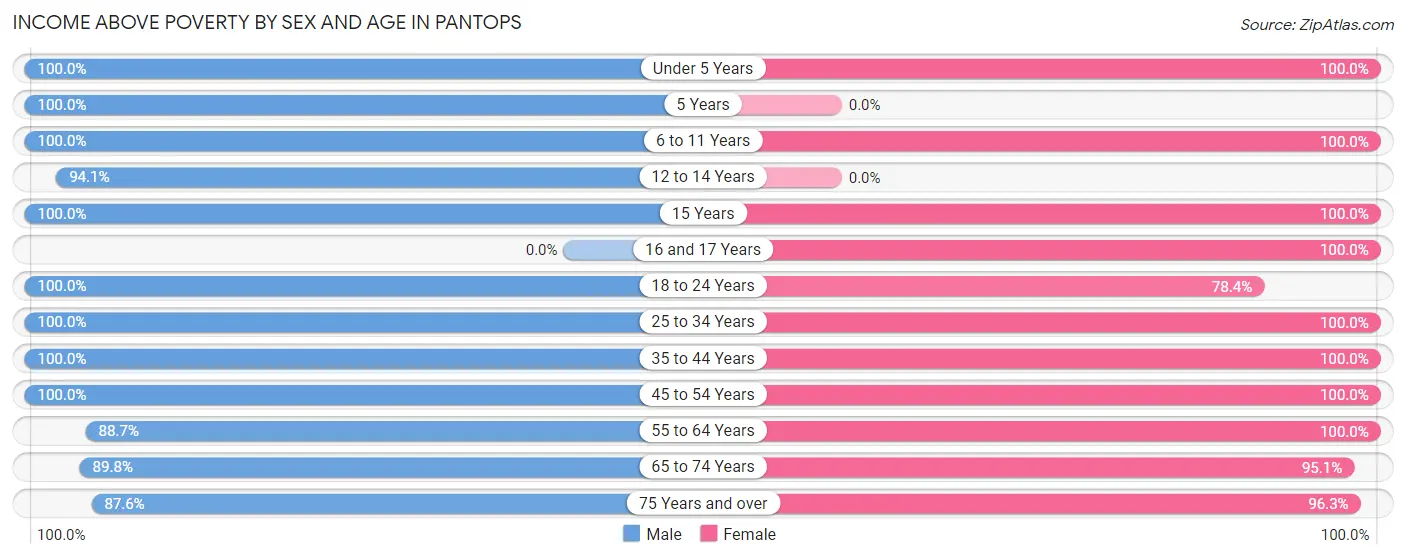
| Age Bracket | Male | Female |
| Under 5 Years | 159 (100.0%) | 69 (100.0%) |
| 5 Years | 21 (100.0%) | 0 (0.0%) |
| 6 to 11 Years | 49 (100.0%) | 184 (100.0%) |
| 12 to 14 Years | 32 (94.1%) | 0 (0.0%) |
| 15 Years | 12 (100.0%) | 9 (100.0%) |
| 16 and 17 Years | 0 (0.0%) | 104 (100.0%) |
| 18 to 24 Years | 102 (100.0%) | 29 (78.4%) |
| 25 to 34 Years | 396 (100.0%) | 386 (100.0%) |
| 35 to 44 Years | 378 (100.0%) | 186 (100.0%) |
| 45 to 54 Years | 231 (100.0%) | 473 (100.0%) |
| 55 to 64 Years | 94 (88.7%) | 82 (100.0%) |
| 65 to 74 Years | 158 (89.8%) | 327 (95.1%) |
| 75 Years and over | 127 (87.6%) | 437 (96.3%) |
| Total | 1,759 (97.2%) | 2,286 (98.2%) |
Income Below Poverty Among Married-Couple Families in Pantops
The poverty statistics for married-couple families in Pantops show that 2.8% or 25 of the total 887 families live below the poverty line. Families with no children have the highest poverty rate of 4.4%, comprising of 25 families. On the other hand, families with 1 or 2 children have the lowest poverty rate of 0.0%, which includes 0 families.
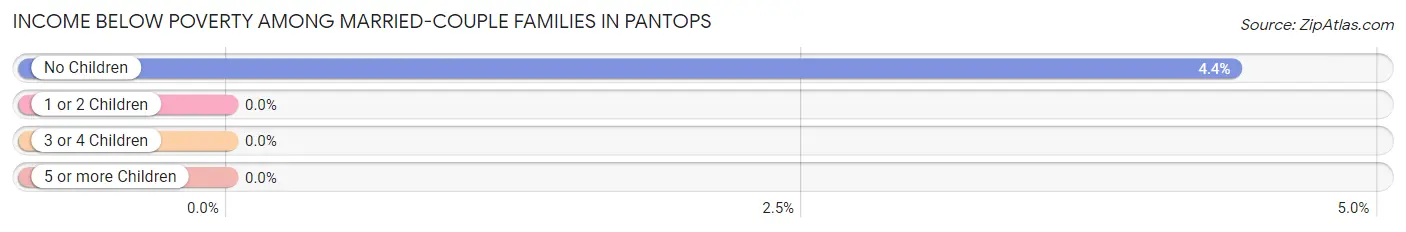
| Children | Above Poverty | Below Poverty |
| No Children | 547 (95.6%) | 25 (4.4%) |
| 1 or 2 Children | 304 (100.0%) | 0 (0.0%) |
| 3 or 4 Children | 11 (100.0%) | 0 (0.0%) |
| 5 or more Children | 0 (0.0%) | 0 (0.0%) |
| Total | 862 (97.2%) | 25 (2.8%) |
Income Below Poverty Among Single-Parent Households in Pantops
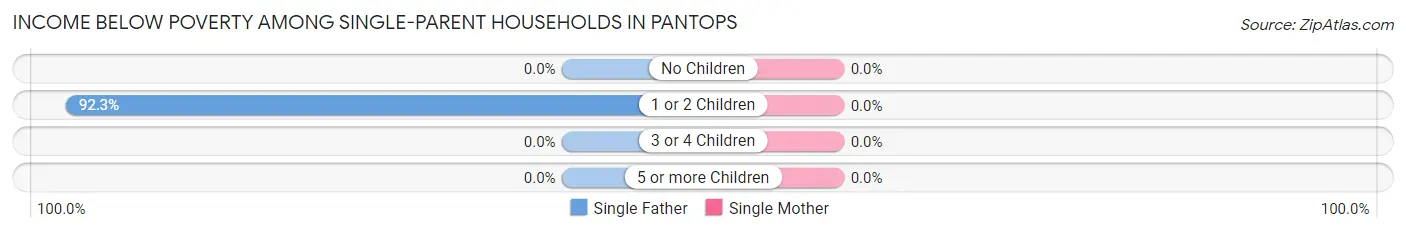
| Children | Single Father | Single Mother |
| No Children | 0 (0.0%) | 0 (0.0%) |
| 1 or 2 Children | 12 (92.3%) | 0 (0.0%) |
| 3 or 4 Children | 0 (0.0%) | 0 (0.0%) |
| 5 or more Children | 0 (0.0%) | 0 (0.0%) |
| Total | 12 (92.3%) | 0 (0.0%) |
Income Below Poverty Among Married-Couple vs Single-Parent Households in Pantops
The poverty data for Pantops shows that 25 of the married-couple family households (2.8%) and 12 of the single-parent households (5.1%) are living below the poverty level. Within the married-couple family households, those with no children have the highest poverty rate, with 25 households (4.4%) falling below the poverty line. Among the single-parent households, those with 1 or 2 children have the highest poverty rate, with 12 household (8.2%) living below poverty.
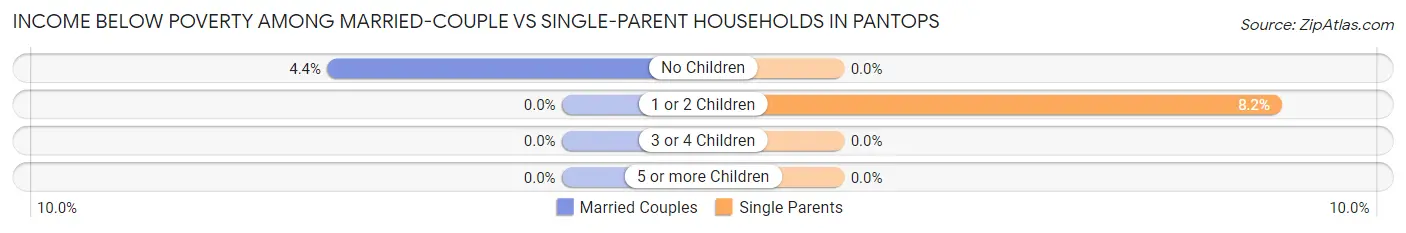
| Children | Married-Couple Families | Single-Parent Households |
| No Children | 25 (4.4%) | 0 (0.0%) |
| 1 or 2 Children | 0 (0.0%) | 12 (8.2%) |
| 3 or 4 Children | 0 (0.0%) | 0 (0.0%) |
| 5 or more Children | 0 (0.0%) | 0 (0.0%) |
| Total | 25 (2.8%) | 12 (5.1%) |
Race in Pantops
The most populous races in Pantops are White / Caucasian (2,933 | 70.0%), Black / African American (607 | 14.5%), and Asian (450 | 10.7%).
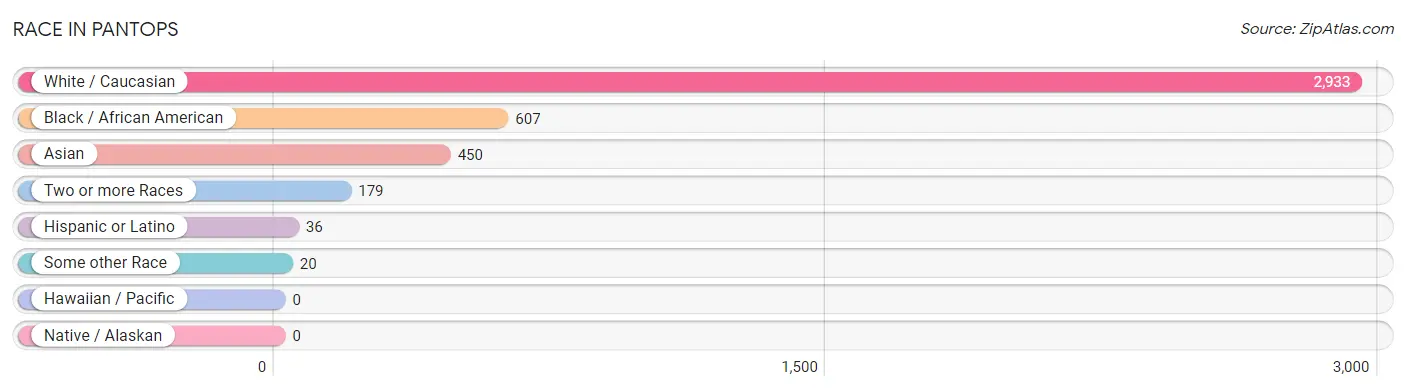
| Race | # Population | % Population |
| Asian | 450 | 10.7% |
| Black / African American | 607 | 14.5% |
| Hawaiian / Pacific | 0 | 0.0% |
| Hispanic or Latino | 36 | 0.9% |
| Native / Alaskan | 0 | 0.0% |
| White / Caucasian | 2,933 | 70.0% |
| Two or more Races | 179 | 4.3% |
| Some other Race | 20 | 0.5% |
| Total | 4,189 | 100.0% |
Ancestry in Pantops
The most populous ancestries reported in Pantops are English (791 | 18.9%), German (633 | 15.1%), Irish (422 | 10.1%), Thai (359 | 8.6%), and Polish (212 | 5.1%), together accounting for 57.7% of all Pantops residents.
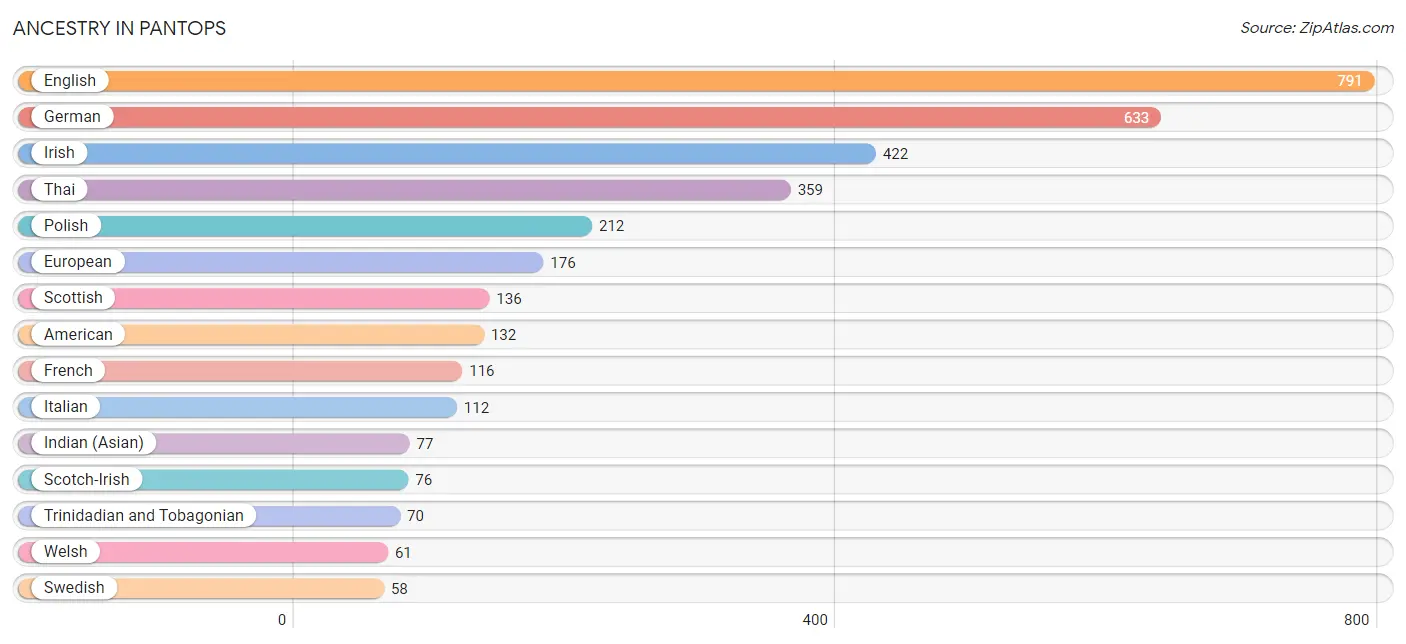
| Ancestry | # Population | % Population |
| African | 19 | 0.4% |
| American | 132 | 3.2% |
| Arab | 13 | 0.3% |
| Armenian | 2 | 0.1% |
| Bhutanese | 30 | 0.7% |
| British | 22 | 0.5% |
| Burmese | 56 | 1.3% |
| Danish | 24 | 0.6% |
| Dominican | 19 | 0.4% |
| Dutch | 40 | 0.9% |
| Eastern European | 20 | 0.5% |
| English | 791 | 18.9% |
| European | 176 | 4.2% |
| French | 116 | 2.8% |
| French Canadian | 55 | 1.3% |
| German | 633 | 15.1% |
| Indian (Asian) | 77 | 1.8% |
| Irish | 422 | 10.1% |
| Italian | 112 | 2.7% |
| Lithuanian | 12 | 0.3% |
| Northern European | 52 | 1.2% |
| Norwegian | 16 | 0.4% |
| Polish | 212 | 5.1% |
| Portuguese | 13 | 0.3% |
| Russian | 43 | 1.0% |
| Scotch-Irish | 76 | 1.8% |
| Scottish | 136 | 3.3% |
| Slavic | 10 | 0.2% |
| South American | 17 | 0.4% |
| Subsaharan African | 19 | 0.4% |
| Swedish | 58 | 1.4% |
| Swiss | 35 | 0.8% |
| Syrian | 13 | 0.3% |
| Thai | 359 | 8.6% |
| Trinidadian and Tobagonian | 70 | 1.7% |
| Ukrainian | 36 | 0.9% |
| Venezuelan | 17 | 0.4% |
| Welsh | 61 | 1.5% | View All 38 Rows |
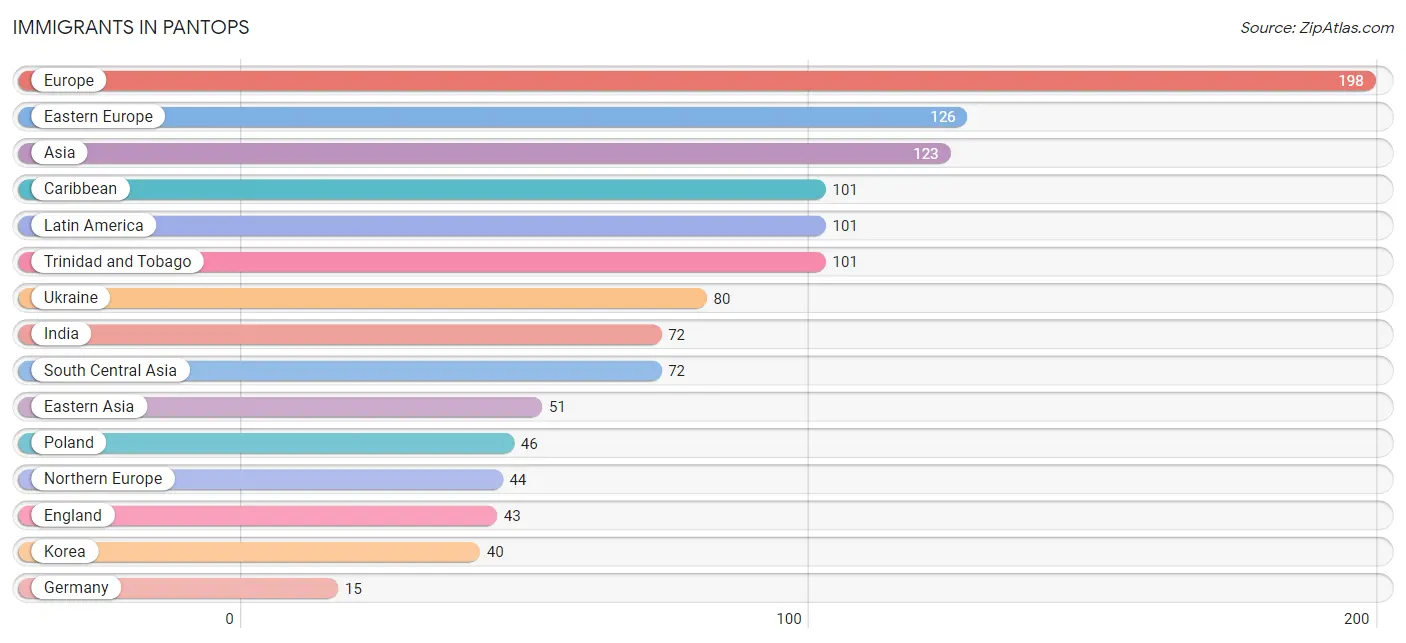
Immigrants in Pantops
The most numerous immigrant groups reported in Pantops came from Europe (198 | 4.7%), Eastern Europe (126 | 3.0%), Asia (123 | 2.9%), Caribbean (101 | 2.4%), and Latin America (101 | 2.4%), together accounting for 15.5% of all Pantops residents.
| Immigration Origin | # Population | % Population |
| Asia | 123 | 2.9% |
| Caribbean | 101 | 2.4% |
| China | 11 | 0.3% |
| Eastern Asia | 51 | 1.2% |
| Eastern Europe | 126 | 3.0% |
| England | 43 | 1.0% |
| Europe | 198 | 4.7% |
| Germany | 15 | 0.4% |
| India | 72 | 1.7% |
| Italy | 13 | 0.3% |
| Korea | 40 | 0.9% |
| Latin America | 101 | 2.4% |
| Northern Europe | 44 | 1.1% |
| Poland | 46 | 1.1% |
| South Central Asia | 72 | 1.7% |
| Southern Europe | 13 | 0.3% |
| Trinidad and Tobago | 101 | 2.4% |
| Ukraine | 80 | 1.9% |
| Western Europe | 15 | 0.4% | View All 19 Rows |
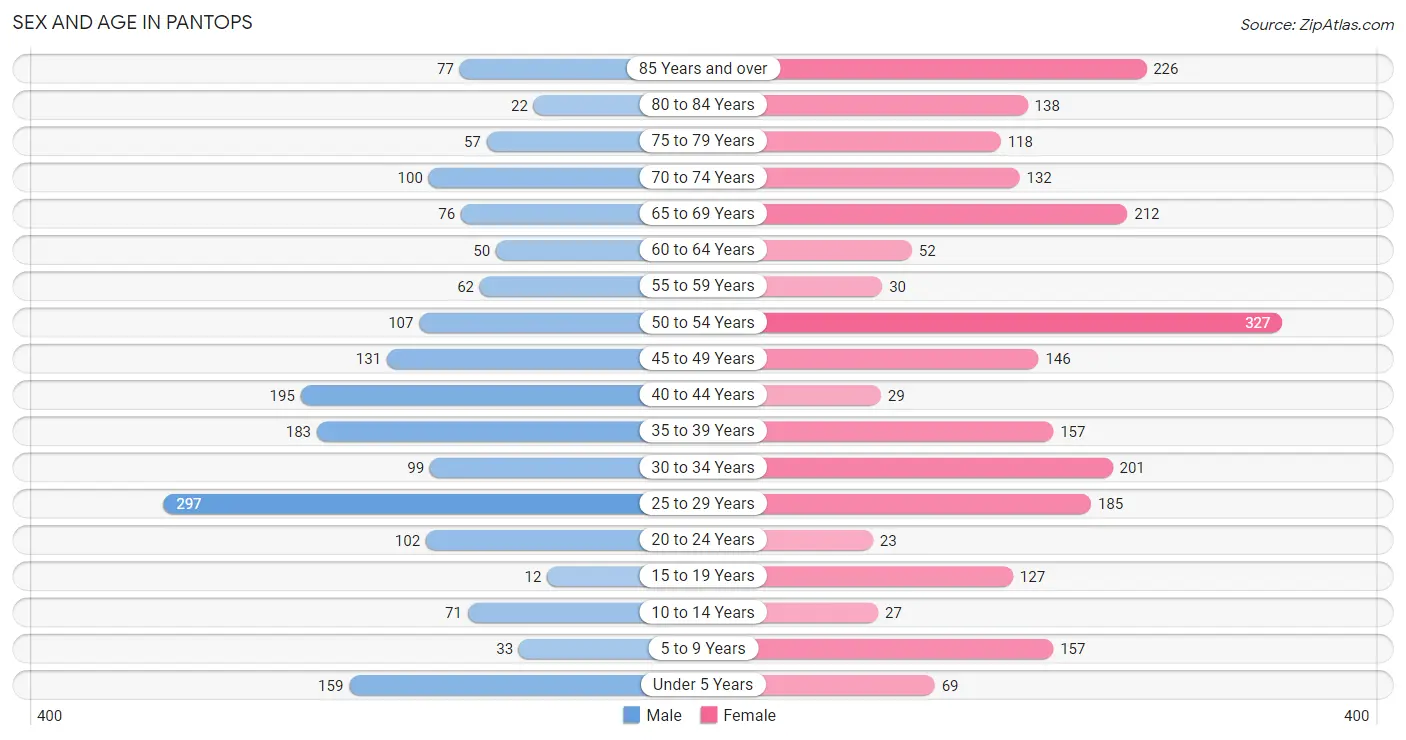
Sex and Age in Pantops
Sex and Age in Pantops
The most populous age groups in Pantops are 25 to 29 Years (297 | 16.2%) for men and 50 to 54 Years (327 | 13.9%) for women.
| Age Bracket | Male | Female |
| Under 5 Years | 159 (8.7%) | 69 (2.9%) |
| 5 to 9 Years | 33 (1.8%) | 157 (6.7%) |
| 10 to 14 Years | 71 (3.9%) | 27 (1.1%) |
| 15 to 19 Years | 12 (0.6%) | 127 (5.4%) |
| 20 to 24 Years | 102 (5.6%) | 23 (1.0%) |
| 25 to 29 Years | 297 (16.2%) | 185 (7.9%) |
| 30 to 34 Years | 99 (5.4%) | 201 (8.5%) |
| 35 to 39 Years | 183 (10.0%) | 157 (6.7%) |
| 40 to 44 Years | 195 (10.6%) | 29 (1.2%) |
| 45 to 49 Years | 131 (7.1%) | 146 (6.2%) |
| 50 to 54 Years | 107 (5.8%) | 327 (13.9%) |
| 55 to 59 Years | 62 (3.4%) | 30 (1.3%) |
| 60 to 64 Years | 50 (2.7%) | 52 (2.2%) |
| 65 to 69 Years | 76 (4.2%) | 212 (9.0%) |
| 70 to 74 Years | 100 (5.5%) | 132 (5.6%) |
| 75 to 79 Years | 57 (3.1%) | 118 (5.0%) |
| 80 to 84 Years | 22 (1.2%) | 138 (5.9%) |
| 85 Years and over | 77 (4.2%) | 226 (9.6%) |
| Total | 1,833 (100.0%) | 2,356 (100.0%) |
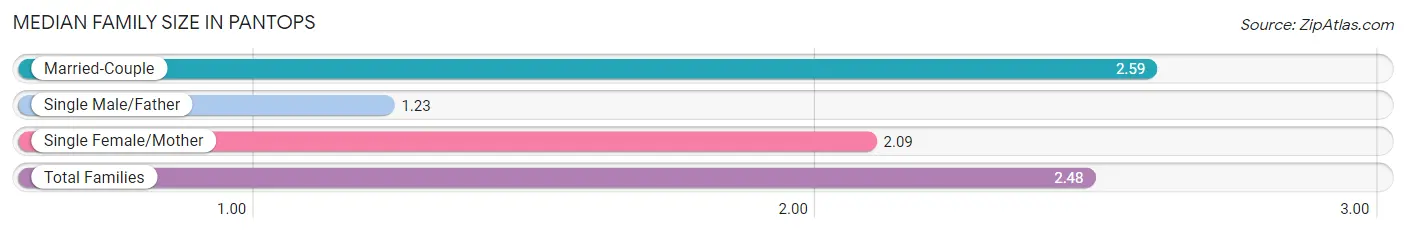
Families and Households in Pantops
Median Family Size in Pantops
The median family size in Pantops is 2.48 persons per family, with married-couple families (887 | 79.0%) accounting for the largest median family size of 2.59 persons per family. On the other hand, single male/father families (13 | 1.2%) represent the smallest median family size with 1.23 persons per family.
| Family Type | # Families | Family Size |
| Married-Couple | 887 (79.0%) | 2.59 |
| Single Male/Father | 13 (1.2%) | 1.23 |
| Single Female/Mother | 223 (19.9%) | 2.09 |
| Total Families | 1,123 (100.0%) | 2.48 |
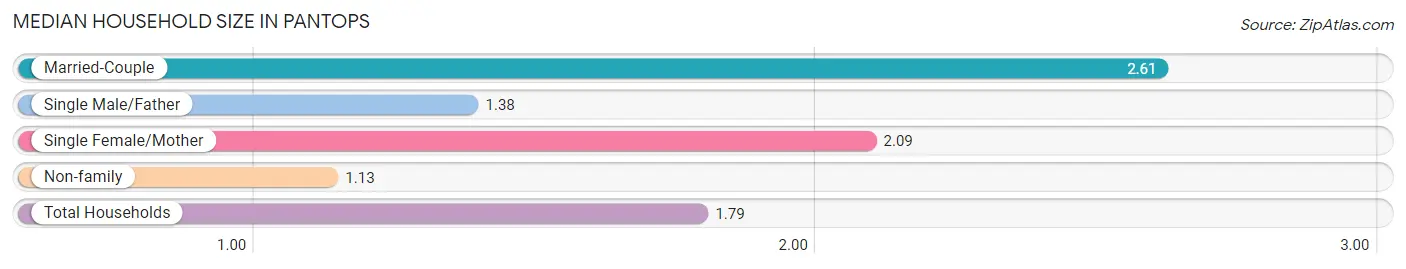
Median Household Size in Pantops
The median household size in Pantops is 1.79 persons per household, with married-couple households (887 | 38.4%) accounting for the largest median household size of 2.61 persons per household. non-family households (1,187 | 51.4%) represent the smallest median household size with 1.13 persons per household.
| Household Type | # Households | Household Size |
| Married-Couple | 887 (38.4%) | 2.61 |
| Single Male/Father | 13 (0.6%) | 1.38 |
| Single Female/Mother | 223 (9.7%) | 2.09 |
| Non-family | 1,187 (51.4%) | 1.13 |
| Total Households | 2,310 (100.0%) | 1.79 |
Household Size by Marriage Status in Pantops
Out of a total of 2,310 households in Pantops, 1,123 (48.6%) are family households, while 1,187 (51.4%) are nonfamily households. The most numerous type of family households are 2-person households, comprising 739, and the most common type of nonfamily households are 1-person households, comprising 1,037.
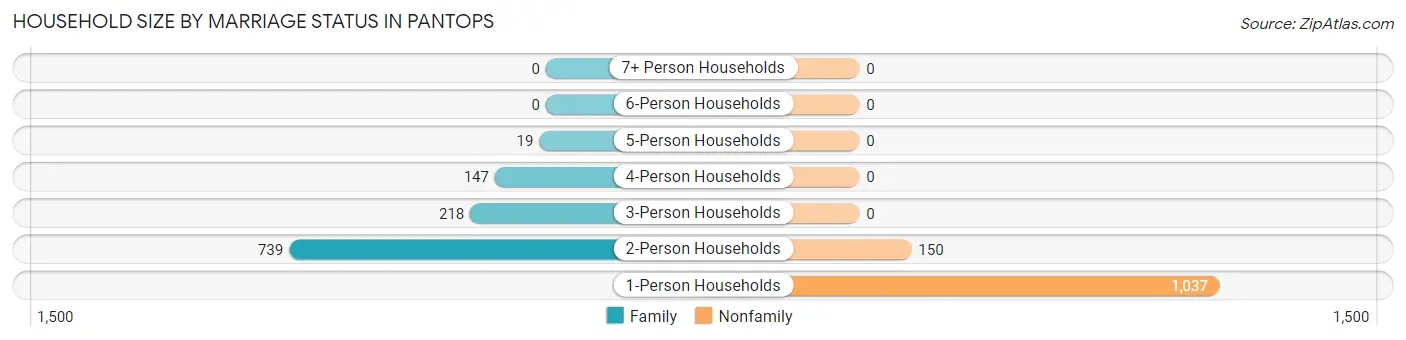
| Household Size | Family Households | Nonfamily Households |
| 1-Person Households | - | 1,037 (44.9%) |
| 2-Person Households | 739 (32.0%) | 150 (6.5%) |
| 3-Person Households | 218 (9.4%) | 0 (0.0%) |
| 4-Person Households | 147 (6.4%) | 0 (0.0%) |
| 5-Person Households | 19 (0.8%) | 0 (0.0%) |
| 6-Person Households | 0 (0.0%) | 0 (0.0%) |
| 7+ Person Households | 0 (0.0%) | 0 (0.0%) |
| Total | 1,123 (48.6%) | 1,187 (51.4%) |
Female Fertility in Pantops
Fertility by Age in Pantops
Average fertility rate in Pantops is 50.0 births per 1,000 women. Women in the age bracket of 20 to 34 years have the highest fertility rate with 71.0 births per 1,000 women. Women in the age bracket of 20 to 34 years acount for 65.9% of all women with births.
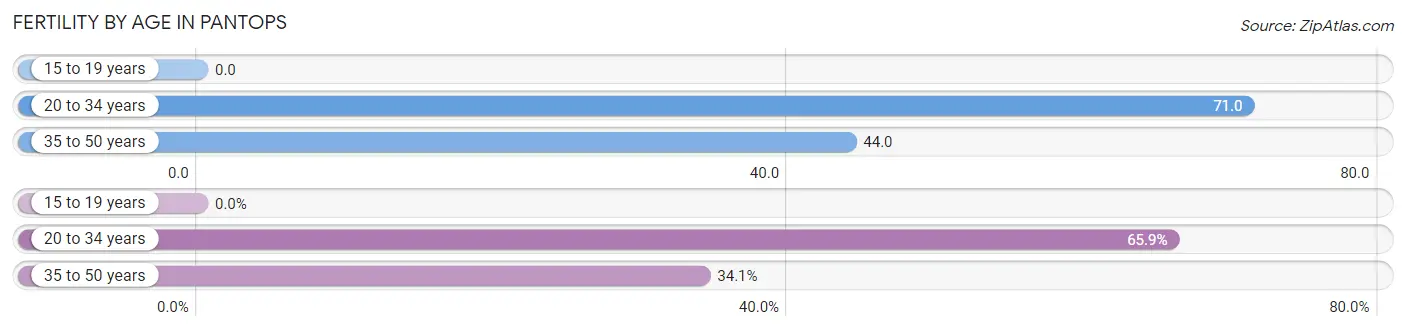
| Age Bracket | Women with Births | Births / 1,000 Women |
| 15 to 19 years | 0 (0.0%) | 0.0 |
| 20 to 34 years | 29 (65.9%) | 71.0 |
| 35 to 50 years | 15 (34.1%) | 44.0 |
| Total | 44 (100.0%) | 50.0 |
Fertility by Age by Marriage Status in Pantops
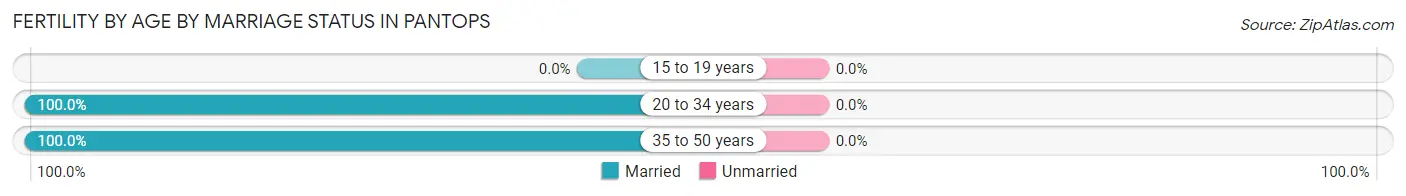
| Age Bracket | Married | Unmarried |
| 15 to 19 years | 0 (0.0%) | 0 (0.0%) |
| 20 to 34 years | 29 (100.0%) | 0 (0.0%) |
| 35 to 50 years | 15 (100.0%) | 0 (0.0%) |
| Total | 44 (100.0%) | 0 (0.0%) |
Fertility by Education in Pantops
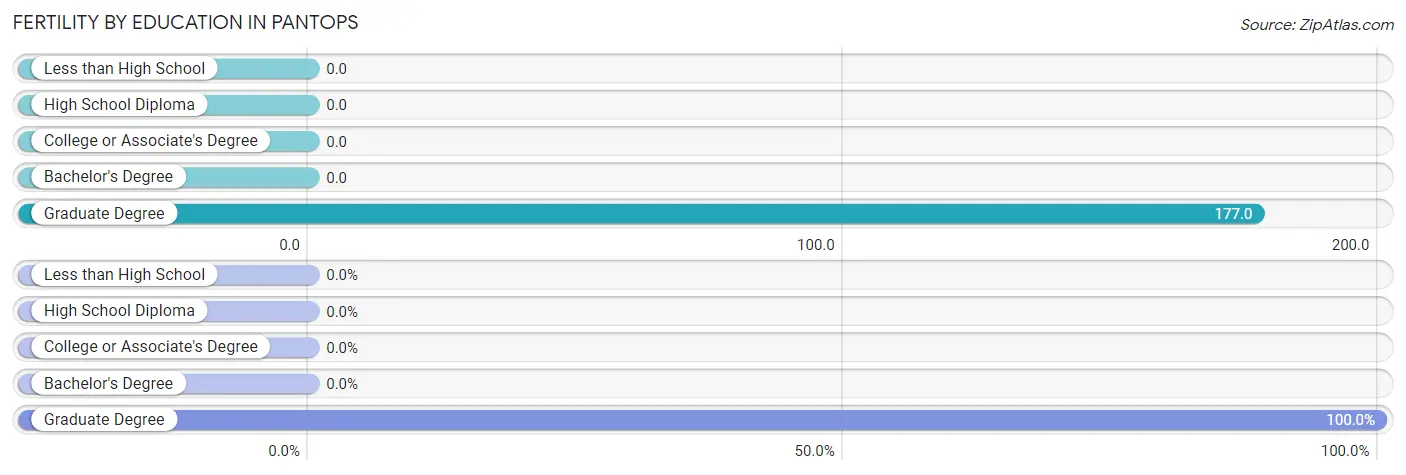
| Educational Attainment | Women with Births | Births / 1,000 Women |
| Less than High School | 0 (0.0%) | 0.0 |
| High School Diploma | 0 (0.0%) | 0.0 |
| College or Associate's Degree | 0 (0.0%) | 0.0 |
| Bachelor's Degree | 0 (0.0%) | 0.0 |
| Graduate Degree | 44 (100.0%) | 177.0 |
| Total | 44 (100.0%) | 50.0 |
Fertility by Education by Marriage Status in Pantops
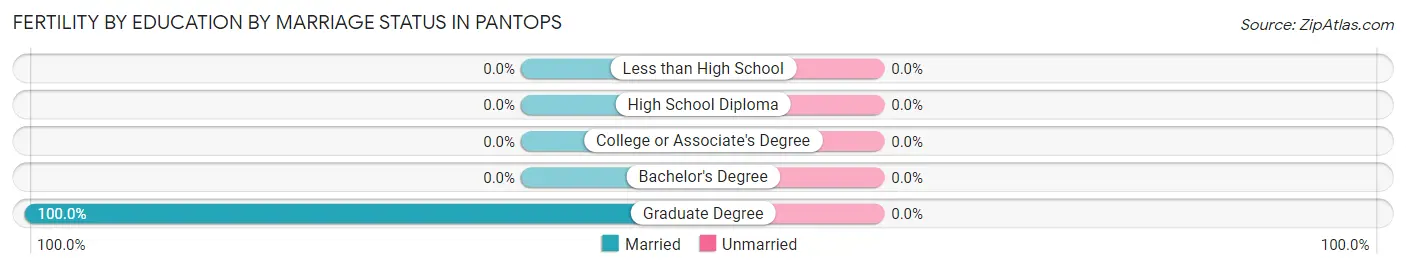
| Educational Attainment | Married | Unmarried |
| Less than High School | 0 (0.0%) | 0 (0.0%) |
| High School Diploma | 0 (0.0%) | 0 (0.0%) |
| College or Associate's Degree | 0 (0.0%) | 0 (0.0%) |
| Bachelor's Degree | 0 (0.0%) | 0 (0.0%) |
| Graduate Degree | 44 (100.0%) | 0 (0.0%) |
| Total | 44 (100.0%) | 0 (0.0%) |
Employment Characteristics in Pantops
Employment by Class of Employer in Pantops
Among the 2,229 employed individuals in Pantops, private company employees (1,361 | 61.1%), state government employees (353 | 15.8%), and not-for-profit organizations (191 | 8.6%) make up the most common classes of employment.
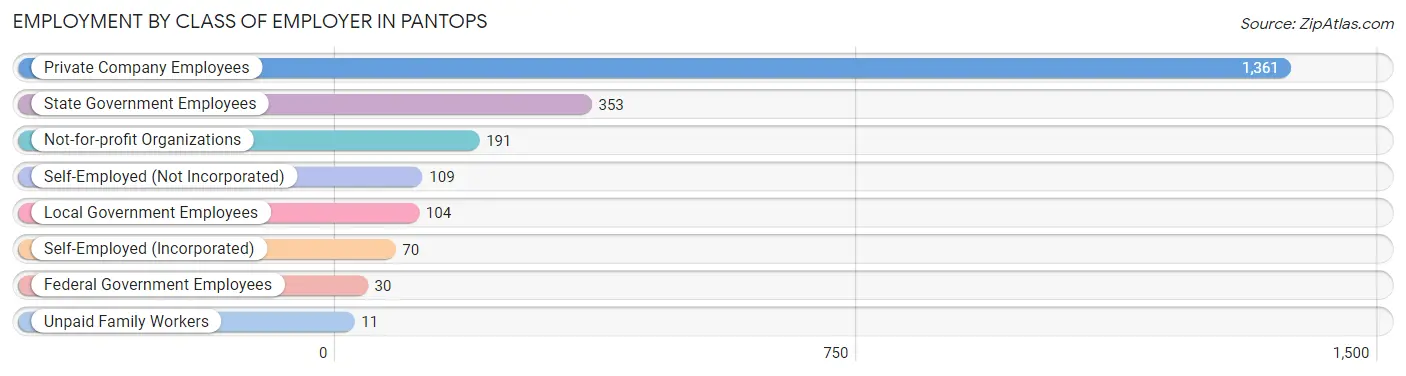
| Employer Class | # Employees | % Employees |
| Private Company Employees | 1,361 | 61.1% |
| Self-Employed (Incorporated) | 70 | 3.1% |
| Self-Employed (Not Incorporated) | 109 | 4.9% |
| Not-for-profit Organizations | 191 | 8.6% |
| Local Government Employees | 104 | 4.7% |
| State Government Employees | 353 | 15.8% |
| Federal Government Employees | 30 | 1.3% |
| Unpaid Family Workers | 11 | 0.5% |
| Total | 2,229 | 100.0% |
Employment Status by Age in Pantops
According to the labor force statistics for Pantops, out of the total population over 16 years of age (3,652), 63.0% or 2,301 individuals are in the labor force, with 3.1% or 71 of them unemployed. The age group with the highest labor force participation rate is 30 to 34 years, with 100.0% or 300 individuals in the labor force. Within the labor force, the 30 to 34 years age range has the highest percentage of unemployed individuals, with 15.3% or 46 of them being unemployed.
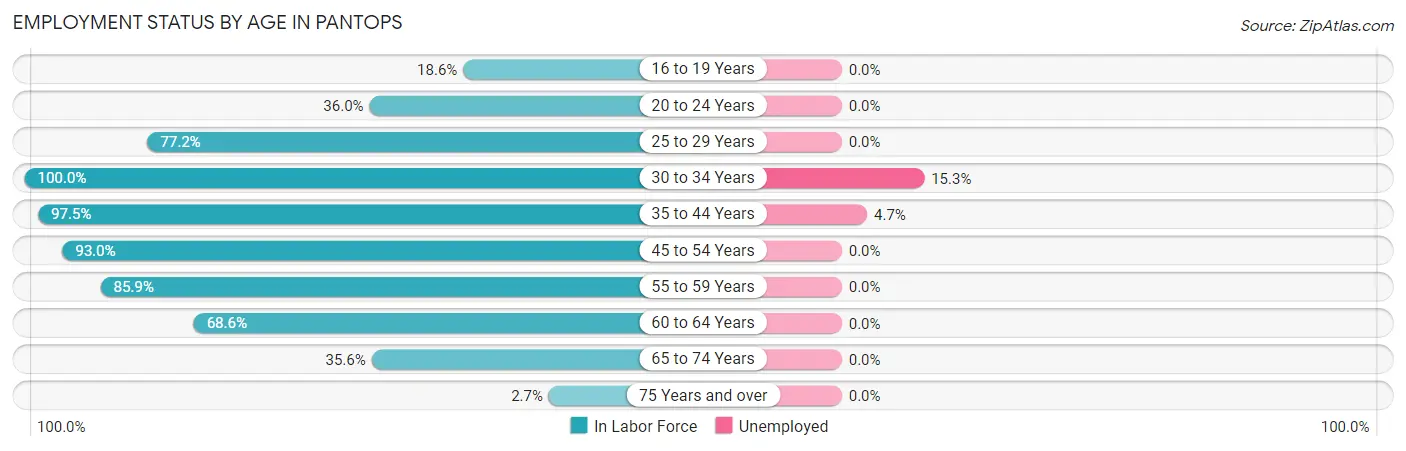
| Age Bracket | In Labor Force | Unemployed |
| 16 to 19 Years | 22 (18.6%) | 0 (0.0%) |
| 20 to 24 Years | 45 (36.0%) | 0 (0.0%) |
| 25 to 29 Years | 372 (77.2%) | 0 (0.0%) |
| 30 to 34 Years | 300 (100.0%) | 46 (15.3%) |
| 35 to 44 Years | 550 (97.5%) | 26 (4.7%) |
| 45 to 54 Years | 661 (93.0%) | 0 (0.0%) |
| 55 to 59 Years | 79 (85.9%) | 0 (0.0%) |
| 60 to 64 Years | 70 (68.6%) | 0 (0.0%) |
| 65 to 74 Years | 185 (35.6%) | 0 (0.0%) |
| 75 Years and over | 17 (2.7%) | 0 (0.0%) |
| Total | 2,301 (63.0%) | 71 (3.1%) |
Employment Status by Educational Attainment in Pantops
According to labor force statistics for Pantops, 90.3% of individuals (2,033) out of the total population between 25 and 64 years of age (2,251) are in the labor force, with 3.5% or 71 of them being unemployed. The group with the highest labor force participation rate are those with the educational attainment of bachelor's degree or higher, with 97.4% or 1,373 individuals in the labor force. Within the labor force, individuals with high school diploma education have the highest percentage of unemployment, with 15.9% or 46 of them being unemployed.
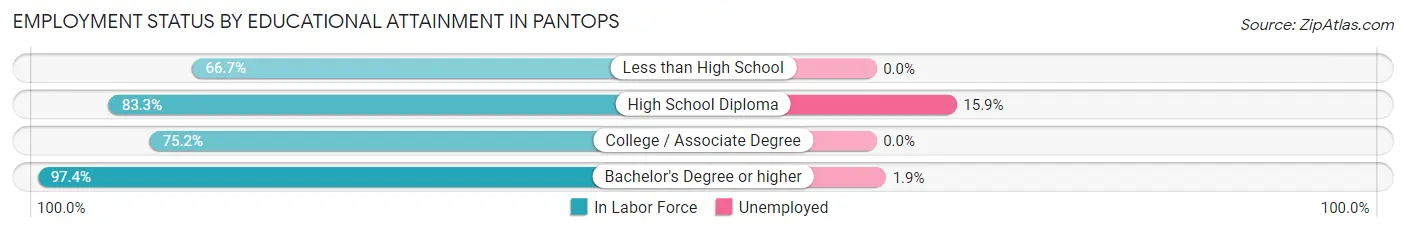
| Educational Attainment | In Labor Force | Unemployed |
| Less than High School | 12 (66.7%) | 0 (0.0%) |
| High School Diploma | 289 (83.3%) | 55 (15.9%) |
| College / Associate Degree | 358 (75.2%) | 0 (0.0%) |
| Bachelor's Degree or higher | 1,373 (97.4%) | 27 (1.9%) |
| Total | 2,033 (90.3%) | 79 (3.5%) |
Employment Occupations by Sex in Pantops
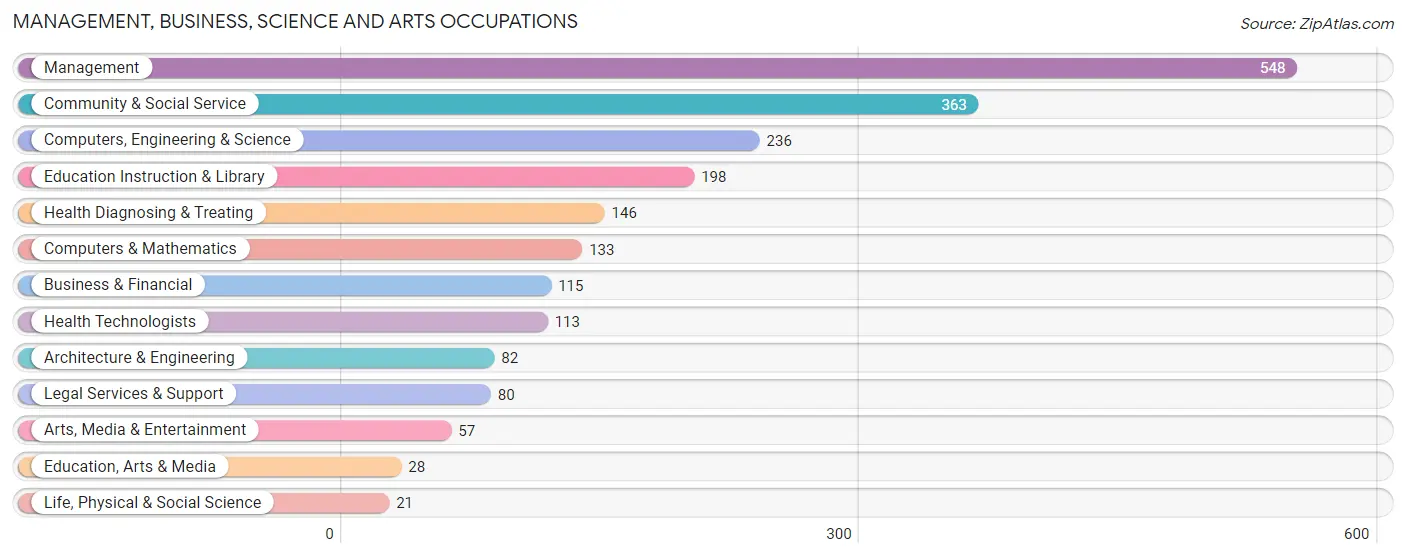
Management, Business, Science and Arts Occupations
The most common Management, Business, Science and Arts occupations in Pantops are Management (548 | 24.6%), Community & Social Service (363 | 16.3%), Computers, Engineering & Science (236 | 10.6%), Education Instruction & Library (198 | 8.9%), and Health Diagnosing & Treating (146 | 6.6%).
Management, Business, Science and Arts Occupations by Sex
Within the Management, Business, Science and Arts occupations in Pantops, the most male-oriented occupations are Life, Physical & Social Science (100.0%), Education, Arts & Media (100.0%), and Architecture & Engineering (90.2%), while the most female-oriented occupations are Health Diagnosing & Treating (100.0%), Health Technologists (100.0%), and Education Instruction & Library (82.3%).
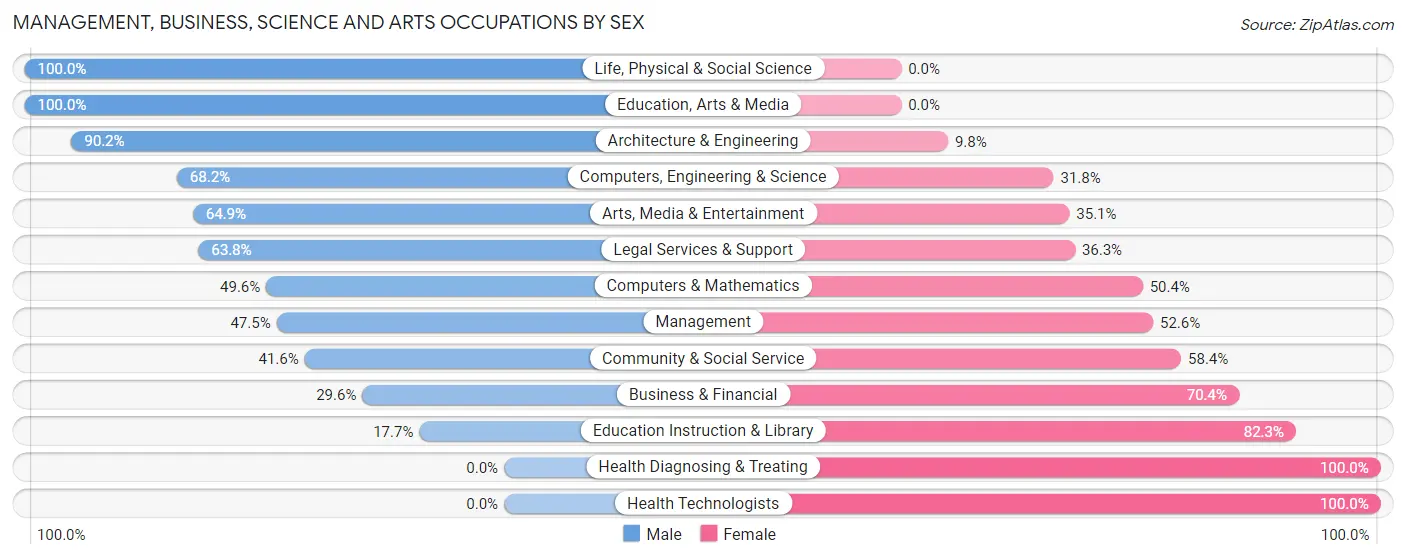
| Occupation | Male | Female |
| Management | 260 (47.4%) | 288 (52.5%) |
| Business & Financial | 34 (29.6%) | 81 (70.4%) |
| Computers, Engineering & Science | 161 (68.2%) | 75 (31.8%) |
| Computers & Mathematics | 66 (49.6%) | 67 (50.4%) |
| Architecture & Engineering | 74 (90.2%) | 8 (9.8%) |
| Life, Physical & Social Science | 21 (100.0%) | 0 (0.0%) |
| Community & Social Service | 151 (41.6%) | 212 (58.4%) |
| Education, Arts & Media | 28 (100.0%) | 0 (0.0%) |
| Legal Services & Support | 51 (63.7%) | 29 (36.2%) |
| Education Instruction & Library | 35 (17.7%) | 163 (82.3%) |
| Arts, Media & Entertainment | 37 (64.9%) | 20 (35.1%) |
| Health Diagnosing & Treating | 0 (0.0%) | 146 (100.0%) |
| Health Technologists | 0 (0.0%) | 113 (100.0%) |
| Total (Category) | 606 (43.0%) | 802 (57.0%) |
| Total (Overall) | 1,035 (46.4%) | 1,194 (53.6%) |
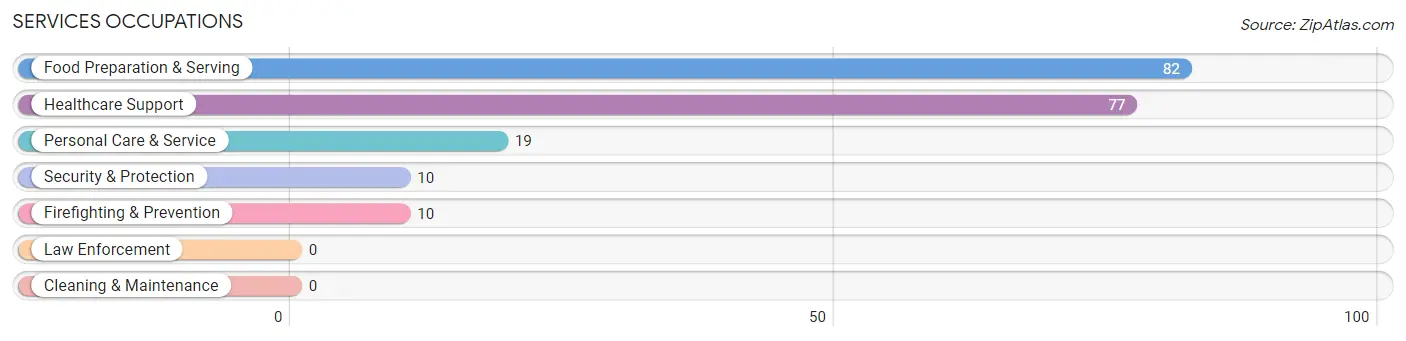
Services Occupations
The most common Services occupations in Pantops are Food Preparation & Serving (82 | 3.7%), Healthcare Support (77 | 3.5%), Personal Care & Service (19 | 0.9%), Security & Protection (10 | 0.4%), and Firefighting & Prevention (10 | 0.4%).
Services Occupations by Sex
Within the Services occupations in Pantops, the most male-oriented occupations are Security & Protection (100.0%), Firefighting & Prevention (100.0%), and Food Preparation & Serving (73.2%), while the most female-oriented occupations are Healthcare Support (100.0%), Personal Care & Service (100.0%), and Food Preparation & Serving (26.8%).
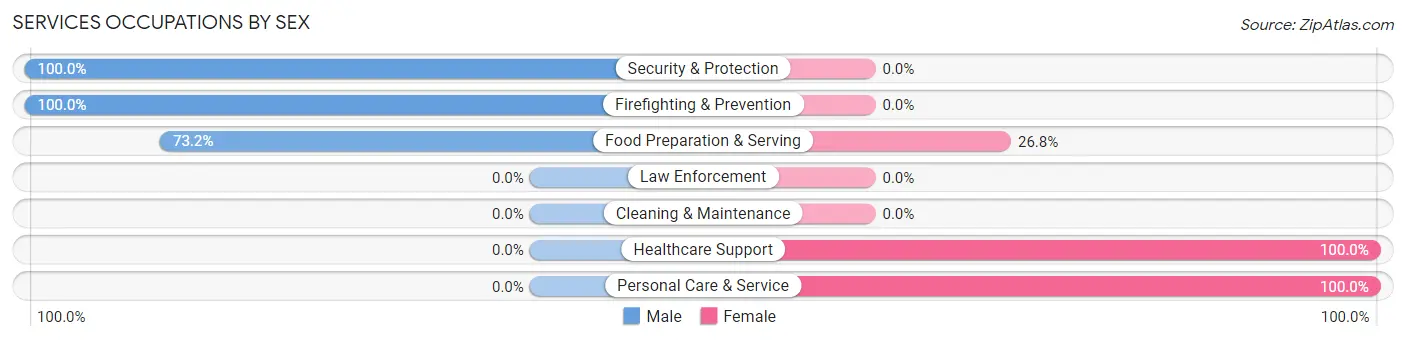
| Occupation | Male | Female |
| Healthcare Support | 0 (0.0%) | 77 (100.0%) |
| Security & Protection | 10 (100.0%) | 0 (0.0%) |
| Firefighting & Prevention | 10 (100.0%) | 0 (0.0%) |
| Law Enforcement | 0 (0.0%) | 0 (0.0%) |
| Food Preparation & Serving | 60 (73.2%) | 22 (26.8%) |
| Cleaning & Maintenance | 0 (0.0%) | 0 (0.0%) |
| Personal Care & Service | 0 (0.0%) | 19 (100.0%) |
| Total (Category) | 70 (37.2%) | 118 (62.8%) |
| Total (Overall) | 1,035 (46.4%) | 1,194 (53.6%) |
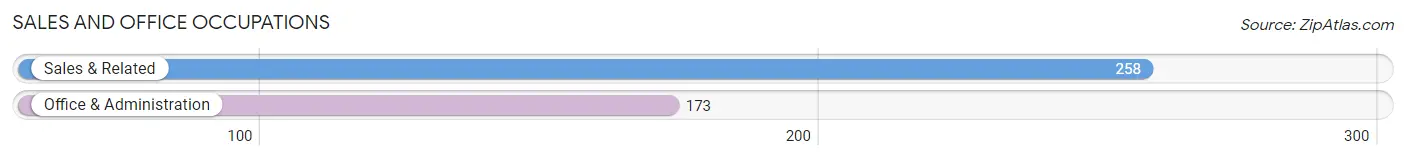
Sales and Office Occupations
The most common Sales and Office occupations in Pantops are Sales & Related (258 | 11.6%), and Office & Administration (173 | 7.8%).
Sales and Office Occupations by Sex
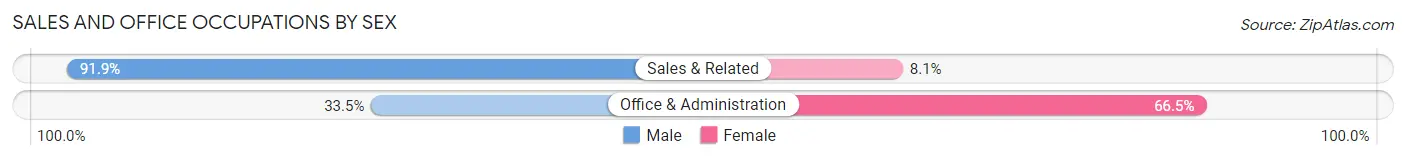
| Occupation | Male | Female |
| Sales & Related | 237 (91.9%) | 21 (8.1%) |
| Office & Administration | 58 (33.5%) | 115 (66.5%) |
| Total (Category) | 295 (68.4%) | 136 (31.6%) |
| Total (Overall) | 1,035 (46.4%) | 1,194 (53.6%) |
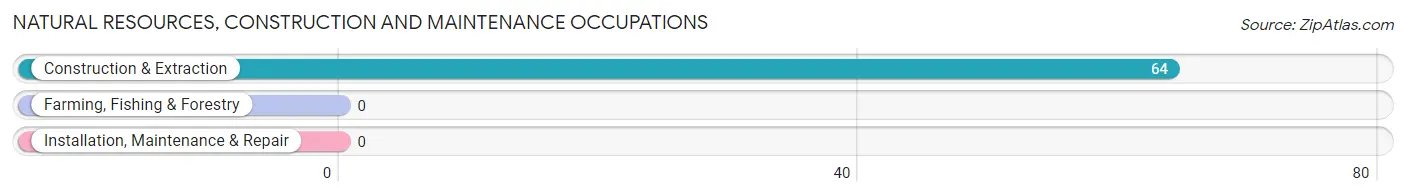
Natural Resources, Construction and Maintenance Occupations
The most common Natural Resources, Construction and Maintenance occupations in Pantops are , and Construction & Extraction (64 | 2.9%).
Natural Resources, Construction and Maintenance Occupations by Sex
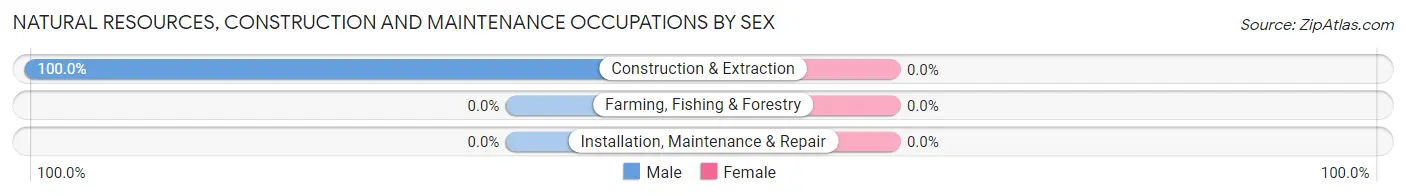
| Occupation | Male | Female |
| Farming, Fishing & Forestry | 0 (0.0%) | 0 (0.0%) |
| Construction & Extraction | 64 (100.0%) | 0 (0.0%) |
| Installation, Maintenance & Repair | 0 (0.0%) | 0 (0.0%) |
| Total (Category) | 64 (100.0%) | 0 (0.0%) |
| Total (Overall) | 1,035 (46.4%) | 1,194 (53.6%) |
Production, Transportation and Moving Occupations
The most common Production, Transportation and Moving occupations in Pantops are Material Moving (75 | 3.4%), and Production (63 | 2.8%).
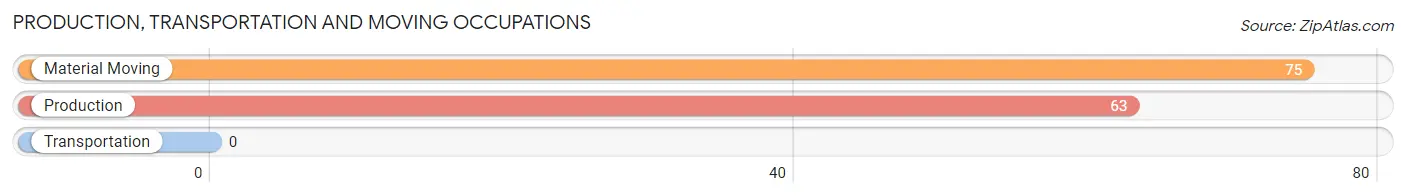
Production, Transportation and Moving Occupations by Sex
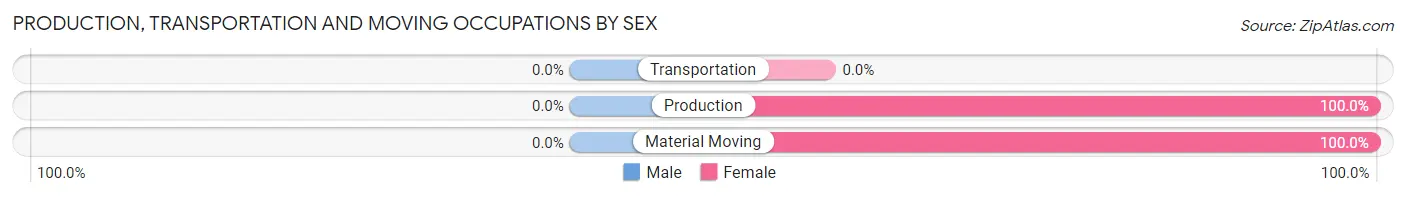
| Occupation | Male | Female |
| Production | 0 (0.0%) | 63 (100.0%) |
| Transportation | 0 (0.0%) | 0 (0.0%) |
| Material Moving | 0 (0.0%) | 75 (100.0%) |
| Total (Category) | 0 (0.0%) | 138 (100.0%) |
| Total (Overall) | 1,035 (46.4%) | 1,194 (53.6%) |
Employment Industries by Sex in Pantops
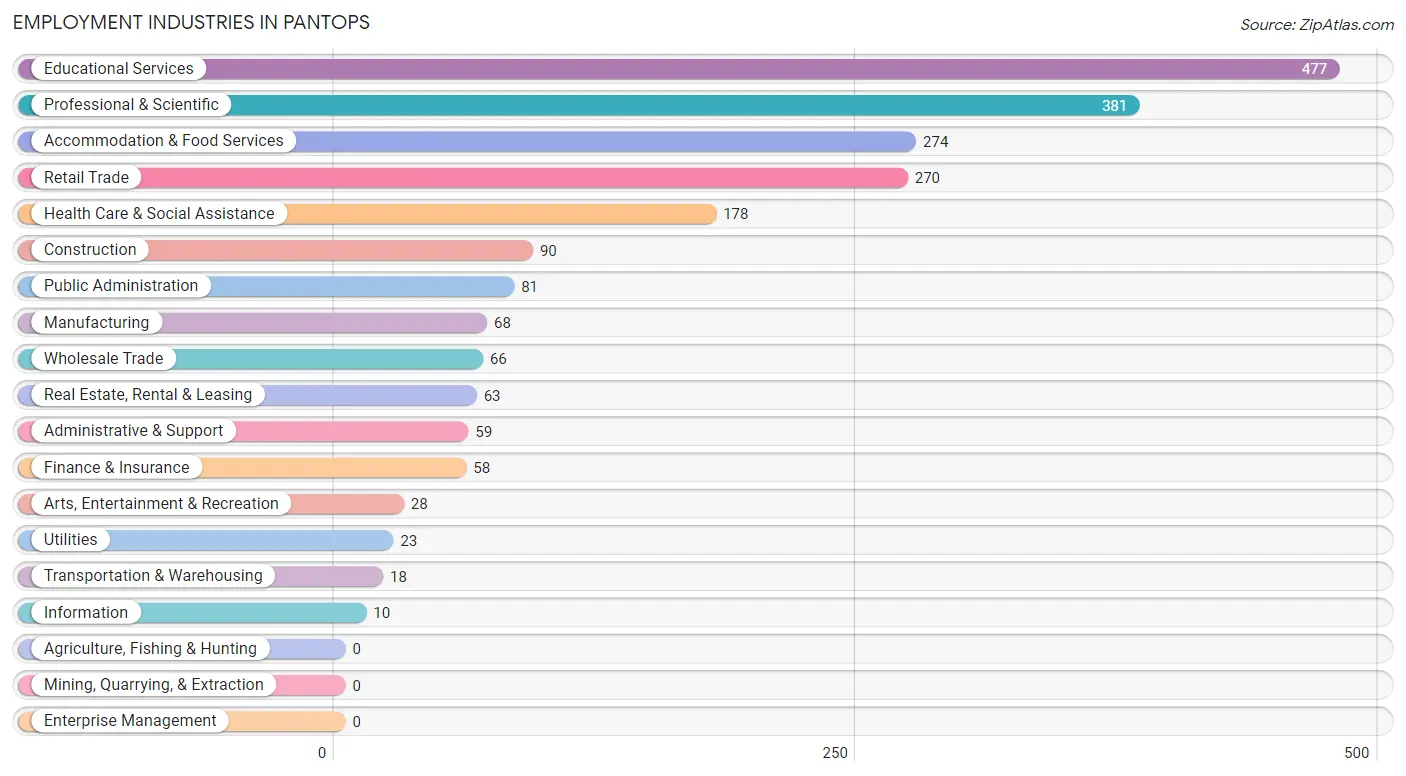
Employment Industries in Pantops
The major employment industries in Pantops include Educational Services (477 | 21.4%), Professional & Scientific (381 | 17.1%), Accommodation & Food Services (274 | 12.3%), Retail Trade (270 | 12.1%), and Health Care & Social Assistance (178 | 8.0%).
Employment Industries by Sex in Pantops
The Pantops industries that see more men than women are Construction (100.0%), Manufacturing (100.0%), and Utilities (100.0%), whereas the industries that tend to have a higher number of women are Transportation & Warehousing (100.0%), Information (100.0%), and Finance & Insurance (89.7%).
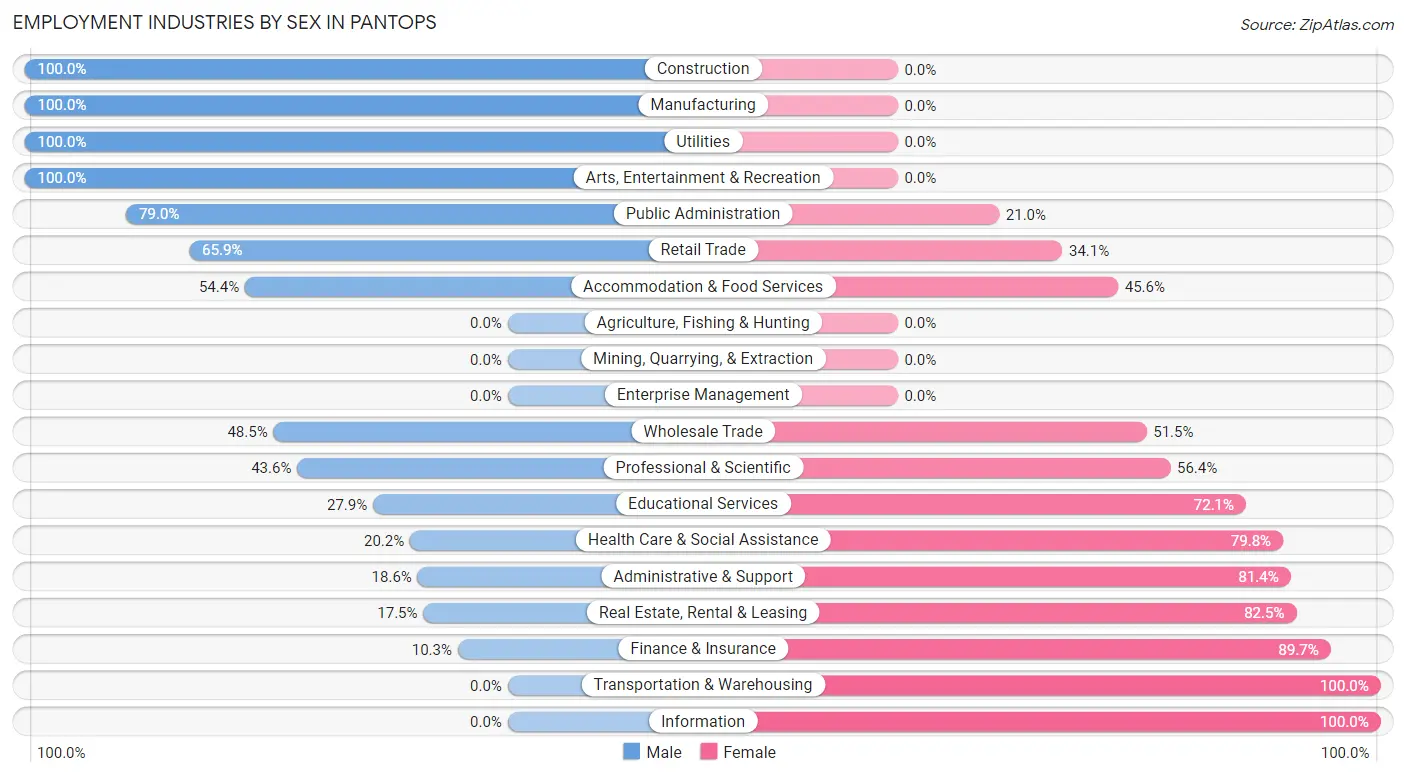
| Industry | Male | Female |
| Agriculture, Fishing & Hunting | 0 (0.0%) | 0 (0.0%) |
| Mining, Quarrying, & Extraction | 0 (0.0%) | 0 (0.0%) |
| Construction | 90 (100.0%) | 0 (0.0%) |
| Manufacturing | 68 (100.0%) | 0 (0.0%) |
| Wholesale Trade | 32 (48.5%) | 34 (51.5%) |
| Retail Trade | 178 (65.9%) | 92 (34.1%) |
| Transportation & Warehousing | 0 (0.0%) | 18 (100.0%) |
| Utilities | 23 (100.0%) | 0 (0.0%) |
| Information | 0 (0.0%) | 10 (100.0%) |
| Finance & Insurance | 6 (10.3%) | 52 (89.7%) |
| Real Estate, Rental & Leasing | 11 (17.5%) | 52 (82.5%) |
| Professional & Scientific | 166 (43.6%) | 215 (56.4%) |
| Enterprise Management | 0 (0.0%) | 0 (0.0%) |
| Administrative & Support | 11 (18.6%) | 48 (81.4%) |
| Educational Services | 133 (27.9%) | 344 (72.1%) |
| Health Care & Social Assistance | 36 (20.2%) | 142 (79.8%) |
| Arts, Entertainment & Recreation | 28 (100.0%) | 0 (0.0%) |
| Accommodation & Food Services | 149 (54.4%) | 125 (45.6%) |
| Public Administration | 64 (79.0%) | 17 (21.0%) |
| Total | 1,035 (46.4%) | 1,194 (53.6%) |
Education in Pantops
School Enrollment in Pantops
The most common levels of schooling among the 620 students in Pantops are kindergarten (174 | 28.1%), high school (127 | 20.5%), and graduate / professional (115 | 18.5%).
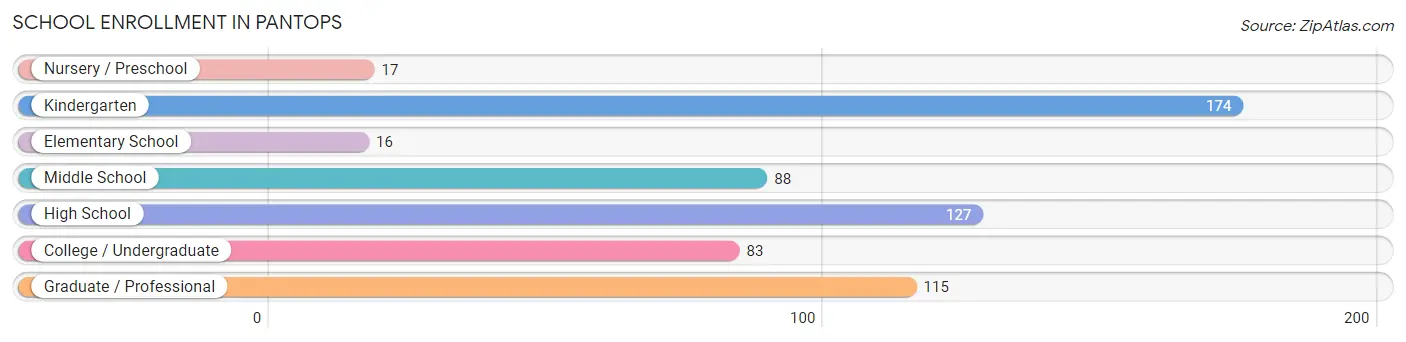
| School Level | # Students | % Students |
| Nursery / Preschool | 17 | 2.7% |
| Kindergarten | 174 | 28.1% |
| Elementary School | 16 | 2.6% |
| Middle School | 88 | 14.2% |
| High School | 127 | 20.5% |
| College / Undergraduate | 83 | 13.4% |
| Graduate / Professional | 115 | 18.5% |
| Total | 620 | 100.0% |
School Enrollment by Age by Funding Source in Pantops
Out of a total of 620 students who are enrolled in schools in Pantops, 212 (34.2%) attend a private institution, while the remaining 408 (65.8%) are enrolled in public schools. The age group of 3 to 4 year olds has the highest likelihood of being enrolled in private schools, with 17 (100.0% in the age bracket) enrolled. Conversely, the age group of 18 to 19 year olds has the lowest likelihood of being enrolled in a private school, with 14 (100.0% in the age bracket) attending a public institution.
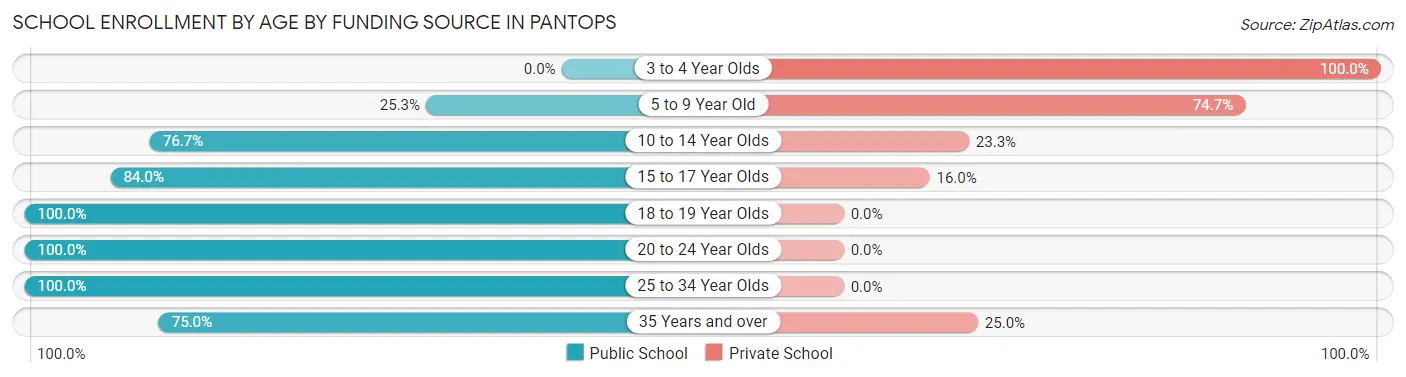
| Age Bracket | Public School | Private School |
| 3 to 4 Year Olds | 0 (0.0%) | 17 (100.0%) |
| 5 to 9 Year Old | 48 (25.3%) | 142 (74.7%) |
| 10 to 14 Year Olds | 69 (76.7%) | 21 (23.3%) |
| 15 to 17 Year Olds | 105 (84.0%) | 20 (16.0%) |
| 18 to 19 Year Olds | 14 (100.0%) | 0 (0.0%) |
| 20 to 24 Year Olds | 34 (100.0%) | 0 (0.0%) |
| 25 to 34 Year Olds | 102 (100.0%) | 0 (0.0%) |
| 35 Years and over | 36 (75.0%) | 12 (25.0%) |
| Total | 408 (65.8%) | 212 (34.2%) |
Educational Attainment by Field of Study in Pantops
Business (376 | 15.0%), education (330 | 13.2%), science & technology (313 | 12.5%), social sciences (235 | 9.4%), and engineering (223 | 8.9%) are the most common fields of study among 2,501 individuals in Pantops who have obtained a bachelor's degree or higher.
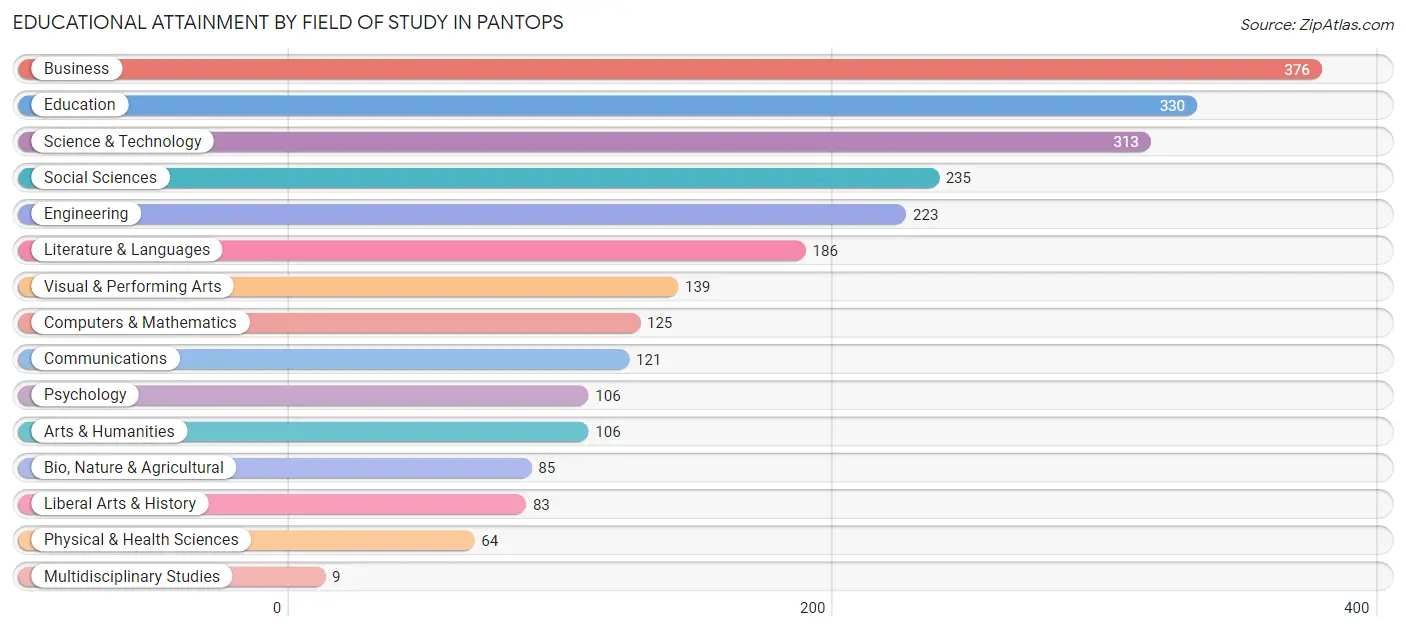
| Field of Study | # Graduates | % Graduates |
| Computers & Mathematics | 125 | 5.0% |
| Bio, Nature & Agricultural | 85 | 3.4% |
| Physical & Health Sciences | 64 | 2.6% |
| Psychology | 106 | 4.2% |
| Social Sciences | 235 | 9.4% |
| Engineering | 223 | 8.9% |
| Multidisciplinary Studies | 9 | 0.4% |
| Science & Technology | 313 | 12.5% |
| Business | 376 | 15.0% |
| Education | 330 | 13.2% |
| Literature & Languages | 186 | 7.4% |
| Liberal Arts & History | 83 | 3.3% |
| Visual & Performing Arts | 139 | 5.6% |
| Communications | 121 | 4.8% |
| Arts & Humanities | 106 | 4.2% |
| Total | 2,501 | 100.0% |
Transportation & Commute in Pantops
Vehicle Availability by Sex in Pantops
The most prevalent vehicle ownership categories in Pantops are males with 2 vehicles (753, accounting for 72.8%) and females with 2 vehicles (610, making up 63.1%).
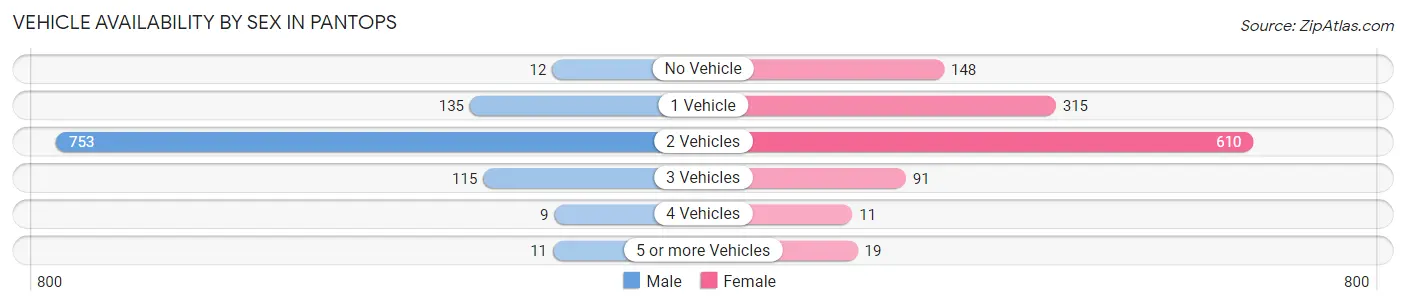
| Vehicles Available | Male | Female |
| No Vehicle | 12 (1.2%) | 148 (12.4%) |
| 1 Vehicle | 135 (13.0%) | 315 (26.4%) |
| 2 Vehicles | 753 (72.8%) | 610 (51.1%) |
| 3 Vehicles | 115 (11.1%) | 91 (7.6%) |
| 4 Vehicles | 9 (0.9%) | 11 (0.9%) |
| 5 or more Vehicles | 11 (1.1%) | 19 (1.6%) |
| Total | 1,035 (100.0%) | 1,194 (100.0%) |
Commute Time in Pantops
The most frequently occuring commute durations in Pantops are 15 to 19 minutes (428 commuters, 23.0%), 10 to 14 minutes (405 commuters, 21.8%), and 30 to 34 minutes (273 commuters, 14.7%).
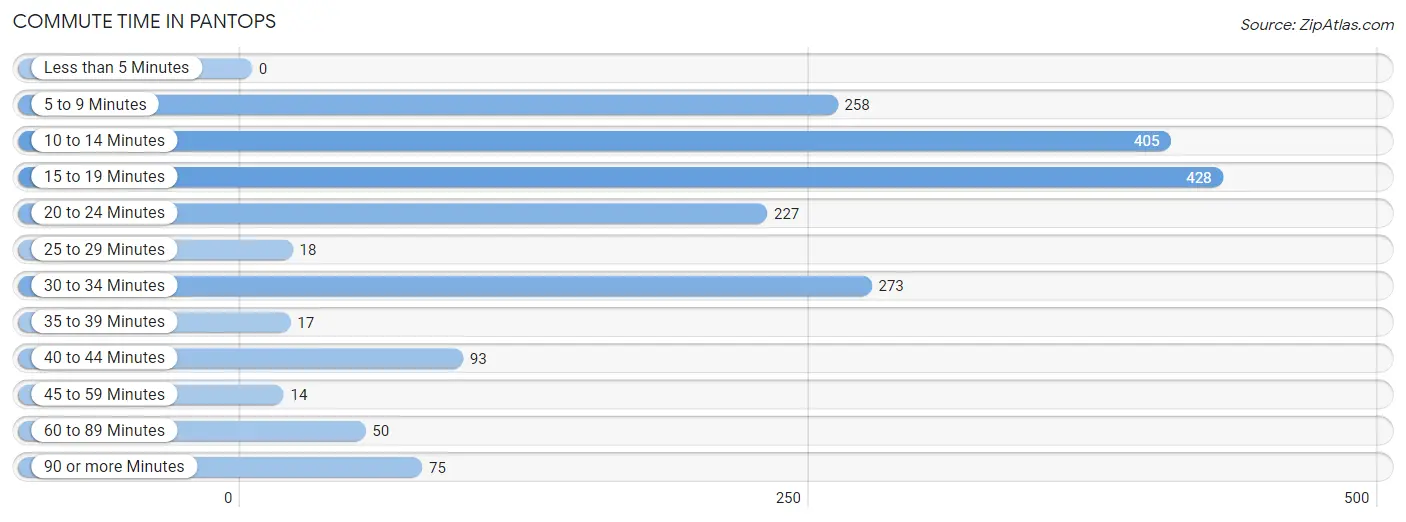
| Commute Time | # Commuters | % Commuters |
| Less than 5 Minutes | 0 | 0.0% |
| 5 to 9 Minutes | 258 | 13.9% |
| 10 to 14 Minutes | 405 | 21.8% |
| 15 to 19 Minutes | 428 | 23.0% |
| 20 to 24 Minutes | 227 | 12.2% |
| 25 to 29 Minutes | 18 | 1.0% |
| 30 to 34 Minutes | 273 | 14.7% |
| 35 to 39 Minutes | 17 | 0.9% |
| 40 to 44 Minutes | 93 | 5.0% |
| 45 to 59 Minutes | 14 | 0.7% |
| 60 to 89 Minutes | 50 | 2.7% |
| 90 or more Minutes | 75 | 4.0% |
Commute Time by Sex in Pantops
The most common commute times in Pantops are 15 to 19 minutes (203 commuters, 26.0%) for males and 10 to 14 minutes (318 commuters, 29.5%) for females.
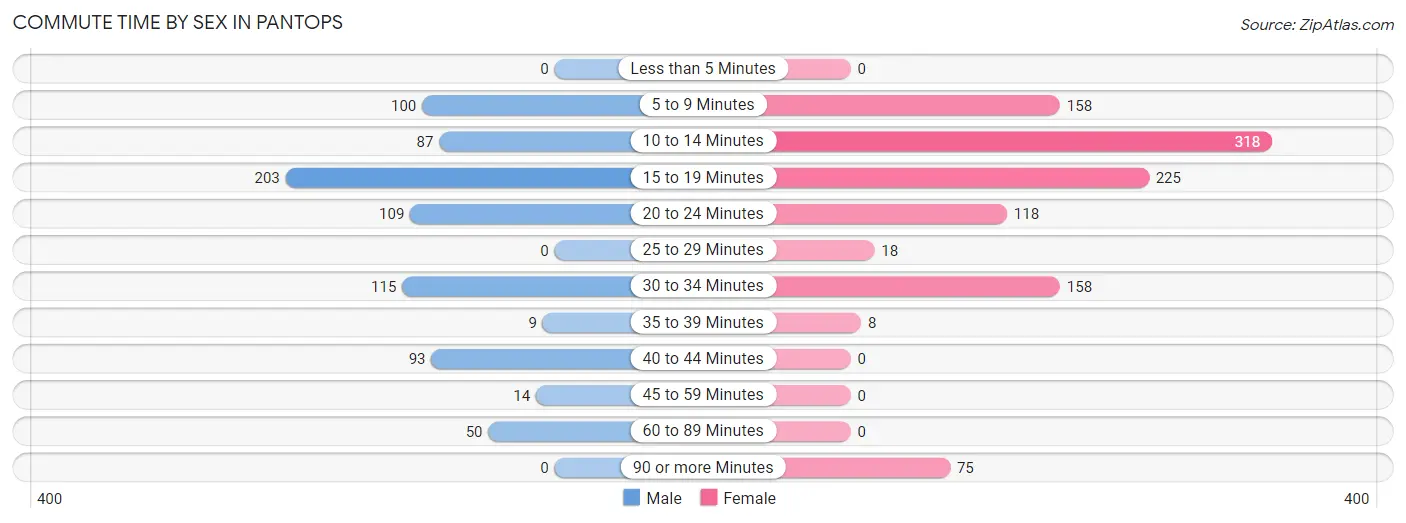
| Commute Time | Male | Female |
| Less than 5 Minutes | 0 (0.0%) | 0 (0.0%) |
| 5 to 9 Minutes | 100 (12.8%) | 158 (14.7%) |
| 10 to 14 Minutes | 87 (11.2%) | 318 (29.5%) |
| 15 to 19 Minutes | 203 (26.0%) | 225 (20.9%) |
| 20 to 24 Minutes | 109 (14.0%) | 118 (11.0%) |
| 25 to 29 Minutes | 0 (0.0%) | 18 (1.7%) |
| 30 to 34 Minutes | 115 (14.7%) | 158 (14.7%) |
| 35 to 39 Minutes | 9 (1.1%) | 8 (0.7%) |
| 40 to 44 Minutes | 93 (11.9%) | 0 (0.0%) |
| 45 to 59 Minutes | 14 (1.8%) | 0 (0.0%) |
| 60 to 89 Minutes | 50 (6.4%) | 0 (0.0%) |
| 90 or more Minutes | 0 (0.0%) | 75 (7.0%) |
Time of Departure to Work by Sex in Pantops
The most frequent times of departure to work in Pantops are 8:00 AM to 8:29 AM (295, 37.8%) for males and 7:30 AM to 7:59 AM (246, 22.8%) for females.
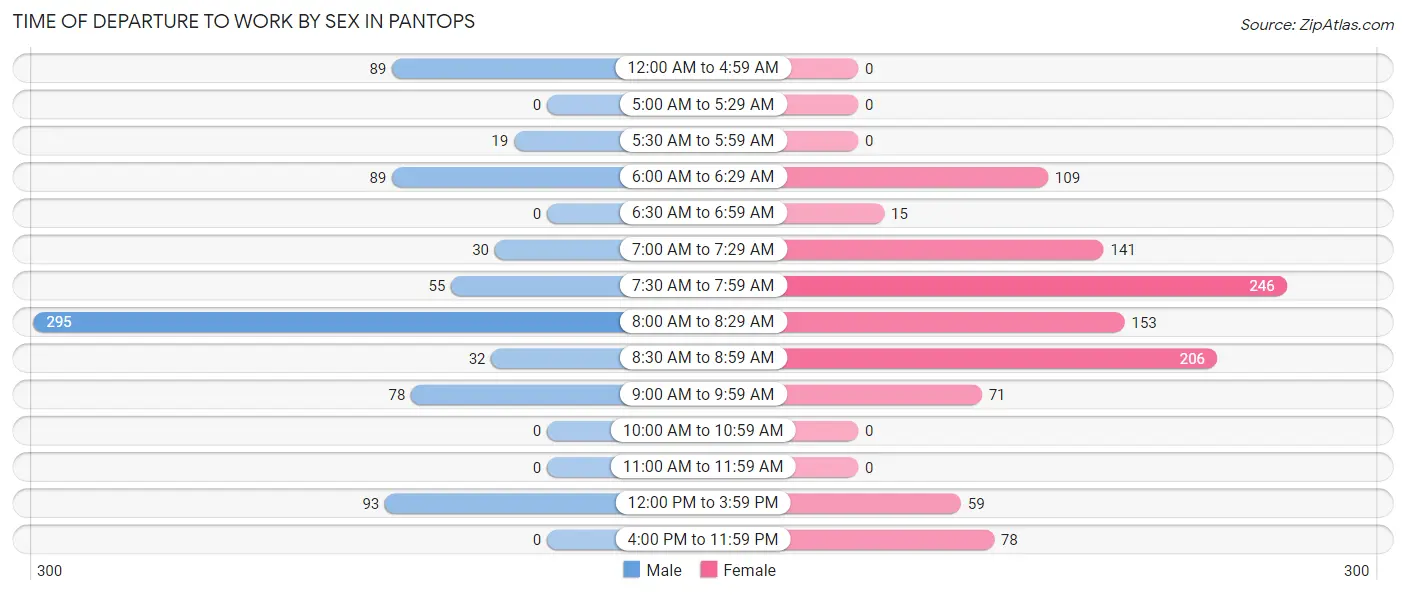
| Time of Departure | Male | Female |
| 12:00 AM to 4:59 AM | 89 (11.4%) | 0 (0.0%) |
| 5:00 AM to 5:29 AM | 0 (0.0%) | 0 (0.0%) |
| 5:30 AM to 5:59 AM | 19 (2.4%) | 0 (0.0%) |
| 6:00 AM to 6:29 AM | 89 (11.4%) | 109 (10.1%) |
| 6:30 AM to 6:59 AM | 0 (0.0%) | 15 (1.4%) |
| 7:00 AM to 7:29 AM | 30 (3.8%) | 141 (13.1%) |
| 7:30 AM to 7:59 AM | 55 (7.0%) | 246 (22.8%) |
| 8:00 AM to 8:29 AM | 295 (37.8%) | 153 (14.2%) |
| 8:30 AM to 8:59 AM | 32 (4.1%) | 206 (19.1%) |
| 9:00 AM to 9:59 AM | 78 (10.0%) | 71 (6.6%) |
| 10:00 AM to 10:59 AM | 0 (0.0%) | 0 (0.0%) |
| 11:00 AM to 11:59 AM | 0 (0.0%) | 0 (0.0%) |
| 12:00 PM to 3:59 PM | 93 (11.9%) | 59 (5.5%) |
| 4:00 PM to 11:59 PM | 0 (0.0%) | 78 (7.2%) |
| Total | 780 (100.0%) | 1,078 (100.0%) |
Housing Occupancy in Pantops
Occupancy by Ownership in Pantops
Of the total 2,310 dwellings in Pantops, owner-occupied units account for 1,093 (47.3%), while renter-occupied units make up 1,217 (52.7%).
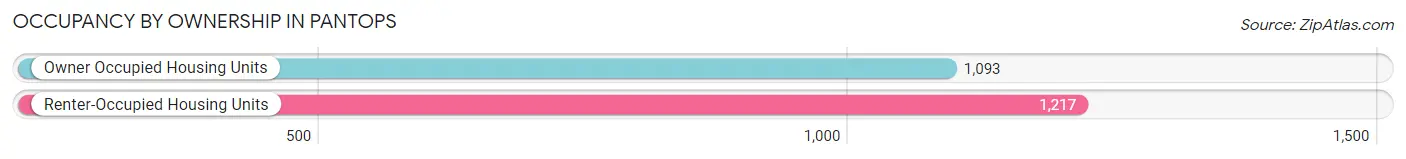
| Occupancy | # Housing Units | % Housing Units |
| Owner Occupied Housing Units | 1,093 | 47.3% |
| Renter-Occupied Housing Units | 1,217 | 52.7% |
| Total Occupied Housing Units | 2,310 | 100.0% |
Occupancy by Household Size in Pantops
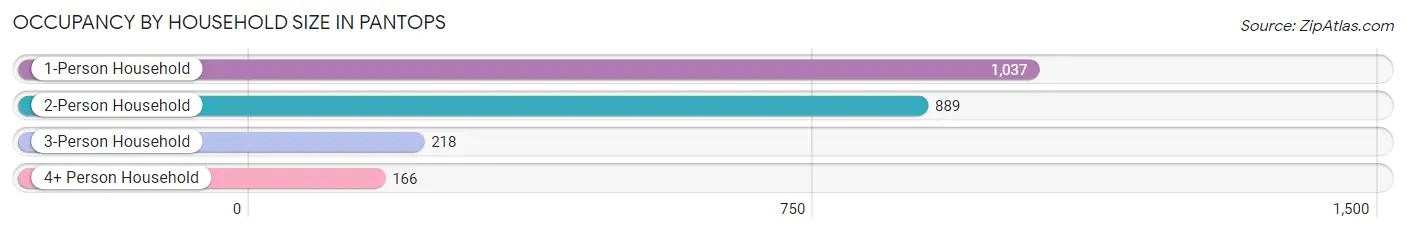
| Household Size | # Housing Units | % Housing Units |
| 1-Person Household | 1,037 | 44.9% |
| 2-Person Household | 889 | 38.5% |
| 3-Person Household | 218 | 9.4% |
| 4+ Person Household | 166 | 7.2% |
| Total Housing Units | 2,310 | 100.0% |
Occupancy by Ownership by Household Size in Pantops
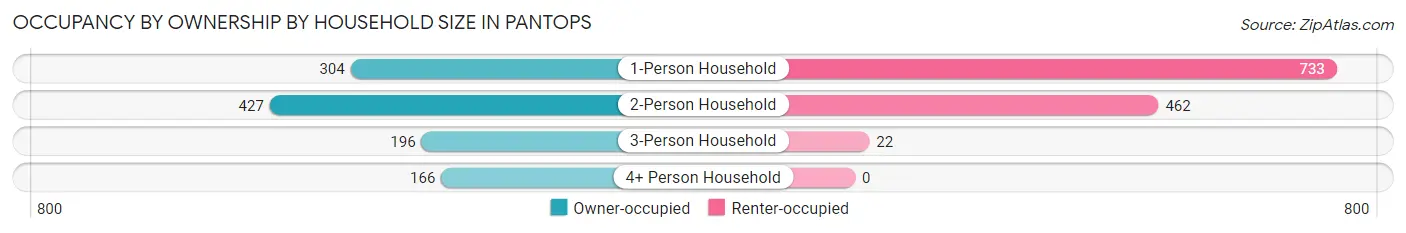
| Household Size | Owner-occupied | Renter-occupied |
| 1-Person Household | 304 (29.3%) | 733 (70.7%) |
| 2-Person Household | 427 (48.0%) | 462 (52.0%) |
| 3-Person Household | 196 (89.9%) | 22 (10.1%) |
| 4+ Person Household | 166 (100.0%) | 0 (0.0%) |
| Total Housing Units | 1,093 (47.3%) | 1,217 (52.7%) |
Occupancy by Educational Attainment in Pantops
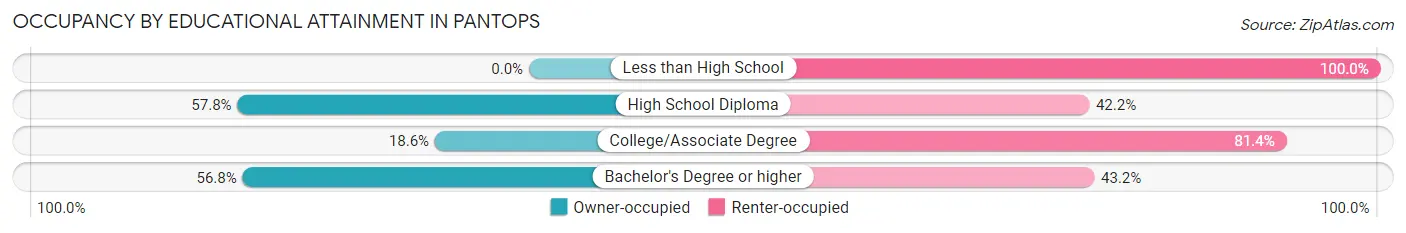
| Household Size | Owner-occupied | Renter-occupied |
| Less than High School | 0 (0.0%) | 34 (100.0%) |
| High School Diploma | 174 (57.8%) | 127 (42.2%) |
| College/Associate Degree | 99 (18.6%) | 432 (81.4%) |
| Bachelor's Degree or higher | 820 (56.8%) | 624 (43.2%) |
Occupancy by Age of Householder in Pantops
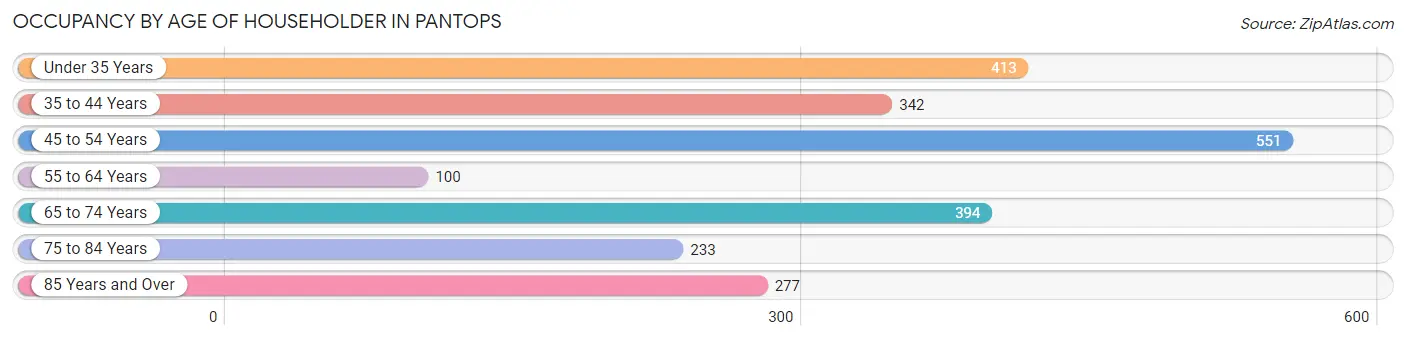
| Age Bracket | # Households | % Households |
| Under 35 Years | 413 | 17.9% |
| 35 to 44 Years | 342 | 14.8% |
| 45 to 54 Years | 551 | 23.8% |
| 55 to 64 Years | 100 | 4.3% |
| 65 to 74 Years | 394 | 17.1% |
| 75 to 84 Years | 233 | 10.1% |
| 85 Years and Over | 277 | 12.0% |
| Total | 2,310 | 100.0% |
Housing Finances in Pantops
Median Income by Occupancy in Pantops
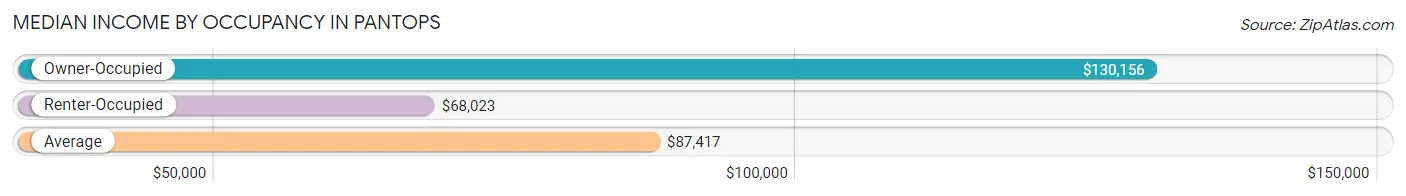
| Occupancy Type | # Households | Median Income |
| Owner-Occupied | 1,093 (47.3%) | $130,156 |
| Renter-Occupied | 1,217 (52.7%) | $68,023 |
| Average | 2,310 (100.0%) | $87,417 |
Occupancy by Householder Income Bracket in Pantops
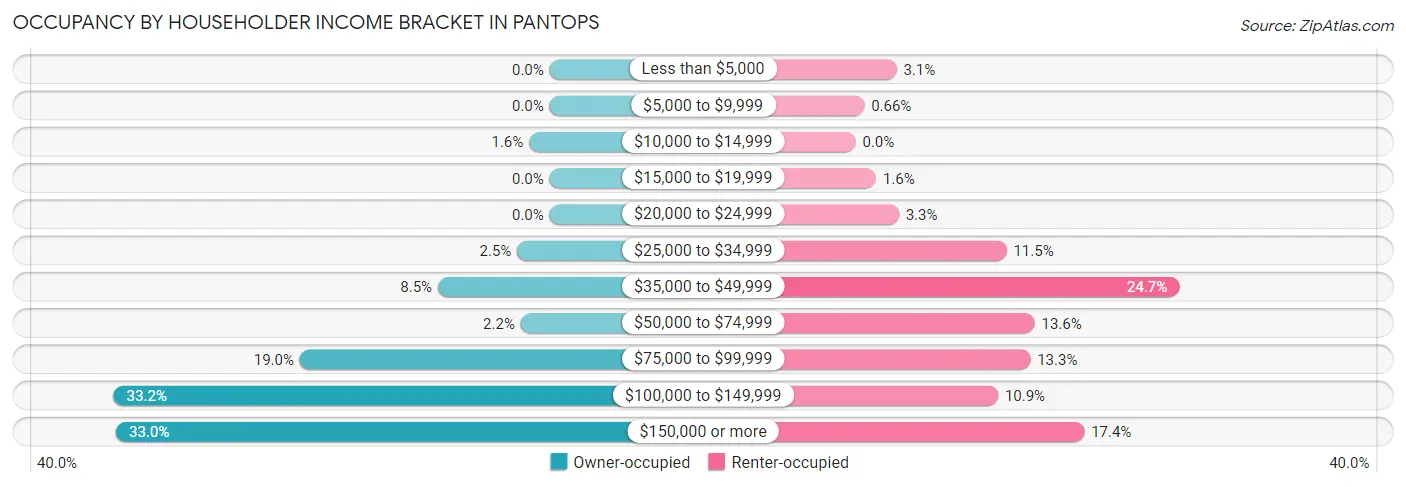
| Income Bracket | Owner-occupied | Renter-occupied |
| Less than $5,000 | 0 (0.0%) | 38 (3.1%) |
| $5,000 to $9,999 | 0 (0.0%) | 8 (0.7%) |
| $10,000 to $14,999 | 17 (1.6%) | 0 (0.0%) |
| $15,000 to $19,999 | 0 (0.0%) | 19 (1.6%) |
| $20,000 to $24,999 | 0 (0.0%) | 40 (3.3%) |
| $25,000 to $34,999 | 27 (2.5%) | 140 (11.5%) |
| $35,000 to $49,999 | 93 (8.5%) | 300 (24.6%) |
| $50,000 to $74,999 | 24 (2.2%) | 166 (13.6%) |
| $75,000 to $99,999 | 208 (19.0%) | 162 (13.3%) |
| $100,000 to $149,999 | 363 (33.2%) | 132 (10.8%) |
| $150,000 or more | 361 (33.0%) | 212 (17.4%) |
| Total | 1,093 (100.0%) | 1,217 (100.0%) |
Monthly Housing Cost Tiers in Pantops
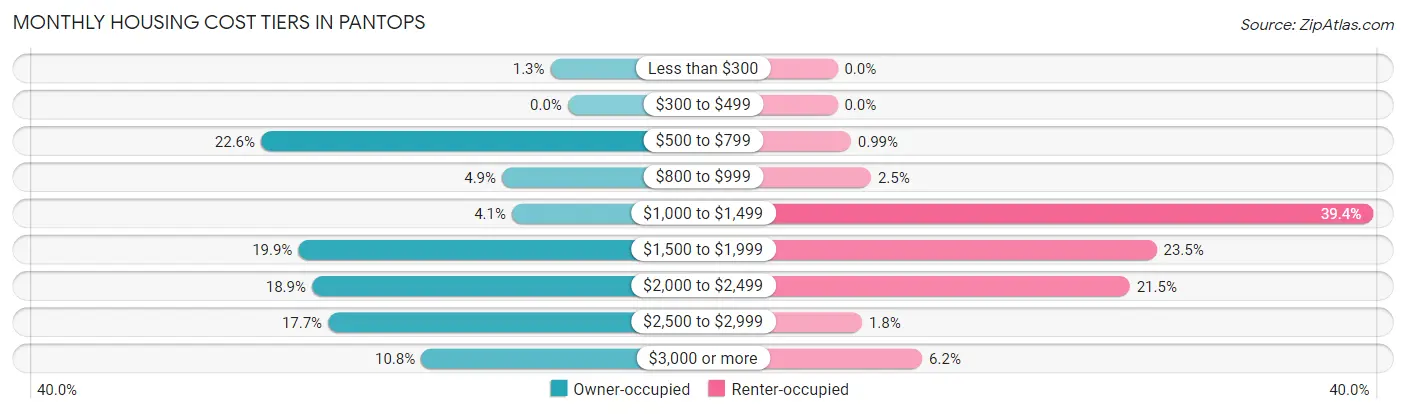
| Monthly Cost | Owner-occupied | Renter-occupied |
| Less than $300 | 14 (1.3%) | 0 (0.0%) |
| $300 to $499 | 0 (0.0%) | 0 (0.0%) |
| $500 to $799 | 247 (22.6%) | 12 (1.0%) |
| $800 to $999 | 53 (4.9%) | 30 (2.5%) |
| $1,000 to $1,499 | 45 (4.1%) | 480 (39.4%) |
| $1,500 to $1,999 | 217 (19.9%) | 286 (23.5%) |
| $2,000 to $2,499 | 206 (18.9%) | 262 (21.5%) |
| $2,500 to $2,999 | 193 (17.7%) | 22 (1.8%) |
| $3,000 or more | 118 (10.8%) | 76 (6.2%) |
| Total | 1,093 (100.0%) | 1,217 (100.0%) |
Physical Housing Characteristics in Pantops
Housing Structures in Pantops
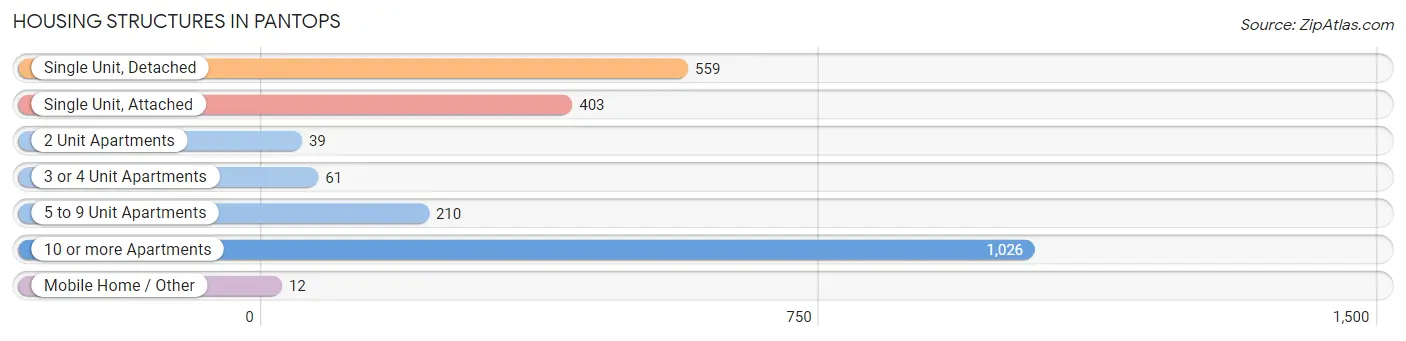
| Structure Type | # Housing Units | % Housing Units |
| Single Unit, Detached | 559 | 24.2% |
| Single Unit, Attached | 403 | 17.4% |
| 2 Unit Apartments | 39 | 1.7% |
| 3 or 4 Unit Apartments | 61 | 2.6% |
| 5 to 9 Unit Apartments | 210 | 9.1% |
| 10 or more Apartments | 1,026 | 44.4% |
| Mobile Home / Other | 12 | 0.5% |
| Total | 2,310 | 100.0% |
Housing Structures by Occupancy in Pantops
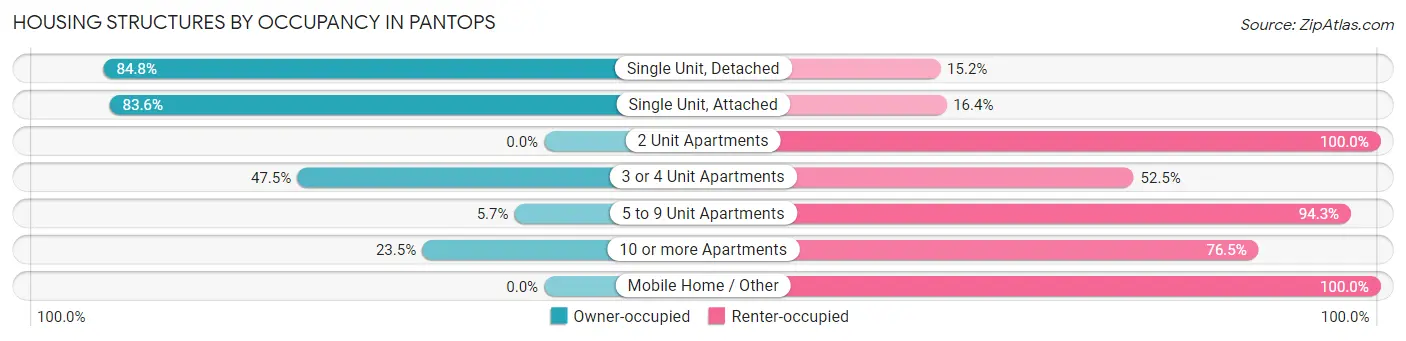
| Structure Type | Owner-occupied | Renter-occupied |
| Single Unit, Detached | 474 (84.8%) | 85 (15.2%) |
| Single Unit, Attached | 337 (83.6%) | 66 (16.4%) |
| 2 Unit Apartments | 0 (0.0%) | 39 (100.0%) |
| 3 or 4 Unit Apartments | 29 (47.5%) | 32 (52.5%) |
| 5 to 9 Unit Apartments | 12 (5.7%) | 198 (94.3%) |
| 10 or more Apartments | 241 (23.5%) | 785 (76.5%) |
| Mobile Home / Other | 0 (0.0%) | 12 (100.0%) |
| Total | 1,093 (47.3%) | 1,217 (52.7%) |
Housing Structures by Number of Rooms in Pantops
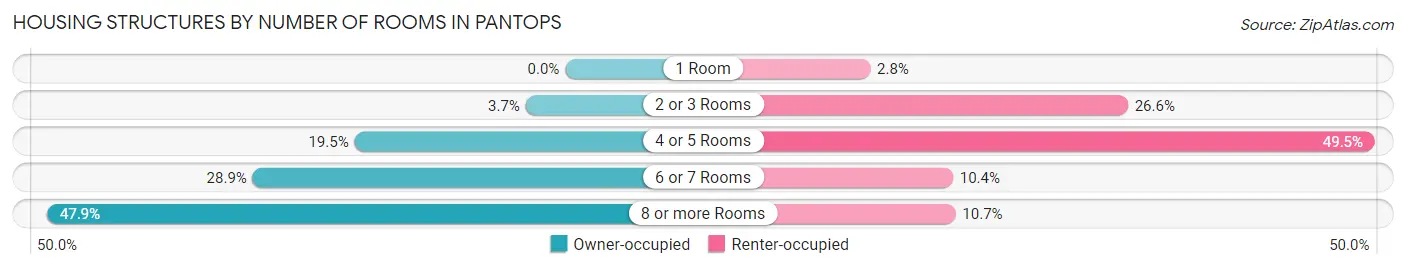
| Number of Rooms | Owner-occupied | Renter-occupied |
| 1 Room | 0 (0.0%) | 34 (2.8%) |
| 2 or 3 Rooms | 40 (3.7%) | 324 (26.6%) |
| 4 or 5 Rooms | 213 (19.5%) | 602 (49.5%) |
| 6 or 7 Rooms | 316 (28.9%) | 127 (10.4%) |
| 8 or more Rooms | 524 (47.9%) | 130 (10.7%) |
| Total | 1,093 (100.0%) | 1,217 (100.0%) |
Housing Structure by Heating Type in Pantops
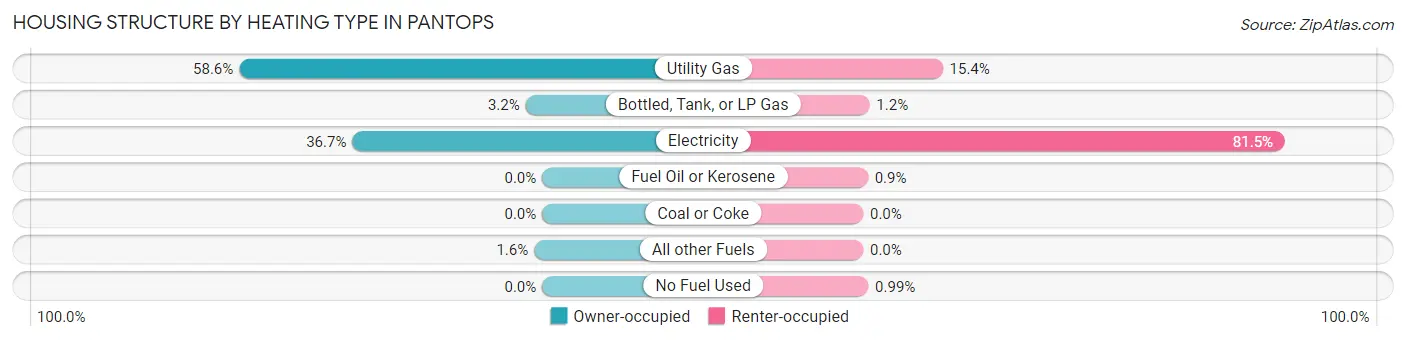
| Heating Type | Owner-occupied | Renter-occupied |
| Utility Gas | 640 (58.6%) | 187 (15.4%) |
| Bottled, Tank, or LP Gas | 35 (3.2%) | 15 (1.2%) |
| Electricity | 401 (36.7%) | 992 (81.5%) |
| Fuel Oil or Kerosene | 0 (0.0%) | 11 (0.9%) |
| Coal or Coke | 0 (0.0%) | 0 (0.0%) |
| All other Fuels | 17 (1.6%) | 0 (0.0%) |
| No Fuel Used | 0 (0.0%) | 12 (1.0%) |
| Total | 1,093 (100.0%) | 1,217 (100.0%) |
Household Vehicle Usage in Pantops
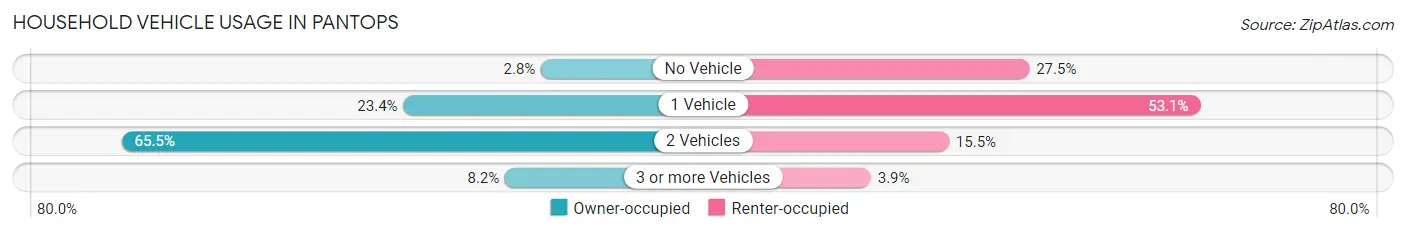
| Vehicles per Household | Owner-occupied | Renter-occupied |
| No Vehicle | 31 (2.8%) | 335 (27.5%) |
| 1 Vehicle | 256 (23.4%) | 646 (53.1%) |
| 2 Vehicles | 716 (65.5%) | 189 (15.5%) |
| 3 or more Vehicles | 90 (8.2%) | 47 (3.9%) |
| Total | 1,093 (100.0%) | 1,217 (100.0%) |
Real Estate & Mortgages in Pantops
Real Estate and Mortgage Overview in Pantops
| Characteristic | Without Mortgage | With Mortgage |
| Housing Units | 210 | 883 |
| Median Property Value | $514,700 | $467,400 |
| Median Household Income | - | - |
| Monthly Housing Costs | $759 | $118 |
| Real Estate Taxes | $3,956 | $0 |
Property Value by Mortgage Status in Pantops
| Property Value | Without Mortgage | With Mortgage |
| Less than $50,000 | 0 (0.0%) | 8 (0.9%) |
| $50,000 to $99,999 | 0 (0.0%) | 0 (0.0%) |
| $100,000 to $299,999 | 54 (25.7%) | 168 (19.0%) |
| $300,000 to $499,999 | 45 (21.4%) | 315 (35.7%) |
| $500,000 to $749,999 | 102 (48.6%) | 338 (38.3%) |
| $750,000 to $999,999 | 0 (0.0%) | 54 (6.1%) |
| $1,000,000 or more | 9 (4.3%) | 0 (0.0%) |
| Total | 210 (100.0%) | 883 (100.0%) |
Household Income by Mortgage Status in Pantops
| Household Income | Without Mortgage | With Mortgage |
| Less than $10,000 | 0 (0.0%) | 25 (2.8%) |
| $10,000 to $24,999 | 0 (0.0%) | 0 (0.0%) |
| $25,000 to $34,999 | 14 (6.7%) | 17 (1.9%) |
| $35,000 to $49,999 | 0 (0.0%) | 13 (1.5%) |
| $50,000 to $74,999 | 12 (5.7%) | 93 (10.5%) |
| $75,000 to $99,999 | 89 (42.4%) | 12 (1.4%) |
| $100,000 to $149,999 | 25 (11.9%) | 119 (13.5%) |
| $150,000 or more | 70 (33.3%) | 338 (38.3%) |
| Total | 210 (100.0%) | 883 (100.0%) |
Property Value to Household Income Ratio in Pantops
| Value-to-Income Ratio | Without Mortgage | With Mortgage |
| Less than 2.0x | 17 (8.1%) | 135,972 (15,398.9%) |
| 2.0x to 2.9x | 8 (3.8%) | 91 (10.3%) |
| 3.0x to 3.9x | 92 (43.8%) | 191 (21.6%) |
| 4.0x or more | 93 (44.3%) | 299 (33.9%) |
| Total | 210 (100.0%) | 883 (100.0%) |
Real Estate Taxes by Mortgage Status in Pantops
| Property Taxes | Without Mortgage | With Mortgage |
| Less than $800 | 0 (0.0%) | 0 (0.0%) |
| $800 to $1,499 | 0 (0.0%) | 111 (12.6%) |
| $800 to $1,499 | 210 (100.0%) | 54 (6.1%) |
| Total | 210 (100.0%) | 883 (100.0%) |
Health & Disability in Pantops
Health Insurance Coverage by Age in Pantops
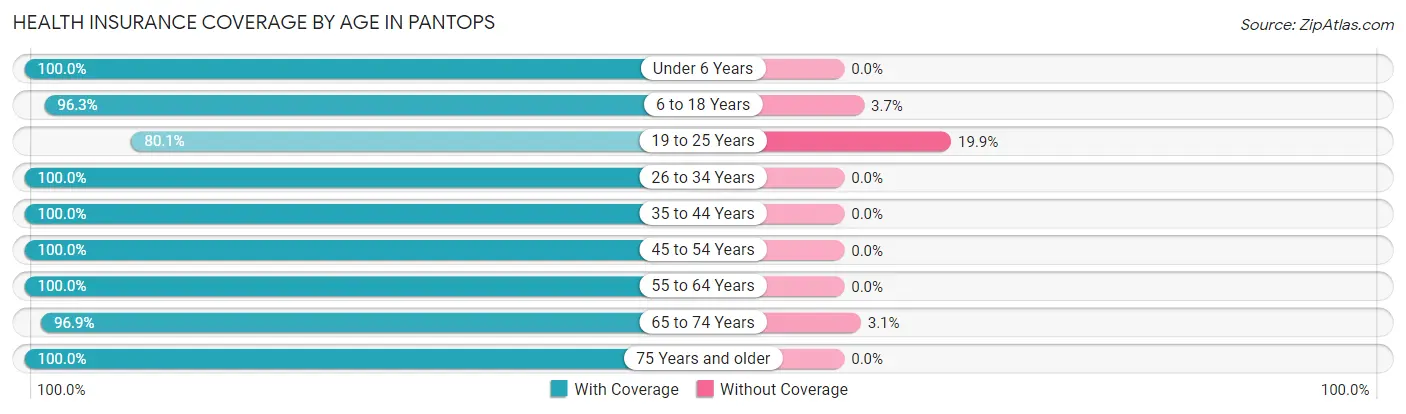
| Age Bracket | With Coverage | Without Coverage |
| Under 6 Years | 249 (100.0%) | 0 (0.0%) |
| 6 to 18 Years | 391 (96.3%) | 15 (3.7%) |
| 19 to 25 Years | 205 (80.1%) | 51 (19.9%) |
| 26 to 34 Years | 651 (100.0%) | 0 (0.0%) |
| 35 to 44 Years | 564 (100.0%) | 0 (0.0%) |
| 45 to 54 Years | 704 (100.0%) | 0 (0.0%) |
| 55 to 64 Years | 188 (100.0%) | 0 (0.0%) |
| 65 to 74 Years | 504 (96.9%) | 16 (3.1%) |
| 75 Years and older | 599 (100.0%) | 0 (0.0%) |
| Total | 4,055 (98.0%) | 82 (2.0%) |
Health Insurance Coverage by Citizenship Status in Pantops
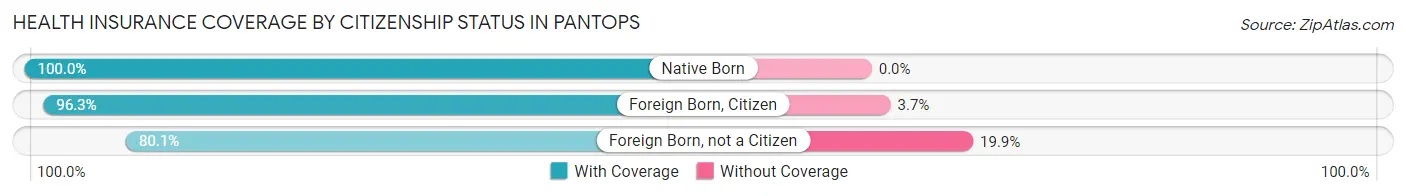
| Citizenship Status | With Coverage | Without Coverage |
| Native Born | 249 (100.0%) | 0 (0.0%) |
| Foreign Born, Citizen | 391 (96.3%) | 15 (3.7%) |
| Foreign Born, not a Citizen | 205 (80.1%) | 51 (19.9%) |
Health Insurance Coverage by Household Income in Pantops
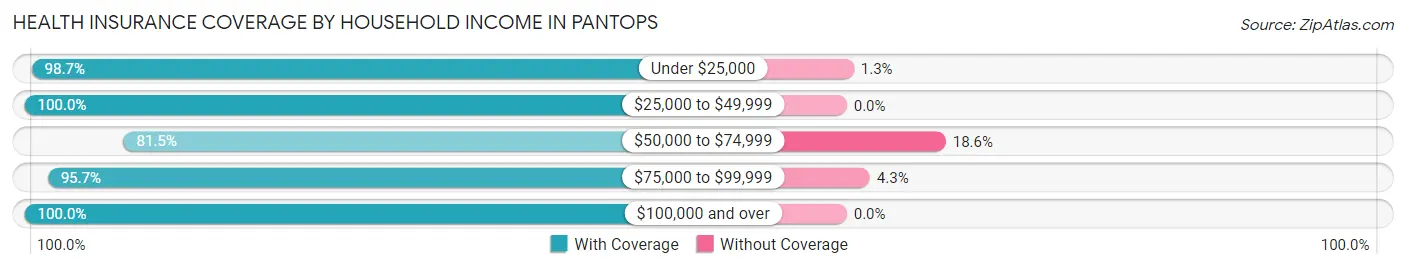
| Household Income | With Coverage | Without Coverage |
| Under $25,000 | 149 (98.7%) | 2 (1.3%) |
| $25,000 to $49,999 | 696 (100.0%) | 0 (0.0%) |
| $50,000 to $74,999 | 224 (81.5%) | 51 (18.5%) |
| $75,000 to $99,999 | 640 (95.7%) | 29 (4.3%) |
| $100,000 and over | 2,346 (100.0%) | 0 (0.0%) |
Public vs Private Health Insurance Coverage by Age in Pantops
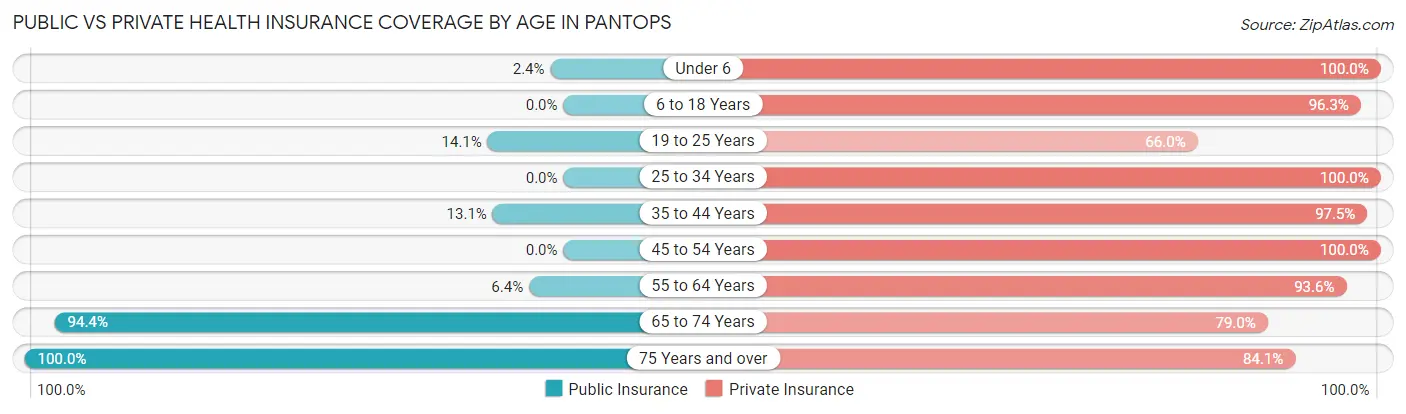
| Age Bracket | Public Insurance | Private Insurance |
| Under 6 | 6 (2.4%) | 249 (100.0%) |
| 6 to 18 Years | 0 (0.0%) | 391 (96.3%) |
| 19 to 25 Years | 36 (14.1%) | 169 (66.0%) |
| 25 to 34 Years | 0 (0.0%) | 651 (100.0%) |
| 35 to 44 Years | 74 (13.1%) | 550 (97.5%) |
| 45 to 54 Years | 0 (0.0%) | 704 (100.0%) |
| 55 to 64 Years | 12 (6.4%) | 176 (93.6%) |
| 65 to 74 Years | 491 (94.4%) | 411 (79.0%) |
| 75 Years and over | 599 (100.0%) | 504 (84.1%) |
| Total | 1,218 (29.4%) | 3,805 (92.0%) |
Disability Status by Sex by Age in Pantops
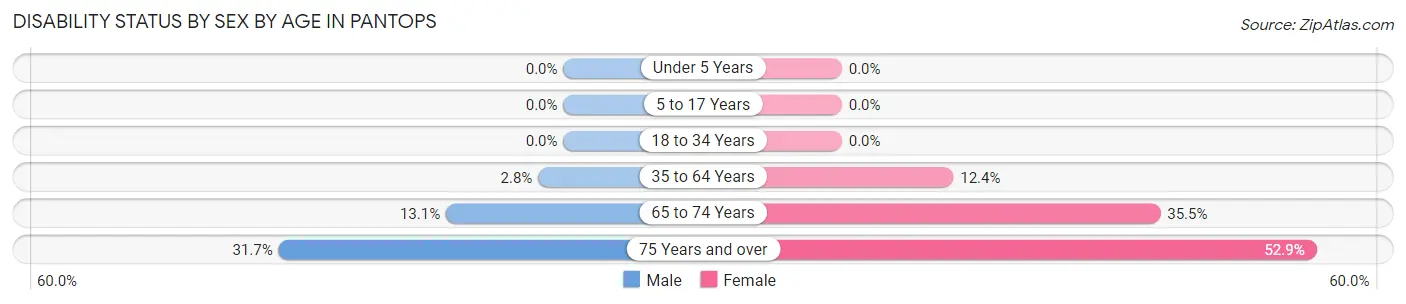
| Age Bracket | Male | Female |
| Under 5 Years | 0 (0.0%) | 0 (0.0%) |
| 5 to 17 Years | 0 (0.0%) | 0 (0.0%) |
| 18 to 34 Years | 0 (0.0%) | 0 (0.0%) |
| 35 to 64 Years | 20 (2.8%) | 92 (12.4%) |
| 65 to 74 Years | 23 (13.1%) | 122 (35.5%) |
| 75 Years and over | 46 (31.7%) | 240 (52.9%) |
Disability Class by Sex by Age in Pantops
Disability Class: Hearing Difficulty
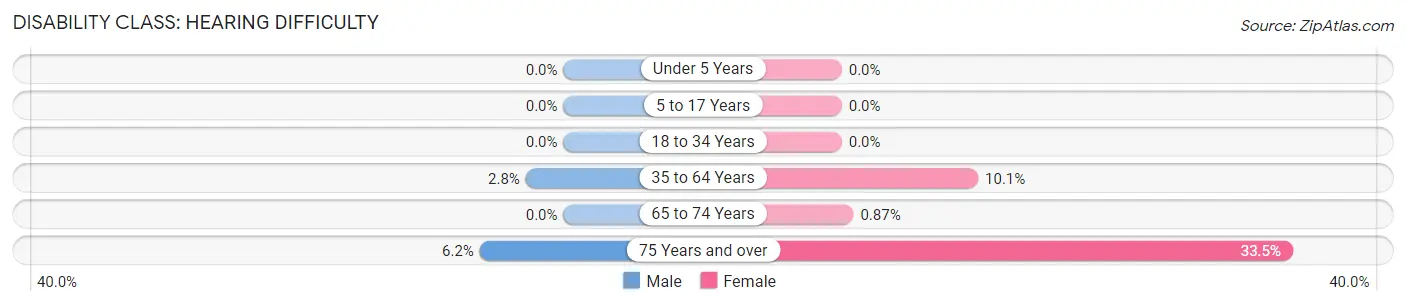
| Age Bracket | Male | Female |
| Under 5 Years | 0 (0.0%) | 0 (0.0%) |
| 5 to 17 Years | 0 (0.0%) | 0 (0.0%) |
| 18 to 34 Years | 0 (0.0%) | 0 (0.0%) |
| 35 to 64 Years | 20 (2.8%) | 75 (10.1%) |
| 65 to 74 Years | 0 (0.0%) | 3 (0.9%) |
| 75 Years and over | 9 (6.2%) | 152 (33.5%) |
Disability Class: Vision Difficulty
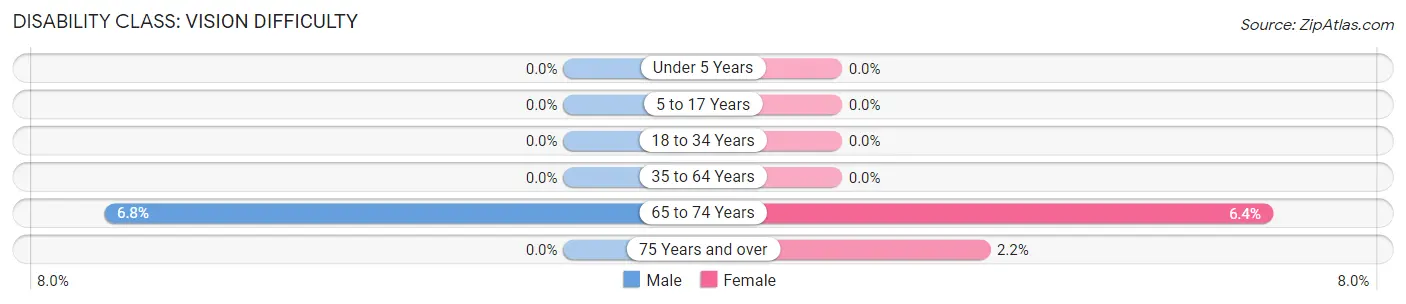
| Age Bracket | Male | Female |
| Under 5 Years | 0 (0.0%) | 0 (0.0%) |
| 5 to 17 Years | 0 (0.0%) | 0 (0.0%) |
| 18 to 34 Years | 0 (0.0%) | 0 (0.0%) |
| 35 to 64 Years | 0 (0.0%) | 0 (0.0%) |
| 65 to 74 Years | 12 (6.8%) | 22 (6.4%) |
| 75 Years and over | 0 (0.0%) | 10 (2.2%) |
Disability Class: Cognitive Difficulty
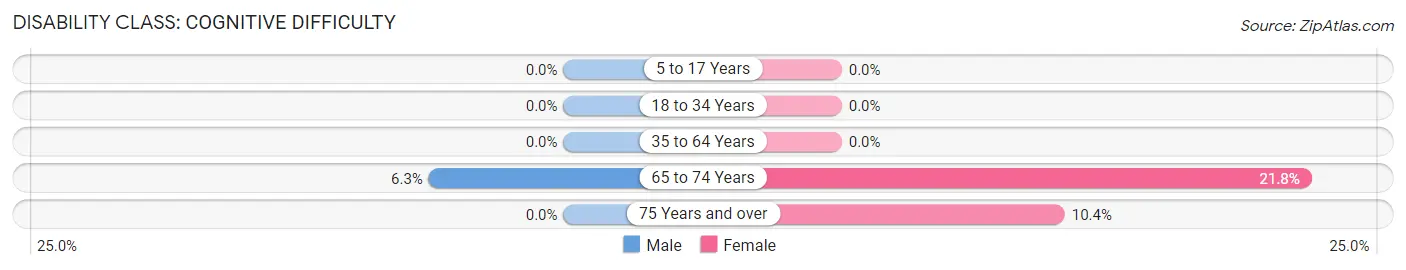
| Age Bracket | Male | Female |
| 5 to 17 Years | 0 (0.0%) | 0 (0.0%) |
| 18 to 34 Years | 0 (0.0%) | 0 (0.0%) |
| 35 to 64 Years | 0 (0.0%) | 0 (0.0%) |
| 65 to 74 Years | 11 (6.2%) | 75 (21.8%) |
| 75 Years and over | 0 (0.0%) | 47 (10.3%) |
Disability Class: Ambulatory Difficulty
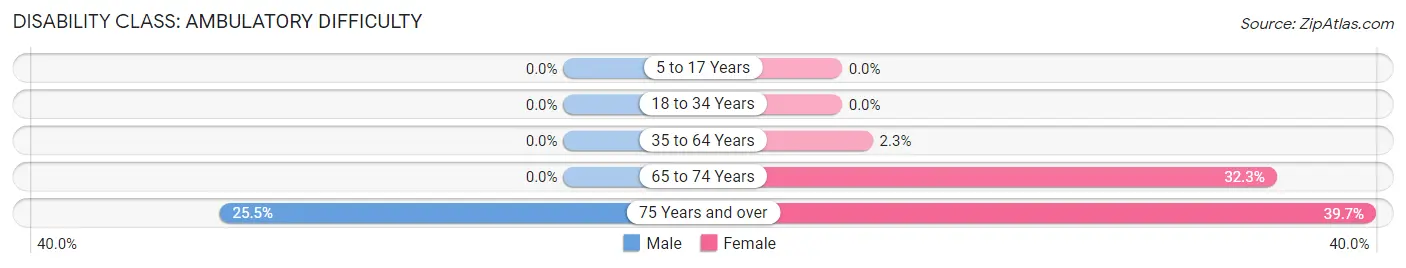
| Age Bracket | Male | Female |
| 5 to 17 Years | 0 (0.0%) | 0 (0.0%) |
| 18 to 34 Years | 0 (0.0%) | 0 (0.0%) |
| 35 to 64 Years | 0 (0.0%) | 17 (2.3%) |
| 65 to 74 Years | 0 (0.0%) | 111 (32.3%) |
| 75 Years and over | 37 (25.5%) | 180 (39.7%) |
Disability Class: Self-Care Difficulty
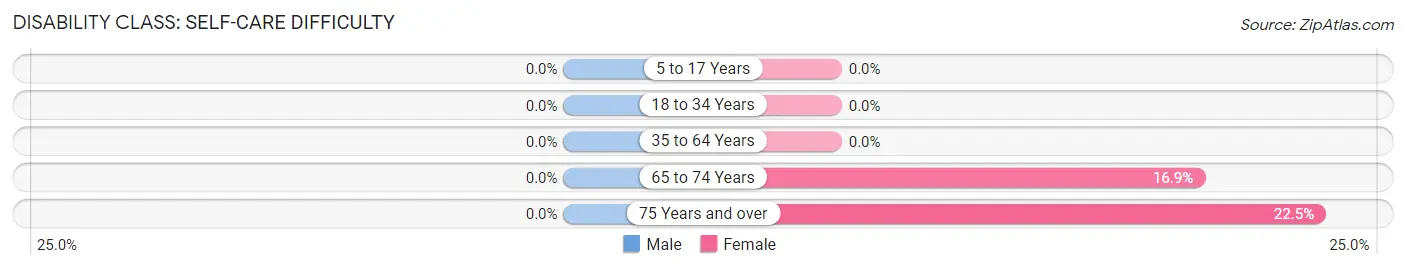
| Age Bracket | Male | Female |
| 5 to 17 Years | 0 (0.0%) | 0 (0.0%) |
| 18 to 34 Years | 0 (0.0%) | 0 (0.0%) |
| 35 to 64 Years | 0 (0.0%) | 0 (0.0%) |
| 65 to 74 Years | 0 (0.0%) | 58 (16.9%) |
| 75 Years and over | 0 (0.0%) | 102 (22.5%) |
Technology Access in Pantops
Computing Device Access in Pantops
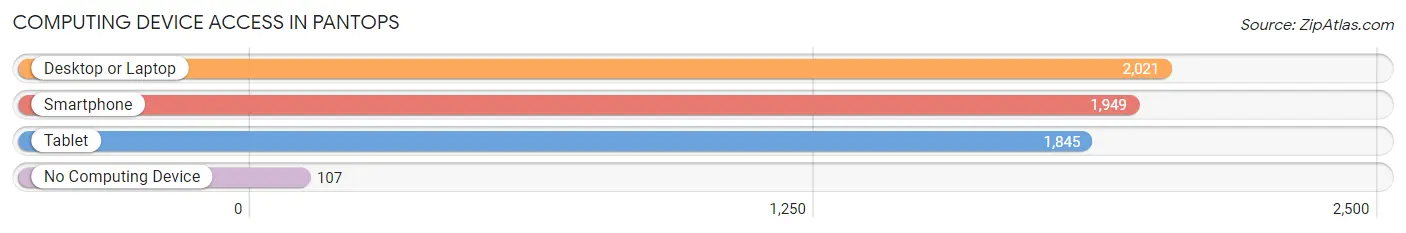
| Device Type | # Households | % Households |
| Desktop or Laptop | 2,021 | 87.5% |
| Smartphone | 1,949 | 84.4% |
| Tablet | 1,845 | 79.9% |
| No Computing Device | 107 | 4.6% |
| Total | 2,310 | 100.0% |
Internet Access in Pantops
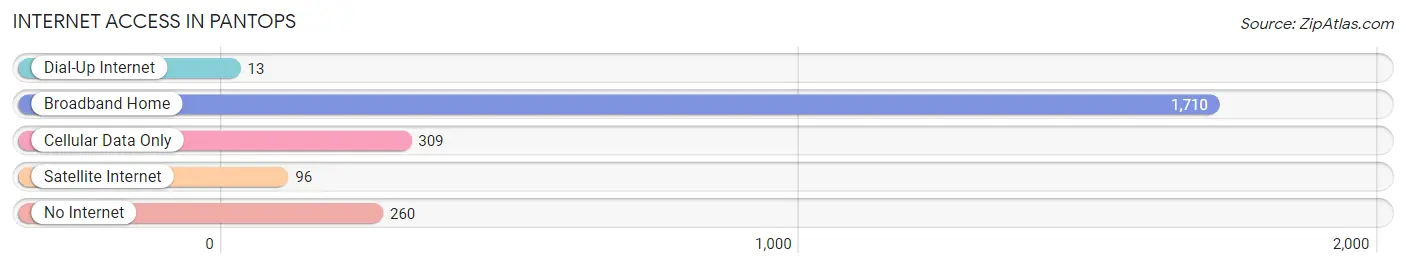
| Internet Type | # Households | % Households |
| Dial-Up Internet | 13 | 0.6% |
| Broadband Home | 1,710 | 74.0% |
| Cellular Data Only | 309 | 13.4% |
| Satellite Internet | 96 | 4.2% |
| No Internet | 260 | 11.3% |
| Total | 2,310 | 100.0% |
Pantops Summary
Pantops is an unincorporated community located in Albemarle County, Virginia. It is situated on the eastern side of the Blue Ridge Mountains, just south of Charlottesville. The area is known for its rolling hills, lush forests, and picturesque views of the surrounding countryside.
History
The area now known as Pantops was first settled in the late 1700s by a group of German immigrants. The community was originally known as “Pantops”, a combination of two German words meaning “all sides”. The name was chosen to reflect the area’s location on the top of a hill, surrounded by mountains on all sides.
In the early 1800s, the area was home to a number of small farms and businesses. The community was also home to a number of churches, including the Pantops Methodist Church, which was founded in 1820.
In the late 1800s, the area began to experience rapid growth as the railroad was extended to the area. This allowed for the development of a number of businesses, including a sawmill, a gristmill, and a general store.
Geography
Pantops is located in Albemarle County, Virginia, just south of Charlottesville. The area is situated on the eastern side of the Blue Ridge Mountains, and is known for its rolling hills and lush forests. The area is also home to a number of creeks and streams, including the Rivanna River, which flows through the area.
The climate in Pantops is generally mild, with temperatures ranging from the mid-30s in the winter to the mid-80s in the summer. The area receives an average of 43 inches of precipitation per year, with most of it falling in the form of rain.
Economy
The economy of Pantops is largely based on agriculture and tourism. The area is home to a number of farms, which produce a variety of crops, including corn, soybeans, and hay. The area is also home to a number of wineries, which produce a variety of wines.
In addition to agriculture, the area is also home to a number of businesses, including restaurants, retail stores, and professional services. The area is also home to a number of technology companies, which provide a variety of services, including software development and web design.
Demographics
As of the 2010 census, the population of Pantops was 1,845. The racial makeup of the area was 87.3% White, 8.2% African American, 0.7% Asian, 0.2% Native American, and 3.6% from other races. The median household income in the area was $50,945, and the median home value was $231,400.
Conclusion
Pantops is an unincorporated community located in Albemarle County, Virginia. It is situated on the eastern side of the Blue Ridge Mountains, just south of Charlottesville. The area is known for its rolling hills, lush forests, and picturesque views of the surrounding countryside. The economy of Pantops is largely based on agriculture and tourism, and the area is home to a number of businesses, including restaurants, retail stores, and professional services. As of the 2010 census, the population of Pantops was 1,845. The racial makeup of the area was 87.3% White, 8.2% African American, 0.7% Asian, 0.2% Native American, and 3.6% from other races.
Common Questions
What is Per Capita Income in Pantops?
Per Capita income in Pantops is $64,084.
What is the Median Family Income in Pantops?
Median Family Income in Pantops is $121,830.
What is the Median Household income in Pantops?
Median Household Income in Pantops is $87,417.
What is Income or Wage Gap in Pantops?
Income or Wage Gap in Pantops is 6.3%.
Women in Pantops earn 93.7 cents for every dollar earned by a man.
What is Inequality or Gini Index in Pantops?
Inequality or Gini Index in Pantops is 0.41.
What is the Total Population of Pantops?
Total Population of Pantops is 4,189.
What is the Total Male Population of Pantops?
Total Male Population of Pantops is 1,833.
What is the Total Female Population of Pantops?
Total Female Population of Pantops is 2,356.
What is the Ratio of Males per 100 Females in Pantops?
There are 77.80 Males per 100 Females in Pantops.
What is the Ratio of Females per 100 Males in Pantops?
There are 128.53 Females per 100 Males in Pantops.
What is the Median Population Age in Pantops?
Median Population Age in Pantops is 42.0 Years.
What is the Average Family Size in Pantops
Average Family Size in Pantops is 2.5 People.
What is the Average Household Size in Pantops
Average Household Size in Pantops is 1.8 People.
How Large is the Labor Force in Pantops?
There are 2,301 People in the Labor Forcein in Pantops.
What is the Percentage of People in the Labor Force in Pantops?
63.0% of People are in the Labor Force in Pantops.
What is the Unemployment Rate in Pantops?
Unemployment Rate in Pantops is 3.1%.