Nelsonia, VA Map & Demographics
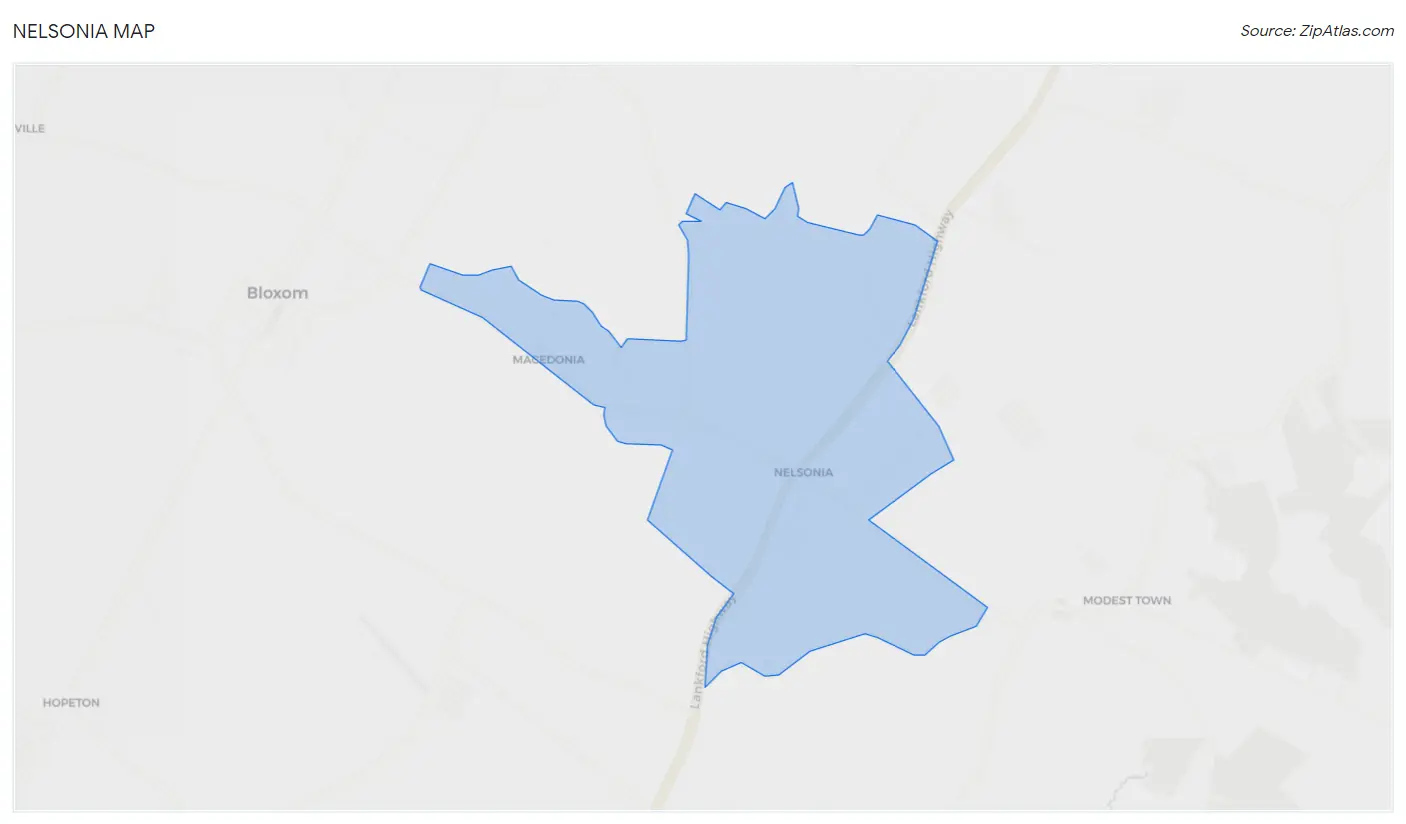
Nelsonia Map
Nelsonia Overview
$36,394
PER CAPITA INCOME
$84,808
AVG FAMILY INCOME
$84,663
AVG HOUSEHOLD INCOME
0.23
INEQUALITY / GINI INDEX
314
TOTAL POPULATION
215
MALE POPULATION
99
FEMALE POPULATION
217.17
MALES / 100 FEMALES
46.05
FEMALES / 100 MALES
41.0
MEDIAN AGE
2.3
AVG FAMILY SIZE
2.2
AVG HOUSEHOLD SIZE
177
LABOR FORCE [ PEOPLE ]
71.4%
PERCENT IN LABOR FORCE
6.2%
UNEMPLOYMENT RATE
Nelsonia Zip Codes
Nelsonia Area Codes
Income in Nelsonia
Income Overview in Nelsonia
Per Capita Income in Nelsonia is $36,394, while median incomes of families and households are $84,808 and $84,663 respectively.
| Characteristic | Number | Measure |
| Per Capita Income | 314 | $36,394 |
| Median Family Income | 134 | $84,808 |
| Mean Family Income | 134 | $91,512 |
| Median Household Income | 140 | $84,663 |
| Mean Household Income | 140 | $88,296 |
| Income Deficit | 134 | $0 |
| Wage / Income Gap (%) | 314 | 0.00% |
| Wage / Income Gap ($) | 314 | 100.00¢ per $1 |
| Gini / Inequality Index | 314 | 0.23 |
Earnings by Sex in Nelsonia
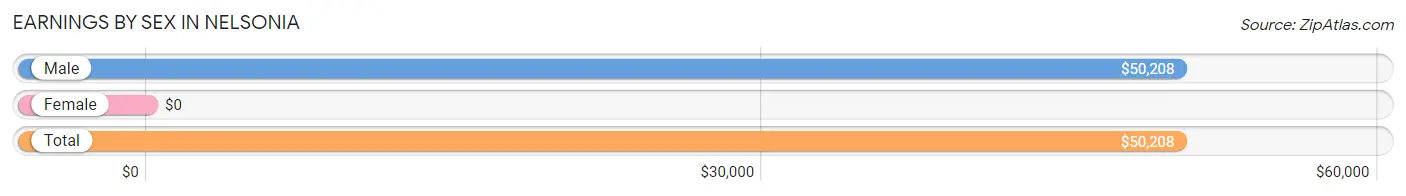
| Sex | Number | Average Earnings |
| Male | 185 (100.0%) | $50,208 |
| Female | 0 (0.0%) | $0 |
| Total | 185 (100.0%) | $50,208 |
Earnings by Sex by Income Bracket in Nelsonia
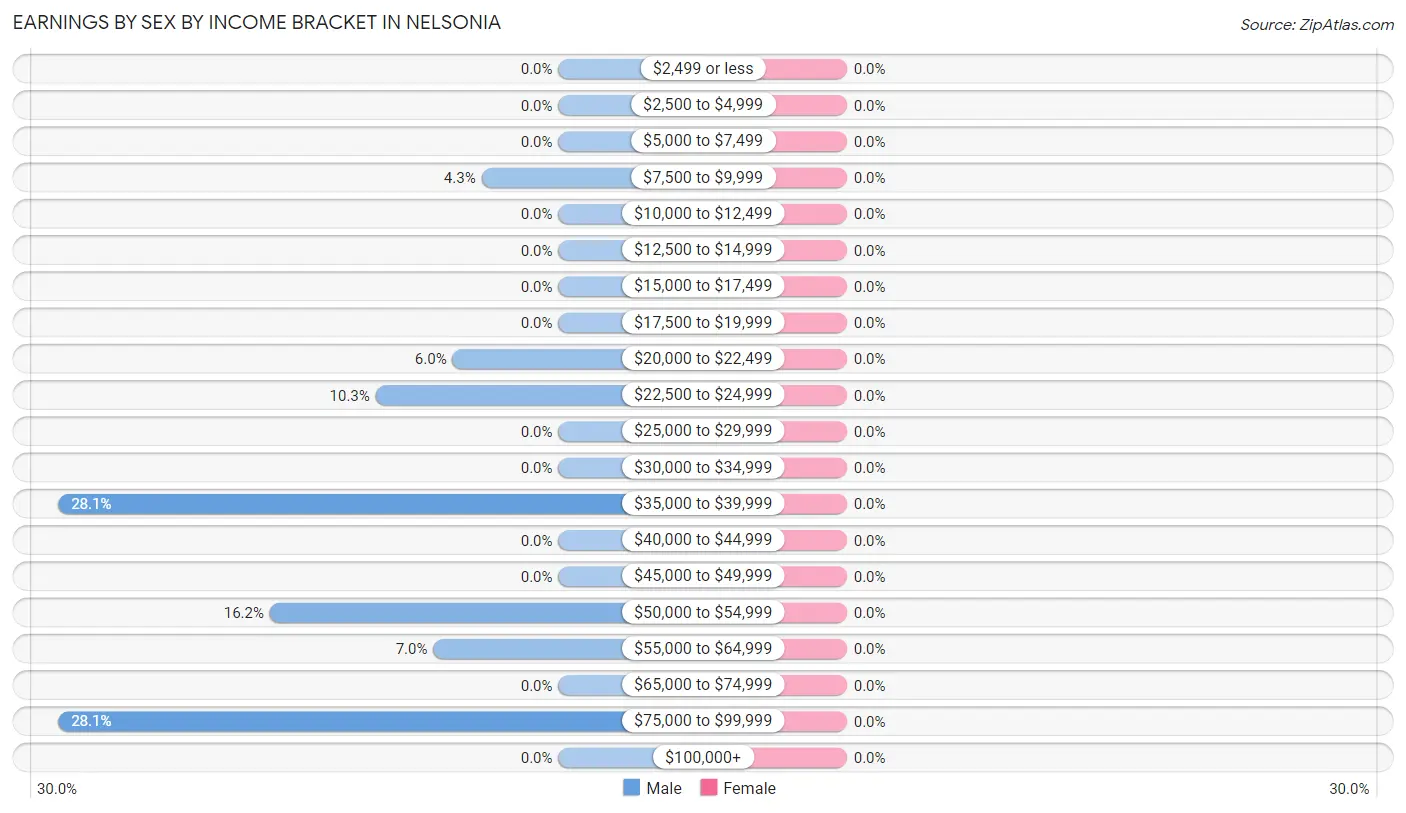
| Income | Male | Female |
| $2,499 or less | 0 (0.0%) | 0 (0.0%) |
| $2,500 to $4,999 | 0 (0.0%) | 0 (0.0%) |
| $5,000 to $7,499 | 0 (0.0%) | 0 (0.0%) |
| $7,500 to $9,999 | 8 (4.3%) | 0 (0.0%) |
| $10,000 to $12,499 | 0 (0.0%) | 0 (0.0%) |
| $12,500 to $14,999 | 0 (0.0%) | 0 (0.0%) |
| $15,000 to $17,499 | 0 (0.0%) | 0 (0.0%) |
| $17,500 to $19,999 | 0 (0.0%) | 0 (0.0%) |
| $20,000 to $22,499 | 11 (5.9%) | 0 (0.0%) |
| $22,500 to $24,999 | 19 (10.3%) | 0 (0.0%) |
| $25,000 to $29,999 | 0 (0.0%) | 0 (0.0%) |
| $30,000 to $34,999 | 0 (0.0%) | 0 (0.0%) |
| $35,000 to $39,999 | 52 (28.1%) | 0 (0.0%) |
| $40,000 to $44,999 | 0 (0.0%) | 0 (0.0%) |
| $45,000 to $49,999 | 0 (0.0%) | 0 (0.0%) |
| $50,000 to $54,999 | 30 (16.2%) | 0 (0.0%) |
| $55,000 to $64,999 | 13 (7.0%) | 0 (0.0%) |
| $65,000 to $74,999 | 0 (0.0%) | 0 (0.0%) |
| $75,000 to $99,999 | 52 (28.1%) | 0 (0.0%) |
| $100,000+ | 0 (0.0%) | 0 (0.0%) |
| Total | 185 (100.0%) | 0 (0.0%) |
Earnings by Sex by Educational Attainment in Nelsonia
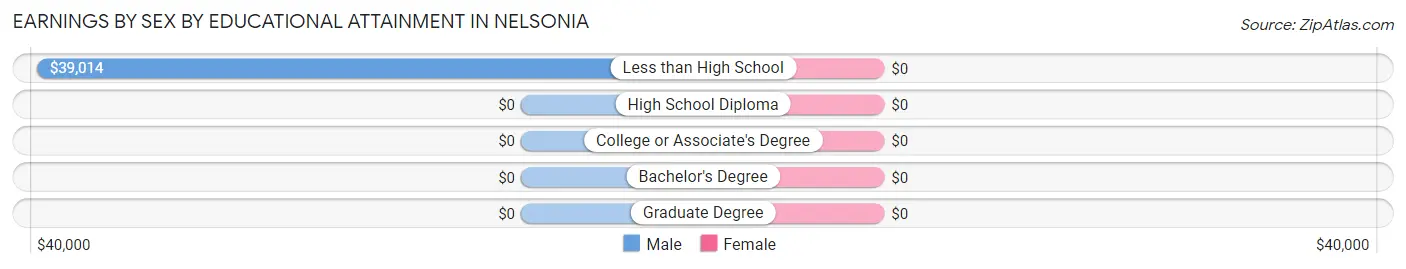
| Educational Attainment | Male Income | Female Income |
| Less than High School | $39,014 | $0 |
| High School Diploma | - | - |
| College or Associate's Degree | - | - |
| Bachelor's Degree | - | - |
| Graduate Degree | - | - |
| Total | $50,208 | $0 |
Family Income in Nelsonia
Family Income Brackets in Nelsonia
According to the Nelsonia family income data, there are 104 families falling into the $75,000 to $99,999 income range, which is the most common income bracket and makes up 77.6% of all families.
| Income Bracket | # Families | % Families |
| Less than $10,000 | 0 | 0.0% |
| $10,000 to $14,999 | 0 | 0.0% |
| $15,000 to $24,999 | 0 | 0.0% |
| $25,000 to $34,999 | 19 | 14.2% |
| $35,000 to $49,999 | 0 | 0.0% |
| $50,000 to $74,999 | 0 | 0.0% |
| $75,000 to $99,999 | 104 | 77.6% |
| $100,000 to $149,999 | 0 | 0.0% |
| $150,000 to $199,999 | 0 | 0.0% |
| $200,000+ | 11 | 8.2% |
Family Income by Famaliy Size in Nelsonia
| Income Bracket | # Families | Median Income |
| 2-Person Families | 104 (77.6%) | $0 |
| 3-Person Families | 0 (0.0%) | $0 |
| 4-Person Families | 0 (0.0%) | $0 |
| 5-Person Families | 30 (22.4%) | $0 |
| 6-Person Families | 0 (0.0%) | $0 |
| 7+ Person Families | 0 (0.0%) | $0 |
| Total | 134 (100.0%) | $84,808 |
Family Income by Number of Earners in Nelsonia
| Number of Earners | # Families | Median Income |
| No Earners | 0 (0.0%) | $0 |
| 1 Earner | 71 (53.0%) | $0 |
| 2 Earners | 52 (38.8%) | $0 |
| 3+ Earners | 11 (8.2%) | $0 |
| Total | 134 (100.0%) | $84,808 |
Household Income in Nelsonia
Household Income Brackets in Nelsonia
With 104 households falling in the category, the $75,000 to $99,999 income range is the most frequent in Nelsonia, accounting for 74.3% of all households.
| Income Bracket | # Households | % Households |
| Less than $10,000 | 0 | 0.0% |
| $10,000 to $14,999 | 0 | 0.0% |
| $15,000 to $24,999 | 6 | 4.3% |
| $25,000 to $34,999 | 19 | 13.6% |
| $35,000 to $49,999 | 0 | 0.0% |
| $50,000 to $74,999 | 0 | 0.0% |
| $75,000 to $99,999 | 104 | 74.3% |
| $100,000 to $149,999 | 0 | 0.0% |
| $150,000 to $199,999 | 0 | 0.0% |
| $200,000+ | 11 | 7.9% |
Household Income by Householder Age in Nelsonia
The median household income in Nelsonia is $84,663, with the highest median household income of $84,543 found in the 25 to 44 years age bracket for the primary householder. A total of 123 households (87.9%) fall into this category.
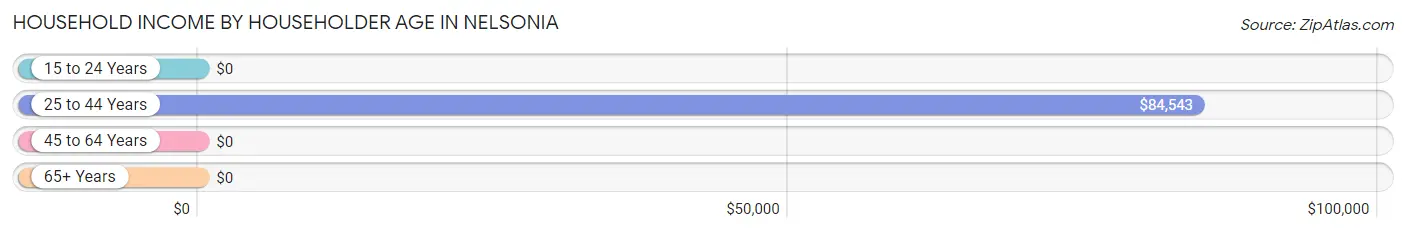
| Income Bracket | # Households | Median Income |
| 15 to 24 Years | 0 (0.0%) | $0 |
| 25 to 44 Years | 123 (87.9%) | $84,543 |
| 45 to 64 Years | 0 (0.0%) | $0 |
| 65+ Years | 17 (12.1%) | $0 |
| Total | 140 (100.0%) | $84,663 |
Poverty in Nelsonia
Income Below Poverty by Sex and Age in Nelsonia
With 20.0% poverty level for males and 42.4% for females among the residents of Nelsonia, 16 and 17 year old males and 25 to 34 year old females are the most vulnerable to poverty, with 24 males (100.0%) and 14 females (100.0%) in their respective age groups living below the poverty level.
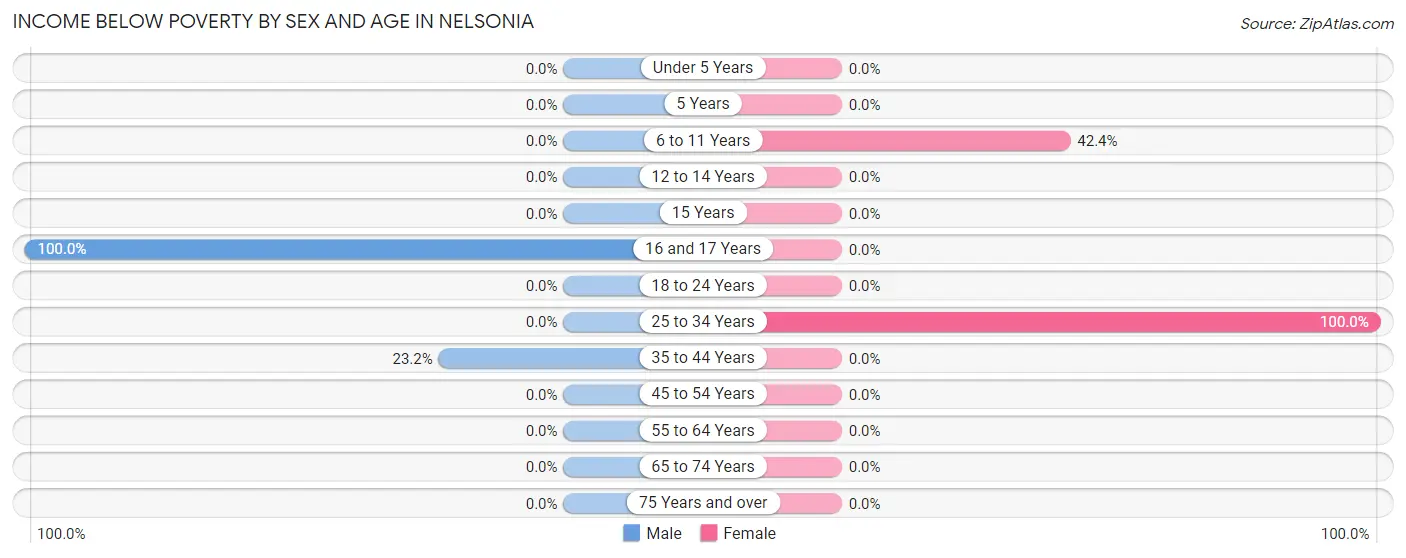
| Age Bracket | Male | Female |
| Under 5 Years | 0 (0.0%) | 0 (0.0%) |
| 5 Years | 0 (0.0%) | 0 (0.0%) |
| 6 to 11 Years | 0 (0.0%) | 28 (42.4%) |
| 12 to 14 Years | 0 (0.0%) | 0 (0.0%) |
| 15 Years | 0 (0.0%) | 0 (0.0%) |
| 16 and 17 Years | 24 (100.0%) | 0 (0.0%) |
| 18 to 24 Years | 0 (0.0%) | 0 (0.0%) |
| 25 to 34 Years | 0 (0.0%) | 14 (100.0%) |
| 35 to 44 Years | 19 (23.2%) | 0 (0.0%) |
| 45 to 54 Years | 0 (0.0%) | 0 (0.0%) |
| 55 to 64 Years | 0 (0.0%) | 0 (0.0%) |
| 65 to 74 Years | 0 (0.0%) | 0 (0.0%) |
| 75 Years and over | 0 (0.0%) | 0 (0.0%) |
| Total | 43 (20.0%) | 42 (42.4%) |
Income Above Poverty by Sex and Age in Nelsonia
According to the poverty statistics in Nelsonia, males aged 25 to 34 years and females aged 65 to 74 years are the age groups that are most secure financially, with 100.0% of males and 100.0% of females in these age groups living above the poverty line.
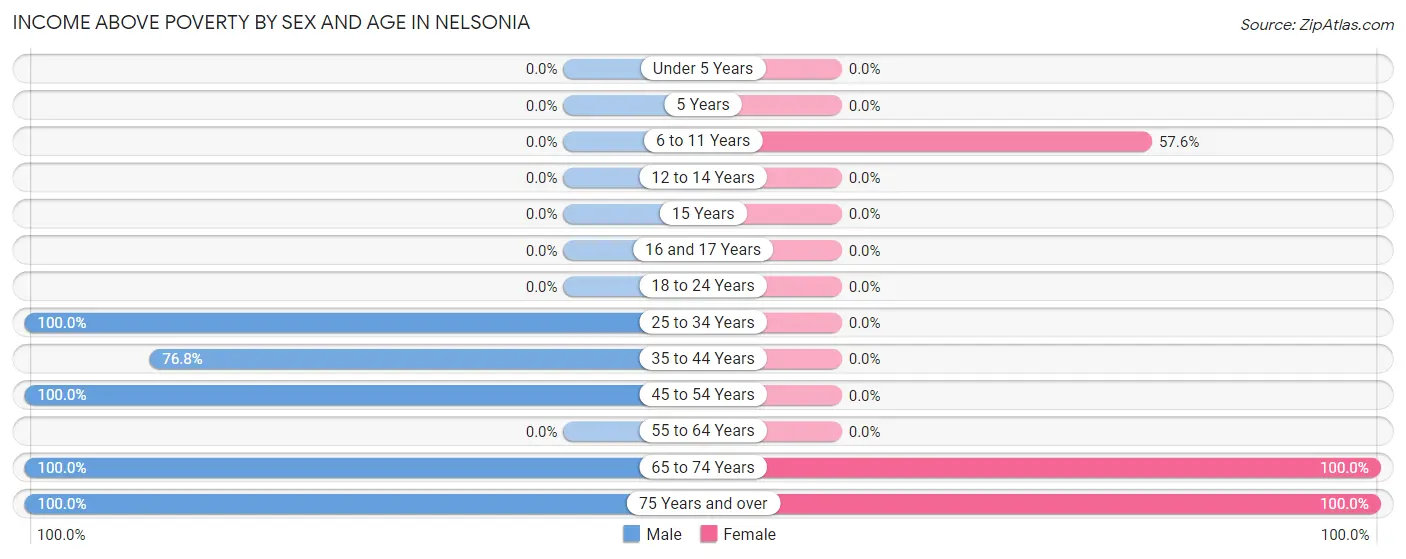
| Age Bracket | Male | Female |
| Under 5 Years | 0 (0.0%) | 0 (0.0%) |
| 5 Years | 0 (0.0%) | 0 (0.0%) |
| 6 to 11 Years | 0 (0.0%) | 38 (57.6%) |
| 12 to 14 Years | 0 (0.0%) | 0 (0.0%) |
| 15 Years | 0 (0.0%) | 0 (0.0%) |
| 16 and 17 Years | 0 (0.0%) | 0 (0.0%) |
| 18 to 24 Years | 0 (0.0%) | 0 (0.0%) |
| 25 to 34 Years | 52 (100.0%) | 0 (0.0%) |
| 35 to 44 Years | 63 (76.8%) | 0 (0.0%) |
| 45 to 54 Years | 38 (100.0%) | 0 (0.0%) |
| 55 to 64 Years | 0 (0.0%) | 0 (0.0%) |
| 65 to 74 Years | 13 (100.0%) | 11 (100.0%) |
| 75 Years and over | 6 (100.0%) | 8 (100.0%) |
| Total | 172 (80.0%) | 57 (57.6%) |
Income Below Poverty Among Married-Couple Families in Nelsonia
The poverty statistics for married-couple families in Nelsonia show that 63.3% or 19 of the total 30 families live below the poverty line. Families with 3 or 4 children have the highest poverty rate of 100.0%, comprising of 19 families. On the other hand, families with no children have the lowest poverty rate of 0.0%, which includes 0 families.
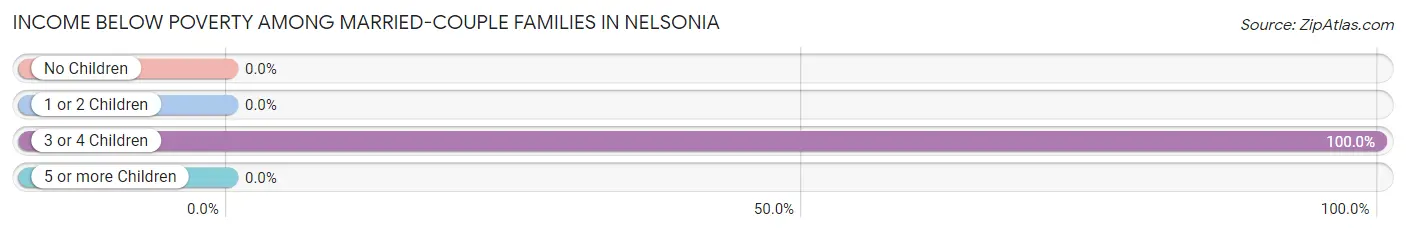
| Children | Above Poverty | Below Poverty |
| No Children | 11 (100.0%) | 0 (0.0%) |
| 1 or 2 Children | 0 (0.0%) | 0 (0.0%) |
| 3 or 4 Children | 0 (0.0%) | 19 (100.0%) |
| 5 or more Children | 0 (0.0%) | 0 (0.0%) |
| Total | 11 (36.7%) | 19 (63.3%) |
Income Below Poverty Among Single-Parent Households in Nelsonia
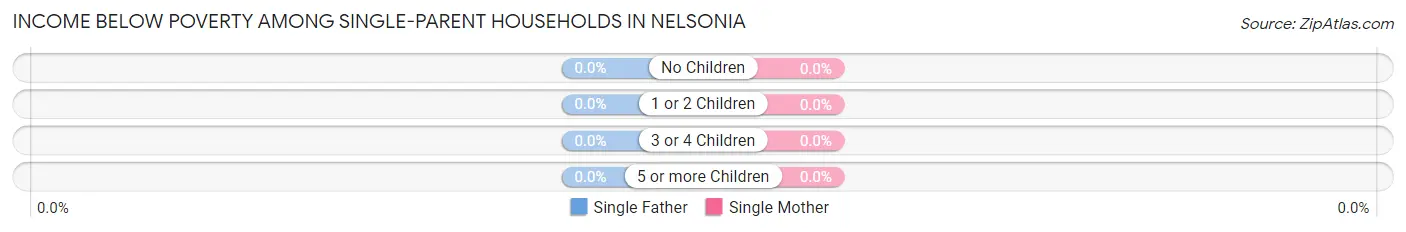
| Children | Single Father | Single Mother |
| No Children | 0 (0.0%) | 0 (0.0%) |
| 1 or 2 Children | 0 (0.0%) | 0 (0.0%) |
| 3 or 4 Children | 0 (0.0%) | 0 (0.0%) |
| 5 or more Children | 0 (0.0%) | 0 (0.0%) |
| Total | 0 (0.0%) | 0 (0.0%) |
Income Below Poverty Among Married-Couple vs Single-Parent Households in Nelsonia
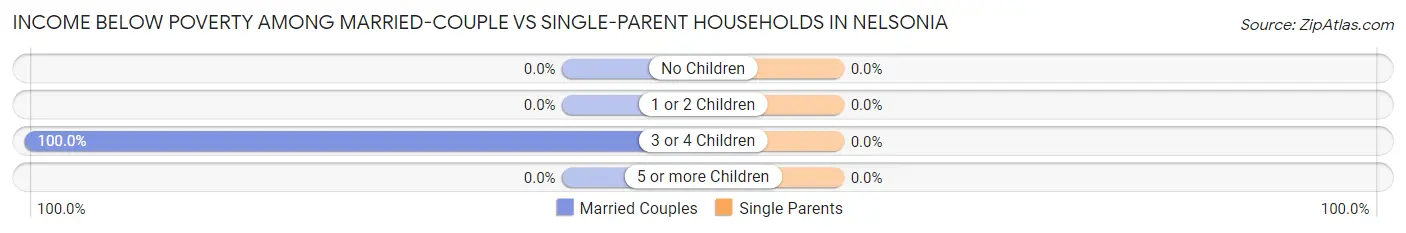
| Children | Married-Couple Families | Single-Parent Households |
| No Children | 0 (0.0%) | 0 (0.0%) |
| 1 or 2 Children | 0 (0.0%) | 0 (0.0%) |
| 3 or 4 Children | 19 (100.0%) | 0 (0.0%) |
| 5 or more Children | 0 (0.0%) | 0 (0.0%) |
| Total | 19 (63.3%) | 0 (0.0%) |
Race in Nelsonia
The most populous races in Nelsonia are White / Caucasian (232 | 73.9%), Hispanic or Latino (85 | 27.1%), and Black / African American (82 | 26.1%).
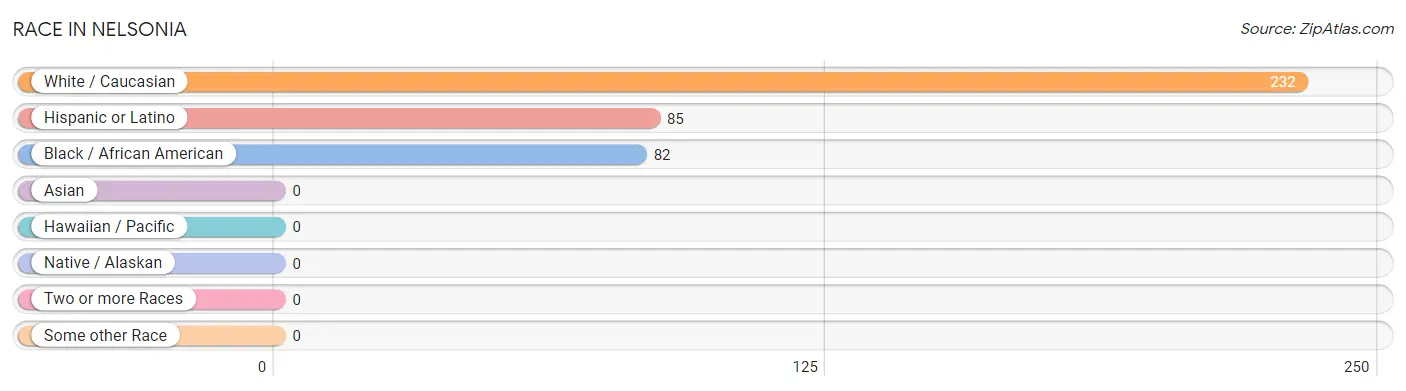
| Race | # Population | % Population |
| Asian | 0 | 0.0% |
| Black / African American | 82 | 26.1% |
| Hawaiian / Pacific | 0 | 0.0% |
| Hispanic or Latino | 85 | 27.1% |
| Native / Alaskan | 0 | 0.0% |
| White / Caucasian | 232 | 73.9% |
| Two or more Races | 0 | 0.0% |
| Some other Race | 0 | 0.0% |
| Total | 314 | 100.0% |
Ancestry in Nelsonia
The most populous ancestries reported in Nelsonia are Mexican (85 | 27.1%), Haitian (82 | 26.1%), Irish (43 | 13.7%), German (19 | 6.0%), and Polish (19 | 6.0%), together accounting for 79.0% of all Nelsonia residents.
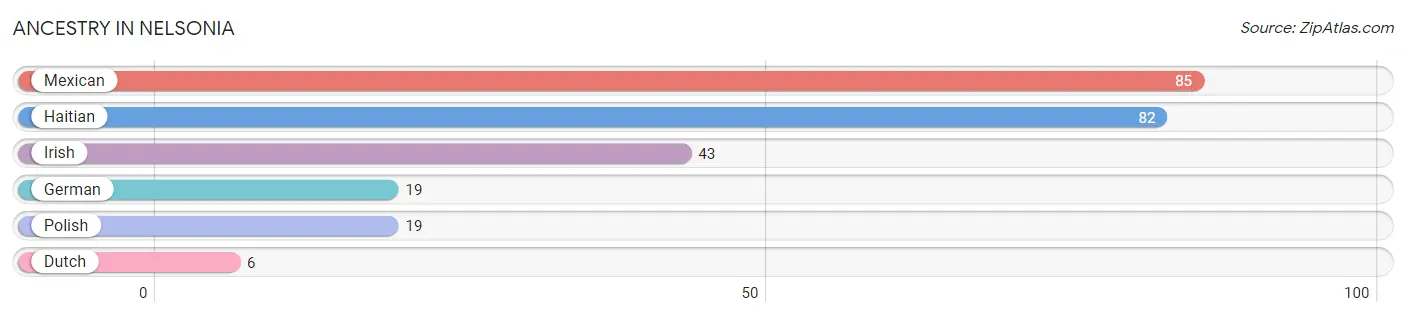
| Ancestry | # Population | % Population |
| Dutch | 6 | 1.9% |
| German | 19 | 6.0% |
| Haitian | 82 | 26.1% |
| Irish | 43 | 13.7% |
| Mexican | 85 | 27.1% |
| Polish | 19 | 6.0% | View All 6 Rows |
Immigrants in Nelsonia
The most numerous immigrant groups reported in Nelsonia came from Latin America (101 | 32.2%), Caribbean (82 | 26.1%), Haiti (82 | 26.1%), Central America (19 | 6.0%), and Guatemala (19 | 6.0%), together accounting for 96.5% of all Nelsonia residents.
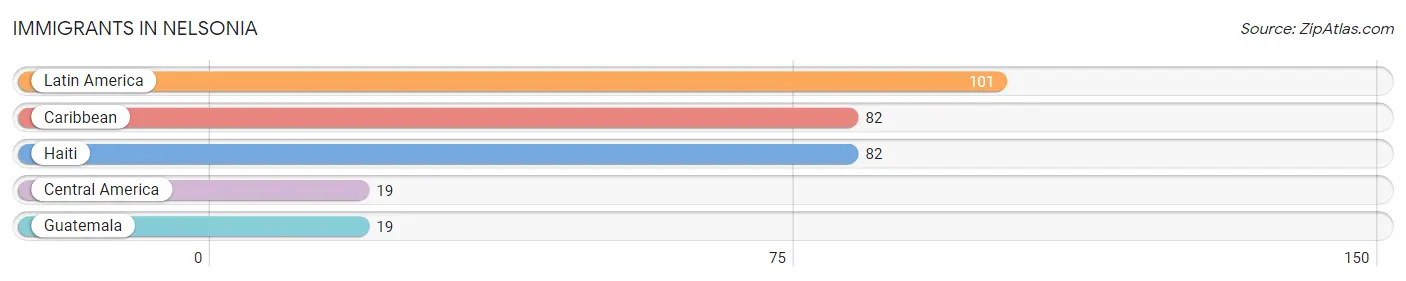
| Immigration Origin | # Population | % Population |
| Caribbean | 82 | 26.1% |
| Central America | 19 | 6.0% |
| Guatemala | 19 | 6.0% |
| Haiti | 82 | 26.1% |
| Latin America | 101 | 32.2% | View All 5 Rows |
Sex and Age in Nelsonia
Sex and Age in Nelsonia
The most populous age groups in Nelsonia are 40 to 44 Years (82 | 38.1%) for men and 5 to 9 Years (52 | 52.5%) for women.
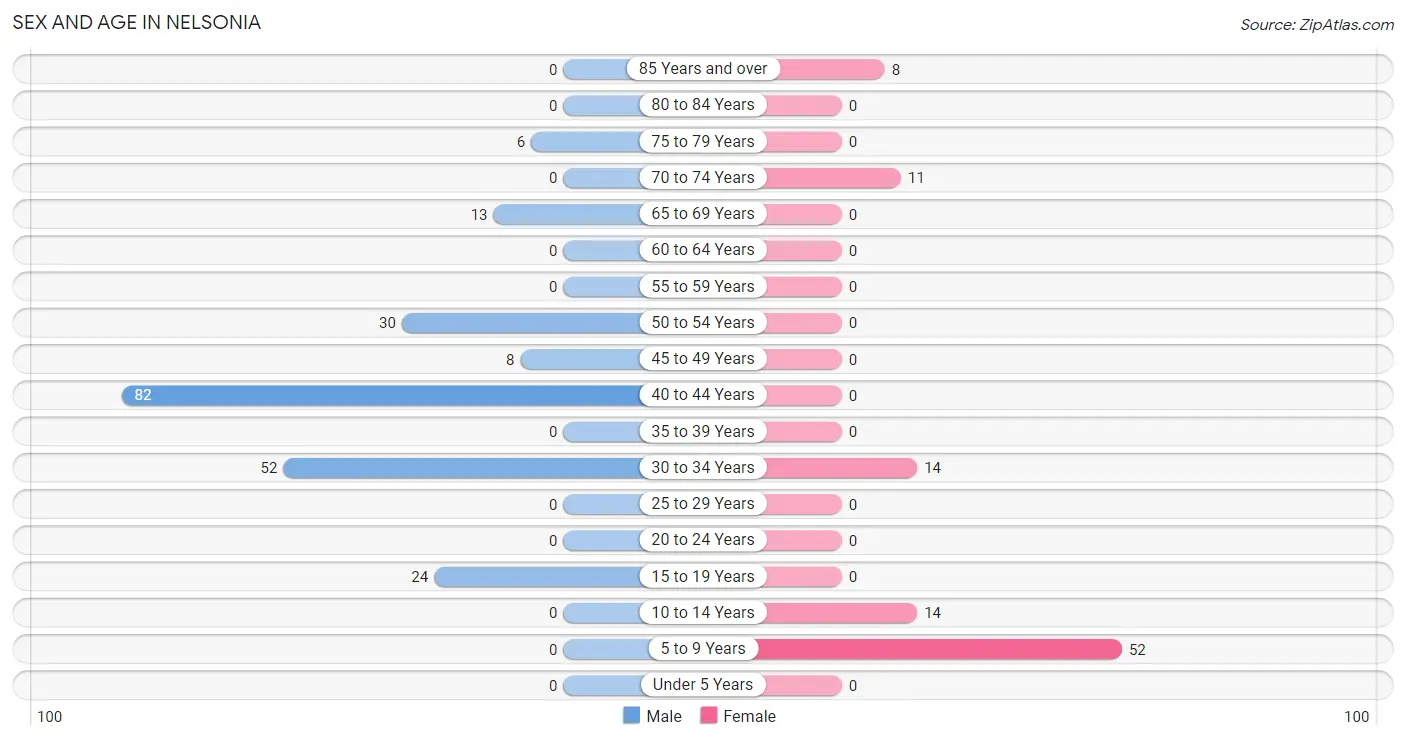
| Age Bracket | Male | Female |
| Under 5 Years | 0 (0.0%) | 0 (0.0%) |
| 5 to 9 Years | 0 (0.0%) | 52 (52.5%) |
| 10 to 14 Years | 0 (0.0%) | 14 (14.1%) |
| 15 to 19 Years | 24 (11.2%) | 0 (0.0%) |
| 20 to 24 Years | 0 (0.0%) | 0 (0.0%) |
| 25 to 29 Years | 0 (0.0%) | 0 (0.0%) |
| 30 to 34 Years | 52 (24.2%) | 14 (14.1%) |
| 35 to 39 Years | 0 (0.0%) | 0 (0.0%) |
| 40 to 44 Years | 82 (38.1%) | 0 (0.0%) |
| 45 to 49 Years | 8 (3.7%) | 0 (0.0%) |
| 50 to 54 Years | 30 (14.0%) | 0 (0.0%) |
| 55 to 59 Years | 0 (0.0%) | 0 (0.0%) |
| 60 to 64 Years | 0 (0.0%) | 0 (0.0%) |
| 65 to 69 Years | 13 (6.0%) | 0 (0.0%) |
| 70 to 74 Years | 0 (0.0%) | 11 (11.1%) |
| 75 to 79 Years | 6 (2.8%) | 0 (0.0%) |
| 80 to 84 Years | 0 (0.0%) | 0 (0.0%) |
| 85 Years and over | 0 (0.0%) | 8 (8.1%) |
| Total | 215 (100.0%) | 99 (100.0%) |
Families and Households in Nelsonia
Median Family Size in Nelsonia
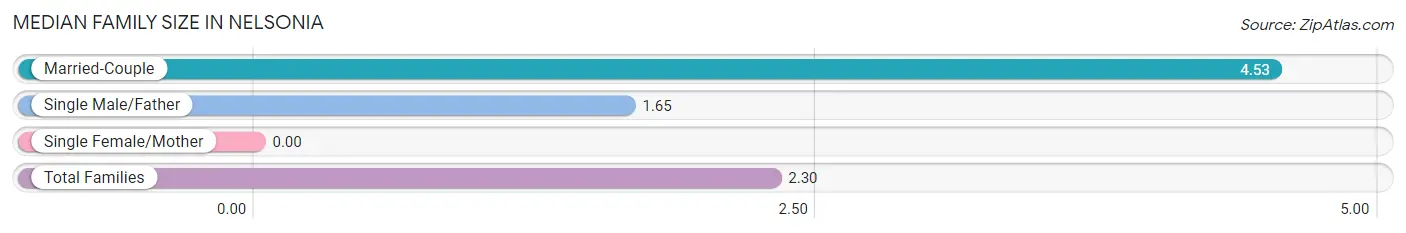
| Family Type | # Families | Family Size |
| Married-Couple | 30 (22.4%) | 4.53 |
| Single Male/Father | 104 (77.6%) | 1.65 |
| Single Female/Mother | 0 (0.0%) | - |
| Total Families | 134 (100.0%) | 2.30 |
Median Household Size in Nelsonia
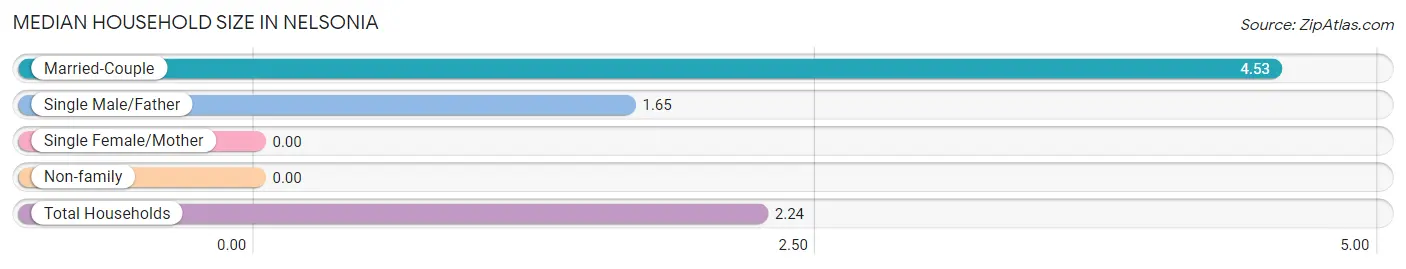
| Household Type | # Households | Household Size |
| Married-Couple | 30 (21.4%) | 4.53 |
| Single Male/Father | 104 (74.3%) | 1.65 |
| Single Female/Mother | 0 (0.0%) | - |
| Non-family | 6 (4.3%) | - |
| Total Households | 140 (100.0%) | 2.24 |
Household Size by Marriage Status in Nelsonia
Out of a total of 140 households in Nelsonia, 134 (95.7%) are family households, while 6 (4.3%) are nonfamily households. The most numerous type of family households are 2-person households, comprising 104, and the most common type of nonfamily households are 1-person households, comprising 6.
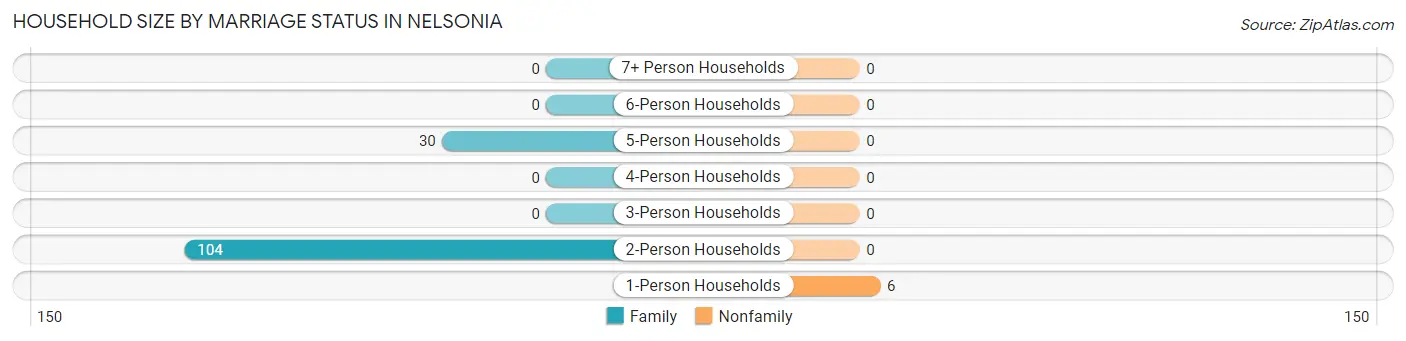
| Household Size | Family Households | Nonfamily Households |
| 1-Person Households | - | 6 (4.3%) |
| 2-Person Households | 104 (74.3%) | 0 (0.0%) |
| 3-Person Households | 0 (0.0%) | 0 (0.0%) |
| 4-Person Households | 0 (0.0%) | 0 (0.0%) |
| 5-Person Households | 30 (21.4%) | 0 (0.0%) |
| 6-Person Households | 0 (0.0%) | 0 (0.0%) |
| 7+ Person Households | 0 (0.0%) | 0 (0.0%) |
| Total | 134 (95.7%) | 6 (4.3%) |
Female Fertility in Nelsonia
Fertility by Age in Nelsonia
| Age Bracket | Women with Births | Births / 1,000 Women |
| 15 to 19 years | 0 (0.0%) | 0.0 |
| 20 to 34 years | 0 (0.0%) | 0.0 |
| 35 to 50 years | 0 (0.0%) | 0.0 |
| Total | 0 (0.0%) | 0.0 |
Fertility by Age by Marriage Status in Nelsonia
| Age Bracket | Married | Unmarried |
| 15 to 19 years | 0 (0.0%) | 0 (0.0%) |
| 20 to 34 years | 0 (0.0%) | 0 (0.0%) |
| 35 to 50 years | 0 (0.0%) | 0 (0.0%) |
| Total | 0 (0.0%) | 0 (0.0%) |
Fertility by Education in Nelsonia
| Educational Attainment | Women with Births | Births / 1,000 Women |
| Less than High School | 0 (0.0%) | 0.0 |
| High School Diploma | 0 (0.0%) | 0.0 |
| College or Associate's Degree | 0 (0.0%) | 0.0 |
| Bachelor's Degree | 0 (0.0%) | 0.0 |
| Graduate Degree | 0 (0.0%) | 0.0 |
| Total | 0 (0.0%) | 0.0 |
Fertility by Education by Marriage Status in Nelsonia
| Educational Attainment | Married | Unmarried |
| Less than High School | 0 (0.0%) | 0 (0.0%) |
| High School Diploma | 0 (0.0%) | 0 (0.0%) |
| College or Associate's Degree | 0 (0.0%) | 0 (0.0%) |
| Bachelor's Degree | 0 (0.0%) | 0 (0.0%) |
| Graduate Degree | 0 (0.0%) | 0 (0.0%) |
| Total | 0 (0.0%) | 0 (0.0%) |
Employment Characteristics in Nelsonia
Employment by Class of Employer in Nelsonia
Among the 166 employed individuals in Nelsonia, private company employees (147 | 88.5%), and self-employed (incorporated) (19 | 11.5%) make up the most common classes of employment.
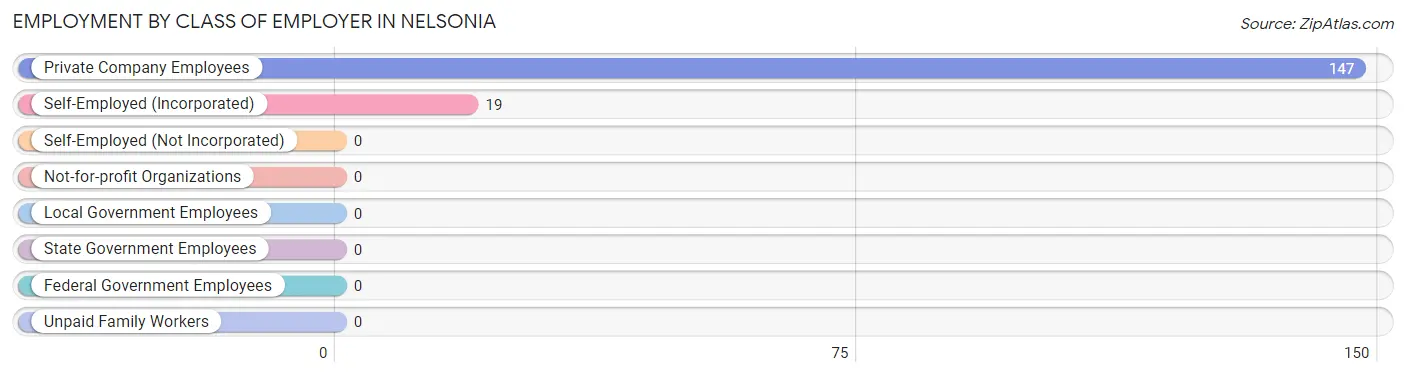
| Employer Class | # Employees | % Employees |
| Private Company Employees | 147 | 88.5% |
| Self-Employed (Incorporated) | 19 | 11.5% |
| Self-Employed (Not Incorporated) | 0 | 0.0% |
| Not-for-profit Organizations | 0 | 0.0% |
| Local Government Employees | 0 | 0.0% |
| State Government Employees | 0 | 0.0% |
| Federal Government Employees | 0 | 0.0% |
| Unpaid Family Workers | 0 | 0.0% |
| Total | 166 | 100.0% |
Employment Status by Age in Nelsonia
According to the labor force statistics for Nelsonia, out of the total population over 16 years of age (248), 71.4% or 177 individuals are in the labor force, with 6.2% or 11 of them unemployed. The age group with the highest labor force participation rate is 35 to 44 years, with 100.0% or 82 individuals in the labor force. Within the labor force, the 35 to 44 years age range has the highest percentage of unemployed individuals, with 13.4% or 11 of them being unemployed.
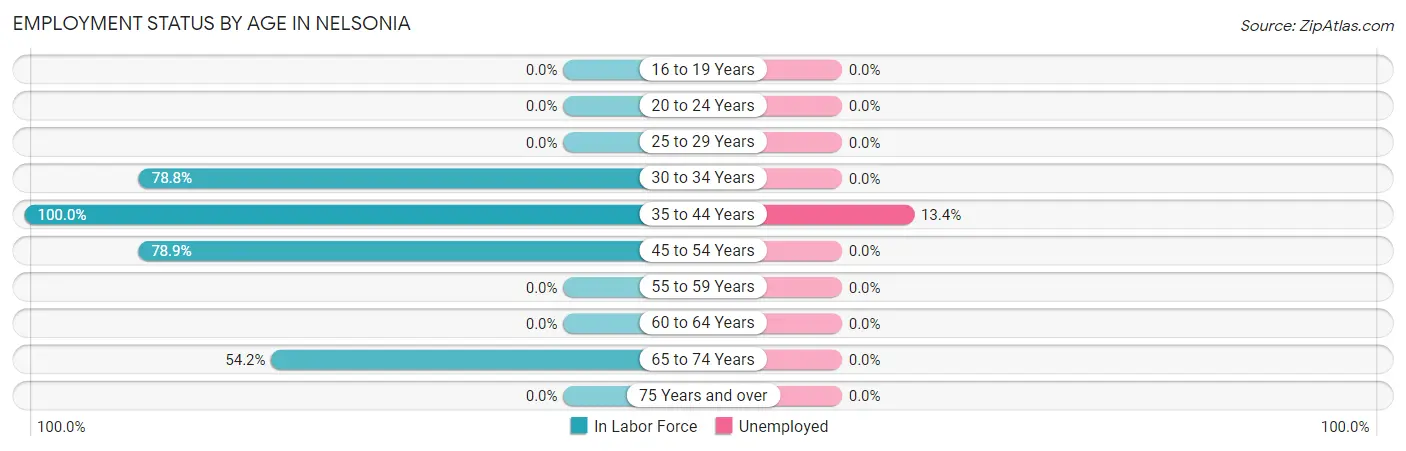
| Age Bracket | In Labor Force | Unemployed |
| 16 to 19 Years | 0 (0.0%) | 0 (0.0%) |
| 20 to 24 Years | 0 (0.0%) | 0 (0.0%) |
| 25 to 29 Years | 0 (0.0%) | 0 (0.0%) |
| 30 to 34 Years | 52 (78.8%) | 0 (0.0%) |
| 35 to 44 Years | 82 (100.0%) | 11 (13.4%) |
| 45 to 54 Years | 30 (78.9%) | 0 (0.0%) |
| 55 to 59 Years | 0 (0.0%) | 0 (0.0%) |
| 60 to 64 Years | 0 (0.0%) | 0 (0.0%) |
| 65 to 74 Years | 13 (54.2%) | 0 (0.0%) |
| 75 Years and over | 0 (0.0%) | 0 (0.0%) |
| Total | 177 (71.4%) | 11 (6.2%) |
Employment Status by Educational Attainment in Nelsonia
According to labor force statistics for Nelsonia, 88.2% of individuals (164) out of the total population between 25 and 64 years of age (186) are in the labor force, with 6.7% or 11 of them being unemployed. The group with the highest labor force participation rate are those with the educational attainment of less than high school, with 100.0% or 101 individuals in the labor force. Within the labor force, individuals with college / associate degree education have the highest percentage of unemployment, with 100.0% or 11 of them being unemployed.
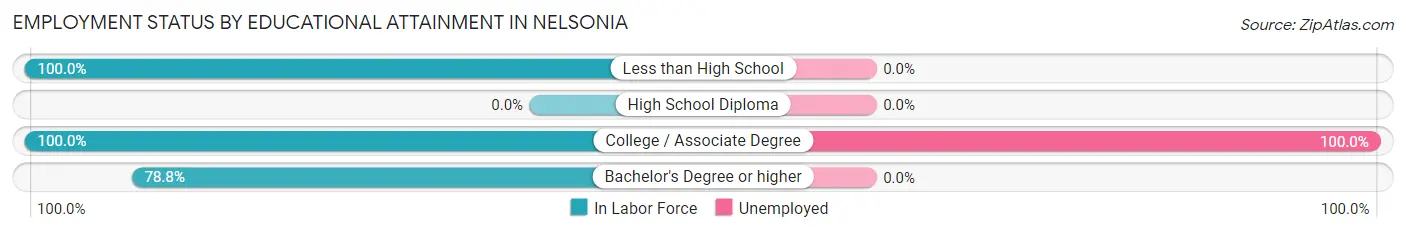
| Educational Attainment | In Labor Force | Unemployed |
| Less than High School | 101 (100.0%) | 0 (0.0%) |
| High School Diploma | 0 (0.0%) | 0 (0.0%) |
| College / Associate Degree | 11 (100.0%) | 11 (100.0%) |
| Bachelor's Degree or higher | 52 (78.8%) | 0 (0.0%) |
| Total | 164 (88.2%) | 12 (6.7%) |
Employment Occupations by Sex in Nelsonia
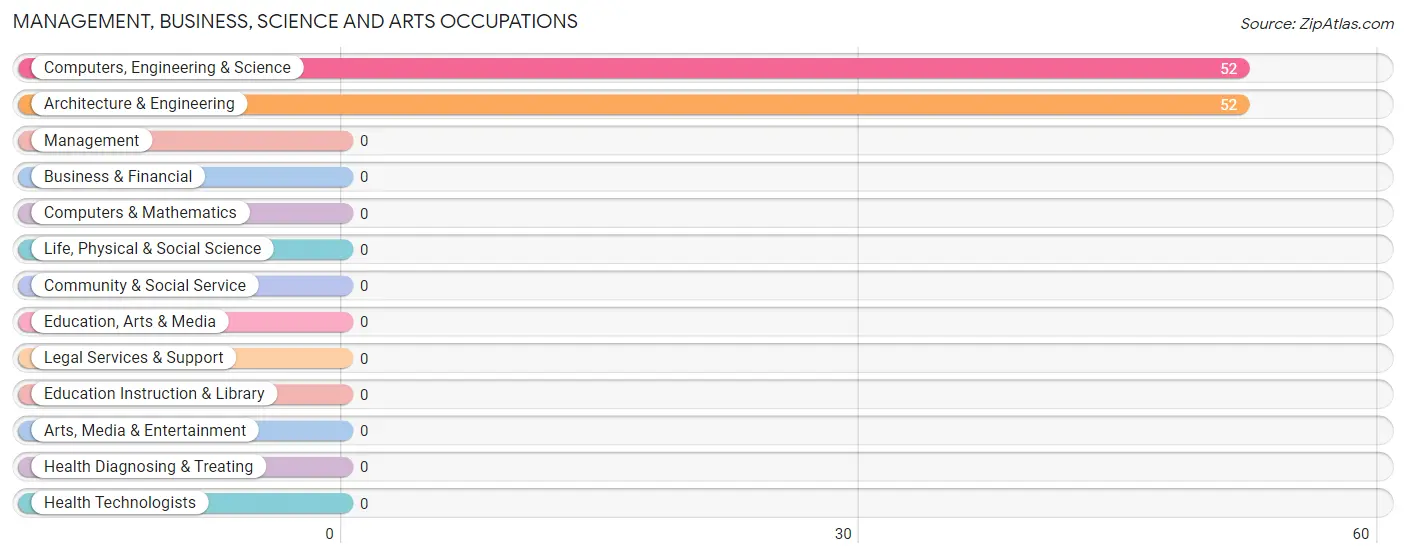
Management, Business, Science and Arts Occupations
The most common Management, Business, Science and Arts occupations in Nelsonia are Computers, Engineering & Science (52 | 31.3%), and Architecture & Engineering (52 | 31.3%).
Management, Business, Science and Arts Occupations by Sex
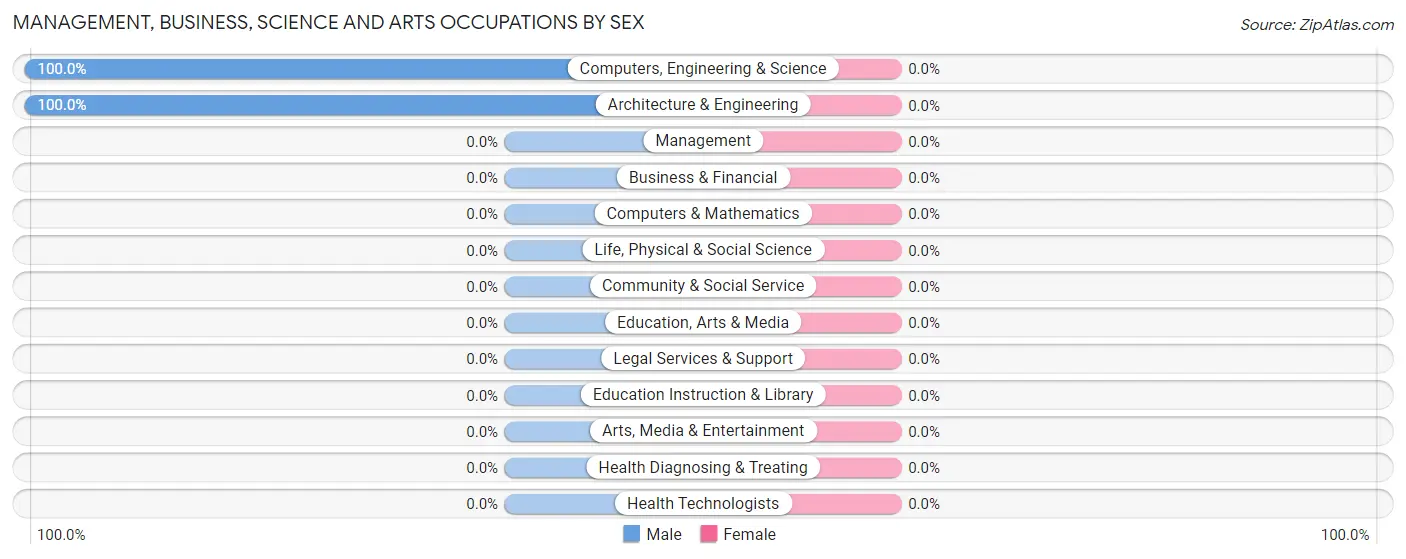
| Occupation | Male | Female |
| Management | 0 (0.0%) | 0 (0.0%) |
| Business & Financial | 0 (0.0%) | 0 (0.0%) |
| Computers, Engineering & Science | 52 (100.0%) | 0 (0.0%) |
| Computers & Mathematics | 0 (0.0%) | 0 (0.0%) |
| Architecture & Engineering | 52 (100.0%) | 0 (0.0%) |
| Life, Physical & Social Science | 0 (0.0%) | 0 (0.0%) |
| Community & Social Service | 0 (0.0%) | 0 (0.0%) |
| Education, Arts & Media | 0 (0.0%) | 0 (0.0%) |
| Legal Services & Support | 0 (0.0%) | 0 (0.0%) |
| Education Instruction & Library | 0 (0.0%) | 0 (0.0%) |
| Arts, Media & Entertainment | 0 (0.0%) | 0 (0.0%) |
| Health Diagnosing & Treating | 0 (0.0%) | 0 (0.0%) |
| Health Technologists | 0 (0.0%) | 0 (0.0%) |
| Total (Category) | 52 (100.0%) | 0 (0.0%) |
| Total (Overall) | 166 (100.0%) | 0 (0.0%) |
Services Occupations
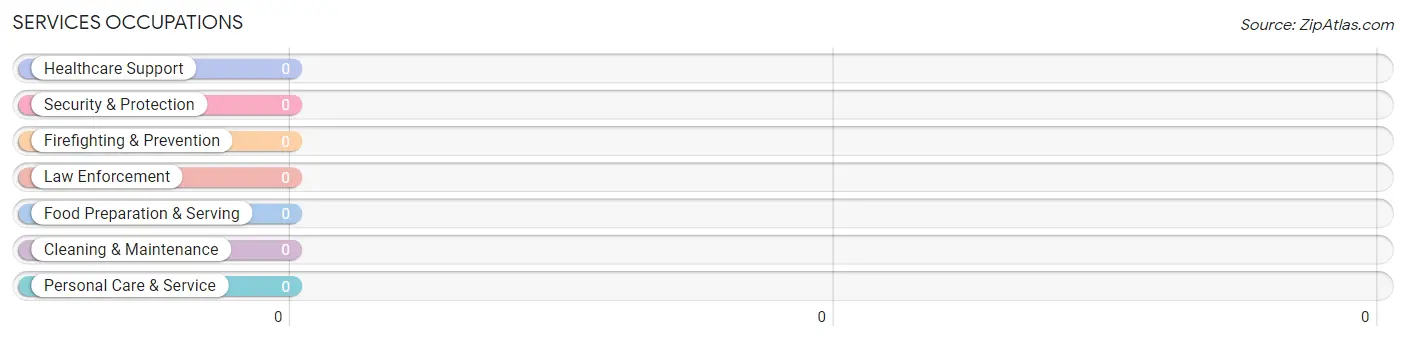
Services Occupations by Sex
| Occupation | Male | Female |
| Healthcare Support | 0 (0.0%) | 0 (0.0%) |
| Security & Protection | 0 (0.0%) | 0 (0.0%) |
| Firefighting & Prevention | 0 (0.0%) | 0 (0.0%) |
| Law Enforcement | 0 (0.0%) | 0 (0.0%) |
| Food Preparation & Serving | 0 (0.0%) | 0 (0.0%) |
| Cleaning & Maintenance | 0 (0.0%) | 0 (0.0%) |
| Personal Care & Service | 0 (0.0%) | 0 (0.0%) |
| Total (Category) | 0 (0.0%) | 0 (0.0%) |
| Total (Overall) | 166 (100.0%) | 0 (0.0%) |
Sales and Office Occupations
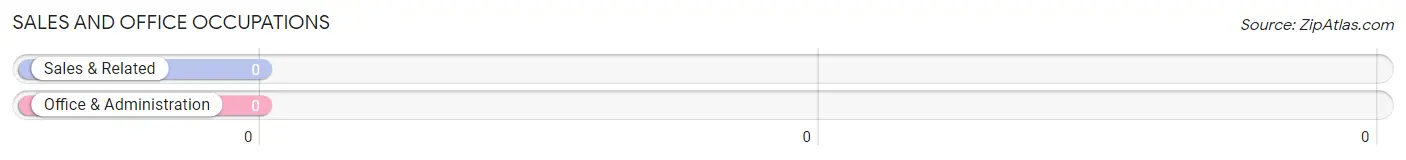
Sales and Office Occupations by Sex
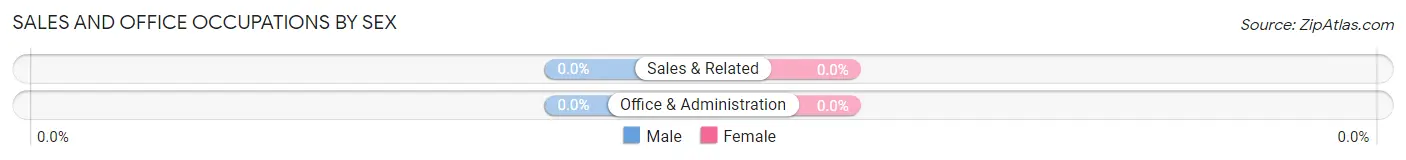
| Occupation | Male | Female |
| Sales & Related | 0 (0.0%) | 0 (0.0%) |
| Office & Administration | 0 (0.0%) | 0 (0.0%) |
| Total (Category) | 0 (0.0%) | 0 (0.0%) |
| Total (Overall) | 166 (100.0%) | 0 (0.0%) |
Natural Resources, Construction and Maintenance Occupations
The most common Natural Resources, Construction and Maintenance occupations in Nelsonia are , and Construction & Extraction (19 | 11.5%).
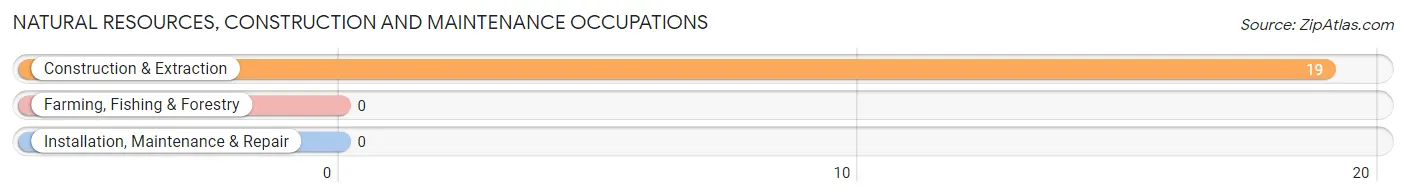
Natural Resources, Construction and Maintenance Occupations by Sex
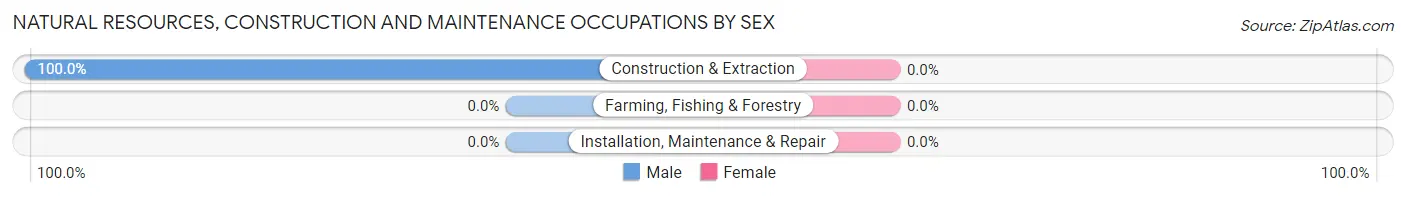
| Occupation | Male | Female |
| Farming, Fishing & Forestry | 0 (0.0%) | 0 (0.0%) |
| Construction & Extraction | 19 (100.0%) | 0 (0.0%) |
| Installation, Maintenance & Repair | 0 (0.0%) | 0 (0.0%) |
| Total (Category) | 19 (100.0%) | 0 (0.0%) |
| Total (Overall) | 166 (100.0%) | 0 (0.0%) |
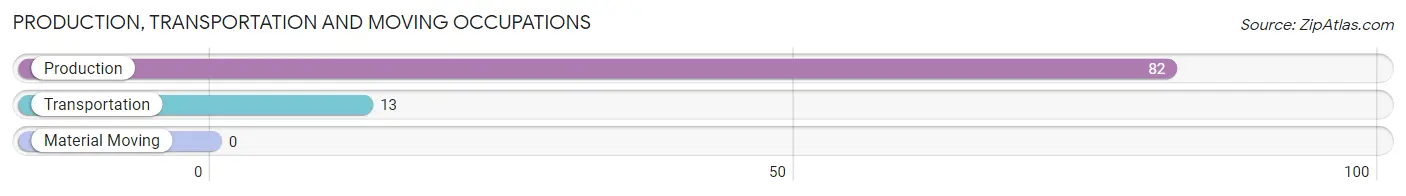
Production, Transportation and Moving Occupations
The most common Production, Transportation and Moving occupations in Nelsonia are Production (82 | 49.4%), and Transportation (13 | 7.8%).
Production, Transportation and Moving Occupations by Sex
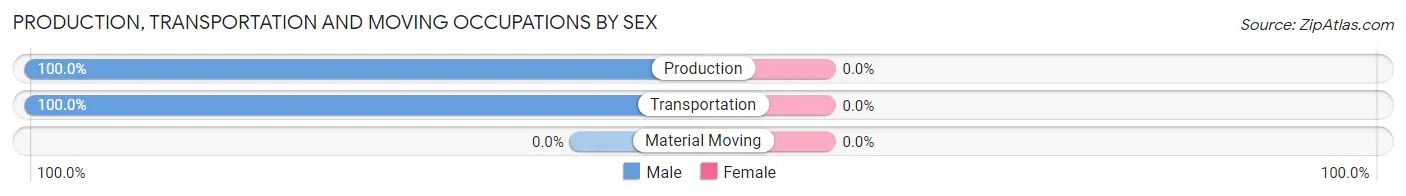
| Occupation | Male | Female |
| Production | 82 (100.0%) | 0 (0.0%) |
| Transportation | 13 (100.0%) | 0 (0.0%) |
| Material Moving | 0 (0.0%) | 0 (0.0%) |
| Total (Category) | 95 (100.0%) | 0 (0.0%) |
| Total (Overall) | 166 (100.0%) | 0 (0.0%) |
Employment Industries by Sex in Nelsonia
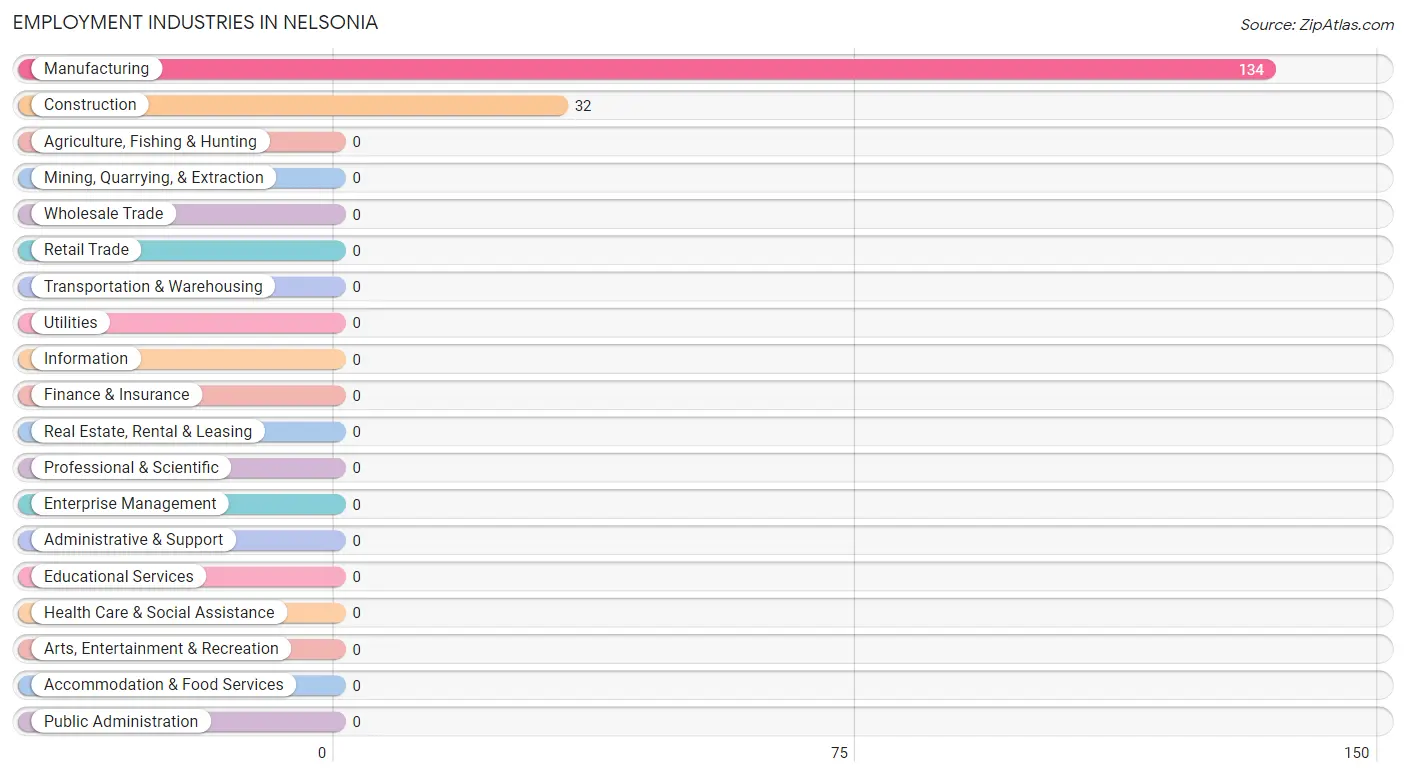
Employment Industries in Nelsonia
The major employment industries in Nelsonia include Manufacturing (134 | 80.7%), and Construction (32 | 19.3%).
Employment Industries by Sex in Nelsonia
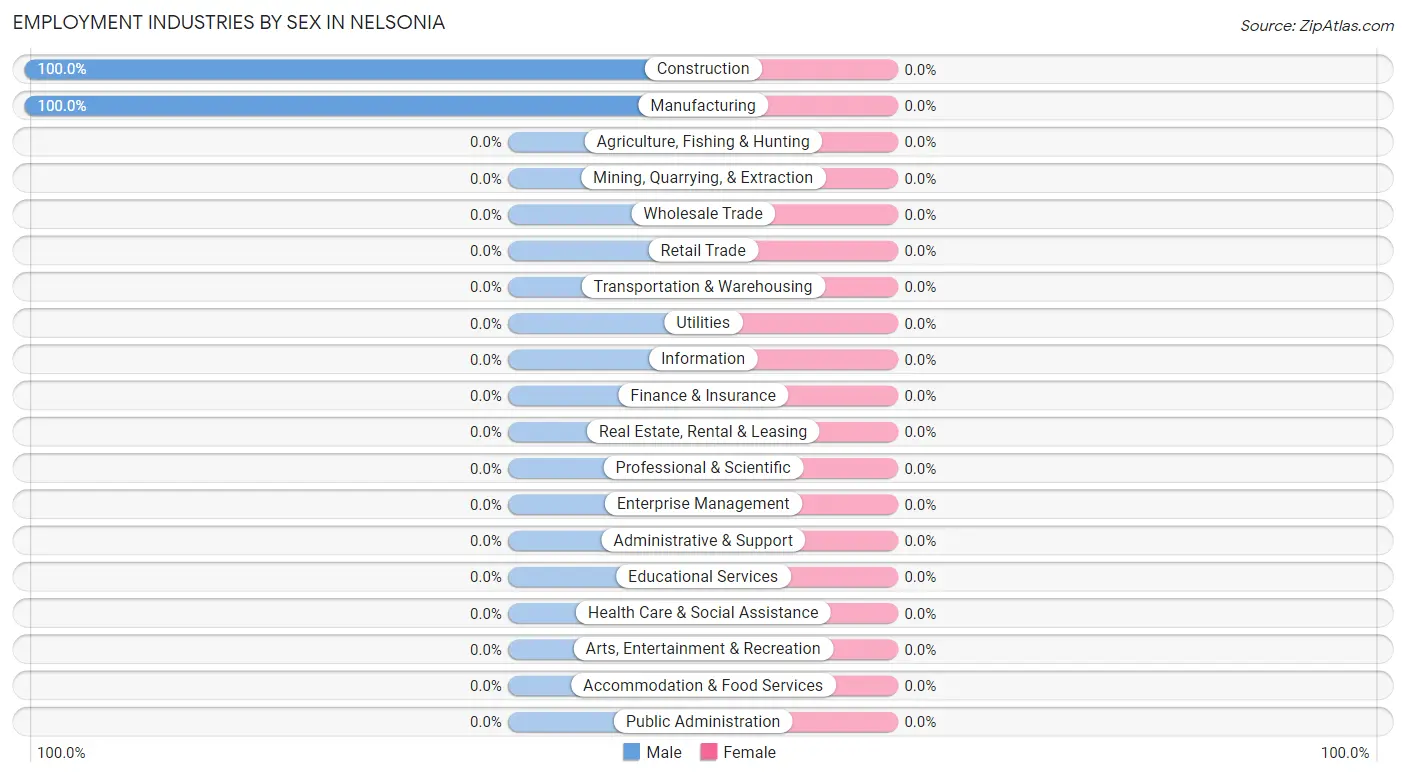
| Industry | Male | Female |
| Agriculture, Fishing & Hunting | 0 (0.0%) | 0 (0.0%) |
| Mining, Quarrying, & Extraction | 0 (0.0%) | 0 (0.0%) |
| Construction | 32 (100.0%) | 0 (0.0%) |
| Manufacturing | 134 (100.0%) | 0 (0.0%) |
| Wholesale Trade | 0 (0.0%) | 0 (0.0%) |
| Retail Trade | 0 (0.0%) | 0 (0.0%) |
| Transportation & Warehousing | 0 (0.0%) | 0 (0.0%) |
| Utilities | 0 (0.0%) | 0 (0.0%) |
| Information | 0 (0.0%) | 0 (0.0%) |
| Finance & Insurance | 0 (0.0%) | 0 (0.0%) |
| Real Estate, Rental & Leasing | 0 (0.0%) | 0 (0.0%) |
| Professional & Scientific | 0 (0.0%) | 0 (0.0%) |
| Enterprise Management | 0 (0.0%) | 0 (0.0%) |
| Administrative & Support | 0 (0.0%) | 0 (0.0%) |
| Educational Services | 0 (0.0%) | 0 (0.0%) |
| Health Care & Social Assistance | 0 (0.0%) | 0 (0.0%) |
| Arts, Entertainment & Recreation | 0 (0.0%) | 0 (0.0%) |
| Accommodation & Food Services | 0 (0.0%) | 0 (0.0%) |
| Public Administration | 0 (0.0%) | 0 (0.0%) |
| Total | 166 (100.0%) | 0 (0.0%) |
Education in Nelsonia
School Enrollment in Nelsonia
The most common levels of schooling among the 90 students in Nelsonia are elementary school (52 | 57.8%), high school (24 | 26.7%), and middle school (14 | 15.6%).
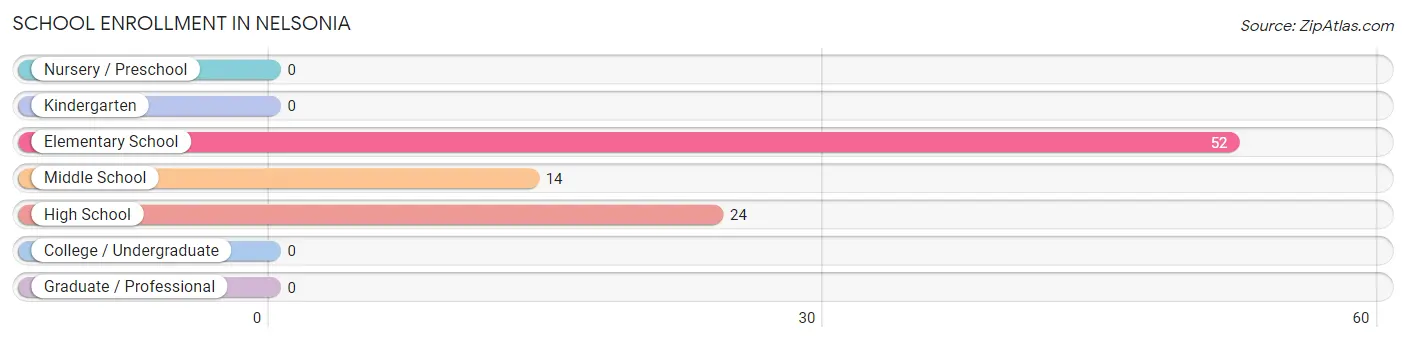
| School Level | # Students | % Students |
| Nursery / Preschool | 0 | 0.0% |
| Kindergarten | 0 | 0.0% |
| Elementary School | 52 | 57.8% |
| Middle School | 14 | 15.6% |
| High School | 24 | 26.7% |
| College / Undergraduate | 0 | 0.0% |
| Graduate / Professional | 0 | 0.0% |
| Total | 90 | 100.0% |
School Enrollment by Age by Funding Source in Nelsonia
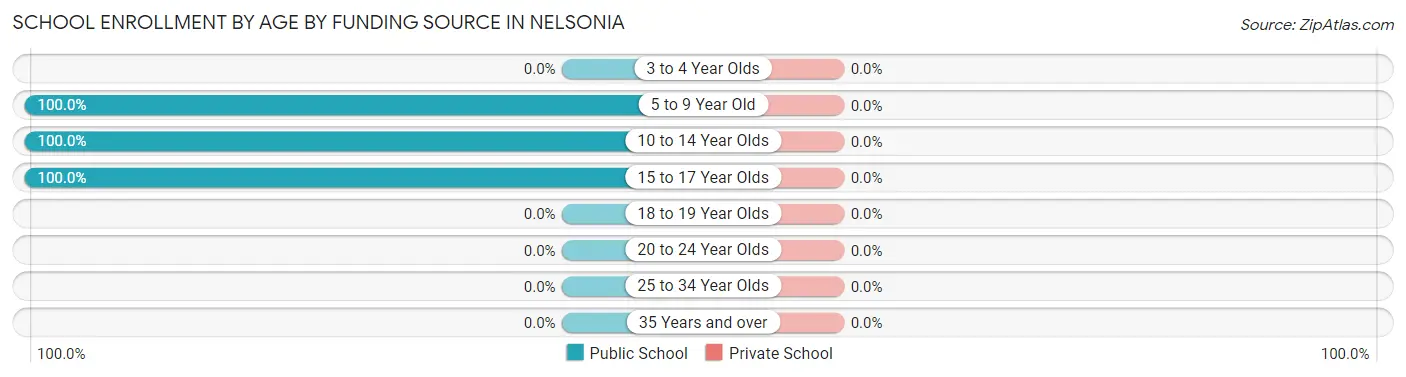
| Age Bracket | Public School | Private School |
| 3 to 4 Year Olds | 0 (0.0%) | 0 (0.0%) |
| 5 to 9 Year Old | 52 (100.0%) | 0 (0.0%) |
| 10 to 14 Year Olds | 14 (100.0%) | 0 (0.0%) |
| 15 to 17 Year Olds | 24 (100.0%) | 0 (0.0%) |
| 18 to 19 Year Olds | 0 (0.0%) | 0 (0.0%) |
| 20 to 24 Year Olds | 0 (0.0%) | 0 (0.0%) |
| 25 to 34 Year Olds | 0 (0.0%) | 0 (0.0%) |
| 35 Years and over | 0 (0.0%) | 0 (0.0%) |
| Total | 90 (100.0%) | 0 (0.0%) |
Educational Attainment by Field of Study in Nelsonia
Computers & mathematics (52 | 78.8%), and psychology (14 | 21.2%) are the most common fields of study among 66 individuals in Nelsonia who have obtained a bachelor's degree or higher.
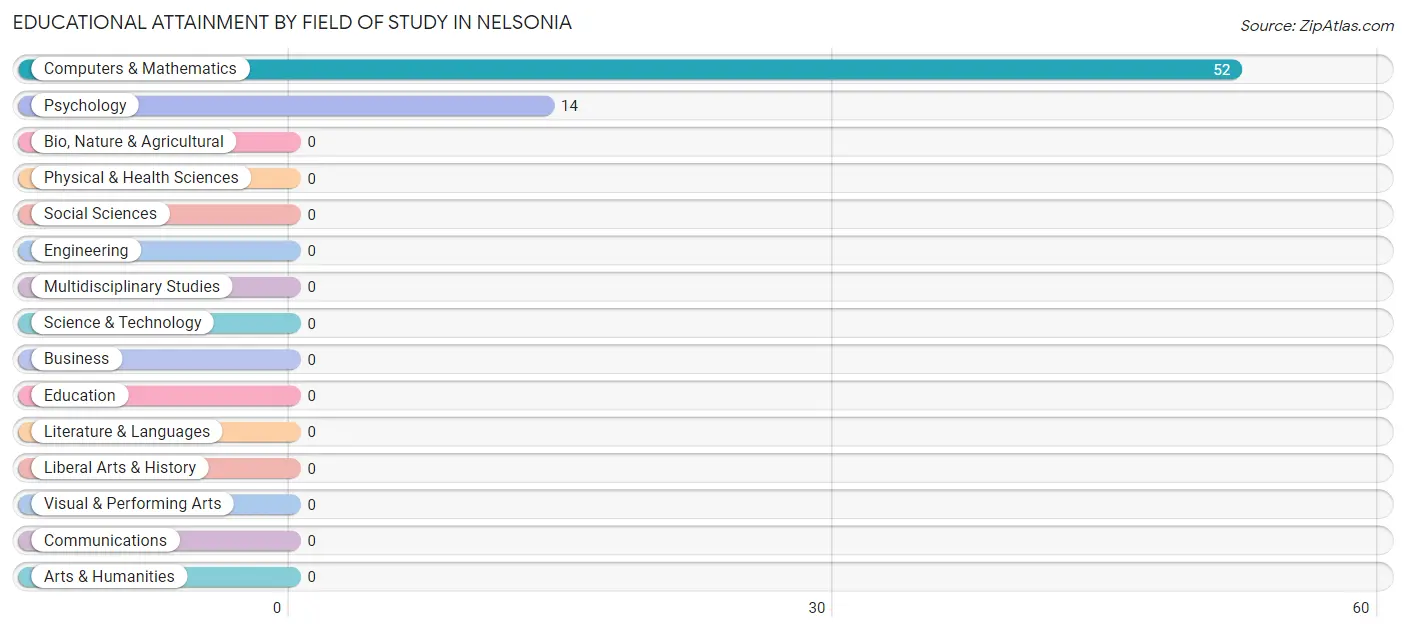
| Field of Study | # Graduates | % Graduates |
| Computers & Mathematics | 52 | 78.8% |
| Bio, Nature & Agricultural | 0 | 0.0% |
| Physical & Health Sciences | 0 | 0.0% |
| Psychology | 14 | 21.2% |
| Social Sciences | 0 | 0.0% |
| Engineering | 0 | 0.0% |
| Multidisciplinary Studies | 0 | 0.0% |
| Science & Technology | 0 | 0.0% |
| Business | 0 | 0.0% |
| Education | 0 | 0.0% |
| Literature & Languages | 0 | 0.0% |
| Liberal Arts & History | 0 | 0.0% |
| Visual & Performing Arts | 0 | 0.0% |
| Communications | 0 | 0.0% |
| Arts & Humanities | 0 | 0.0% |
| Total | 66 | 100.0% |
Transportation & Commute in Nelsonia
Vehicle Availability by Sex in Nelsonia
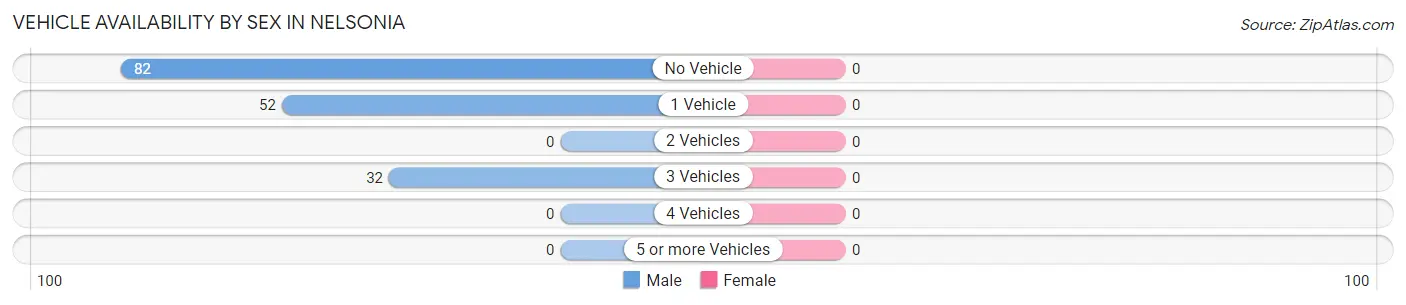
| Vehicles Available | Male | Female |
| No Vehicle | 82 (49.4%) | 0 (0.0%) |
| 1 Vehicle | 52 (31.3%) | 0 (0.0%) |
| 2 Vehicles | 0 (0.0%) | 0 (0.0%) |
| 3 Vehicles | 32 (19.3%) | 0 (0.0%) |
| 4 Vehicles | 0 (0.0%) | 0 (0.0%) |
| 5 or more Vehicles | 0 (0.0%) | 0 (0.0%) |
| Total | 166 (100.0%) | 0 (0.0%) |
Commute Time in Nelsonia
The most frequently occuring commute durations in Nelsonia are 10 to 14 minutes (82 commuters, 49.4%), 15 to 19 minutes (65 commuters, 39.2%), and 60 to 89 minutes (19 commuters, 11.5%).
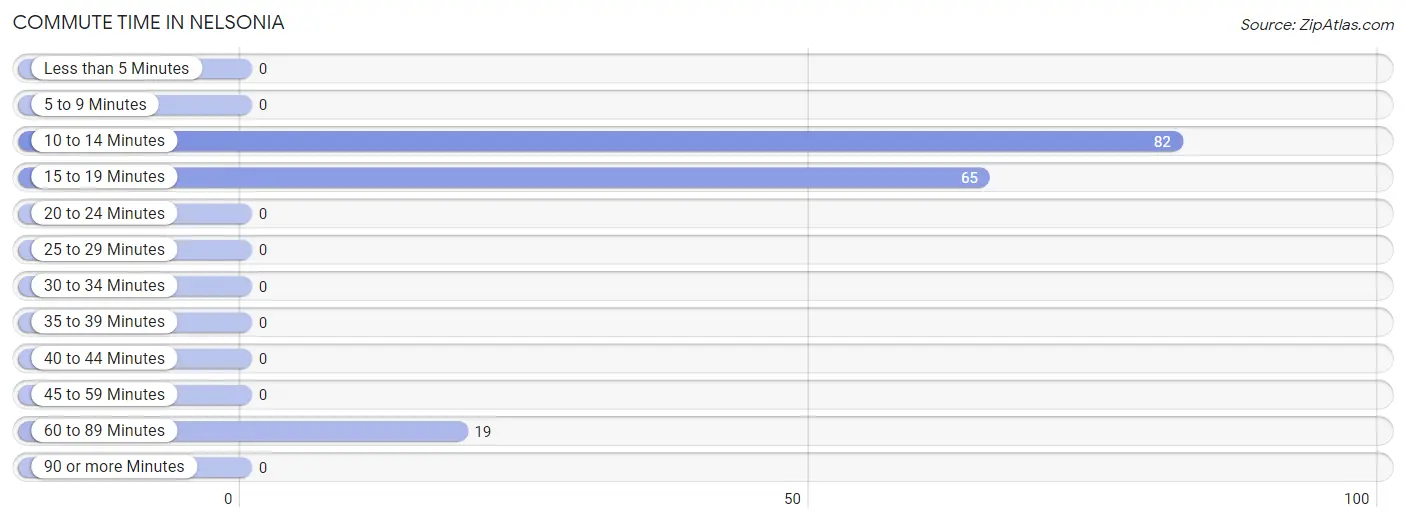
| Commute Time | # Commuters | % Commuters |
| Less than 5 Minutes | 0 | 0.0% |
| 5 to 9 Minutes | 0 | 0.0% |
| 10 to 14 Minutes | 82 | 49.4% |
| 15 to 19 Minutes | 65 | 39.2% |
| 20 to 24 Minutes | 0 | 0.0% |
| 25 to 29 Minutes | 0 | 0.0% |
| 30 to 34 Minutes | 0 | 0.0% |
| 35 to 39 Minutes | 0 | 0.0% |
| 40 to 44 Minutes | 0 | 0.0% |
| 45 to 59 Minutes | 0 | 0.0% |
| 60 to 89 Minutes | 19 | 11.5% |
| 90 or more Minutes | 0 | 0.0% |
Commute Time by Sex in Nelsonia
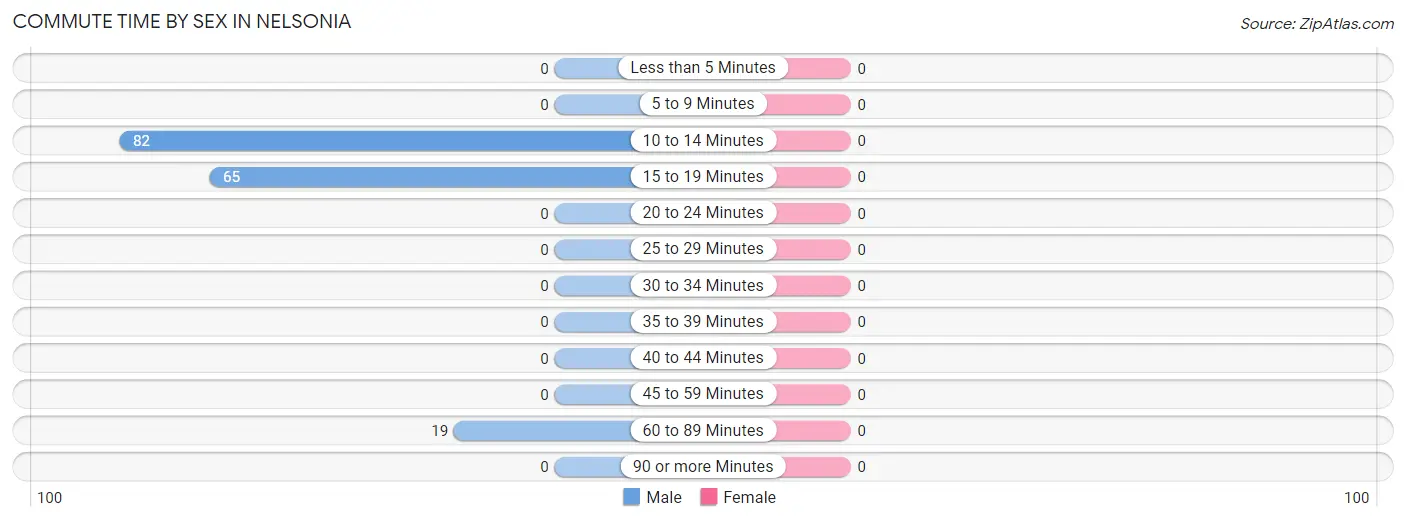
| Commute Time | Male | Female |
| Less than 5 Minutes | 0 (0.0%) | 0 (0.0%) |
| 5 to 9 Minutes | 0 (0.0%) | 0 (0.0%) |
| 10 to 14 Minutes | 82 (49.4%) | 0 (0.0%) |
| 15 to 19 Minutes | 65 (39.2%) | 0 (0.0%) |
| 20 to 24 Minutes | 0 (0.0%) | 0 (0.0%) |
| 25 to 29 Minutes | 0 (0.0%) | 0 (0.0%) |
| 30 to 34 Minutes | 0 (0.0%) | 0 (0.0%) |
| 35 to 39 Minutes | 0 (0.0%) | 0 (0.0%) |
| 40 to 44 Minutes | 0 (0.0%) | 0 (0.0%) |
| 45 to 59 Minutes | 0 (0.0%) | 0 (0.0%) |
| 60 to 89 Minutes | 19 (11.5%) | 0 (0.0%) |
| 90 or more Minutes | 0 (0.0%) | 0 (0.0%) |
Time of Departure to Work by Sex in Nelsonia
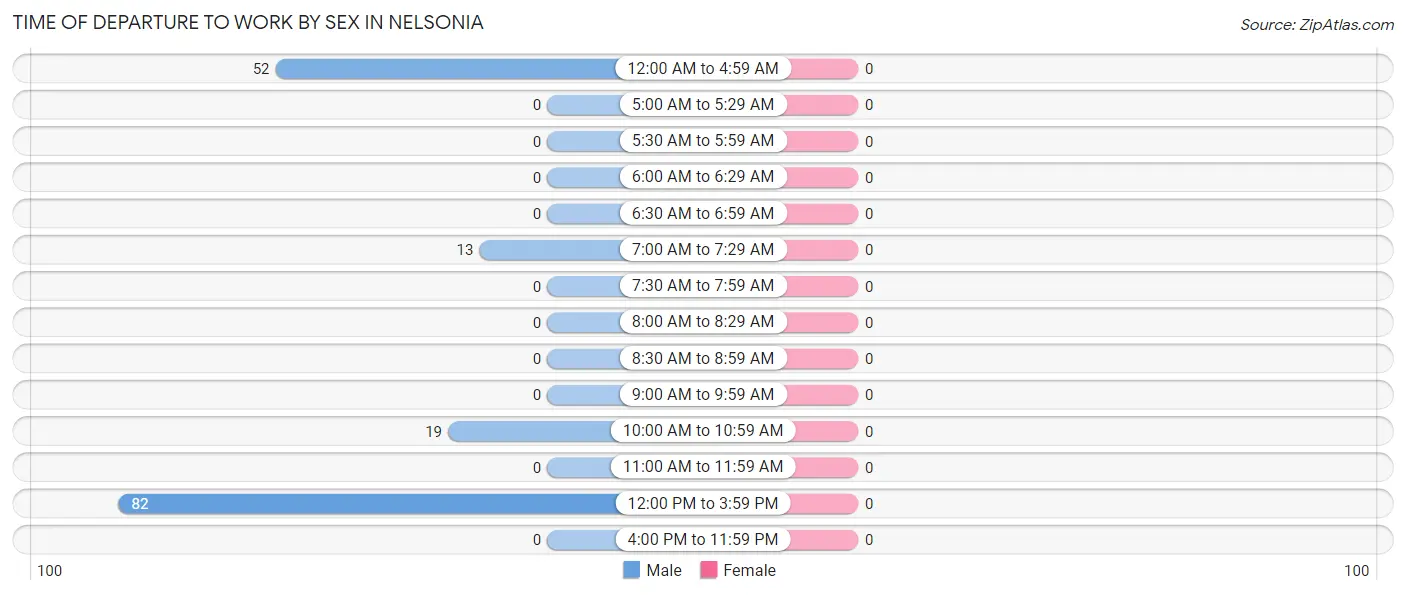
| Time of Departure | Male | Female |
| 12:00 AM to 4:59 AM | 52 (31.3%) | 0 (0.0%) |
| 5:00 AM to 5:29 AM | 0 (0.0%) | 0 (0.0%) |
| 5:30 AM to 5:59 AM | 0 (0.0%) | 0 (0.0%) |
| 6:00 AM to 6:29 AM | 0 (0.0%) | 0 (0.0%) |
| 6:30 AM to 6:59 AM | 0 (0.0%) | 0 (0.0%) |
| 7:00 AM to 7:29 AM | 13 (7.8%) | 0 (0.0%) |
| 7:30 AM to 7:59 AM | 0 (0.0%) | 0 (0.0%) |
| 8:00 AM to 8:29 AM | 0 (0.0%) | 0 (0.0%) |
| 8:30 AM to 8:59 AM | 0 (0.0%) | 0 (0.0%) |
| 9:00 AM to 9:59 AM | 0 (0.0%) | 0 (0.0%) |
| 10:00 AM to 10:59 AM | 19 (11.5%) | 0 (0.0%) |
| 11:00 AM to 11:59 AM | 0 (0.0%) | 0 (0.0%) |
| 12:00 PM to 3:59 PM | 82 (49.4%) | 0 (0.0%) |
| 4:00 PM to 11:59 PM | 0 (0.0%) | 0 (0.0%) |
| Total | 166 (100.0%) | 0 (0.0%) |
Housing Occupancy in Nelsonia
Occupancy by Ownership in Nelsonia
Of the total 140 dwellings in Nelsonia, owner-occupied units account for 63 (45.0%), while renter-occupied units make up 77 (55.0%).
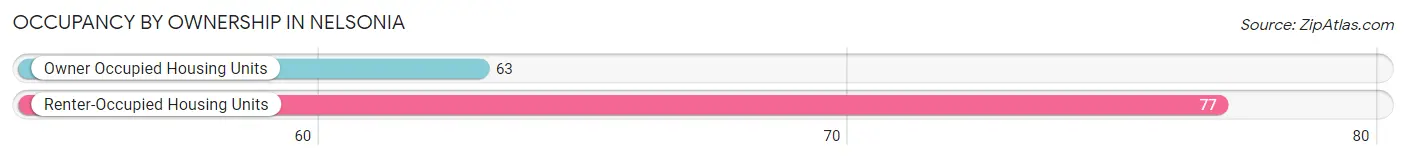
| Occupancy | # Housing Units | % Housing Units |
| Owner Occupied Housing Units | 63 | 45.0% |
| Renter-Occupied Housing Units | 77 | 55.0% |
| Total Occupied Housing Units | 140 | 100.0% |
Occupancy by Household Size in Nelsonia
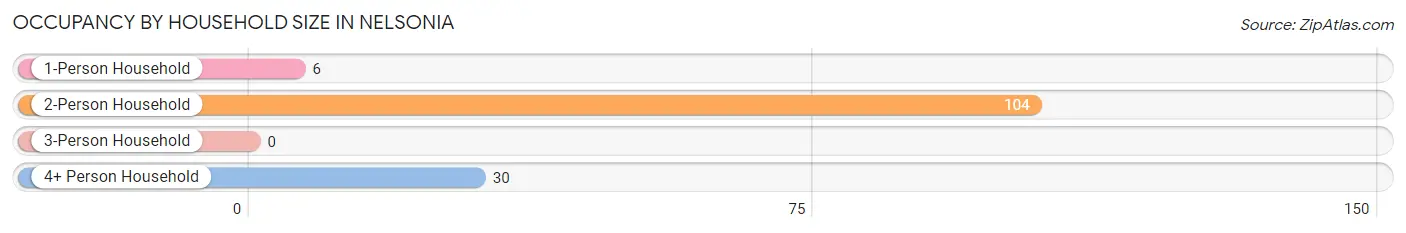
| Household Size | # Housing Units | % Housing Units |
| 1-Person Household | 6 | 4.3% |
| 2-Person Household | 104 | 74.3% |
| 3-Person Household | 0 | 0.0% |
| 4+ Person Household | 30 | 21.4% |
| Total Housing Units | 140 | 100.0% |
Occupancy by Ownership by Household Size in Nelsonia
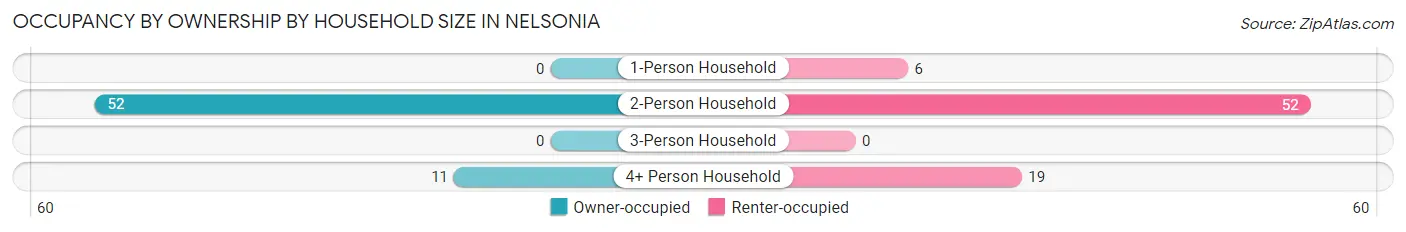
| Household Size | Owner-occupied | Renter-occupied |
| 1-Person Household | 0 (0.0%) | 6 (100.0%) |
| 2-Person Household | 52 (50.0%) | 52 (50.0%) |
| 3-Person Household | 0 (0.0%) | 0 (0.0%) |
| 4+ Person Household | 11 (36.7%) | 19 (63.3%) |
| Total Housing Units | 63 (45.0%) | 77 (55.0%) |
Occupancy by Educational Attainment in Nelsonia
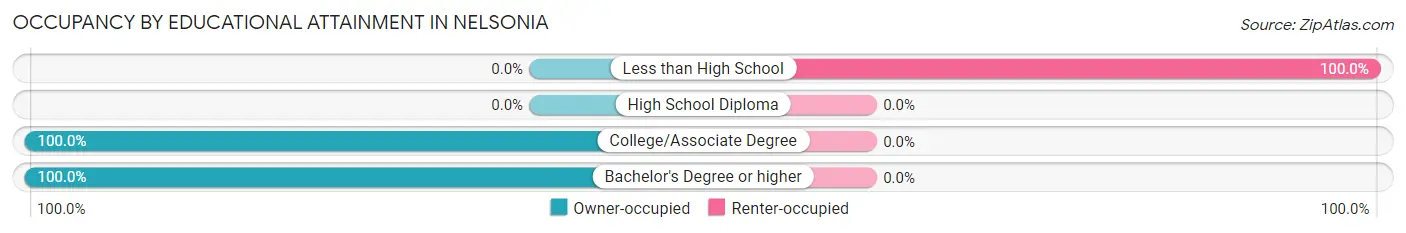
| Household Size | Owner-occupied | Renter-occupied |
| Less than High School | 0 (0.0%) | 77 (100.0%) |
| High School Diploma | 0 (0.0%) | 0 (0.0%) |
| College/Associate Degree | 11 (100.0%) | 0 (0.0%) |
| Bachelor's Degree or higher | 52 (100.0%) | 0 (0.0%) |
Occupancy by Age of Householder in Nelsonia
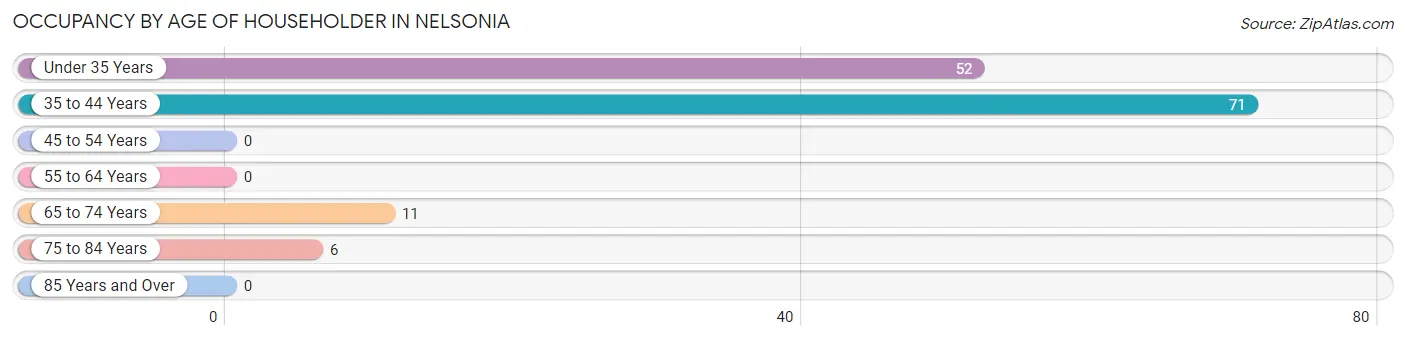
| Age Bracket | # Households | % Households |
| Under 35 Years | 52 | 37.1% |
| 35 to 44 Years | 71 | 50.7% |
| 45 to 54 Years | 0 | 0.0% |
| 55 to 64 Years | 0 | 0.0% |
| 65 to 74 Years | 11 | 7.9% |
| 75 to 84 Years | 6 | 4.3% |
| 85 Years and Over | 0 | 0.0% |
| Total | 140 | 100.0% |
Housing Finances in Nelsonia
Median Income by Occupancy in Nelsonia
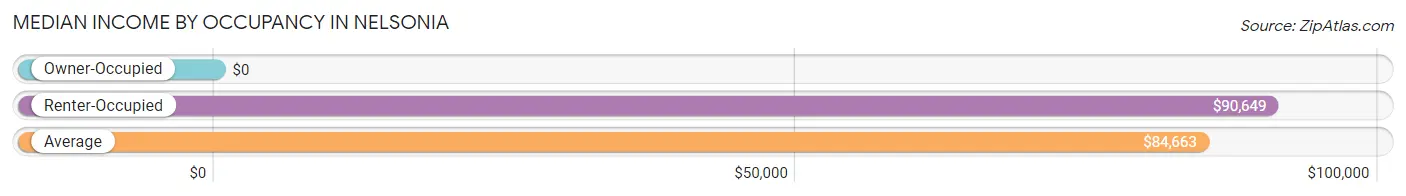
| Occupancy Type | # Households | Median Income |
| Owner-Occupied | 63 (45.0%) | $0 |
| Renter-Occupied | 77 (55.0%) | $90,649 |
| Average | 140 (100.0%) | $84,663 |
Occupancy by Householder Income Bracket in Nelsonia
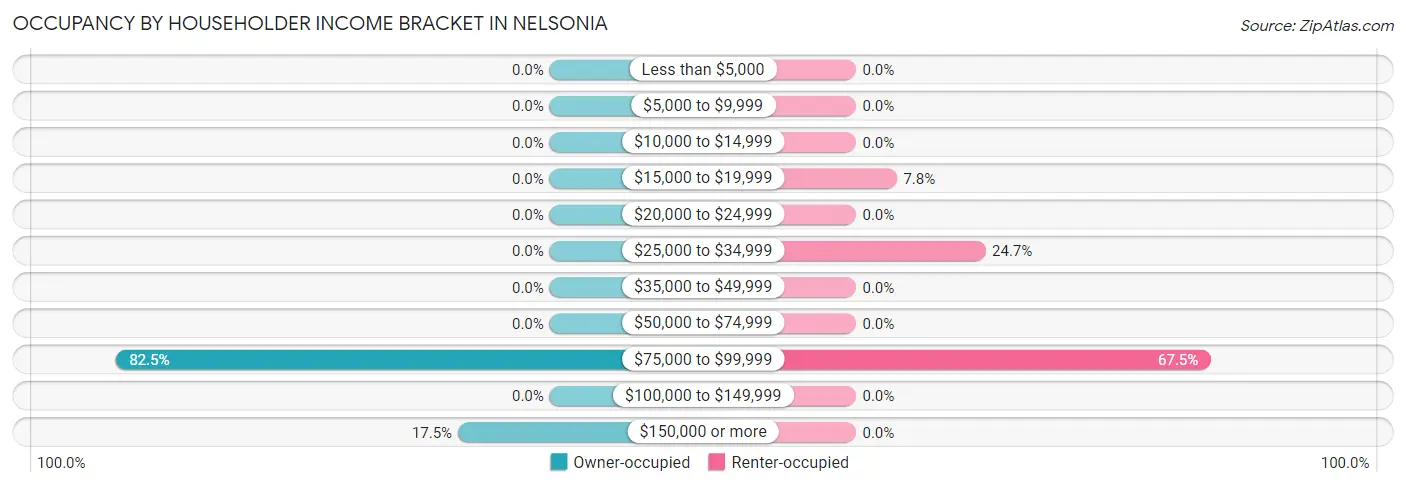
| Income Bracket | Owner-occupied | Renter-occupied |
| Less than $5,000 | 0 (0.0%) | 0 (0.0%) |
| $5,000 to $9,999 | 0 (0.0%) | 0 (0.0%) |
| $10,000 to $14,999 | 0 (0.0%) | 0 (0.0%) |
| $15,000 to $19,999 | 0 (0.0%) | 6 (7.8%) |
| $20,000 to $24,999 | 0 (0.0%) | 0 (0.0%) |
| $25,000 to $34,999 | 0 (0.0%) | 19 (24.7%) |
| $35,000 to $49,999 | 0 (0.0%) | 0 (0.0%) |
| $50,000 to $74,999 | 0 (0.0%) | 0 (0.0%) |
| $75,000 to $99,999 | 52 (82.5%) | 52 (67.5%) |
| $100,000 to $149,999 | 0 (0.0%) | 0 (0.0%) |
| $150,000 or more | 11 (17.5%) | 0 (0.0%) |
| Total | 63 (100.0%) | 77 (100.0%) |
Monthly Housing Cost Tiers in Nelsonia
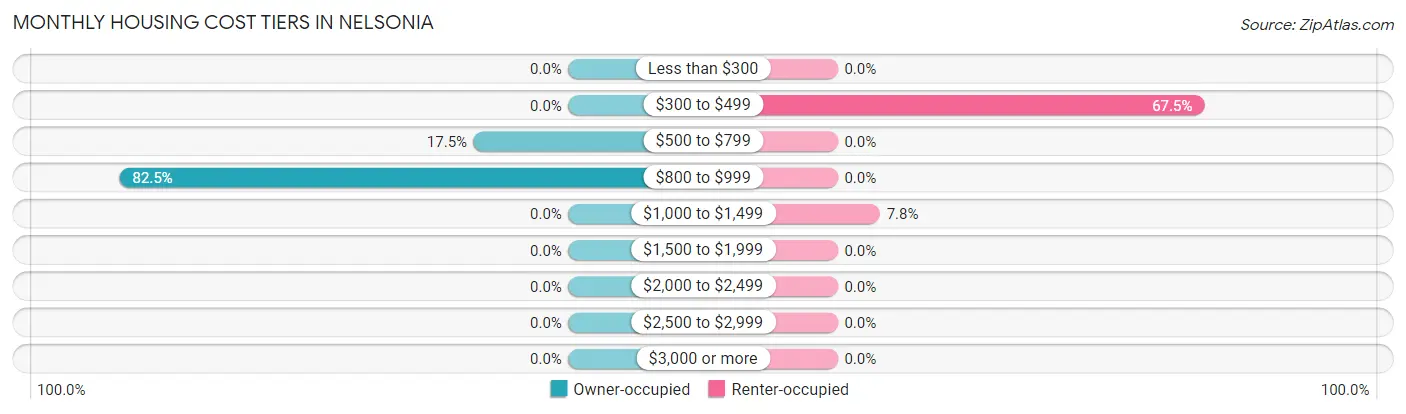
| Monthly Cost | Owner-occupied | Renter-occupied |
| Less than $300 | 0 (0.0%) | 0 (0.0%) |
| $300 to $499 | 0 (0.0%) | 52 (67.5%) |
| $500 to $799 | 11 (17.5%) | 0 (0.0%) |
| $800 to $999 | 52 (82.5%) | 0 (0.0%) |
| $1,000 to $1,499 | 0 (0.0%) | 6 (7.8%) |
| $1,500 to $1,999 | 0 (0.0%) | 0 (0.0%) |
| $2,000 to $2,499 | 0 (0.0%) | 0 (0.0%) |
| $2,500 to $2,999 | 0 (0.0%) | 0 (0.0%) |
| $3,000 or more | 0 (0.0%) | 0 (0.0%) |
| Total | 63 (100.0%) | 77 (100.0%) |
Physical Housing Characteristics in Nelsonia
Housing Structures in Nelsonia
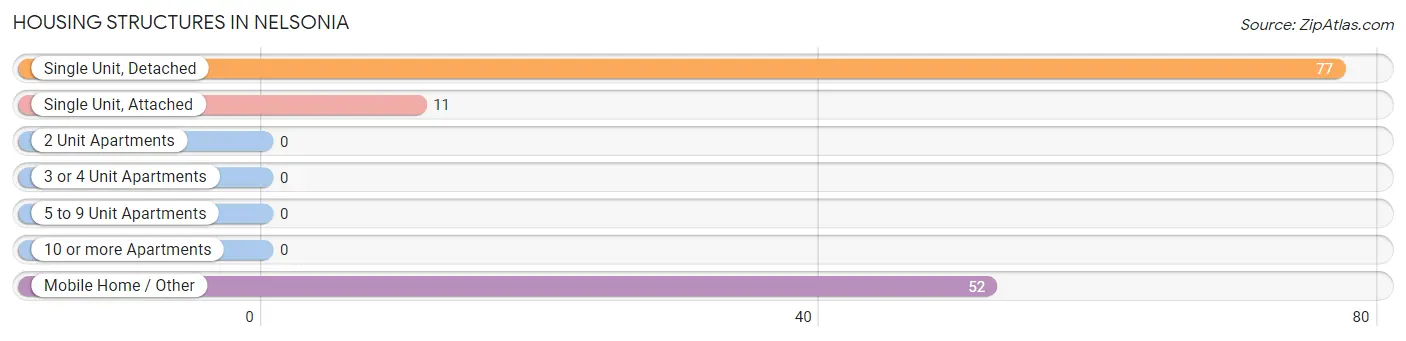
| Structure Type | # Housing Units | % Housing Units |
| Single Unit, Detached | 77 | 55.0% |
| Single Unit, Attached | 11 | 7.9% |
| 2 Unit Apartments | 0 | 0.0% |
| 3 or 4 Unit Apartments | 0 | 0.0% |
| 5 to 9 Unit Apartments | 0 | 0.0% |
| 10 or more Apartments | 0 | 0.0% |
| Mobile Home / Other | 52 | 37.1% |
| Total | 140 | 100.0% |
Housing Structures by Occupancy in Nelsonia
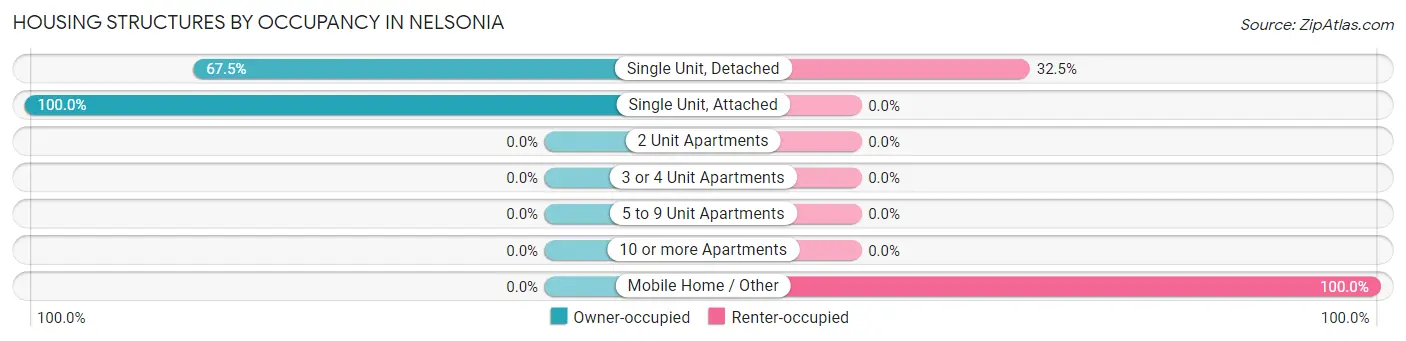
| Structure Type | Owner-occupied | Renter-occupied |
| Single Unit, Detached | 52 (67.5%) | 25 (32.5%) |
| Single Unit, Attached | 11 (100.0%) | 0 (0.0%) |
| 2 Unit Apartments | 0 (0.0%) | 0 (0.0%) |
| 3 or 4 Unit Apartments | 0 (0.0%) | 0 (0.0%) |
| 5 to 9 Unit Apartments | 0 (0.0%) | 0 (0.0%) |
| 10 or more Apartments | 0 (0.0%) | 0 (0.0%) |
| Mobile Home / Other | 0 (0.0%) | 52 (100.0%) |
| Total | 63 (45.0%) | 77 (55.0%) |
Housing Structures by Number of Rooms in Nelsonia
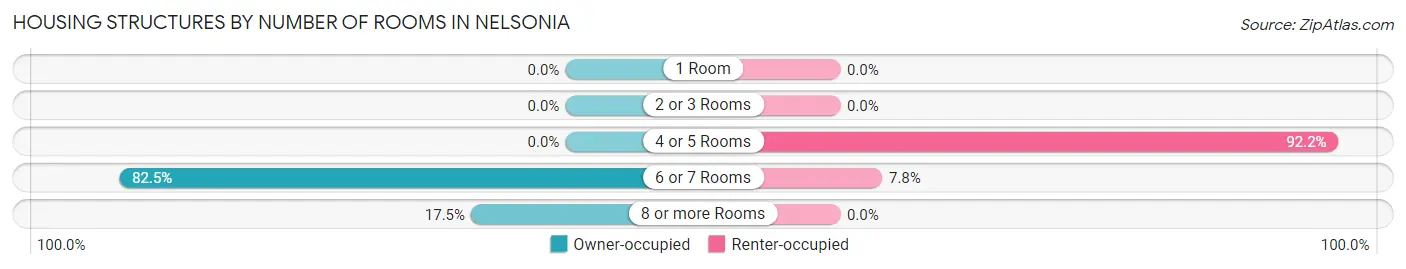
| Number of Rooms | Owner-occupied | Renter-occupied |
| 1 Room | 0 (0.0%) | 0 (0.0%) |
| 2 or 3 Rooms | 0 (0.0%) | 0 (0.0%) |
| 4 or 5 Rooms | 0 (0.0%) | 71 (92.2%) |
| 6 or 7 Rooms | 52 (82.5%) | 6 (7.8%) |
| 8 or more Rooms | 11 (17.5%) | 0 (0.0%) |
| Total | 63 (100.0%) | 77 (100.0%) |
Housing Structure by Heating Type in Nelsonia
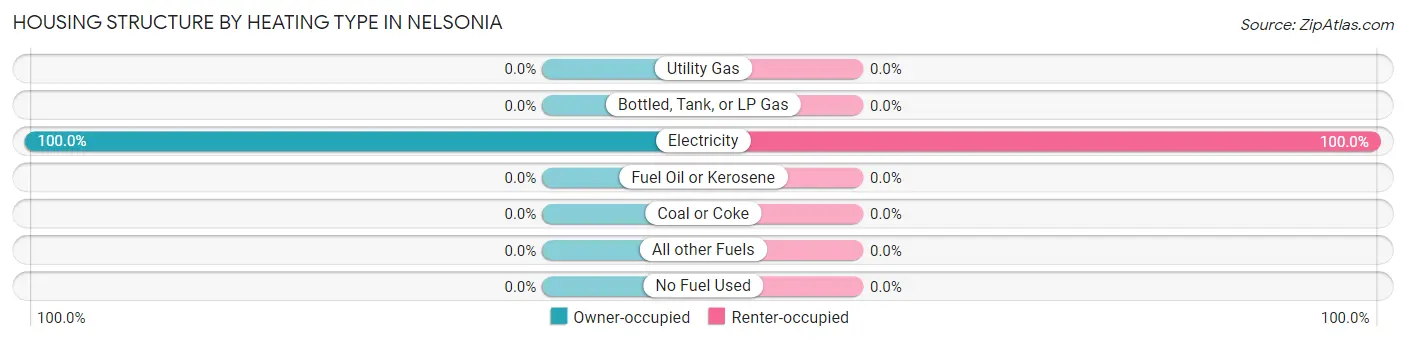
| Heating Type | Owner-occupied | Renter-occupied |
| Utility Gas | 0 (0.0%) | 0 (0.0%) |
| Bottled, Tank, or LP Gas | 0 (0.0%) | 0 (0.0%) |
| Electricity | 63 (100.0%) | 77 (100.0%) |
| Fuel Oil or Kerosene | 0 (0.0%) | 0 (0.0%) |
| Coal or Coke | 0 (0.0%) | 0 (0.0%) |
| All other Fuels | 0 (0.0%) | 0 (0.0%) |
| No Fuel Used | 0 (0.0%) | 0 (0.0%) |
| Total | 63 (100.0%) | 77 (100.0%) |
Household Vehicle Usage in Nelsonia
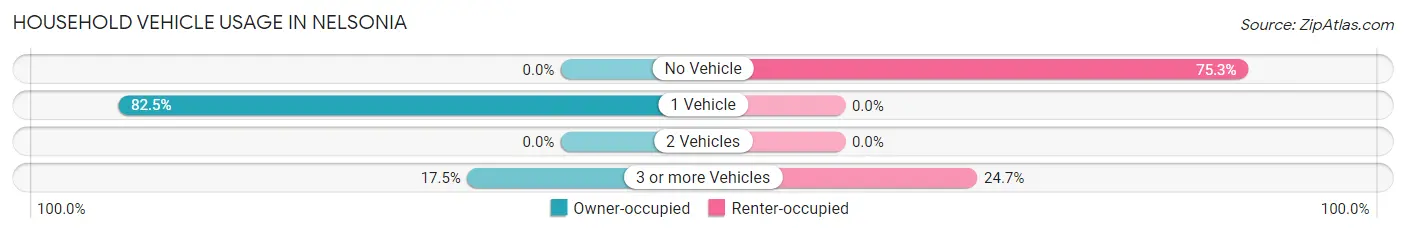
| Vehicles per Household | Owner-occupied | Renter-occupied |
| No Vehicle | 0 (0.0%) | 58 (75.3%) |
| 1 Vehicle | 52 (82.5%) | 0 (0.0%) |
| 2 Vehicles | 0 (0.0%) | 0 (0.0%) |
| 3 or more Vehicles | 11 (17.5%) | 19 (24.7%) |
| Total | 63 (100.0%) | 77 (100.0%) |
Real Estate & Mortgages in Nelsonia
Real Estate and Mortgage Overview in Nelsonia
| Characteristic | Without Mortgage | With Mortgage |
| Housing Units | 11 | 52 |
| Median Property Value | - | - |
| Median Household Income | - | - |
| Monthly Housing Costs | - | - |
| Real Estate Taxes | - | - |
Property Value by Mortgage Status in Nelsonia
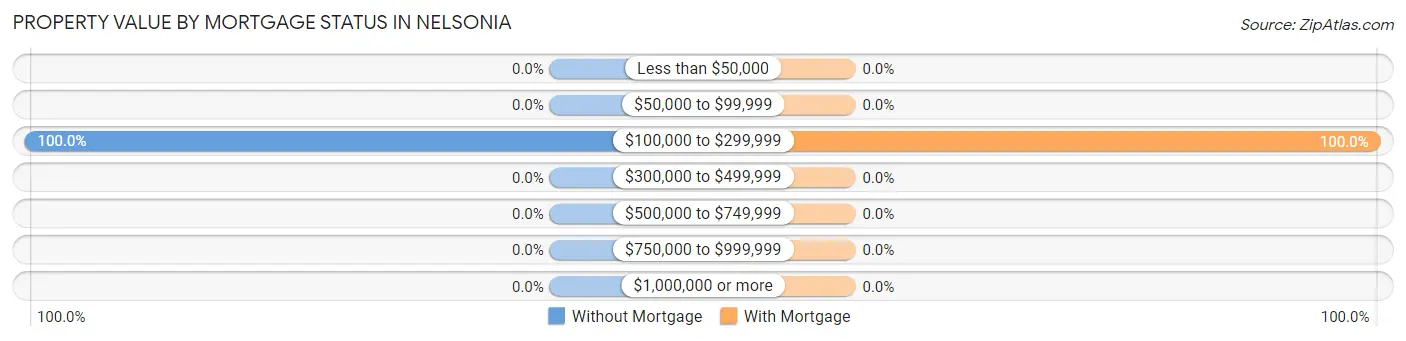
| Property Value | Without Mortgage | With Mortgage |
| Less than $50,000 | 0 (0.0%) | 0 (0.0%) |
| $50,000 to $99,999 | 0 (0.0%) | 0 (0.0%) |
| $100,000 to $299,999 | 11 (100.0%) | 52 (100.0%) |
| $300,000 to $499,999 | 0 (0.0%) | 0 (0.0%) |
| $500,000 to $749,999 | 0 (0.0%) | 0 (0.0%) |
| $750,000 to $999,999 | 0 (0.0%) | 0 (0.0%) |
| $1,000,000 or more | 0 (0.0%) | 0 (0.0%) |
| Total | 11 (100.0%) | 52 (100.0%) |
Household Income by Mortgage Status in Nelsonia
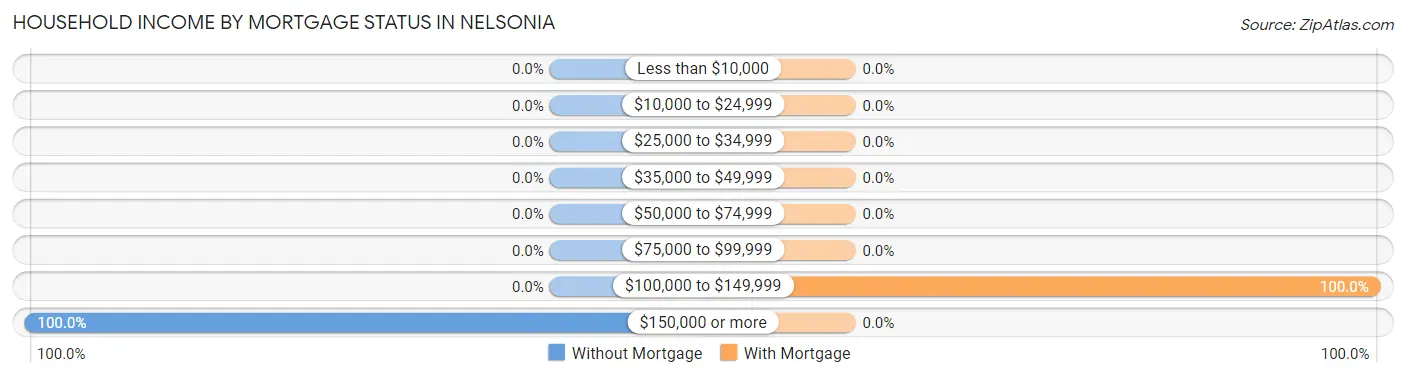
| Household Income | Without Mortgage | With Mortgage |
| Less than $10,000 | 0 (0.0%) | 0 (0.0%) |
| $10,000 to $24,999 | 0 (0.0%) | 0 (0.0%) |
| $25,000 to $34,999 | 0 (0.0%) | 0 (0.0%) |
| $35,000 to $49,999 | 0 (0.0%) | 0 (0.0%) |
| $50,000 to $74,999 | 0 (0.0%) | 0 (0.0%) |
| $75,000 to $99,999 | 0 (0.0%) | 0 (0.0%) |
| $100,000 to $149,999 | 0 (0.0%) | 52 (100.0%) |
| $150,000 or more | 11 (100.0%) | 0 (0.0%) |
| Total | 11 (100.0%) | 52 (100.0%) |
Property Value to Household Income Ratio in Nelsonia
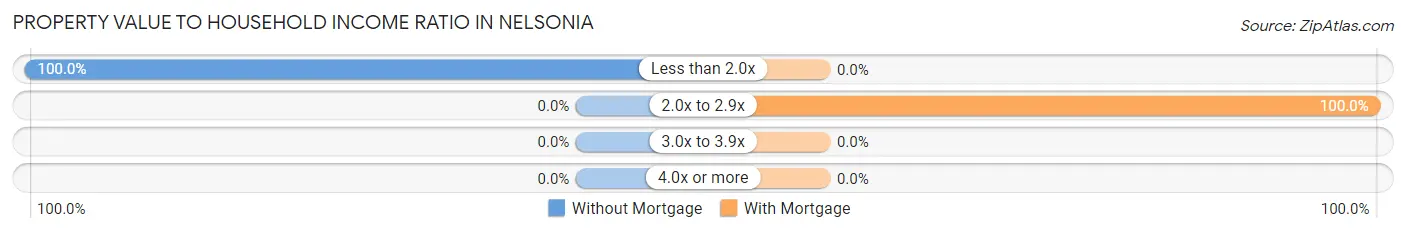
| Value-to-Income Ratio | Without Mortgage | With Mortgage |
| Less than 2.0x | 11 (100.0%) | 0 (0.0%) |
| 2.0x to 2.9x | 0 (0.0%) | 52 (100.0%) |
| 3.0x to 3.9x | 0 (0.0%) | 0 (0.0%) |
| 4.0x or more | 0 (0.0%) | 0 (0.0%) |
| Total | 11 (100.0%) | 52 (100.0%) |
Real Estate Taxes by Mortgage Status in Nelsonia
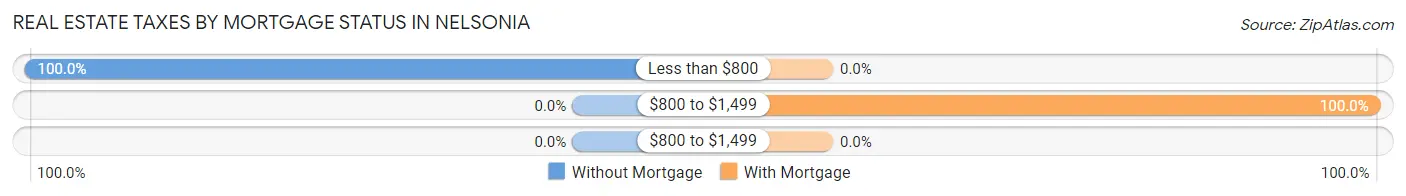
| Property Taxes | Without Mortgage | With Mortgage |
| Less than $800 | 11 (100.0%) | 0 (0.0%) |
| $800 to $1,499 | 0 (0.0%) | 52 (100.0%) |
| $800 to $1,499 | 0 (0.0%) | 0 (0.0%) |
| Total | 11 (100.0%) | 52 (100.0%) |
Health & Disability in Nelsonia
Health Insurance Coverage by Age in Nelsonia
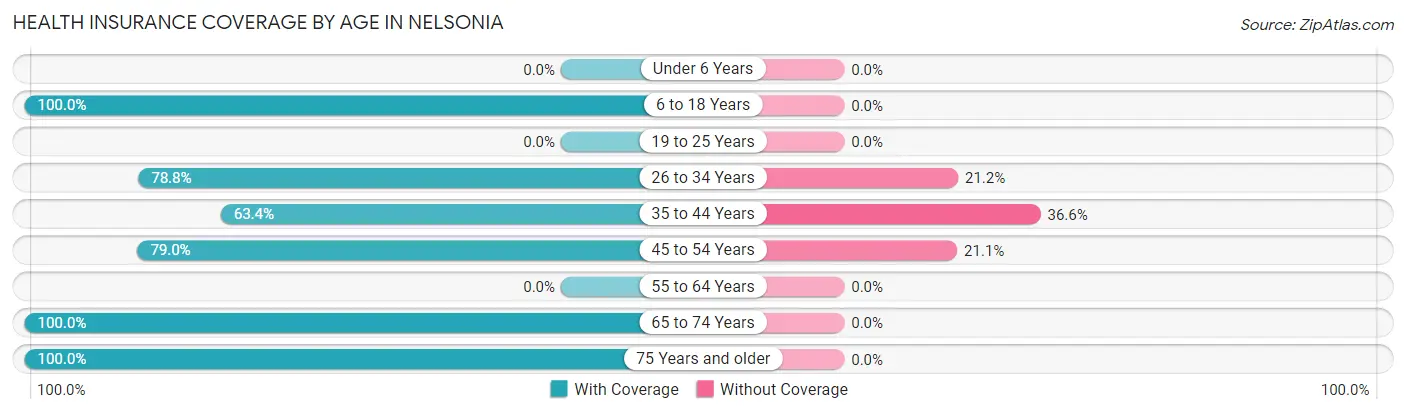
| Age Bracket | With Coverage | Without Coverage |
| Under 6 Years | 0 (0.0%) | 0 (0.0%) |
| 6 to 18 Years | 90 (100.0%) | 0 (0.0%) |
| 19 to 25 Years | 0 (0.0%) | 0 (0.0%) |
| 26 to 34 Years | 52 (78.8%) | 14 (21.2%) |
| 35 to 44 Years | 52 (63.4%) | 30 (36.6%) |
| 45 to 54 Years | 30 (78.9%) | 8 (21.0%) |
| 55 to 64 Years | 0 (0.0%) | 0 (0.0%) |
| 65 to 74 Years | 24 (100.0%) | 0 (0.0%) |
| 75 Years and older | 14 (100.0%) | 0 (0.0%) |
| Total | 262 (83.4%) | 52 (16.6%) |
Health Insurance Coverage by Citizenship Status in Nelsonia
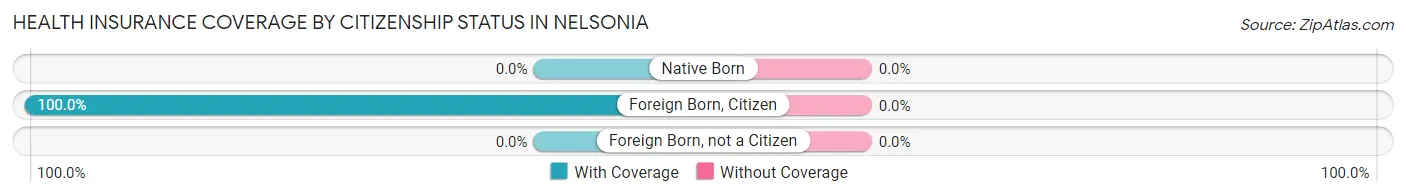
| Citizenship Status | With Coverage | Without Coverage |
| Native Born | 0 (0.0%) | 0 (0.0%) |
| Foreign Born, Citizen | 90 (100.0%) | 0 (0.0%) |
| Foreign Born, not a Citizen | 0 (0.0%) | 0 (0.0%) |
Health Insurance Coverage by Household Income in Nelsonia
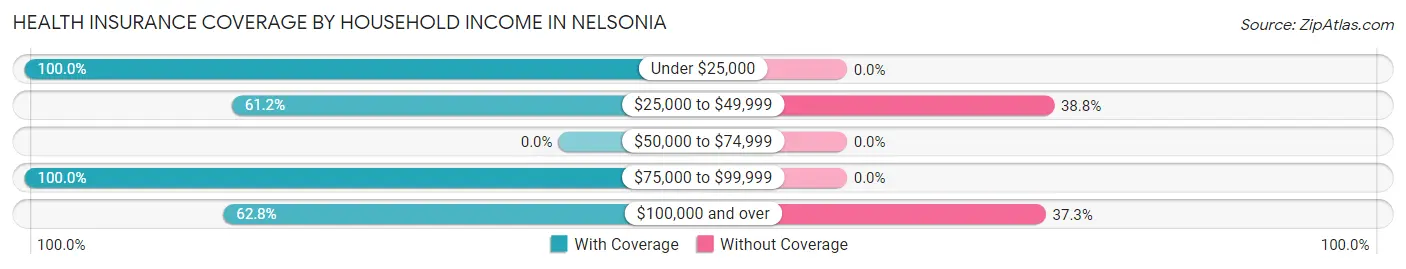
| Household Income | With Coverage | Without Coverage |
| Under $25,000 | 6 (100.0%) | 0 (0.0%) |
| $25,000 to $49,999 | 52 (61.2%) | 33 (38.8%) |
| $50,000 to $74,999 | 0 (0.0%) | 0 (0.0%) |
| $75,000 to $99,999 | 172 (100.0%) | 0 (0.0%) |
| $100,000 and over | 32 (62.7%) | 19 (37.2%) |
Public vs Private Health Insurance Coverage by Age in Nelsonia
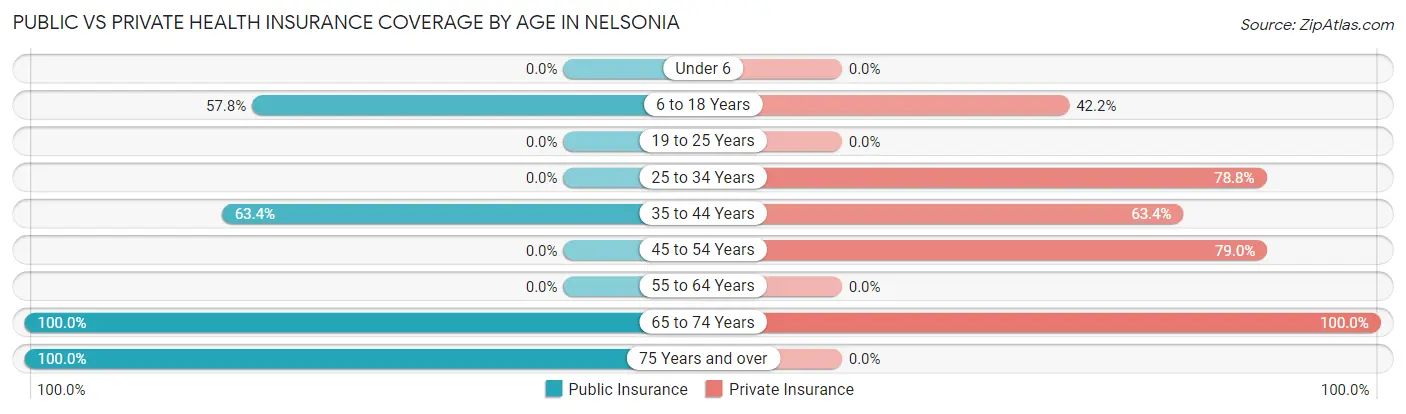
| Age Bracket | Public Insurance | Private Insurance |
| Under 6 | 0 (0.0%) | 0 (0.0%) |
| 6 to 18 Years | 52 (57.8%) | 38 (42.2%) |
| 19 to 25 Years | 0 (0.0%) | 0 (0.0%) |
| 25 to 34 Years | 0 (0.0%) | 52 (78.8%) |
| 35 to 44 Years | 52 (63.4%) | 52 (63.4%) |
| 45 to 54 Years | 0 (0.0%) | 30 (78.9%) |
| 55 to 64 Years | 0 (0.0%) | 0 (0.0%) |
| 65 to 74 Years | 24 (100.0%) | 24 (100.0%) |
| 75 Years and over | 14 (100.0%) | 0 (0.0%) |
| Total | 142 (45.2%) | 196 (62.4%) |
Disability Status by Sex by Age in Nelsonia
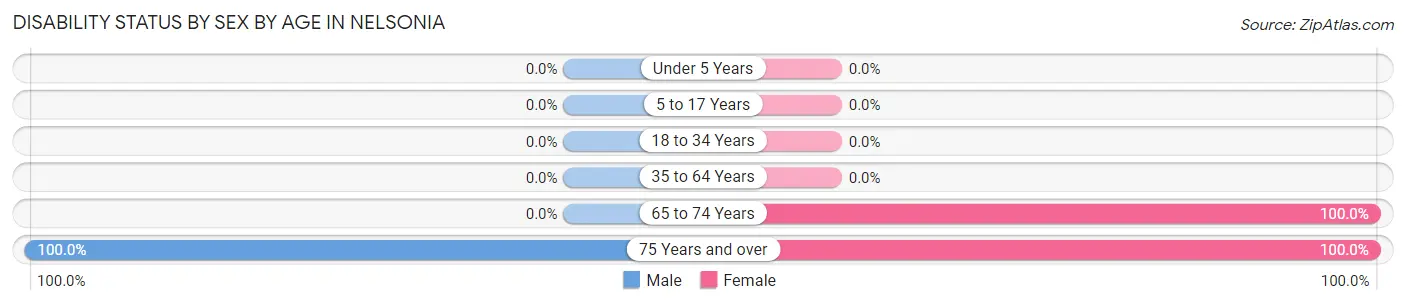
| Age Bracket | Male | Female |
| Under 5 Years | 0 (0.0%) | 0 (0.0%) |
| 5 to 17 Years | 0 (0.0%) | 0 (0.0%) |
| 18 to 34 Years | 0 (0.0%) | 0 (0.0%) |
| 35 to 64 Years | 0 (0.0%) | 0 (0.0%) |
| 65 to 74 Years | 0 (0.0%) | 11 (100.0%) |
| 75 Years and over | 6 (100.0%) | 8 (100.0%) |
Disability Class by Sex by Age in Nelsonia
Disability Class: Hearing Difficulty
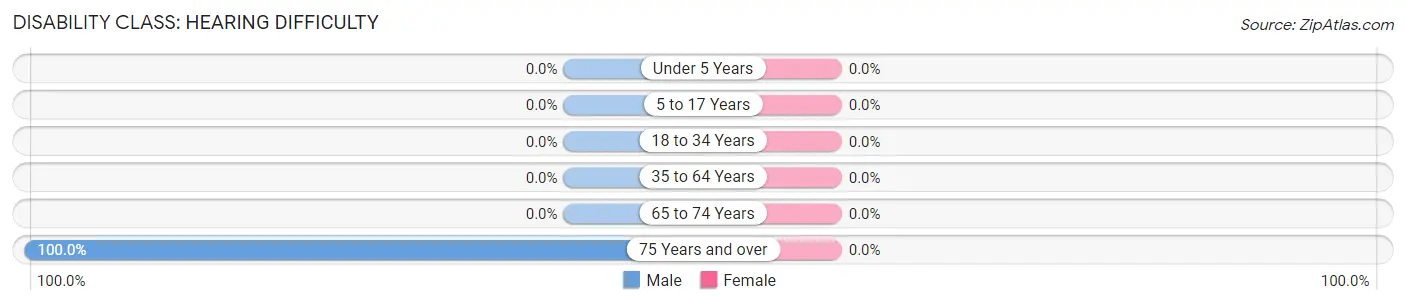
| Age Bracket | Male | Female |
| Under 5 Years | 0 (0.0%) | 0 (0.0%) |
| 5 to 17 Years | 0 (0.0%) | 0 (0.0%) |
| 18 to 34 Years | 0 (0.0%) | 0 (0.0%) |
| 35 to 64 Years | 0 (0.0%) | 0 (0.0%) |
| 65 to 74 Years | 0 (0.0%) | 0 (0.0%) |
| 75 Years and over | 6 (100.0%) | 0 (0.0%) |
Disability Class: Vision Difficulty
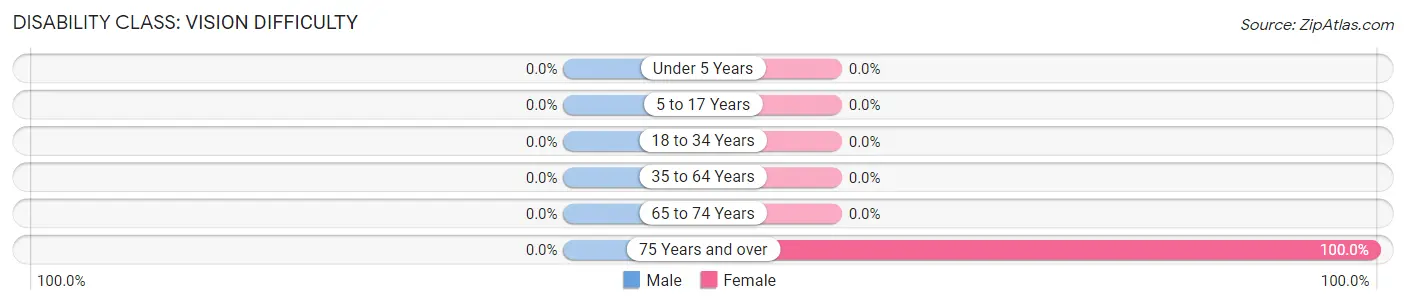
| Age Bracket | Male | Female |
| Under 5 Years | 0 (0.0%) | 0 (0.0%) |
| 5 to 17 Years | 0 (0.0%) | 0 (0.0%) |
| 18 to 34 Years | 0 (0.0%) | 0 (0.0%) |
| 35 to 64 Years | 0 (0.0%) | 0 (0.0%) |
| 65 to 74 Years | 0 (0.0%) | 0 (0.0%) |
| 75 Years and over | 0 (0.0%) | 8 (100.0%) |
Disability Class: Cognitive Difficulty
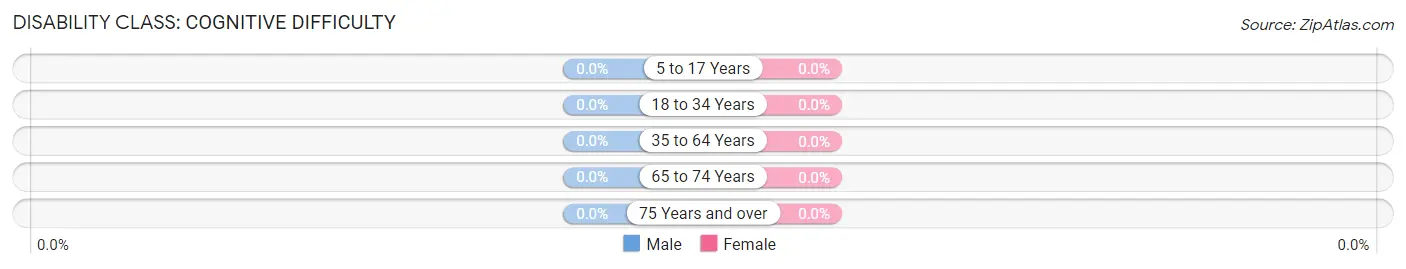
| Age Bracket | Male | Female |
| 5 to 17 Years | 0 (0.0%) | 0 (0.0%) |
| 18 to 34 Years | 0 (0.0%) | 0 (0.0%) |
| 35 to 64 Years | 0 (0.0%) | 0 (0.0%) |
| 65 to 74 Years | 0 (0.0%) | 0 (0.0%) |
| 75 Years and over | 0 (0.0%) | 0 (0.0%) |
Disability Class: Ambulatory Difficulty
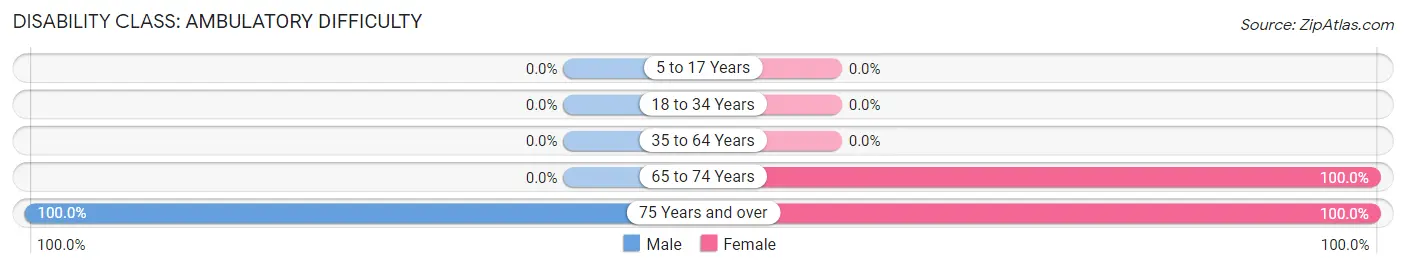
| Age Bracket | Male | Female |
| 5 to 17 Years | 0 (0.0%) | 0 (0.0%) |
| 18 to 34 Years | 0 (0.0%) | 0 (0.0%) |
| 35 to 64 Years | 0 (0.0%) | 0 (0.0%) |
| 65 to 74 Years | 0 (0.0%) | 11 (100.0%) |
| 75 Years and over | 6 (100.0%) | 8 (100.0%) |
Disability Class: Self-Care Difficulty
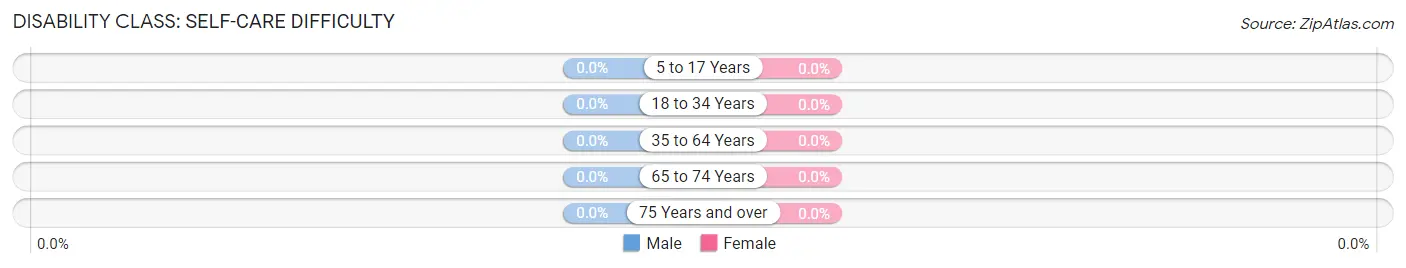
| Age Bracket | Male | Female |
| 5 to 17 Years | 0 (0.0%) | 0 (0.0%) |
| 18 to 34 Years | 0 (0.0%) | 0 (0.0%) |
| 35 to 64 Years | 0 (0.0%) | 0 (0.0%) |
| 65 to 74 Years | 0 (0.0%) | 0 (0.0%) |
| 75 Years and over | 0 (0.0%) | 0 (0.0%) |
Technology Access in Nelsonia
Computing Device Access in Nelsonia
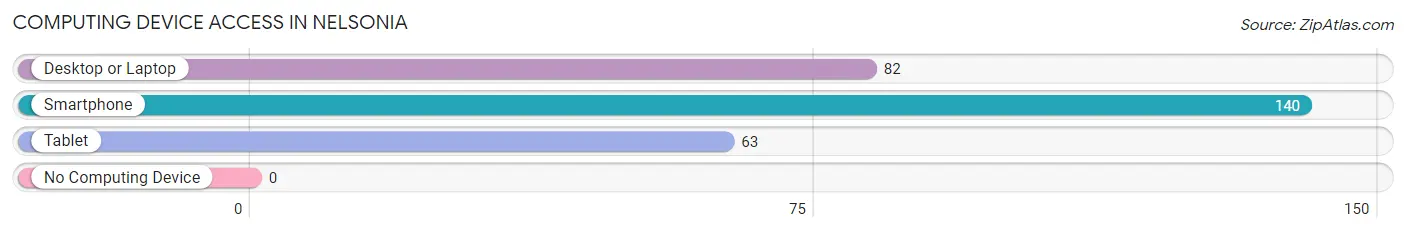
| Device Type | # Households | % Households |
| Desktop or Laptop | 82 | 58.6% |
| Smartphone | 140 | 100.0% |
| Tablet | 63 | 45.0% |
| No Computing Device | 0 | 0.0% |
| Total | 140 | 100.0% |
Internet Access in Nelsonia
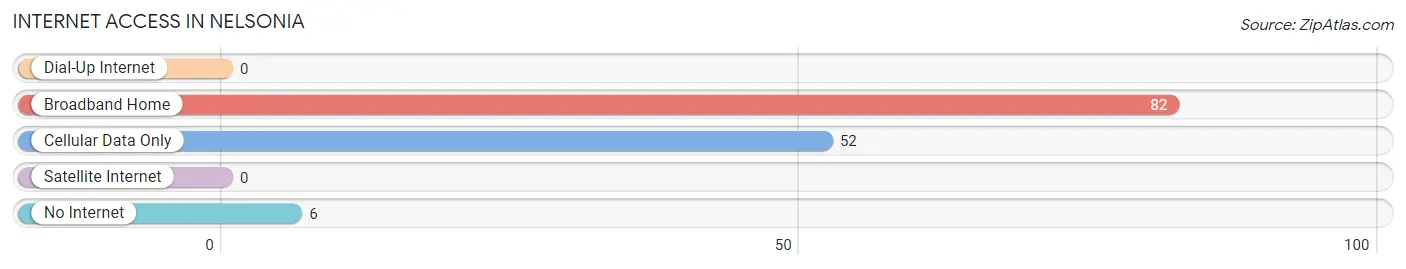
| Internet Type | # Households | % Households |
| Dial-Up Internet | 0 | 0.0% |
| Broadband Home | 82 | 58.6% |
| Cellular Data Only | 52 | 37.1% |
| Satellite Internet | 0 | 0.0% |
| No Internet | 6 | 4.3% |
| Total | 140 | 100.0% |
Nelsonia Summary
Nelsonia is a small unincorporated community located in Accomack County, Virginia. It is situated on the Eastern Shore of Virginia, approximately 20 miles south of the state capital of Richmond. The population of Nelsonia was estimated to be around 1,000 in 2020.
History
Nelsonia was first settled in the early 1700s by English colonists. The town was named after Thomas Nelson, a prominent Virginia politician and signer of the Declaration of Independence. The town was originally a farming community, but it later became a center for the oyster industry. In the late 1800s, Nelsonia was a popular destination for tourists, who came to enjoy the area's natural beauty and seafood.
In the early 1900s, Nelsonia was a thriving community with a variety of businesses, including a hotel, a general store, a post office, and a movie theater. The town also had a school, a library, and a church.
In the 1950s, Nelsonia began to decline as the oyster industry declined and the town's population began to dwindle. In the 1970s, the town was almost completely abandoned. In the 1980s, the town was revitalized by the efforts of local residents and businesses. Today, Nelsonia is a small but vibrant community with a variety of businesses and services.
Geography
Nelsonia is located on the Eastern Shore of Virginia, approximately 20 miles south of the state capital of Richmond. The town is situated on the Chesapeake Bay, and is surrounded by wetlands and marshlands. The town is bordered by the towns of Accomac, Onancock, and Parksley.
The climate in Nelsonia is humid subtropical, with hot, humid summers and mild winters. The average annual temperature is around 60 degrees Fahrenheit. The average annual precipitation is around 40 inches.
Economy
Nelsonia's economy is largely based on tourism and agriculture. The town is home to several seafood restaurants, as well as a variety of shops and stores. The town also has a marina, which provides access to the Chesapeake Bay.
Agriculture is also an important part of the local economy. The town is home to several farms, which produce a variety of crops, including corn, soybeans, and wheat.
Demographics
As of 2020, the population of Nelsonia was estimated to be around 1,000. The town is predominantly white, with a small African American population. The median household income is around $50,000. The median age is around 40 years old.
Common Questions
What is Per Capita Income in Nelsonia?
Per Capita income in Nelsonia is $36,394.
What is the Median Family Income in Nelsonia?
Median Family Income in Nelsonia is $84,808.
What is the Median Household income in Nelsonia?
Median Household Income in Nelsonia is $84,663.
What is Inequality or Gini Index in Nelsonia?
Inequality or Gini Index in Nelsonia is 0.23.
What is the Total Population of Nelsonia?
Total Population of Nelsonia is 314.
What is the Total Male Population of Nelsonia?
Total Male Population of Nelsonia is 215.
What is the Total Female Population of Nelsonia?
Total Female Population of Nelsonia is 99.
What is the Ratio of Males per 100 Females in Nelsonia?
There are 217.17 Males per 100 Females in Nelsonia.
What is the Ratio of Females per 100 Males in Nelsonia?
There are 46.05 Females per 100 Males in Nelsonia.
What is the Median Population Age in Nelsonia?
Median Population Age in Nelsonia is 41.0 Years.
What is the Average Family Size in Nelsonia
Average Family Size in Nelsonia is 2.3 People.
What is the Average Household Size in Nelsonia
Average Household Size in Nelsonia is 2.2 People.
How Large is the Labor Force in Nelsonia?
There are 177 People in the Labor Forcein in Nelsonia.
What is the Percentage of People in the Labor Force in Nelsonia?
71.4% of People are in the Labor Force in Nelsonia.
What is the Unemployment Rate in Nelsonia?
Unemployment Rate in Nelsonia is 6.2%.