Occoquan, VA Map & Demographics
Occoquan Map
Occoquan Overview
$77,972
PER CAPITA INCOME
$176,429
AVG FAMILY INCOME
$126,927
AVG HOUSEHOLD INCOME
51.6%
WAGE / INCOME GAP [ % ]
48.4¢/ $1
WAGE / INCOME GAP [ $ ]
0.37
INEQUALITY / GINI INDEX
1,072
TOTAL POPULATION
529
MALE POPULATION
543
FEMALE POPULATION
97.42
MALES / 100 FEMALES
102.65
FEMALES / 100 MALES
43.9
MEDIAN AGE
2.6
AVG FAMILY SIZE
1.9
AVG HOUSEHOLD SIZE
832
LABOR FORCE [ PEOPLE ]
83.9%
PERCENT IN LABOR FORCE
5.1%
UNEMPLOYMENT RATE
Occoquan Zip Codes
Occoquan Area Codes
Income in Occoquan
Income Overview in Occoquan
Per Capita Income in Occoquan is $77,972, while median incomes of families and households are $176,429 and $126,927 respectively.
| Characteristic | Number | Measure |
| Per Capita Income | 1,072 | $77,972 |
| Median Family Income | 276 | $176,429 |
| Mean Family Income | 276 | $183,046 |
| Median Household Income | 569 | $126,927 |
| Mean Household Income | 569 | $146,467 |
| Income Deficit | 276 | $0 |
| Wage / Income Gap (%) | 1,072 | 51.58% |
| Wage / Income Gap ($) | 1,072 | 48.42¢ per $1 |
| Gini / Inequality Index | 1,072 | 0.37 |
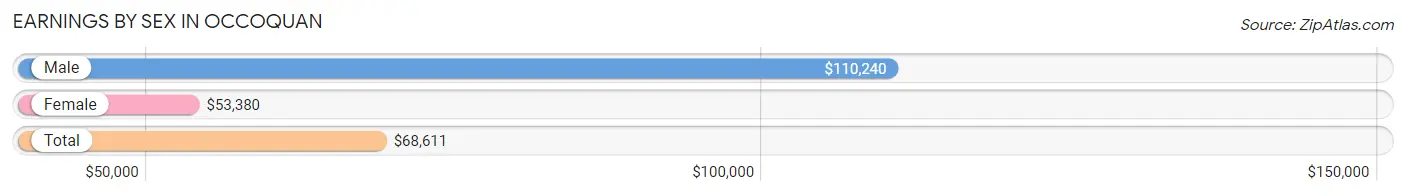
Earnings by Sex in Occoquan
Average Earnings in Occoquan are $68,611, $110,240 for men and $53,380 for women, a difference of 51.6%.
| Sex | Number | Average Earnings |
| Male | 421 (49.1%) | $110,240 |
| Female | 437 (50.9%) | $53,380 |
| Total | 858 (100.0%) | $68,611 |
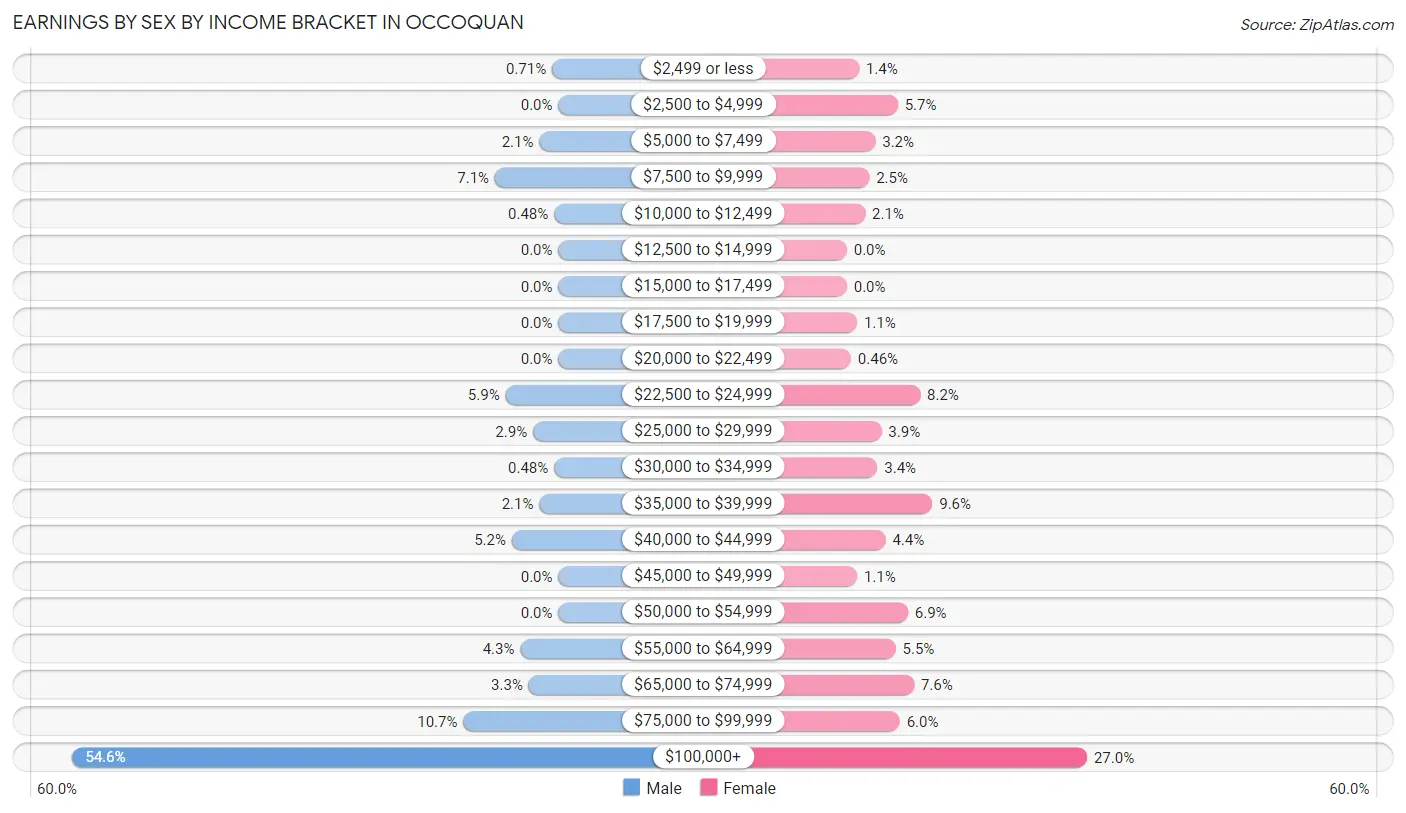
Earnings by Sex by Income Bracket in Occoquan
The most common earnings brackets in Occoquan are $100,000+ for men (230 | 54.6%) and $100,000+ for women (118 | 27.0%).
| Income | Male | Female |
| $2,499 or less | 3 (0.7%) | 6 (1.4%) |
| $2,500 to $4,999 | 0 (0.0%) | 25 (5.7%) |
| $5,000 to $7,499 | 9 (2.1%) | 14 (3.2%) |
| $7,500 to $9,999 | 30 (7.1%) | 11 (2.5%) |
| $10,000 to $12,499 | 2 (0.5%) | 9 (2.1%) |
| $12,500 to $14,999 | 0 (0.0%) | 0 (0.0%) |
| $15,000 to $17,499 | 0 (0.0%) | 0 (0.0%) |
| $17,500 to $19,999 | 0 (0.0%) | 5 (1.1%) |
| $20,000 to $22,499 | 0 (0.0%) | 2 (0.5%) |
| $22,500 to $24,999 | 25 (5.9%) | 36 (8.2%) |
| $25,000 to $29,999 | 12 (2.9%) | 17 (3.9%) |
| $30,000 to $34,999 | 2 (0.5%) | 15 (3.4%) |
| $35,000 to $39,999 | 9 (2.1%) | 42 (9.6%) |
| $40,000 to $44,999 | 22 (5.2%) | 19 (4.3%) |
| $45,000 to $49,999 | 0 (0.0%) | 5 (1.1%) |
| $50,000 to $54,999 | 0 (0.0%) | 30 (6.9%) |
| $55,000 to $64,999 | 18 (4.3%) | 24 (5.5%) |
| $65,000 to $74,999 | 14 (3.3%) | 33 (7.5%) |
| $75,000 to $99,999 | 45 (10.7%) | 26 (5.9%) |
| $100,000+ | 230 (54.6%) | 118 (27.0%) |
| Total | 421 (100.0%) | 437 (100.0%) |
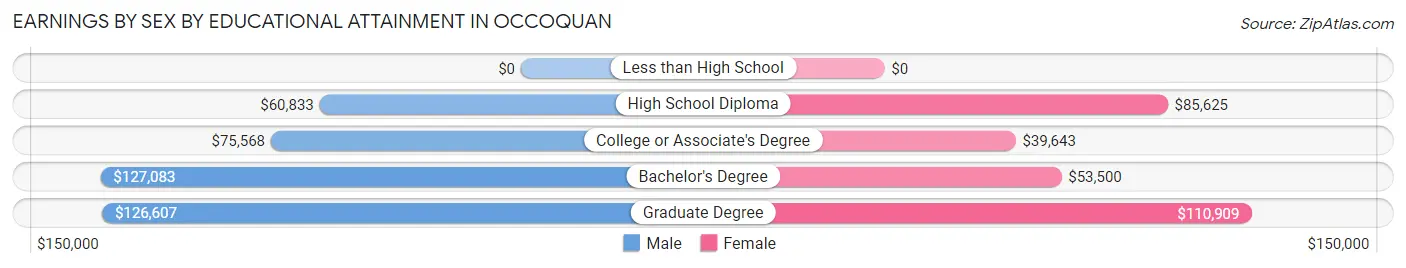
Earnings by Sex by Educational Attainment in Occoquan
Average earnings in Occoquan are $110,817 for men and $56,875 for women, a difference of 48.7%. Men with an educational attainment of bachelor's degree enjoy the highest average annual earnings of $127,083, while those with high school diploma education earn the least with $60,833. Women with an educational attainment of graduate degree earn the most with the average annual earnings of $110,909, while those with college or associate's degree education have the smallest earnings of $39,643.
| Educational Attainment | Male Income | Female Income |
| Less than High School | - | - |
| High School Diploma | $60,833 | $85,625 |
| College or Associate's Degree | $75,568 | $39,643 |
| Bachelor's Degree | $127,083 | $53,500 |
| Graduate Degree | $126,607 | $110,909 |
| Total | $110,817 | $56,875 |
Family Income in Occoquan
Family Income Brackets in Occoquan
According to the Occoquan family income data, there are 115 families falling into the $200,000+ income range, which is the most common income bracket and makes up 41.7% of all families.
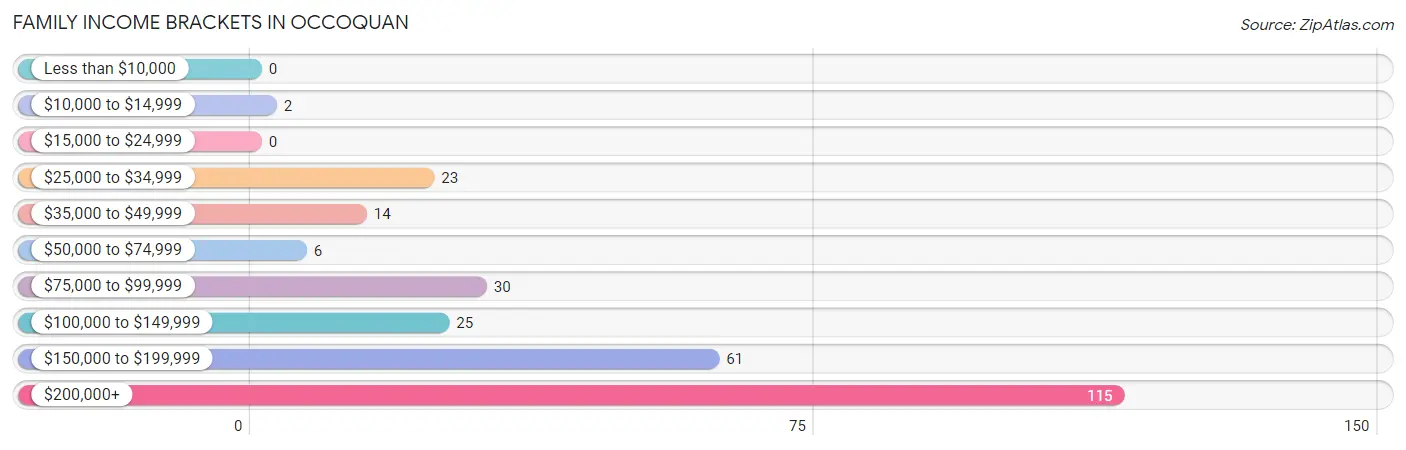
| Income Bracket | # Families | % Families |
| Less than $10,000 | 0 | 0.0% |
| $10,000 to $14,999 | 2 | 0.7% |
| $15,000 to $24,999 | 0 | 0.0% |
| $25,000 to $34,999 | 23 | 8.3% |
| $35,000 to $49,999 | 14 | 5.1% |
| $50,000 to $74,999 | 6 | 2.2% |
| $75,000 to $99,999 | 30 | 10.9% |
| $100,000 to $149,999 | 25 | 9.1% |
| $150,000 to $199,999 | 61 | 22.1% |
| $200,000+ | 115 | 41.7% |
Family Income by Famaliy Size in Occoquan
4-person families (33 | 12.0%) account for the highest median family income in Occoquan with $250,001 per family, while 2-person families (166 | 60.1%) have the highest median income of $91,000 per family member.
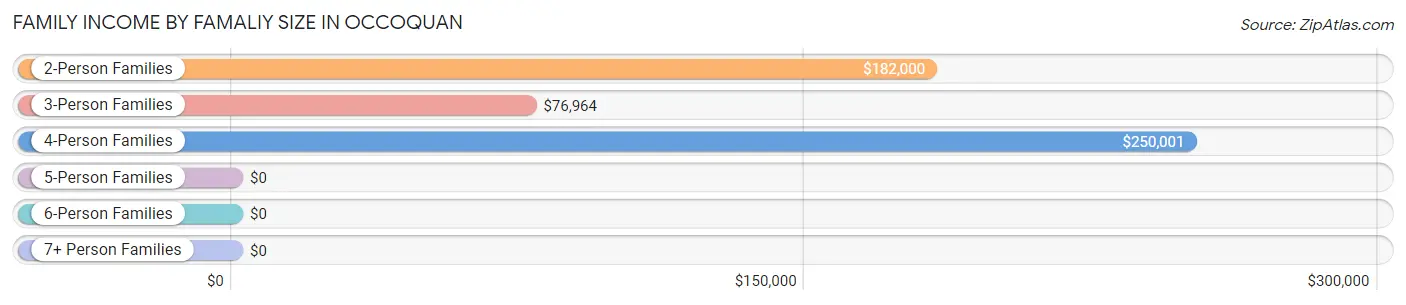
| Income Bracket | # Families | Median Income |
| 2-Person Families | 166 (60.1%) | $182,000 |
| 3-Person Families | 75 (27.2%) | $76,964 |
| 4-Person Families | 33 (12.0%) | $250,001 |
| 5-Person Families | 2 (0.7%) | $0 |
| 6-Person Families | 0 (0.0%) | $0 |
| 7+ Person Families | 0 (0.0%) | $0 |
| Total | 276 (100.0%) | $176,429 |
Family Income by Number of Earners in Occoquan
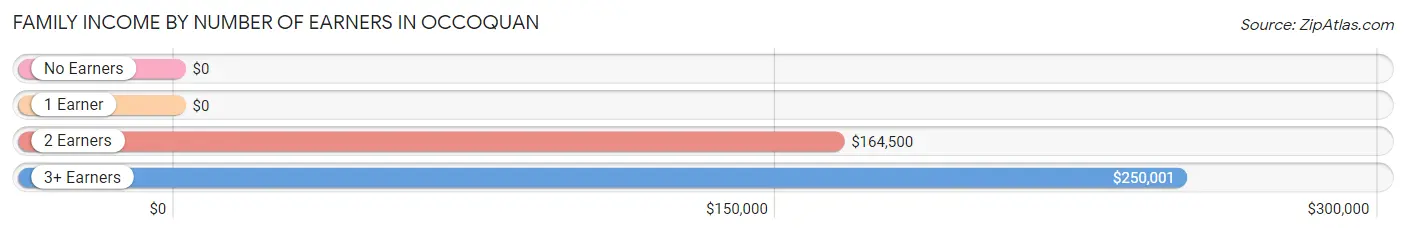
| Number of Earners | # Families | Median Income |
| No Earners | 10 (3.6%) | $0 |
| 1 Earner | 54 (19.6%) | $0 |
| 2 Earners | 178 (64.5%) | $164,500 |
| 3+ Earners | 34 (12.3%) | $250,001 |
| Total | 276 (100.0%) | $176,429 |
Household Income in Occoquan
Household Income Brackets in Occoquan
With 137 households falling in the category, the $200,000+ income range is the most frequent in Occoquan, accounting for 24.1% of all households.
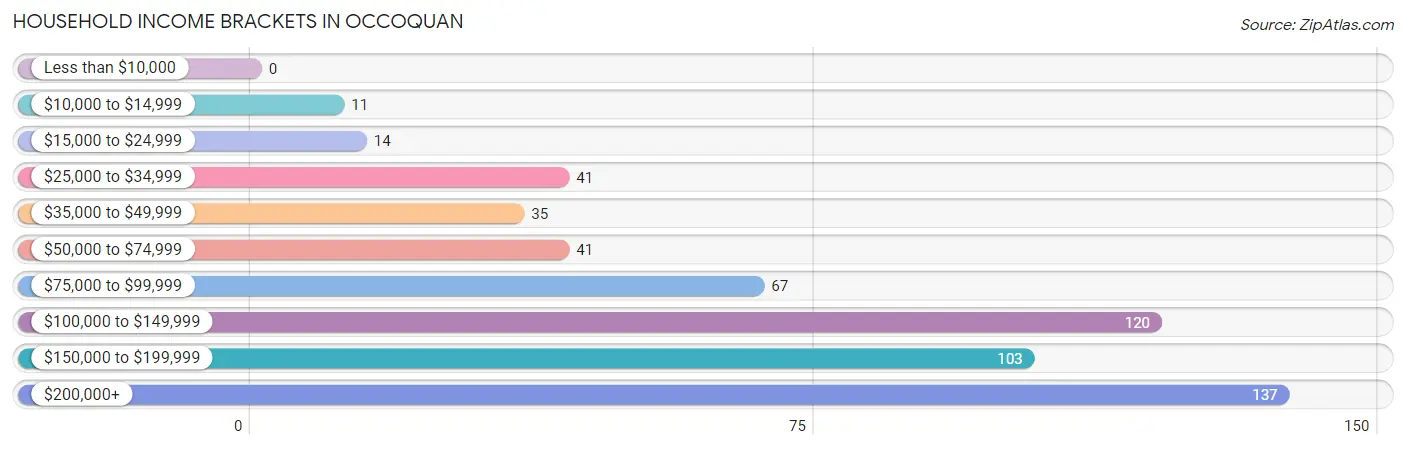
| Income Bracket | # Households | % Households |
| Less than $10,000 | 0 | 0.0% |
| $10,000 to $14,999 | 11 | 1.9% |
| $15,000 to $24,999 | 14 | 2.5% |
| $25,000 to $34,999 | 41 | 7.2% |
| $35,000 to $49,999 | 35 | 6.2% |
| $50,000 to $74,999 | 41 | 7.2% |
| $75,000 to $99,999 | 67 | 11.8% |
| $100,000 to $149,999 | 120 | 21.1% |
| $150,000 to $199,999 | 103 | 18.1% |
| $200,000+ | 137 | 24.1% |
Household Income by Householder Age in Occoquan
The median household income in Occoquan is $126,927, with the highest median household income of $170,536 found in the 45 to 64 years age bracket for the primary householder. A total of 303 households (53.2%) fall into this category. Meanwhile, the 15 to 24 years age bracket for the primary householder has the lowest median household income of $0, with 9 households (1.6%) in this group.

| Income Bracket | # Households | Median Income |
| 15 to 24 Years | 9 (1.6%) | $0 |
| 25 to 44 Years | 204 (35.8%) | $94,722 |
| 45 to 64 Years | 303 (53.2%) | $170,536 |
| 65+ Years | 53 (9.3%) | $115,417 |
| Total | 569 (100.0%) | $126,927 |
Poverty in Occoquan
Income Below Poverty by Sex and Age in Occoquan
With 2.6% poverty level for males and 2.6% for females among the residents of Occoquan, 15 year old males and 18 to 24 year old females are the most vulnerable to poverty, with 2 males (100.0%) and 8 females (19.1%) in their respective age groups living below the poverty level.
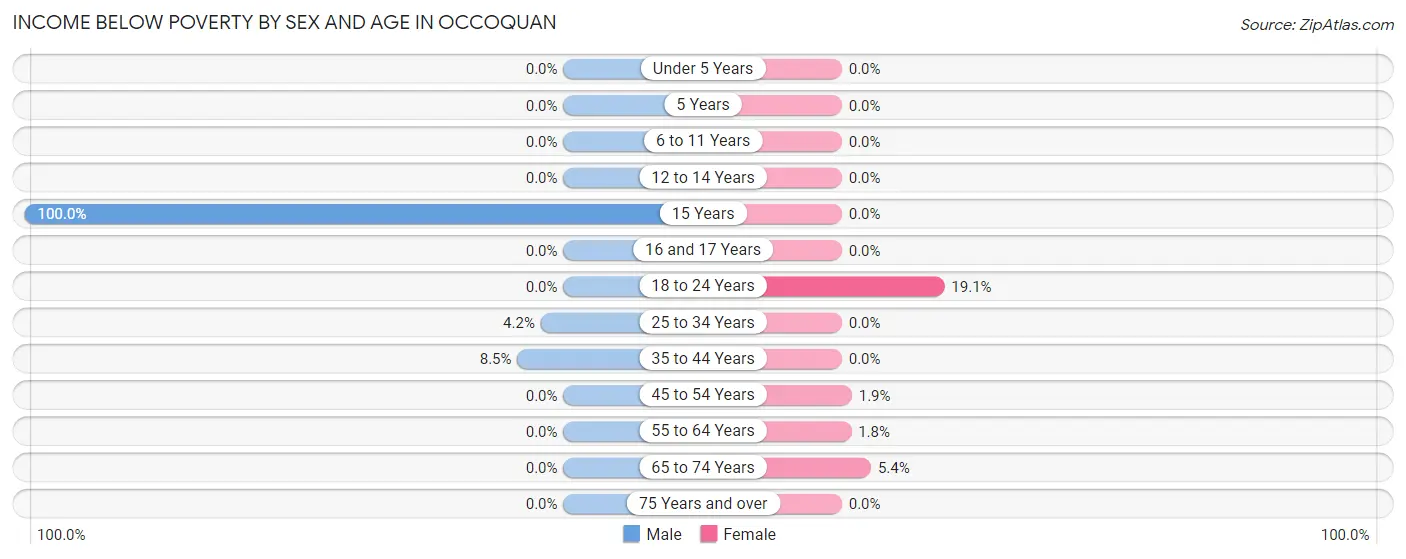
| Age Bracket | Male | Female |
| Under 5 Years | 0 (0.0%) | 0 (0.0%) |
| 5 Years | 0 (0.0%) | 0 (0.0%) |
| 6 to 11 Years | 0 (0.0%) | 0 (0.0%) |
| 12 to 14 Years | 0 (0.0%) | 0 (0.0%) |
| 15 Years | 2 (100.0%) | 0 (0.0%) |
| 16 and 17 Years | 0 (0.0%) | 0 (0.0%) |
| 18 to 24 Years | 0 (0.0%) | 8 (19.1%) |
| 25 to 34 Years | 5 (4.2%) | 0 (0.0%) |
| 35 to 44 Years | 7 (8.5%) | 0 (0.0%) |
| 45 to 54 Years | 0 (0.0%) | 2 (1.8%) |
| 55 to 64 Years | 0 (0.0%) | 2 (1.8%) |
| 65 to 74 Years | 0 (0.0%) | 2 (5.4%) |
| 75 Years and over | 0 (0.0%) | 0 (0.0%) |
| Total | 14 (2.6%) | 14 (2.6%) |
Income Above Poverty by Sex and Age in Occoquan
According to the poverty statistics in Occoquan, males aged under 5 years and females aged under 5 years are the age groups that are most secure financially, with 100.0% of males and 100.0% of females in these age groups living above the poverty line.
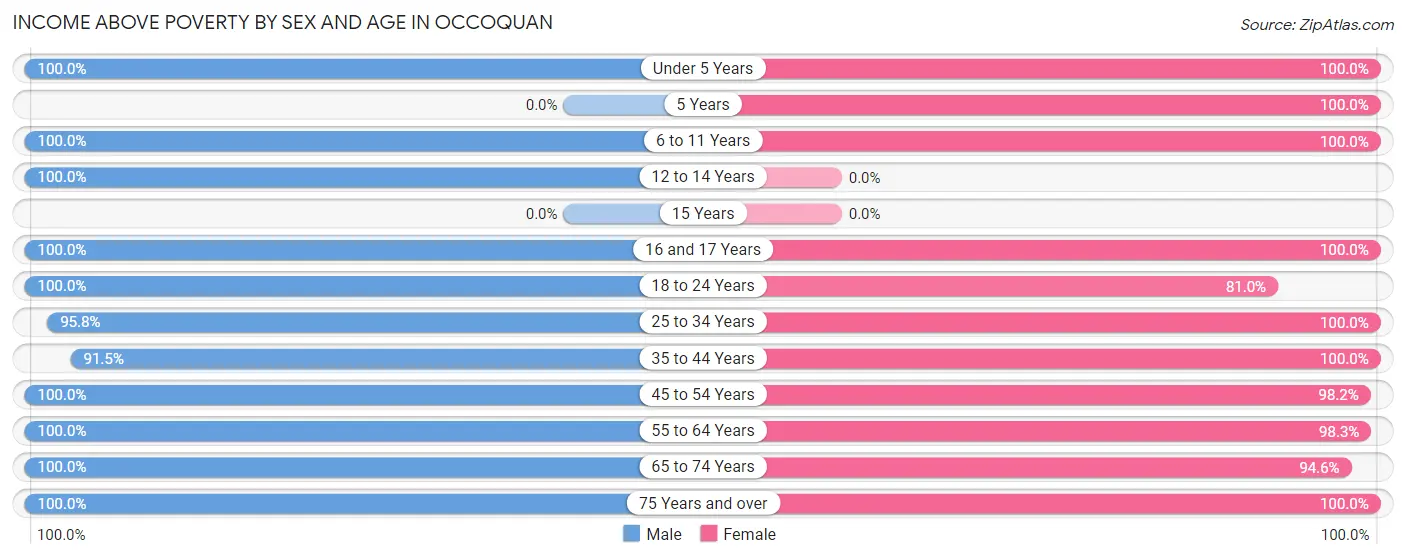
| Age Bracket | Male | Female |
| Under 5 Years | 30 (100.0%) | 29 (100.0%) |
| 5 Years | 0 (0.0%) | 5 (100.0%) |
| 6 to 11 Years | 4 (100.0%) | 3 (100.0%) |
| 12 to 14 Years | 7 (100.0%) | 0 (0.0%) |
| 15 Years | 0 (0.0%) | 0 (0.0%) |
| 16 and 17 Years | 3 (100.0%) | 2 (100.0%) |
| 18 to 24 Years | 35 (100.0%) | 34 (80.9%) |
| 25 to 34 Years | 114 (95.8%) | 147 (100.0%) |
| 35 to 44 Years | 75 (91.5%) | 38 (100.0%) |
| 45 to 54 Years | 104 (100.0%) | 106 (98.2%) |
| 55 to 64 Years | 114 (100.0%) | 112 (98.3%) |
| 65 to 74 Years | 25 (100.0%) | 35 (94.6%) |
| 75 Years and over | 4 (100.0%) | 18 (100.0%) |
| Total | 515 (97.4%) | 529 (97.4%) |
Income Below Poverty Among Married-Couple Families in Occoquan
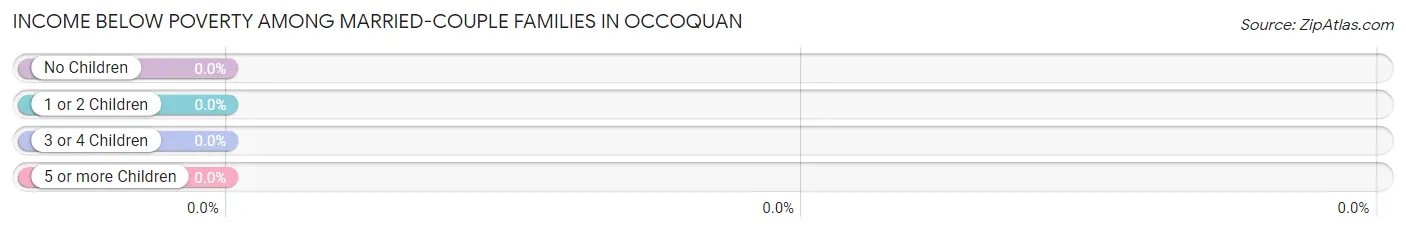
| Children | Above Poverty | Below Poverty |
| No Children | 152 (100.0%) | 0 (0.0%) |
| 1 or 2 Children | 57 (100.0%) | 0 (0.0%) |
| 3 or 4 Children | 0 (0.0%) | 0 (0.0%) |
| 5 or more Children | 0 (0.0%) | 0 (0.0%) |
| Total | 209 (100.0%) | 0 (0.0%) |
Income Below Poverty Among Single-Parent Households in Occoquan
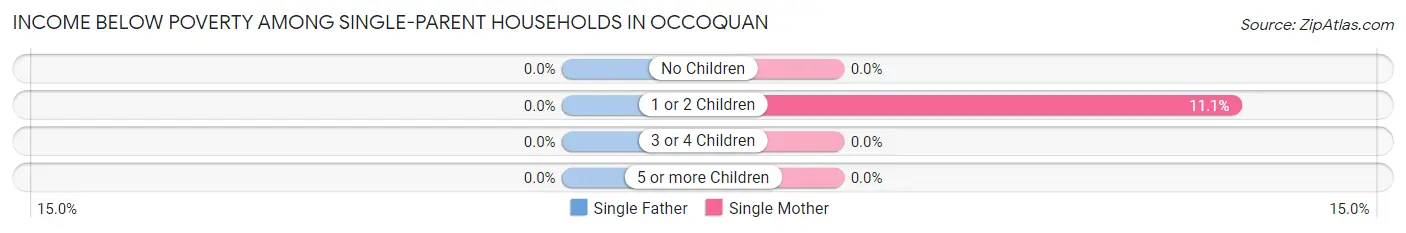
| Children | Single Father | Single Mother |
| No Children | 0 (0.0%) | 0 (0.0%) |
| 1 or 2 Children | 0 (0.0%) | 2 (11.1%) |
| 3 or 4 Children | 0 (0.0%) | 0 (0.0%) |
| 5 or more Children | 0 (0.0%) | 0 (0.0%) |
| Total | 0 (0.0%) | 2 (4.5%) |
Income Below Poverty Among Married-Couple vs Single-Parent Households in Occoquan
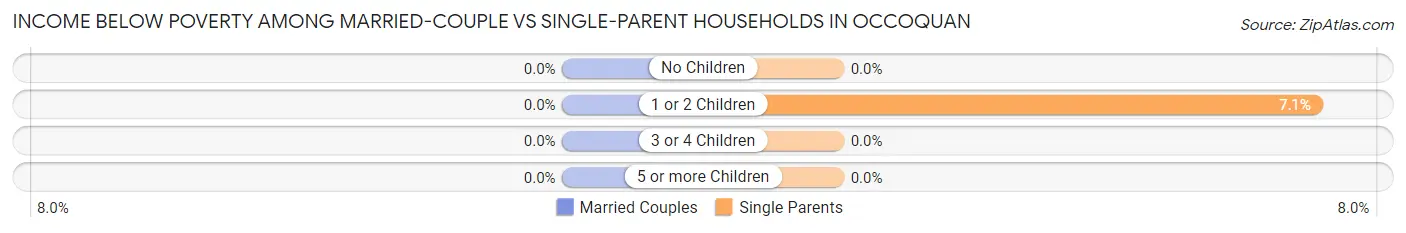
| Children | Married-Couple Families | Single-Parent Households |
| No Children | 0 (0.0%) | 0 (0.0%) |
| 1 or 2 Children | 0 (0.0%) | 2 (7.1%) |
| 3 or 4 Children | 0 (0.0%) | 0 (0.0%) |
| 5 or more Children | 0 (0.0%) | 0 (0.0%) |
| Total | 0 (0.0%) | 2 (3.0%) |
Race in Occoquan
The most populous races in Occoquan are White / Caucasian (761 | 71.0%), Hispanic or Latino (228 | 21.3%), and Black / African American (110 | 10.3%).
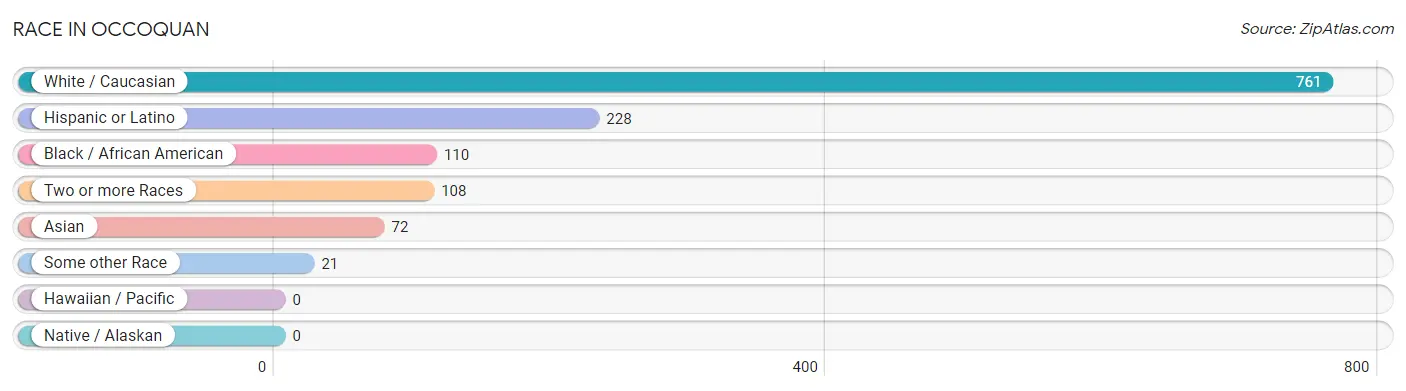
| Race | # Population | % Population |
| Asian | 72 | 6.7% |
| Black / African American | 110 | 10.3% |
| Hawaiian / Pacific | 0 | 0.0% |
| Hispanic or Latino | 228 | 21.3% |
| Native / Alaskan | 0 | 0.0% |
| White / Caucasian | 761 | 71.0% |
| Two or more Races | 108 | 10.1% |
| Some other Race | 21 | 2.0% |
| Total | 1,072 | 100.0% |
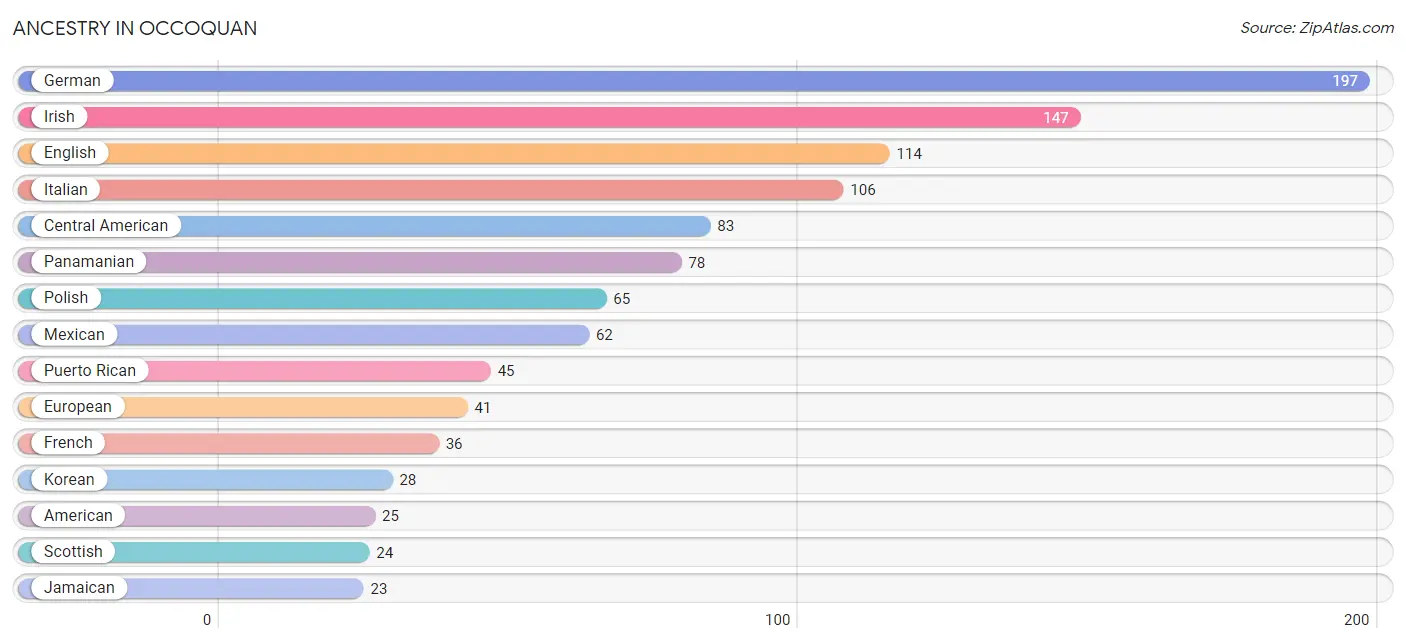
Ancestry in Occoquan
The most populous ancestries reported in Occoquan are German (197 | 18.4%), Irish (147 | 13.7%), English (114 | 10.6%), Italian (106 | 9.9%), and Central American (83 | 7.7%), together accounting for 60.4% of all Occoquan residents.
| Ancestry | # Population | % Population |
| African | 2 | 0.2% |
| American | 25 | 2.3% |
| Arab | 6 | 0.6% |
| Argentinean | 7 | 0.6% |
| Armenian | 4 | 0.4% |
| Austrian | 2 | 0.2% |
| Bhutanese | 14 | 1.3% |
| Burmese | 2 | 0.2% |
| Central American | 83 | 7.7% |
| Croatian | 2 | 0.2% |
| Danish | 10 | 0.9% |
| Dominican | 3 | 0.3% |
| Dutch | 10 | 0.9% |
| Ecuadorian | 12 | 1.1% |
| English | 114 | 10.6% |
| Estonian | 21 | 2.0% |
| European | 41 | 3.8% |
| French | 36 | 3.4% |
| French Canadian | 22 | 2.1% |
| German | 197 | 18.4% |
| Greek | 6 | 0.6% |
| Hungarian | 8 | 0.7% |
| Indian (Asian) | 18 | 1.7% |
| Irish | 147 | 13.7% |
| Italian | 106 | 9.9% |
| Jamaican | 23 | 2.1% |
| Korean | 28 | 2.6% |
| Laotian | 3 | 0.3% |
| Latvian | 4 | 0.4% |
| Lithuanian | 2 | 0.2% |
| Mexican | 62 | 5.8% |
| Moroccan | 6 | 0.6% |
| Nicaraguan | 5 | 0.5% |
| Northern European | 9 | 0.8% |
| Norwegian | 14 | 1.3% |
| Panamanian | 78 | 7.3% |
| Polish | 65 | 6.1% |
| Puerto Rican | 45 | 4.2% |
| Russian | 8 | 0.7% |
| Scotch-Irish | 16 | 1.5% |
| Scottish | 24 | 2.2% |
| South American | 19 | 1.8% |
| Spaniard | 16 | 1.5% |
| Sri Lankan | 10 | 0.9% |
| Subsaharan African | 6 | 0.6% |
| Swedish | 13 | 1.2% |
| Swiss | 9 | 0.8% |
| Thai | 17 | 1.6% |
| Ukrainian | 4 | 0.4% |
| Welsh | 7 | 0.6% | View All 50 Rows |
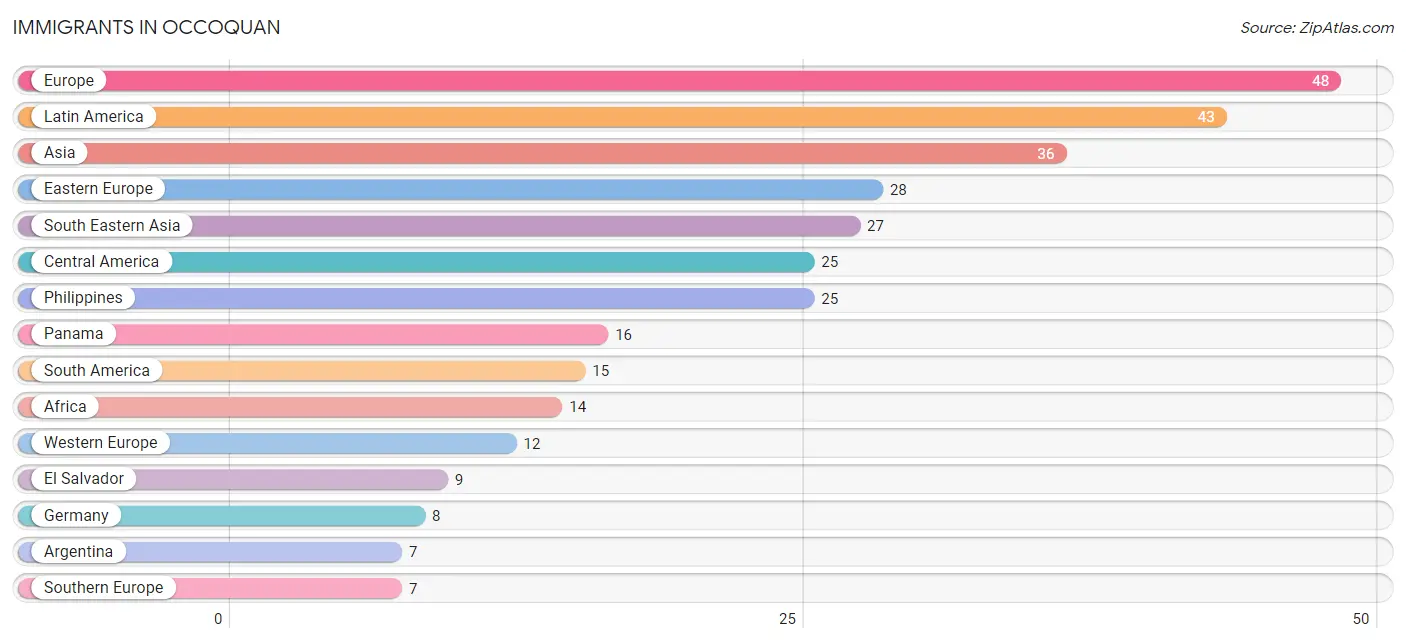
Immigrants in Occoquan
The most numerous immigrant groups reported in Occoquan came from Europe (48 | 4.5%), Latin America (43 | 4.0%), Asia (36 | 3.4%), Eastern Europe (28 | 2.6%), and South Eastern Asia (27 | 2.5%), together accounting for 17.0% of all Occoquan residents.
| Immigration Origin | # Population | % Population |
| Africa | 14 | 1.3% |
| Argentina | 7 | 0.6% |
| Asia | 36 | 3.4% |
| Brazil | 2 | 0.2% |
| Canada | 3 | 0.3% |
| Caribbean | 3 | 0.3% |
| Central America | 25 | 2.3% |
| China | 3 | 0.3% |
| Dominican Republic | 3 | 0.3% |
| Eastern Africa | 6 | 0.6% |
| Eastern Asia | 3 | 0.3% |
| Eastern Europe | 28 | 2.6% |
| Ecuador | 6 | 0.6% |
| El Salvador | 9 | 0.8% |
| Europe | 48 | 4.5% |
| Germany | 8 | 0.7% |
| India | 4 | 0.4% |
| Ireland | 1 | 0.1% |
| Latin America | 43 | 4.0% |
| Morocco | 6 | 0.6% |
| Netherlands | 4 | 0.4% |
| Northern Africa | 6 | 0.6% |
| Northern Europe | 1 | 0.1% |
| Panama | 16 | 1.5% |
| Philippines | 25 | 2.3% |
| Russia | 3 | 0.3% |
| South Africa | 2 | 0.2% |
| South America | 15 | 1.4% |
| South Central Asia | 4 | 0.4% |
| South Eastern Asia | 27 | 2.5% |
| Southern Europe | 7 | 0.6% |
| Spain | 7 | 0.6% |
| Uganda | 2 | 0.2% |
| Ukraine | 4 | 0.4% |
| Vietnam | 2 | 0.2% |
| Western Asia | 2 | 0.2% |
| Western Europe | 12 | 1.1% | View All 37 Rows |
Sex and Age in Occoquan
Sex and Age in Occoquan
The most populous age groups in Occoquan are 30 to 34 Years (99 | 18.7%) for men and 55 to 59 Years (102 | 18.8%) for women.
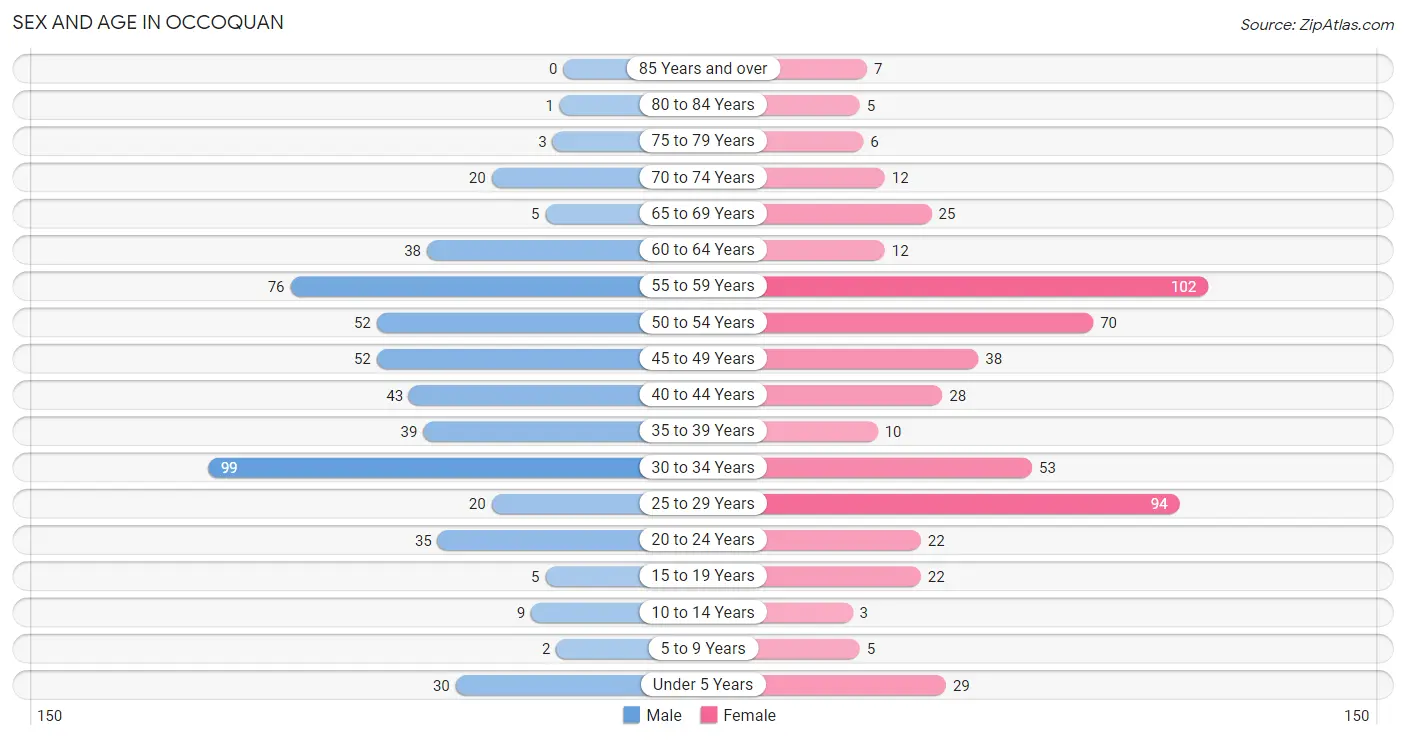
| Age Bracket | Male | Female |
| Under 5 Years | 30 (5.7%) | 29 (5.3%) |
| 5 to 9 Years | 2 (0.4%) | 5 (0.9%) |
| 10 to 14 Years | 9 (1.7%) | 3 (0.5%) |
| 15 to 19 Years | 5 (0.9%) | 22 (4.1%) |
| 20 to 24 Years | 35 (6.6%) | 22 (4.1%) |
| 25 to 29 Years | 20 (3.8%) | 94 (17.3%) |
| 30 to 34 Years | 99 (18.7%) | 53 (9.8%) |
| 35 to 39 Years | 39 (7.4%) | 10 (1.8%) |
| 40 to 44 Years | 43 (8.1%) | 28 (5.2%) |
| 45 to 49 Years | 52 (9.8%) | 38 (7.0%) |
| 50 to 54 Years | 52 (9.8%) | 70 (12.9%) |
| 55 to 59 Years | 76 (14.4%) | 102 (18.8%) |
| 60 to 64 Years | 38 (7.2%) | 12 (2.2%) |
| 65 to 69 Years | 5 (0.9%) | 25 (4.6%) |
| 70 to 74 Years | 20 (3.8%) | 12 (2.2%) |
| 75 to 79 Years | 3 (0.6%) | 6 (1.1%) |
| 80 to 84 Years | 1 (0.2%) | 5 (0.9%) |
| 85 Years and over | 0 (0.0%) | 7 (1.3%) |
| Total | 529 (100.0%) | 543 (100.0%) |
Families and Households in Occoquan
Median Family Size in Occoquan
The median family size in Occoquan is 2.58 persons per family, with married-couple families (209 | 75.7%) accounting for the largest median family size of 2.69 persons per family. On the other hand, single male/father families (23 | 8.3%) represent the smallest median family size with 2.09 persons per family.
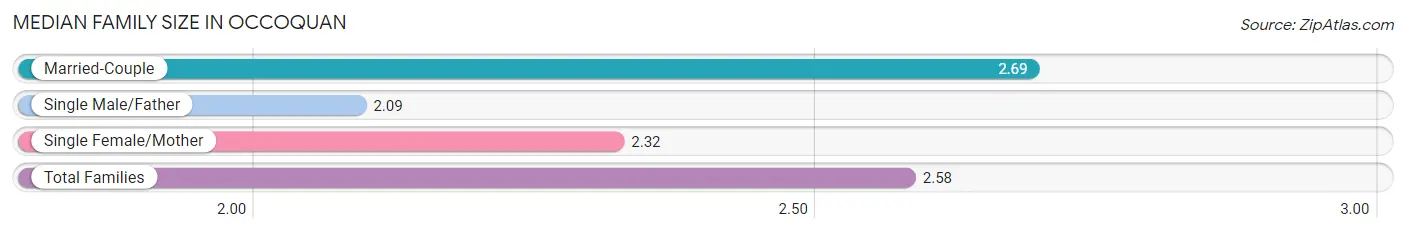
| Family Type | # Families | Family Size |
| Married-Couple | 209 (75.7%) | 2.69 |
| Single Male/Father | 23 (8.3%) | 2.09 |
| Single Female/Mother | 44 (15.9%) | 2.32 |
| Total Families | 276 (100.0%) | 2.58 |
Median Household Size in Occoquan
The median household size in Occoquan is 1.88 persons per household, with married-couple households (209 | 36.7%) accounting for the largest median household size of 2.8 persons per household. non-family households (293 | 51.5%) represent the smallest median household size with 1.12 persons per household.
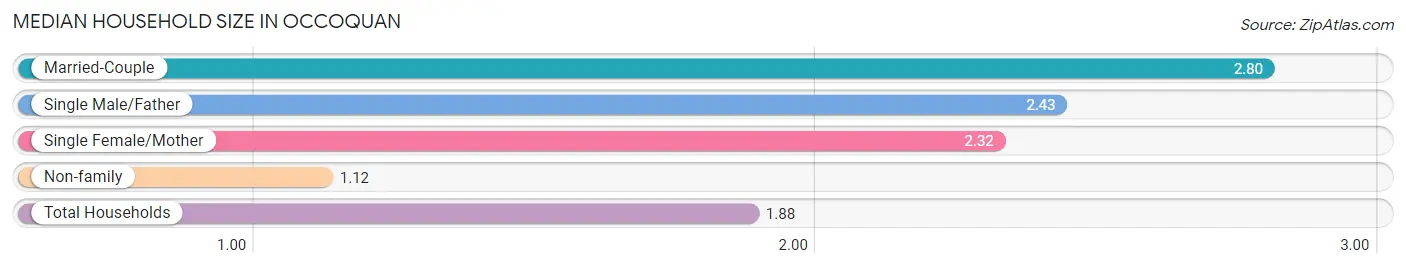
| Household Type | # Households | Household Size |
| Married-Couple | 209 (36.7%) | 2.80 |
| Single Male/Father | 23 (4.0%) | 2.43 |
| Single Female/Mother | 44 (7.7%) | 2.32 |
| Non-family | 293 (51.5%) | 1.12 |
| Total Households | 569 (100.0%) | 1.88 |
Household Size by Marriage Status in Occoquan
Out of a total of 569 households in Occoquan, 276 (48.5%) are family households, while 293 (51.5%) are nonfamily households. The most numerous type of family households are 2-person households, comprising 160, and the most common type of nonfamily households are 1-person households, comprising 269.
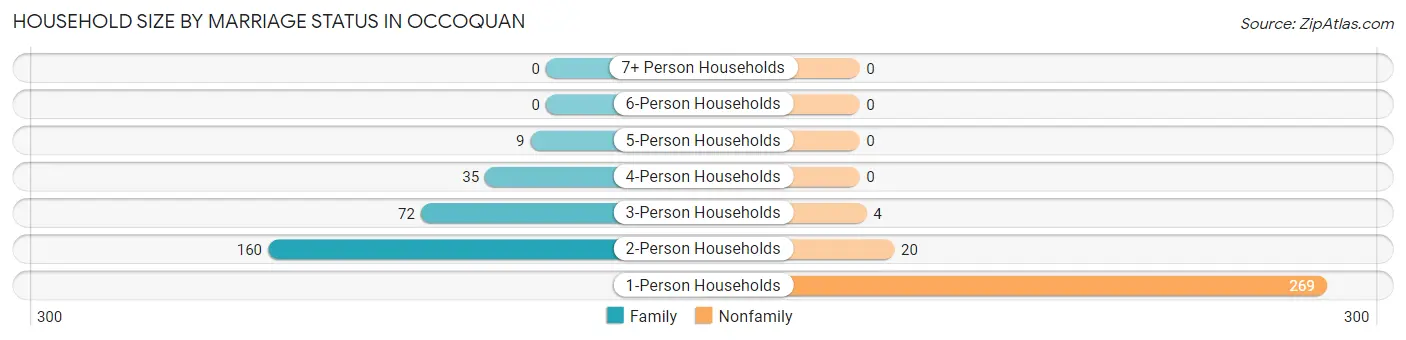
| Household Size | Family Households | Nonfamily Households |
| 1-Person Households | - | 269 (47.3%) |
| 2-Person Households | 160 (28.1%) | 20 (3.5%) |
| 3-Person Households | 72 (12.7%) | 4 (0.7%) |
| 4-Person Households | 35 (6.1%) | 0 (0.0%) |
| 5-Person Households | 9 (1.6%) | 0 (0.0%) |
| 6-Person Households | 0 (0.0%) | 0 (0.0%) |
| 7+ Person Households | 0 (0.0%) | 0 (0.0%) |
| Total | 276 (48.5%) | 293 (51.5%) |
Female Fertility in Occoquan
Fertility by Age in Occoquan
Average fertility rate in Occoquan is 58.0 births per 1,000 women. Women in the age bracket of 20 to 34 years have the highest fertility rate with 77.0 births per 1,000 women. Women in the age bracket of 20 to 34 years acount for 76.5% of all women with births.
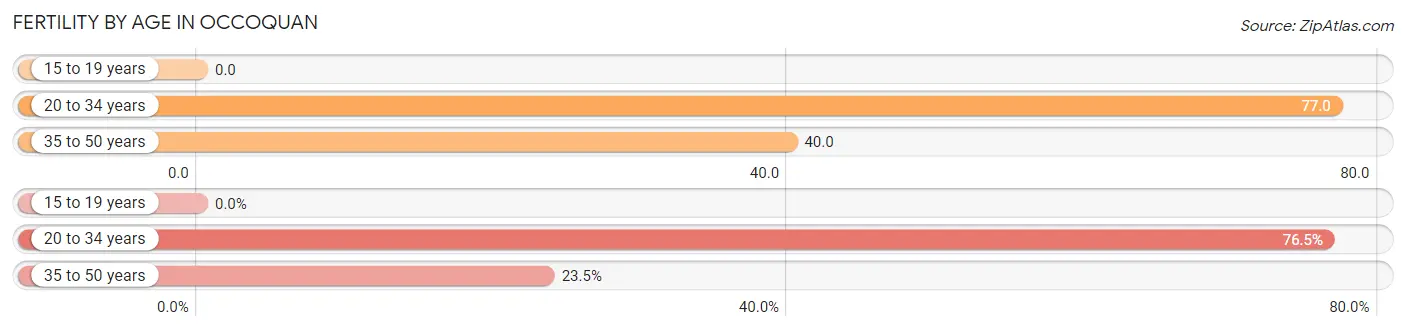
| Age Bracket | Women with Births | Births / 1,000 Women |
| 15 to 19 years | 0 (0.0%) | 0.0 |
| 20 to 34 years | 13 (76.5%) | 77.0 |
| 35 to 50 years | 4 (23.5%) | 40.0 |
| Total | 17 (100.0%) | 58.0 |
Fertility by Age by Marriage Status in Occoquan
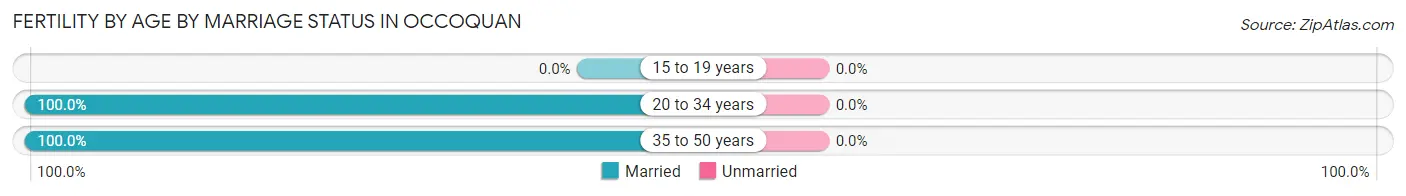
| Age Bracket | Married | Unmarried |
| 15 to 19 years | 0 (0.0%) | 0 (0.0%) |
| 20 to 34 years | 13 (100.0%) | 0 (0.0%) |
| 35 to 50 years | 4 (100.0%) | 0 (0.0%) |
| Total | 17 (100.0%) | 0 (0.0%) |
Fertility by Education in Occoquan
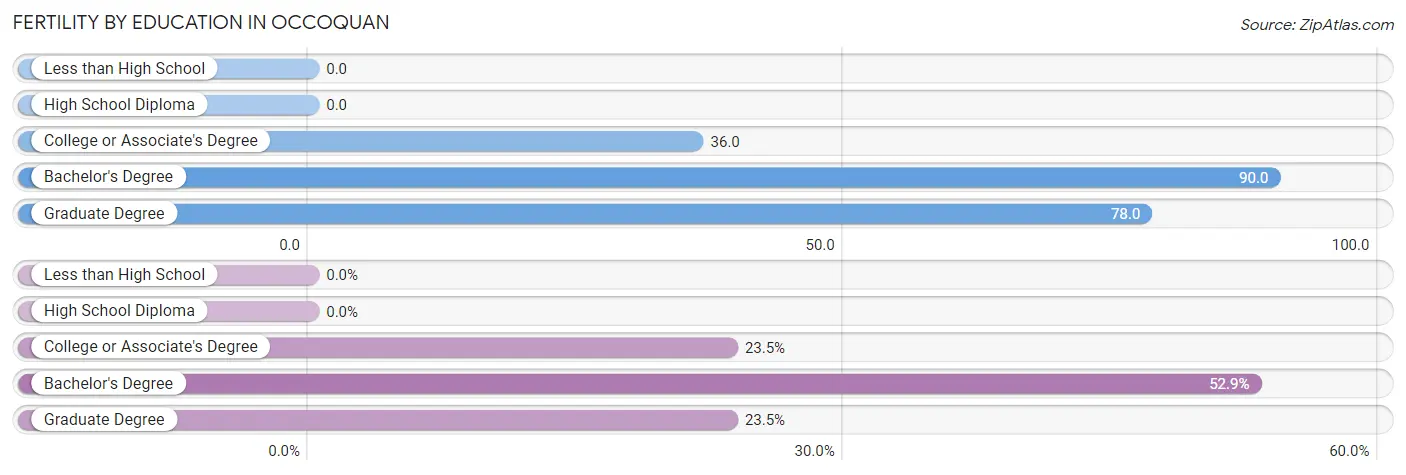
| Educational Attainment | Women with Births | Births / 1,000 Women |
| Less than High School | 0 (0.0%) | 0.0 |
| High School Diploma | 0 (0.0%) | 0.0 |
| College or Associate's Degree | 4 (23.5%) | 36.0 |
| Bachelor's Degree | 9 (52.9%) | 90.0 |
| Graduate Degree | 4 (23.5%) | 78.0 |
| Total | 17 (100.0%) | 58.0 |
Fertility by Education by Marriage Status in Occoquan
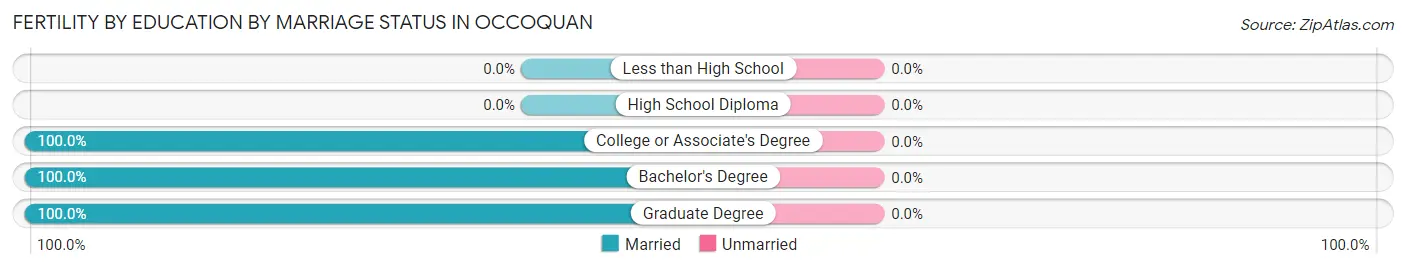
| Educational Attainment | Married | Unmarried |
| Less than High School | 0 (0.0%) | 0 (0.0%) |
| High School Diploma | 0 (0.0%) | 0 (0.0%) |
| College or Associate's Degree | 4 (100.0%) | 0 (0.0%) |
| Bachelor's Degree | 9 (100.0%) | 0 (0.0%) |
| Graduate Degree | 4 (100.0%) | 0 (0.0%) |
| Total | 17 (100.0%) | 0 (0.0%) |
Employment Characteristics in Occoquan
Employment by Class of Employer in Occoquan
Among the 747 employed individuals in Occoquan, private company employees (311 | 41.6%), federal government employees (201 | 26.9%), and not-for-profit organizations (97 | 13.0%) make up the most common classes of employment.
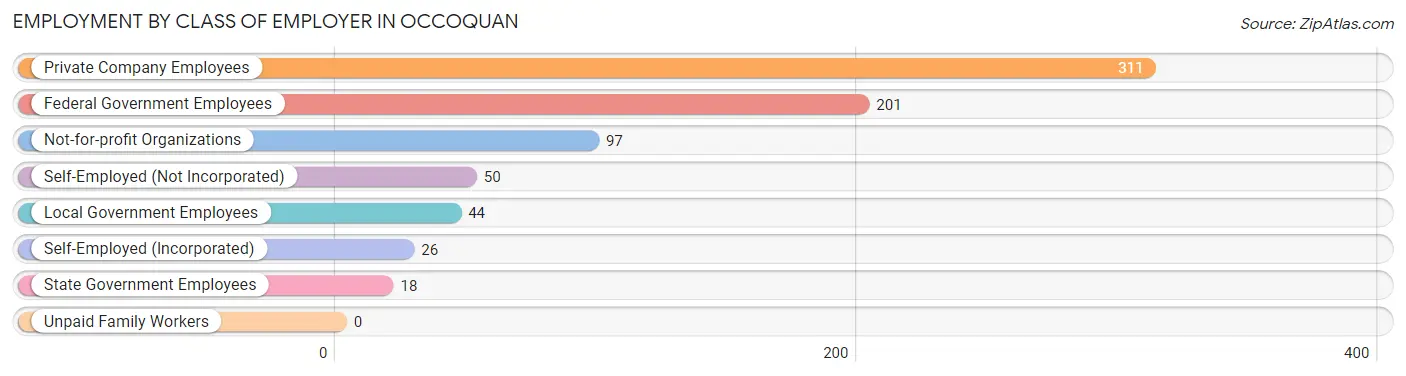
| Employer Class | # Employees | % Employees |
| Private Company Employees | 311 | 41.6% |
| Self-Employed (Incorporated) | 26 | 3.5% |
| Self-Employed (Not Incorporated) | 50 | 6.7% |
| Not-for-profit Organizations | 97 | 13.0% |
| Local Government Employees | 44 | 5.9% |
| State Government Employees | 18 | 2.4% |
| Federal Government Employees | 201 | 26.9% |
| Unpaid Family Workers | 0 | 0.0% |
| Total | 747 | 100.0% |
Employment Status by Age in Occoquan
According to the labor force statistics for Occoquan, out of the total population over 16 years of age (992), 83.9% or 832 individuals are in the labor force, with 5.1% or 42 of them unemployed. The age group with the highest labor force participation rate is 25 to 29 years, with 98.2% or 112 individuals in the labor force. Within the labor force, the 65 to 74 years age range has the highest percentage of unemployed individuals, with 25.0% or 4 of them being unemployed.
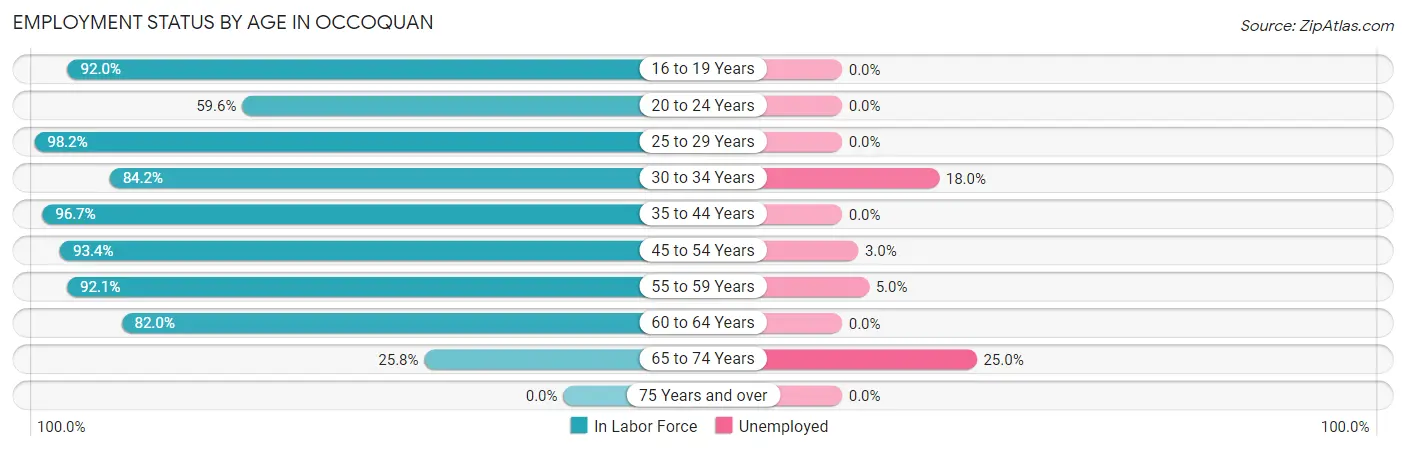
| Age Bracket | In Labor Force | Unemployed |
| 16 to 19 Years | 23 (92.0%) | 0 (0.0%) |
| 20 to 24 Years | 34 (59.6%) | 0 (0.0%) |
| 25 to 29 Years | 112 (98.2%) | 0 (0.0%) |
| 30 to 34 Years | 128 (84.2%) | 23 (18.0%) |
| 35 to 44 Years | 116 (96.7%) | 0 (0.0%) |
| 45 to 54 Years | 198 (93.4%) | 6 (3.0%) |
| 55 to 59 Years | 164 (92.1%) | 8 (5.0%) |
| 60 to 64 Years | 41 (82.0%) | 0 (0.0%) |
| 65 to 74 Years | 16 (25.8%) | 4 (25.0%) |
| 75 Years and over | 0 (0.0%) | 0 (0.0%) |
| Total | 832 (83.9%) | 42 (5.1%) |
Employment Status by Educational Attainment in Occoquan
According to labor force statistics for Occoquan, 91.9% of individuals (759) out of the total population between 25 and 64 years of age (826) are in the labor force, with 5.0% or 38 of them being unemployed. The group with the highest labor force participation rate are those with the educational attainment of less than high school, with 100.0% or 4 individuals in the labor force. Within the labor force, individuals with college / associate degree education have the highest percentage of unemployment, with 11.6% or 34 of them being unemployed.
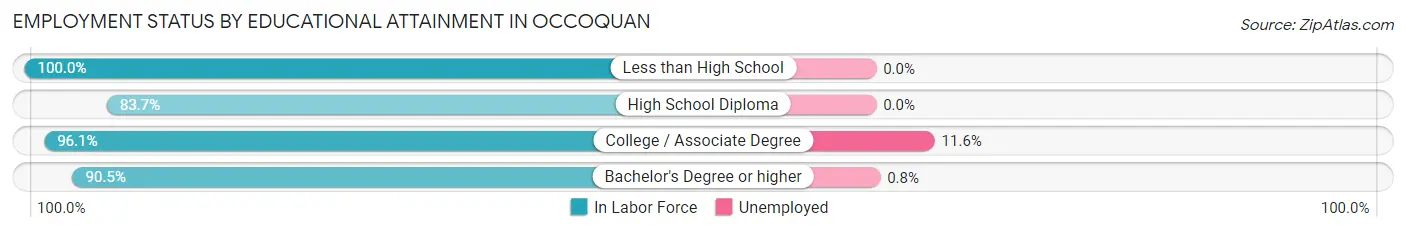
| Educational Attainment | In Labor Force | Unemployed |
| Less than High School | 4 (100.0%) | 0 (0.0%) |
| High School Diploma | 72 (83.7%) | 0 (0.0%) |
| College / Associate Degree | 293 (96.1%) | 35 (11.6%) |
| Bachelor's Degree or higher | 390 (90.5%) | 3 (0.8%) |
| Total | 759 (91.9%) | 41 (5.0%) |
Employment Occupations by Sex in Occoquan
Management, Business, Science and Arts Occupations
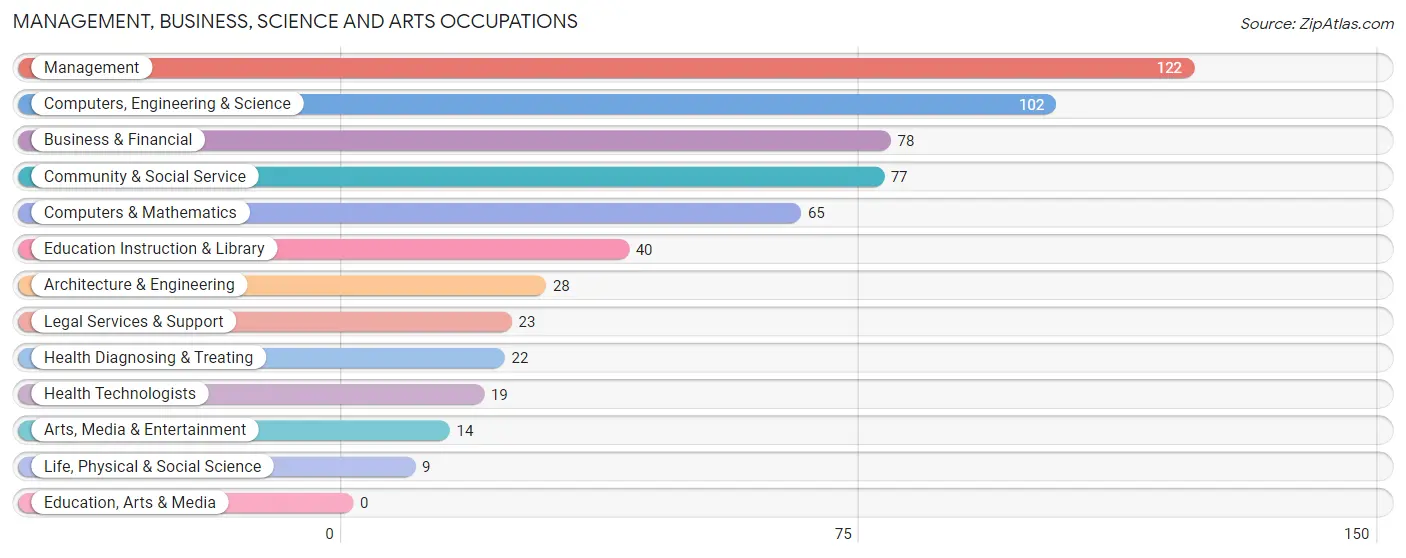
The most common Management, Business, Science and Arts occupations in Occoquan are Management (122 | 15.8%), Computers, Engineering & Science (102 | 13.3%), Business & Financial (78 | 10.1%), Community & Social Service (77 | 10.0%), and Computers & Mathematics (65 | 8.4%).
Management, Business, Science and Arts Occupations by Sex
Within the Management, Business, Science and Arts occupations in Occoquan, the most male-oriented occupations are Computers & Mathematics (76.9%), Business & Financial (73.1%), and Computers, Engineering & Science (62.7%), while the most female-oriented occupations are Legal Services & Support (91.3%), Health Diagnosing & Treating (90.9%), and Health Technologists (89.5%).
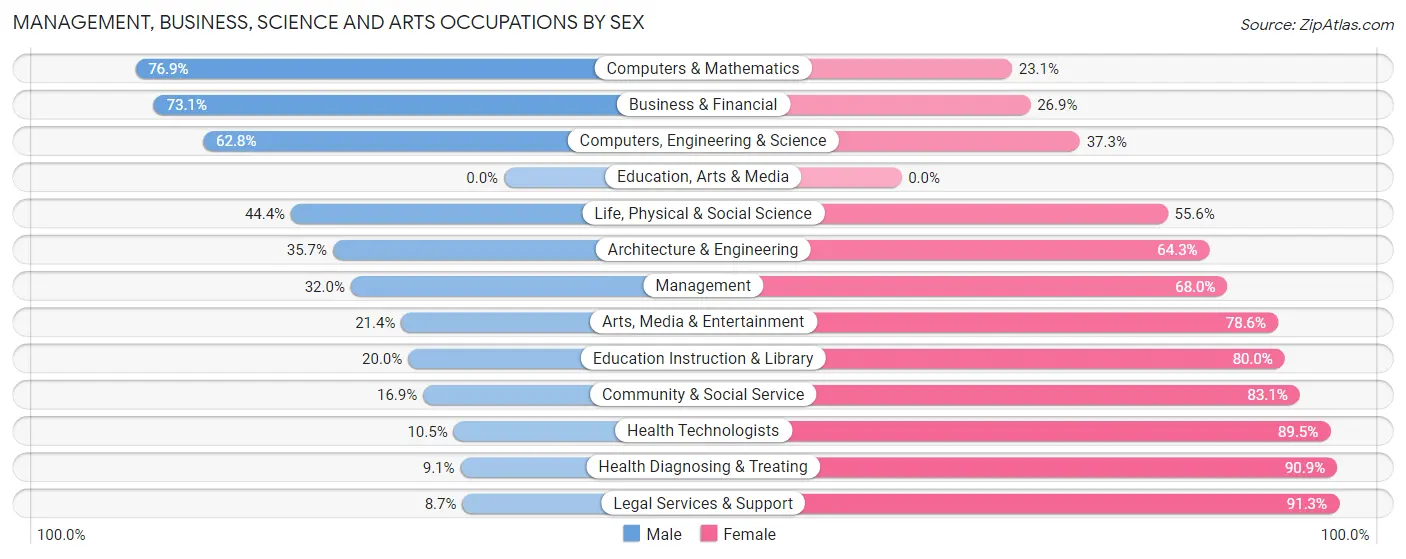
| Occupation | Male | Female |
| Management | 39 (32.0%) | 83 (68.0%) |
| Business & Financial | 57 (73.1%) | 21 (26.9%) |
| Computers, Engineering & Science | 64 (62.7%) | 38 (37.2%) |
| Computers & Mathematics | 50 (76.9%) | 15 (23.1%) |
| Architecture & Engineering | 10 (35.7%) | 18 (64.3%) |
| Life, Physical & Social Science | 4 (44.4%) | 5 (55.6%) |
| Community & Social Service | 13 (16.9%) | 64 (83.1%) |
| Education, Arts & Media | 0 (0.0%) | 0 (0.0%) |
| Legal Services & Support | 2 (8.7%) | 21 (91.3%) |
| Education Instruction & Library | 8 (20.0%) | 32 (80.0%) |
| Arts, Media & Entertainment | 3 (21.4%) | 11 (78.6%) |
| Health Diagnosing & Treating | 2 (9.1%) | 20 (90.9%) |
| Health Technologists | 2 (10.5%) | 17 (89.5%) |
| Total (Category) | 175 (43.6%) | 226 (56.4%) |
| Total (Overall) | 360 (46.8%) | 410 (53.2%) |
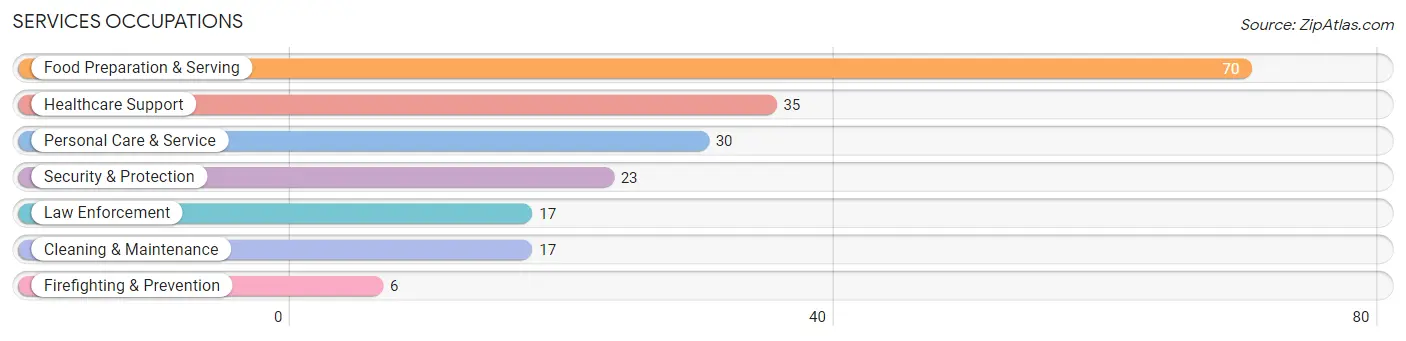
Services Occupations
The most common Services occupations in Occoquan are Food Preparation & Serving (70 | 9.1%), Healthcare Support (35 | 4.5%), Personal Care & Service (30 | 3.9%), Security & Protection (23 | 3.0%), and Law Enforcement (17 | 2.2%).
Services Occupations by Sex
Within the Services occupations in Occoquan, the most male-oriented occupations are Law Enforcement (100.0%), Cleaning & Maintenance (100.0%), and Security & Protection (91.3%), while the most female-oriented occupations are Personal Care & Service (90.0%), Food Preparation & Serving (72.9%), and Healthcare Support (68.6%).
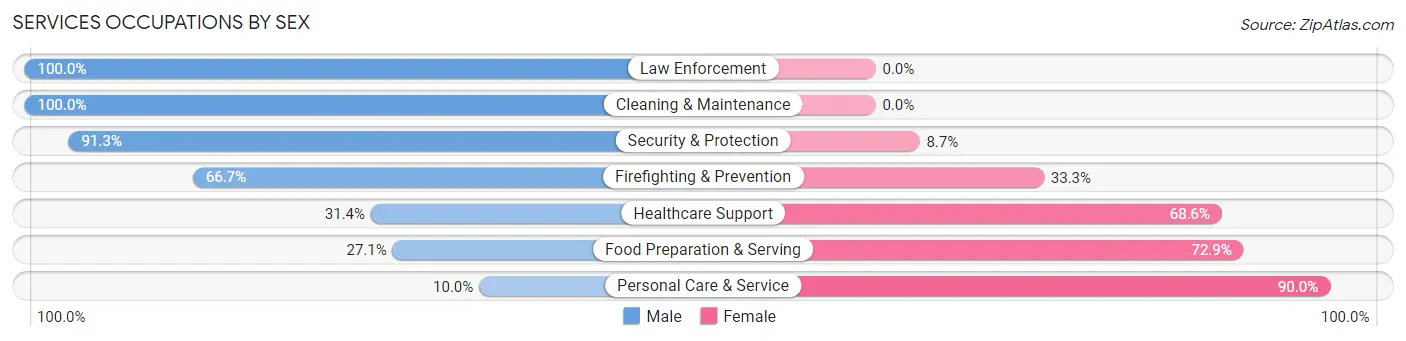
| Occupation | Male | Female |
| Healthcare Support | 11 (31.4%) | 24 (68.6%) |
| Security & Protection | 21 (91.3%) | 2 (8.7%) |
| Firefighting & Prevention | 4 (66.7%) | 2 (33.3%) |
| Law Enforcement | 17 (100.0%) | 0 (0.0%) |
| Food Preparation & Serving | 19 (27.1%) | 51 (72.9%) |
| Cleaning & Maintenance | 17 (100.0%) | 0 (0.0%) |
| Personal Care & Service | 3 (10.0%) | 27 (90.0%) |
| Total (Category) | 71 (40.6%) | 104 (59.4%) |
| Total (Overall) | 360 (46.8%) | 410 (53.2%) |
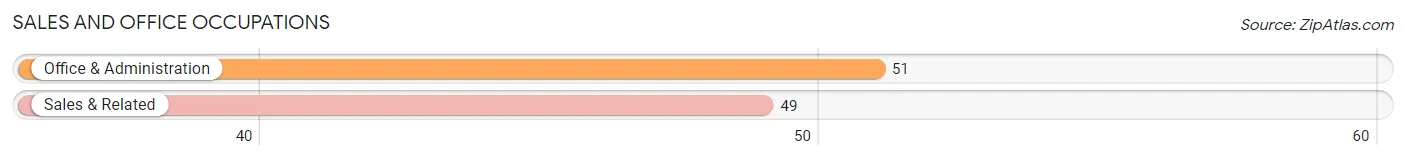
Sales and Office Occupations
The most common Sales and Office occupations in Occoquan are Office & Administration (51 | 6.6%), and Sales & Related (49 | 6.4%).
Sales and Office Occupations by Sex
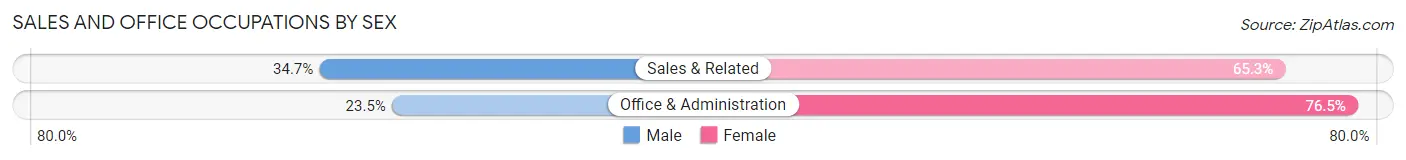
| Occupation | Male | Female |
| Sales & Related | 17 (34.7%) | 32 (65.3%) |
| Office & Administration | 12 (23.5%) | 39 (76.5%) |
| Total (Category) | 29 (29.0%) | 71 (71.0%) |
| Total (Overall) | 360 (46.8%) | 410 (53.2%) |
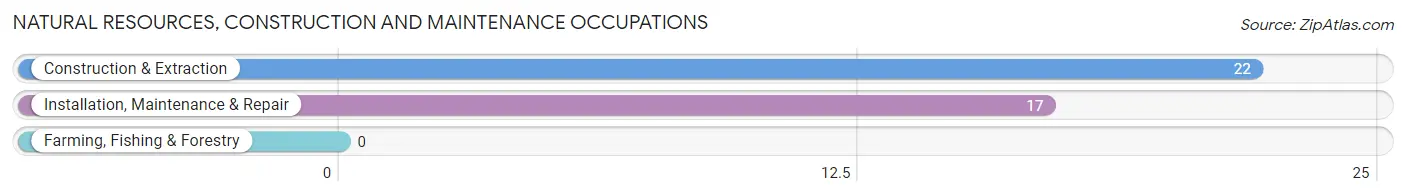
Natural Resources, Construction and Maintenance Occupations
The most common Natural Resources, Construction and Maintenance occupations in Occoquan are Construction & Extraction (22 | 2.9%), and Installation, Maintenance & Repair (17 | 2.2%).
Natural Resources, Construction and Maintenance Occupations by Sex
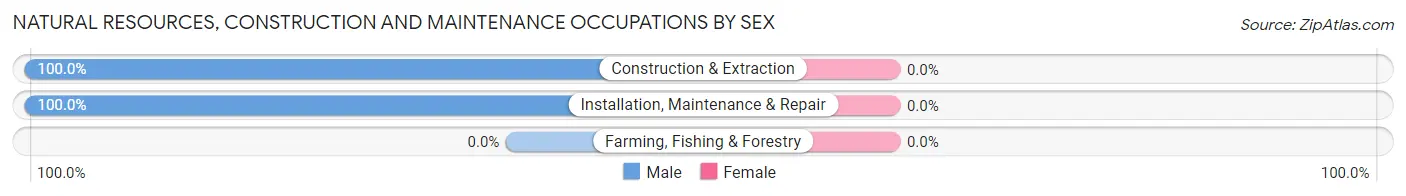
| Occupation | Male | Female |
| Farming, Fishing & Forestry | 0 (0.0%) | 0 (0.0%) |
| Construction & Extraction | 22 (100.0%) | 0 (0.0%) |
| Installation, Maintenance & Repair | 17 (100.0%) | 0 (0.0%) |
| Total (Category) | 39 (100.0%) | 0 (0.0%) |
| Total (Overall) | 360 (46.8%) | 410 (53.2%) |
Production, Transportation and Moving Occupations
The most common Production, Transportation and Moving occupations in Occoquan are Transportation (35 | 4.5%), and Material Moving (20 | 2.6%).
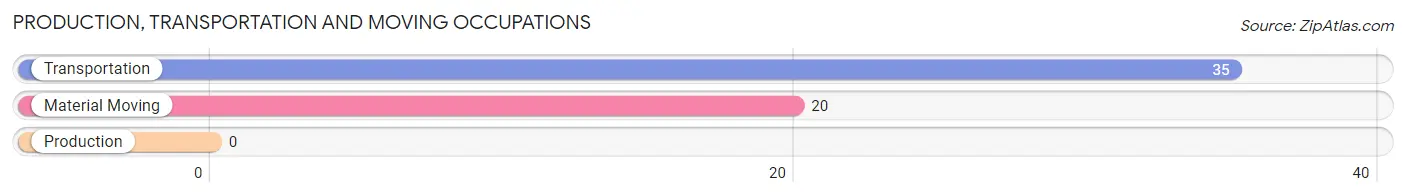
Production, Transportation and Moving Occupations by Sex
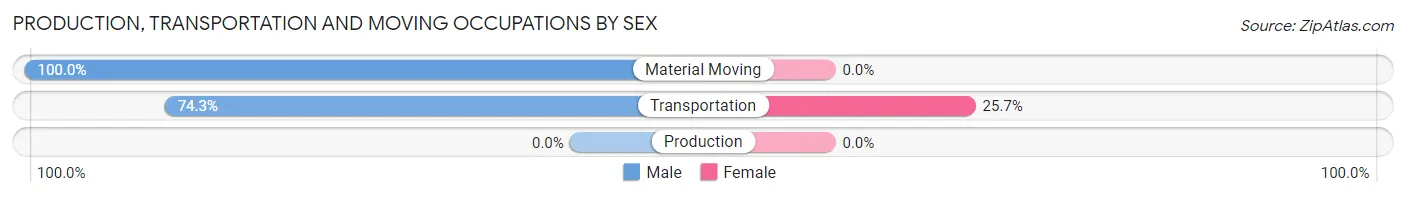
| Occupation | Male | Female |
| Production | 0 (0.0%) | 0 (0.0%) |
| Transportation | 26 (74.3%) | 9 (25.7%) |
| Material Moving | 20 (100.0%) | 0 (0.0%) |
| Total (Category) | 46 (83.6%) | 9 (16.4%) |
| Total (Overall) | 360 (46.8%) | 410 (53.2%) |
Employment Industries by Sex in Occoquan
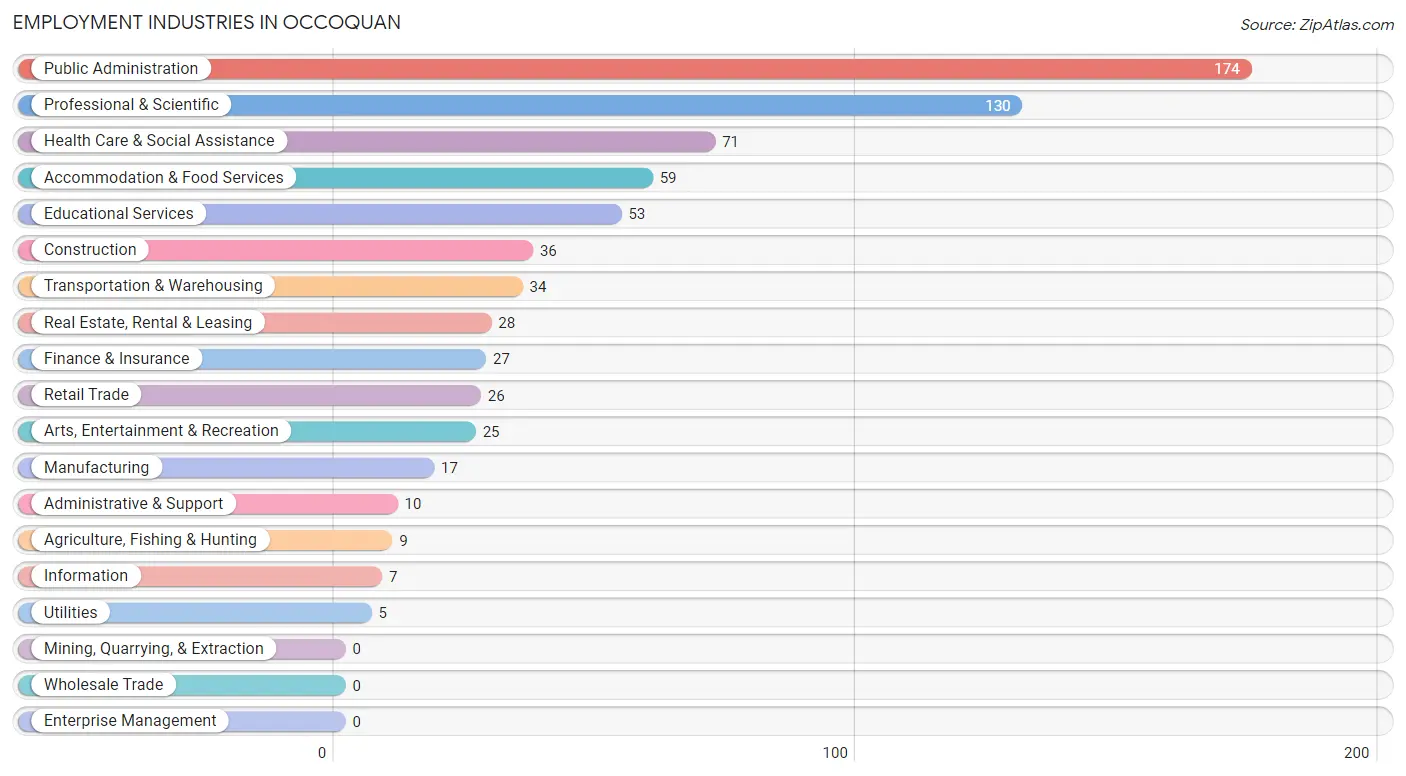
Employment Industries in Occoquan
The major employment industries in Occoquan include Public Administration (174 | 22.6%), Professional & Scientific (130 | 16.9%), Health Care & Social Assistance (71 | 9.2%), Accommodation & Food Services (59 | 7.7%), and Educational Services (53 | 6.9%).
Employment Industries by Sex in Occoquan
The Occoquan industries that see more men than women are Construction (100.0%), Utilities (100.0%), and Administrative & Support (100.0%), whereas the industries that tend to have a higher number of women are Agriculture, Fishing & Hunting (100.0%), Information (100.0%), and Retail Trade (88.5%).
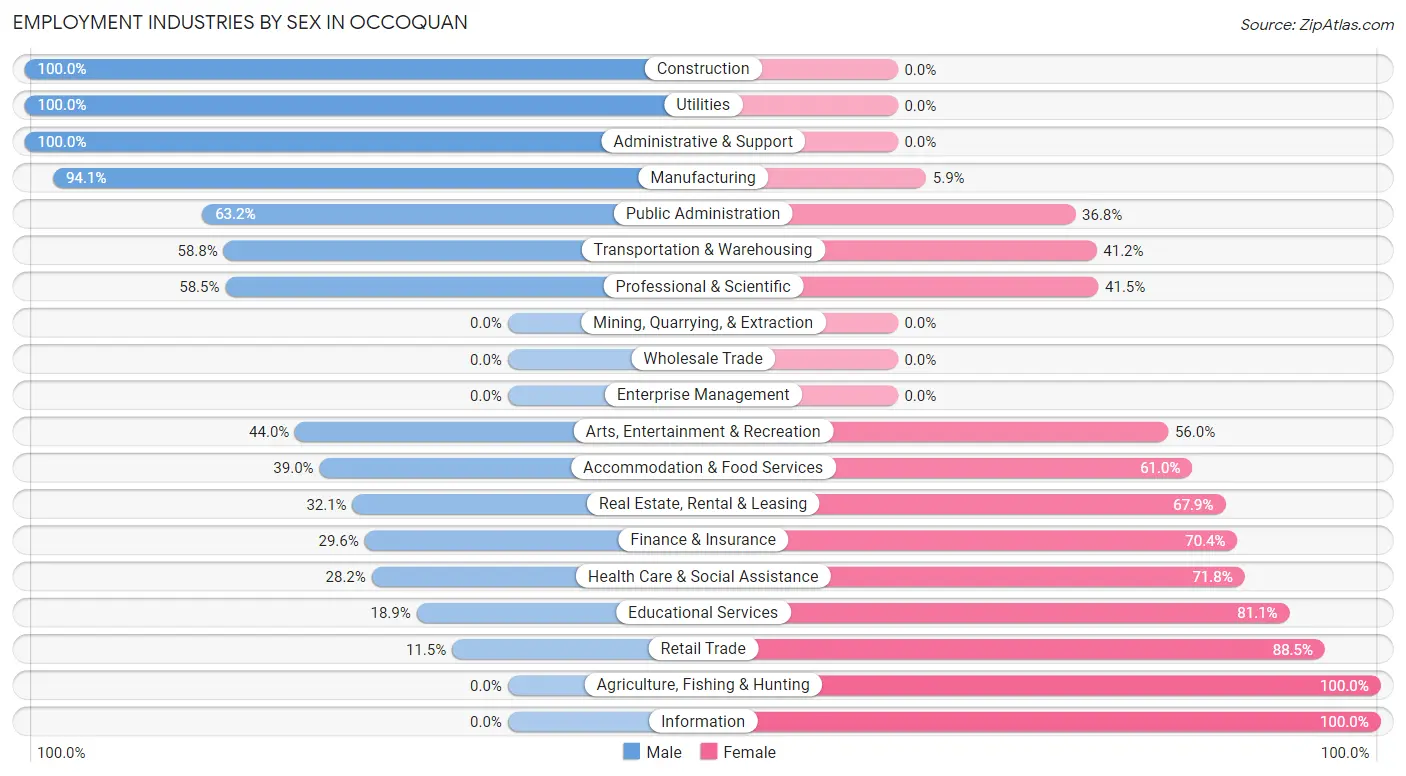
| Industry | Male | Female |
| Agriculture, Fishing & Hunting | 0 (0.0%) | 9 (100.0%) |
| Mining, Quarrying, & Extraction | 0 (0.0%) | 0 (0.0%) |
| Construction | 36 (100.0%) | 0 (0.0%) |
| Manufacturing | 16 (94.1%) | 1 (5.9%) |
| Wholesale Trade | 0 (0.0%) | 0 (0.0%) |
| Retail Trade | 3 (11.5%) | 23 (88.5%) |
| Transportation & Warehousing | 20 (58.8%) | 14 (41.2%) |
| Utilities | 5 (100.0%) | 0 (0.0%) |
| Information | 0 (0.0%) | 7 (100.0%) |
| Finance & Insurance | 8 (29.6%) | 19 (70.4%) |
| Real Estate, Rental & Leasing | 9 (32.1%) | 19 (67.9%) |
| Professional & Scientific | 76 (58.5%) | 54 (41.5%) |
| Enterprise Management | 0 (0.0%) | 0 (0.0%) |
| Administrative & Support | 10 (100.0%) | 0 (0.0%) |
| Educational Services | 10 (18.9%) | 43 (81.1%) |
| Health Care & Social Assistance | 20 (28.2%) | 51 (71.8%) |
| Arts, Entertainment & Recreation | 11 (44.0%) | 14 (56.0%) |
| Accommodation & Food Services | 23 (39.0%) | 36 (61.0%) |
| Public Administration | 110 (63.2%) | 64 (36.8%) |
| Total | 360 (46.8%) | 410 (53.2%) |
Education in Occoquan
School Enrollment in Occoquan
The most common levels of schooling among the 101 students in Occoquan are college / undergraduate (49 | 48.5%), graduate / professional (26 | 25.7%), and middle school (12 | 11.9%).
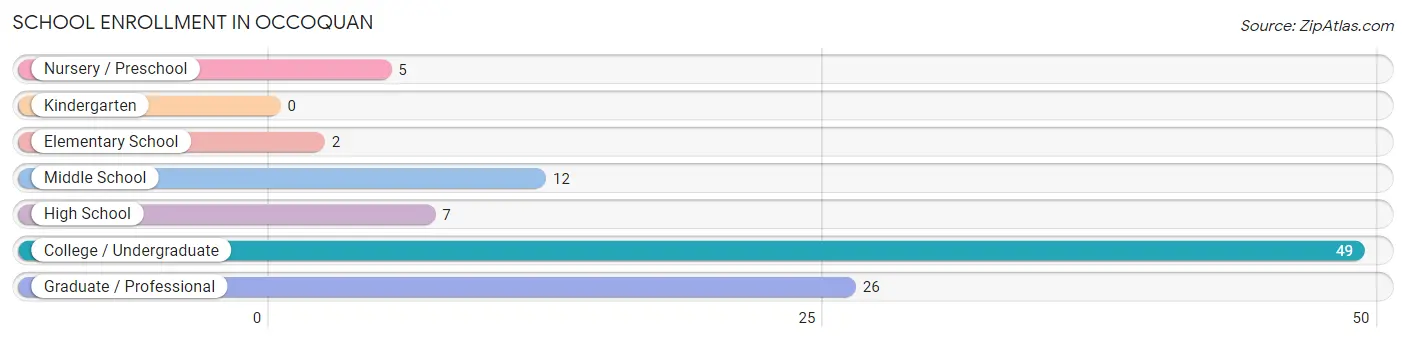
| School Level | # Students | % Students |
| Nursery / Preschool | 5 | 5.0% |
| Kindergarten | 0 | 0.0% |
| Elementary School | 2 | 2.0% |
| Middle School | 12 | 11.9% |
| High School | 7 | 6.9% |
| College / Undergraduate | 49 | 48.5% |
| Graduate / Professional | 26 | 25.7% |
| Total | 101 | 100.0% |
School Enrollment by Age by Funding Source in Occoquan
Out of a total of 101 students who are enrolled in schools in Occoquan, 26 (25.7%) attend a private institution, while the remaining 75 (74.3%) are enrolled in public schools. The age group of 5 to 9 year old has the highest likelihood of being enrolled in private schools, with 5 (71.4% in the age bracket) enrolled. Conversely, the age group of 10 to 14 year olds has the lowest likelihood of being enrolled in a private school, with 12 (100.0% in the age bracket) attending a public institution.
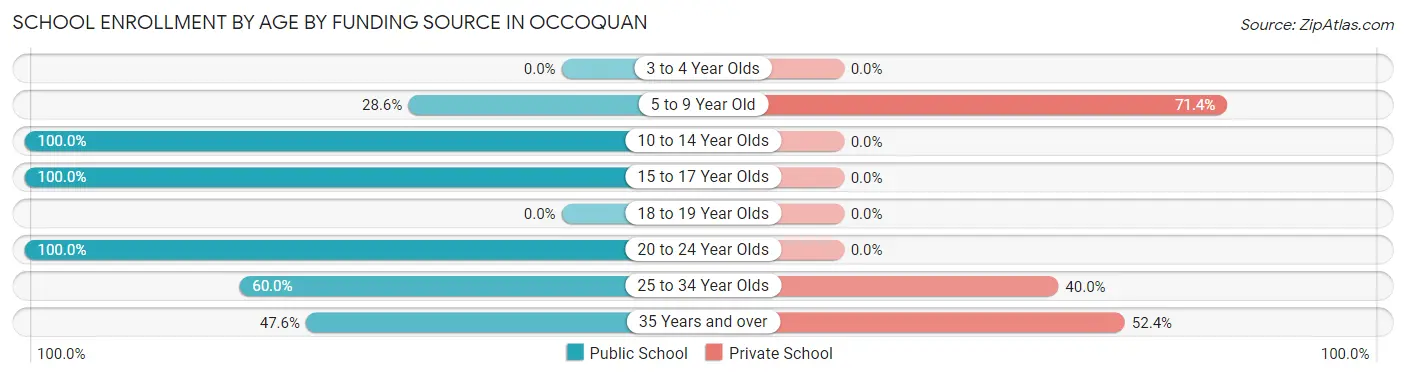
| Age Bracket | Public School | Private School |
| 3 to 4 Year Olds | 0 (0.0%) | 0 (0.0%) |
| 5 to 9 Year Old | 2 (28.6%) | 5 (71.4%) |
| 10 to 14 Year Olds | 12 (100.0%) | 0 (0.0%) |
| 15 to 17 Year Olds | 7 (100.0%) | 0 (0.0%) |
| 18 to 19 Year Olds | 0 (0.0%) | 0 (0.0%) |
| 20 to 24 Year Olds | 29 (100.0%) | 0 (0.0%) |
| 25 to 34 Year Olds | 15 (60.0%) | 10 (40.0%) |
| 35 Years and over | 10 (47.6%) | 11 (52.4%) |
| Total | 75 (74.3%) | 26 (25.7%) |
Educational Attainment by Field of Study in Occoquan
Social sciences (76 | 14.8%), business (73 | 14.2%), engineering (55 | 10.7%), arts & humanities (42 | 8.2%), and computers & mathematics (40 | 7.8%) are the most common fields of study among 513 individuals in Occoquan who have obtained a bachelor's degree or higher.
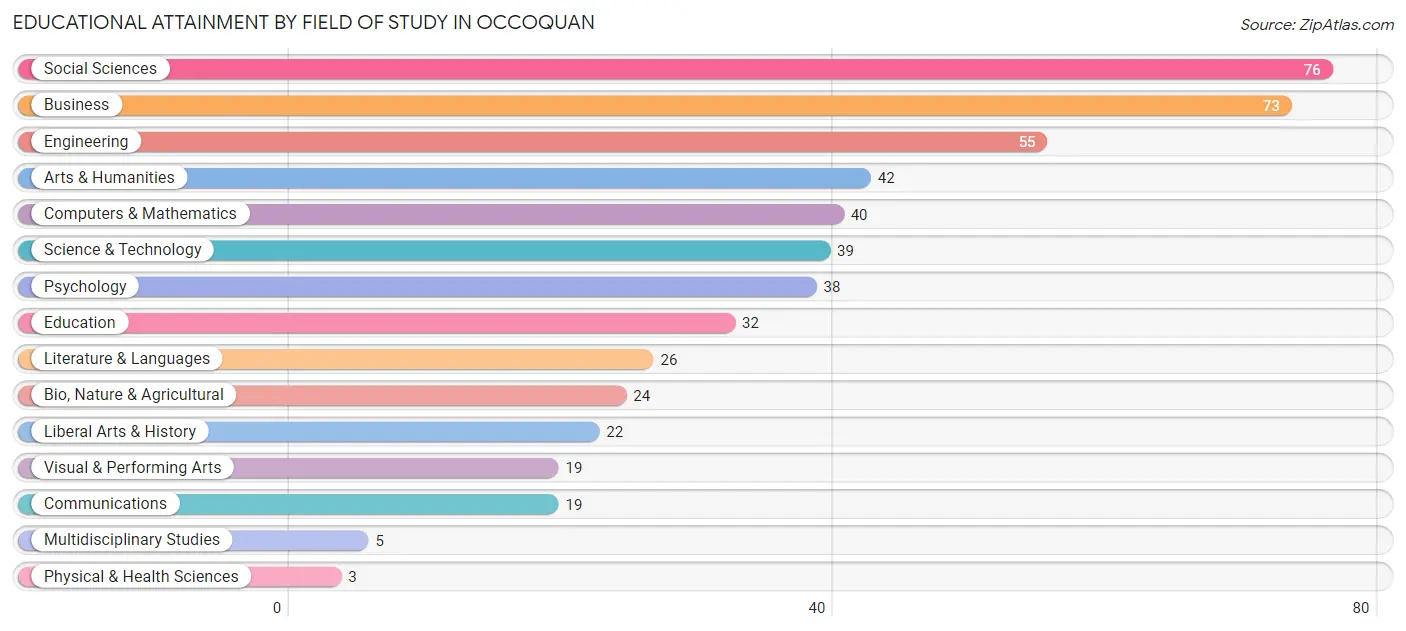
| Field of Study | # Graduates | % Graduates |
| Computers & Mathematics | 40 | 7.8% |
| Bio, Nature & Agricultural | 24 | 4.7% |
| Physical & Health Sciences | 3 | 0.6% |
| Psychology | 38 | 7.4% |
| Social Sciences | 76 | 14.8% |
| Engineering | 55 | 10.7% |
| Multidisciplinary Studies | 5 | 1.0% |
| Science & Technology | 39 | 7.6% |
| Business | 73 | 14.2% |
| Education | 32 | 6.2% |
| Literature & Languages | 26 | 5.1% |
| Liberal Arts & History | 22 | 4.3% |
| Visual & Performing Arts | 19 | 3.7% |
| Communications | 19 | 3.7% |
| Arts & Humanities | 42 | 8.2% |
| Total | 513 | 100.0% |
Transportation & Commute in Occoquan
Vehicle Availability by Sex in Occoquan
The most prevalent vehicle ownership categories in Occoquan are males with 2 vehicles (164, accounting for 44.2%) and females with 2 vehicles (168, making up 43.6%).
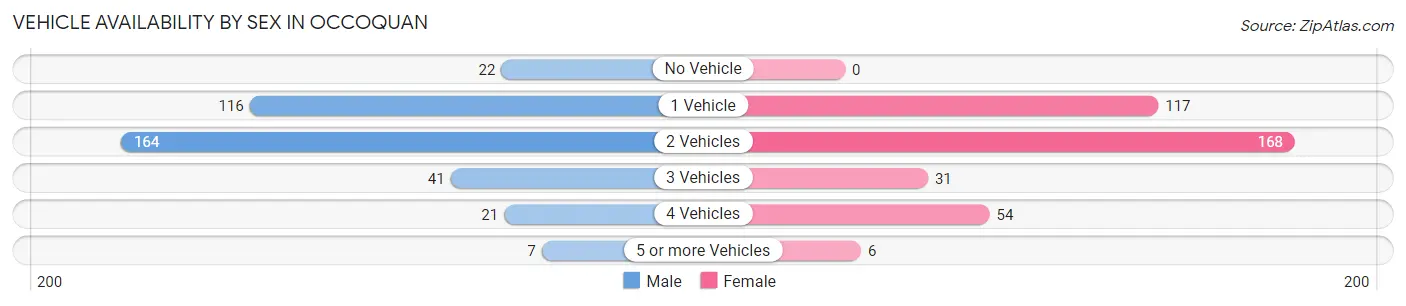
| Vehicles Available | Male | Female |
| No Vehicle | 22 (5.9%) | 0 (0.0%) |
| 1 Vehicle | 116 (31.3%) | 117 (31.1%) |
| 2 Vehicles | 164 (44.2%) | 168 (44.7%) |
| 3 Vehicles | 41 (11.1%) | 31 (8.2%) |
| 4 Vehicles | 21 (5.7%) | 54 (14.4%) |
| 5 or more Vehicles | 7 (1.9%) | 6 (1.6%) |
| Total | 371 (100.0%) | 376 (100.0%) |
Commute Time in Occoquan
The most frequently occuring commute durations in Occoquan are 45 to 59 minutes (145 commuters, 24.4%), 30 to 34 minutes (125 commuters, 21.0%), and 15 to 19 minutes (74 commuters, 12.4%).
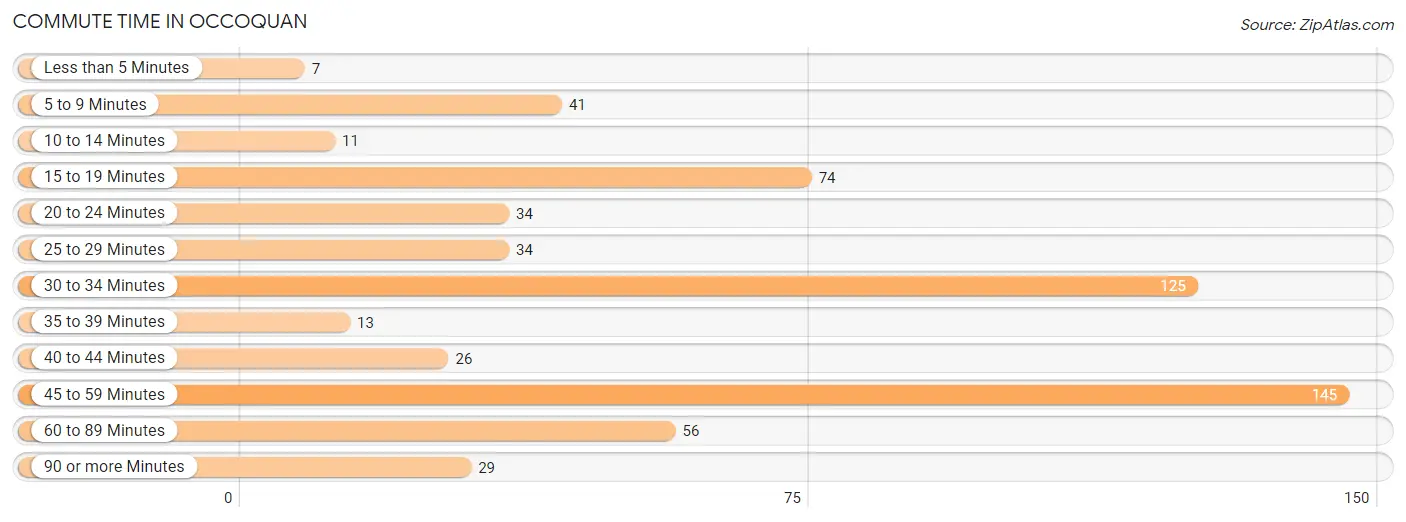
| Commute Time | # Commuters | % Commuters |
| Less than 5 Minutes | 7 | 1.2% |
| 5 to 9 Minutes | 41 | 6.9% |
| 10 to 14 Minutes | 11 | 1.8% |
| 15 to 19 Minutes | 74 | 12.4% |
| 20 to 24 Minutes | 34 | 5.7% |
| 25 to 29 Minutes | 34 | 5.7% |
| 30 to 34 Minutes | 125 | 21.0% |
| 35 to 39 Minutes | 13 | 2.2% |
| 40 to 44 Minutes | 26 | 4.4% |
| 45 to 59 Minutes | 145 | 24.4% |
| 60 to 89 Minutes | 56 | 9.4% |
| 90 or more Minutes | 29 | 4.9% |
Commute Time by Sex in Occoquan
The most common commute times in Occoquan are 45 to 59 minutes (99 commuters, 31.1%) for males and 30 to 34 minutes (60 commuters, 21.7%) for females.
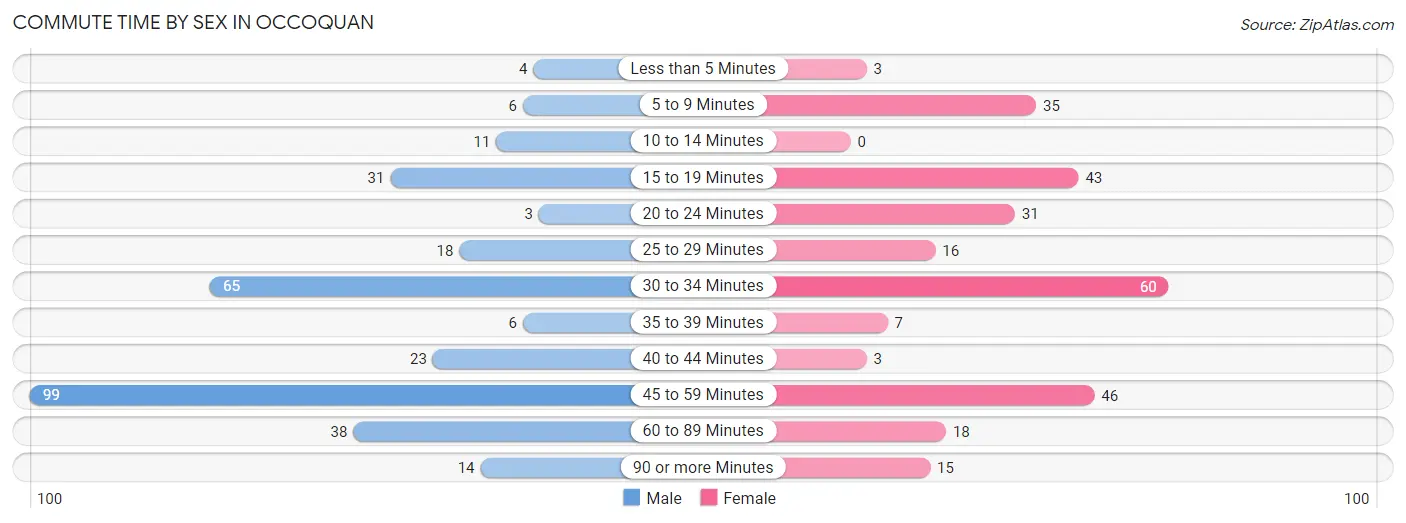
| Commute Time | Male | Female |
| Less than 5 Minutes | 4 (1.3%) | 3 (1.1%) |
| 5 to 9 Minutes | 6 (1.9%) | 35 (12.6%) |
| 10 to 14 Minutes | 11 (3.5%) | 0 (0.0%) |
| 15 to 19 Minutes | 31 (9.8%) | 43 (15.5%) |
| 20 to 24 Minutes | 3 (0.9%) | 31 (11.2%) |
| 25 to 29 Minutes | 18 (5.7%) | 16 (5.8%) |
| 30 to 34 Minutes | 65 (20.4%) | 60 (21.7%) |
| 35 to 39 Minutes | 6 (1.9%) | 7 (2.5%) |
| 40 to 44 Minutes | 23 (7.2%) | 3 (1.1%) |
| 45 to 59 Minutes | 99 (31.1%) | 46 (16.6%) |
| 60 to 89 Minutes | 38 (11.9%) | 18 (6.5%) |
| 90 or more Minutes | 14 (4.4%) | 15 (5.4%) |
Time of Departure to Work by Sex in Occoquan
The most frequent times of departure to work in Occoquan are 7:00 AM to 7:29 AM (72, 22.6%) for males and 10:00 AM to 10:59 AM (43, 15.5%) for females.
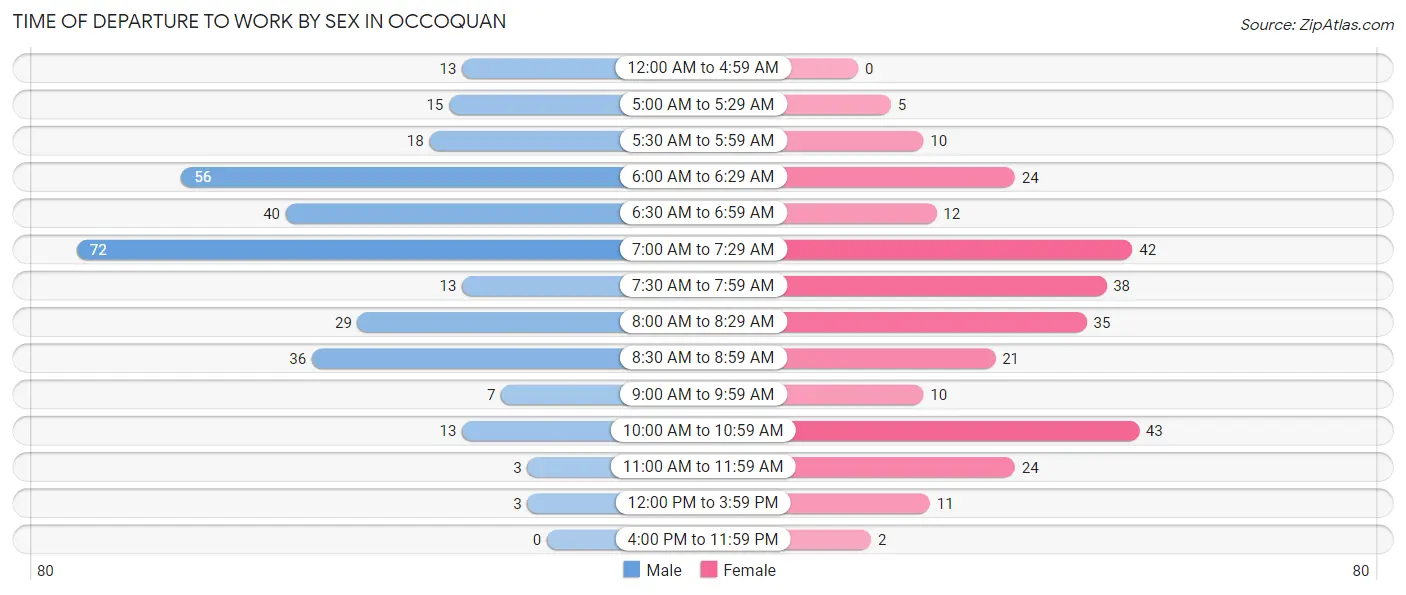
| Time of Departure | Male | Female |
| 12:00 AM to 4:59 AM | 13 (4.1%) | 0 (0.0%) |
| 5:00 AM to 5:29 AM | 15 (4.7%) | 5 (1.8%) |
| 5:30 AM to 5:59 AM | 18 (5.7%) | 10 (3.6%) |
| 6:00 AM to 6:29 AM | 56 (17.6%) | 24 (8.7%) |
| 6:30 AM to 6:59 AM | 40 (12.6%) | 12 (4.3%) |
| 7:00 AM to 7:29 AM | 72 (22.6%) | 42 (15.2%) |
| 7:30 AM to 7:59 AM | 13 (4.1%) | 38 (13.7%) |
| 8:00 AM to 8:29 AM | 29 (9.1%) | 35 (12.6%) |
| 8:30 AM to 8:59 AM | 36 (11.3%) | 21 (7.6%) |
| 9:00 AM to 9:59 AM | 7 (2.2%) | 10 (3.6%) |
| 10:00 AM to 10:59 AM | 13 (4.1%) | 43 (15.5%) |
| 11:00 AM to 11:59 AM | 3 (0.9%) | 24 (8.7%) |
| 12:00 PM to 3:59 PM | 3 (0.9%) | 11 (4.0%) |
| 4:00 PM to 11:59 PM | 0 (0.0%) | 2 (0.7%) |
| Total | 318 (100.0%) | 277 (100.0%) |
Housing Occupancy in Occoquan
Occupancy by Ownership in Occoquan
Of the total 569 dwellings in Occoquan, owner-occupied units account for 310 (54.5%), while renter-occupied units make up 259 (45.5%).
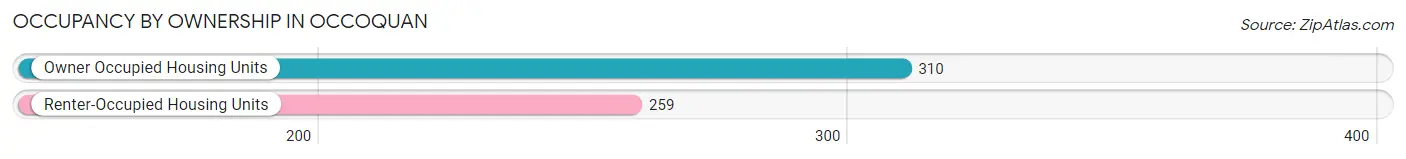
| Occupancy | # Housing Units | % Housing Units |
| Owner Occupied Housing Units | 310 | 54.5% |
| Renter-Occupied Housing Units | 259 | 45.5% |
| Total Occupied Housing Units | 569 | 100.0% |
Occupancy by Household Size in Occoquan
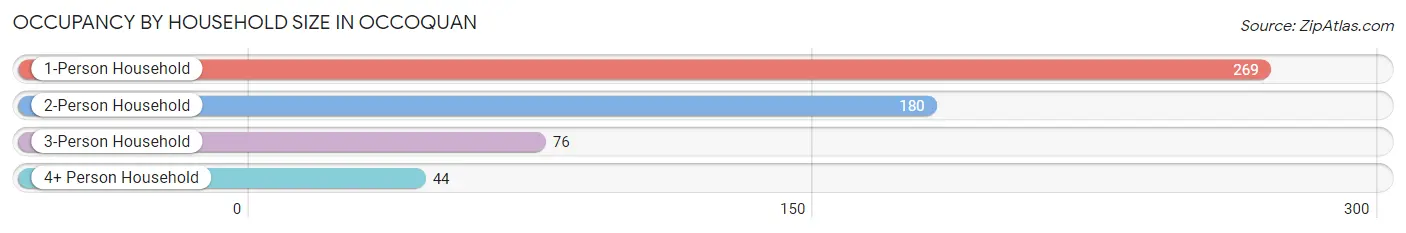
| Household Size | # Housing Units | % Housing Units |
| 1-Person Household | 269 | 47.3% |
| 2-Person Household | 180 | 31.6% |
| 3-Person Household | 76 | 13.4% |
| 4+ Person Household | 44 | 7.7% |
| Total Housing Units | 569 | 100.0% |
Occupancy by Ownership by Household Size in Occoquan
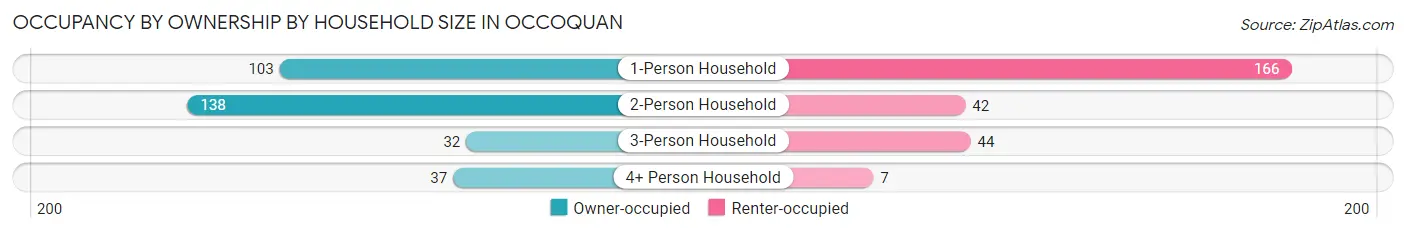
| Household Size | Owner-occupied | Renter-occupied |
| 1-Person Household | 103 (38.3%) | 166 (61.7%) |
| 2-Person Household | 138 (76.7%) | 42 (23.3%) |
| 3-Person Household | 32 (42.1%) | 44 (57.9%) |
| 4+ Person Household | 37 (84.1%) | 7 (15.9%) |
| Total Housing Units | 310 (54.5%) | 259 (45.5%) |
Occupancy by Educational Attainment in Occoquan
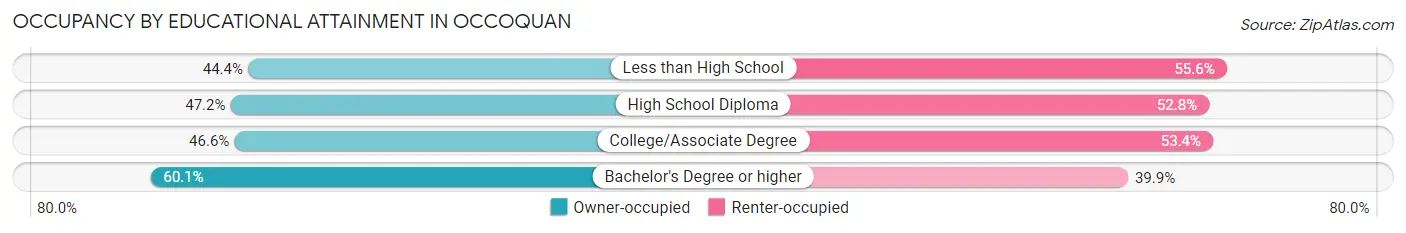
| Household Size | Owner-occupied | Renter-occupied |
| Less than High School | 4 (44.4%) | 5 (55.6%) |
| High School Diploma | 17 (47.2%) | 19 (52.8%) |
| College/Associate Degree | 89 (46.6%) | 102 (53.4%) |
| Bachelor's Degree or higher | 200 (60.1%) | 133 (39.9%) |
Occupancy by Age of Householder in Occoquan
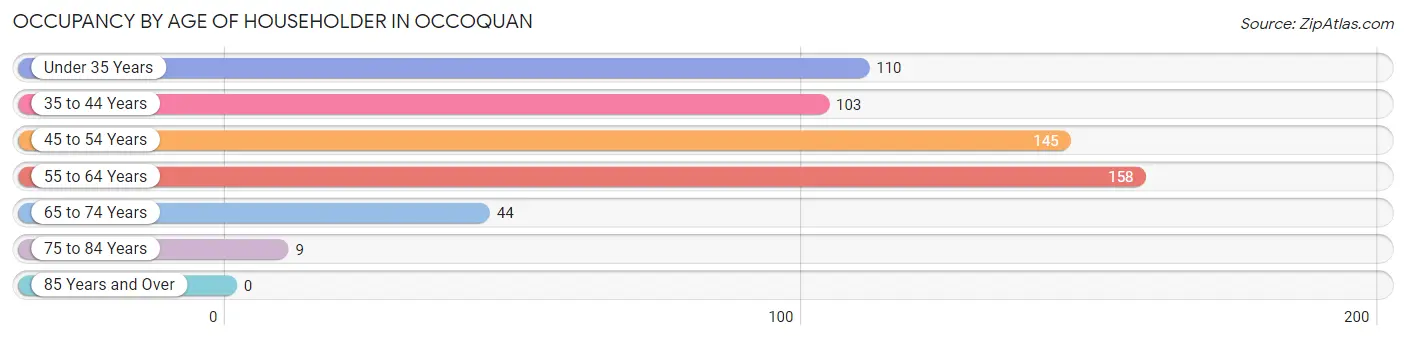
| Age Bracket | # Households | % Households |
| Under 35 Years | 110 | 19.3% |
| 35 to 44 Years | 103 | 18.1% |
| 45 to 54 Years | 145 | 25.5% |
| 55 to 64 Years | 158 | 27.8% |
| 65 to 74 Years | 44 | 7.7% |
| 75 to 84 Years | 9 | 1.6% |
| 85 Years and Over | 0 | 0.0% |
| Total | 569 | 100.0% |
Housing Finances in Occoquan
Median Income by Occupancy in Occoquan
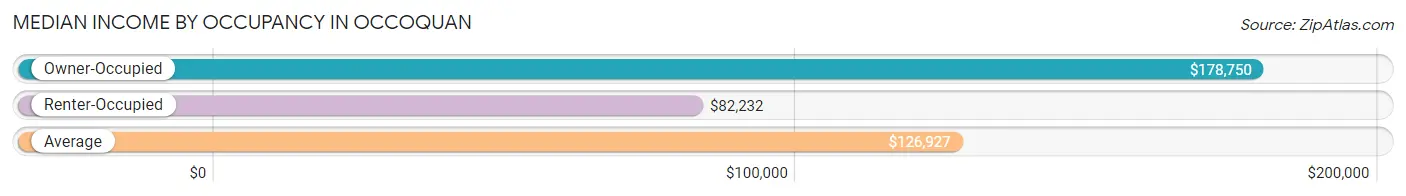
| Occupancy Type | # Households | Median Income |
| Owner-Occupied | 310 (54.5%) | $178,750 |
| Renter-Occupied | 259 (45.5%) | $82,232 |
| Average | 569 (100.0%) | $126,927 |
Occupancy by Householder Income Bracket in Occoquan
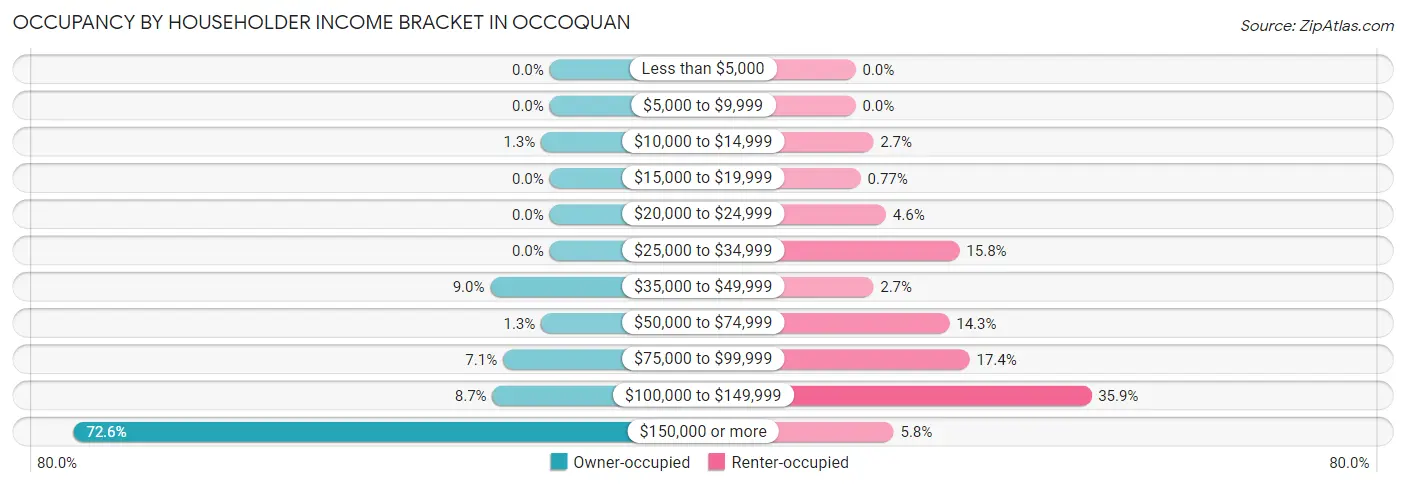
| Income Bracket | Owner-occupied | Renter-occupied |
| Less than $5,000 | 0 (0.0%) | 0 (0.0%) |
| $5,000 to $9,999 | 0 (0.0%) | 0 (0.0%) |
| $10,000 to $14,999 | 4 (1.3%) | 7 (2.7%) |
| $15,000 to $19,999 | 0 (0.0%) | 2 (0.8%) |
| $20,000 to $24,999 | 0 (0.0%) | 12 (4.6%) |
| $25,000 to $34,999 | 0 (0.0%) | 41 (15.8%) |
| $35,000 to $49,999 | 28 (9.0%) | 7 (2.7%) |
| $50,000 to $74,999 | 4 (1.3%) | 37 (14.3%) |
| $75,000 to $99,999 | 22 (7.1%) | 45 (17.4%) |
| $100,000 to $149,999 | 27 (8.7%) | 93 (35.9%) |
| $150,000 or more | 225 (72.6%) | 15 (5.8%) |
| Total | 310 (100.0%) | 259 (100.0%) |
Monthly Housing Cost Tiers in Occoquan
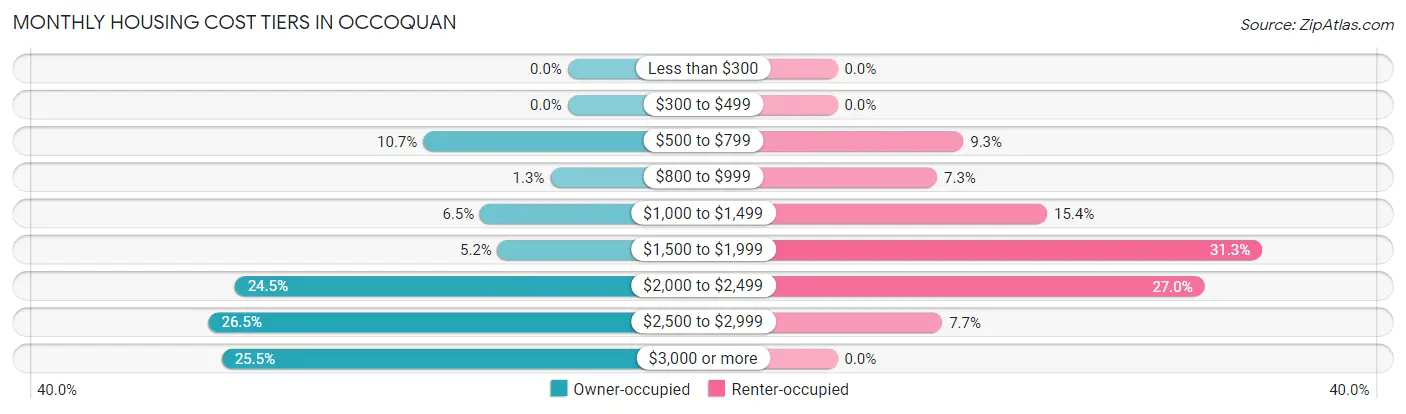
| Monthly Cost | Owner-occupied | Renter-occupied |
| Less than $300 | 0 (0.0%) | 0 (0.0%) |
| $300 to $499 | 0 (0.0%) | 0 (0.0%) |
| $500 to $799 | 33 (10.6%) | 24 (9.3%) |
| $800 to $999 | 4 (1.3%) | 19 (7.3%) |
| $1,000 to $1,499 | 20 (6.5%) | 40 (15.4%) |
| $1,500 to $1,999 | 16 (5.2%) | 81 (31.3%) |
| $2,000 to $2,499 | 76 (24.5%) | 70 (27.0%) |
| $2,500 to $2,999 | 82 (26.5%) | 20 (7.7%) |
| $3,000 or more | 79 (25.5%) | 0 (0.0%) |
| Total | 310 (100.0%) | 259 (100.0%) |
Physical Housing Characteristics in Occoquan
Housing Structures in Occoquan
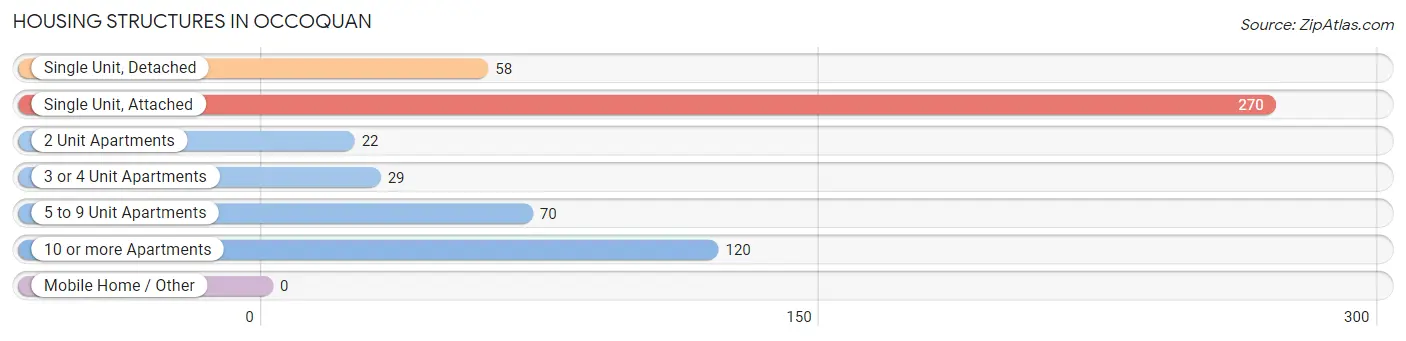
| Structure Type | # Housing Units | % Housing Units |
| Single Unit, Detached | 58 | 10.2% |
| Single Unit, Attached | 270 | 47.4% |
| 2 Unit Apartments | 22 | 3.9% |
| 3 or 4 Unit Apartments | 29 | 5.1% |
| 5 to 9 Unit Apartments | 70 | 12.3% |
| 10 or more Apartments | 120 | 21.1% |
| Mobile Home / Other | 0 | 0.0% |
| Total | 569 | 100.0% |
Housing Structures by Occupancy in Occoquan
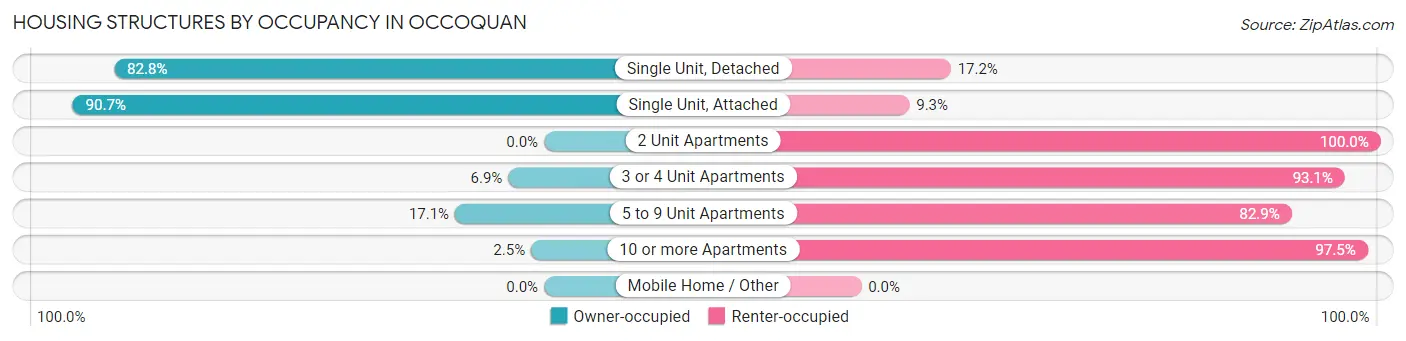
| Structure Type | Owner-occupied | Renter-occupied |
| Single Unit, Detached | 48 (82.8%) | 10 (17.2%) |
| Single Unit, Attached | 245 (90.7%) | 25 (9.3%) |
| 2 Unit Apartments | 0 (0.0%) | 22 (100.0%) |
| 3 or 4 Unit Apartments | 2 (6.9%) | 27 (93.1%) |
| 5 to 9 Unit Apartments | 12 (17.1%) | 58 (82.9%) |
| 10 or more Apartments | 3 (2.5%) | 117 (97.5%) |
| Mobile Home / Other | 0 (0.0%) | 0 (0.0%) |
| Total | 310 (54.5%) | 259 (45.5%) |
Housing Structures by Number of Rooms in Occoquan
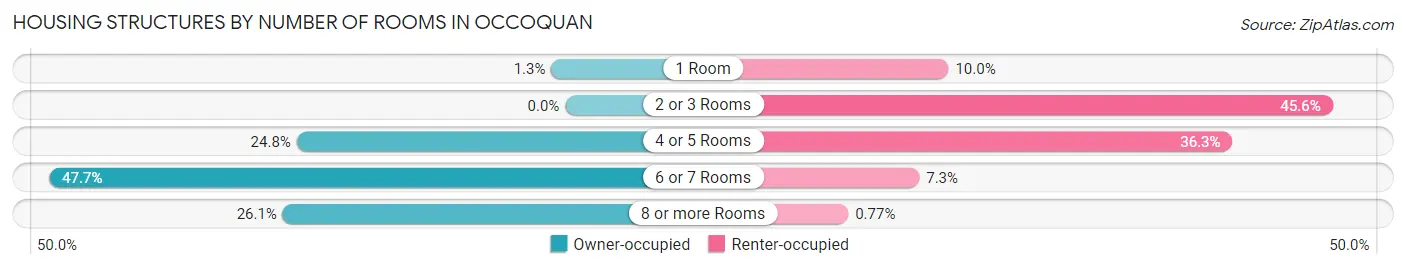
| Number of Rooms | Owner-occupied | Renter-occupied |
| 1 Room | 4 (1.3%) | 26 (10.0%) |
| 2 or 3 Rooms | 0 (0.0%) | 118 (45.6%) |
| 4 or 5 Rooms | 77 (24.8%) | 94 (36.3%) |
| 6 or 7 Rooms | 148 (47.7%) | 19 (7.3%) |
| 8 or more Rooms | 81 (26.1%) | 2 (0.8%) |
| Total | 310 (100.0%) | 259 (100.0%) |
Housing Structure by Heating Type in Occoquan
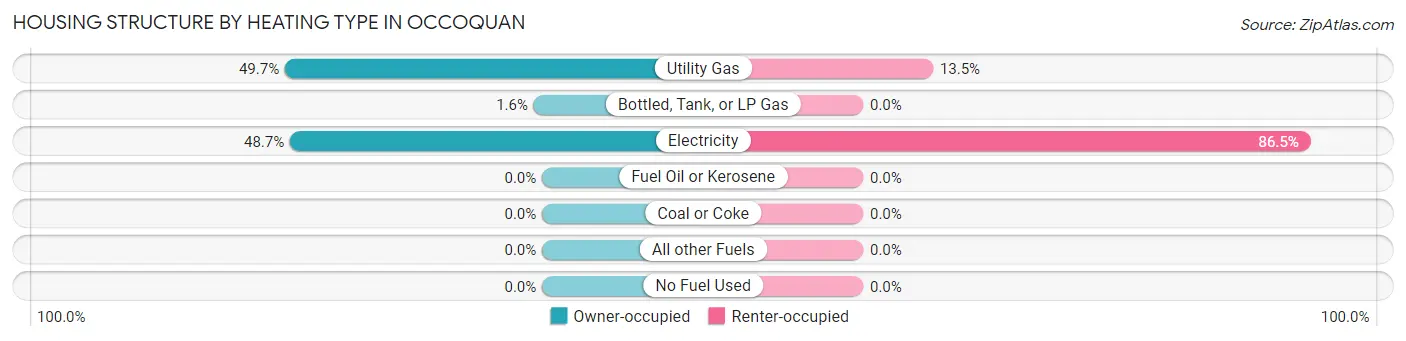
| Heating Type | Owner-occupied | Renter-occupied |
| Utility Gas | 154 (49.7%) | 35 (13.5%) |
| Bottled, Tank, or LP Gas | 5 (1.6%) | 0 (0.0%) |
| Electricity | 151 (48.7%) | 224 (86.5%) |
| Fuel Oil or Kerosene | 0 (0.0%) | 0 (0.0%) |
| Coal or Coke | 0 (0.0%) | 0 (0.0%) |
| All other Fuels | 0 (0.0%) | 0 (0.0%) |
| No Fuel Used | 0 (0.0%) | 0 (0.0%) |
| Total | 310 (100.0%) | 259 (100.0%) |
Household Vehicle Usage in Occoquan
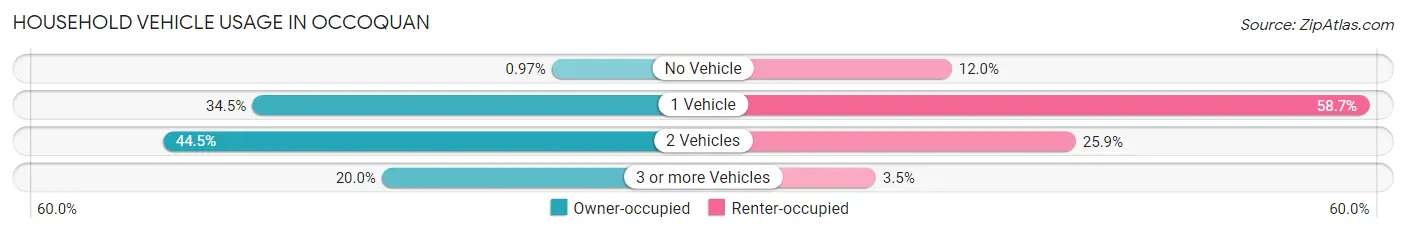
| Vehicles per Household | Owner-occupied | Renter-occupied |
| No Vehicle | 3 (1.0%) | 31 (12.0%) |
| 1 Vehicle | 107 (34.5%) | 152 (58.7%) |
| 2 Vehicles | 138 (44.5%) | 67 (25.9%) |
| 3 or more Vehicles | 62 (20.0%) | 9 (3.5%) |
| Total | 310 (100.0%) | 259 (100.0%) |
Real Estate & Mortgages in Occoquan
Real Estate and Mortgage Overview in Occoquan
| Characteristic | Without Mortgage | With Mortgage |
| Housing Units | 26 | 284 |
| Median Property Value | $409,100 | $471,600 |
| Median Household Income | $242,813 | $206 |
| Monthly Housing Costs | $950 | $79 |
| Real Estate Taxes | $4,231 | $11 |
Property Value by Mortgage Status in Occoquan
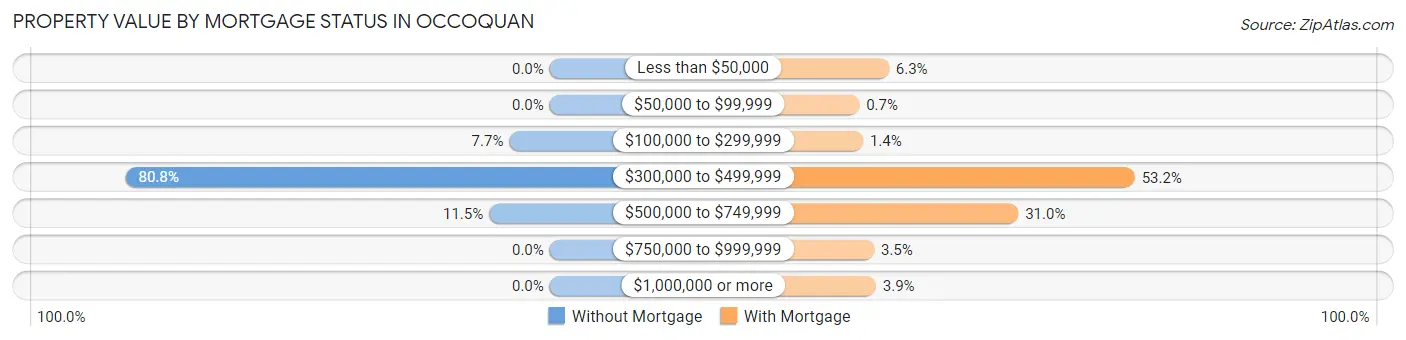
| Property Value | Without Mortgage | With Mortgage |
| Less than $50,000 | 0 (0.0%) | 18 (6.3%) |
| $50,000 to $99,999 | 0 (0.0%) | 2 (0.7%) |
| $100,000 to $299,999 | 2 (7.7%) | 4 (1.4%) |
| $300,000 to $499,999 | 21 (80.8%) | 151 (53.2%) |
| $500,000 to $749,999 | 3 (11.5%) | 88 (31.0%) |
| $750,000 to $999,999 | 0 (0.0%) | 10 (3.5%) |
| $1,000,000 or more | 0 (0.0%) | 11 (3.9%) |
| Total | 26 (100.0%) | 284 (100.0%) |
Household Income by Mortgage Status in Occoquan
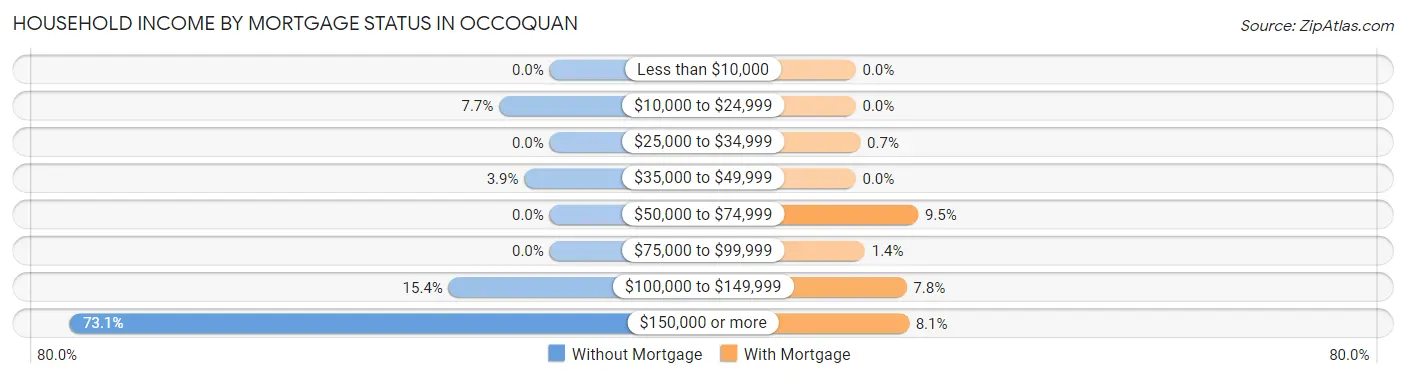
| Household Income | Without Mortgage | With Mortgage |
| Less than $10,000 | 0 (0.0%) | 0 (0.0%) |
| $10,000 to $24,999 | 2 (7.7%) | 0 (0.0%) |
| $25,000 to $34,999 | 0 (0.0%) | 2 (0.7%) |
| $35,000 to $49,999 | 1 (3.8%) | 0 (0.0%) |
| $50,000 to $74,999 | 0 (0.0%) | 27 (9.5%) |
| $75,000 to $99,999 | 0 (0.0%) | 4 (1.4%) |
| $100,000 to $149,999 | 4 (15.4%) | 22 (7.7%) |
| $150,000 or more | 19 (73.1%) | 23 (8.1%) |
| Total | 26 (100.0%) | 284 (100.0%) |
Property Value to Household Income Ratio in Occoquan
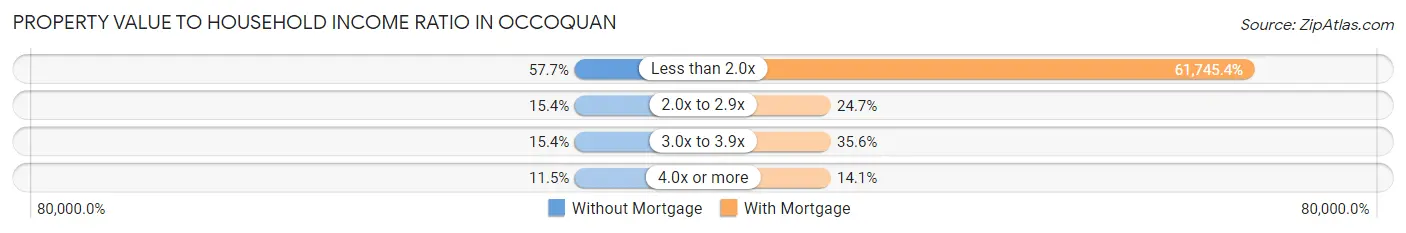
| Value-to-Income Ratio | Without Mortgage | With Mortgage |
| Less than 2.0x | 15 (57.7%) | 175,357 (61,745.4%) |
| 2.0x to 2.9x | 4 (15.4%) | 70 (24.6%) |
| 3.0x to 3.9x | 4 (15.4%) | 101 (35.6%) |
| 4.0x or more | 3 (11.5%) | 40 (14.1%) |
| Total | 26 (100.0%) | 284 (100.0%) |
Real Estate Taxes by Mortgage Status in Occoquan
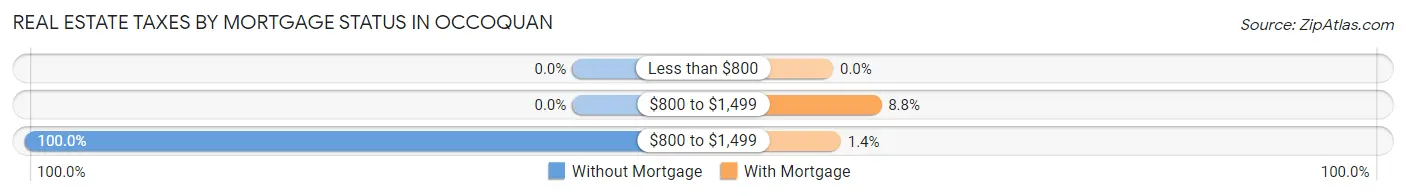
| Property Taxes | Without Mortgage | With Mortgage |
| Less than $800 | 0 (0.0%) | 0 (0.0%) |
| $800 to $1,499 | 0 (0.0%) | 25 (8.8%) |
| $800 to $1,499 | 26 (100.0%) | 4 (1.4%) |
| Total | 26 (100.0%) | 284 (100.0%) |
Health & Disability in Occoquan
Health Insurance Coverage by Age in Occoquan
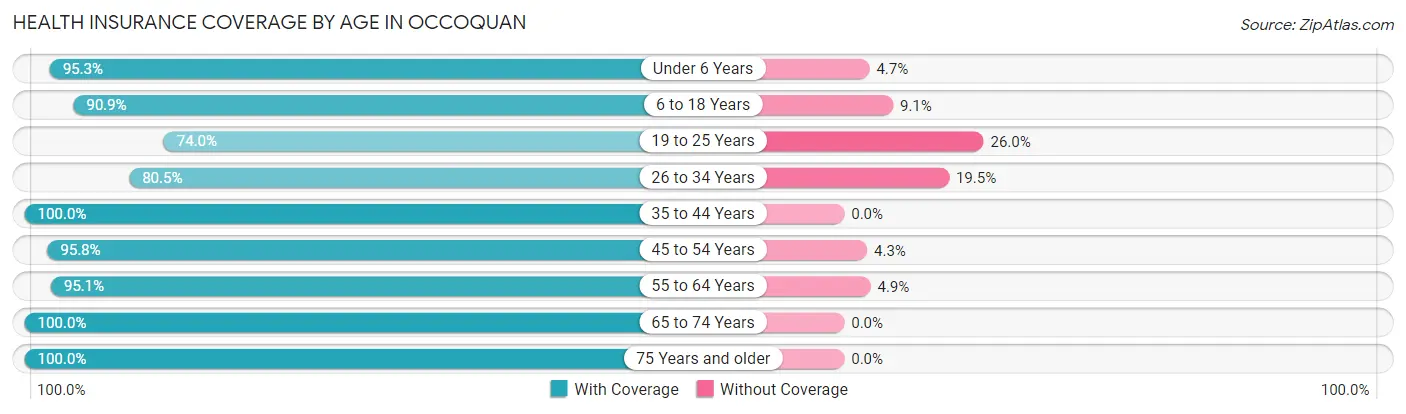
| Age Bracket | With Coverage | Without Coverage |
| Under 6 Years | 61 (95.3%) | 3 (4.7%) |
| 6 to 18 Years | 30 (90.9%) | 3 (9.1%) |
| 19 to 25 Years | 57 (74.0%) | 20 (26.0%) |
| 26 to 34 Years | 202 (80.5%) | 49 (19.5%) |
| 35 to 44 Years | 105 (100.0%) | 0 (0.0%) |
| 45 to 54 Years | 203 (95.8%) | 9 (4.3%) |
| 55 to 64 Years | 214 (95.1%) | 11 (4.9%) |
| 65 to 74 Years | 62 (100.0%) | 0 (0.0%) |
| 75 Years and older | 22 (100.0%) | 0 (0.0%) |
| Total | 956 (91.0%) | 95 (9.0%) |
Health Insurance Coverage by Citizenship Status in Occoquan
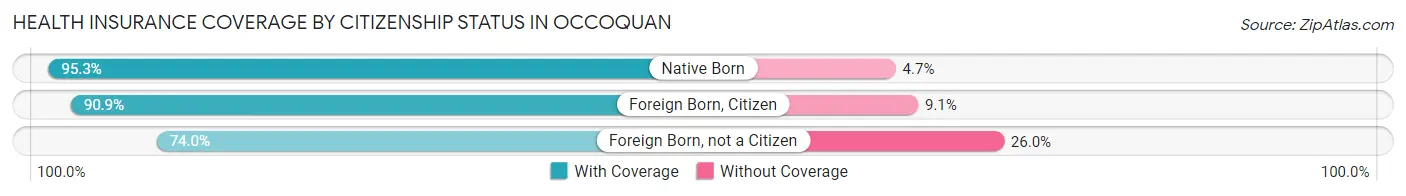
| Citizenship Status | With Coverage | Without Coverage |
| Native Born | 61 (95.3%) | 3 (4.7%) |
| Foreign Born, Citizen | 30 (90.9%) | 3 (9.1%) |
| Foreign Born, not a Citizen | 57 (74.0%) | 20 (26.0%) |
Health Insurance Coverage by Household Income in Occoquan
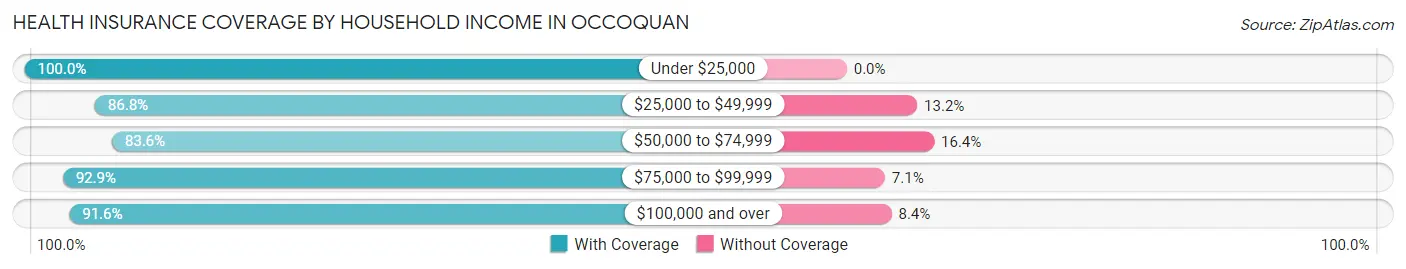
| Household Income | With Coverage | Without Coverage |
| Under $25,000 | 27 (100.0%) | 0 (0.0%) |
| $25,000 to $49,999 | 112 (86.8%) | 17 (13.2%) |
| $50,000 to $74,999 | 46 (83.6%) | 9 (16.4%) |
| $75,000 to $99,999 | 104 (92.9%) | 8 (7.1%) |
| $100,000 and over | 667 (91.6%) | 61 (8.4%) |
Public vs Private Health Insurance Coverage by Age in Occoquan
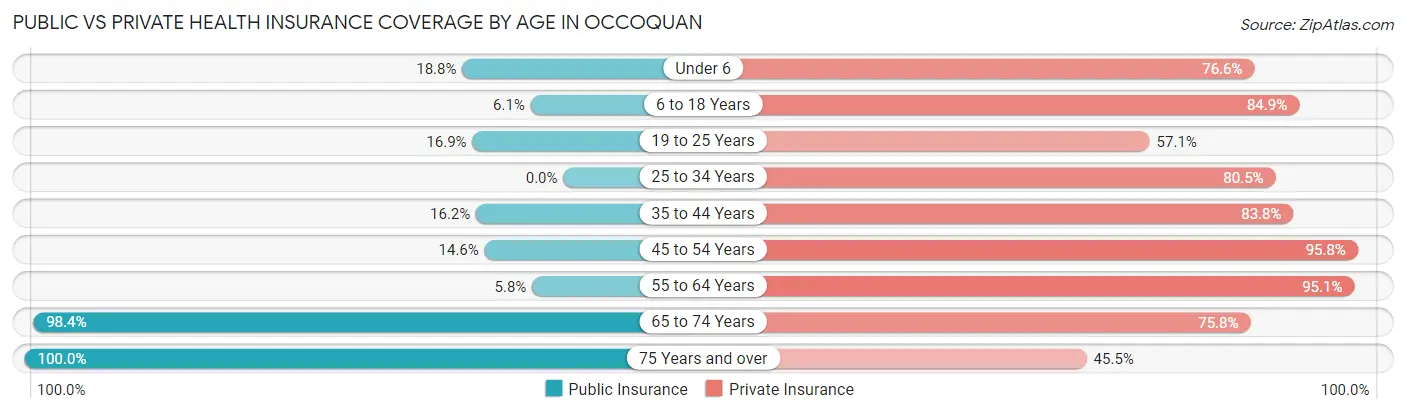
| Age Bracket | Public Insurance | Private Insurance |
| Under 6 | 12 (18.8%) | 49 (76.6%) |
| 6 to 18 Years | 2 (6.1%) | 28 (84.9%) |
| 19 to 25 Years | 13 (16.9%) | 44 (57.1%) |
| 25 to 34 Years | 0 (0.0%) | 202 (80.5%) |
| 35 to 44 Years | 17 (16.2%) | 88 (83.8%) |
| 45 to 54 Years | 31 (14.6%) | 203 (95.8%) |
| 55 to 64 Years | 13 (5.8%) | 214 (95.1%) |
| 65 to 74 Years | 61 (98.4%) | 47 (75.8%) |
| 75 Years and over | 22 (100.0%) | 10 (45.5%) |
| Total | 171 (16.3%) | 885 (84.2%) |
Disability Status by Sex by Age in Occoquan
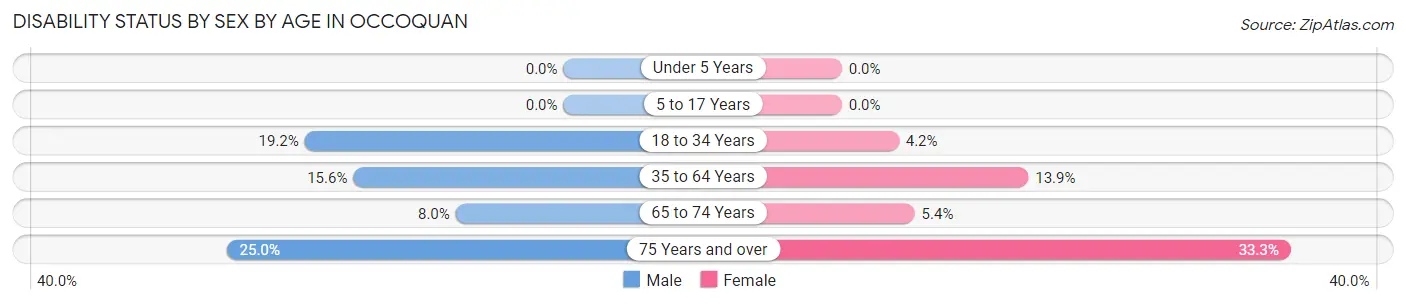
| Age Bracket | Male | Female |
| Under 5 Years | 0 (0.0%) | 0 (0.0%) |
| 5 to 17 Years | 0 (0.0%) | 0 (0.0%) |
| 18 to 34 Years | 29 (19.2%) | 8 (4.2%) |
| 35 to 64 Years | 44 (15.6%) | 36 (13.9%) |
| 65 to 74 Years | 2 (8.0%) | 2 (5.4%) |
| 75 Years and over | 1 (25.0%) | 6 (33.3%) |
Disability Class by Sex by Age in Occoquan
Disability Class: Hearing Difficulty
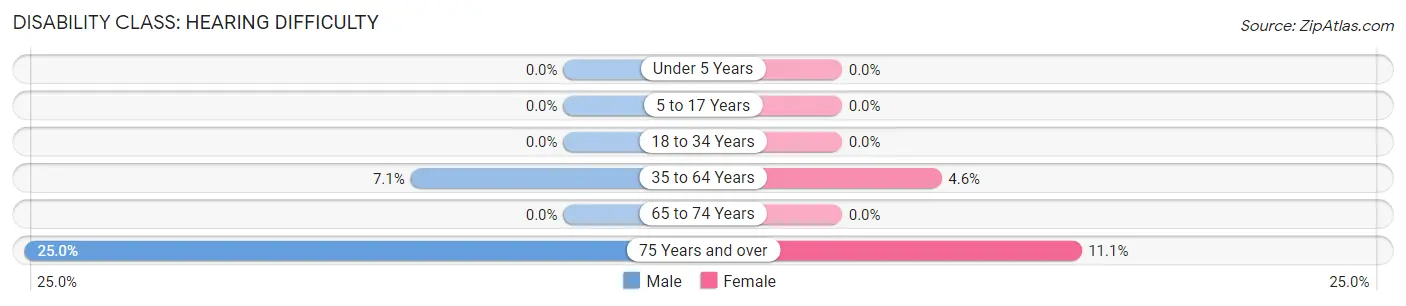
| Age Bracket | Male | Female |
| Under 5 Years | 0 (0.0%) | 0 (0.0%) |
| 5 to 17 Years | 0 (0.0%) | 0 (0.0%) |
| 18 to 34 Years | 0 (0.0%) | 0 (0.0%) |
| 35 to 64 Years | 20 (7.1%) | 12 (4.6%) |
| 65 to 74 Years | 0 (0.0%) | 0 (0.0%) |
| 75 Years and over | 1 (25.0%) | 2 (11.1%) |
Disability Class: Vision Difficulty
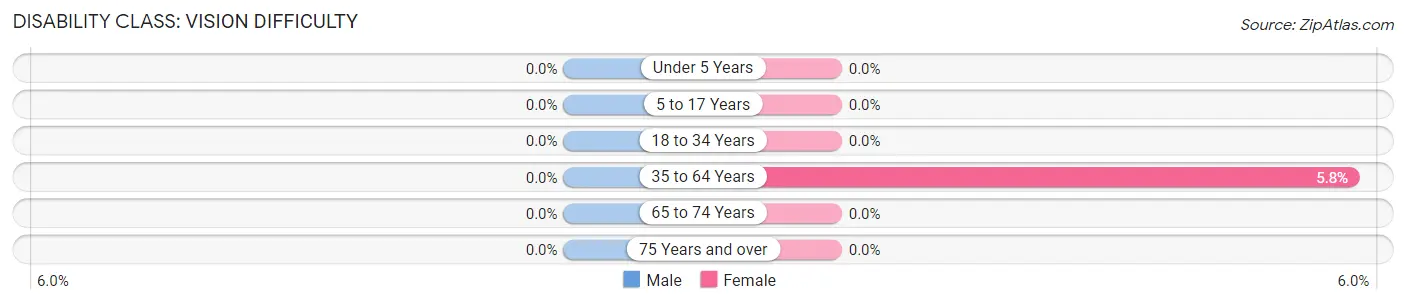
| Age Bracket | Male | Female |
| Under 5 Years | 0 (0.0%) | 0 (0.0%) |
| 5 to 17 Years | 0 (0.0%) | 0 (0.0%) |
| 18 to 34 Years | 0 (0.0%) | 0 (0.0%) |
| 35 to 64 Years | 0 (0.0%) | 15 (5.8%) |
| 65 to 74 Years | 0 (0.0%) | 0 (0.0%) |
| 75 Years and over | 0 (0.0%) | 0 (0.0%) |
Disability Class: Cognitive Difficulty
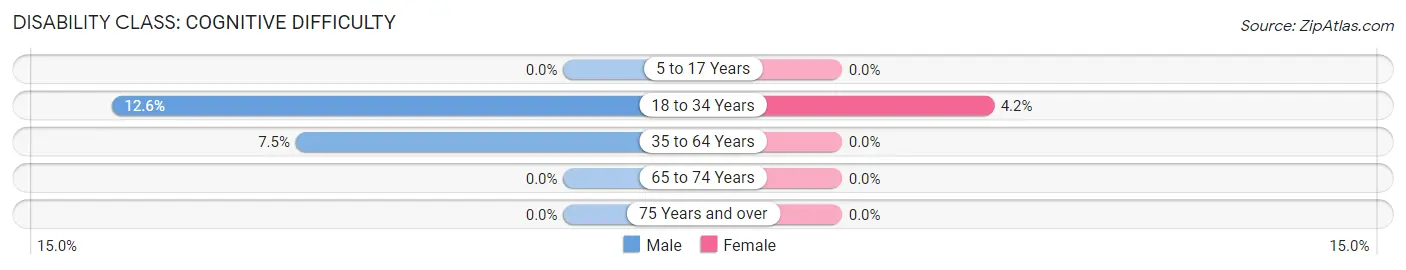
| Age Bracket | Male | Female |
| 5 to 17 Years | 0 (0.0%) | 0 (0.0%) |
| 18 to 34 Years | 19 (12.6%) | 8 (4.2%) |
| 35 to 64 Years | 21 (7.4%) | 0 (0.0%) |
| 65 to 74 Years | 0 (0.0%) | 0 (0.0%) |
| 75 Years and over | 0 (0.0%) | 0 (0.0%) |
Disability Class: Ambulatory Difficulty
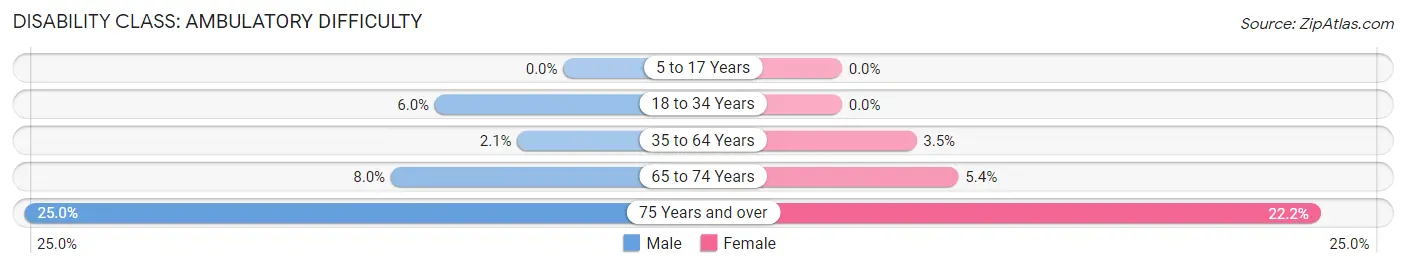
| Age Bracket | Male | Female |
| 5 to 17 Years | 0 (0.0%) | 0 (0.0%) |
| 18 to 34 Years | 9 (6.0%) | 0 (0.0%) |
| 35 to 64 Years | 6 (2.1%) | 9 (3.5%) |
| 65 to 74 Years | 2 (8.0%) | 2 (5.4%) |
| 75 Years and over | 1 (25.0%) | 4 (22.2%) |
Disability Class: Self-Care Difficulty
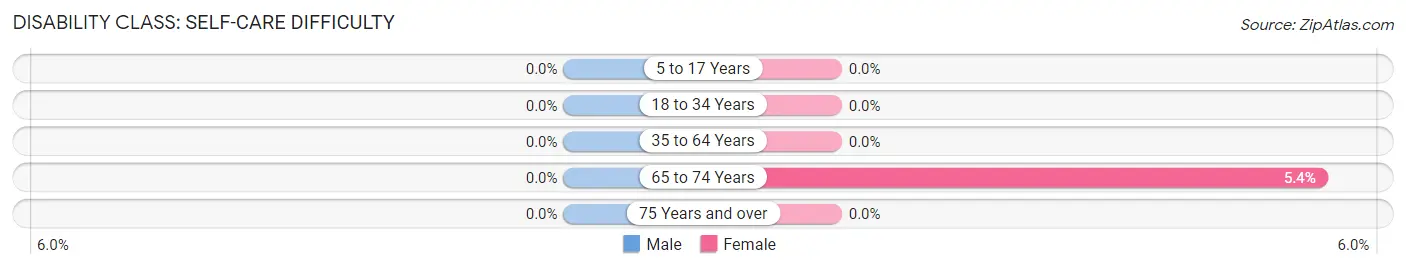
| Age Bracket | Male | Female |
| 5 to 17 Years | 0 (0.0%) | 0 (0.0%) |
| 18 to 34 Years | 0 (0.0%) | 0 (0.0%) |
| 35 to 64 Years | 0 (0.0%) | 0 (0.0%) |
| 65 to 74 Years | 0 (0.0%) | 2 (5.4%) |
| 75 Years and over | 0 (0.0%) | 0 (0.0%) |
Technology Access in Occoquan
Computing Device Access in Occoquan
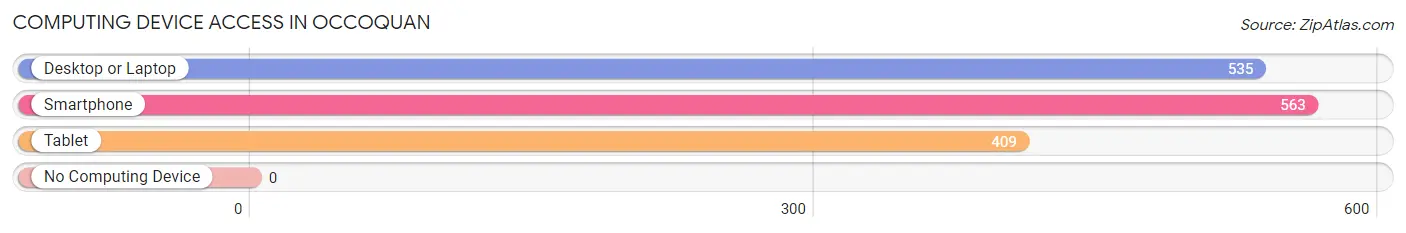
| Device Type | # Households | % Households |
| Desktop or Laptop | 535 | 94.0% |
| Smartphone | 563 | 99.0% |
| Tablet | 409 | 71.9% |
| No Computing Device | 0 | 0.0% |
| Total | 569 | 100.0% |
Internet Access in Occoquan
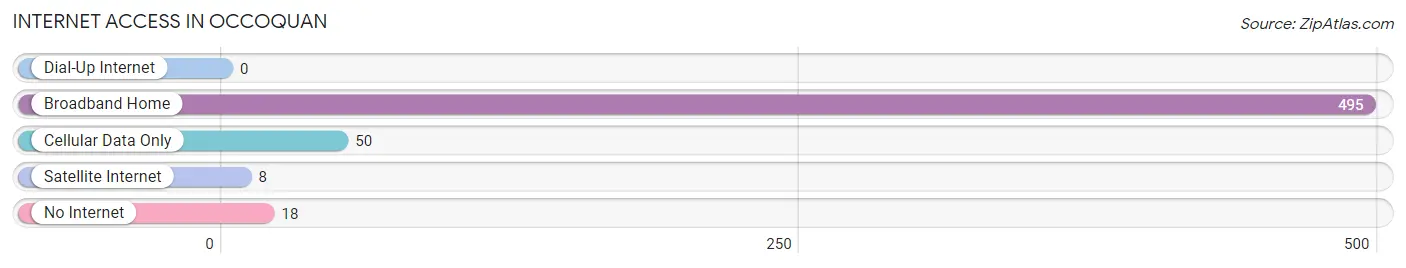
| Internet Type | # Households | % Households |
| Dial-Up Internet | 0 | 0.0% |
| Broadband Home | 495 | 87.0% |
| Cellular Data Only | 50 | 8.8% |
| Satellite Internet | 8 | 1.4% |
| No Internet | 18 | 3.2% |
| Total | 569 | 100.0% |
Occoquan Summary
History
Occoquan is a small town located in Prince William County, Virginia. It is situated on the Occoquan River, which is a tributary of the Potomac River. The town was first settled in the early 1700s by English colonists, who named it after the Occoquan Indians who lived in the area. The town was incorporated in 1804 and has a long and rich history.
During the American Civil War, Occoquan was a strategic location for both the Union and Confederate forces. The town was the site of several battles, including the Battle of Occoquan in 1862. The Union forces were victorious in this battle, and the town remained in Union control for the remainder of the war.
In the late 19th century, Occoquan became a popular tourist destination. The town was known for its picturesque views of the Occoquan River and its many historic buildings. The town also became a popular destination for artists, who were drawn to the area’s natural beauty.
In the early 20th century, Occoquan became a center for industry. The town was home to several mills, including the Occoquan Woolen Mill, which was the largest woolen mill in the United States at the time. The town also had a thriving shipbuilding industry, which produced a variety of vessels, including tugboats and barges.
Geography
Occoquan is located in Prince William County, Virginia, approximately 25 miles south of Washington, D.C. The town is situated on the Occoquan River, which is a tributary of the Potomac River. The town is bordered by the towns of Woodbridge and Lorton to the north, and the towns of Manassas and Bristow to the south.
The town has a total area of 1.3 square miles, all of which is land. The terrain is mostly flat, with some rolling hills. The town is located in a temperate climate zone, with hot, humid summers and mild winters.
Economy
The economy of Occoquan is largely based on tourism and retail. The town is home to several historic sites, including the Occoquan Woolen Mill, which is now a museum. The town also has several antique shops, art galleries, and restaurants.
The town is also home to several industrial businesses, including a paper mill and a shipbuilding company. The town is also home to a number of government agencies, including the Occoquan National Wildlife Refuge.
Demographics
As of the 2010 census, the population of Occoquan was 1,053. The racial makeup of the town was 79.3% White, 11.2% African American, 0.3% Native American, 2.2% Asian, 0.1% Pacific Islander, and 6.9% from other races. The median household income was $60,938, and the median family income was $68,958. The per capita income was $30,945.
The town is served by the Prince William County Public Schools system. The town is also home to the Occoquan Regional Library, which is part of the Prince William Public Library System.
Common Questions
What is Per Capita Income in Occoquan?
Per Capita income in Occoquan is $77,972.
What is the Median Family Income in Occoquan?
Median Family Income in Occoquan is $176,429.
What is the Median Household income in Occoquan?
Median Household Income in Occoquan is $126,927.
What is Income or Wage Gap in Occoquan?
Income or Wage Gap in Occoquan is 51.6%.
Women in Occoquan earn 48.4 cents for every dollar earned by a man.
What is Inequality or Gini Index in Occoquan?
Inequality or Gini Index in Occoquan is 0.37.
What is the Total Population of Occoquan?
Total Population of Occoquan is 1,072.
What is the Total Male Population of Occoquan?
Total Male Population of Occoquan is 529.
What is the Total Female Population of Occoquan?
Total Female Population of Occoquan is 543.
What is the Ratio of Males per 100 Females in Occoquan?
There are 97.42 Males per 100 Females in Occoquan.
What is the Ratio of Females per 100 Males in Occoquan?
There are 102.65 Females per 100 Males in Occoquan.
What is the Median Population Age in Occoquan?
Median Population Age in Occoquan is 43.9 Years.
What is the Average Family Size in Occoquan
Average Family Size in Occoquan is 2.6 People.
What is the Average Household Size in Occoquan
Average Household Size in Occoquan is 1.9 People.
How Large is the Labor Force in Occoquan?
There are 832 People in the Labor Forcein in Occoquan.
What is the Percentage of People in the Labor Force in Occoquan?
83.9% of People are in the Labor Force in Occoquan.
What is the Unemployment Rate in Occoquan?
Unemployment Rate in Occoquan is 5.1%.