Ravensworth, VA Map & Demographics
Ravensworth Map
Ravensworth Overview
$60,722
PER CAPITA INCOME
$164,143
AVG FAMILY INCOME
$163,019
AVG HOUSEHOLD INCOME
33.0%
WAGE / INCOME GAP [ % ]
67.0¢/ $1
WAGE / INCOME GAP [ $ ]
0.34
INEQUALITY / GINI INDEX
2,661
TOTAL POPULATION
1,284
MALE POPULATION
1,377
FEMALE POPULATION
93.25
MALES / 100 FEMALES
107.24
FEMALES / 100 MALES
40.3
MEDIAN AGE
3.5
AVG FAMILY SIZE
3.1
AVG HOUSEHOLD SIZE
1,519
LABOR FORCE [ PEOPLE ]
75.2%
PERCENT IN LABOR FORCE
4.6%
UNEMPLOYMENT RATE
Income in Ravensworth
Income Overview in Ravensworth
Per Capita Income in Ravensworth is $60,722, while median incomes of families and households are $164,143 and $163,019 respectively.
| Characteristic | Number | Measure |
| Per Capita Income | 2,661 | $60,722 |
| Median Family Income | 638 | $164,143 |
| Mean Family Income | 638 | $188,002 |
| Median Household Income | 848 | $163,019 |
| Mean Household Income | 848 | $184,007 |
| Income Deficit | 638 | $0 |
| Wage / Income Gap (%) | 2,661 | 33.01% |
| Wage / Income Gap ($) | 2,661 | 66.99¢ per $1 |
| Gini / Inequality Index | 2,661 | 0.34 |
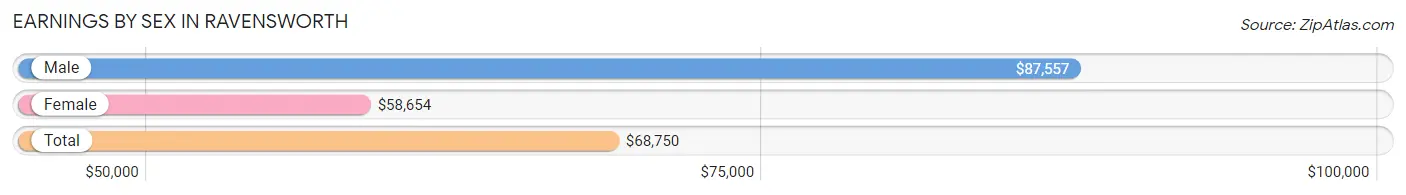
Earnings by Sex in Ravensworth
Average Earnings in Ravensworth are $68,750, $87,557 for men and $58,654 for women, a difference of 33.0%.
| Sex | Number | Average Earnings |
| Male | 763 (48.2%) | $87,557 |
| Female | 820 (51.8%) | $58,654 |
| Total | 1,583 (100.0%) | $68,750 |
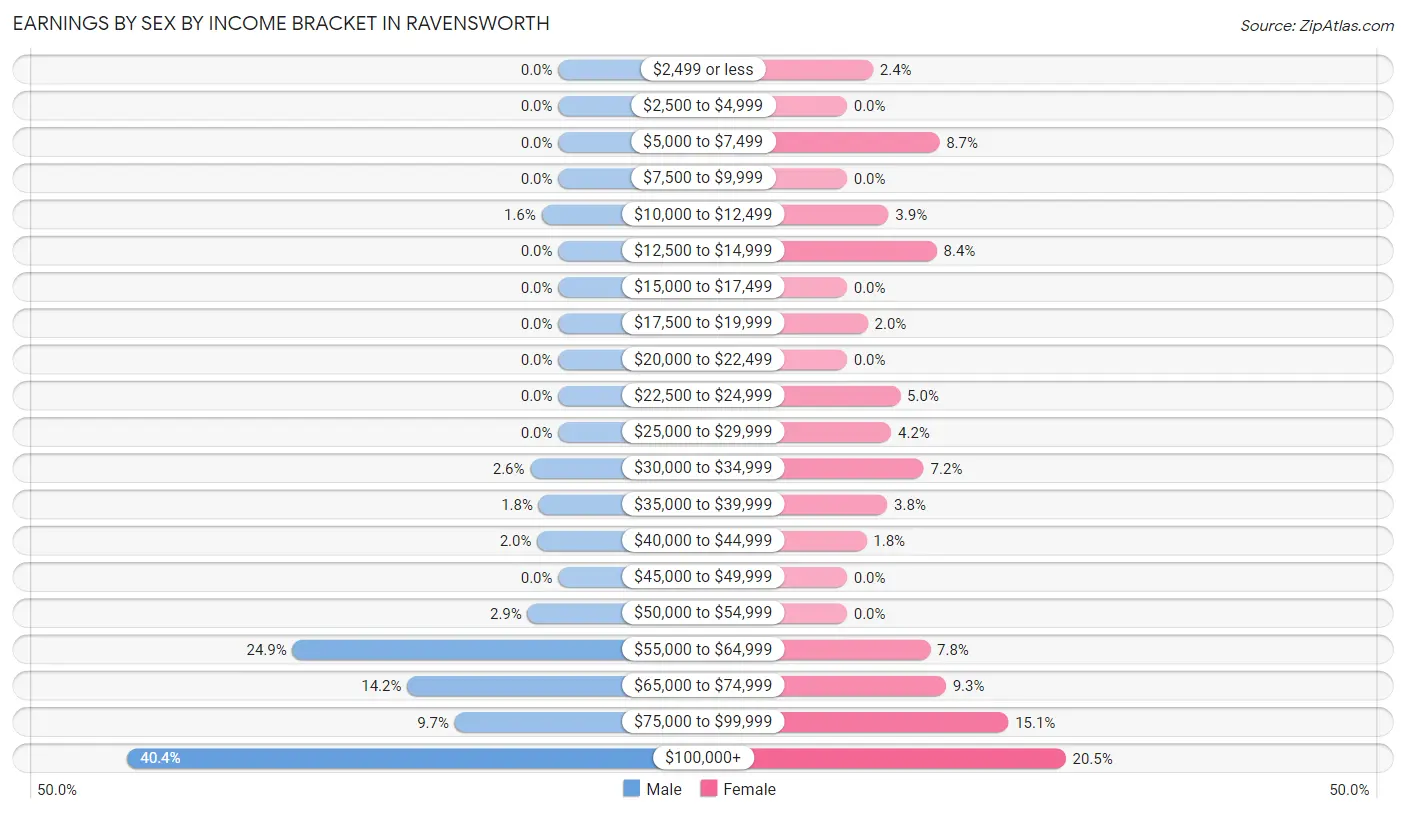
Earnings by Sex by Income Bracket in Ravensworth
The most common earnings brackets in Ravensworth are $100,000+ for men (308 | 40.4%) and $100,000+ for women (168 | 20.5%).
| Income | Male | Female |
| $2,499 or less | 0 (0.0%) | 20 (2.4%) |
| $2,500 to $4,999 | 0 (0.0%) | 0 (0.0%) |
| $5,000 to $7,499 | 0 (0.0%) | 71 (8.7%) |
| $7,500 to $9,999 | 0 (0.0%) | 0 (0.0%) |
| $10,000 to $12,499 | 12 (1.6%) | 32 (3.9%) |
| $12,500 to $14,999 | 0 (0.0%) | 69 (8.4%) |
| $15,000 to $17,499 | 0 (0.0%) | 0 (0.0%) |
| $17,500 to $19,999 | 0 (0.0%) | 16 (1.9%) |
| $20,000 to $22,499 | 0 (0.0%) | 0 (0.0%) |
| $22,500 to $24,999 | 0 (0.0%) | 41 (5.0%) |
| $25,000 to $29,999 | 0 (0.0%) | 34 (4.2%) |
| $30,000 to $34,999 | 20 (2.6%) | 59 (7.2%) |
| $35,000 to $39,999 | 14 (1.8%) | 31 (3.8%) |
| $40,000 to $44,999 | 15 (2.0%) | 15 (1.8%) |
| $45,000 to $49,999 | 0 (0.0%) | 0 (0.0%) |
| $50,000 to $54,999 | 22 (2.9%) | 0 (0.0%) |
| $55,000 to $64,999 | 190 (24.9%) | 64 (7.8%) |
| $65,000 to $74,999 | 108 (14.1%) | 76 (9.3%) |
| $75,000 to $99,999 | 74 (9.7%) | 124 (15.1%) |
| $100,000+ | 308 (40.4%) | 168 (20.5%) |
| Total | 763 (100.0%) | 820 (100.0%) |
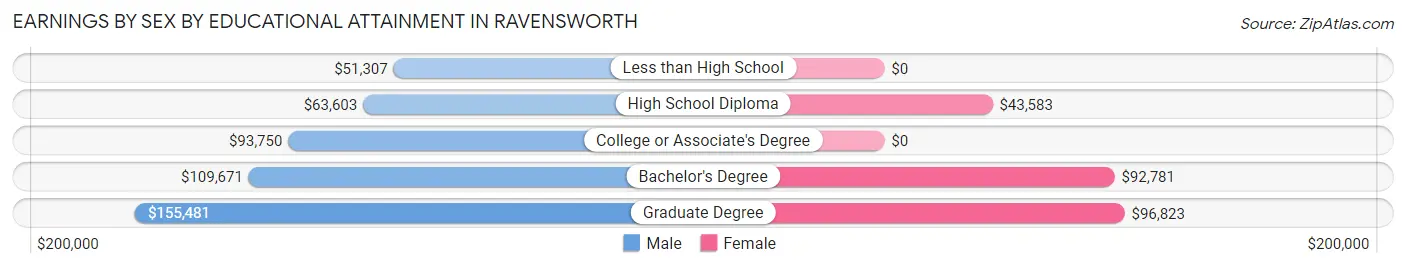
Earnings by Sex by Educational Attainment in Ravensworth
Average earnings in Ravensworth are $87,557 for men and $65,643 for women, a difference of 25.0%. Men with an educational attainment of graduate degree enjoy the highest average annual earnings of $155,481, while those with less than high school education earn the least with $51,307. Women with an educational attainment of graduate degree earn the most with the average annual earnings of $96,823, while those with high school diploma education have the smallest earnings of $43,583.
| Educational Attainment | Male Income | Female Income |
| Less than High School | $51,307 | $0 |
| High School Diploma | $63,603 | $43,583 |
| College or Associate's Degree | $93,750 | $0 |
| Bachelor's Degree | $109,671 | $92,781 |
| Graduate Degree | $155,481 | $96,823 |
| Total | $87,557 | $65,643 |
Family Income in Ravensworth
Family Income Brackets in Ravensworth
According to the Ravensworth family income data, there are 253 families falling into the $200,000+ income range, which is the most common income bracket and makes up 39.7% of all families.
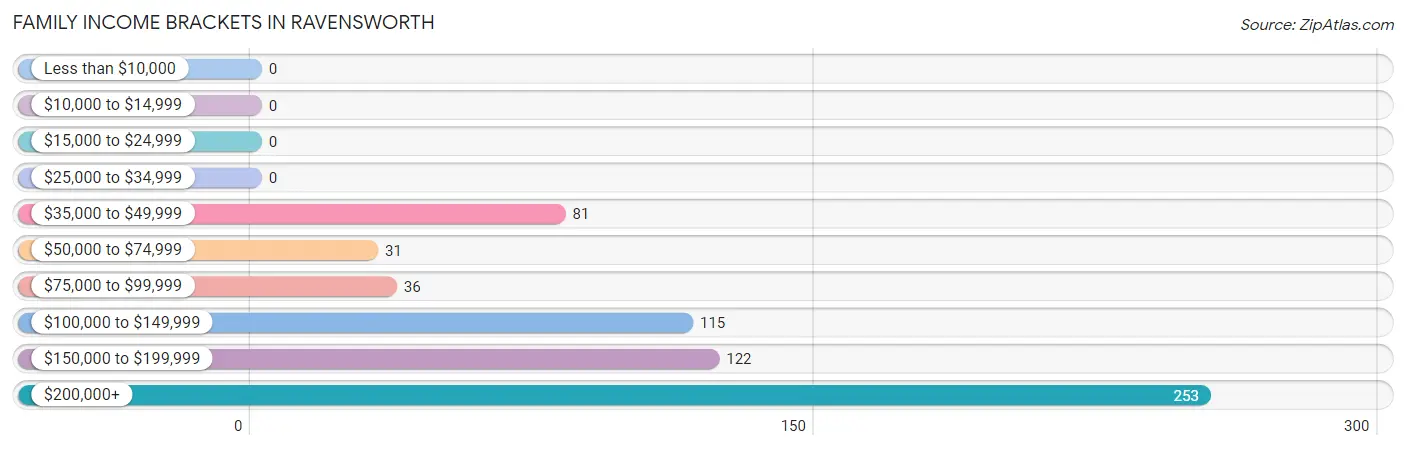
| Income Bracket | # Families | % Families |
| Less than $10,000 | 0 | 0.0% |
| $10,000 to $14,999 | 0 | 0.0% |
| $15,000 to $24,999 | 0 | 0.0% |
| $25,000 to $34,999 | 0 | 0.0% |
| $35,000 to $49,999 | 81 | 12.7% |
| $50,000 to $74,999 | 31 | 4.9% |
| $75,000 to $99,999 | 36 | 5.6% |
| $100,000 to $149,999 | 115 | 18.0% |
| $150,000 to $199,999 | 122 | 19.1% |
| $200,000+ | 253 | 39.7% |
Family Income by Famaliy Size in Ravensworth
4-person families (164 | 25.7%) account for the highest median family income in Ravensworth with $197,174 per family, while 3-person families (151 | 23.7%) have the highest median income of $51,369 per family member.
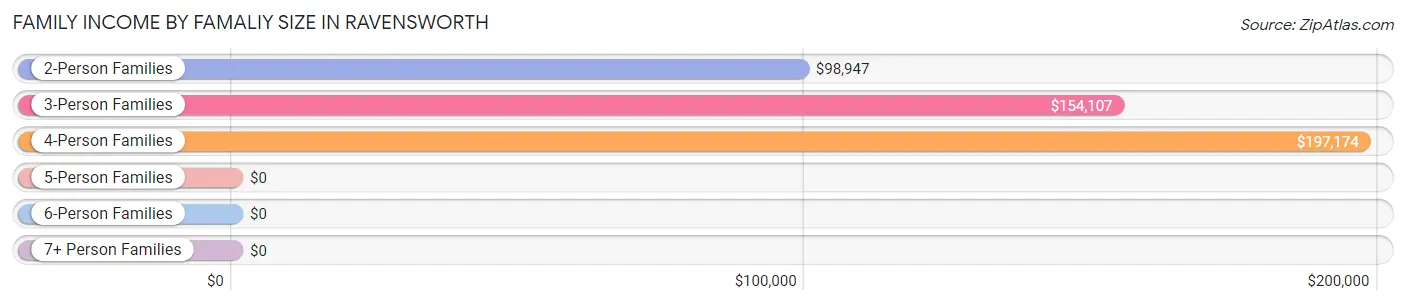
| Income Bracket | # Families | Median Income |
| 2-Person Families | 256 (40.1%) | $98,947 |
| 3-Person Families | 151 (23.7%) | $154,107 |
| 4-Person Families | 164 (25.7%) | $197,174 |
| 5-Person Families | 32 (5.0%) | $0 |
| 6-Person Families | 35 (5.5%) | $0 |
| 7+ Person Families | 0 (0.0%) | $0 |
| Total | 638 (100.0%) | $164,143 |
Family Income by Number of Earners in Ravensworth
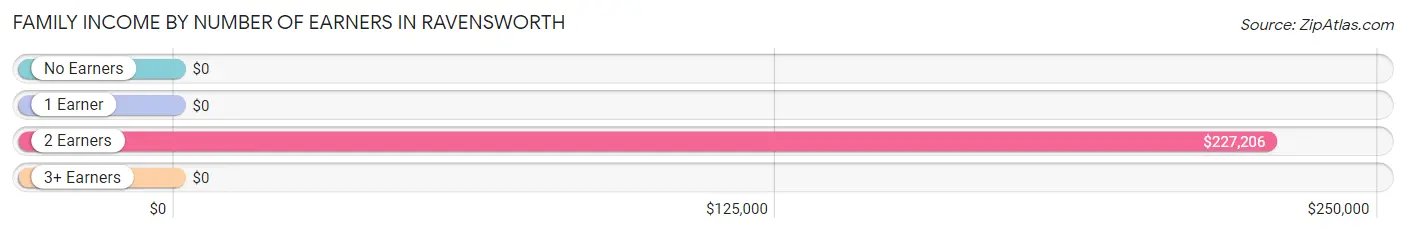
| Number of Earners | # Families | Median Income |
| No Earners | 31 (4.9%) | $0 |
| 1 Earner | 158 (24.8%) | $0 |
| 2 Earners | 332 (52.0%) | $227,206 |
| 3+ Earners | 117 (18.3%) | $0 |
| Total | 638 (100.0%) | $164,143 |
Household Income in Ravensworth
Household Income Brackets in Ravensworth
With 308 households falling in the category, the $200,000+ income range is the most frequent in Ravensworth, accounting for 36.3% of all households.
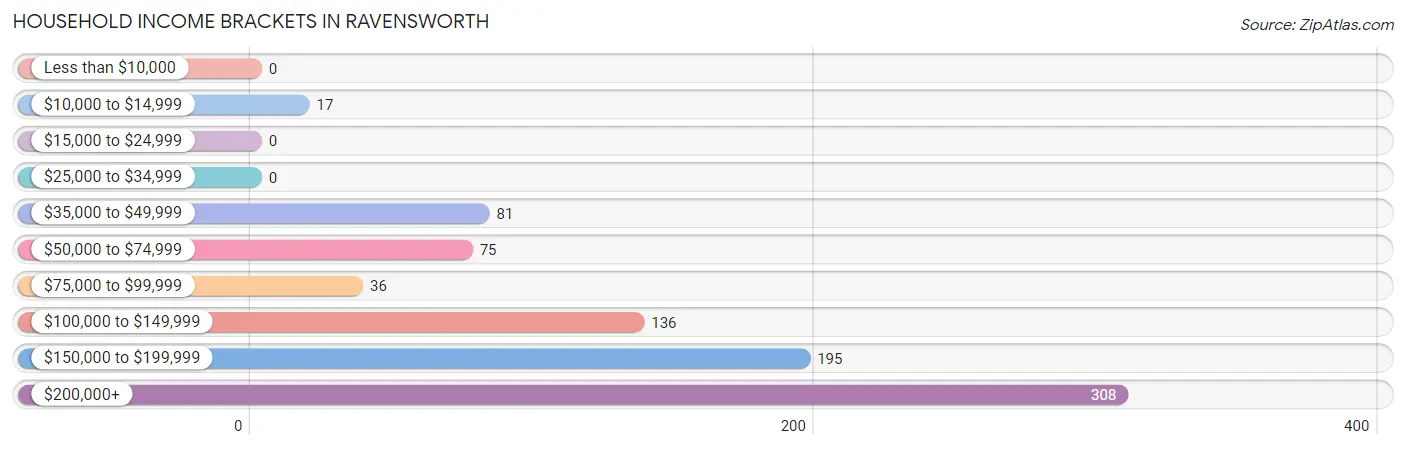
| Income Bracket | # Households | % Households |
| Less than $10,000 | 0 | 0.0% |
| $10,000 to $14,999 | 17 | 2.0% |
| $15,000 to $24,999 | 0 | 0.0% |
| $25,000 to $34,999 | 0 | 0.0% |
| $35,000 to $49,999 | 81 | 9.6% |
| $50,000 to $74,999 | 75 | 8.8% |
| $75,000 to $99,999 | 36 | 4.2% |
| $100,000 to $149,999 | 136 | 16.0% |
| $150,000 to $199,999 | 195 | 23.0% |
| $200,000+ | 308 | 36.3% |
Household Income by Householder Age in Ravensworth
The median household income in Ravensworth is $163,019, with the highest median household income of $166,833 found in the 45 to 64 years age bracket for the primary householder. A total of 336 households (39.6%) fall into this category.
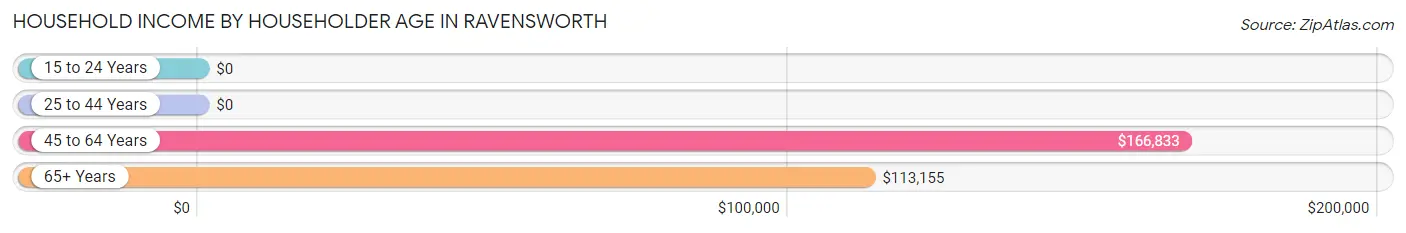
| Income Bracket | # Households | Median Income |
| 15 to 24 Years | 0 (0.0%) | $0 |
| 25 to 44 Years | 283 (33.4%) | $0 |
| 45 to 64 Years | 336 (39.6%) | $166,833 |
| 65+ Years | 229 (27.0%) | $113,155 |
| Total | 848 (100.0%) | $163,019 |
Poverty in Ravensworth
Income Below Poverty by Sex and Age in Ravensworth
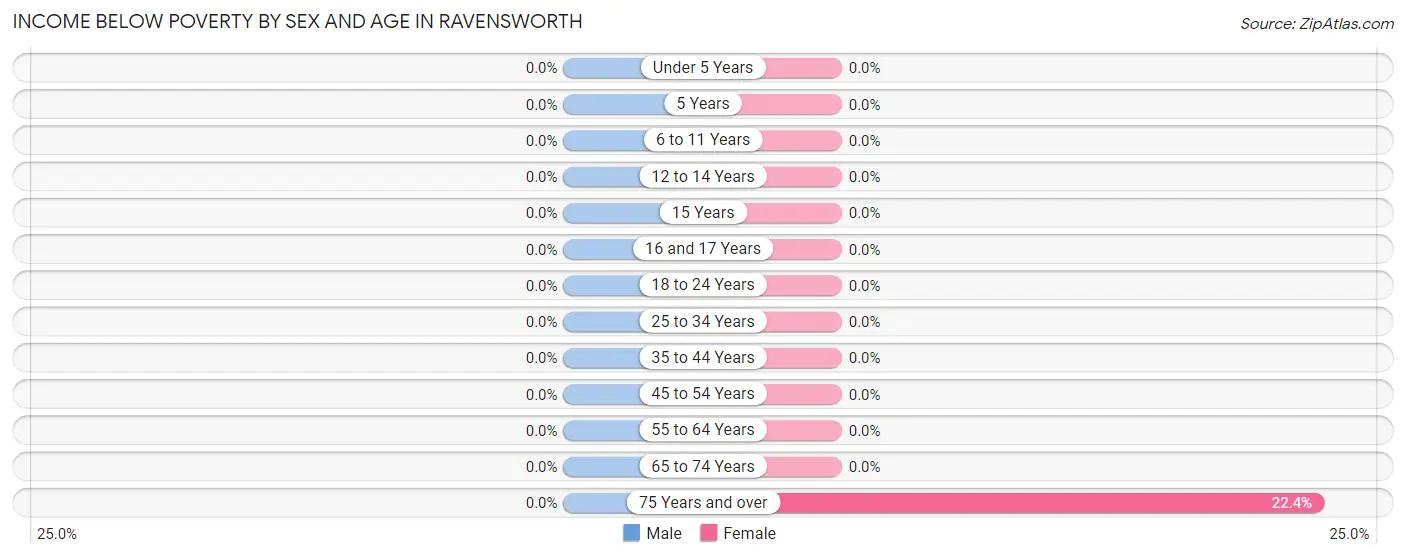
| Age Bracket | Male | Female |
| Under 5 Years | 0 (0.0%) | 0 (0.0%) |
| 5 Years | 0 (0.0%) | 0 (0.0%) |
| 6 to 11 Years | 0 (0.0%) | 0 (0.0%) |
| 12 to 14 Years | 0 (0.0%) | 0 (0.0%) |
| 15 Years | 0 (0.0%) | 0 (0.0%) |
| 16 and 17 Years | 0 (0.0%) | 0 (0.0%) |
| 18 to 24 Years | 0 (0.0%) | 0 (0.0%) |
| 25 to 34 Years | 0 (0.0%) | 0 (0.0%) |
| 35 to 44 Years | 0 (0.0%) | 0 (0.0%) |
| 45 to 54 Years | 0 (0.0%) | 0 (0.0%) |
| 55 to 64 Years | 0 (0.0%) | 0 (0.0%) |
| 65 to 74 Years | 0 (0.0%) | 0 (0.0%) |
| 75 Years and over | 0 (0.0%) | 17 (22.4%) |
| Total | 0 (0.0%) | 17 (1.2%) |
Income Above Poverty by Sex and Age in Ravensworth
According to the poverty statistics in Ravensworth, males aged under 5 years and females aged under 5 years are the age groups that are most secure financially, with 100.0% of males and 100.0% of females in these age groups living above the poverty line.
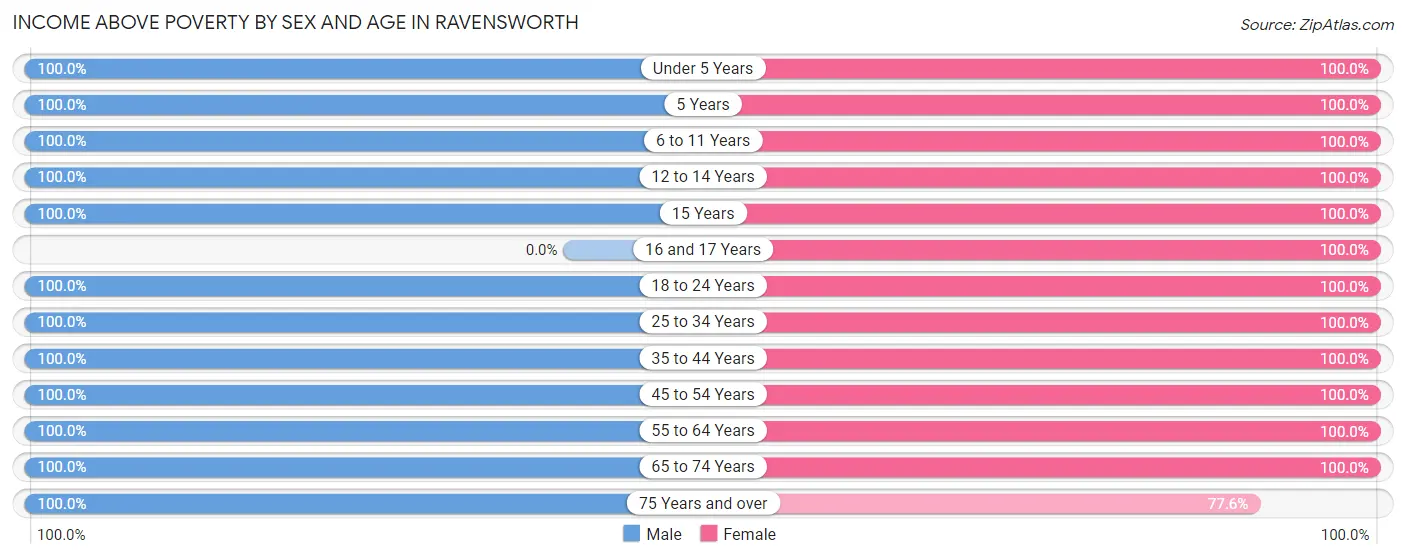
| Age Bracket | Male | Female |
| Under 5 Years | 66 (100.0%) | 13 (100.0%) |
| 5 Years | 12 (100.0%) | 176 (100.0%) |
| 6 to 11 Years | 122 (100.0%) | 104 (100.0%) |
| 12 to 14 Years | 29 (100.0%) | 52 (100.0%) |
| 15 Years | 54 (100.0%) | 13 (100.0%) |
| 16 and 17 Years | 0 (0.0%) | 26 (100.0%) |
| 18 to 24 Years | 73 (100.0%) | 148 (100.0%) |
| 25 to 34 Years | 141 (100.0%) | 172 (100.0%) |
| 35 to 44 Years | 330 (100.0%) | 94 (100.0%) |
| 45 to 54 Years | 181 (100.0%) | 257 (100.0%) |
| 55 to 64 Years | 121 (100.0%) | 119 (100.0%) |
| 65 to 74 Years | 103 (100.0%) | 127 (100.0%) |
| 75 Years and over | 52 (100.0%) | 59 (77.6%) |
| Total | 1,284 (100.0%) | 1,360 (98.8%) |
Income Below Poverty Among Married-Couple Families in Ravensworth
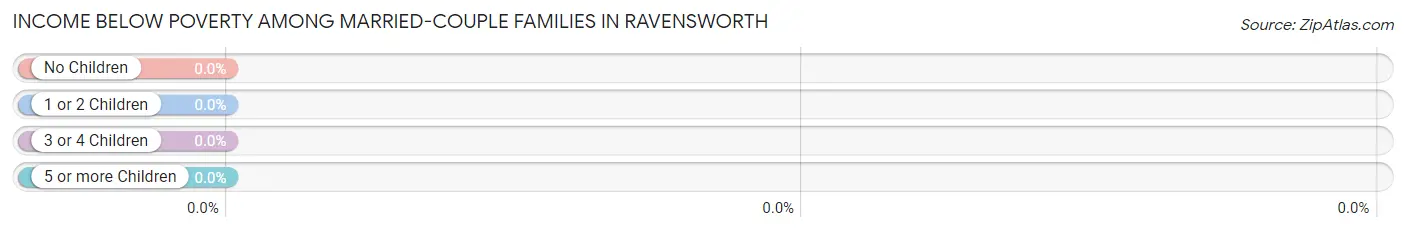
| Children | Above Poverty | Below Poverty |
| No Children | 301 (100.0%) | 0 (0.0%) |
| 1 or 2 Children | 193 (100.0%) | 0 (0.0%) |
| 3 or 4 Children | 35 (100.0%) | 0 (0.0%) |
| 5 or more Children | 0 (0.0%) | 0 (0.0%) |
| Total | 529 (100.0%) | 0 (0.0%) |
Income Below Poverty Among Single-Parent Households in Ravensworth
| Children | Single Father | Single Mother |
| No Children | 0 (0.0%) | 0 (0.0%) |
| 1 or 2 Children | 0 (0.0%) | 0 (0.0%) |
| 3 or 4 Children | 0 (0.0%) | 0 (0.0%) |
| 5 or more Children | 0 (0.0%) | 0 (0.0%) |
| Total | 0 (0.0%) | 0 (0.0%) |
Income Below Poverty Among Married-Couple vs Single-Parent Households in Ravensworth
| Children | Married-Couple Families | Single-Parent Households |
| No Children | 0 (0.0%) | 0 (0.0%) |
| 1 or 2 Children | 0 (0.0%) | 0 (0.0%) |
| 3 or 4 Children | 0 (0.0%) | 0 (0.0%) |
| 5 or more Children | 0 (0.0%) | 0 (0.0%) |
| Total | 0 (0.0%) | 0 (0.0%) |
Race in Ravensworth
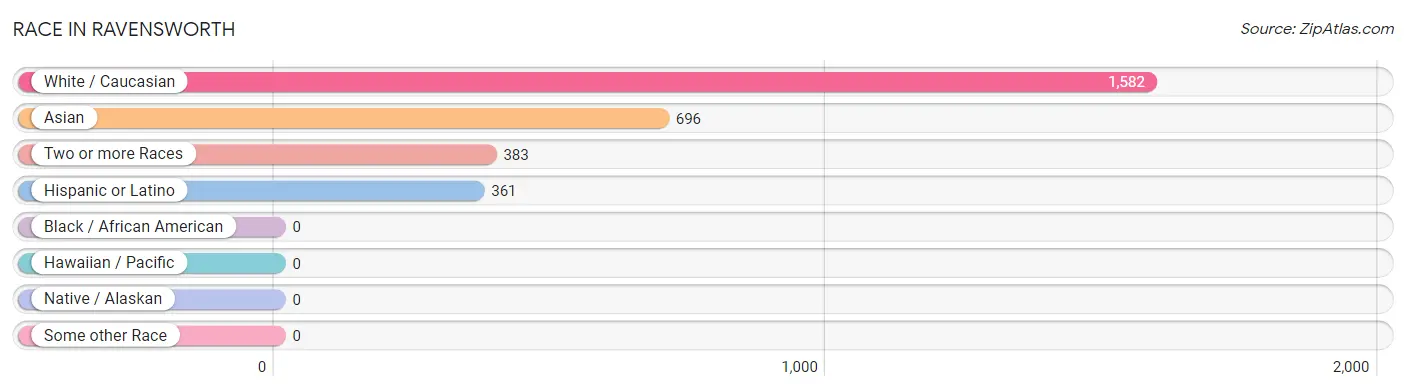
The most populous races in Ravensworth are White / Caucasian (1,582 | 59.5%), Asian (696 | 26.2%), and Two or more Races (383 | 14.4%).
| Race | # Population | % Population |
| Asian | 696 | 26.2% |
| Black / African American | 0 | 0.0% |
| Hawaiian / Pacific | 0 | 0.0% |
| Hispanic or Latino | 361 | 13.6% |
| Native / Alaskan | 0 | 0.0% |
| White / Caucasian | 1,582 | 59.5% |
| Two or more Races | 383 | 14.4% |
| Some other Race | 0 | 0.0% |
| Total | 2,661 | 100.0% |
Ancestry in Ravensworth
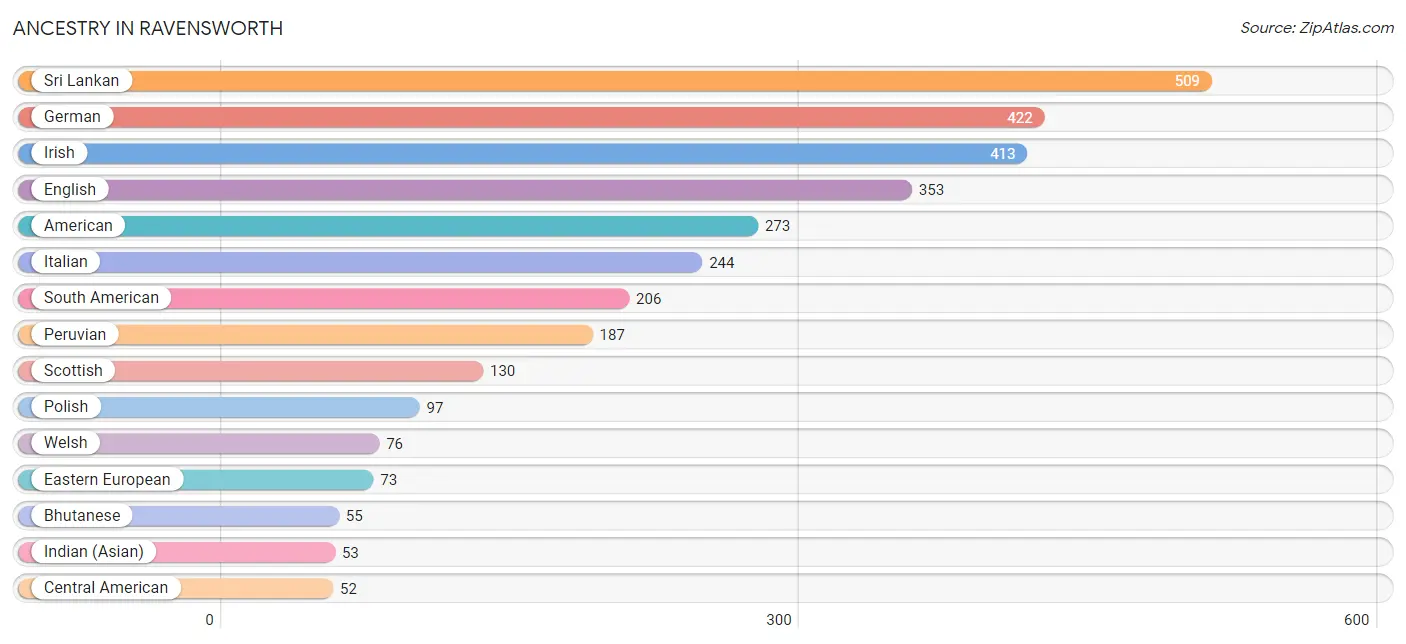
The most populous ancestries reported in Ravensworth are Sri Lankan (509 | 19.1%), German (422 | 15.9%), Irish (413 | 15.5%), English (353 | 13.3%), and American (273 | 10.3%), together accounting for 74.0% of all Ravensworth residents.
| Ancestry | # Population | % Population |
| American | 273 | 10.3% |
| Arab | 10 | 0.4% |
| Argentinean | 19 | 0.7% |
| Bhutanese | 55 | 2.1% |
| Burmese | 18 | 0.7% |
| Central American | 52 | 1.9% |
| Dutch | 46 | 1.7% |
| Eastern European | 73 | 2.7% |
| English | 353 | 13.3% |
| French | 35 | 1.3% |
| German | 422 | 15.9% |
| Indian (Asian) | 53 | 2.0% |
| Irish | 413 | 15.5% |
| Italian | 244 | 9.2% |
| Korean | 33 | 1.2% |
| Northern European | 17 | 0.6% |
| Norwegian | 18 | 0.7% |
| Peruvian | 187 | 7.0% |
| Polish | 97 | 3.6% |
| Salvadoran | 52 | 1.9% |
| Scotch-Irish | 19 | 0.7% |
| Scottish | 130 | 4.9% |
| South American | 206 | 7.7% |
| Sri Lankan | 509 | 19.1% |
| Syrian | 10 | 0.4% |
| Thai | 42 | 1.6% |
| Ukrainian | 17 | 0.6% |
| Welsh | 76 | 2.9% | View All 28 Rows |
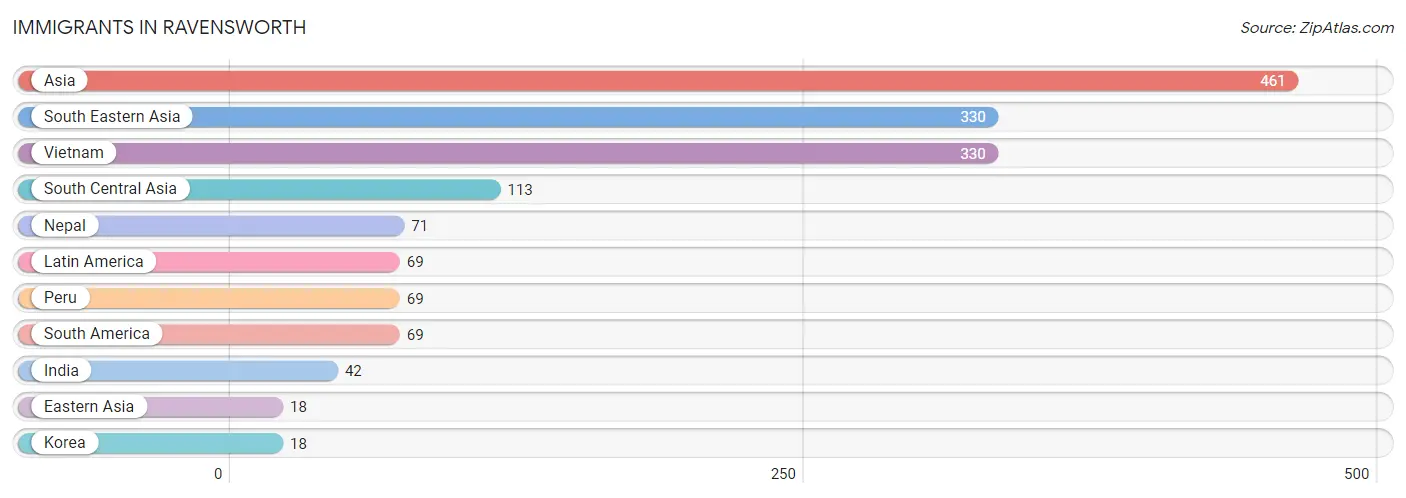
Immigrants in Ravensworth
The most numerous immigrant groups reported in Ravensworth came from Asia (461 | 17.3%), South Eastern Asia (330 | 12.4%), Vietnam (330 | 12.4%), South Central Asia (113 | 4.3%), and Nepal (71 | 2.7%), together accounting for 49.0% of all Ravensworth residents.
| Immigration Origin | # Population | % Population |
| Asia | 461 | 17.3% |
| Eastern Asia | 18 | 0.7% |
| India | 42 | 1.6% |
| Korea | 18 | 0.7% |
| Latin America | 69 | 2.6% |
| Nepal | 71 | 2.7% |
| Peru | 69 | 2.6% |
| South America | 69 | 2.6% |
| South Central Asia | 113 | 4.3% |
| South Eastern Asia | 330 | 12.4% |
| Vietnam | 330 | 12.4% | View All 11 Rows |
Sex and Age in Ravensworth
Sex and Age in Ravensworth
The most populous age groups in Ravensworth are 40 to 44 Years (276 | 21.5%) for men and 5 to 9 Years (222 | 16.1%) for women.
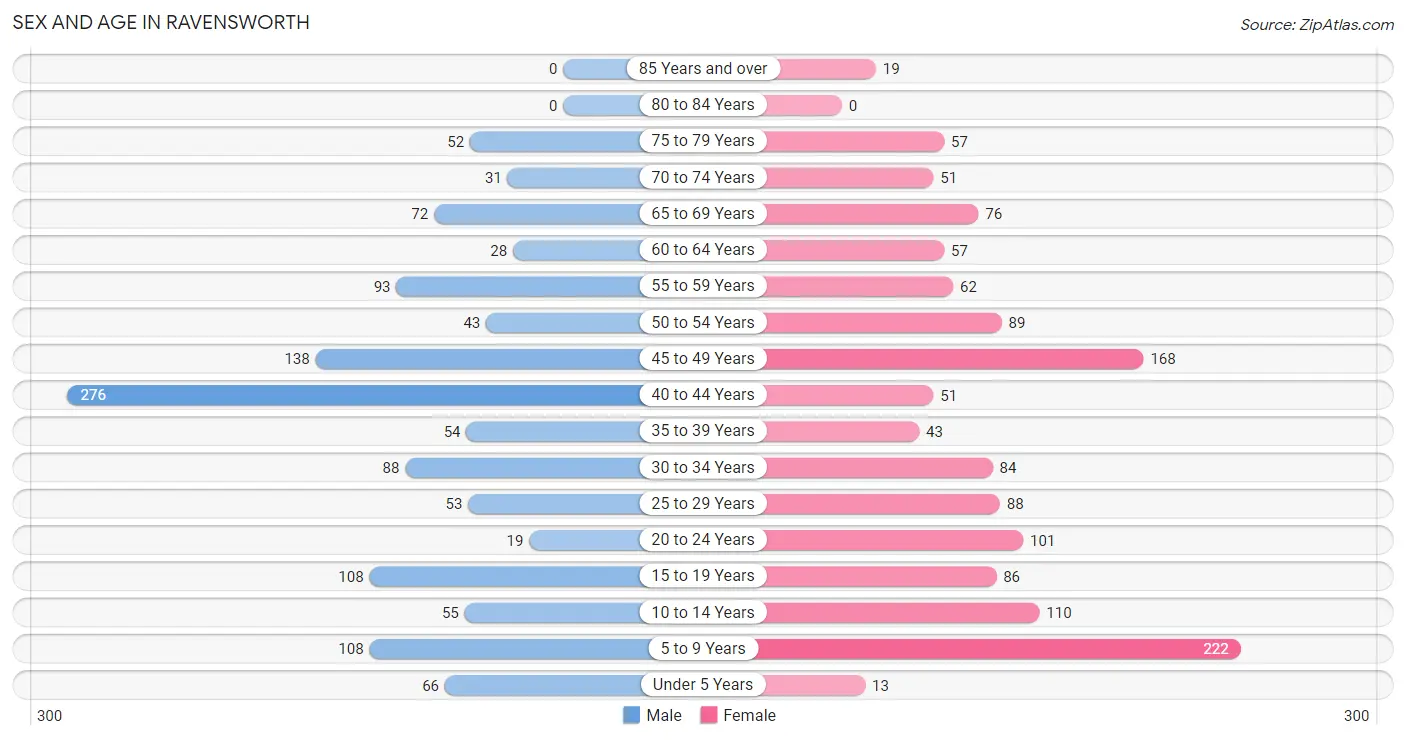
| Age Bracket | Male | Female |
| Under 5 Years | 66 (5.1%) | 13 (0.9%) |
| 5 to 9 Years | 108 (8.4%) | 222 (16.1%) |
| 10 to 14 Years | 55 (4.3%) | 110 (8.0%) |
| 15 to 19 Years | 108 (8.4%) | 86 (6.2%) |
| 20 to 24 Years | 19 (1.5%) | 101 (7.3%) |
| 25 to 29 Years | 53 (4.1%) | 88 (6.4%) |
| 30 to 34 Years | 88 (6.9%) | 84 (6.1%) |
| 35 to 39 Years | 54 (4.2%) | 43 (3.1%) |
| 40 to 44 Years | 276 (21.5%) | 51 (3.7%) |
| 45 to 49 Years | 138 (10.7%) | 168 (12.2%) |
| 50 to 54 Years | 43 (3.4%) | 89 (6.5%) |
| 55 to 59 Years | 93 (7.2%) | 62 (4.5%) |
| 60 to 64 Years | 28 (2.2%) | 57 (4.1%) |
| 65 to 69 Years | 72 (5.6%) | 76 (5.5%) |
| 70 to 74 Years | 31 (2.4%) | 51 (3.7%) |
| 75 to 79 Years | 52 (4.1%) | 57 (4.1%) |
| 80 to 84 Years | 0 (0.0%) | 0 (0.0%) |
| 85 Years and over | 0 (0.0%) | 19 (1.4%) |
| Total | 1,284 (100.0%) | 1,377 (100.0%) |
Families and Households in Ravensworth
Median Family Size in Ravensworth
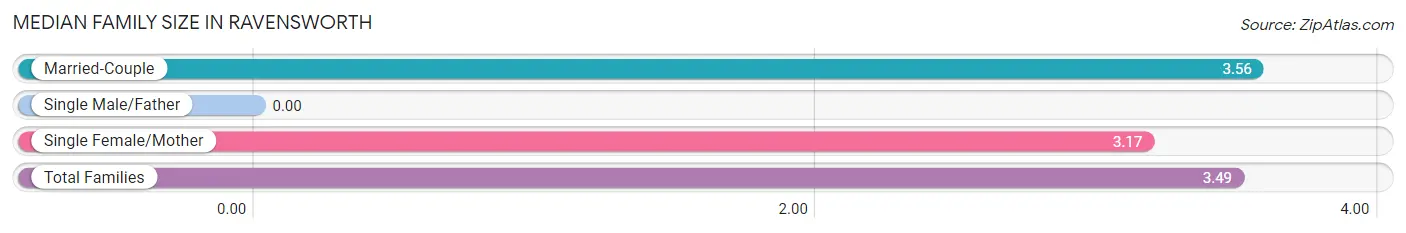
| Family Type | # Families | Family Size |
| Married-Couple | 529 (82.9%) | 3.56 |
| Single Male/Father | 0 (0.0%) | - |
| Single Female/Mother | 109 (17.1%) | 3.17 |
| Total Families | 638 (100.0%) | 3.49 |
Median Household Size in Ravensworth
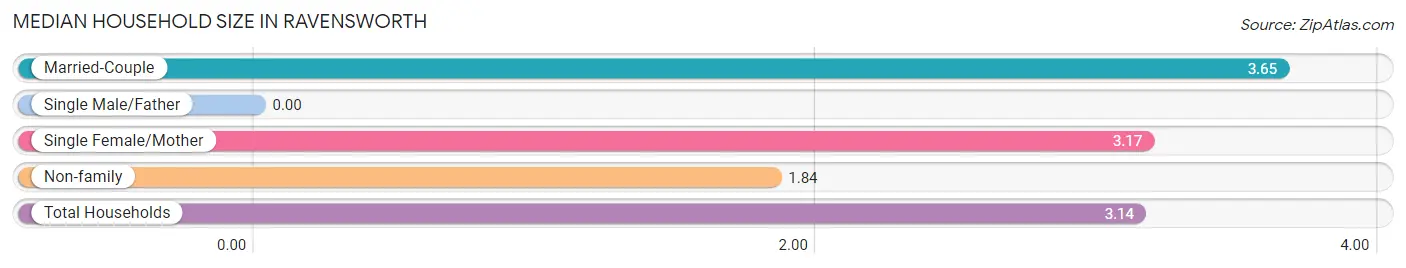
| Household Type | # Households | Household Size |
| Married-Couple | 529 (62.4%) | 3.65 |
| Single Male/Father | 0 (0.0%) | - |
| Single Female/Mother | 109 (12.9%) | 3.17 |
| Non-family | 210 (24.8%) | 1.84 |
| Total Households | 848 (100.0%) | 3.14 |
Household Size by Marriage Status in Ravensworth
Out of a total of 848 households in Ravensworth, 638 (75.2%) are family households, while 210 (24.8%) are nonfamily households. The most numerous type of family households are 2-person households, comprising 256, and the most common type of nonfamily households are 1-person households, comprising 121.
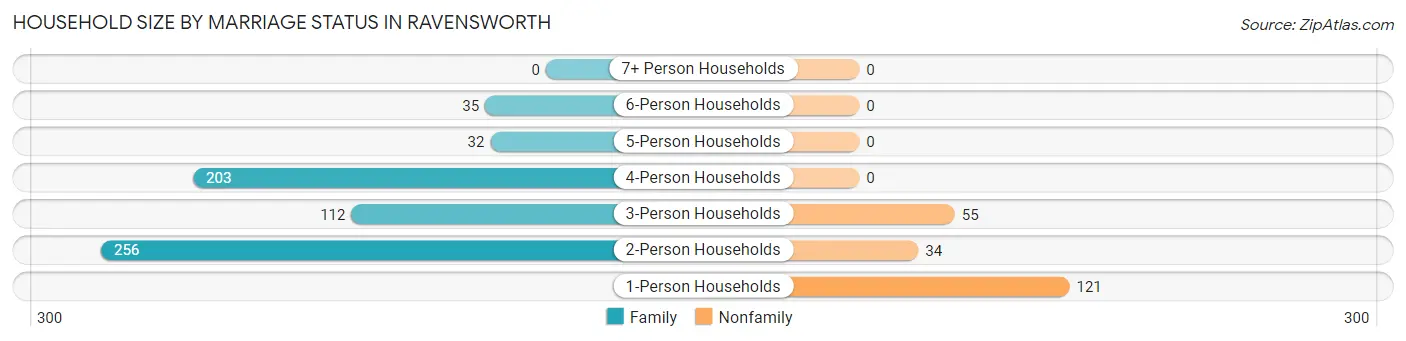
| Household Size | Family Households | Nonfamily Households |
| 1-Person Households | - | 121 (14.3%) |
| 2-Person Households | 256 (30.2%) | 34 (4.0%) |
| 3-Person Households | 112 (13.2%) | 55 (6.5%) |
| 4-Person Households | 203 (23.9%) | 0 (0.0%) |
| 5-Person Households | 32 (3.8%) | 0 (0.0%) |
| 6-Person Households | 35 (4.1%) | 0 (0.0%) |
| 7+ Person Households | 0 (0.0%) | 0 (0.0%) |
| Total | 638 (75.2%) | 210 (24.8%) |
Female Fertility in Ravensworth
Fertility by Age in Ravensworth
Average fertility rate in Ravensworth is 30.0 births per 1,000 women. Women in the age bracket of 35 to 50 years have the highest fertility rate with 68.0 births per 1,000 women. Women in the age bracket of 35 to 50 years acount for 100.0% of all women with births.
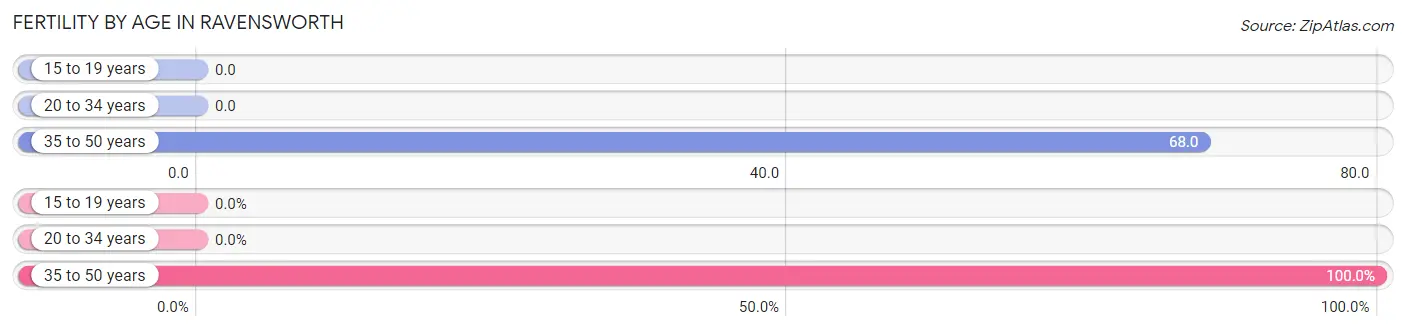
| Age Bracket | Women with Births | Births / 1,000 Women |
| 15 to 19 years | 0 (0.0%) | 0.0 |
| 20 to 34 years | 0 (0.0%) | 0.0 |
| 35 to 50 years | 19 (100.0%) | 68.0 |
| Total | 19 (100.0%) | 30.0 |
Fertility by Age by Marriage Status in Ravensworth
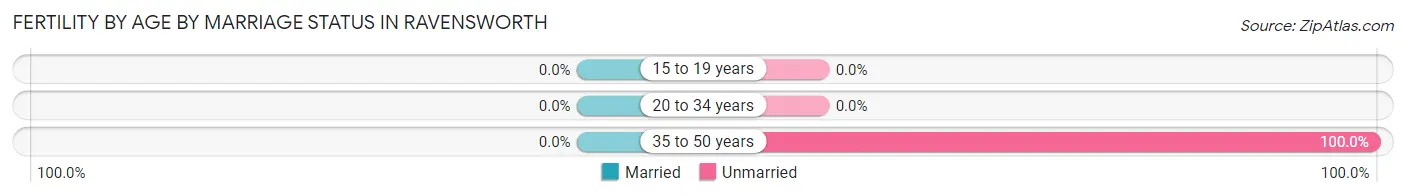
| Age Bracket | Married | Unmarried |
| 15 to 19 years | 0 (0.0%) | 0 (0.0%) |
| 20 to 34 years | 0 (0.0%) | 0 (0.0%) |
| 35 to 50 years | 0 (0.0%) | 19 (100.0%) |
| Total | 0 (0.0%) | 19 (100.0%) |
Fertility by Education in Ravensworth
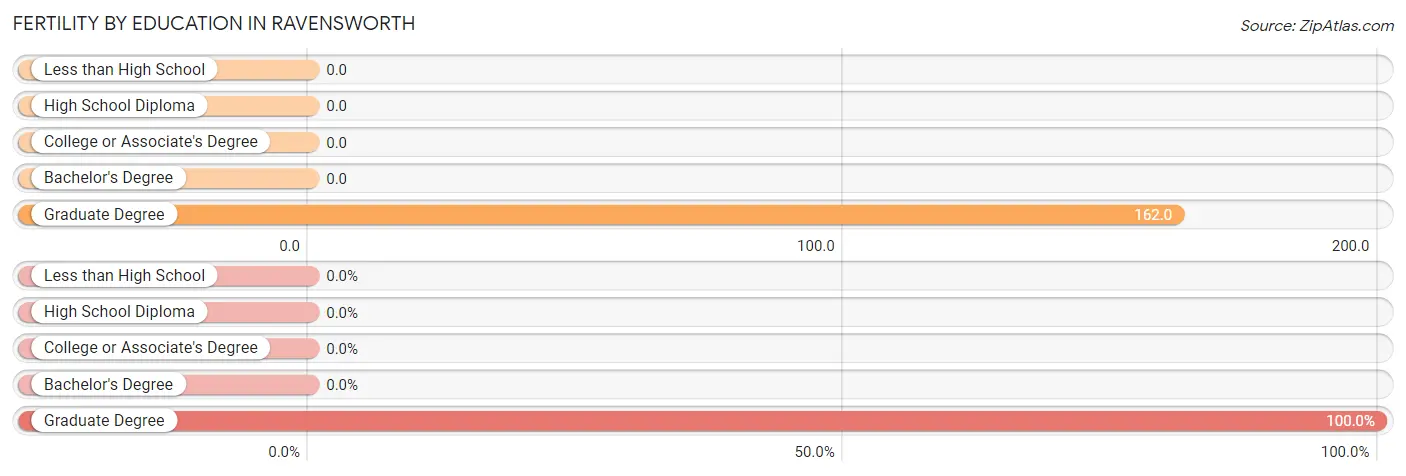
| Educational Attainment | Women with Births | Births / 1,000 Women |
| Less than High School | 0 (0.0%) | 0.0 |
| High School Diploma | 0 (0.0%) | 0.0 |
| College or Associate's Degree | 0 (0.0%) | 0.0 |
| Bachelor's Degree | 0 (0.0%) | 0.0 |
| Graduate Degree | 19 (100.0%) | 162.0 |
| Total | 19 (100.0%) | 30.0 |
Fertility by Education by Marriage Status in Ravensworth
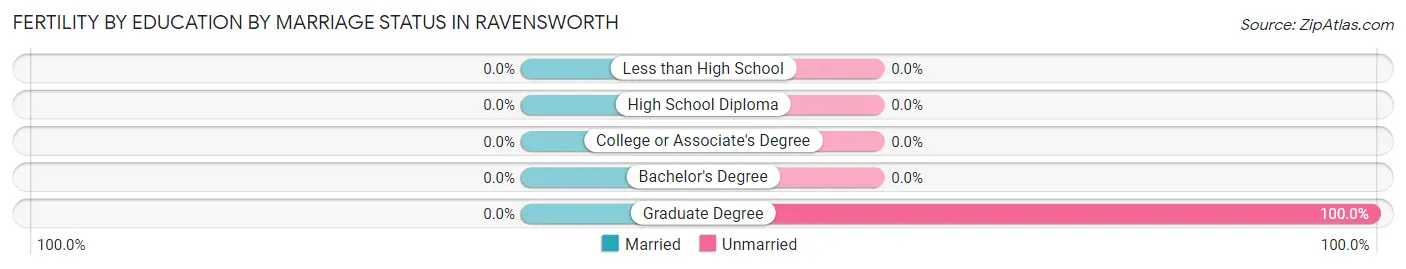
| Educational Attainment | Married | Unmarried |
| Less than High School | 0 (0.0%) | 0 (0.0%) |
| High School Diploma | 0 (0.0%) | 0 (0.0%) |
| College or Associate's Degree | 0 (0.0%) | 0 (0.0%) |
| Bachelor's Degree | 0 (0.0%) | 0 (0.0%) |
| Graduate Degree | 0 (0.0%) | 19 (100.0%) |
| Total | 0 (0.0%) | 19 (100.0%) |
Employment Characteristics in Ravensworth
Employment by Class of Employer in Ravensworth
Among the 1,431 employed individuals in Ravensworth, private company employees (1,019 | 71.2%), not-for-profit organizations (213 | 14.9%), and federal government employees (88 | 6.1%) make up the most common classes of employment.
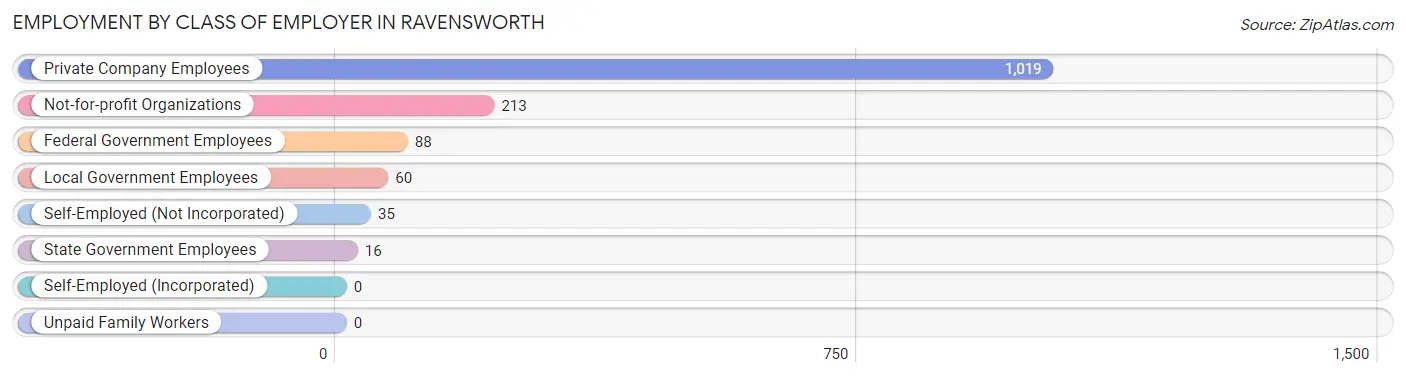
| Employer Class | # Employees | % Employees |
| Private Company Employees | 1,019 | 71.2% |
| Self-Employed (Incorporated) | 0 | 0.0% |
| Self-Employed (Not Incorporated) | 35 | 2.5% |
| Not-for-profit Organizations | 213 | 14.9% |
| Local Government Employees | 60 | 4.2% |
| State Government Employees | 16 | 1.1% |
| Federal Government Employees | 88 | 6.1% |
| Unpaid Family Workers | 0 | 0.0% |
| Total | 1,431 | 100.0% |
Employment Status by Age in Ravensworth
According to the labor force statistics for Ravensworth, out of the total population over 16 years of age (2,020), 75.2% or 1,519 individuals are in the labor force, with 4.6% or 70 of them unemployed. The age group with the highest labor force participation rate is 25 to 29 years, with 100.0% or 141 individuals in the labor force. Within the labor force, the 25 to 29 years age range has the highest percentage of unemployed individuals, with 48.9% or 69 of them being unemployed.
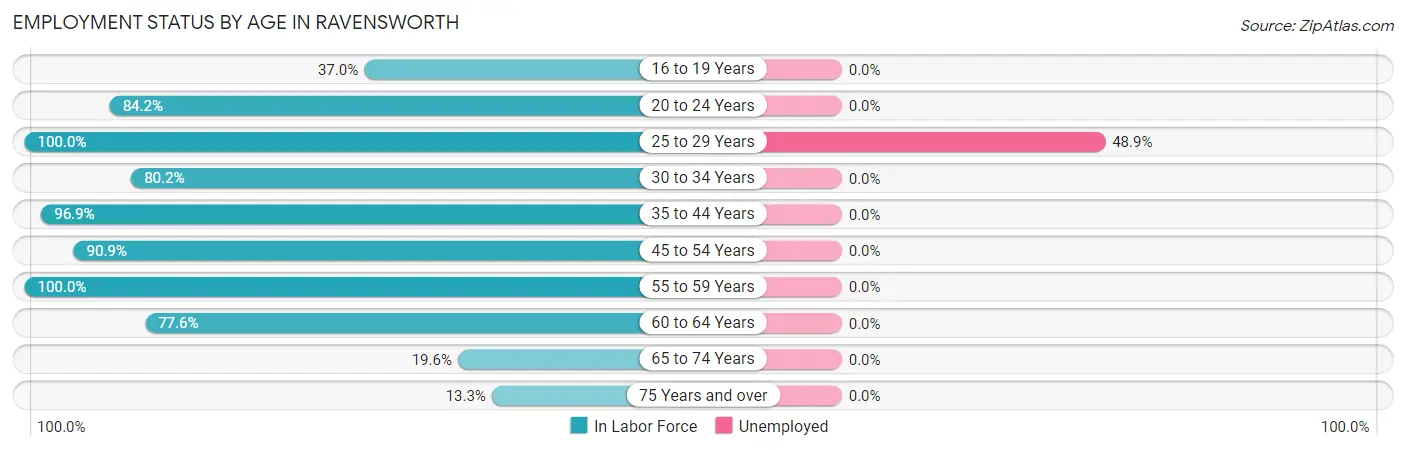
| Age Bracket | In Labor Force | Unemployed |
| 16 to 19 Years | 47 (37.0%) | 0 (0.0%) |
| 20 to 24 Years | 101 (84.2%) | 0 (0.0%) |
| 25 to 29 Years | 141 (100.0%) | 69 (48.9%) |
| 30 to 34 Years | 138 (80.2%) | 0 (0.0%) |
| 35 to 44 Years | 411 (96.9%) | 0 (0.0%) |
| 45 to 54 Years | 398 (90.9%) | 0 (0.0%) |
| 55 to 59 Years | 155 (100.0%) | 0 (0.0%) |
| 60 to 64 Years | 66 (77.6%) | 0 (0.0%) |
| 65 to 74 Years | 45 (19.6%) | 0 (0.0%) |
| 75 Years and over | 17 (13.3%) | 0 (0.0%) |
| Total | 1,519 (75.2%) | 70 (4.6%) |
Employment Status by Educational Attainment in Ravensworth
According to labor force statistics for Ravensworth, 92.5% of individuals (1,309) out of the total population between 25 and 64 years of age (1,415) are in the labor force, with 5.3% or 69 of them being unemployed. The group with the highest labor force participation rate are those with the educational attainment of bachelor's degree or higher, with 98.1% or 631 individuals in the labor force. Within the labor force, individuals with college / associate degree education have the highest percentage of unemployment, with 24.8% or 69 of them being unemployed.
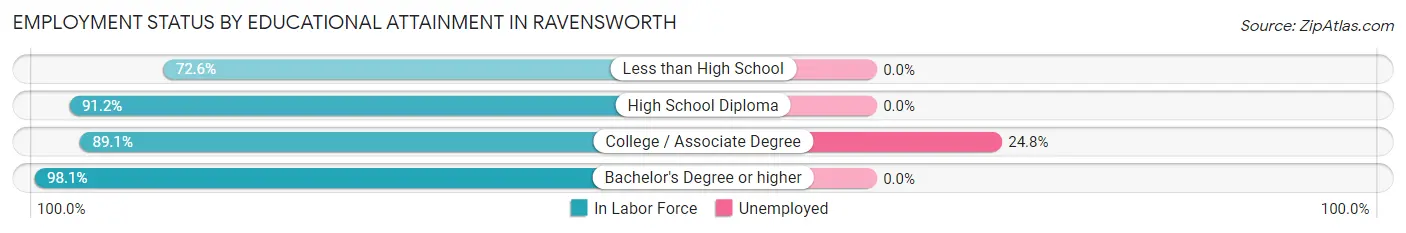
| Educational Attainment | In Labor Force | Unemployed |
| Less than High School | 77 (72.6%) | 0 (0.0%) |
| High School Diploma | 323 (91.2%) | 0 (0.0%) |
| College / Associate Degree | 278 (89.1%) | 77 (24.8%) |
| Bachelor's Degree or higher | 631 (98.1%) | 0 (0.0%) |
| Total | 1,309 (92.5%) | 75 (5.3%) |
Employment Occupations by Sex in Ravensworth
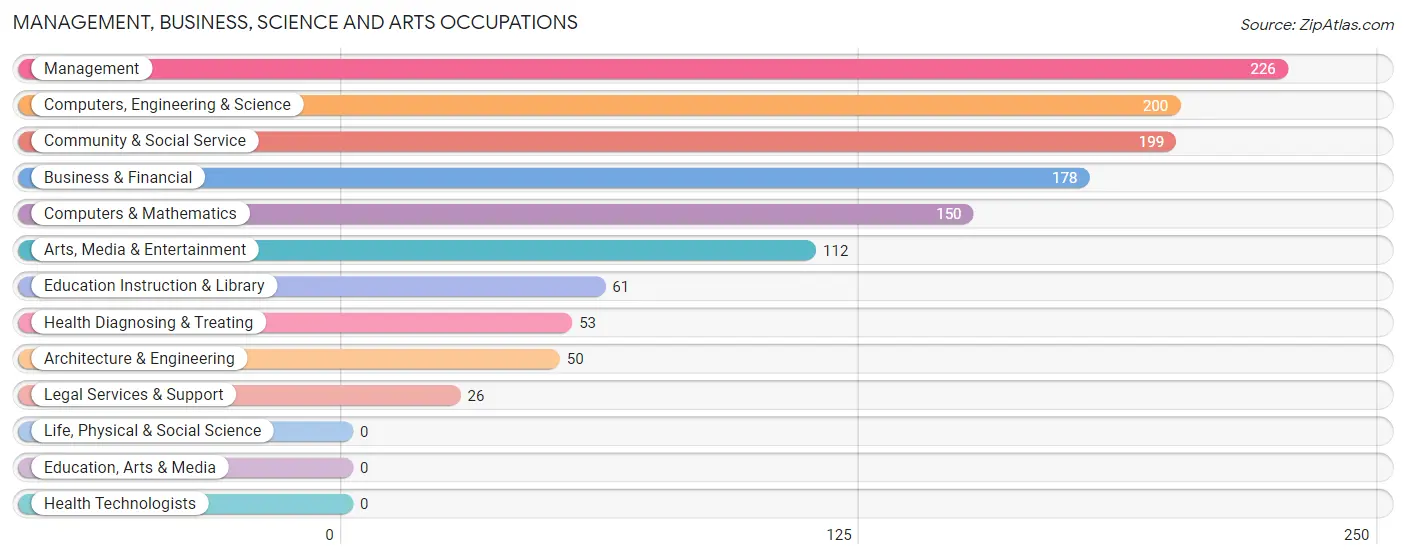
Management, Business, Science and Arts Occupations
The most common Management, Business, Science and Arts occupations in Ravensworth are Management (226 | 15.7%), Computers, Engineering & Science (200 | 13.9%), Community & Social Service (199 | 13.8%), Business & Financial (178 | 12.3%), and Computers & Mathematics (150 | 10.4%).
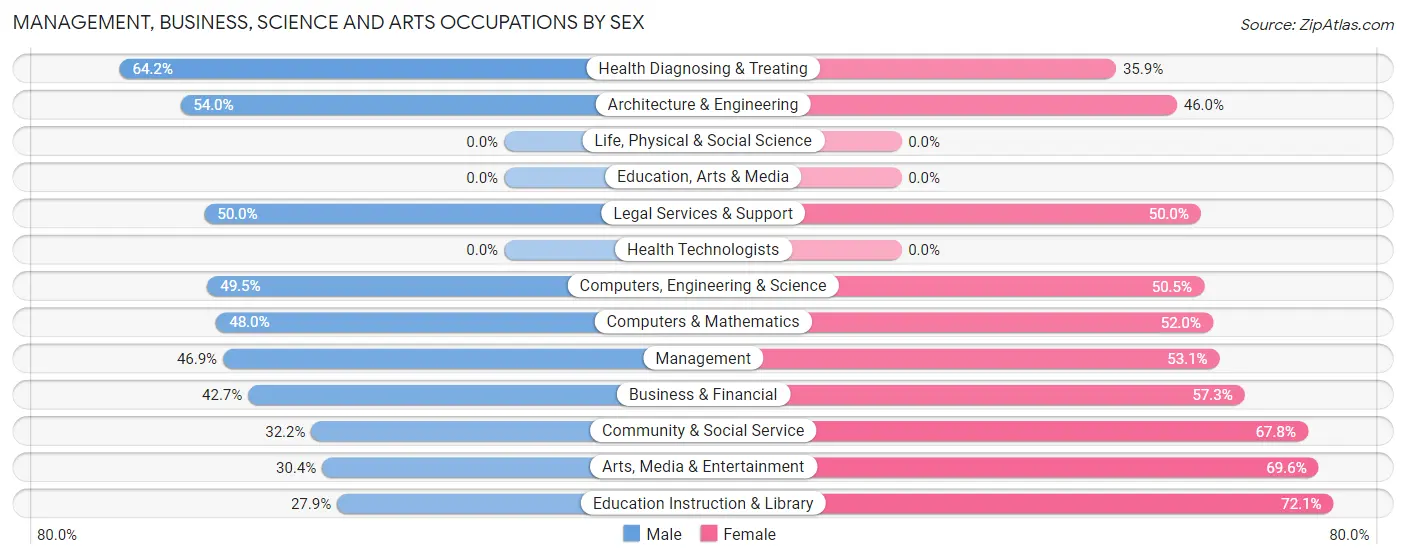
Management, Business, Science and Arts Occupations by Sex
Within the Management, Business, Science and Arts occupations in Ravensworth, the most male-oriented occupations are Health Diagnosing & Treating (64.1%), Architecture & Engineering (54.0%), and Legal Services & Support (50.0%), while the most female-oriented occupations are Education Instruction & Library (72.1%), Arts, Media & Entertainment (69.6%), and Community & Social Service (67.8%).
| Occupation | Male | Female |
| Management | 106 (46.9%) | 120 (53.1%) |
| Business & Financial | 76 (42.7%) | 102 (57.3%) |
| Computers, Engineering & Science | 99 (49.5%) | 101 (50.5%) |
| Computers & Mathematics | 72 (48.0%) | 78 (52.0%) |
| Architecture & Engineering | 27 (54.0%) | 23 (46.0%) |
| Life, Physical & Social Science | 0 (0.0%) | 0 (0.0%) |
| Community & Social Service | 64 (32.2%) | 135 (67.8%) |
| Education, Arts & Media | 0 (0.0%) | 0 (0.0%) |
| Legal Services & Support | 13 (50.0%) | 13 (50.0%) |
| Education Instruction & Library | 17 (27.9%) | 44 (72.1%) |
| Arts, Media & Entertainment | 34 (30.4%) | 78 (69.6%) |
| Health Diagnosing & Treating | 34 (64.1%) | 19 (35.8%) |
| Health Technologists | 0 (0.0%) | 0 (0.0%) |
| Total (Category) | 379 (44.3%) | 477 (55.7%) |
| Total (Overall) | 736 (51.0%) | 707 (49.0%) |
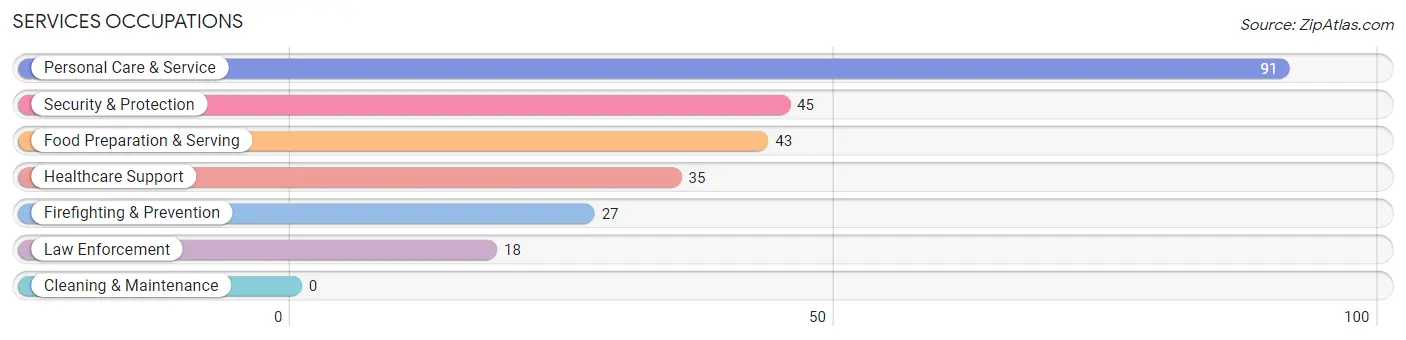
Services Occupations
The most common Services occupations in Ravensworth are Personal Care & Service (91 | 6.3%), Security & Protection (45 | 3.1%), Food Preparation & Serving (43 | 3.0%), Healthcare Support (35 | 2.4%), and Firefighting & Prevention (27 | 1.9%).
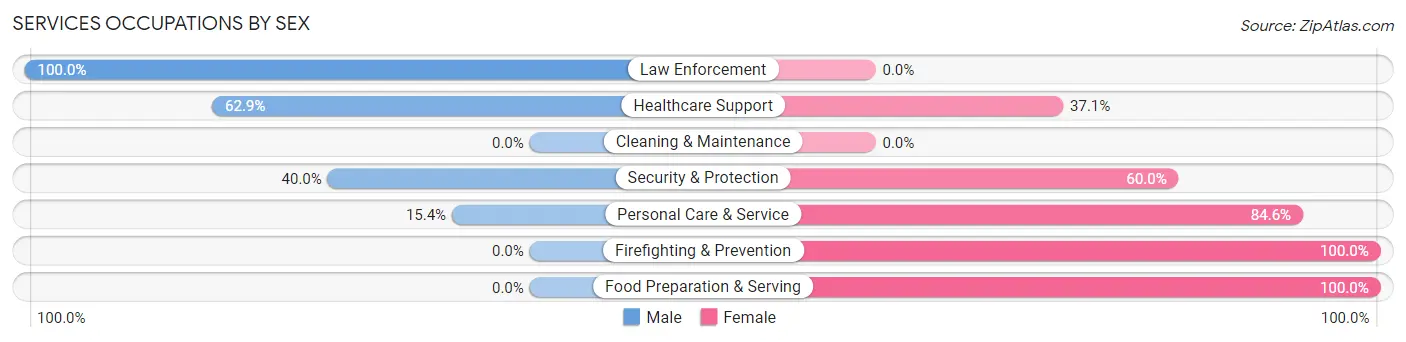
Services Occupations by Sex
Within the Services occupations in Ravensworth, the most male-oriented occupations are Law Enforcement (100.0%), Healthcare Support (62.9%), and Security & Protection (40.0%), while the most female-oriented occupations are Firefighting & Prevention (100.0%), Food Preparation & Serving (100.0%), and Personal Care & Service (84.6%).
| Occupation | Male | Female |
| Healthcare Support | 22 (62.9%) | 13 (37.1%) |
| Security & Protection | 18 (40.0%) | 27 (60.0%) |
| Firefighting & Prevention | 0 (0.0%) | 27 (100.0%) |
| Law Enforcement | 18 (100.0%) | 0 (0.0%) |
| Food Preparation & Serving | 0 (0.0%) | 43 (100.0%) |
| Cleaning & Maintenance | 0 (0.0%) | 0 (0.0%) |
| Personal Care & Service | 14 (15.4%) | 77 (84.6%) |
| Total (Category) | 54 (25.2%) | 160 (74.8%) |
| Total (Overall) | 736 (51.0%) | 707 (49.0%) |
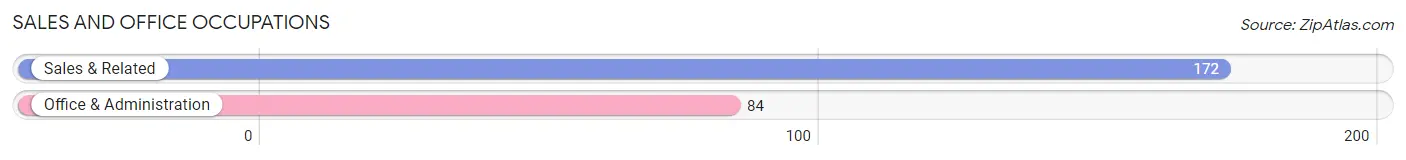
Sales and Office Occupations
The most common Sales and Office occupations in Ravensworth are Sales & Related (172 | 11.9%), and Office & Administration (84 | 5.8%).
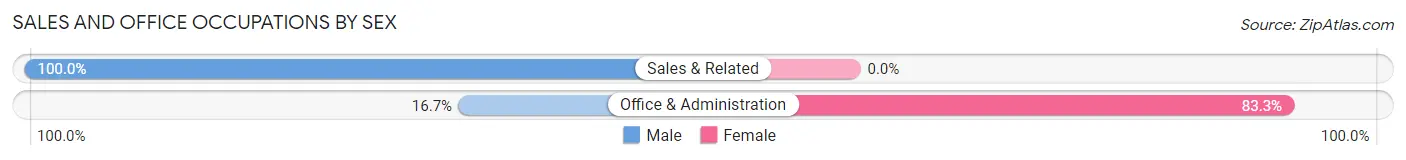
Sales and Office Occupations by Sex
| Occupation | Male | Female |
| Sales & Related | 172 (100.0%) | 0 (0.0%) |
| Office & Administration | 14 (16.7%) | 70 (83.3%) |
| Total (Category) | 186 (72.7%) | 70 (27.3%) |
| Total (Overall) | 736 (51.0%) | 707 (49.0%) |
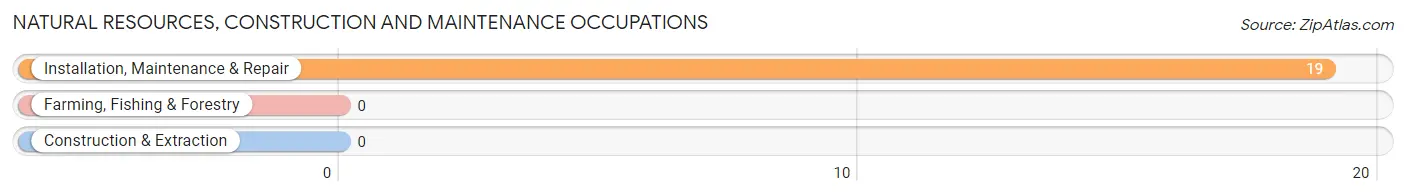
Natural Resources, Construction and Maintenance Occupations
The most common Natural Resources, Construction and Maintenance occupations in Ravensworth are , and Installation, Maintenance & Repair (19 | 1.3%).
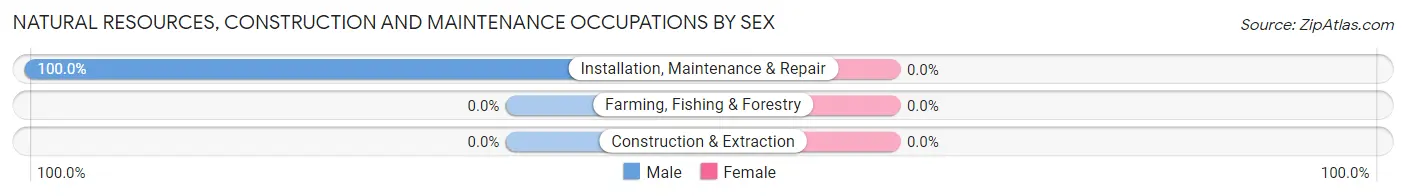
Natural Resources, Construction and Maintenance Occupations by Sex
| Occupation | Male | Female |
| Farming, Fishing & Forestry | 0 (0.0%) | 0 (0.0%) |
| Construction & Extraction | 0 (0.0%) | 0 (0.0%) |
| Installation, Maintenance & Repair | 19 (100.0%) | 0 (0.0%) |
| Total (Category) | 19 (100.0%) | 0 (0.0%) |
| Total (Overall) | 736 (51.0%) | 707 (49.0%) |
Production, Transportation and Moving Occupations
The most common Production, Transportation and Moving occupations in Ravensworth are Production (82 | 5.7%), and Transportation (16 | 1.1%).
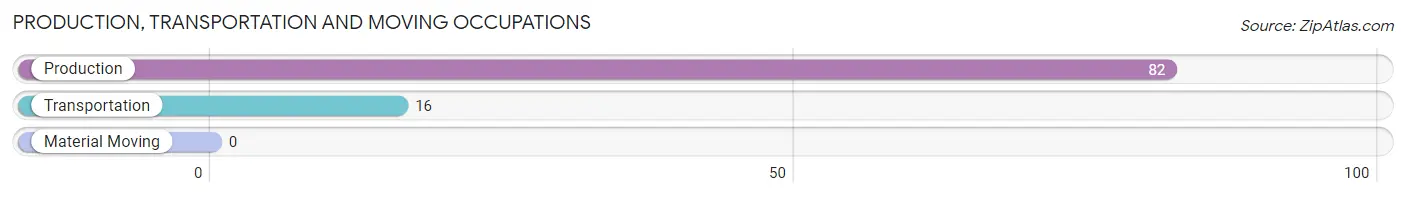
Production, Transportation and Moving Occupations by Sex
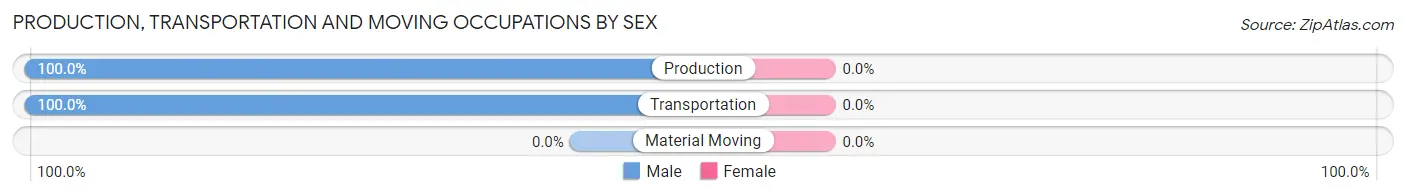
| Occupation | Male | Female |
| Production | 82 (100.0%) | 0 (0.0%) |
| Transportation | 16 (100.0%) | 0 (0.0%) |
| Material Moving | 0 (0.0%) | 0 (0.0%) |
| Total (Category) | 98 (100.0%) | 0 (0.0%) |
| Total (Overall) | 736 (51.0%) | 707 (49.0%) |
Employment Industries by Sex in Ravensworth
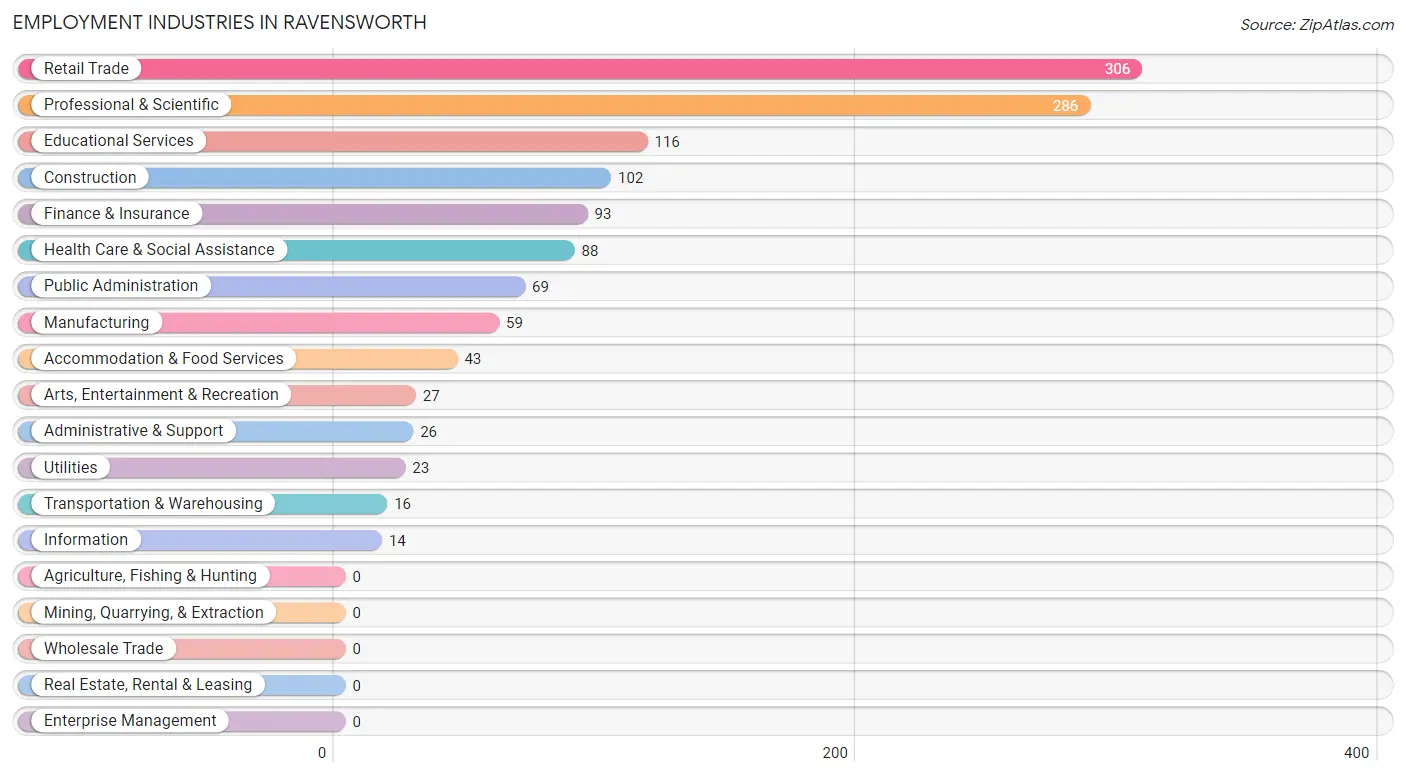
Employment Industries in Ravensworth
The major employment industries in Ravensworth include Retail Trade (306 | 21.2%), Professional & Scientific (286 | 19.8%), Educational Services (116 | 8.0%), Construction (102 | 7.1%), and Finance & Insurance (93 | 6.4%).
Employment Industries by Sex in Ravensworth
The Ravensworth industries that see more men than women are Transportation & Warehousing (100.0%), Information (100.0%), and Retail Trade (84.3%), whereas the industries that tend to have a higher number of women are Utilities (100.0%), Administrative & Support (100.0%), and Arts, Entertainment & Recreation (100.0%).
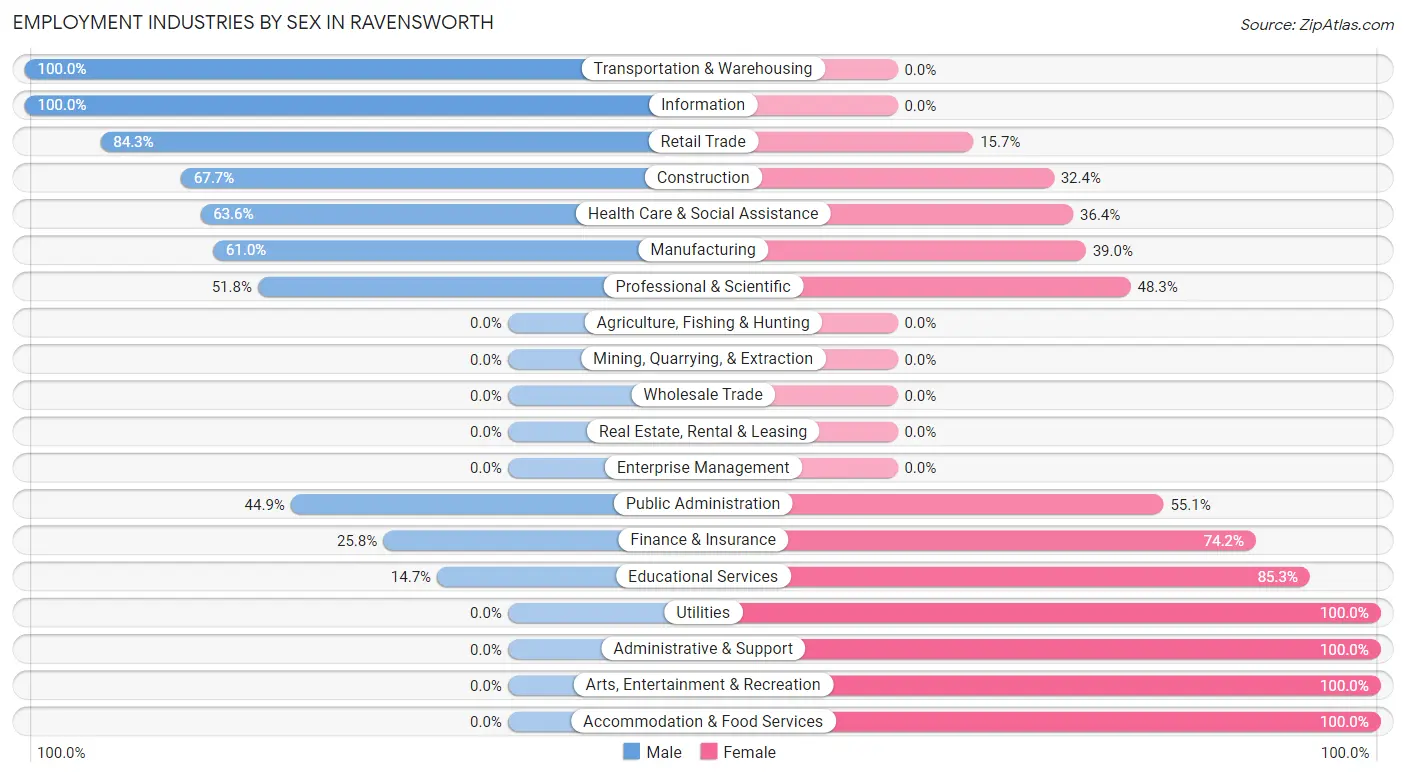
| Industry | Male | Female |
| Agriculture, Fishing & Hunting | 0 (0.0%) | 0 (0.0%) |
| Mining, Quarrying, & Extraction | 0 (0.0%) | 0 (0.0%) |
| Construction | 69 (67.6%) | 33 (32.4%) |
| Manufacturing | 36 (61.0%) | 23 (39.0%) |
| Wholesale Trade | 0 (0.0%) | 0 (0.0%) |
| Retail Trade | 258 (84.3%) | 48 (15.7%) |
| Transportation & Warehousing | 16 (100.0%) | 0 (0.0%) |
| Utilities | 0 (0.0%) | 23 (100.0%) |
| Information | 14 (100.0%) | 0 (0.0%) |
| Finance & Insurance | 24 (25.8%) | 69 (74.2%) |
| Real Estate, Rental & Leasing | 0 (0.0%) | 0 (0.0%) |
| Professional & Scientific | 148 (51.7%) | 138 (48.2%) |
| Enterprise Management | 0 (0.0%) | 0 (0.0%) |
| Administrative & Support | 0 (0.0%) | 26 (100.0%) |
| Educational Services | 17 (14.7%) | 99 (85.3%) |
| Health Care & Social Assistance | 56 (63.6%) | 32 (36.4%) |
| Arts, Entertainment & Recreation | 0 (0.0%) | 27 (100.0%) |
| Accommodation & Food Services | 0 (0.0%) | 43 (100.0%) |
| Public Administration | 31 (44.9%) | 38 (55.1%) |
| Total | 736 (51.0%) | 707 (49.0%) |
Education in Ravensworth
School Enrollment in Ravensworth
The most common levels of schooling among the 653 students in Ravensworth are high school (210 | 32.2%), middle school (122 | 18.7%), and elementary school (116 | 17.8%).
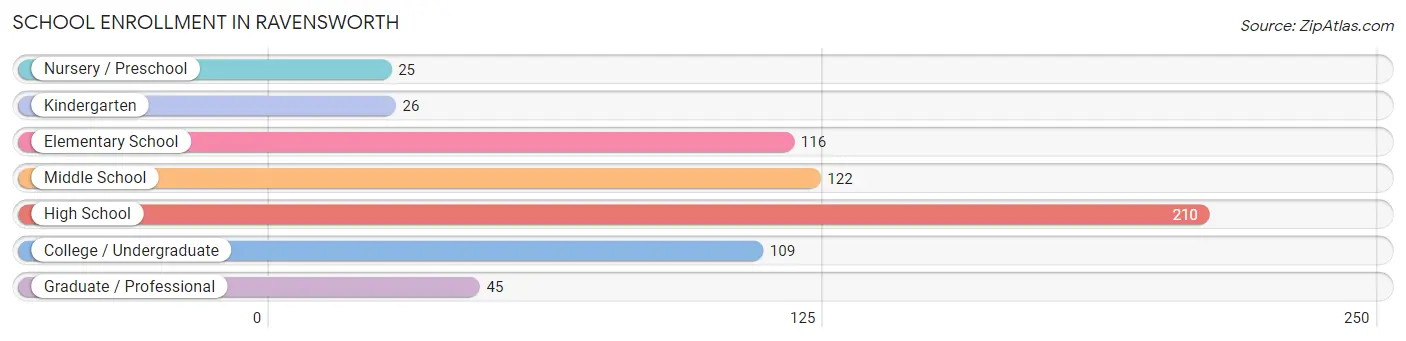
| School Level | # Students | % Students |
| Nursery / Preschool | 25 | 3.8% |
| Kindergarten | 26 | 4.0% |
| Elementary School | 116 | 17.8% |
| Middle School | 122 | 18.7% |
| High School | 210 | 32.2% |
| College / Undergraduate | 109 | 16.7% |
| Graduate / Professional | 45 | 6.9% |
| Total | 653 | 100.0% |
School Enrollment by Age by Funding Source in Ravensworth
Out of a total of 653 students who are enrolled in schools in Ravensworth, 115 (17.6%) attend a private institution, while the remaining 538 (82.4%) are enrolled in public schools. The age group of 3 to 4 year olds has the highest likelihood of being enrolled in private schools, with 13 (100.0% in the age bracket) enrolled. Conversely, the age group of 10 to 14 year olds has the lowest likelihood of being enrolled in a private school, with 165 (100.0% in the age bracket) attending a public institution.
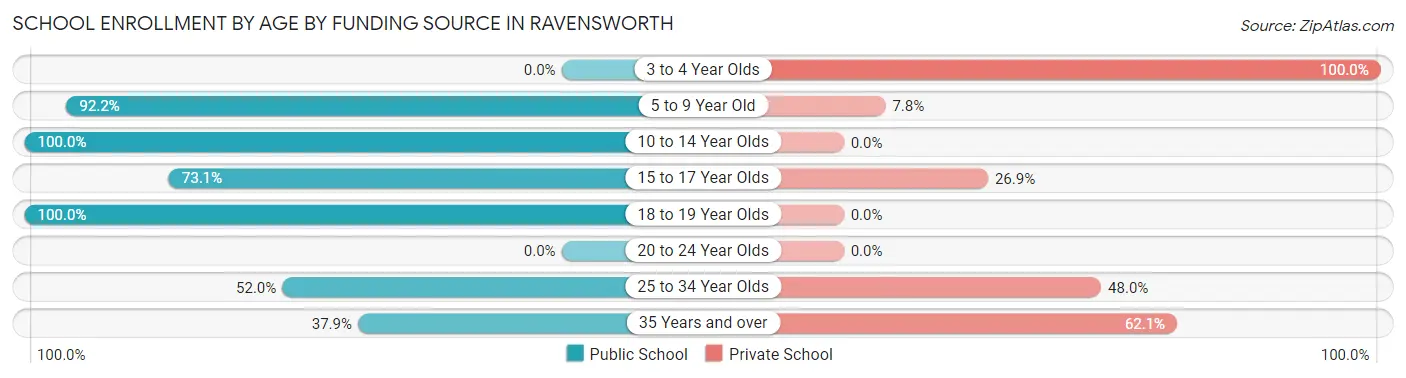
| Age Bracket | Public School | Private School |
| 3 to 4 Year Olds | 0 (0.0%) | 13 (100.0%) |
| 5 to 9 Year Old | 142 (92.2%) | 12 (7.8%) |
| 10 to 14 Year Olds | 165 (100.0%) | 0 (0.0%) |
| 15 to 17 Year Olds | 68 (73.1%) | 25 (26.9%) |
| 18 to 19 Year Olds | 101 (100.0%) | 0 (0.0%) |
| 20 to 24 Year Olds | 0 (0.0%) | 0 (0.0%) |
| 25 to 34 Year Olds | 51 (52.0%) | 47 (48.0%) |
| 35 Years and over | 11 (37.9%) | 18 (62.1%) |
| Total | 538 (82.4%) | 115 (17.6%) |
Educational Attainment by Field of Study in Ravensworth
Social sciences (197 | 21.6%), engineering (167 | 18.3%), business (147 | 16.1%), education (122 | 13.4%), and communications (93 | 10.2%) are the most common fields of study among 911 individuals in Ravensworth who have obtained a bachelor's degree or higher.
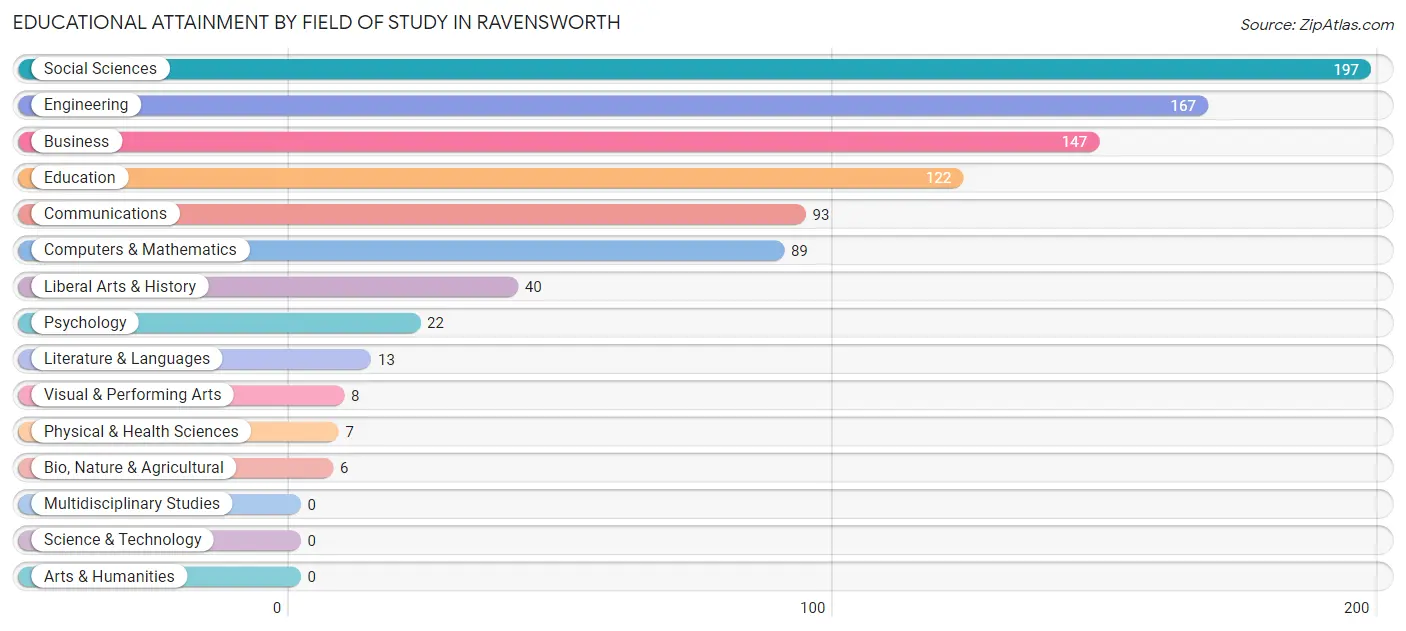
| Field of Study | # Graduates | % Graduates |
| Computers & Mathematics | 89 | 9.8% |
| Bio, Nature & Agricultural | 6 | 0.7% |
| Physical & Health Sciences | 7 | 0.8% |
| Psychology | 22 | 2.4% |
| Social Sciences | 197 | 21.6% |
| Engineering | 167 | 18.3% |
| Multidisciplinary Studies | 0 | 0.0% |
| Science & Technology | 0 | 0.0% |
| Business | 147 | 16.1% |
| Education | 122 | 13.4% |
| Literature & Languages | 13 | 1.4% |
| Liberal Arts & History | 40 | 4.4% |
| Visual & Performing Arts | 8 | 0.9% |
| Communications | 93 | 10.2% |
| Arts & Humanities | 0 | 0.0% |
| Total | 911 | 100.0% |
Transportation & Commute in Ravensworth
Vehicle Availability by Sex in Ravensworth
The most prevalent vehicle ownership categories in Ravensworth are males with 5 or more vehicles (250, accounting for 33.7%) and females with 5 or more vehicles (92, making up 36.3%).
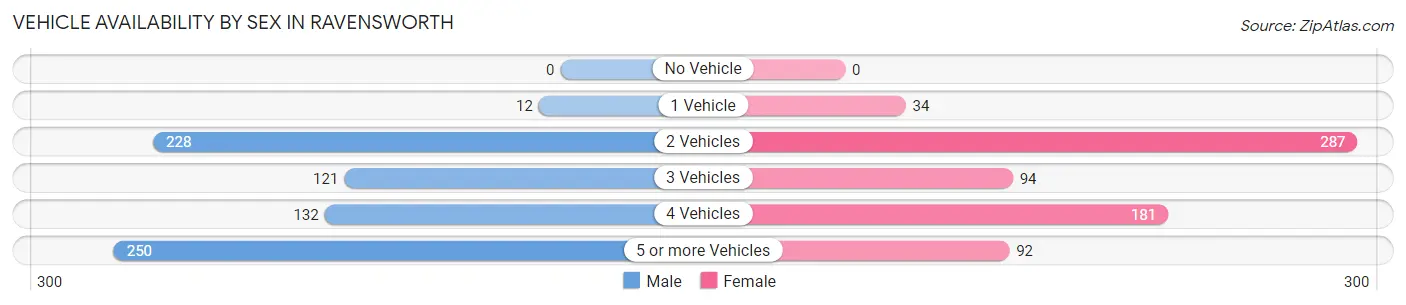
| Vehicles Available | Male | Female |
| No Vehicle | 0 (0.0%) | 0 (0.0%) |
| 1 Vehicle | 12 (1.6%) | 34 (4.9%) |
| 2 Vehicles | 228 (30.7%) | 287 (41.7%) |
| 3 Vehicles | 121 (16.3%) | 94 (13.7%) |
| 4 Vehicles | 132 (17.8%) | 181 (26.3%) |
| 5 or more Vehicles | 250 (33.7%) | 92 (13.4%) |
| Total | 743 (100.0%) | 688 (100.0%) |
Commute Time in Ravensworth
The most frequently occuring commute durations in Ravensworth are 15 to 19 minutes (248 commuters, 20.9%), 20 to 24 minutes (224 commuters, 18.8%), and 30 to 34 minutes (192 commuters, 16.2%).
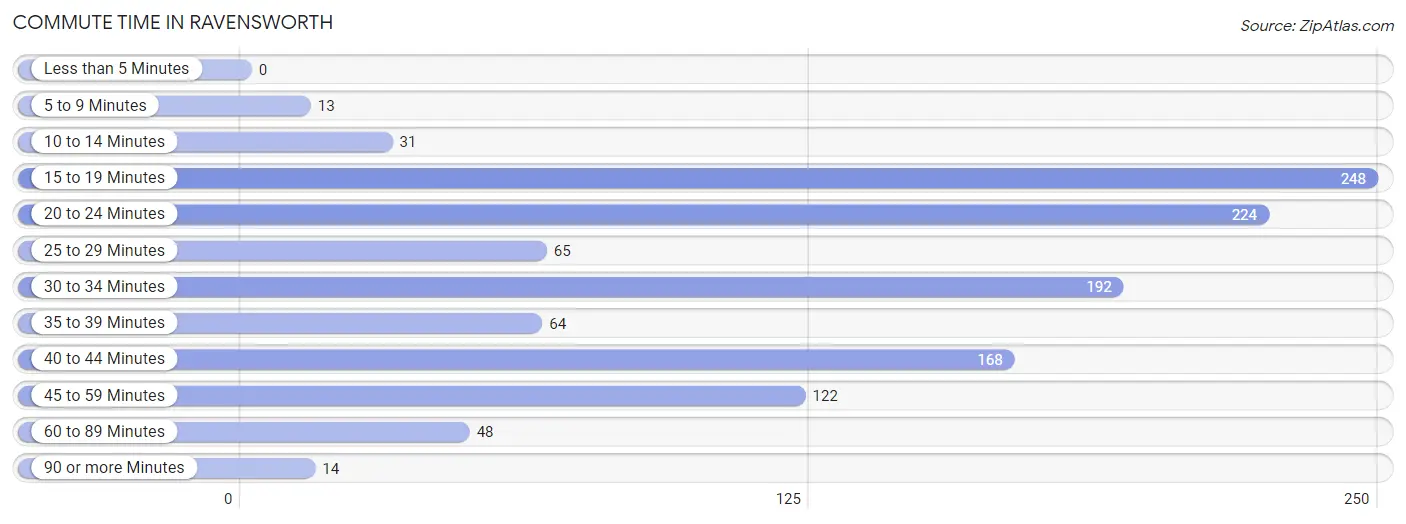
| Commute Time | # Commuters | % Commuters |
| Less than 5 Minutes | 0 | 0.0% |
| 5 to 9 Minutes | 13 | 1.1% |
| 10 to 14 Minutes | 31 | 2.6% |
| 15 to 19 Minutes | 248 | 20.9% |
| 20 to 24 Minutes | 224 | 18.8% |
| 25 to 29 Minutes | 65 | 5.5% |
| 30 to 34 Minutes | 192 | 16.2% |
| 35 to 39 Minutes | 64 | 5.4% |
| 40 to 44 Minutes | 168 | 14.1% |
| 45 to 59 Minutes | 122 | 10.3% |
| 60 to 89 Minutes | 48 | 4.0% |
| 90 or more Minutes | 14 | 1.2% |
Commute Time by Sex in Ravensworth
The most common commute times in Ravensworth are 30 to 34 minutes (116 commuters, 19.4%) for males and 15 to 19 minutes (144 commuters, 24.4%) for females.
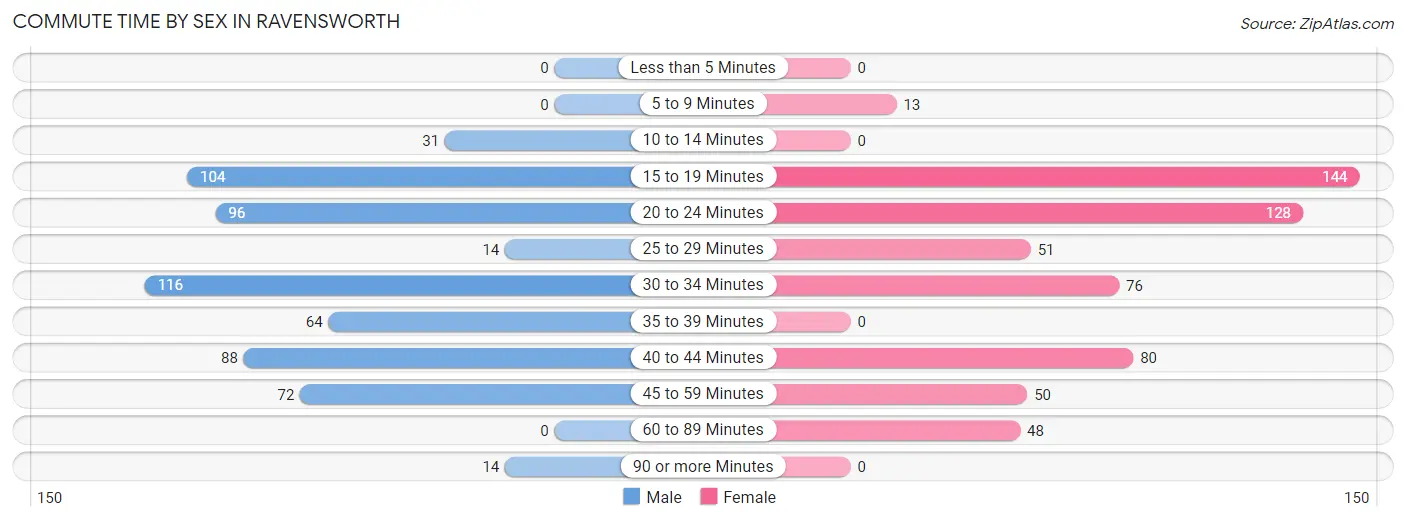
| Commute Time | Male | Female |
| Less than 5 Minutes | 0 (0.0%) | 0 (0.0%) |
| 5 to 9 Minutes | 0 (0.0%) | 13 (2.2%) |
| 10 to 14 Minutes | 31 (5.2%) | 0 (0.0%) |
| 15 to 19 Minutes | 104 (17.4%) | 144 (24.4%) |
| 20 to 24 Minutes | 96 (16.0%) | 128 (21.7%) |
| 25 to 29 Minutes | 14 (2.3%) | 51 (8.6%) |
| 30 to 34 Minutes | 116 (19.4%) | 76 (12.9%) |
| 35 to 39 Minutes | 64 (10.7%) | 0 (0.0%) |
| 40 to 44 Minutes | 88 (14.7%) | 80 (13.6%) |
| 45 to 59 Minutes | 72 (12.0%) | 50 (8.5%) |
| 60 to 89 Minutes | 0 (0.0%) | 48 (8.1%) |
| 90 or more Minutes | 14 (2.3%) | 0 (0.0%) |
Time of Departure to Work by Sex in Ravensworth
The most frequent times of departure to work in Ravensworth are 7:30 AM to 7:59 AM (176, 29.4%) for males and 7:00 AM to 7:29 AM (117, 19.8%) for females.
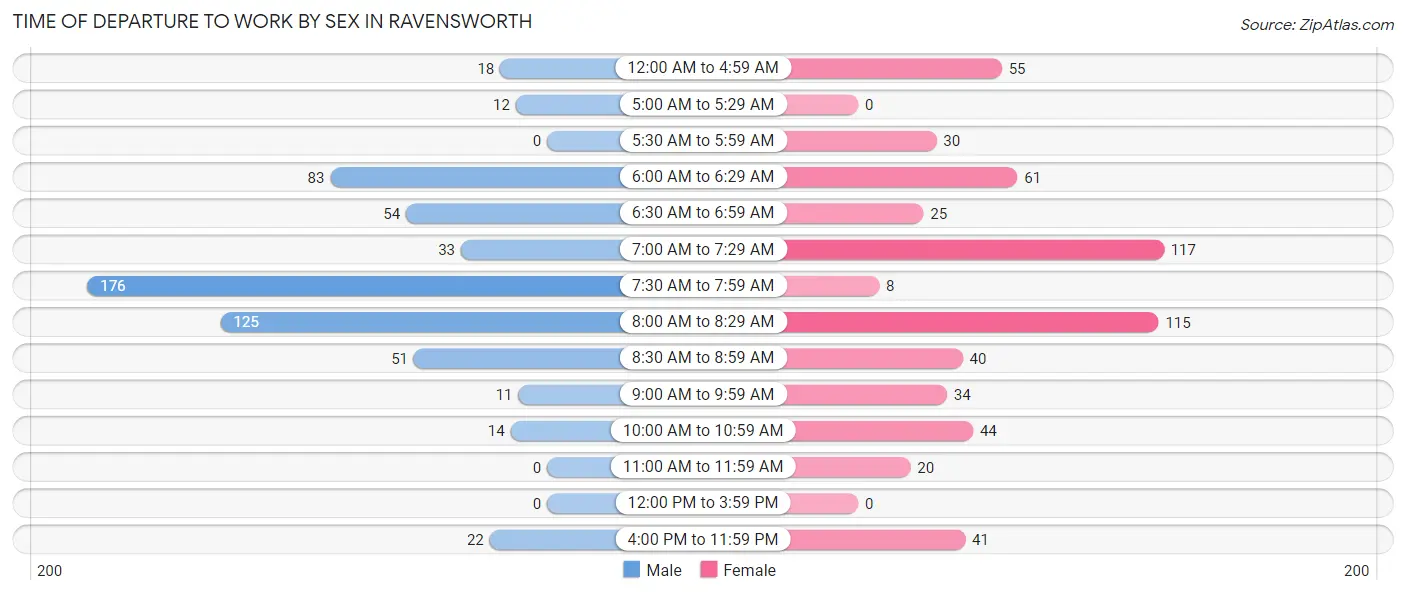
| Time of Departure | Male | Female |
| 12:00 AM to 4:59 AM | 18 (3.0%) | 55 (9.3%) |
| 5:00 AM to 5:29 AM | 12 (2.0%) | 0 (0.0%) |
| 5:30 AM to 5:59 AM | 0 (0.0%) | 30 (5.1%) |
| 6:00 AM to 6:29 AM | 83 (13.9%) | 61 (10.3%) |
| 6:30 AM to 6:59 AM | 54 (9.0%) | 25 (4.2%) |
| 7:00 AM to 7:29 AM | 33 (5.5%) | 117 (19.8%) |
| 7:30 AM to 7:59 AM | 176 (29.4%) | 8 (1.4%) |
| 8:00 AM to 8:29 AM | 125 (20.9%) | 115 (19.5%) |
| 8:30 AM to 8:59 AM | 51 (8.5%) | 40 (6.8%) |
| 9:00 AM to 9:59 AM | 11 (1.8%) | 34 (5.8%) |
| 10:00 AM to 10:59 AM | 14 (2.3%) | 44 (7.5%) |
| 11:00 AM to 11:59 AM | 0 (0.0%) | 20 (3.4%) |
| 12:00 PM to 3:59 PM | 0 (0.0%) | 0 (0.0%) |
| 4:00 PM to 11:59 PM | 22 (3.7%) | 41 (7.0%) |
| Total | 599 (100.0%) | 590 (100.0%) |
Housing Occupancy in Ravensworth
Occupancy by Ownership in Ravensworth
Of the total 848 dwellings in Ravensworth, owner-occupied units account for 730 (86.1%), while renter-occupied units make up 118 (13.9%).
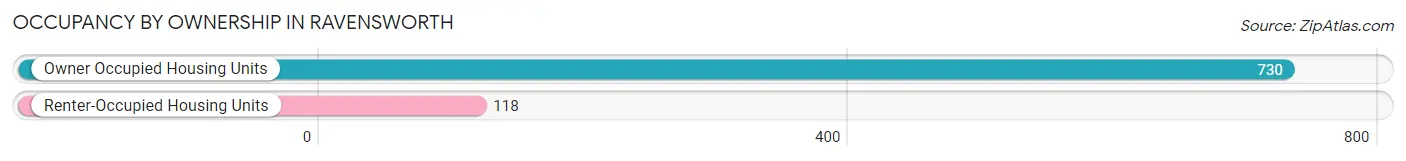
| Occupancy | # Housing Units | % Housing Units |
| Owner Occupied Housing Units | 730 | 86.1% |
| Renter-Occupied Housing Units | 118 | 13.9% |
| Total Occupied Housing Units | 848 | 100.0% |
Occupancy by Household Size in Ravensworth
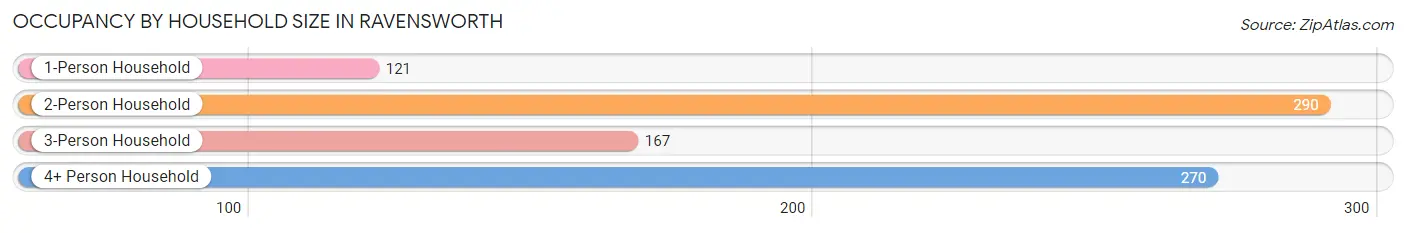
| Household Size | # Housing Units | % Housing Units |
| 1-Person Household | 121 | 14.3% |
| 2-Person Household | 290 | 34.2% |
| 3-Person Household | 167 | 19.7% |
| 4+ Person Household | 270 | 31.8% |
| Total Housing Units | 848 | 100.0% |
Occupancy by Ownership by Household Size in Ravensworth
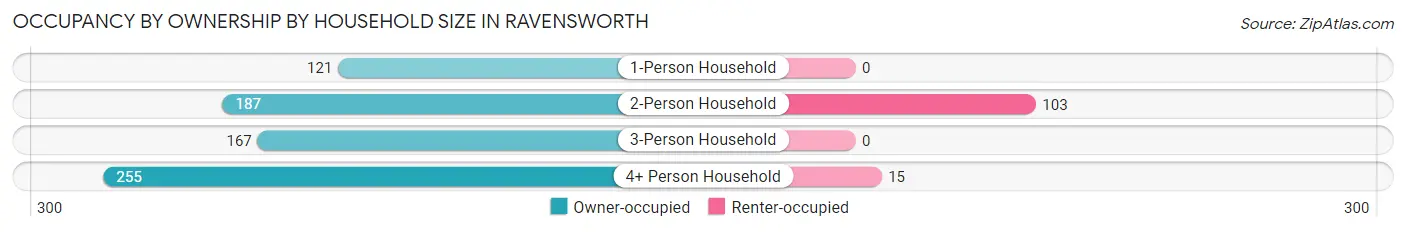
| Household Size | Owner-occupied | Renter-occupied |
| 1-Person Household | 121 (100.0%) | 0 (0.0%) |
| 2-Person Household | 187 (64.5%) | 103 (35.5%) |
| 3-Person Household | 167 (100.0%) | 0 (0.0%) |
| 4+ Person Household | 255 (94.4%) | 15 (5.6%) |
| Total Housing Units | 730 (86.1%) | 118 (13.9%) |
Occupancy by Educational Attainment in Ravensworth
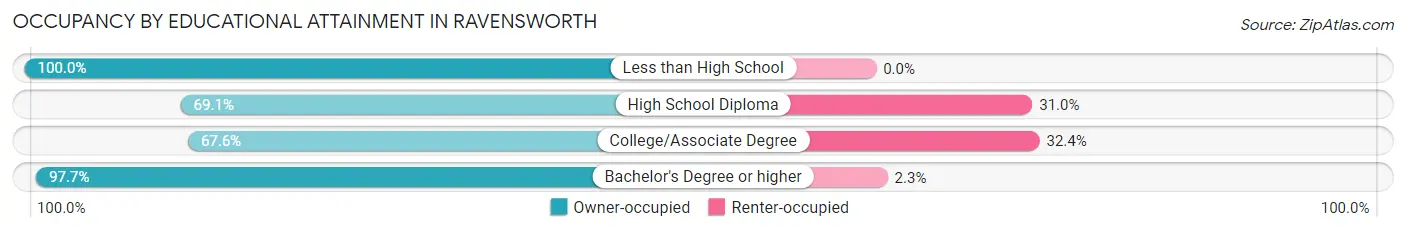
| Household Size | Owner-occupied | Renter-occupied |
| Less than High School | 71 (100.0%) | 0 (0.0%) |
| High School Diploma | 87 (69.1%) | 39 (30.9%) |
| College/Associate Degree | 144 (67.6%) | 69 (32.4%) |
| Bachelor's Degree or higher | 428 (97.7%) | 10 (2.3%) |
Occupancy by Age of Householder in Ravensworth
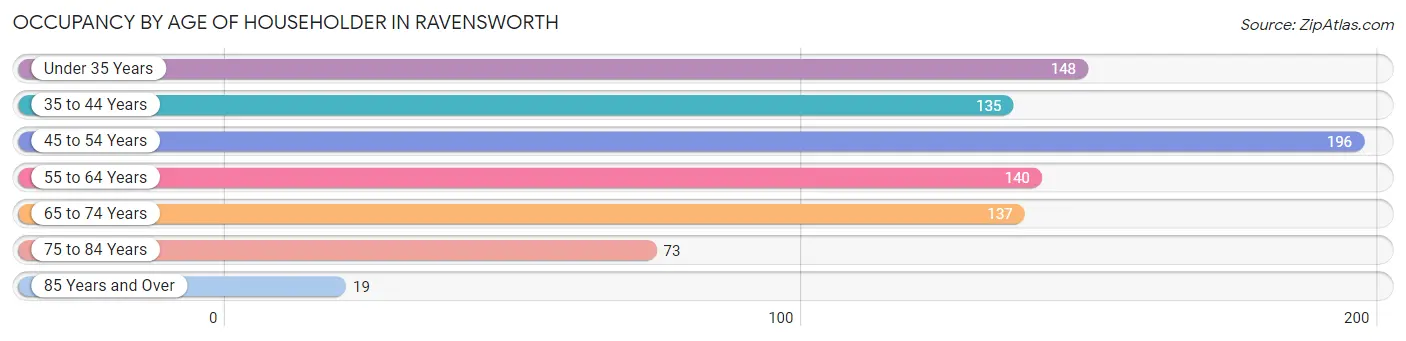
| Age Bracket | # Households | % Households |
| Under 35 Years | 148 | 17.4% |
| 35 to 44 Years | 135 | 15.9% |
| 45 to 54 Years | 196 | 23.1% |
| 55 to 64 Years | 140 | 16.5% |
| 65 to 74 Years | 137 | 16.2% |
| 75 to 84 Years | 73 | 8.6% |
| 85 Years and Over | 19 | 2.2% |
| Total | 848 | 100.0% |
Housing Finances in Ravensworth
Median Income by Occupancy in Ravensworth
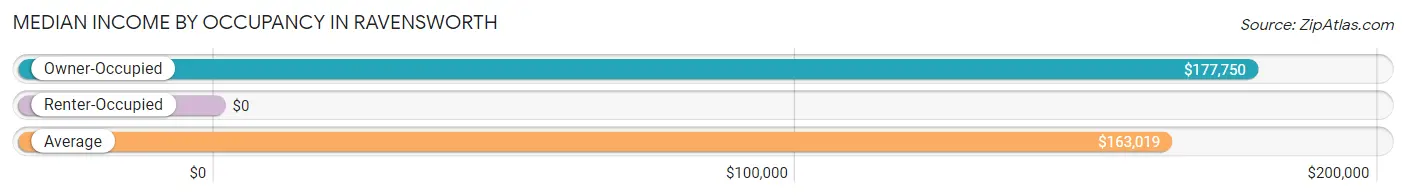
| Occupancy Type | # Households | Median Income |
| Owner-Occupied | 730 (86.1%) | $177,750 |
| Renter-Occupied | 118 (13.9%) | $0 |
| Average | 848 (100.0%) | $163,019 |
Occupancy by Householder Income Bracket in Ravensworth
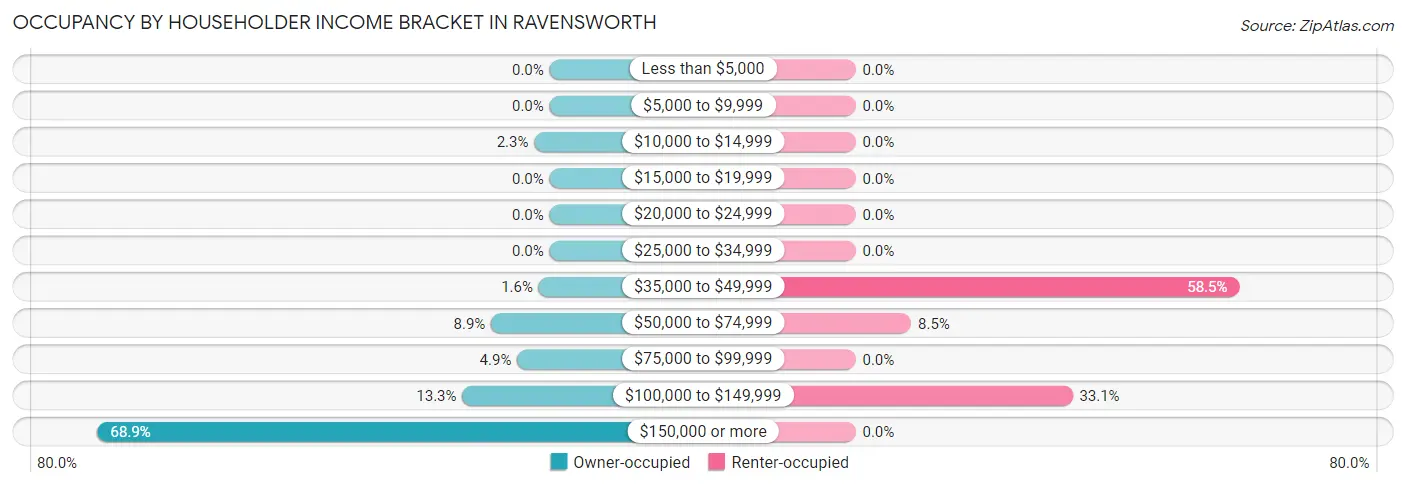
| Income Bracket | Owner-occupied | Renter-occupied |
| Less than $5,000 | 0 (0.0%) | 0 (0.0%) |
| $5,000 to $9,999 | 0 (0.0%) | 0 (0.0%) |
| $10,000 to $14,999 | 17 (2.3%) | 0 (0.0%) |
| $15,000 to $19,999 | 0 (0.0%) | 0 (0.0%) |
| $20,000 to $24,999 | 0 (0.0%) | 0 (0.0%) |
| $25,000 to $34,999 | 0 (0.0%) | 0 (0.0%) |
| $35,000 to $49,999 | 12 (1.6%) | 69 (58.5%) |
| $50,000 to $74,999 | 65 (8.9%) | 10 (8.5%) |
| $75,000 to $99,999 | 36 (4.9%) | 0 (0.0%) |
| $100,000 to $149,999 | 97 (13.3%) | 39 (33.1%) |
| $150,000 or more | 503 (68.9%) | 0 (0.0%) |
| Total | 730 (100.0%) | 118 (100.0%) |
Monthly Housing Cost Tiers in Ravensworth
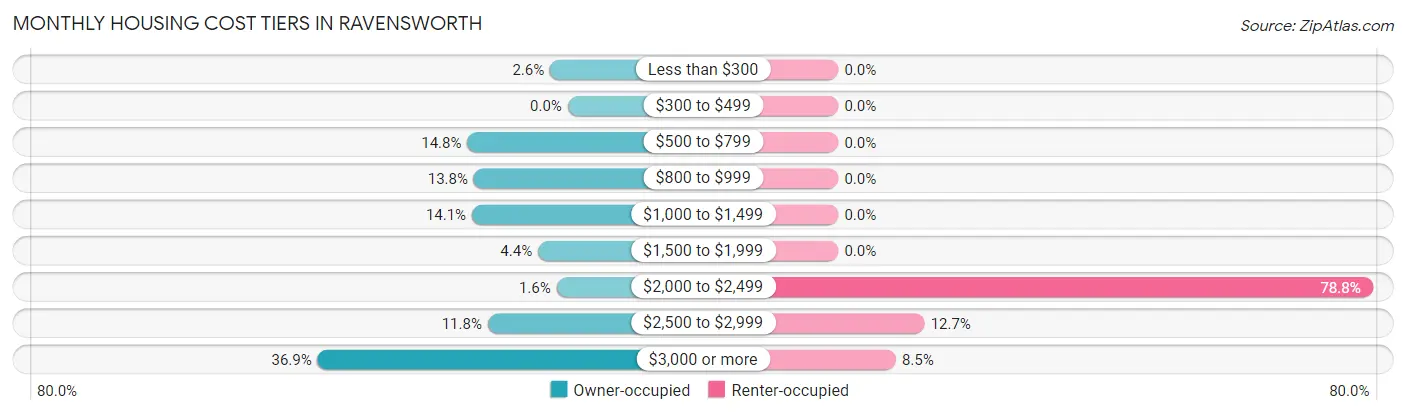
| Monthly Cost | Owner-occupied | Renter-occupied |
| Less than $300 | 19 (2.6%) | 0 (0.0%) |
| $300 to $499 | 0 (0.0%) | 0 (0.0%) |
| $500 to $799 | 108 (14.8%) | 0 (0.0%) |
| $800 to $999 | 101 (13.8%) | 0 (0.0%) |
| $1,000 to $1,499 | 103 (14.1%) | 0 (0.0%) |
| $1,500 to $1,999 | 32 (4.4%) | 0 (0.0%) |
| $2,000 to $2,499 | 12 (1.6%) | 93 (78.8%) |
| $2,500 to $2,999 | 86 (11.8%) | 15 (12.7%) |
| $3,000 or more | 269 (36.8%) | 10 (8.5%) |
| Total | 730 (100.0%) | 118 (100.0%) |
Physical Housing Characteristics in Ravensworth
Housing Structures in Ravensworth
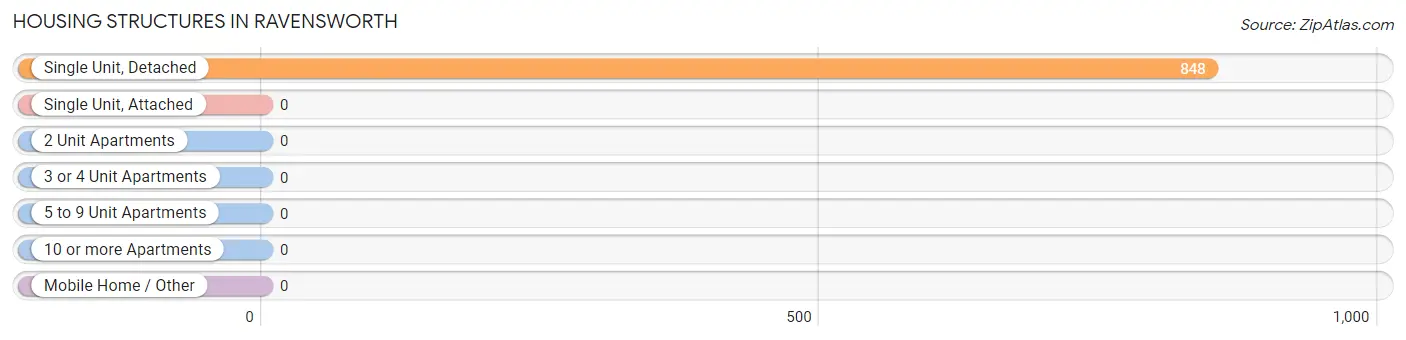
| Structure Type | # Housing Units | % Housing Units |
| Single Unit, Detached | 848 | 100.0% |
| Single Unit, Attached | 0 | 0.0% |
| 2 Unit Apartments | 0 | 0.0% |
| 3 or 4 Unit Apartments | 0 | 0.0% |
| 5 to 9 Unit Apartments | 0 | 0.0% |
| 10 or more Apartments | 0 | 0.0% |
| Mobile Home / Other | 0 | 0.0% |
| Total | 848 | 100.0% |
Housing Structures by Occupancy in Ravensworth
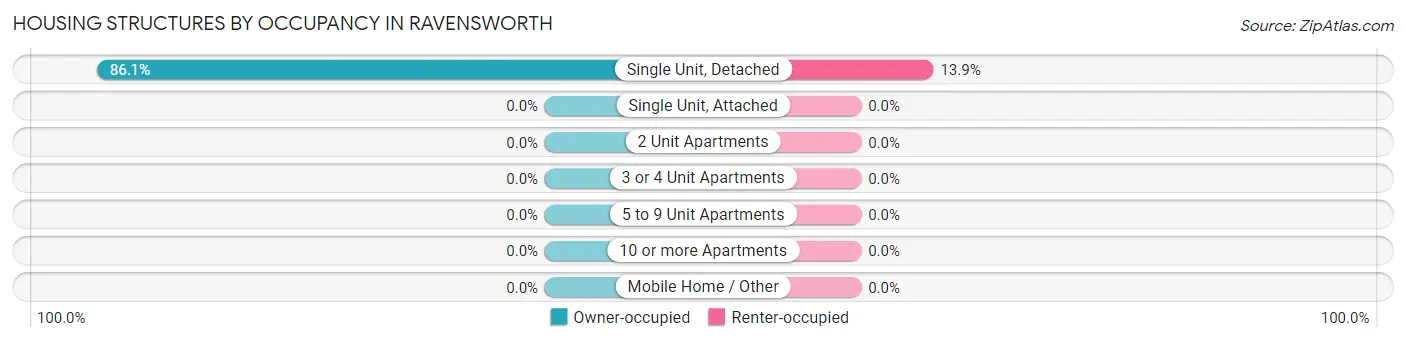
| Structure Type | Owner-occupied | Renter-occupied |
| Single Unit, Detached | 730 (86.1%) | 118 (13.9%) |
| Single Unit, Attached | 0 (0.0%) | 0 (0.0%) |
| 2 Unit Apartments | 0 (0.0%) | 0 (0.0%) |
| 3 or 4 Unit Apartments | 0 (0.0%) | 0 (0.0%) |
| 5 to 9 Unit Apartments | 0 (0.0%) | 0 (0.0%) |
| 10 or more Apartments | 0 (0.0%) | 0 (0.0%) |
| Mobile Home / Other | 0 (0.0%) | 0 (0.0%) |
| Total | 730 (86.1%) | 118 (13.9%) |
Housing Structures by Number of Rooms in Ravensworth
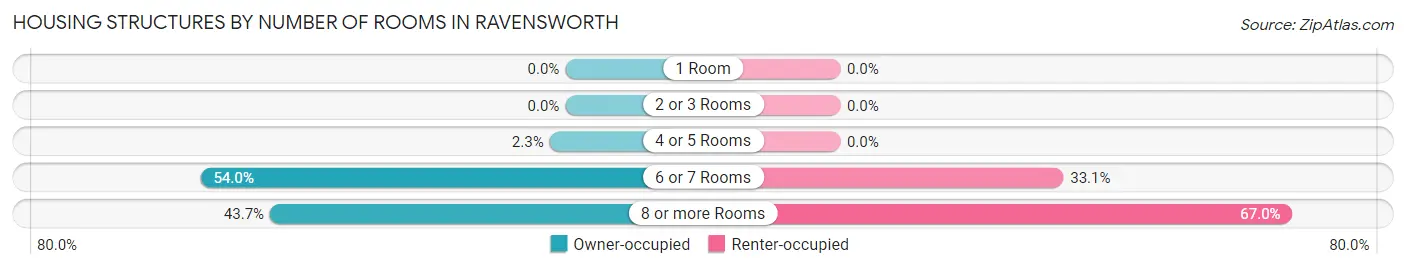
| Number of Rooms | Owner-occupied | Renter-occupied |
| 1 Room | 0 (0.0%) | 0 (0.0%) |
| 2 or 3 Rooms | 0 (0.0%) | 0 (0.0%) |
| 4 or 5 Rooms | 17 (2.3%) | 0 (0.0%) |
| 6 or 7 Rooms | 394 (54.0%) | 39 (33.1%) |
| 8 or more Rooms | 319 (43.7%) | 79 (66.9%) |
| Total | 730 (100.0%) | 118 (100.0%) |
Housing Structure by Heating Type in Ravensworth
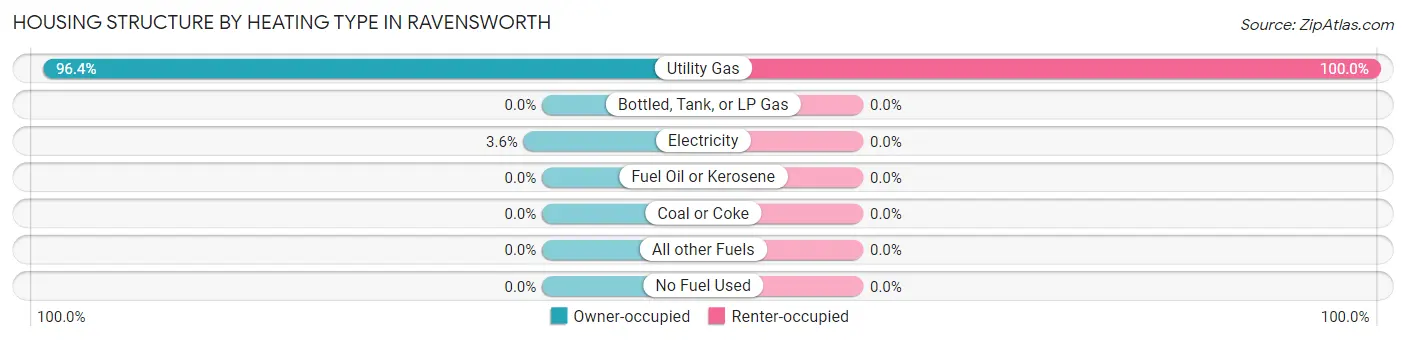
| Heating Type | Owner-occupied | Renter-occupied |
| Utility Gas | 704 (96.4%) | 118 (100.0%) |
| Bottled, Tank, or LP Gas | 0 (0.0%) | 0 (0.0%) |
| Electricity | 26 (3.6%) | 0 (0.0%) |
| Fuel Oil or Kerosene | 0 (0.0%) | 0 (0.0%) |
| Coal or Coke | 0 (0.0%) | 0 (0.0%) |
| All other Fuels | 0 (0.0%) | 0 (0.0%) |
| No Fuel Used | 0 (0.0%) | 0 (0.0%) |
| Total | 730 (100.0%) | 118 (100.0%) |
Household Vehicle Usage in Ravensworth
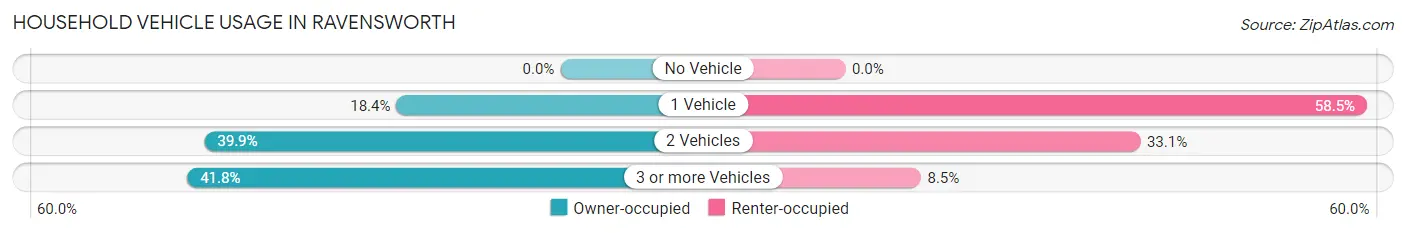
| Vehicles per Household | Owner-occupied | Renter-occupied |
| No Vehicle | 0 (0.0%) | 0 (0.0%) |
| 1 Vehicle | 134 (18.4%) | 69 (58.5%) |
| 2 Vehicles | 291 (39.9%) | 39 (33.1%) |
| 3 or more Vehicles | 305 (41.8%) | 10 (8.5%) |
| Total | 730 (100.0%) | 118 (100.0%) |
Real Estate & Mortgages in Ravensworth
Real Estate and Mortgage Overview in Ravensworth
| Characteristic | Without Mortgage | With Mortgage |
| Housing Units | 302 | 428 |
| Median Property Value | $586,900 | $647,900 |
| Median Household Income | $150,921 | $345 |
| Monthly Housing Costs | $867 | $269 |
| Real Estate Taxes | $6,138 | $0 |
Property Value by Mortgage Status in Ravensworth
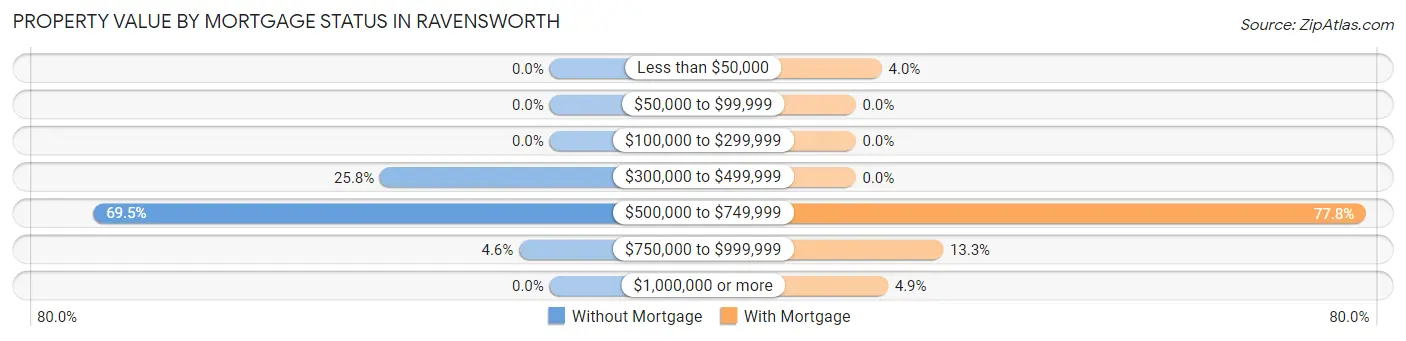
| Property Value | Without Mortgage | With Mortgage |
| Less than $50,000 | 0 (0.0%) | 17 (4.0%) |
| $50,000 to $99,999 | 0 (0.0%) | 0 (0.0%) |
| $100,000 to $299,999 | 0 (0.0%) | 0 (0.0%) |
| $300,000 to $499,999 | 78 (25.8%) | 0 (0.0%) |
| $500,000 to $749,999 | 210 (69.5%) | 333 (77.8%) |
| $750,000 to $999,999 | 14 (4.6%) | 57 (13.3%) |
| $1,000,000 or more | 0 (0.0%) | 21 (4.9%) |
| Total | 302 (100.0%) | 428 (100.0%) |
Household Income by Mortgage Status in Ravensworth
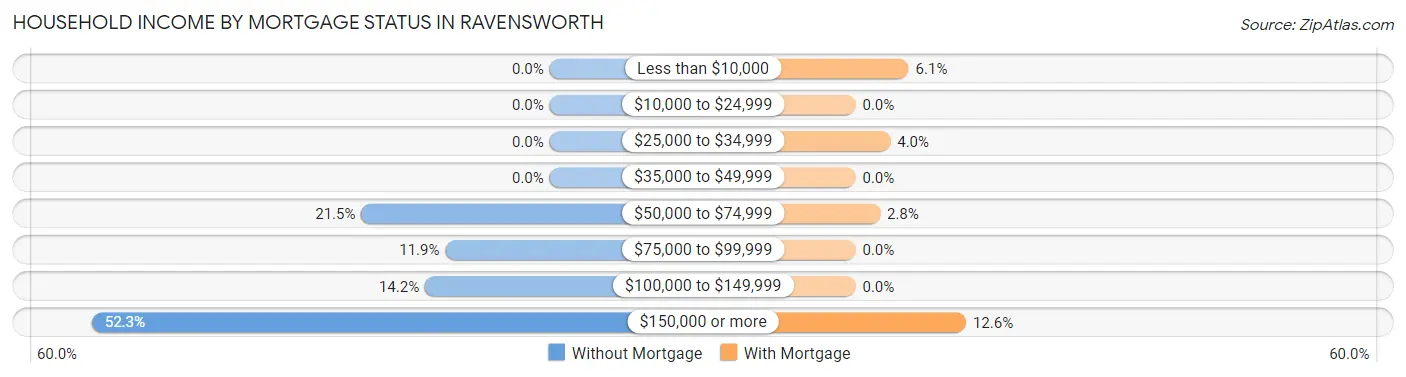
| Household Income | Without Mortgage | With Mortgage |
| Less than $10,000 | 0 (0.0%) | 26 (6.1%) |
| $10,000 to $24,999 | 0 (0.0%) | 0 (0.0%) |
| $25,000 to $34,999 | 0 (0.0%) | 17 (4.0%) |
| $35,000 to $49,999 | 0 (0.0%) | 0 (0.0%) |
| $50,000 to $74,999 | 65 (21.5%) | 12 (2.8%) |
| $75,000 to $99,999 | 36 (11.9%) | 0 (0.0%) |
| $100,000 to $149,999 | 43 (14.2%) | 0 (0.0%) |
| $150,000 or more | 158 (52.3%) | 54 (12.6%) |
| Total | 302 (100.0%) | 428 (100.0%) |
Property Value to Household Income Ratio in Ravensworth
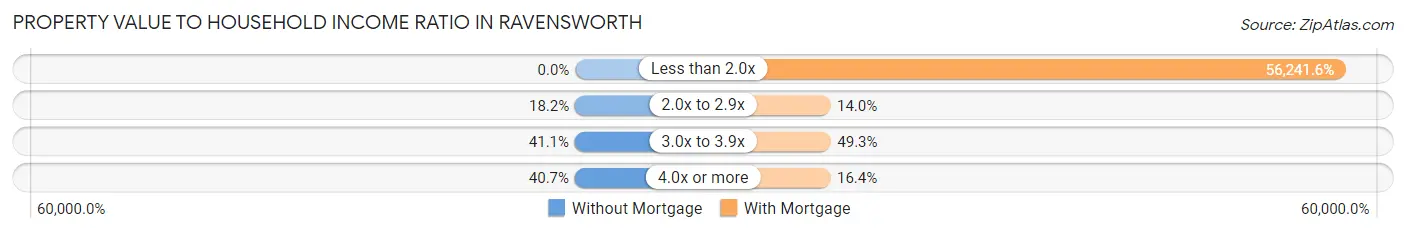
| Value-to-Income Ratio | Without Mortgage | With Mortgage |
| Less than 2.0x | 0 (0.0%) | 240,714 (56,241.6%) |
| 2.0x to 2.9x | 55 (18.2%) | 60 (14.0%) |
| 3.0x to 3.9x | 124 (41.1%) | 211 (49.3%) |
| 4.0x or more | 123 (40.7%) | 70 (16.4%) |
| Total | 302 (100.0%) | 428 (100.0%) |
Real Estate Taxes by Mortgage Status in Ravensworth
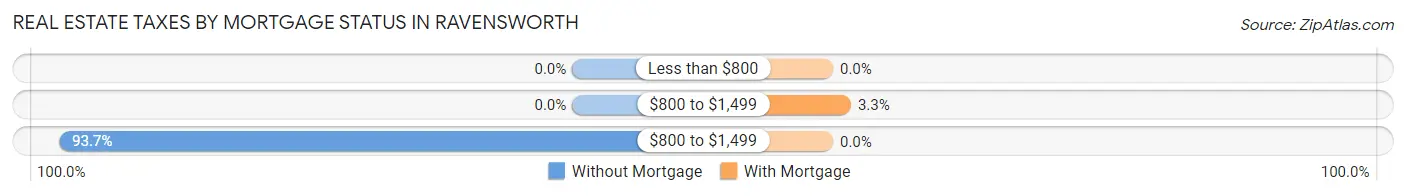
| Property Taxes | Without Mortgage | With Mortgage |
| Less than $800 | 0 (0.0%) | 0 (0.0%) |
| $800 to $1,499 | 0 (0.0%) | 14 (3.3%) |
| $800 to $1,499 | 283 (93.7%) | 0 (0.0%) |
| Total | 302 (100.0%) | 428 (100.0%) |
Health & Disability in Ravensworth
Health Insurance Coverage by Age in Ravensworth
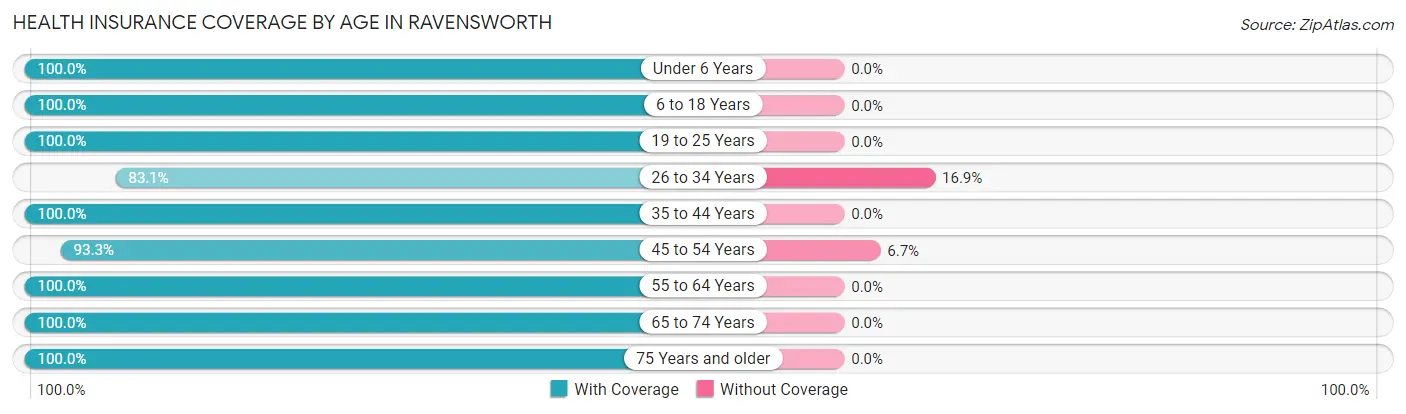
| Age Bracket | With Coverage | Without Coverage |
| Under 6 Years | 267 (100.0%) | 0 (0.0%) |
| 6 to 18 Years | 474 (100.0%) | 0 (0.0%) |
| 19 to 25 Years | 147 (100.0%) | 0 (0.0%) |
| 26 to 34 Years | 260 (83.1%) | 53 (16.9%) |
| 35 to 44 Years | 424 (100.0%) | 0 (0.0%) |
| 45 to 54 Years | 402 (93.3%) | 29 (6.7%) |
| 55 to 64 Years | 240 (100.0%) | 0 (0.0%) |
| 65 to 74 Years | 230 (100.0%) | 0 (0.0%) |
| 75 Years and older | 128 (100.0%) | 0 (0.0%) |
| Total | 2,572 (96.9%) | 82 (3.1%) |
Health Insurance Coverage by Citizenship Status in Ravensworth
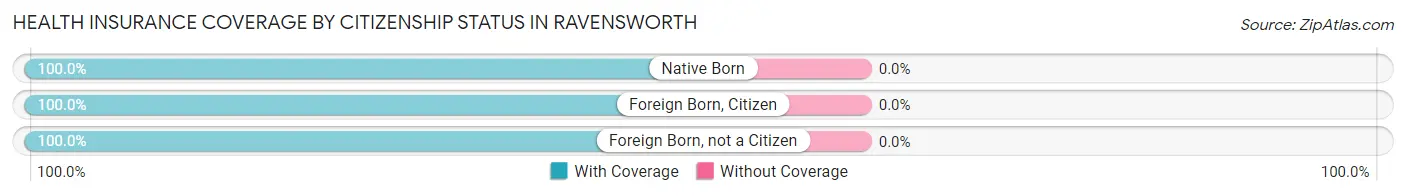
| Citizenship Status | With Coverage | Without Coverage |
| Native Born | 267 (100.0%) | 0 (0.0%) |
| Foreign Born, Citizen | 474 (100.0%) | 0 (0.0%) |
| Foreign Born, not a Citizen | 147 (100.0%) | 0 (0.0%) |
Health Insurance Coverage by Household Income in Ravensworth
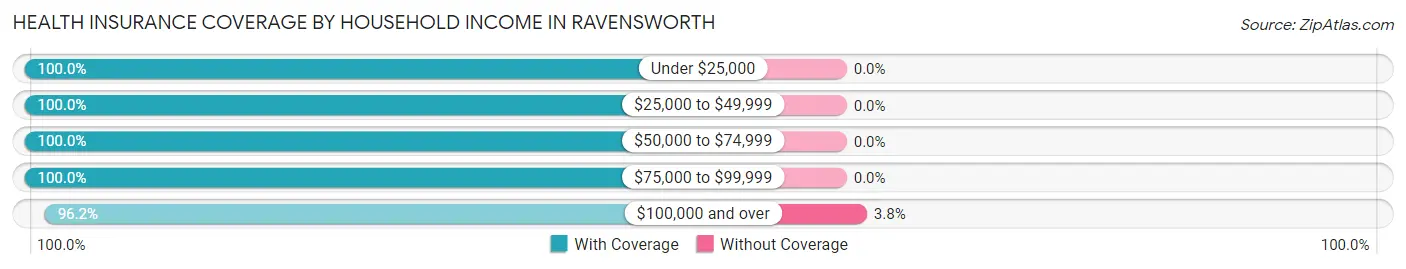
| Household Income | With Coverage | Without Coverage |
| Under $25,000 | 17 (100.0%) | 0 (0.0%) |
| $25,000 to $49,999 | 283 (100.0%) | 0 (0.0%) |
| $50,000 to $74,999 | 106 (100.0%) | 0 (0.0%) |
| $75,000 to $99,999 | 73 (100.0%) | 0 (0.0%) |
| $100,000 and over | 2,093 (96.2%) | 82 (3.8%) |
Public vs Private Health Insurance Coverage by Age in Ravensworth
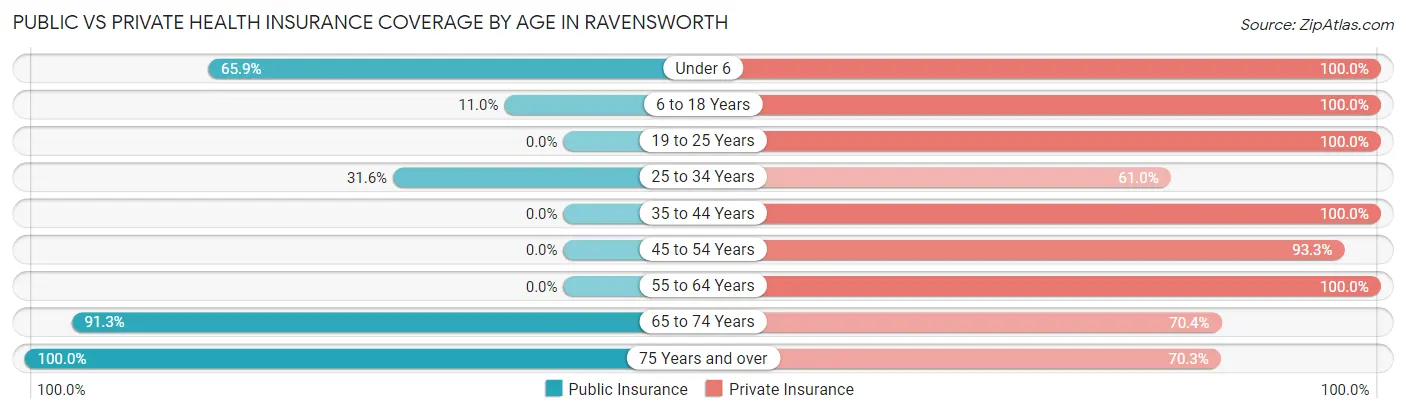
| Age Bracket | Public Insurance | Private Insurance |
| Under 6 | 176 (65.9%) | 267 (100.0%) |
| 6 to 18 Years | 52 (11.0%) | 474 (100.0%) |
| 19 to 25 Years | 0 (0.0%) | 147 (100.0%) |
| 25 to 34 Years | 99 (31.6%) | 191 (61.0%) |
| 35 to 44 Years | 0 (0.0%) | 424 (100.0%) |
| 45 to 54 Years | 0 (0.0%) | 402 (93.3%) |
| 55 to 64 Years | 0 (0.0%) | 240 (100.0%) |
| 65 to 74 Years | 210 (91.3%) | 162 (70.4%) |
| 75 Years and over | 128 (100.0%) | 90 (70.3%) |
| Total | 665 (25.1%) | 2,397 (90.3%) |
Disability Status by Sex by Age in Ravensworth
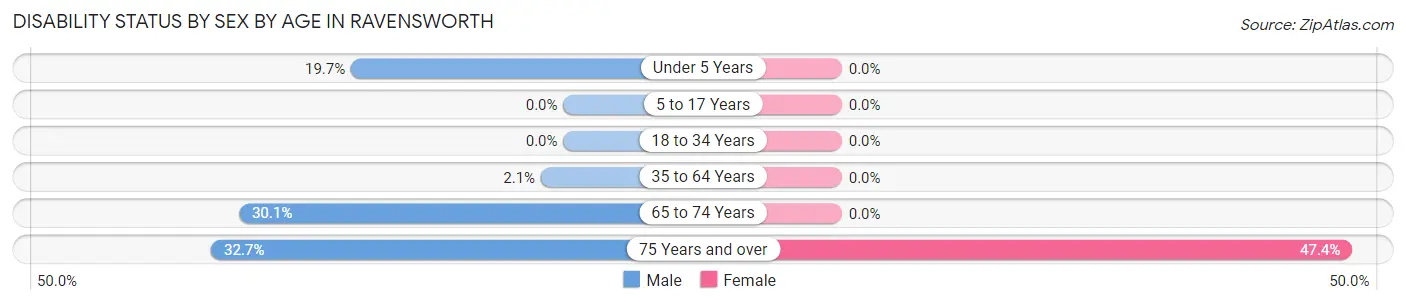
| Age Bracket | Male | Female |
| Under 5 Years | 13 (19.7%) | 0 (0.0%) |
| 5 to 17 Years | 0 (0.0%) | 0 (0.0%) |
| 18 to 34 Years | 0 (0.0%) | 0 (0.0%) |
| 35 to 64 Years | 13 (2.1%) | 0 (0.0%) |
| 65 to 74 Years | 31 (30.1%) | 0 (0.0%) |
| 75 Years and over | 17 (32.7%) | 36 (47.4%) |
Disability Class by Sex by Age in Ravensworth
Disability Class: Hearing Difficulty
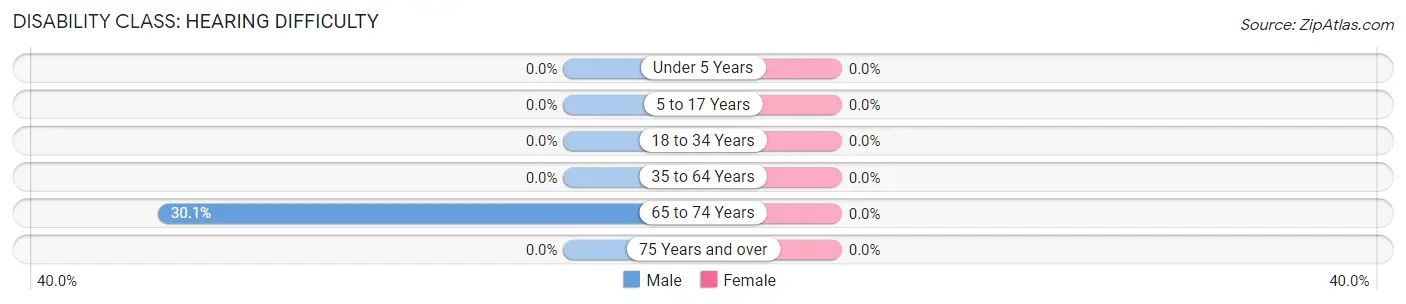
| Age Bracket | Male | Female |
| Under 5 Years | 0 (0.0%) | 0 (0.0%) |
| 5 to 17 Years | 0 (0.0%) | 0 (0.0%) |
| 18 to 34 Years | 0 (0.0%) | 0 (0.0%) |
| 35 to 64 Years | 0 (0.0%) | 0 (0.0%) |
| 65 to 74 Years | 31 (30.1%) | 0 (0.0%) |
| 75 Years and over | 0 (0.0%) | 0 (0.0%) |
Disability Class: Vision Difficulty
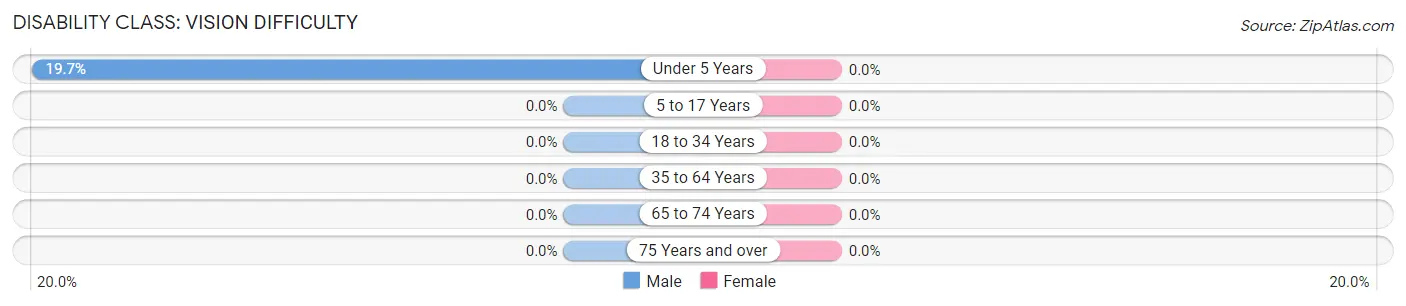
| Age Bracket | Male | Female |
| Under 5 Years | 13 (19.7%) | 0 (0.0%) |
| 5 to 17 Years | 0 (0.0%) | 0 (0.0%) |
| 18 to 34 Years | 0 (0.0%) | 0 (0.0%) |
| 35 to 64 Years | 0 (0.0%) | 0 (0.0%) |
| 65 to 74 Years | 0 (0.0%) | 0 (0.0%) |
| 75 Years and over | 0 (0.0%) | 0 (0.0%) |
Disability Class: Cognitive Difficulty
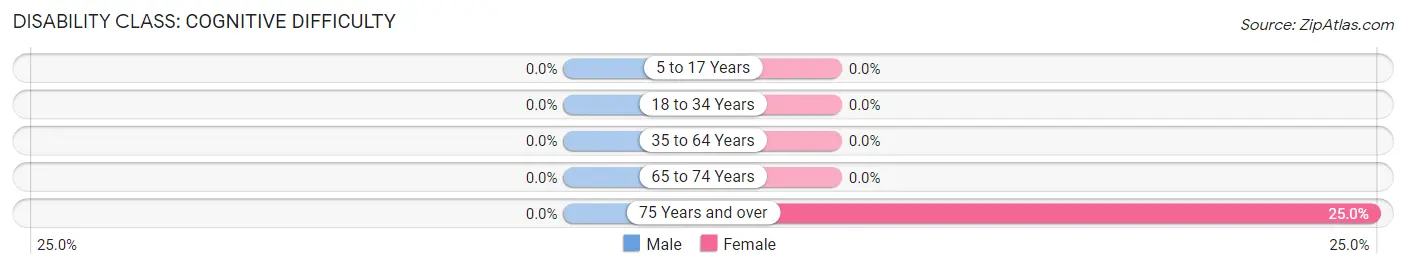
| Age Bracket | Male | Female |
| 5 to 17 Years | 0 (0.0%) | 0 (0.0%) |
| 18 to 34 Years | 0 (0.0%) | 0 (0.0%) |
| 35 to 64 Years | 0 (0.0%) | 0 (0.0%) |
| 65 to 74 Years | 0 (0.0%) | 0 (0.0%) |
| 75 Years and over | 0 (0.0%) | 19 (25.0%) |
Disability Class: Ambulatory Difficulty
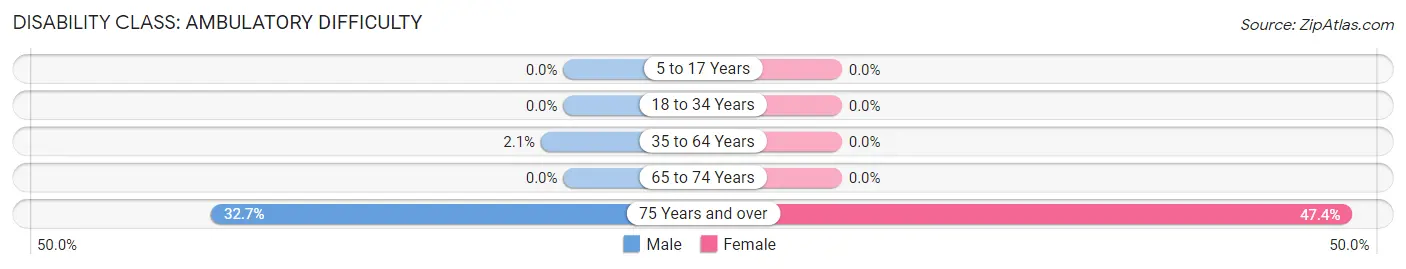
| Age Bracket | Male | Female |
| 5 to 17 Years | 0 (0.0%) | 0 (0.0%) |
| 18 to 34 Years | 0 (0.0%) | 0 (0.0%) |
| 35 to 64 Years | 13 (2.1%) | 0 (0.0%) |
| 65 to 74 Years | 0 (0.0%) | 0 (0.0%) |
| 75 Years and over | 17 (32.7%) | 36 (47.4%) |
Disability Class: Self-Care Difficulty
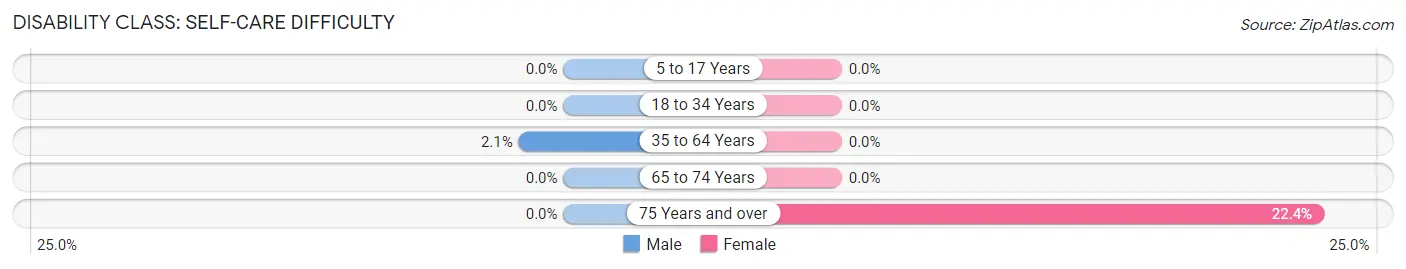
| Age Bracket | Male | Female |
| 5 to 17 Years | 0 (0.0%) | 0 (0.0%) |
| 18 to 34 Years | 0 (0.0%) | 0 (0.0%) |
| 35 to 64 Years | 13 (2.1%) | 0 (0.0%) |
| 65 to 74 Years | 0 (0.0%) | 0 (0.0%) |
| 75 Years and over | 0 (0.0%) | 17 (22.4%) |
Technology Access in Ravensworth
Computing Device Access in Ravensworth
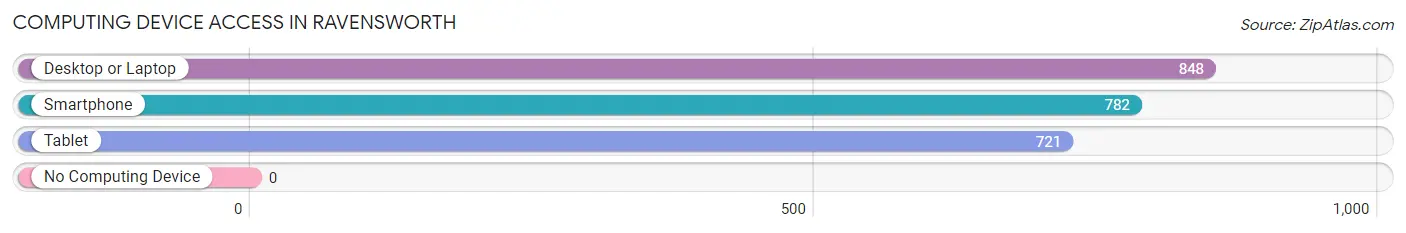
| Device Type | # Households | % Households |
| Desktop or Laptop | 848 | 100.0% |
| Smartphone | 782 | 92.2% |
| Tablet | 721 | 85.0% |
| No Computing Device | 0 | 0.0% |
| Total | 848 | 100.0% |
Internet Access in Ravensworth
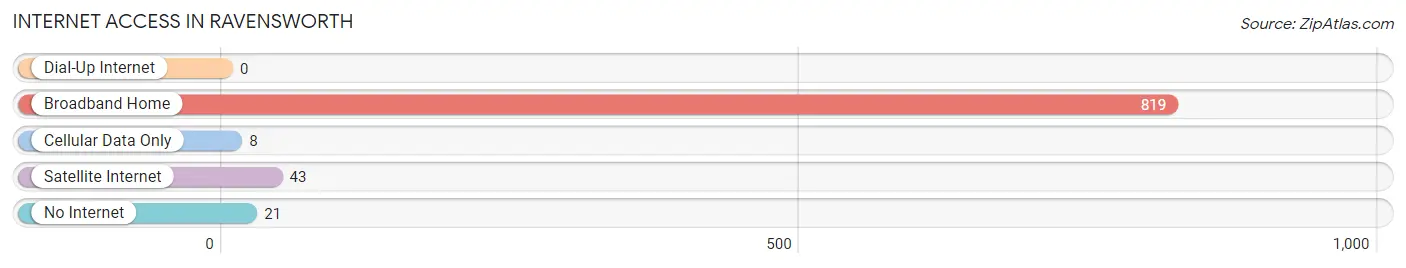
| Internet Type | # Households | % Households |
| Dial-Up Internet | 0 | 0.0% |
| Broadband Home | 819 | 96.6% |
| Cellular Data Only | 8 | 0.9% |
| Satellite Internet | 43 | 5.1% |
| No Internet | 21 | 2.5% |
| Total | 848 | 100.0% |
Ravensworth Summary
Ravensworth is a small unincorporated community located in Fairfax County, Virginia. It is situated in the southeastern part of the county, just north of the city of Alexandria. The community is bordered by the towns of Annandale, Springfield, and Burke. The population of Ravensworth was estimated to be 1,845 in 2019.
History
The area that is now Ravensworth was first settled in the late 1700s by the Raven family, who owned a large plantation in the area. The plantation was named Ravensworth, and the community that grew up around it was named after the plantation. The plantation was destroyed during the Civil War, but the community remained.
In the early 1900s, the area was mostly rural, with small farms and a few stores. In the 1950s, the area began to develop rapidly, as the population of Fairfax County grew. The area was annexed by the City of Alexandria in the 1960s, and the population of Ravensworth began to grow.
Geography
Ravensworth is located in southeastern Fairfax County, just north of the City of Alexandria. It is bordered by the towns of Annandale, Springfield, and Burke. The area is mostly flat, with some rolling hills. The climate is temperate, with hot summers and cold winters.
Economy
The economy of Ravensworth is largely based on the service industry. There are several restaurants, retail stores, and other businesses in the area. The area is also home to several government offices, including the Fairfax County Police Department and the Fairfax County Fire and Rescue Department.
Demographics
The population of Ravensworth was estimated to be 1,845 in 2019. The racial makeup of the community is predominantly white (77.3%), followed by African American (14.2%), Asian (4.2%), and Hispanic (2.3%). The median household income is $107,845, and the median home value is $541,000.
Conclusion
Ravensworth is a small unincorporated community located in Fairfax County, Virginia. It has a rich history, and its economy is largely based on the service industry. The population of Ravensworth is predominantly white, and the median household income is high. Ravensworth is a great place to live, work, and raise a family.
Common Questions
What is Per Capita Income in Ravensworth?
Per Capita income in Ravensworth is $60,722.
What is the Median Family Income in Ravensworth?
Median Family Income in Ravensworth is $164,143.
What is the Median Household income in Ravensworth?
Median Household Income in Ravensworth is $163,019.
What is Income or Wage Gap in Ravensworth?
Income or Wage Gap in Ravensworth is 33.0%.
Women in Ravensworth earn 67.0 cents for every dollar earned by a man.
What is Inequality or Gini Index in Ravensworth?
Inequality or Gini Index in Ravensworth is 0.34.
What is the Total Population of Ravensworth?
Total Population of Ravensworth is 2,661.
What is the Total Male Population of Ravensworth?
Total Male Population of Ravensworth is 1,284.
What is the Total Female Population of Ravensworth?
Total Female Population of Ravensworth is 1,377.
What is the Ratio of Males per 100 Females in Ravensworth?
There are 93.25 Males per 100 Females in Ravensworth.
What is the Ratio of Females per 100 Males in Ravensworth?
There are 107.24 Females per 100 Males in Ravensworth.
What is the Median Population Age in Ravensworth?
Median Population Age in Ravensworth is 40.3 Years.
What is the Average Family Size in Ravensworth
Average Family Size in Ravensworth is 3.5 People.
What is the Average Household Size in Ravensworth
Average Household Size in Ravensworth is 3.1 People.
How Large is the Labor Force in Ravensworth?
There are 1,519 People in the Labor Forcein in Ravensworth.
What is the Percentage of People in the Labor Force in Ravensworth?
75.2% of People are in the Labor Force in Ravensworth.
What is the Unemployment Rate in Ravensworth?
Unemployment Rate in Ravensworth is 4.6%.