Broadlands, VA Map & Demographics
Broadlands Map
Broadlands Overview
$77,783
PER CAPITA INCOME
$243,828
AVG FAMILY INCOME
$231,854
AVG HOUSEHOLD INCOME
53.6%
WAGE / INCOME GAP [ % ]
46.4¢/ $1
WAGE / INCOME GAP [ $ ]
0.32
INEQUALITY / GINI INDEX
14,582
TOTAL POPULATION
7,470
MALE POPULATION
7,112
FEMALE POPULATION
105.03
MALES / 100 FEMALES
95.21
FEMALES / 100 MALES
37.5
MEDIAN AGE
3.7
AVG FAMILY SIZE
3.4
AVG HOUSEHOLD SIZE
8,066
LABOR FORCE [ PEOPLE ]
74.9%
PERCENT IN LABOR FORCE
2.4%
UNEMPLOYMENT RATE
Income in Broadlands
Income Overview in Broadlands
Per Capita Income in Broadlands is $77,783, while median incomes of families and households are $243,828 and $231,854 respectively.
| Characteristic | Number | Measure |
| Per Capita Income | 14,582 | $77,783 |
| Median Family Income | 3,642 | $243,828 |
| Mean Family Income | 3,642 | $262,895 |
| Median Household Income | 4,345 | $231,854 |
| Mean Household Income | 4,345 | $252,252 |
| Income Deficit | 3,642 | $0 |
| Wage / Income Gap (%) | 14,582 | 53.57% |
| Wage / Income Gap ($) | 14,582 | 46.43¢ per $1 |
| Gini / Inequality Index | 14,582 | 0.32 |
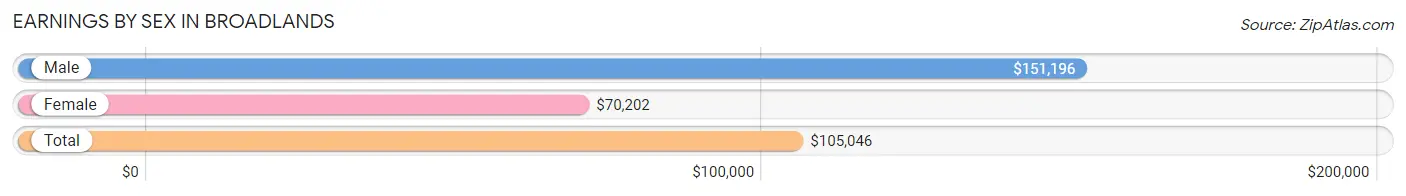
Earnings by Sex in Broadlands
Average Earnings in Broadlands are $105,046, $151,196 for men and $70,202 for women, a difference of 53.6%.
| Sex | Number | Average Earnings |
| Male | 4,601 (55.1%) | $151,196 |
| Female | 3,745 (44.9%) | $70,202 |
| Total | 8,346 (100.0%) | $105,046 |
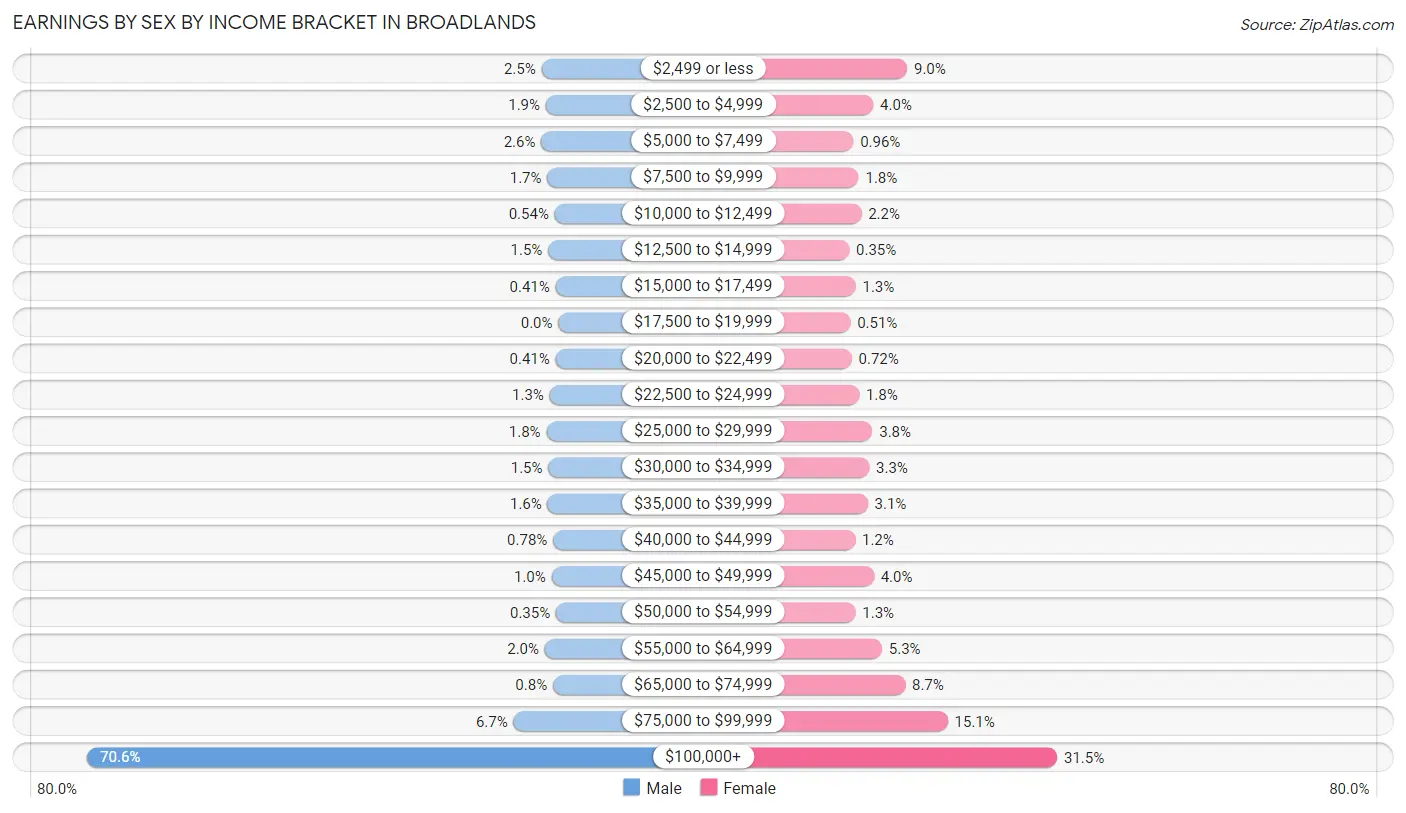
Earnings by Sex by Income Bracket in Broadlands
The most common earnings brackets in Broadlands are $100,000+ for men (3,249 | 70.6%) and $100,000+ for women (1,180 | 31.5%).
| Income | Male | Female |
| $2,499 or less | 116 (2.5%) | 338 (9.0%) |
| $2,500 to $4,999 | 86 (1.9%) | 148 (4.0%) |
| $5,000 to $7,499 | 118 (2.6%) | 36 (1.0%) |
| $7,500 to $9,999 | 76 (1.7%) | 66 (1.8%) |
| $10,000 to $12,499 | 25 (0.5%) | 81 (2.2%) |
| $12,500 to $14,999 | 70 (1.5%) | 13 (0.4%) |
| $15,000 to $17,499 | 19 (0.4%) | 49 (1.3%) |
| $17,500 to $19,999 | 0 (0.0%) | 19 (0.5%) |
| $20,000 to $22,499 | 19 (0.4%) | 27 (0.7%) |
| $22,500 to $24,999 | 60 (1.3%) | 68 (1.8%) |
| $25,000 to $29,999 | 82 (1.8%) | 143 (3.8%) |
| $30,000 to $34,999 | 69 (1.5%) | 125 (3.3%) |
| $35,000 to $39,999 | 74 (1.6%) | 117 (3.1%) |
| $40,000 to $44,999 | 36 (0.8%) | 46 (1.2%) |
| $45,000 to $49,999 | 47 (1.0%) | 151 (4.0%) |
| $50,000 to $54,999 | 16 (0.4%) | 48 (1.3%) |
| $55,000 to $64,999 | 93 (2.0%) | 197 (5.3%) |
| $65,000 to $74,999 | 37 (0.8%) | 327 (8.7%) |
| $75,000 to $99,999 | 309 (6.7%) | 566 (15.1%) |
| $100,000+ | 3,249 (70.6%) | 1,180 (31.5%) |
| Total | 4,601 (100.0%) | 3,745 (100.0%) |
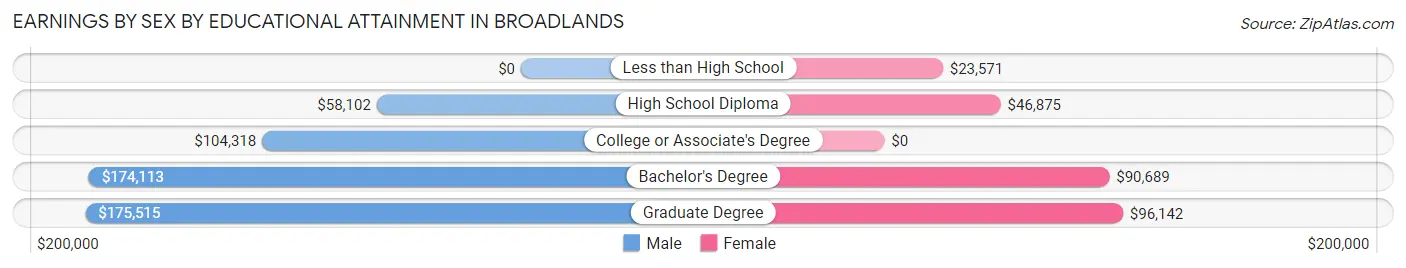
Earnings by Sex by Educational Attainment in Broadlands
Average earnings in Broadlands are $162,540 for men and $85,585 for women, a difference of 47.3%. Men with an educational attainment of graduate degree enjoy the highest average annual earnings of $175,515, while those with high school diploma education earn the least with $58,102. Women with an educational attainment of graduate degree earn the most with the average annual earnings of $96,142, while those with less than high school education have the smallest earnings of $23,571.
| Educational Attainment | Male Income | Female Income |
| Less than High School | - | - |
| High School Diploma | $58,102 | $46,875 |
| College or Associate's Degree | $104,318 | $0 |
| Bachelor's Degree | $174,113 | $90,689 |
| Graduate Degree | $175,515 | $96,142 |
| Total | $162,540 | $85,585 |
Family Income in Broadlands
Family Income Brackets in Broadlands
According to the Broadlands family income data, there are 2,429 families falling into the $200,000+ income range, which is the most common income bracket and makes up 66.7% of all families.
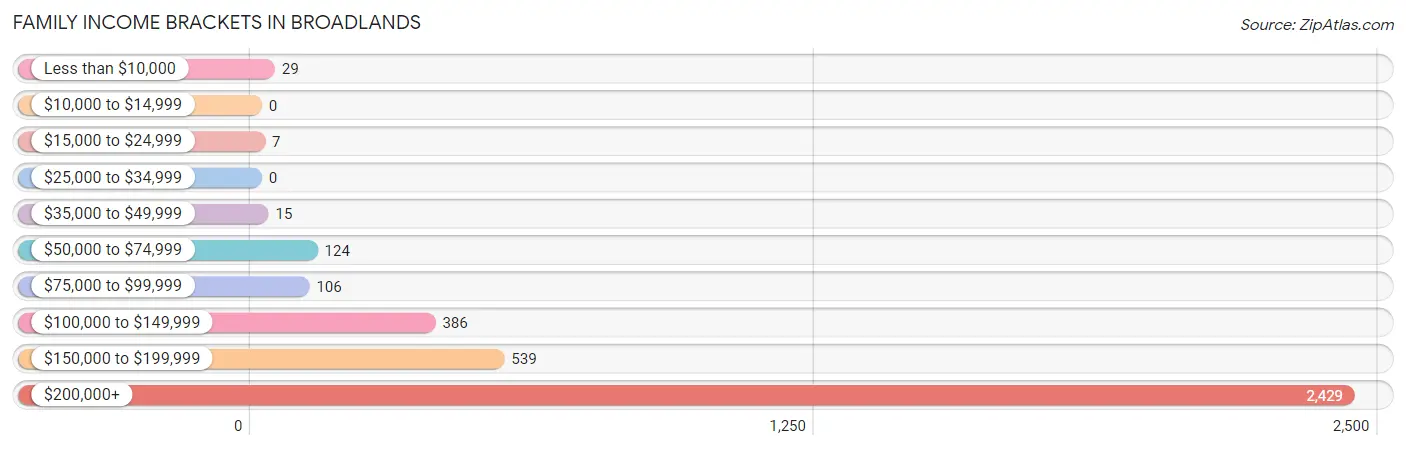
| Income Bracket | # Families | % Families |
| Less than $10,000 | 29 | 0.8% |
| $10,000 to $14,999 | 0 | 0.0% |
| $15,000 to $24,999 | 7 | 0.2% |
| $25,000 to $34,999 | 0 | 0.0% |
| $35,000 to $49,999 | 15 | 0.4% |
| $50,000 to $74,999 | 124 | 3.4% |
| $75,000 to $99,999 | 106 | 2.9% |
| $100,000 to $149,999 | 386 | 10.6% |
| $150,000 to $199,999 | 539 | 14.8% |
| $200,000+ | 2,429 | 66.7% |
Family Income by Famaliy Size in Broadlands
4-person families (1,449 | 39.8%) account for the highest median family income in Broadlands with $250,001 per family, while 2-person families (606 | 16.6%) have the highest median income of $86,164 per family member.
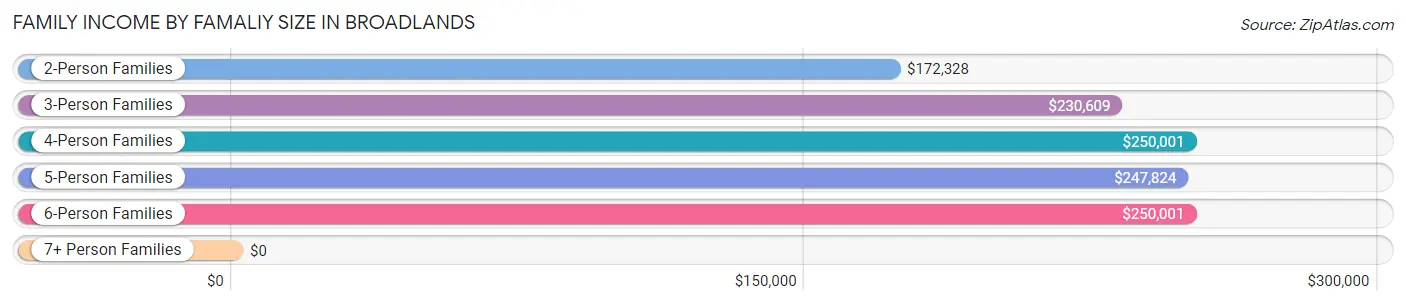
| Income Bracket | # Families | Median Income |
| 2-Person Families | 606 (16.6%) | $172,328 |
| 3-Person Families | 955 (26.2%) | $230,609 |
| 4-Person Families | 1,449 (39.8%) | $250,001 |
| 5-Person Families | 507 (13.9%) | $247,824 |
| 6-Person Families | 125 (3.4%) | $250,001 |
| 7+ Person Families | 0 (0.0%) | $0 |
| Total | 3,642 (100.0%) | $243,828 |
Family Income by Number of Earners in Broadlands
The median family income in Broadlands is $243,828, with families comprising 2 earners (2,076) having the highest median family income of $250,001, while families with no earners (104) have the lowest median family income of $67,778, accounting for 57.0% and 2.9% of families, respectively.
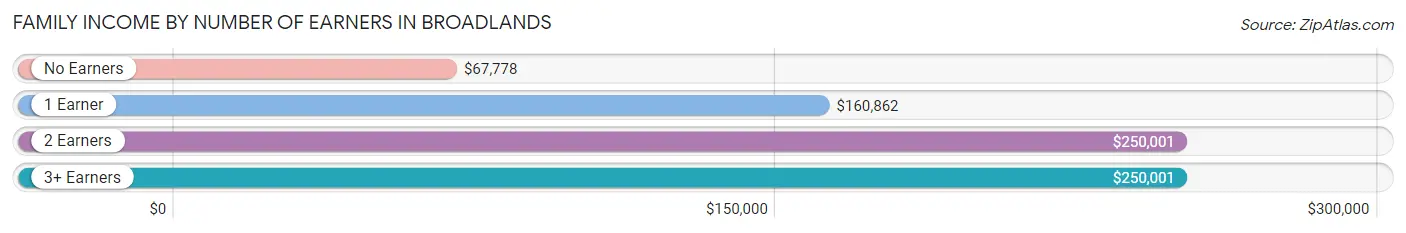
| Number of Earners | # Families | Median Income |
| No Earners | 104 (2.9%) | $67,778 |
| 1 Earner | 856 (23.5%) | $160,862 |
| 2 Earners | 2,076 (57.0%) | $250,001 |
| 3+ Earners | 606 (16.6%) | $250,001 |
| Total | 3,642 (100.0%) | $243,828 |
Household Income in Broadlands
Household Income Brackets in Broadlands
With 2,655 households falling in the category, the $200,000+ income range is the most frequent in Broadlands, accounting for 61.1% of all households.
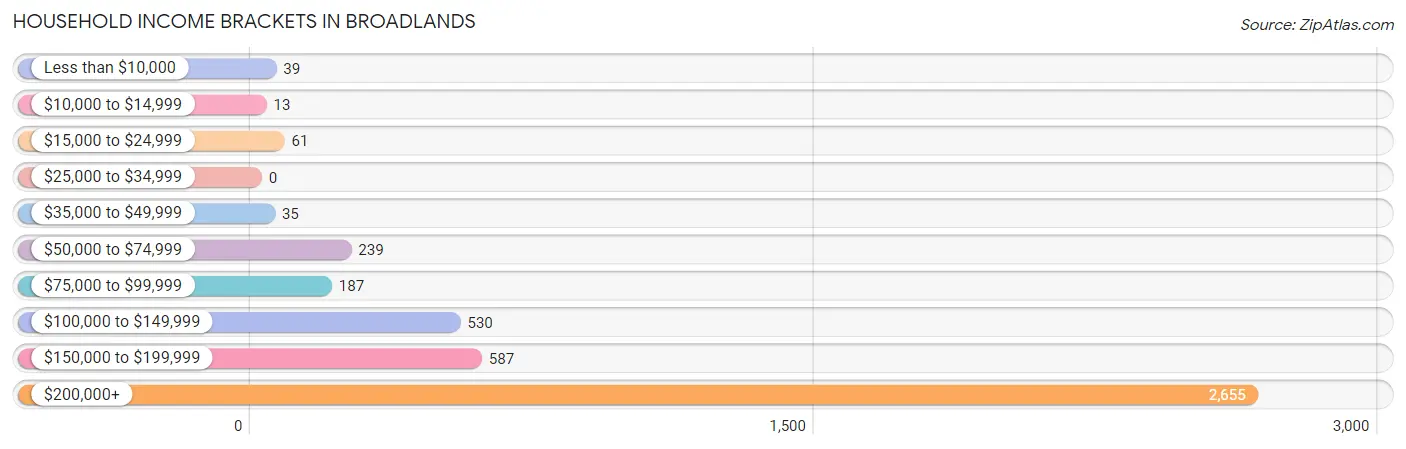
| Income Bracket | # Households | % Households |
| Less than $10,000 | 39 | 0.9% |
| $10,000 to $14,999 | 13 | 0.3% |
| $15,000 to $24,999 | 61 | 1.4% |
| $25,000 to $34,999 | 0 | 0.0% |
| $35,000 to $49,999 | 35 | 0.8% |
| $50,000 to $74,999 | 239 | 5.5% |
| $75,000 to $99,999 | 187 | 4.3% |
| $100,000 to $149,999 | 530 | 12.2% |
| $150,000 to $199,999 | 587 | 13.5% |
| $200,000+ | 2,655 | 61.1% |
Household Income by Householder Age in Broadlands
The median household income in Broadlands is $231,854, with the highest median household income of $250,001 found in the 45 to 64 years age bracket for the primary householder. A total of 2,315 households (53.3%) fall into this category. Meanwhile, the 15 to 24 years age bracket for the primary householder has the lowest median household income of $0, with 15 households (0.4%) in this group.
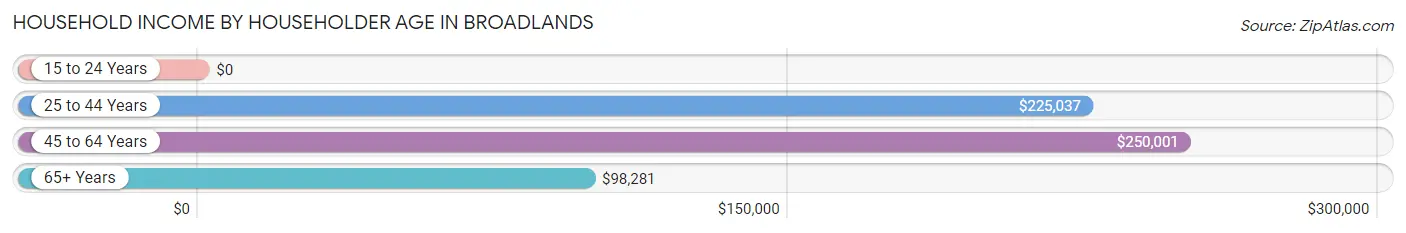
| Income Bracket | # Households | Median Income |
| 15 to 24 Years | 15 (0.4%) | $0 |
| 25 to 44 Years | 1,603 (36.9%) | $225,037 |
| 45 to 64 Years | 2,315 (53.3%) | $250,001 |
| 65+ Years | 412 (9.5%) | $98,281 |
| Total | 4,345 (100.0%) | $231,854 |
Poverty in Broadlands
Income Below Poverty by Sex and Age in Broadlands
With 1.1% poverty level for males and 2.3% for females among the residents of Broadlands, 75 year old and over males and 18 to 24 year old females are the most vulnerable to poverty, with 11 males (6.4%) and 56 females (10.5%) in their respective age groups living below the poverty level.
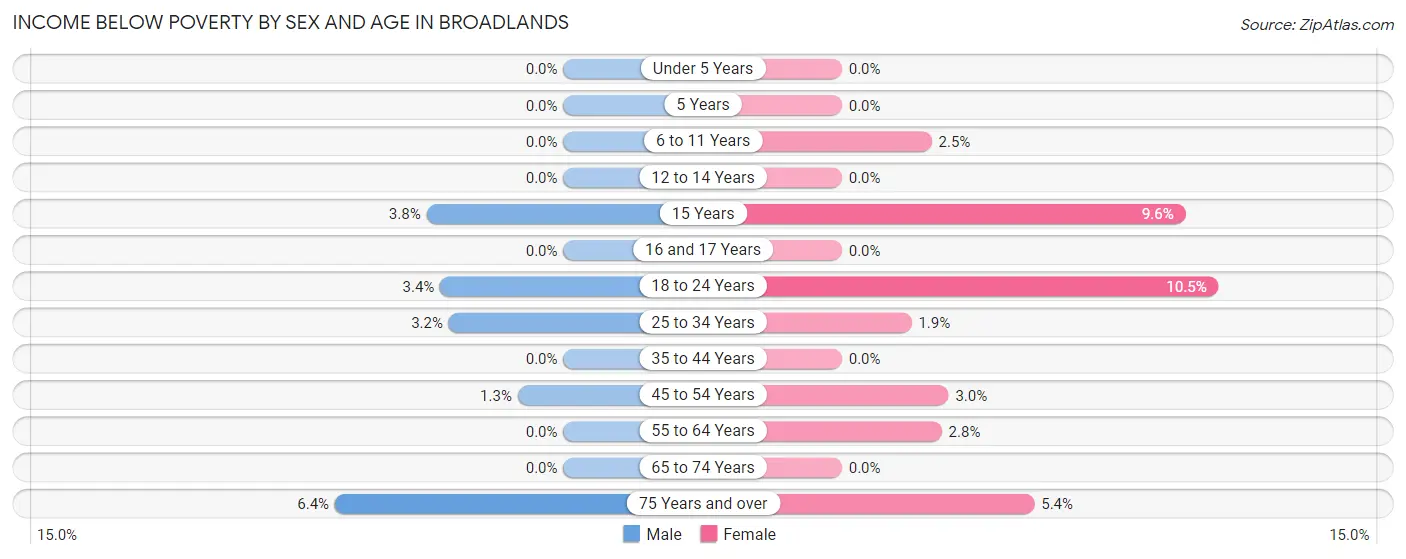
| Age Bracket | Male | Female |
| Under 5 Years | 0 (0.0%) | 0 (0.0%) |
| 5 Years | 0 (0.0%) | 0 (0.0%) |
| 6 to 11 Years | 0 (0.0%) | 15 (2.5%) |
| 12 to 14 Years | 0 (0.0%) | 0 (0.0%) |
| 15 Years | 9 (3.8%) | 9 (9.6%) |
| 16 and 17 Years | 0 (0.0%) | 0 (0.0%) |
| 18 to 24 Years | 25 (3.4%) | 56 (10.5%) |
| 25 to 34 Years | 18 (3.2%) | 12 (1.9%) |
| 35 to 44 Years | 0 (0.0%) | 0 (0.0%) |
| 45 to 54 Years | 23 (1.3%) | 41 (3.0%) |
| 55 to 64 Years | 0 (0.0%) | 17 (2.8%) |
| 65 to 74 Years | 0 (0.0%) | 0 (0.0%) |
| 75 Years and over | 11 (6.4%) | 14 (5.4%) |
| Total | 86 (1.1%) | 164 (2.3%) |
Income Above Poverty by Sex and Age in Broadlands
According to the poverty statistics in Broadlands, males aged under 5 years and females aged under 5 years are the age groups that are most secure financially, with 100.0% of males and 100.0% of females in these age groups living above the poverty line.
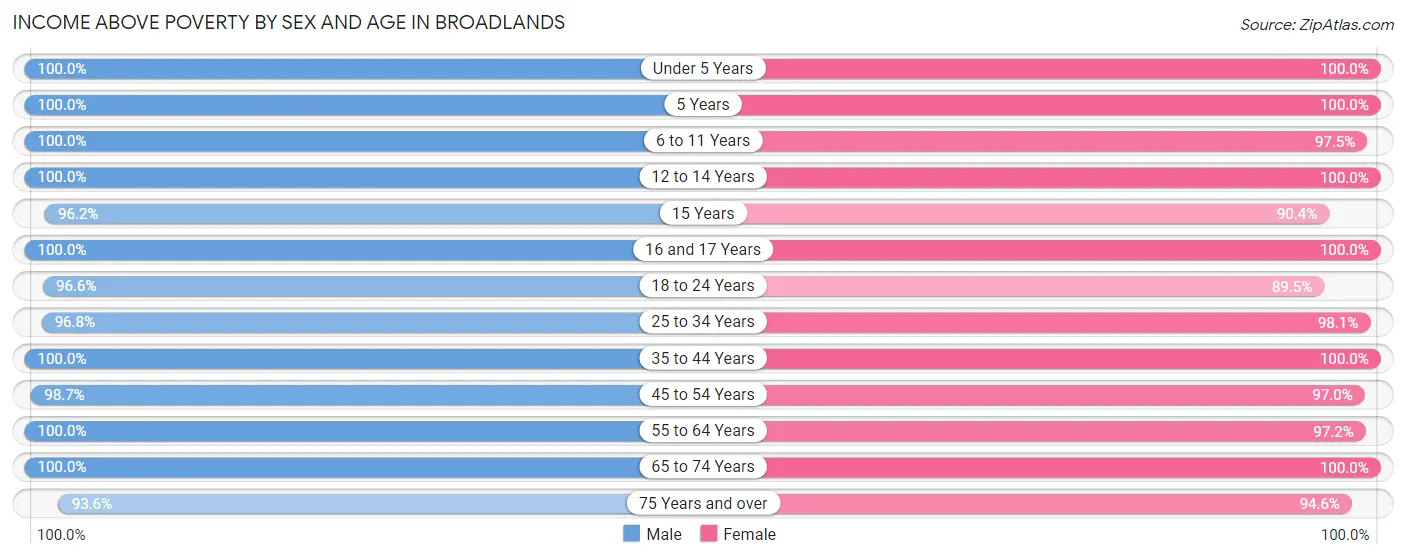
| Age Bracket | Male | Female |
| Under 5 Years | 366 (100.0%) | 249 (100.0%) |
| 5 Years | 112 (100.0%) | 144 (100.0%) |
| 6 to 11 Years | 873 (100.0%) | 586 (97.5%) |
| 12 to 14 Years | 557 (100.0%) | 558 (100.0%) |
| 15 Years | 227 (96.2%) | 85 (90.4%) |
| 16 and 17 Years | 238 (100.0%) | 418 (100.0%) |
| 18 to 24 Years | 703 (96.6%) | 478 (89.5%) |
| 25 to 34 Years | 546 (96.8%) | 607 (98.1%) |
| 35 to 44 Years | 999 (100.0%) | 1,278 (100.0%) |
| 45 to 54 Years | 1,786 (98.7%) | 1,339 (97.0%) |
| 55 to 64 Years | 574 (100.0%) | 595 (97.2%) |
| 65 to 74 Years | 238 (100.0%) | 344 (100.0%) |
| 75 Years and over | 162 (93.6%) | 247 (94.6%) |
| Total | 7,381 (98.9%) | 6,928 (97.7%) |
Income Below Poverty Among Married-Couple Families in Broadlands
The poverty statistics for married-couple families in Broadlands show that 0.3% or 9 of the total 3,309 families live below the poverty line. Families with 1 or 2 children have the highest poverty rate of 0.4%, comprising of 9 families. On the other hand, families with no children have the lowest poverty rate of 0.0%, which includes 0 families.
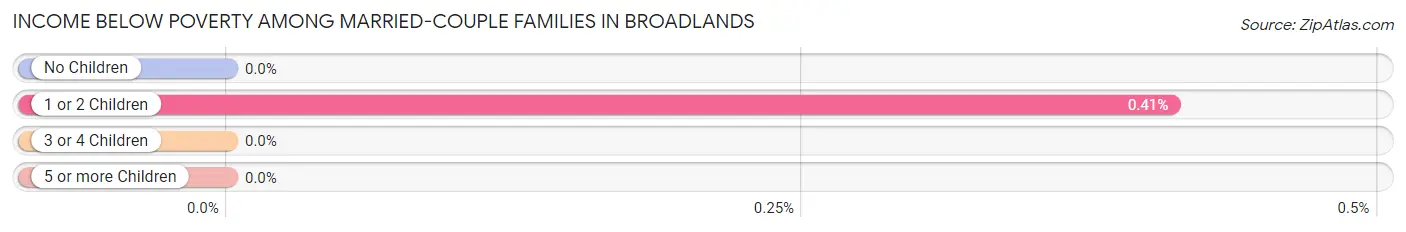
| Children | Above Poverty | Below Poverty |
| No Children | 866 (100.0%) | 0 (0.0%) |
| 1 or 2 Children | 2,178 (99.6%) | 9 (0.4%) |
| 3 or 4 Children | 256 (100.0%) | 0 (0.0%) |
| 5 or more Children | 0 (0.0%) | 0 (0.0%) |
| Total | 3,300 (99.7%) | 9 (0.3%) |
Income Below Poverty Among Single-Parent Households in Broadlands
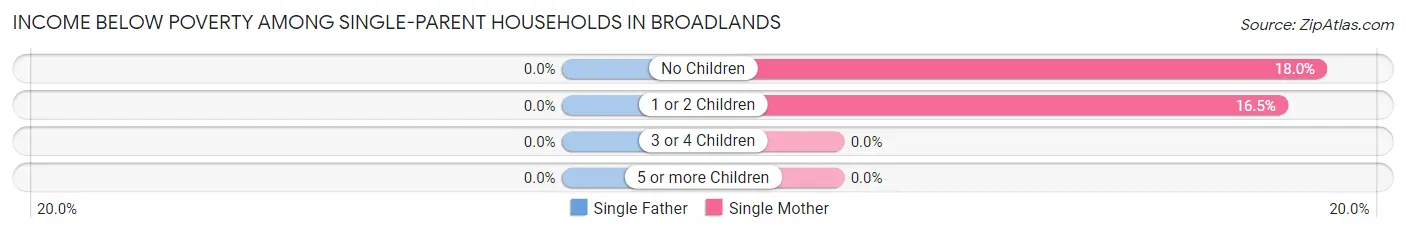
| Children | Single Father | Single Mother |
| No Children | 0 (0.0%) | 9 (18.0%) |
| 1 or 2 Children | 0 (0.0%) | 21 (16.5%) |
| 3 or 4 Children | 0 (0.0%) | 0 (0.0%) |
| 5 or more Children | 0 (0.0%) | 0 (0.0%) |
| Total | 0 (0.0%) | 30 (15.7%) |
Income Below Poverty Among Married-Couple vs Single-Parent Households in Broadlands
The poverty data for Broadlands shows that 9 of the married-couple family households (0.3%) and 30 of the single-parent households (9.0%) are living below the poverty level. Within the married-couple family households, those with 1 or 2 children have the highest poverty rate, with 9 households (0.4%) falling below the poverty line. Among the single-parent households, those with 1 or 2 children have the highest poverty rate, with 21 household (10.6%) living below poverty.
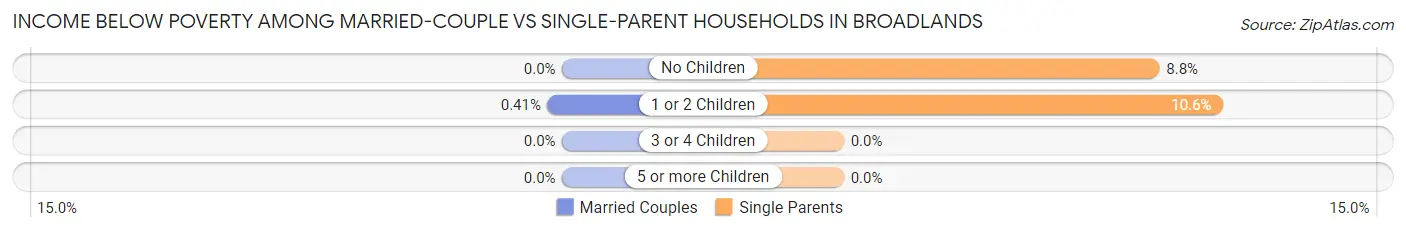
| Children | Married-Couple Families | Single-Parent Households |
| No Children | 0 (0.0%) | 9 (8.8%) |
| 1 or 2 Children | 9 (0.4%) | 21 (10.6%) |
| 3 or 4 Children | 0 (0.0%) | 0 (0.0%) |
| 5 or more Children | 0 (0.0%) | 0 (0.0%) |
| Total | 9 (0.3%) | 30 (9.0%) |
Race in Broadlands
The most populous races in Broadlands are White / Caucasian (8,610 | 59.1%), Asian (3,836 | 26.3%), and Two or more Races (1,356 | 9.3%).
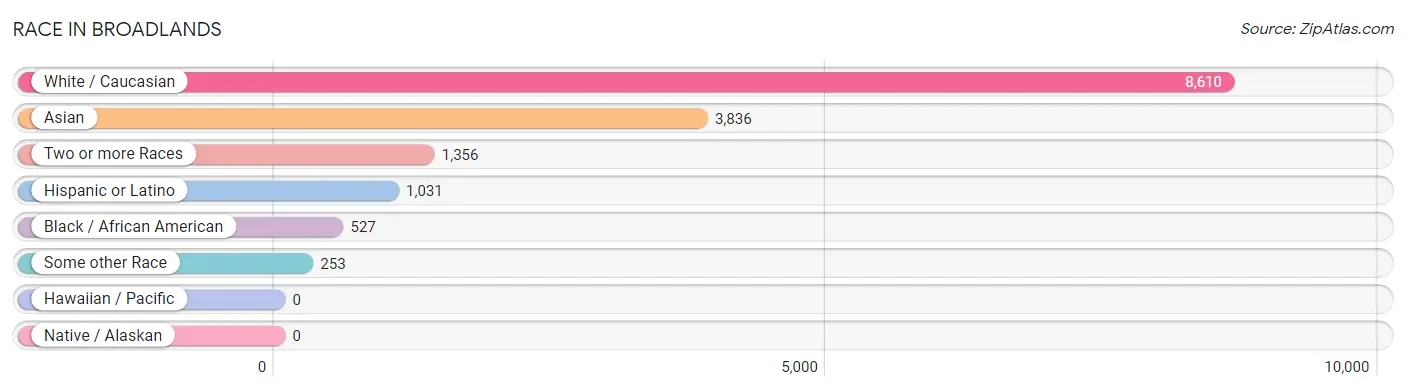
| Race | # Population | % Population |
| Asian | 3,836 | 26.3% |
| Black / African American | 527 | 3.6% |
| Hawaiian / Pacific | 0 | 0.0% |
| Hispanic or Latino | 1,031 | 7.1% |
| Native / Alaskan | 0 | 0.0% |
| White / Caucasian | 8,610 | 59.1% |
| Two or more Races | 1,356 | 9.3% |
| Some other Race | 253 | 1.7% |
| Total | 14,582 | 100.0% |
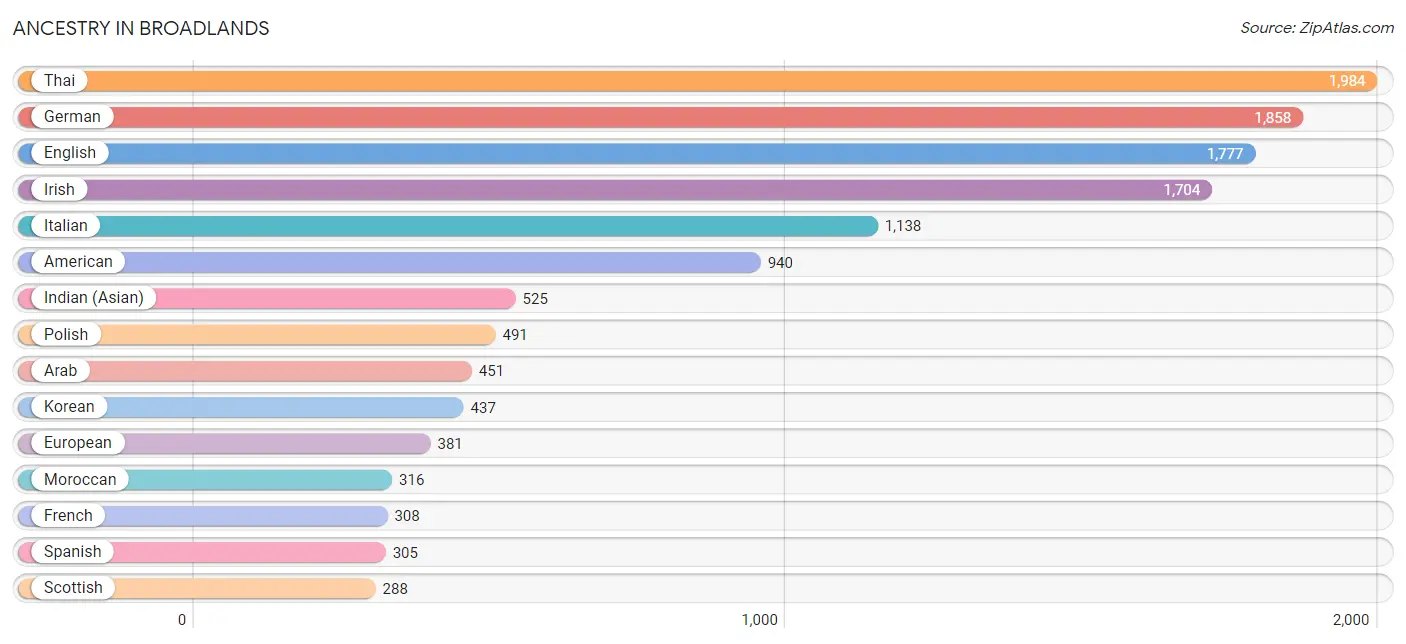
Ancestry in Broadlands
The most populous ancestries reported in Broadlands are Thai (1,984 | 13.6%), German (1,858 | 12.7%), English (1,777 | 12.2%), Irish (1,704 | 11.7%), and Italian (1,138 | 7.8%), together accounting for 58.0% of all Broadlands residents.
| Ancestry | # Population | % Population |
| Afghan | 44 | 0.3% |
| African | 68 | 0.5% |
| American | 940 | 6.5% |
| Arab | 451 | 3.1% |
| Argentinean | 38 | 0.3% |
| Armenian | 57 | 0.4% |
| Australian | 27 | 0.2% |
| Austrian | 47 | 0.3% |
| Bhutanese | 148 | 1.0% |
| Blackfeet | 11 | 0.1% |
| British | 156 | 1.1% |
| Burmese | 243 | 1.7% |
| Canadian | 26 | 0.2% |
| Cape Verdean | 52 | 0.4% |
| Central American | 53 | 0.4% |
| Central American Indian | 11 | 0.1% |
| Cherokee | 4 | 0.0% |
| Colombian | 120 | 0.8% |
| Cuban | 69 | 0.5% |
| Czech | 49 | 0.3% |
| Czechoslovakian | 24 | 0.2% |
| Danish | 143 | 1.0% |
| Dutch | 51 | 0.4% |
| Eastern European | 27 | 0.2% |
| Ecuadorian | 27 | 0.2% |
| Egyptian | 31 | 0.2% |
| English | 1,777 | 12.2% |
| Ethiopian | 19 | 0.1% |
| European | 381 | 2.6% |
| French | 308 | 2.1% |
| French Canadian | 80 | 0.5% |
| German | 1,858 | 12.7% |
| Greek | 105 | 0.7% |
| Guatemalan | 20 | 0.1% |
| Hungarian | 90 | 0.6% |
| Indian (Asian) | 525 | 3.6% |
| Indonesian | 38 | 0.3% |
| Iranian | 11 | 0.1% |
| Irish | 1,704 | 11.7% |
| Iroquois | 4 | 0.0% |
| Italian | 1,138 | 7.8% |
| Jamaican | 30 | 0.2% |
| Korean | 437 | 3.0% |
| Laotian | 7 | 0.1% |
| Lebanese | 77 | 0.5% |
| Lithuanian | 105 | 0.7% |
| Malaysian | 16 | 0.1% |
| Mexican | 214 | 1.5% |
| Moroccan | 316 | 2.2% |
| Native Hawaiian | 27 | 0.2% |
| Norwegian | 183 | 1.3% |
| Pakistani | 8 | 0.1% |
| Peruvian | 64 | 0.4% |
| Polish | 491 | 3.4% |
| Puerto Rican | 132 | 0.9% |
| Romanian | 15 | 0.1% |
| Russian | 24 | 0.2% |
| Salvadoran | 33 | 0.2% |
| Scandinavian | 19 | 0.1% |
| Scotch-Irish | 39 | 0.3% |
| Scottish | 288 | 2.0% |
| Slavic | 25 | 0.2% |
| Slovak | 94 | 0.6% |
| Slovene | 9 | 0.1% |
| South American | 249 | 1.7% |
| Spaniard | 9 | 0.1% |
| Spanish | 305 | 2.1% |
| Sri Lankan | 286 | 2.0% |
| Subsaharan African | 189 | 1.3% |
| Swedish | 119 | 0.8% |
| Swiss | 27 | 0.2% |
| Thai | 1,984 | 13.6% |
| Ukrainian | 154 | 1.1% |
| Welsh | 43 | 0.3% | View All 74 Rows |
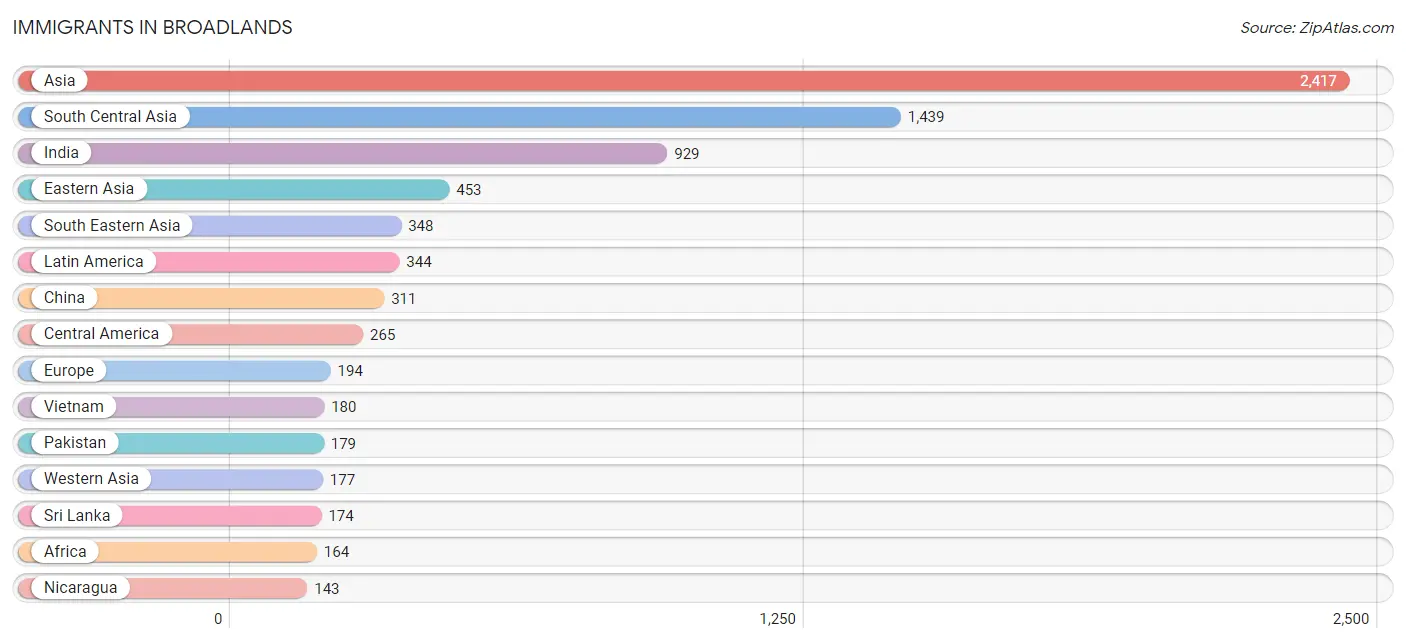
Immigrants in Broadlands
The most numerous immigrant groups reported in Broadlands came from Asia (2,417 | 16.6%), South Central Asia (1,439 | 9.9%), India (929 | 6.4%), Eastern Asia (453 | 3.1%), and South Eastern Asia (348 | 2.4%), together accounting for 38.3% of all Broadlands residents.
| Immigration Origin | # Population | % Population |
| Afghanistan | 39 | 0.3% |
| Africa | 164 | 1.1% |
| Asia | 2,417 | 16.6% |
| Bangladesh | 47 | 0.3% |
| Cabo Verde | 36 | 0.3% |
| Caribbean | 7 | 0.1% |
| Central America | 265 | 1.8% |
| China | 311 | 2.1% |
| Czechoslovakia | 8 | 0.1% |
| Dominica | 7 | 0.1% |
| Eastern Africa | 27 | 0.2% |
| Eastern Asia | 453 | 3.1% |
| Eastern Europe | 95 | 0.6% |
| Ecuador | 11 | 0.1% |
| Egypt | 31 | 0.2% |
| El Salvador | 64 | 0.4% |
| England | 8 | 0.1% |
| Eritrea | 11 | 0.1% |
| Europe | 194 | 1.3% |
| France | 18 | 0.1% |
| Germany | 54 | 0.4% |
| Guatemala | 11 | 0.1% |
| Guyana | 13 | 0.1% |
| Hong Kong | 79 | 0.5% |
| India | 929 | 6.4% |
| Italy | 10 | 0.1% |
| Korea | 142 | 1.0% |
| Laos | 8 | 0.1% |
| Latin America | 344 | 2.4% |
| Lebanon | 76 | 0.5% |
| Mexico | 47 | 0.3% |
| Middle Africa | 6 | 0.0% |
| Morocco | 33 | 0.2% |
| Nepal | 71 | 0.5% |
| Netherlands | 9 | 0.1% |
| Nicaragua | 143 | 1.0% |
| Northern Africa | 64 | 0.4% |
| Northern Europe | 8 | 0.1% |
| Pakistan | 179 | 1.2% |
| Peru | 48 | 0.3% |
| Philippines | 114 | 0.8% |
| Russia | 30 | 0.2% |
| South America | 72 | 0.5% |
| South Central Asia | 1,439 | 9.9% |
| South Eastern Asia | 348 | 2.4% |
| Southern Europe | 10 | 0.1% |
| Sri Lanka | 174 | 1.2% |
| Syria | 9 | 0.1% |
| Thailand | 8 | 0.1% |
| Vietnam | 180 | 1.2% |
| Western Africa | 67 | 0.5% |
| Western Asia | 177 | 1.2% |
| Western Europe | 81 | 0.6% |
| Yemen | 41 | 0.3% |
| Zimbabwe | 16 | 0.1% | View All 55 Rows |
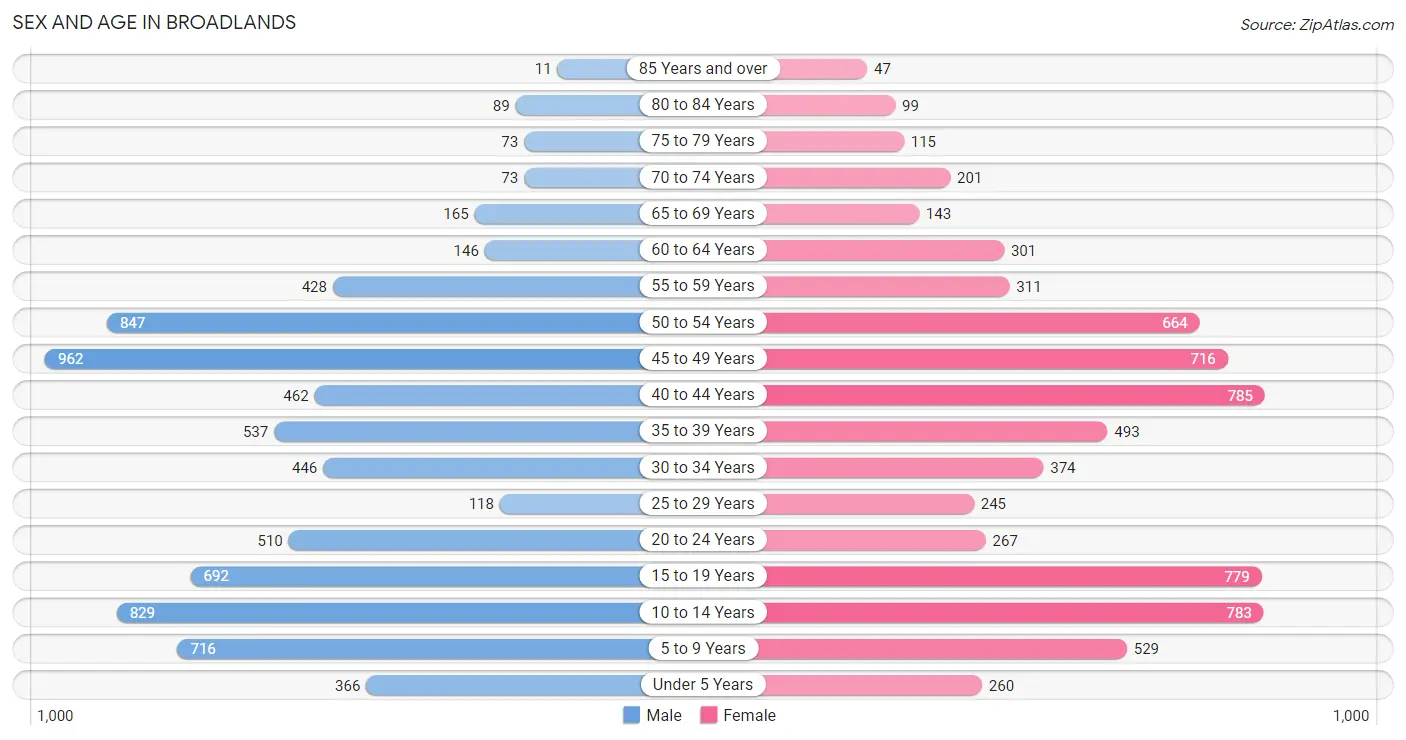
Sex and Age in Broadlands
Sex and Age in Broadlands
The most populous age groups in Broadlands are 45 to 49 Years (962 | 12.9%) for men and 40 to 44 Years (785 | 11.0%) for women.
| Age Bracket | Male | Female |
| Under 5 Years | 366 (4.9%) | 260 (3.7%) |
| 5 to 9 Years | 716 (9.6%) | 529 (7.4%) |
| 10 to 14 Years | 829 (11.1%) | 783 (11.0%) |
| 15 to 19 Years | 692 (9.3%) | 779 (11.0%) |
| 20 to 24 Years | 510 (6.8%) | 267 (3.7%) |
| 25 to 29 Years | 118 (1.6%) | 245 (3.4%) |
| 30 to 34 Years | 446 (6.0%) | 374 (5.3%) |
| 35 to 39 Years | 537 (7.2%) | 493 (6.9%) |
| 40 to 44 Years | 462 (6.2%) | 785 (11.0%) |
| 45 to 49 Years | 962 (12.9%) | 716 (10.1%) |
| 50 to 54 Years | 847 (11.3%) | 664 (9.3%) |
| 55 to 59 Years | 428 (5.7%) | 311 (4.4%) |
| 60 to 64 Years | 146 (1.9%) | 301 (4.2%) |
| 65 to 69 Years | 165 (2.2%) | 143 (2.0%) |
| 70 to 74 Years | 73 (1.0%) | 201 (2.8%) |
| 75 to 79 Years | 73 (1.0%) | 115 (1.6%) |
| 80 to 84 Years | 89 (1.2%) | 99 (1.4%) |
| 85 Years and over | 11 (0.2%) | 47 (0.7%) |
| Total | 7,470 (100.0%) | 7,112 (100.0%) |
Families and Households in Broadlands
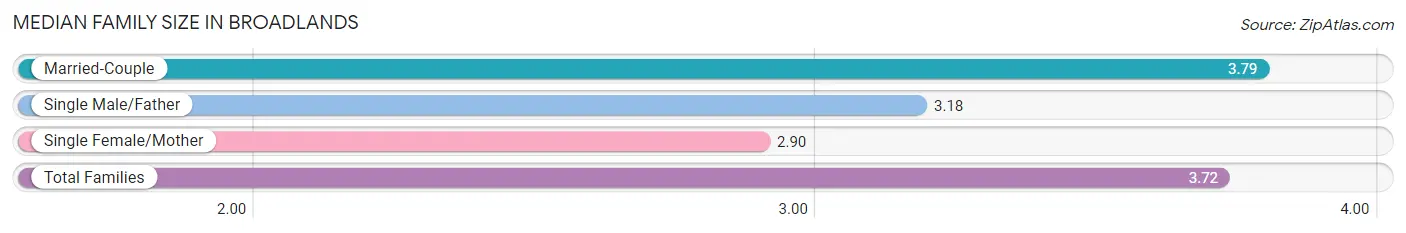
Median Family Size in Broadlands
The median family size in Broadlands is 3.72 persons per family, with married-couple families (3,309 | 90.9%) accounting for the largest median family size of 3.79 persons per family. On the other hand, single female/mother families (191 | 5.2%) represent the smallest median family size with 2.90 persons per family.
| Family Type | # Families | Family Size |
| Married-Couple | 3,309 (90.9%) | 3.79 |
| Single Male/Father | 142 (3.9%) | 3.18 |
| Single Female/Mother | 191 (5.2%) | 2.90 |
| Total Families | 3,642 (100.0%) | 3.72 |
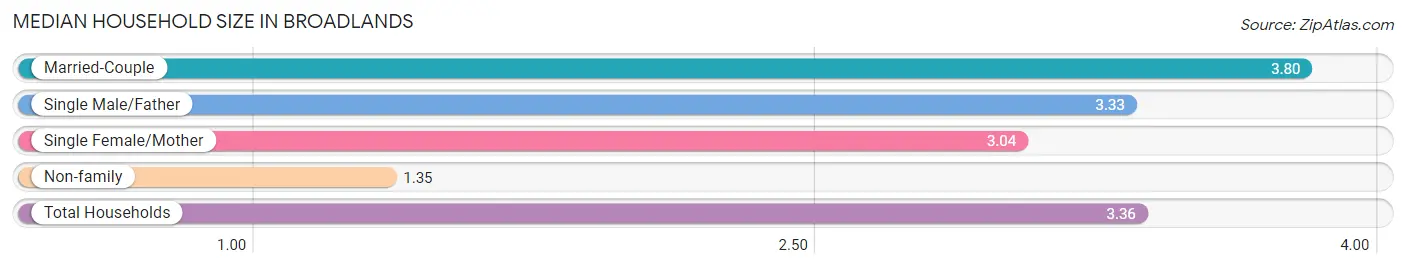
Median Household Size in Broadlands
The median household size in Broadlands is 3.36 persons per household, with married-couple households (3,309 | 76.2%) accounting for the largest median household size of 3.8 persons per household. non-family households (703 | 16.2%) represent the smallest median household size with 1.35 persons per household.
| Household Type | # Households | Household Size |
| Married-Couple | 3,309 (76.2%) | 3.80 |
| Single Male/Father | 142 (3.3%) | 3.33 |
| Single Female/Mother | 191 (4.4%) | 3.04 |
| Non-family | 703 (16.2%) | 1.35 |
| Total Households | 4,345 (100.0%) | 3.36 |
Household Size by Marriage Status in Broadlands
Out of a total of 4,345 households in Broadlands, 3,642 (83.8%) are family households, while 703 (16.2%) are nonfamily households. The most numerous type of family households are 4-person households, comprising 1,437, and the most common type of nonfamily households are 1-person households, comprising 499.
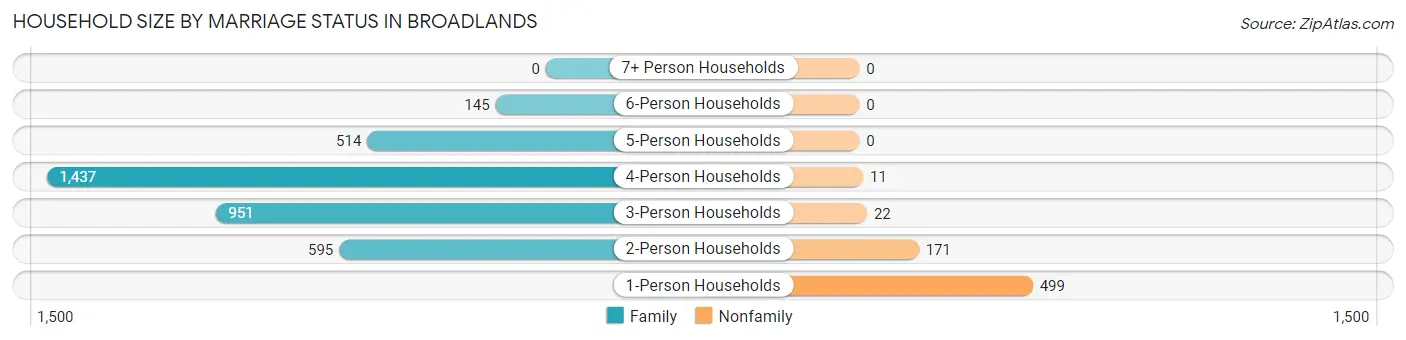
| Household Size | Family Households | Nonfamily Households |
| 1-Person Households | - | 499 (11.5%) |
| 2-Person Households | 595 (13.7%) | 171 (3.9%) |
| 3-Person Households | 951 (21.9%) | 22 (0.5%) |
| 4-Person Households | 1,437 (33.1%) | 11 (0.3%) |
| 5-Person Households | 514 (11.8%) | 0 (0.0%) |
| 6-Person Households | 145 (3.3%) | 0 (0.0%) |
| 7+ Person Households | 0 (0.0%) | 0 (0.0%) |
| Total | 3,642 (83.8%) | 703 (16.2%) |
Female Fertility in Broadlands
Fertility by Age in Broadlands
Average fertility rate in Broadlands is 26.0 births per 1,000 women. Women in the age bracket of 20 to 34 years have the highest fertility rate with 78.0 births per 1,000 women. Women in the age bracket of 20 to 34 years acount for 71.9% of all women with births.
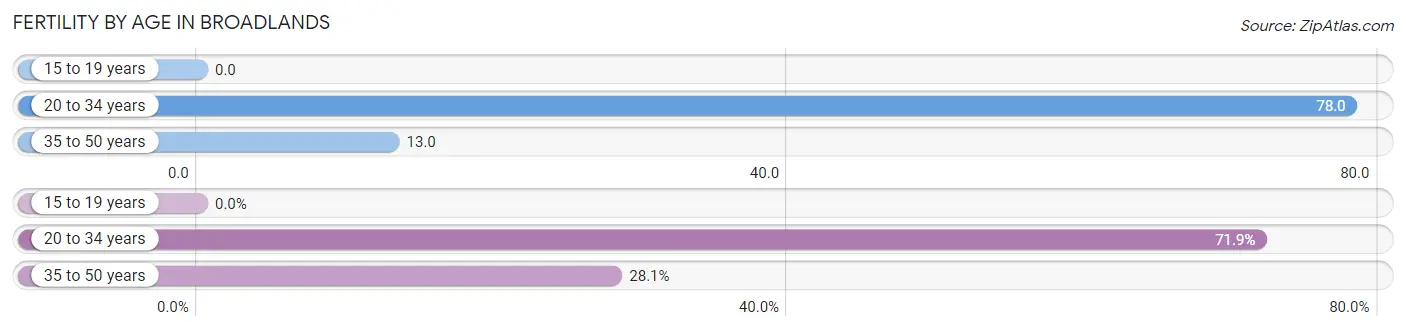
| Age Bracket | Women with Births | Births / 1,000 Women |
| 15 to 19 years | 0 (0.0%) | 0.0 |
| 20 to 34 years | 69 (71.9%) | 78.0 |
| 35 to 50 years | 27 (28.1%) | 13.0 |
| Total | 96 (100.0%) | 26.0 |
Fertility by Age by Marriage Status in Broadlands
87.5% of women with births (96) in Broadlands are married. The highest percentage of unmarried women with births falls into 20 to 34 years age bracket with 17.4% of them unmarried at the time of birth, while the lowest percentage of unmarried women with births belong to 35 to 50 years age bracket with 0.0% of them unmarried.
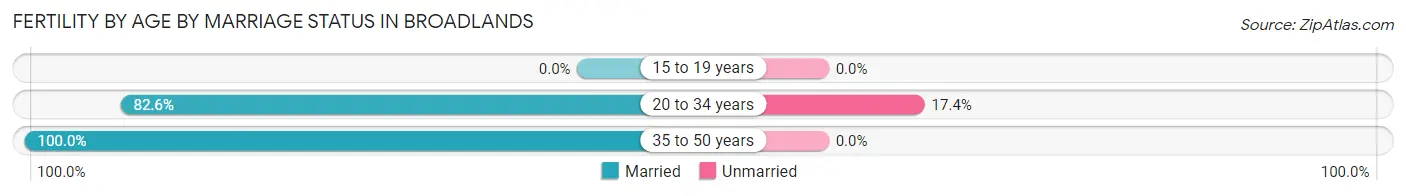
| Age Bracket | Married | Unmarried |
| 15 to 19 years | 0 (0.0%) | 0 (0.0%) |
| 20 to 34 years | 57 (82.6%) | 12 (17.4%) |
| 35 to 50 years | 27 (100.0%) | 0 (0.0%) |
| Total | 84 (87.5%) | 12 (12.5%) |
Fertility by Education in Broadlands
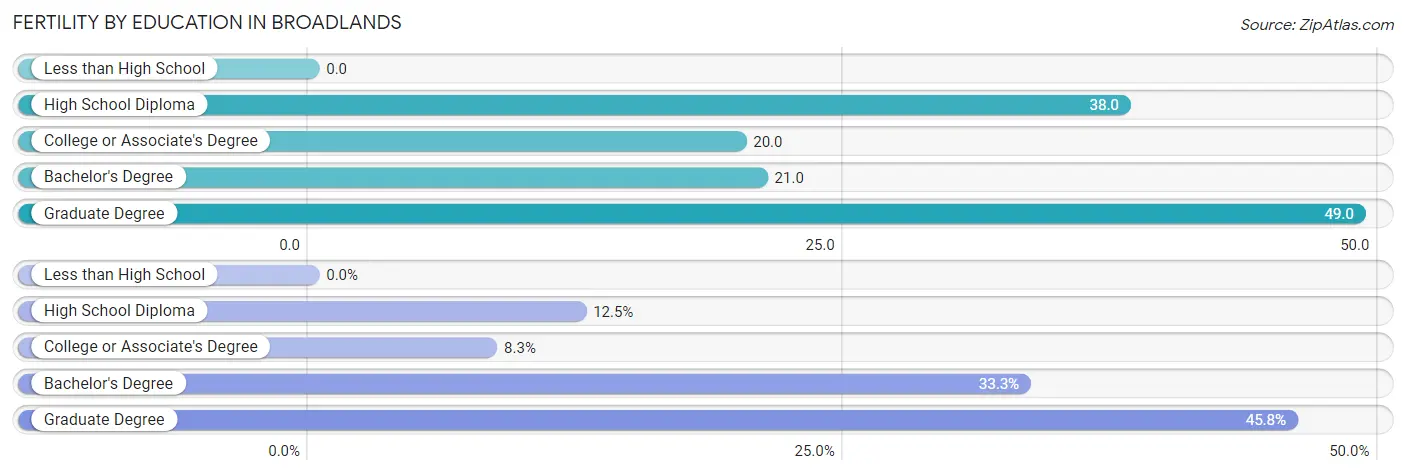
| Educational Attainment | Women with Births | Births / 1,000 Women |
| Less than High School | 0 (0.0%) | 0.0 |
| High School Diploma | 12 (12.5%) | 38.0 |
| College or Associate's Degree | 8 (8.3%) | 20.0 |
| Bachelor's Degree | 32 (33.3%) | 21.0 |
| Graduate Degree | 44 (45.8%) | 49.0 |
| Total | 96 (100.0%) | 26.0 |
Fertility by Education by Marriage Status in Broadlands
12.5% of women with births in Broadlands are unmarried. Women with the educational attainment of college or associate's degree are most likely to be married with 100.0% of them married at childbirth, while women with the educational attainment of high school diploma are least likely to be married with 100.0% of them unmarried at childbirth.
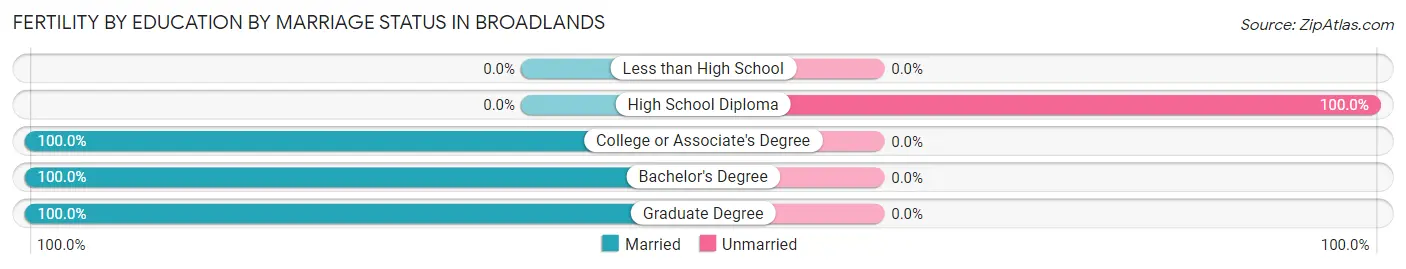
| Educational Attainment | Married | Unmarried |
| Less than High School | 0 (0.0%) | 0 (0.0%) |
| High School Diploma | 0 (0.0%) | 12 (100.0%) |
| College or Associate's Degree | 8 (100.0%) | 0 (0.0%) |
| Bachelor's Degree | 32 (100.0%) | 0 (0.0%) |
| Graduate Degree | 44 (100.0%) | 0 (0.0%) |
| Total | 84 (87.5%) | 12 (12.5%) |
Employment Characteristics in Broadlands
Employment by Class of Employer in Broadlands
Among the 7,831 employed individuals in Broadlands, private company employees (5,643 | 72.1%), federal government employees (678 | 8.7%), and local government employees (492 | 6.3%) make up the most common classes of employment.
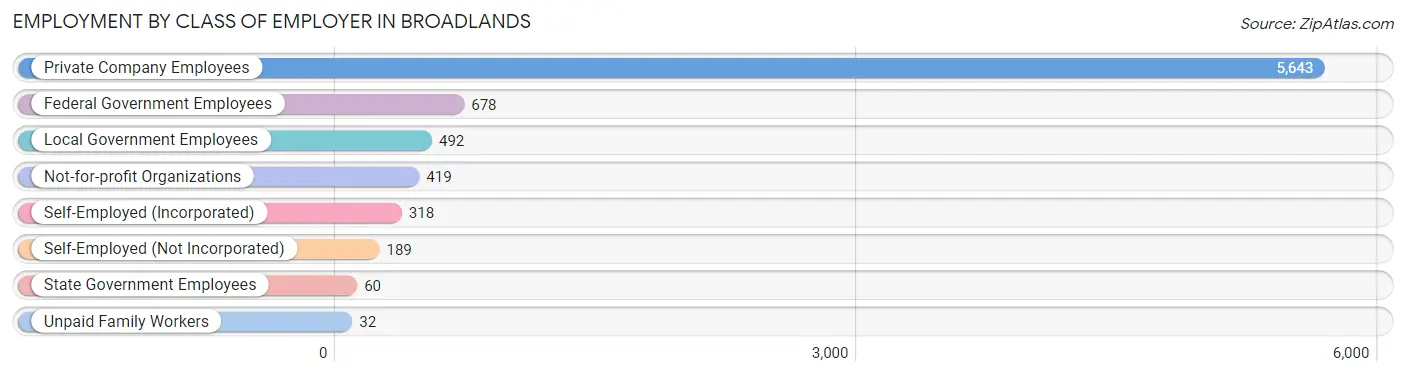
| Employer Class | # Employees | % Employees |
| Private Company Employees | 5,643 | 72.1% |
| Self-Employed (Incorporated) | 318 | 4.1% |
| Self-Employed (Not Incorporated) | 189 | 2.4% |
| Not-for-profit Organizations | 419 | 5.3% |
| Local Government Employees | 492 | 6.3% |
| State Government Employees | 60 | 0.8% |
| Federal Government Employees | 678 | 8.7% |
| Unpaid Family Workers | 32 | 0.4% |
| Total | 7,831 | 100.0% |
Employment Status by Age in Broadlands
According to the labor force statistics for Broadlands, out of the total population over 16 years of age (10,769), 74.9% or 8,066 individuals are in the labor force, with 2.4% or 194 of them unemployed. The age group with the highest labor force participation rate is 25 to 29 years, with 100.0% or 363 individuals in the labor force. Within the labor force, the 20 to 24 years age range has the highest percentage of unemployed individuals, with 18.0% or 94 of them being unemployed.
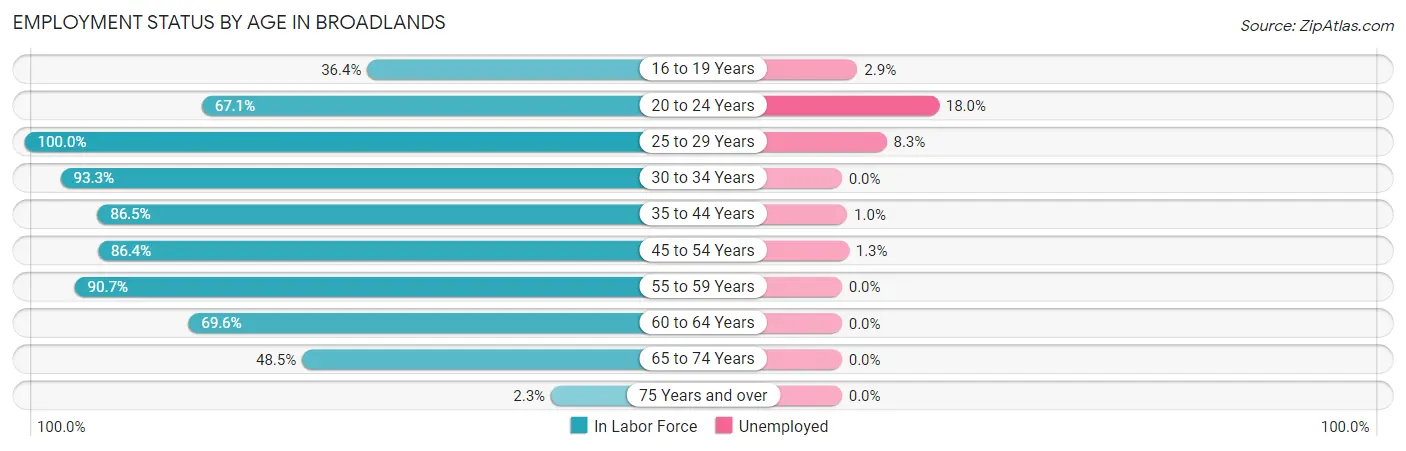
| Age Bracket | In Labor Force | Unemployed |
| 16 to 19 Years | 415 (36.4%) | 12 (2.9%) |
| 20 to 24 Years | 521 (67.1%) | 94 (18.0%) |
| 25 to 29 Years | 363 (100.0%) | 30 (8.3%) |
| 30 to 34 Years | 765 (93.3%) | 0 (0.0%) |
| 35 to 44 Years | 1,970 (86.5%) | 20 (1.0%) |
| 45 to 54 Years | 2,755 (86.4%) | 36 (1.3%) |
| 55 to 59 Years | 670 (90.7%) | 0 (0.0%) |
| 60 to 64 Years | 311 (69.6%) | 0 (0.0%) |
| 65 to 74 Years | 282 (48.5%) | 0 (0.0%) |
| 75 Years and over | 10 (2.3%) | 0 (0.0%) |
| Total | 8,066 (74.9%) | 194 (2.4%) |
Employment Status by Educational Attainment in Broadlands
According to labor force statistics for Broadlands, 87.2% of individuals (6,832) out of the total population between 25 and 64 years of age (7,835) are in the labor force, with 1.2% or 82 of them being unemployed. The group with the highest labor force participation rate are those with the educational attainment of bachelor's degree or higher, with 89.0% or 5,681 individuals in the labor force. Within the labor force, individuals with less than high school education have the highest percentage of unemployment, with 21.3% or 13 of them being unemployed.
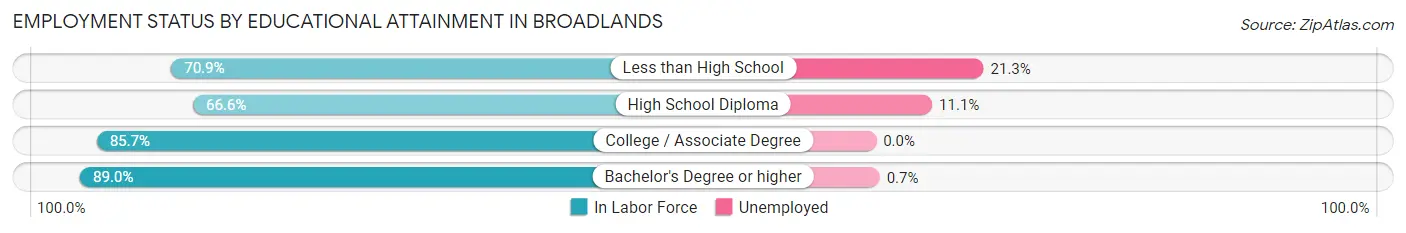
| Educational Attainment | In Labor Force | Unemployed |
| Less than High School | 61 (70.9%) | 18 (21.3%) |
| High School Diploma | 271 (66.6%) | 45 (11.1%) |
| College / Associate Degree | 822 (85.7%) | 0 (0.0%) |
| Bachelor's Degree or higher | 5,681 (89.0%) | 45 (0.7%) |
| Total | 6,832 (87.2%) | 94 (1.2%) |
Employment Occupations by Sex in Broadlands
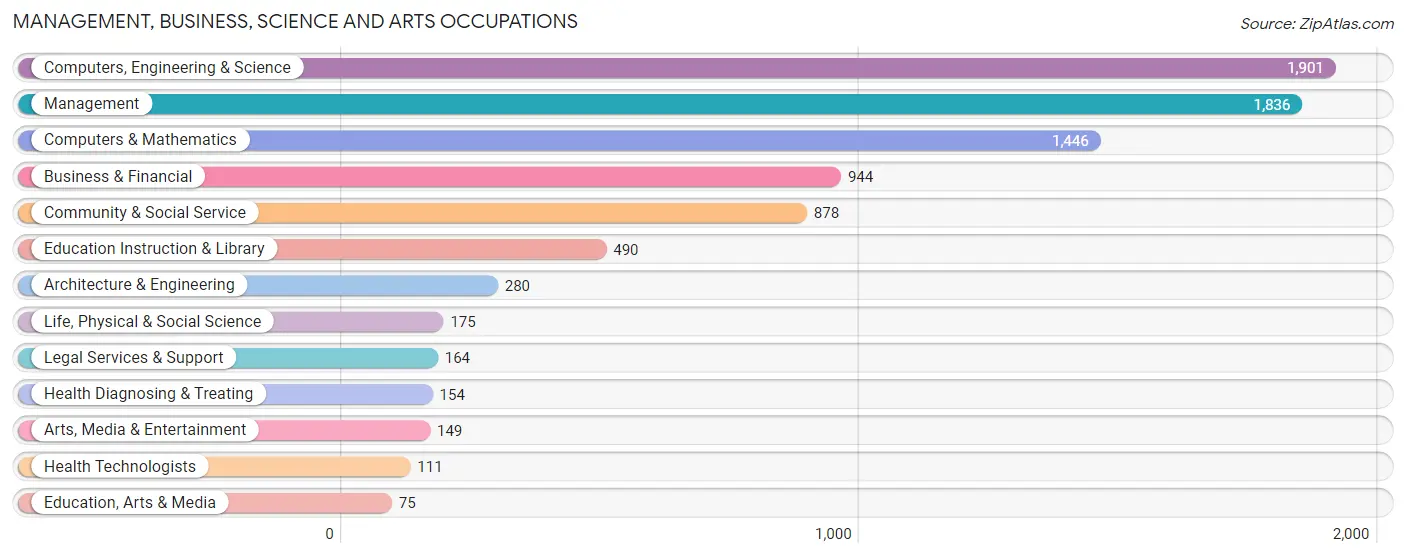
Management, Business, Science and Arts Occupations
The most common Management, Business, Science and Arts occupations in Broadlands are Computers, Engineering & Science (1,901 | 24.2%), Management (1,836 | 23.4%), Computers & Mathematics (1,446 | 18.4%), Business & Financial (944 | 12.0%), and Community & Social Service (878 | 11.2%).
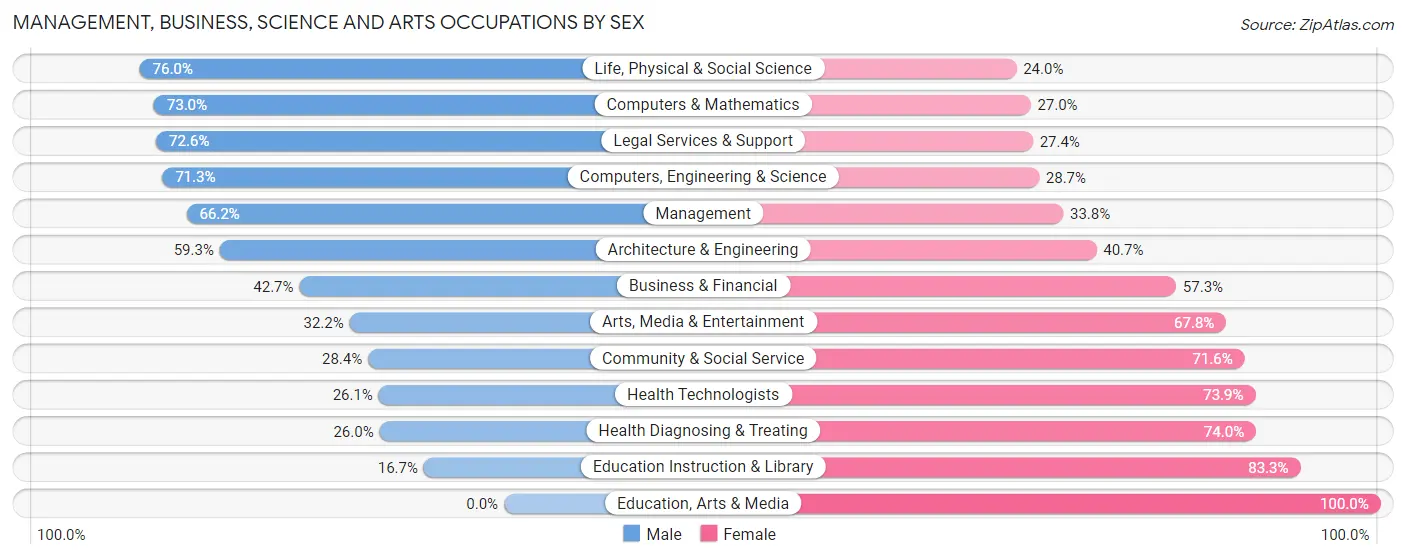
Management, Business, Science and Arts Occupations by Sex
Within the Management, Business, Science and Arts occupations in Broadlands, the most male-oriented occupations are Life, Physical & Social Science (76.0%), Computers & Mathematics (73.0%), and Legal Services & Support (72.6%), while the most female-oriented occupations are Education, Arts & Media (100.0%), Education Instruction & Library (83.3%), and Health Diagnosing & Treating (74.0%).
| Occupation | Male | Female |
| Management | 1,216 (66.2%) | 620 (33.8%) |
| Business & Financial | 403 (42.7%) | 541 (57.3%) |
| Computers, Engineering & Science | 1,355 (71.3%) | 546 (28.7%) |
| Computers & Mathematics | 1,056 (73.0%) | 390 (27.0%) |
| Architecture & Engineering | 166 (59.3%) | 114 (40.7%) |
| Life, Physical & Social Science | 133 (76.0%) | 42 (24.0%) |
| Community & Social Service | 249 (28.4%) | 629 (71.6%) |
| Education, Arts & Media | 0 (0.0%) | 75 (100.0%) |
| Legal Services & Support | 119 (72.6%) | 45 (27.4%) |
| Education Instruction & Library | 82 (16.7%) | 408 (83.3%) |
| Arts, Media & Entertainment | 48 (32.2%) | 101 (67.8%) |
| Health Diagnosing & Treating | 40 (26.0%) | 114 (74.0%) |
| Health Technologists | 29 (26.1%) | 82 (73.9%) |
| Total (Category) | 3,263 (57.1%) | 2,450 (42.9%) |
| Total (Overall) | 4,348 (55.3%) | 3,511 (44.7%) |
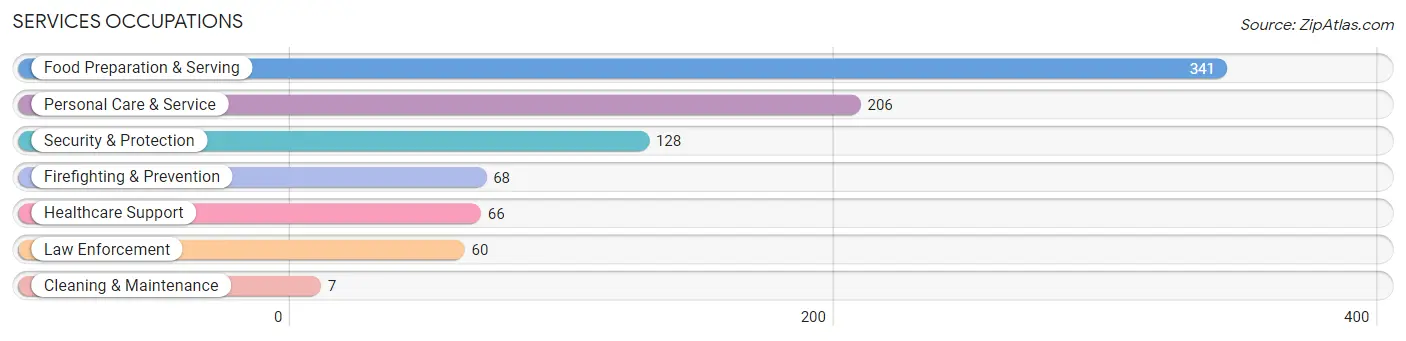
Services Occupations
The most common Services occupations in Broadlands are Food Preparation & Serving (341 | 4.3%), Personal Care & Service (206 | 2.6%), Security & Protection (128 | 1.6%), Firefighting & Prevention (68 | 0.9%), and Healthcare Support (66 | 0.8%).
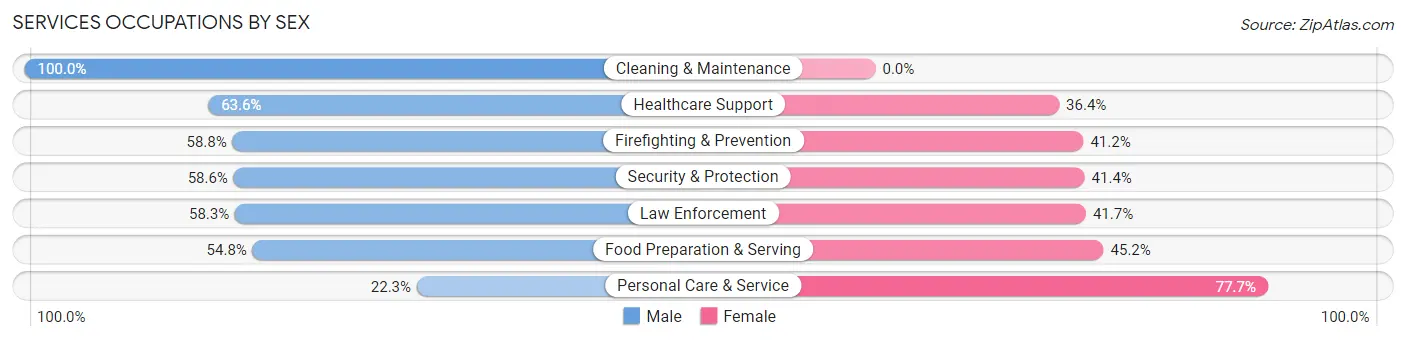
Services Occupations by Sex
Within the Services occupations in Broadlands, the most male-oriented occupations are Cleaning & Maintenance (100.0%), Healthcare Support (63.6%), and Firefighting & Prevention (58.8%), while the most female-oriented occupations are Personal Care & Service (77.7%), Food Preparation & Serving (45.2%), and Law Enforcement (41.7%).
| Occupation | Male | Female |
| Healthcare Support | 42 (63.6%) | 24 (36.4%) |
| Security & Protection | 75 (58.6%) | 53 (41.4%) |
| Firefighting & Prevention | 40 (58.8%) | 28 (41.2%) |
| Law Enforcement | 35 (58.3%) | 25 (41.7%) |
| Food Preparation & Serving | 187 (54.8%) | 154 (45.2%) |
| Cleaning & Maintenance | 7 (100.0%) | 0 (0.0%) |
| Personal Care & Service | 46 (22.3%) | 160 (77.7%) |
| Total (Category) | 357 (47.7%) | 391 (52.3%) |
| Total (Overall) | 4,348 (55.3%) | 3,511 (44.7%) |
Sales and Office Occupations
The most common Sales and Office occupations in Broadlands are Sales & Related (648 | 8.3%), and Office & Administration (451 | 5.7%).
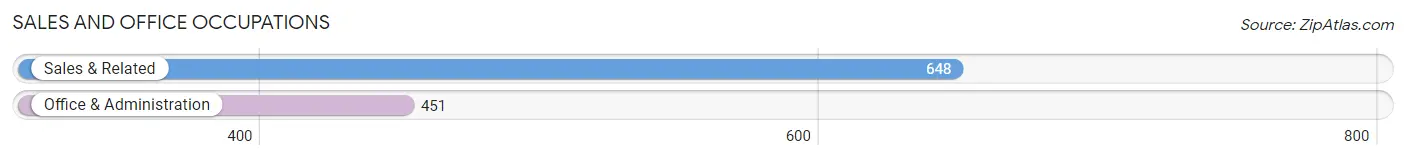
Sales and Office Occupations by Sex
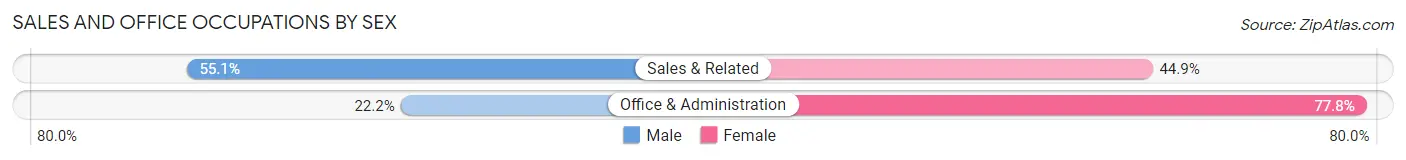
| Occupation | Male | Female |
| Sales & Related | 357 (55.1%) | 291 (44.9%) |
| Office & Administration | 100 (22.2%) | 351 (77.8%) |
| Total (Category) | 457 (41.6%) | 642 (58.4%) |
| Total (Overall) | 4,348 (55.3%) | 3,511 (44.7%) |
Natural Resources, Construction and Maintenance Occupations
The most common Natural Resources, Construction and Maintenance occupations in Broadlands are Construction & Extraction (73 | 0.9%), and Installation, Maintenance & Repair (44 | 0.6%).
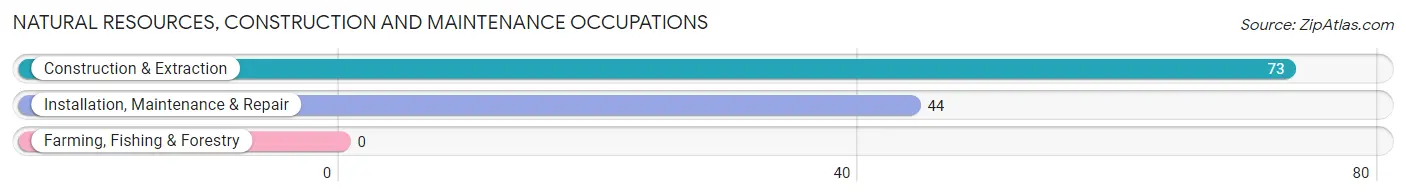
Natural Resources, Construction and Maintenance Occupations by Sex
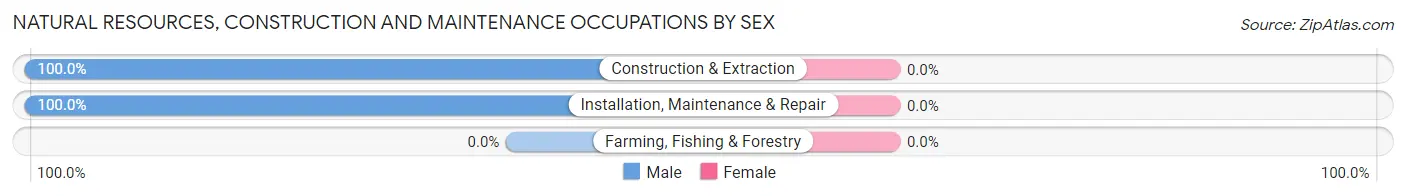
| Occupation | Male | Female |
| Farming, Fishing & Forestry | 0 (0.0%) | 0 (0.0%) |
| Construction & Extraction | 73 (100.0%) | 0 (0.0%) |
| Installation, Maintenance & Repair | 44 (100.0%) | 0 (0.0%) |
| Total (Category) | 117 (100.0%) | 0 (0.0%) |
| Total (Overall) | 4,348 (55.3%) | 3,511 (44.7%) |
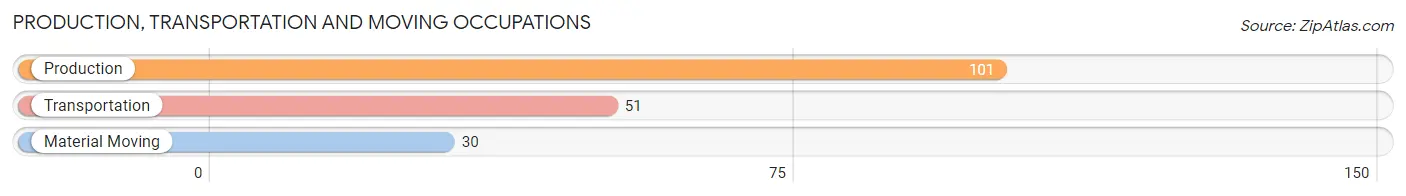
Production, Transportation and Moving Occupations
The most common Production, Transportation and Moving occupations in Broadlands are Production (101 | 1.3%), Transportation (51 | 0.6%), and Material Moving (30 | 0.4%).
Production, Transportation and Moving Occupations by Sex
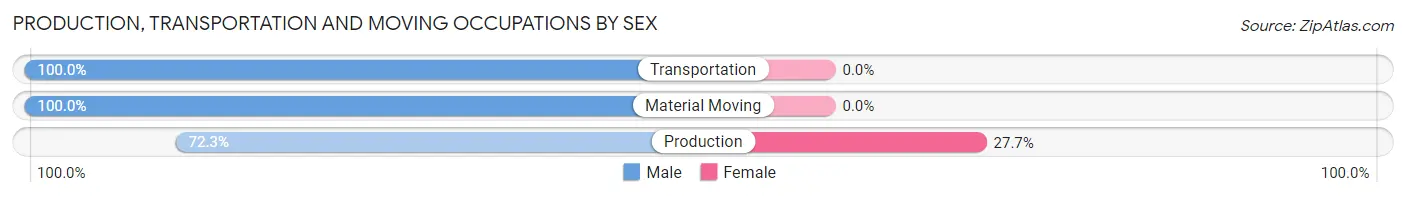
| Occupation | Male | Female |
| Production | 73 (72.3%) | 28 (27.7%) |
| Transportation | 51 (100.0%) | 0 (0.0%) |
| Material Moving | 30 (100.0%) | 0 (0.0%) |
| Total (Category) | 154 (84.6%) | 28 (15.4%) |
| Total (Overall) | 4,348 (55.3%) | 3,511 (44.7%) |
Employment Industries by Sex in Broadlands
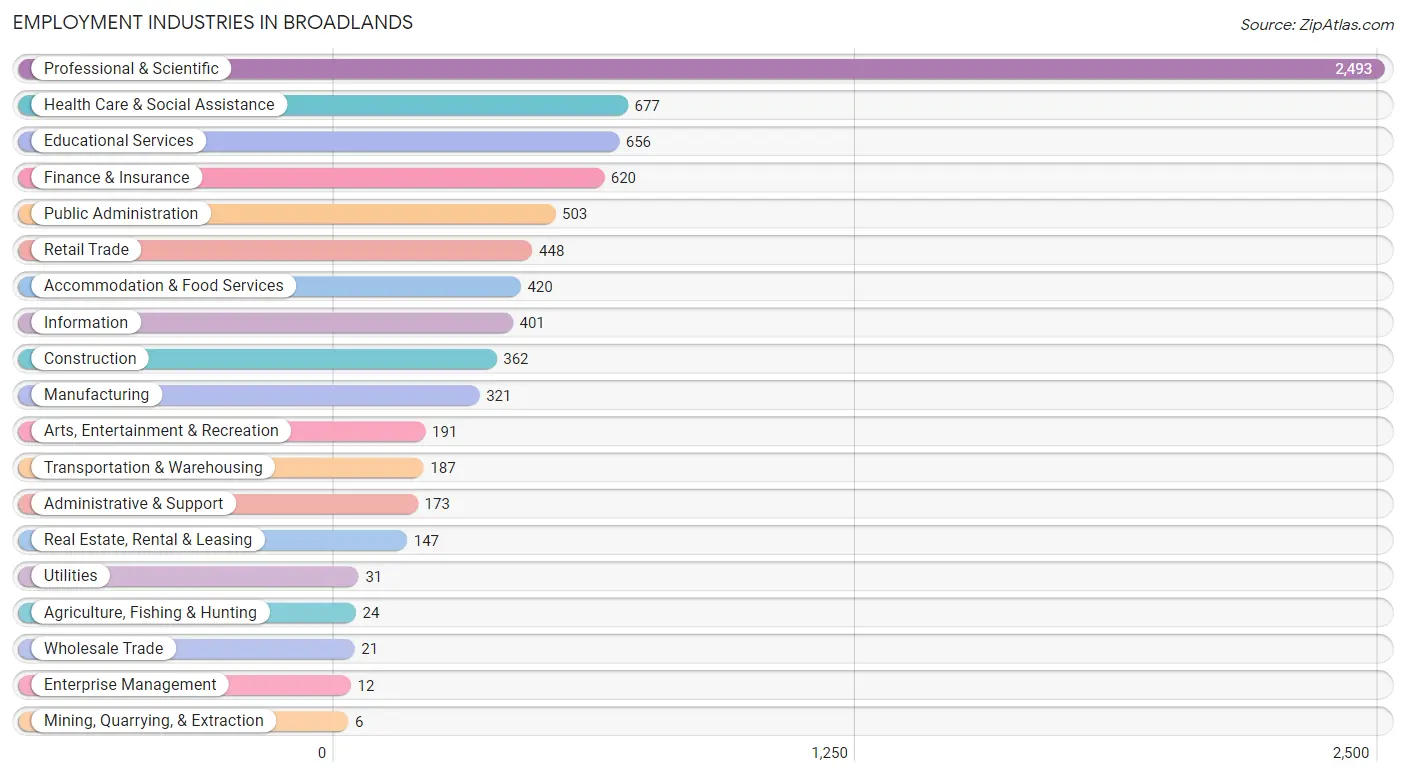
Employment Industries in Broadlands
The major employment industries in Broadlands include Professional & Scientific (2,493 | 31.7%), Health Care & Social Assistance (677 | 8.6%), Educational Services (656 | 8.4%), Finance & Insurance (620 | 7.9%), and Public Administration (503 | 6.4%).
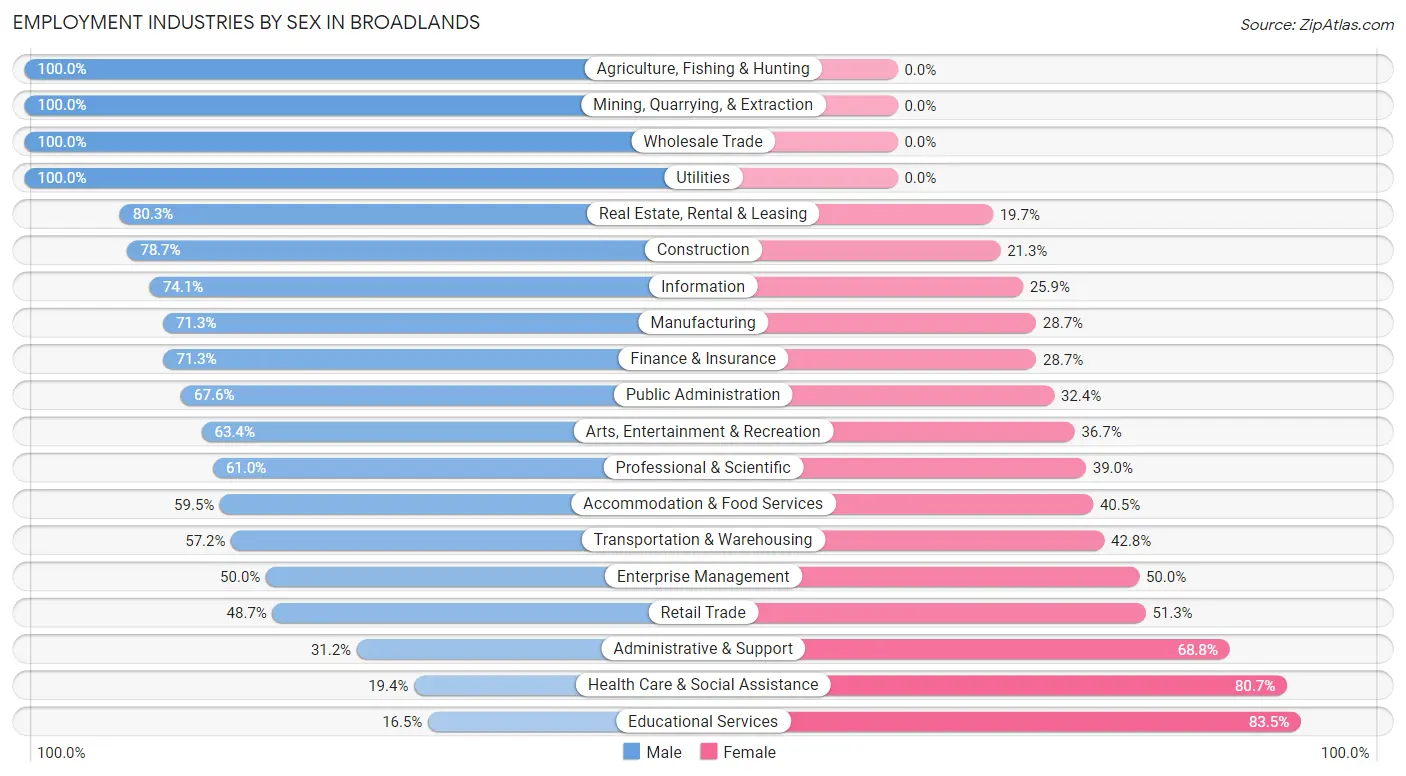
Employment Industries by Sex in Broadlands
The Broadlands industries that see more men than women are Agriculture, Fishing & Hunting (100.0%), Mining, Quarrying, & Extraction (100.0%), and Wholesale Trade (100.0%), whereas the industries that tend to have a higher number of women are Educational Services (83.5%), Health Care & Social Assistance (80.6%), and Administrative & Support (68.8%).
| Industry | Male | Female |
| Agriculture, Fishing & Hunting | 24 (100.0%) | 0 (0.0%) |
| Mining, Quarrying, & Extraction | 6 (100.0%) | 0 (0.0%) |
| Construction | 285 (78.7%) | 77 (21.3%) |
| Manufacturing | 229 (71.3%) | 92 (28.7%) |
| Wholesale Trade | 21 (100.0%) | 0 (0.0%) |
| Retail Trade | 218 (48.7%) | 230 (51.3%) |
| Transportation & Warehousing | 107 (57.2%) | 80 (42.8%) |
| Utilities | 31 (100.0%) | 0 (0.0%) |
| Information | 297 (74.1%) | 104 (25.9%) |
| Finance & Insurance | 442 (71.3%) | 178 (28.7%) |
| Real Estate, Rental & Leasing | 118 (80.3%) | 29 (19.7%) |
| Professional & Scientific | 1,521 (61.0%) | 972 (39.0%) |
| Enterprise Management | 6 (50.0%) | 6 (50.0%) |
| Administrative & Support | 54 (31.2%) | 119 (68.8%) |
| Educational Services | 108 (16.5%) | 548 (83.5%) |
| Health Care & Social Assistance | 131 (19.4%) | 546 (80.6%) |
| Arts, Entertainment & Recreation | 121 (63.3%) | 70 (36.6%) |
| Accommodation & Food Services | 250 (59.5%) | 170 (40.5%) |
| Public Administration | 340 (67.6%) | 163 (32.4%) |
| Total | 4,348 (55.3%) | 3,511 (44.7%) |
Education in Broadlands
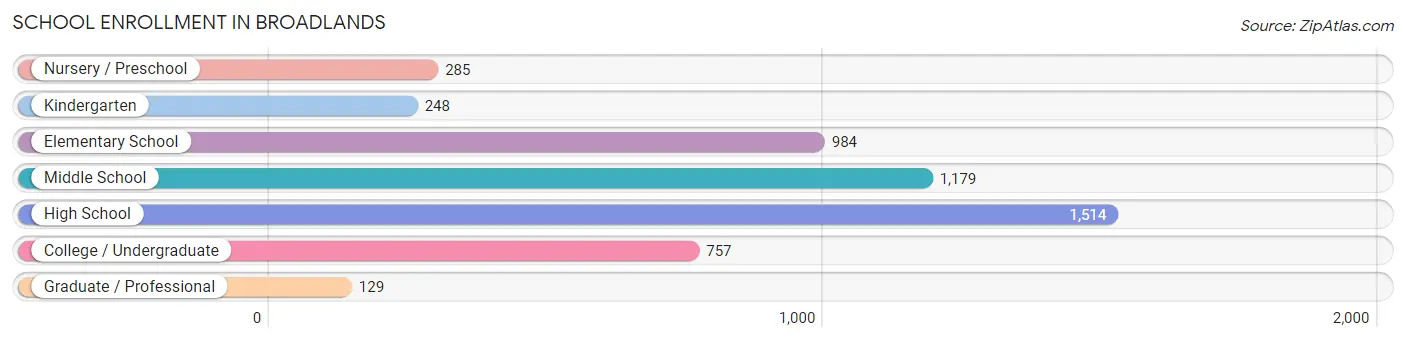
School Enrollment in Broadlands
The most common levels of schooling among the 5,096 students in Broadlands are high school (1,514 | 29.7%), middle school (1,179 | 23.1%), and elementary school (984 | 19.3%).
| School Level | # Students | % Students |
| Nursery / Preschool | 285 | 5.6% |
| Kindergarten | 248 | 4.9% |
| Elementary School | 984 | 19.3% |
| Middle School | 1,179 | 23.1% |
| High School | 1,514 | 29.7% |
| College / Undergraduate | 757 | 14.8% |
| Graduate / Professional | 129 | 2.5% |
| Total | 5,096 | 100.0% |
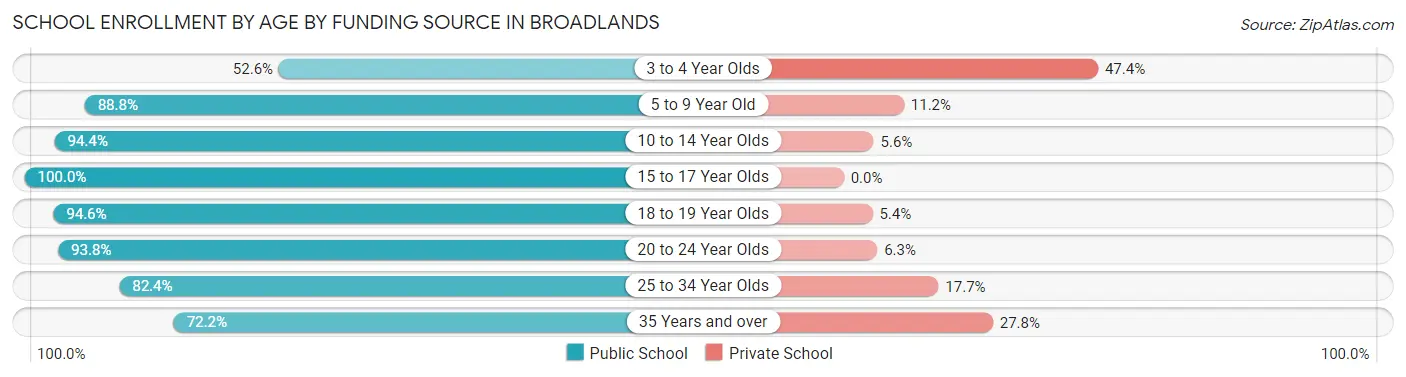
School Enrollment by Age by Funding Source in Broadlands
Out of a total of 5,096 students who are enrolled in schools in Broadlands, 408 (8.0%) attend a private institution, while the remaining 4,688 (92.0%) are enrolled in public schools. The age group of 3 to 4 year olds has the highest likelihood of being enrolled in private schools, with 81 (47.4% in the age bracket) enrolled. Conversely, the age group of 15 to 17 year olds has the lowest likelihood of being enrolled in a private school, with 986 (100.0% in the age bracket) attending a public institution.
| Age Bracket | Public School | Private School |
| 3 to 4 Year Olds | 90 (52.6%) | 81 (47.4%) |
| 5 to 9 Year Old | 1,069 (88.8%) | 135 (11.2%) |
| 10 to 14 Year Olds | 1,522 (94.4%) | 90 (5.6%) |
| 15 to 17 Year Olds | 986 (100.0%) | 0 (0.0%) |
| 18 to 19 Year Olds | 424 (94.6%) | 24 (5.4%) |
| 20 to 24 Year Olds | 450 (93.8%) | 30 (6.2%) |
| 25 to 34 Year Olds | 42 (82.4%) | 9 (17.6%) |
| 35 Years and over | 104 (72.2%) | 40 (27.8%) |
| Total | 4,688 (92.0%) | 408 (8.0%) |
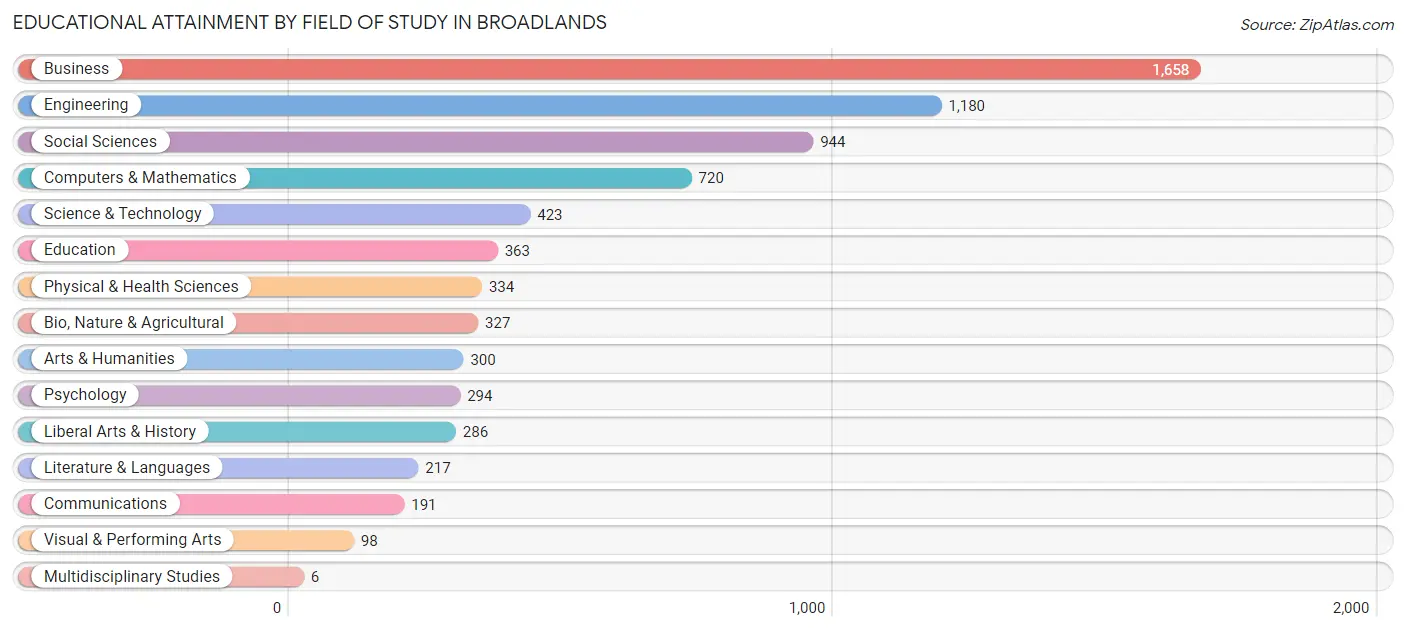
Educational Attainment by Field of Study in Broadlands
Business (1,658 | 22.6%), engineering (1,180 | 16.1%), social sciences (944 | 12.9%), computers & mathematics (720 | 9.8%), and science & technology (423 | 5.8%) are the most common fields of study among 7,341 individuals in Broadlands who have obtained a bachelor's degree or higher.
| Field of Study | # Graduates | % Graduates |
| Computers & Mathematics | 720 | 9.8% |
| Bio, Nature & Agricultural | 327 | 4.4% |
| Physical & Health Sciences | 334 | 4.5% |
| Psychology | 294 | 4.0% |
| Social Sciences | 944 | 12.9% |
| Engineering | 1,180 | 16.1% |
| Multidisciplinary Studies | 6 | 0.1% |
| Science & Technology | 423 | 5.8% |
| Business | 1,658 | 22.6% |
| Education | 363 | 4.9% |
| Literature & Languages | 217 | 3.0% |
| Liberal Arts & History | 286 | 3.9% |
| Visual & Performing Arts | 98 | 1.3% |
| Communications | 191 | 2.6% |
| Arts & Humanities | 300 | 4.1% |
| Total | 7,341 | 100.0% |
Transportation & Commute in Broadlands
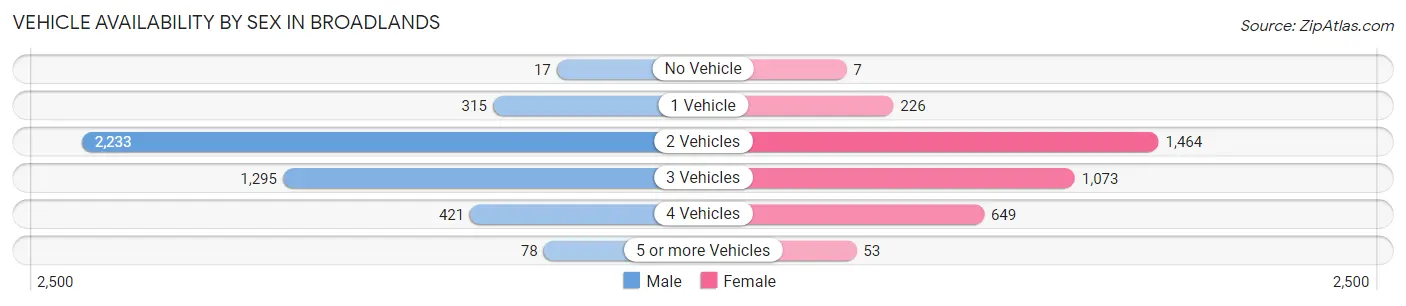
Vehicle Availability by Sex in Broadlands
The most prevalent vehicle ownership categories in Broadlands are males with 2 vehicles (2,233, accounting for 51.2%) and females with 2 vehicles (1,464, making up 64.3%).
| Vehicles Available | Male | Female |
| No Vehicle | 17 (0.4%) | 7 (0.2%) |
| 1 Vehicle | 315 (7.2%) | 226 (6.5%) |
| 2 Vehicles | 2,233 (51.2%) | 1,464 (42.2%) |
| 3 Vehicles | 1,295 (29.7%) | 1,073 (30.9%) |
| 4 Vehicles | 421 (9.7%) | 649 (18.7%) |
| 5 or more Vehicles | 78 (1.8%) | 53 (1.5%) |
| Total | 4,359 (100.0%) | 3,472 (100.0%) |
Commute Time in Broadlands
The most frequently occuring commute durations in Broadlands are 45 to 59 minutes (745 commuters, 13.6%), 30 to 34 minutes (729 commuters, 13.3%), and 15 to 19 minutes (707 commuters, 12.9%).
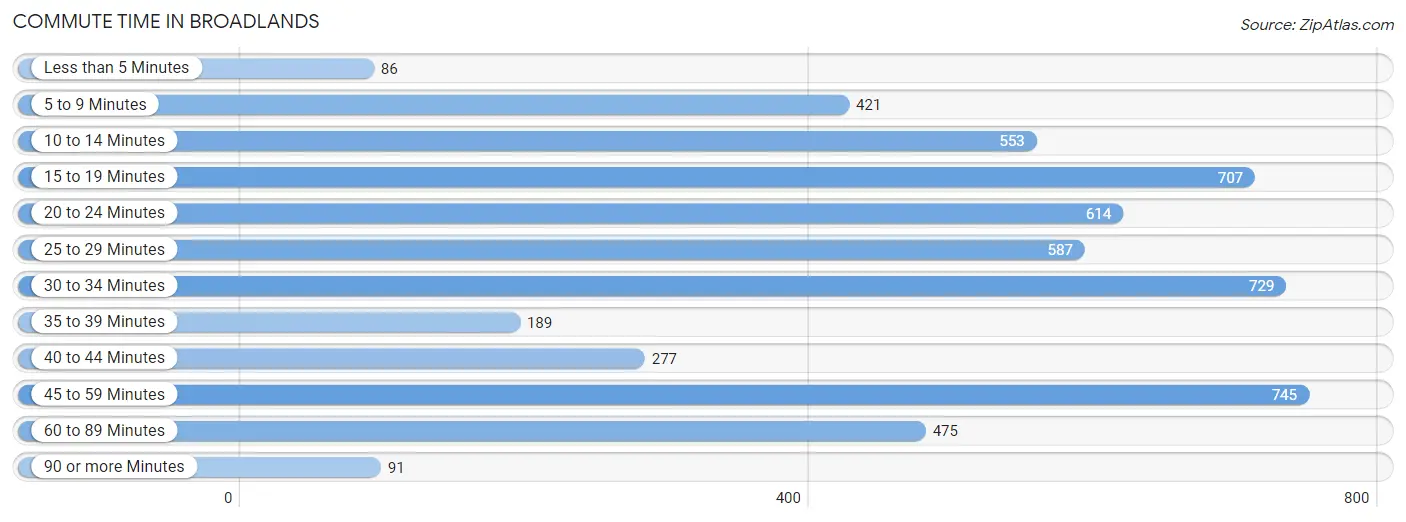
| Commute Time | # Commuters | % Commuters |
| Less than 5 Minutes | 86 | 1.6% |
| 5 to 9 Minutes | 421 | 7.7% |
| 10 to 14 Minutes | 553 | 10.1% |
| 15 to 19 Minutes | 707 | 12.9% |
| 20 to 24 Minutes | 614 | 11.2% |
| 25 to 29 Minutes | 587 | 10.7% |
| 30 to 34 Minutes | 729 | 13.3% |
| 35 to 39 Minutes | 189 | 3.5% |
| 40 to 44 Minutes | 277 | 5.1% |
| 45 to 59 Minutes | 745 | 13.6% |
| 60 to 89 Minutes | 475 | 8.7% |
| 90 or more Minutes | 91 | 1.7% |
Commute Time by Sex in Broadlands
The most common commute times in Broadlands are 10 to 14 minutes (452 commuters, 15.0%) for males and 25 to 29 minutes (359 commuters, 14.6%) for females.
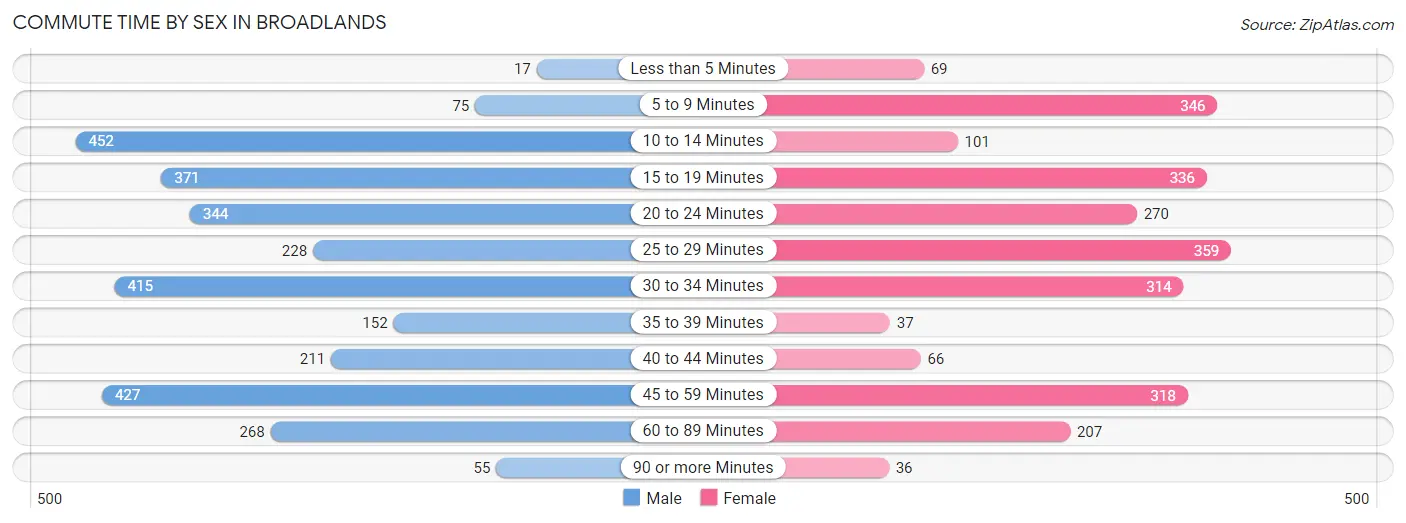
| Commute Time | Male | Female |
| Less than 5 Minutes | 17 (0.6%) | 69 (2.8%) |
| 5 to 9 Minutes | 75 (2.5%) | 346 (14.1%) |
| 10 to 14 Minutes | 452 (15.0%) | 101 (4.1%) |
| 15 to 19 Minutes | 371 (12.3%) | 336 (13.7%) |
| 20 to 24 Minutes | 344 (11.4%) | 270 (11.0%) |
| 25 to 29 Minutes | 228 (7.6%) | 359 (14.6%) |
| 30 to 34 Minutes | 415 (13.8%) | 314 (12.8%) |
| 35 to 39 Minutes | 152 (5.0%) | 37 (1.5%) |
| 40 to 44 Minutes | 211 (7.0%) | 66 (2.7%) |
| 45 to 59 Minutes | 427 (14.2%) | 318 (12.9%) |
| 60 to 89 Minutes | 268 (8.9%) | 207 (8.4%) |
| 90 or more Minutes | 55 (1.8%) | 36 (1.5%) |
Time of Departure to Work by Sex in Broadlands
The most frequent times of departure to work in Broadlands are 8:00 AM to 8:29 AM (653, 21.7%) for males and 8:00 AM to 8:29 AM (489, 19.9%) for females.
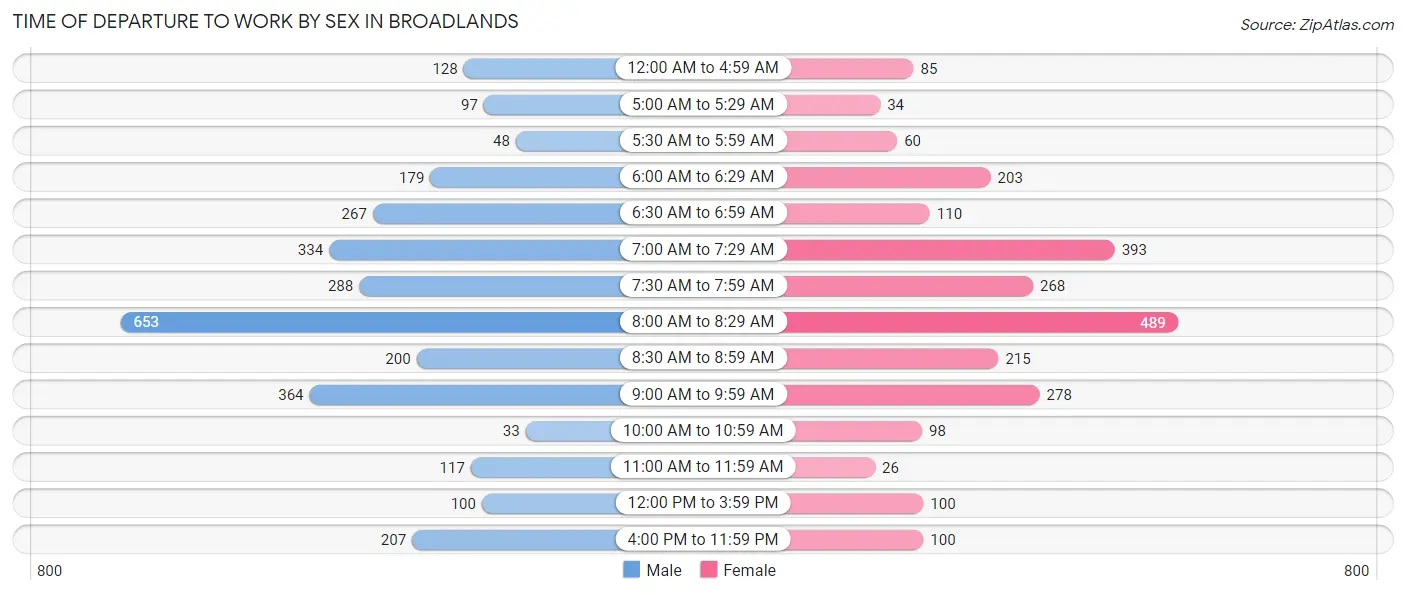
| Time of Departure | Male | Female |
| 12:00 AM to 4:59 AM | 128 (4.3%) | 85 (3.5%) |
| 5:00 AM to 5:29 AM | 97 (3.2%) | 34 (1.4%) |
| 5:30 AM to 5:59 AM | 48 (1.6%) | 60 (2.4%) |
| 6:00 AM to 6:29 AM | 179 (5.9%) | 203 (8.3%) |
| 6:30 AM to 6:59 AM | 267 (8.9%) | 110 (4.5%) |
| 7:00 AM to 7:29 AM | 334 (11.1%) | 393 (16.0%) |
| 7:30 AM to 7:59 AM | 288 (9.6%) | 268 (10.9%) |
| 8:00 AM to 8:29 AM | 653 (21.7%) | 489 (19.9%) |
| 8:30 AM to 8:59 AM | 200 (6.6%) | 215 (8.7%) |
| 9:00 AM to 9:59 AM | 364 (12.1%) | 278 (11.3%) |
| 10:00 AM to 10:59 AM | 33 (1.1%) | 98 (4.0%) |
| 11:00 AM to 11:59 AM | 117 (3.9%) | 26 (1.1%) |
| 12:00 PM to 3:59 PM | 100 (3.3%) | 100 (4.1%) |
| 4:00 PM to 11:59 PM | 207 (6.9%) | 100 (4.1%) |
| Total | 3,015 (100.0%) | 2,459 (100.0%) |
Housing Occupancy in Broadlands
Occupancy by Ownership in Broadlands
Of the total 4,345 dwellings in Broadlands, owner-occupied units account for 3,742 (86.1%), while renter-occupied units make up 603 (13.9%).
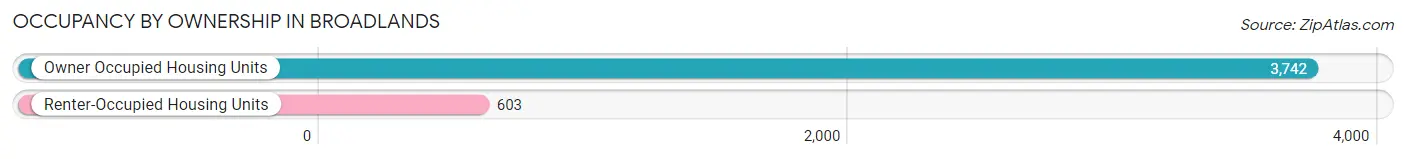
| Occupancy | # Housing Units | % Housing Units |
| Owner Occupied Housing Units | 3,742 | 86.1% |
| Renter-Occupied Housing Units | 603 | 13.9% |
| Total Occupied Housing Units | 4,345 | 100.0% |
Occupancy by Household Size in Broadlands
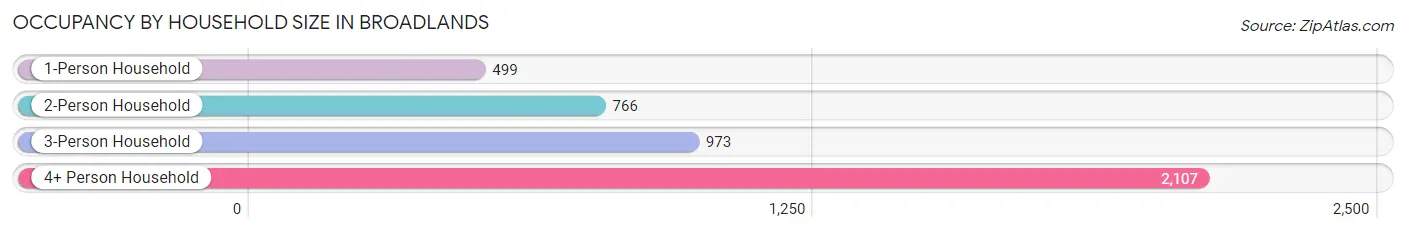
| Household Size | # Housing Units | % Housing Units |
| 1-Person Household | 499 | 11.5% |
| 2-Person Household | 766 | 17.6% |
| 3-Person Household | 973 | 22.4% |
| 4+ Person Household | 2,107 | 48.5% |
| Total Housing Units | 4,345 | 100.0% |
Occupancy by Ownership by Household Size in Broadlands
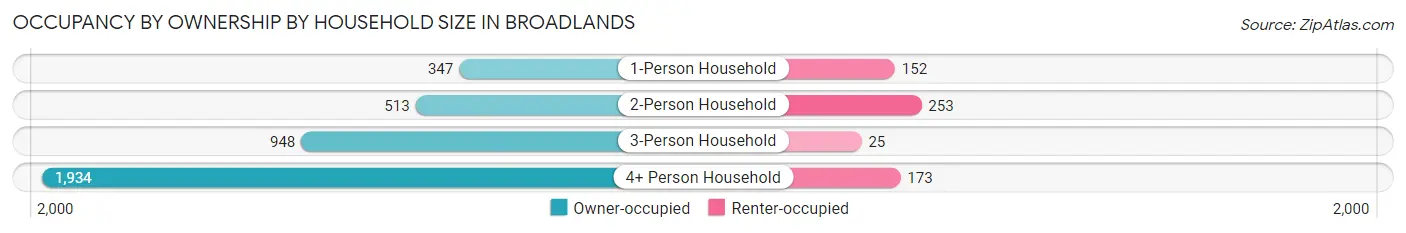
| Household Size | Owner-occupied | Renter-occupied |
| 1-Person Household | 347 (69.5%) | 152 (30.5%) |
| 2-Person Household | 513 (67.0%) | 253 (33.0%) |
| 3-Person Household | 948 (97.4%) | 25 (2.6%) |
| 4+ Person Household | 1,934 (91.8%) | 173 (8.2%) |
| Total Housing Units | 3,742 (86.1%) | 603 (13.9%) |
Occupancy by Educational Attainment in Broadlands
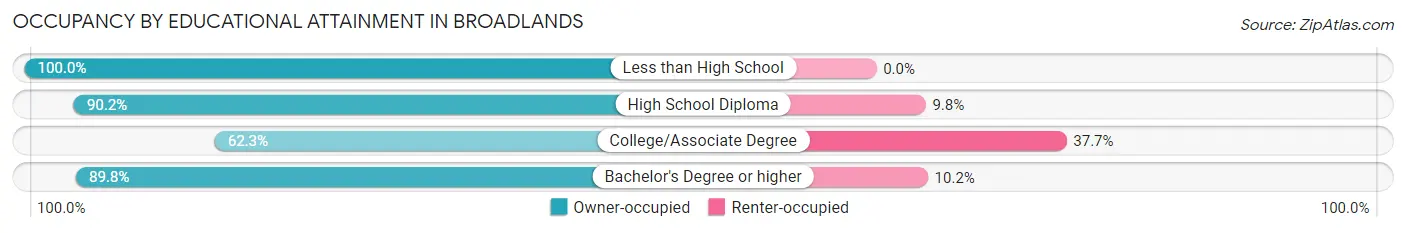
| Household Size | Owner-occupied | Renter-occupied |
| Less than High School | 32 (100.0%) | 0 (0.0%) |
| High School Diploma | 166 (90.2%) | 18 (9.8%) |
| College/Associate Degree | 370 (62.3%) | 224 (37.7%) |
| Bachelor's Degree or higher | 3,174 (89.8%) | 361 (10.2%) |
Occupancy by Age of Householder in Broadlands
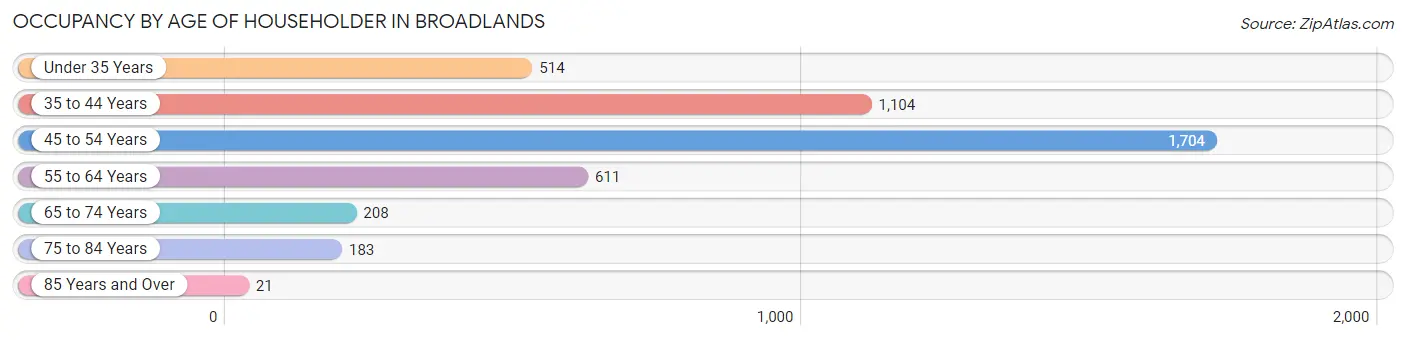
| Age Bracket | # Households | % Households |
| Under 35 Years | 514 | 11.8% |
| 35 to 44 Years | 1,104 | 25.4% |
| 45 to 54 Years | 1,704 | 39.2% |
| 55 to 64 Years | 611 | 14.1% |
| 65 to 74 Years | 208 | 4.8% |
| 75 to 84 Years | 183 | 4.2% |
| 85 Years and Over | 21 | 0.5% |
| Total | 4,345 | 100.0% |
Housing Finances in Broadlands
Median Income by Occupancy in Broadlands
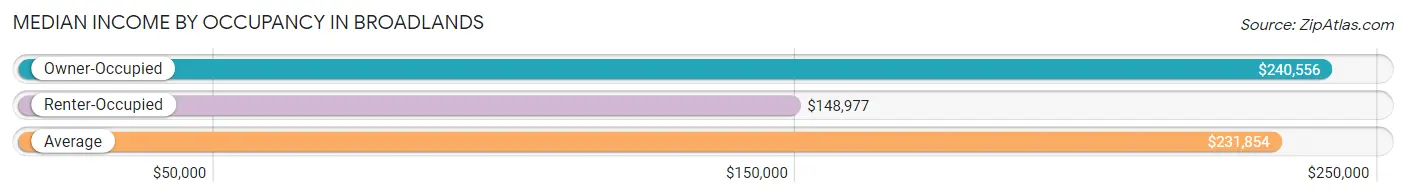
| Occupancy Type | # Households | Median Income |
| Owner-Occupied | 3,742 (86.1%) | $240,556 |
| Renter-Occupied | 603 (13.9%) | $148,977 |
| Average | 4,345 (100.0%) | $231,854 |
Occupancy by Householder Income Bracket in Broadlands
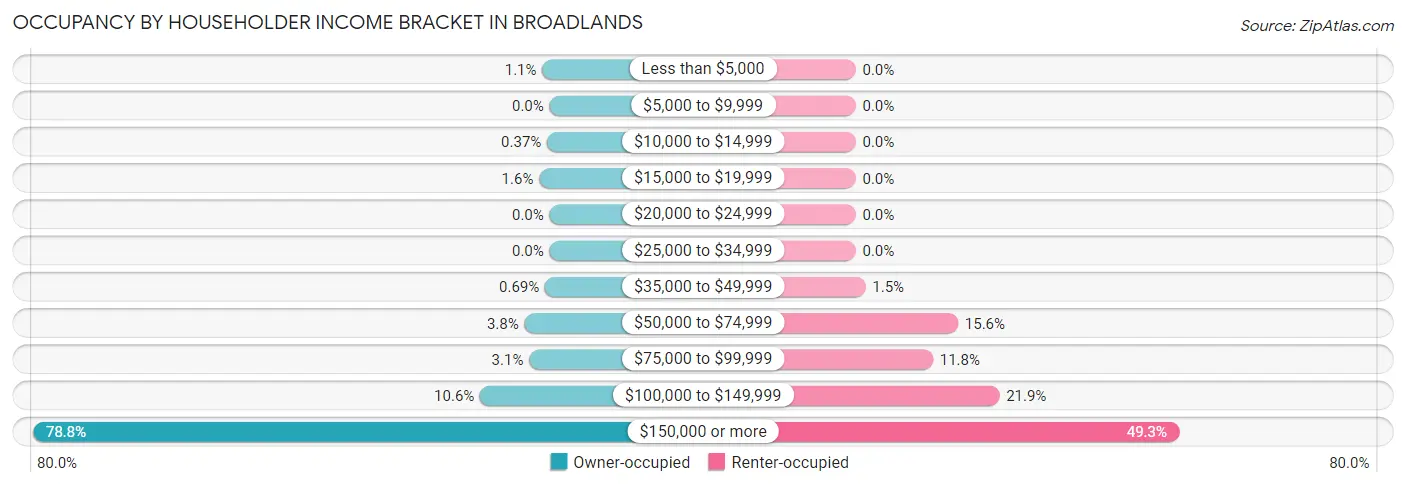
| Income Bracket | Owner-occupied | Renter-occupied |
| Less than $5,000 | 41 (1.1%) | 0 (0.0%) |
| $5,000 to $9,999 | 0 (0.0%) | 0 (0.0%) |
| $10,000 to $14,999 | 14 (0.4%) | 0 (0.0%) |
| $15,000 to $19,999 | 59 (1.6%) | 0 (0.0%) |
| $20,000 to $24,999 | 0 (0.0%) | 0 (0.0%) |
| $25,000 to $34,999 | 0 (0.0%) | 0 (0.0%) |
| $35,000 to $49,999 | 26 (0.7%) | 9 (1.5%) |
| $50,000 to $74,999 | 143 (3.8%) | 94 (15.6%) |
| $75,000 to $99,999 | 116 (3.1%) | 71 (11.8%) |
| $100,000 to $149,999 | 396 (10.6%) | 132 (21.9%) |
| $150,000 or more | 2,947 (78.7%) | 297 (49.2%) |
| Total | 3,742 (100.0%) | 603 (100.0%) |
Monthly Housing Cost Tiers in Broadlands
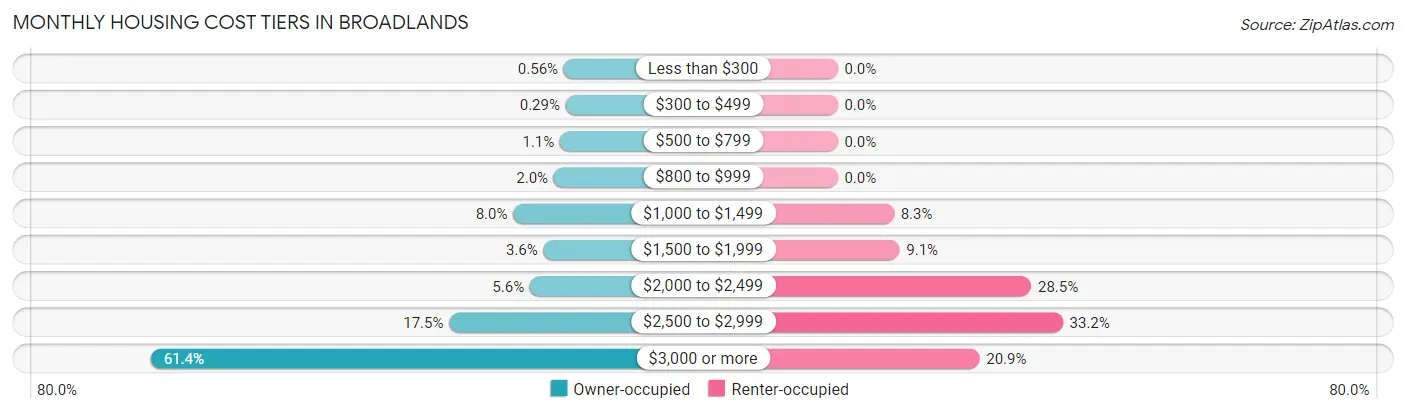
| Monthly Cost | Owner-occupied | Renter-occupied |
| Less than $300 | 21 (0.6%) | 0 (0.0%) |
| $300 to $499 | 11 (0.3%) | 0 (0.0%) |
| $500 to $799 | 42 (1.1%) | 0 (0.0%) |
| $800 to $999 | 76 (2.0%) | 0 (0.0%) |
| $1,000 to $1,499 | 300 (8.0%) | 50 (8.3%) |
| $1,500 to $1,999 | 133 (3.5%) | 55 (9.1%) |
| $2,000 to $2,499 | 208 (5.6%) | 172 (28.5%) |
| $2,500 to $2,999 | 653 (17.4%) | 200 (33.2%) |
| $3,000 or more | 2,298 (61.4%) | 126 (20.9%) |
| Total | 3,742 (100.0%) | 603 (100.0%) |
Physical Housing Characteristics in Broadlands
Housing Structures in Broadlands
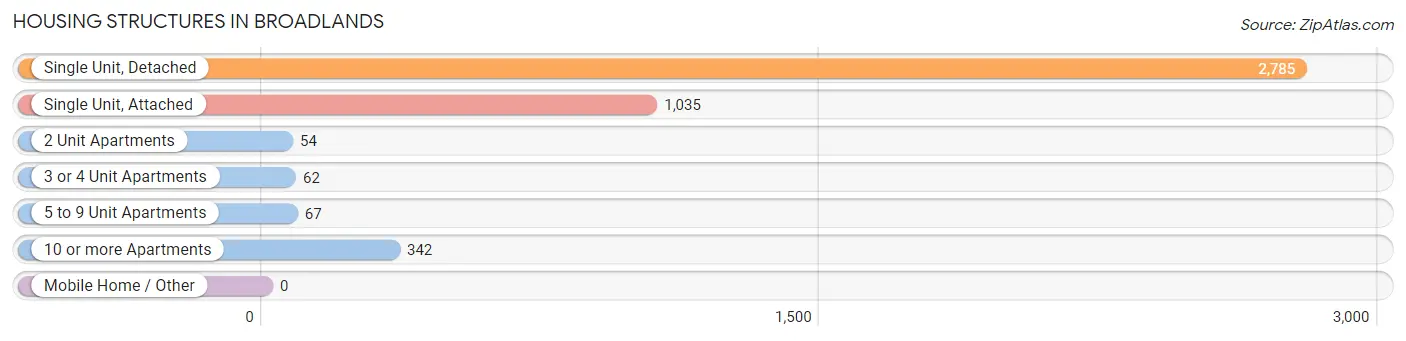
| Structure Type | # Housing Units | % Housing Units |
| Single Unit, Detached | 2,785 | 64.1% |
| Single Unit, Attached | 1,035 | 23.8% |
| 2 Unit Apartments | 54 | 1.2% |
| 3 or 4 Unit Apartments | 62 | 1.4% |
| 5 to 9 Unit Apartments | 67 | 1.5% |
| 10 or more Apartments | 342 | 7.9% |
| Mobile Home / Other | 0 | 0.0% |
| Total | 4,345 | 100.0% |
Housing Structures by Occupancy in Broadlands
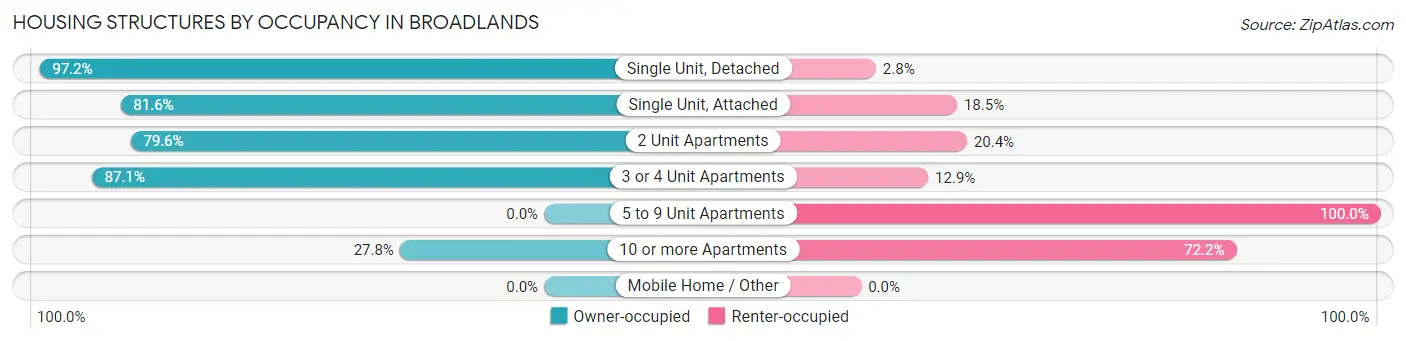
| Structure Type | Owner-occupied | Renter-occupied |
| Single Unit, Detached | 2,706 (97.2%) | 79 (2.8%) |
| Single Unit, Attached | 844 (81.6%) | 191 (18.4%) |
| 2 Unit Apartments | 43 (79.6%) | 11 (20.4%) |
| 3 or 4 Unit Apartments | 54 (87.1%) | 8 (12.9%) |
| 5 to 9 Unit Apartments | 0 (0.0%) | 67 (100.0%) |
| 10 or more Apartments | 95 (27.8%) | 247 (72.2%) |
| Mobile Home / Other | 0 (0.0%) | 0 (0.0%) |
| Total | 3,742 (86.1%) | 603 (13.9%) |
Housing Structures by Number of Rooms in Broadlands
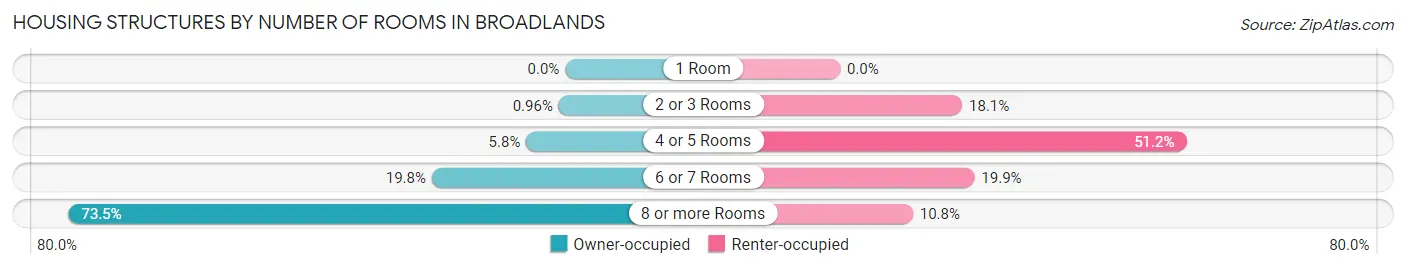
| Number of Rooms | Owner-occupied | Renter-occupied |
| 1 Room | 0 (0.0%) | 0 (0.0%) |
| 2 or 3 Rooms | 36 (1.0%) | 109 (18.1%) |
| 4 or 5 Rooms | 216 (5.8%) | 309 (51.2%) |
| 6 or 7 Rooms | 739 (19.8%) | 120 (19.9%) |
| 8 or more Rooms | 2,751 (73.5%) | 65 (10.8%) |
| Total | 3,742 (100.0%) | 603 (100.0%) |
Housing Structure by Heating Type in Broadlands
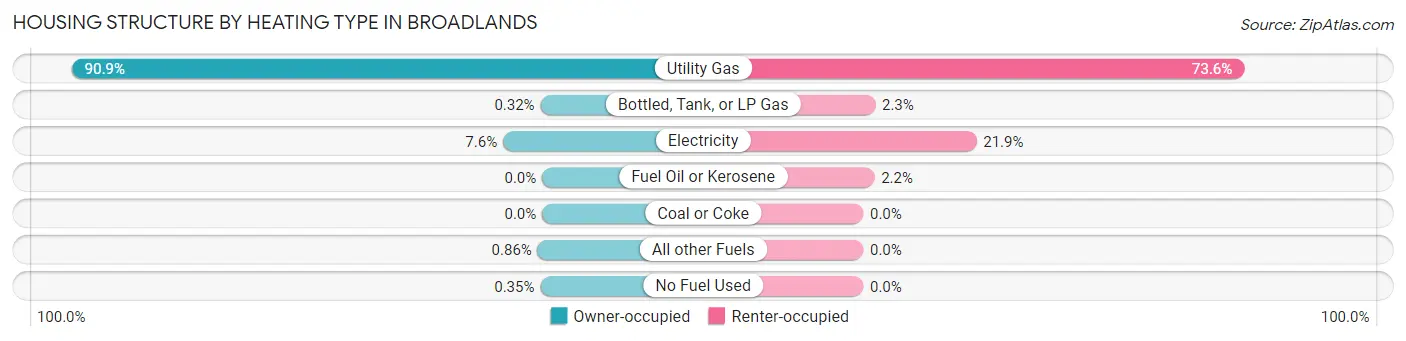
| Heating Type | Owner-occupied | Renter-occupied |
| Utility Gas | 3,402 (90.9%) | 444 (73.6%) |
| Bottled, Tank, or LP Gas | 12 (0.3%) | 14 (2.3%) |
| Electricity | 283 (7.6%) | 132 (21.9%) |
| Fuel Oil or Kerosene | 0 (0.0%) | 13 (2.2%) |
| Coal or Coke | 0 (0.0%) | 0 (0.0%) |
| All other Fuels | 32 (0.9%) | 0 (0.0%) |
| No Fuel Used | 13 (0.4%) | 0 (0.0%) |
| Total | 3,742 (100.0%) | 603 (100.0%) |
Household Vehicle Usage in Broadlands
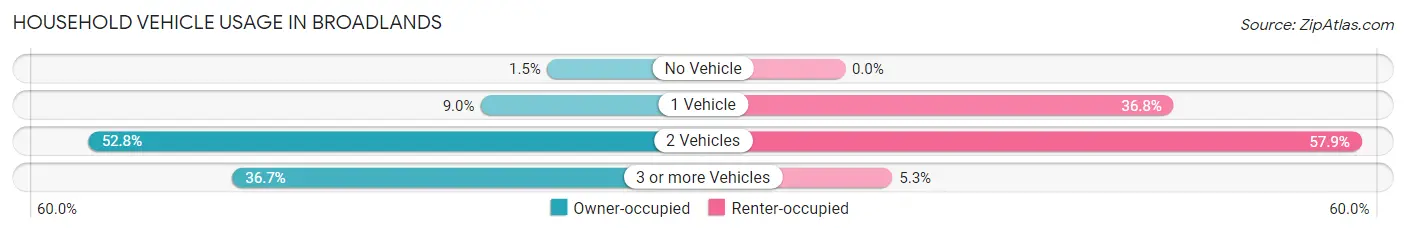
| Vehicles per Household | Owner-occupied | Renter-occupied |
| No Vehicle | 57 (1.5%) | 0 (0.0%) |
| 1 Vehicle | 335 (8.9%) | 222 (36.8%) |
| 2 Vehicles | 1,976 (52.8%) | 349 (57.9%) |
| 3 or more Vehicles | 1,374 (36.7%) | 32 (5.3%) |
| Total | 3,742 (100.0%) | 603 (100.0%) |
Real Estate & Mortgages in Broadlands
Real Estate and Mortgage Overview in Broadlands
| Characteristic | Without Mortgage | With Mortgage |
| Housing Units | 357 | 3,385 |
| Median Property Value | $779,400 | $819,800 |
| Median Household Income | $212,019 | $2,758 |
| Monthly Housing Costs | $1,046 | $2,298 |
| Real Estate Taxes | $6,477 | $33 |
Property Value by Mortgage Status in Broadlands
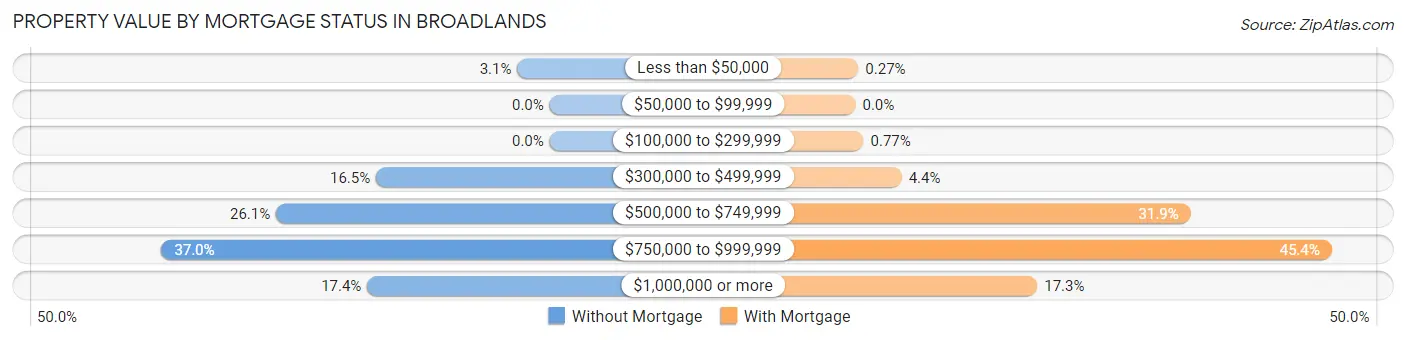
| Property Value | Without Mortgage | With Mortgage |
| Less than $50,000 | 11 (3.1%) | 9 (0.3%) |
| $50,000 to $99,999 | 0 (0.0%) | 0 (0.0%) |
| $100,000 to $299,999 | 0 (0.0%) | 26 (0.8%) |
| $300,000 to $499,999 | 59 (16.5%) | 149 (4.4%) |
| $500,000 to $749,999 | 93 (26.1%) | 1,080 (31.9%) |
| $750,000 to $999,999 | 132 (37.0%) | 1,535 (45.4%) |
| $1,000,000 or more | 62 (17.4%) | 586 (17.3%) |
| Total | 357 (100.0%) | 3,385 (100.0%) |
Household Income by Mortgage Status in Broadlands
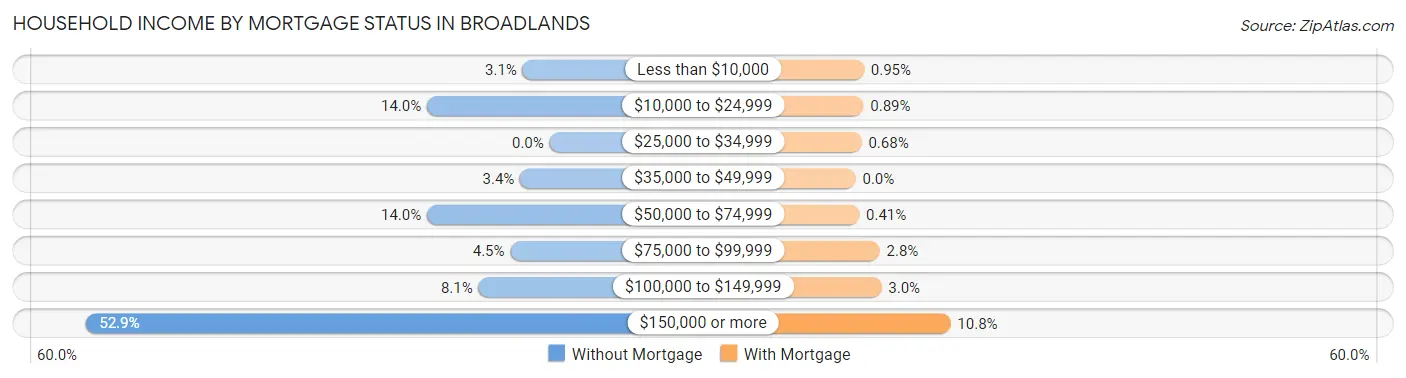
| Household Income | Without Mortgage | With Mortgage |
| Less than $10,000 | 11 (3.1%) | 32 (0.9%) |
| $10,000 to $24,999 | 50 (14.0%) | 30 (0.9%) |
| $25,000 to $34,999 | 0 (0.0%) | 23 (0.7%) |
| $35,000 to $49,999 | 12 (3.4%) | 0 (0.0%) |
| $50,000 to $74,999 | 50 (14.0%) | 14 (0.4%) |
| $75,000 to $99,999 | 16 (4.5%) | 93 (2.8%) |
| $100,000 to $149,999 | 29 (8.1%) | 100 (2.9%) |
| $150,000 or more | 189 (52.9%) | 367 (10.8%) |
| Total | 357 (100.0%) | 3,385 (100.0%) |
Property Value to Household Income Ratio in Broadlands
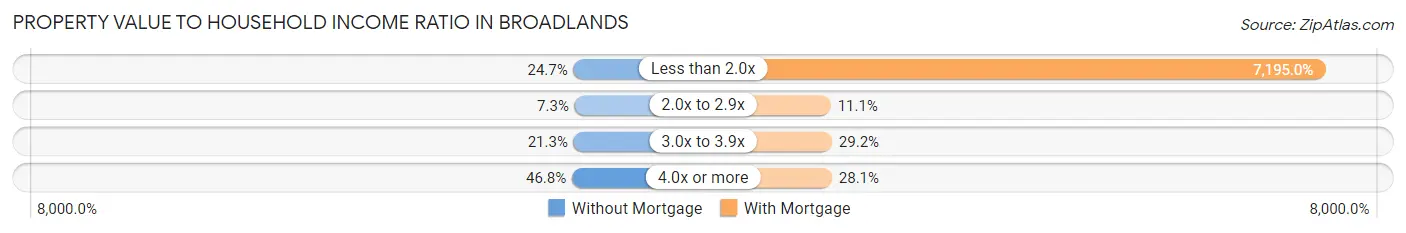
| Value-to-Income Ratio | Without Mortgage | With Mortgage |
| Less than 2.0x | 88 (24.6%) | 243,550 (7,195.0%) |
| 2.0x to 2.9x | 26 (7.3%) | 376 (11.1%) |
| 3.0x to 3.9x | 76 (21.3%) | 988 (29.2%) |
| 4.0x or more | 167 (46.8%) | 952 (28.1%) |
| Total | 357 (100.0%) | 3,385 (100.0%) |
Real Estate Taxes by Mortgage Status in Broadlands
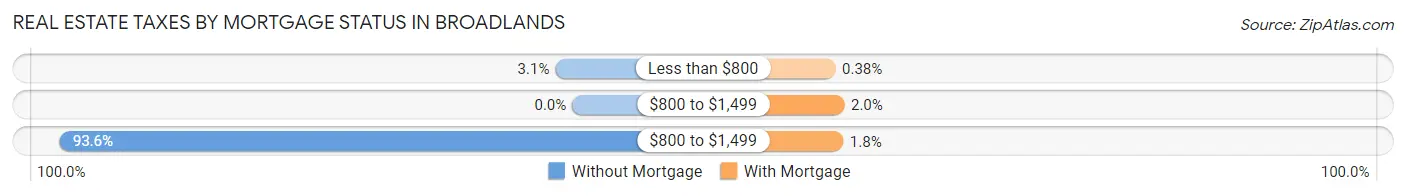
| Property Taxes | Without Mortgage | With Mortgage |
| Less than $800 | 11 (3.1%) | 13 (0.4%) |
| $800 to $1,499 | 0 (0.0%) | 68 (2.0%) |
| $800 to $1,499 | 334 (93.6%) | 61 (1.8%) |
| Total | 357 (100.0%) | 3,385 (100.0%) |
Health & Disability in Broadlands
Health Insurance Coverage by Age in Broadlands
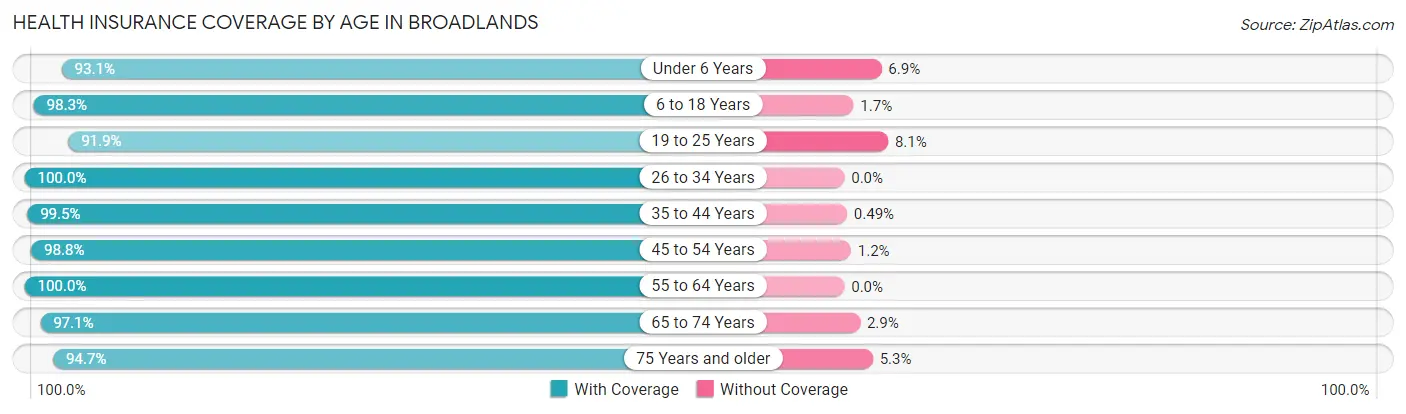
| Age Bracket | With Coverage | Without Coverage |
| Under 6 Years | 821 (93.1%) | 61 (6.9%) |
| 6 to 18 Years | 3,870 (98.3%) | 67 (1.7%) |
| 19 to 25 Years | 925 (91.9%) | 82 (8.1%) |
| 26 to 34 Years | 1,088 (100.0%) | 0 (0.0%) |
| 35 to 44 Years | 2,255 (99.5%) | 11 (0.5%) |
| 45 to 54 Years | 3,150 (98.8%) | 39 (1.2%) |
| 55 to 64 Years | 1,186 (100.0%) | 0 (0.0%) |
| 65 to 74 Years | 565 (97.1%) | 17 (2.9%) |
| 75 Years and older | 411 (94.7%) | 23 (5.3%) |
| Total | 14,271 (97.9%) | 300 (2.1%) |
Health Insurance Coverage by Citizenship Status in Broadlands
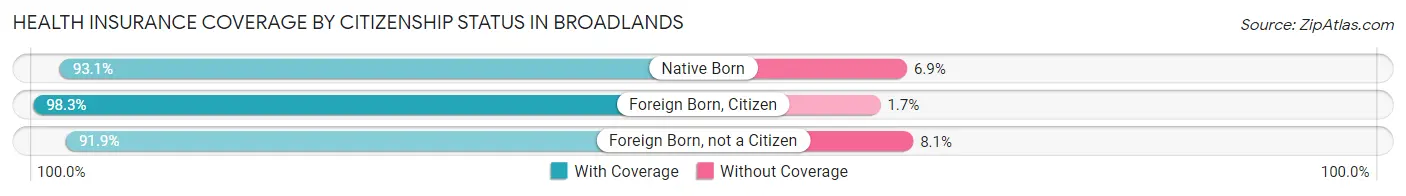
| Citizenship Status | With Coverage | Without Coverage |
| Native Born | 821 (93.1%) | 61 (6.9%) |
| Foreign Born, Citizen | 3,870 (98.3%) | 67 (1.7%) |
| Foreign Born, not a Citizen | 925 (91.9%) | 82 (8.1%) |
Health Insurance Coverage by Household Income in Broadlands
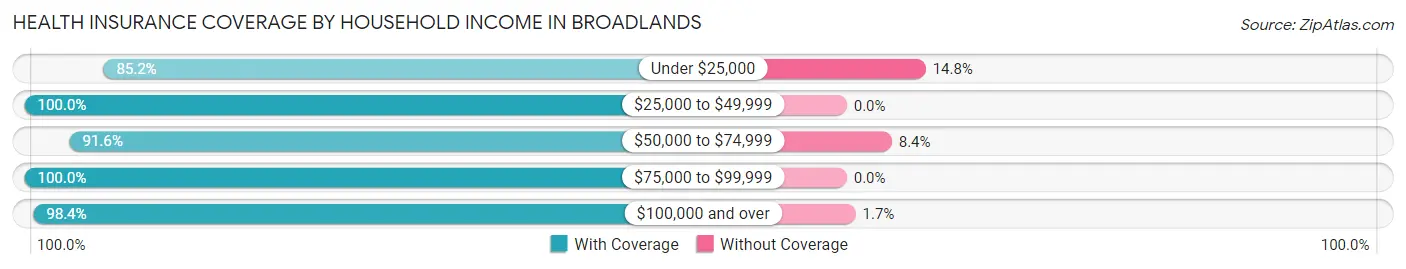
| Household Income | With Coverage | Without Coverage |
| Under $25,000 | 196 (85.2%) | 34 (14.8%) |
| $25,000 to $49,999 | 78 (100.0%) | 0 (0.0%) |
| $50,000 to $74,999 | 489 (91.6%) | 45 (8.4%) |
| $75,000 to $99,999 | 333 (100.0%) | 0 (0.0%) |
| $100,000 and over | 13,175 (98.4%) | 221 (1.7%) |
Public vs Private Health Insurance Coverage by Age in Broadlands
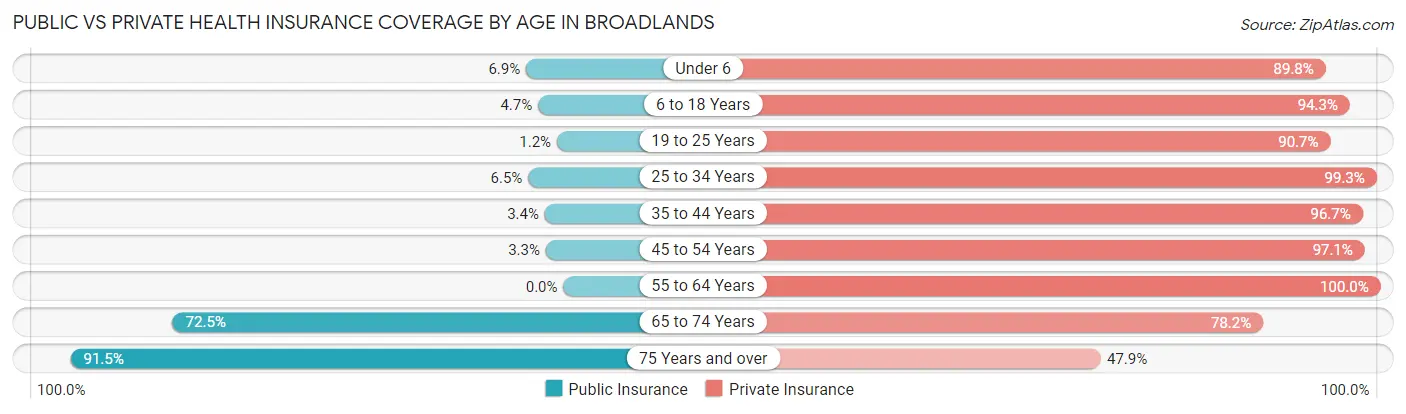
| Age Bracket | Public Insurance | Private Insurance |
| Under 6 | 61 (6.9%) | 792 (89.8%) |
| 6 to 18 Years | 185 (4.7%) | 3,712 (94.3%) |
| 19 to 25 Years | 12 (1.2%) | 913 (90.7%) |
| 25 to 34 Years | 71 (6.5%) | 1,080 (99.3%) |
| 35 to 44 Years | 78 (3.4%) | 2,190 (96.7%) |
| 45 to 54 Years | 104 (3.3%) | 3,095 (97.1%) |
| 55 to 64 Years | 0 (0.0%) | 1,186 (100.0%) |
| 65 to 74 Years | 422 (72.5%) | 455 (78.2%) |
| 75 Years and over | 397 (91.5%) | 208 (47.9%) |
| Total | 1,330 (9.1%) | 13,631 (93.5%) |
Disability Status by Sex by Age in Broadlands
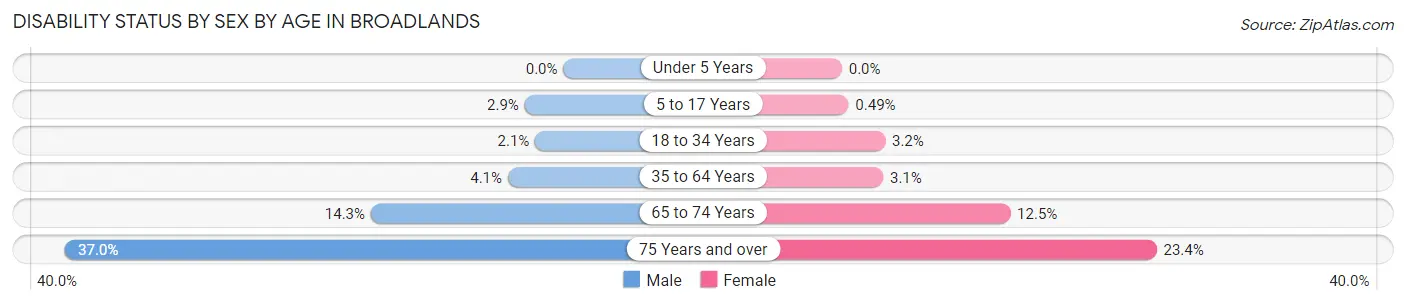
| Age Bracket | Male | Female |
| Under 5 Years | 0 (0.0%) | 0 (0.0%) |
| 5 to 17 Years | 58 (2.9%) | 9 (0.5%) |
| 18 to 34 Years | 27 (2.1%) | 37 (3.2%) |
| 35 to 64 Years | 139 (4.1%) | 100 (3.1%) |
| 65 to 74 Years | 34 (14.3%) | 43 (12.5%) |
| 75 Years and over | 64 (37.0%) | 61 (23.4%) |
Disability Class by Sex by Age in Broadlands
Disability Class: Hearing Difficulty
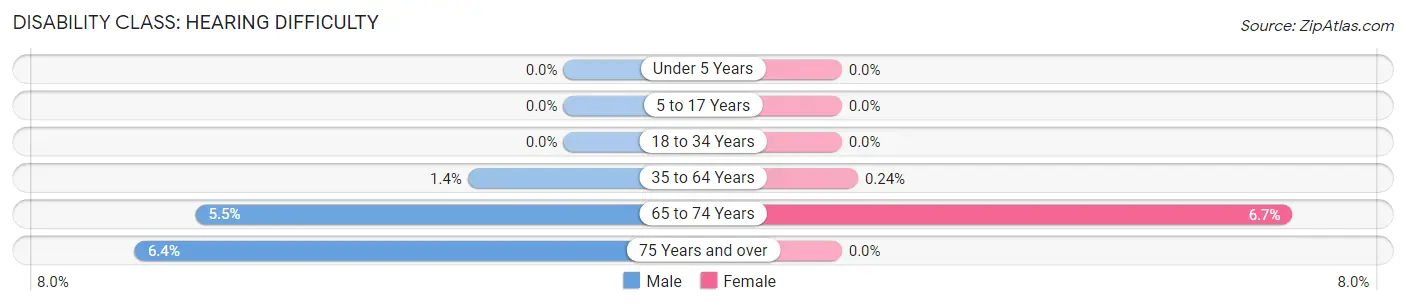
| Age Bracket | Male | Female |
| Under 5 Years | 0 (0.0%) | 0 (0.0%) |
| 5 to 17 Years | 0 (0.0%) | 0 (0.0%) |
| 18 to 34 Years | 0 (0.0%) | 0 (0.0%) |
| 35 to 64 Years | 48 (1.4%) | 8 (0.2%) |
| 65 to 74 Years | 13 (5.5%) | 23 (6.7%) |
| 75 Years and over | 11 (6.4%) | 0 (0.0%) |
Disability Class: Vision Difficulty
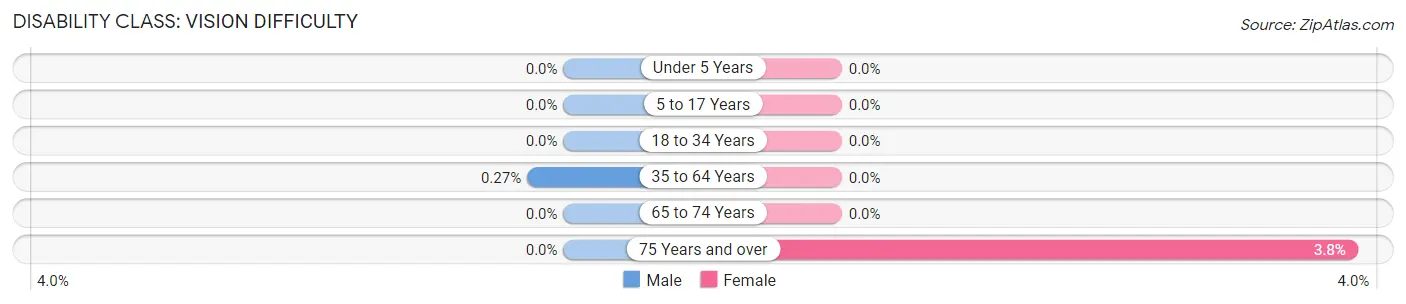
| Age Bracket | Male | Female |
| Under 5 Years | 0 (0.0%) | 0 (0.0%) |
| 5 to 17 Years | 0 (0.0%) | 0 (0.0%) |
| 18 to 34 Years | 0 (0.0%) | 0 (0.0%) |
| 35 to 64 Years | 9 (0.3%) | 0 (0.0%) |
| 65 to 74 Years | 0 (0.0%) | 0 (0.0%) |
| 75 Years and over | 0 (0.0%) | 10 (3.8%) |
Disability Class: Cognitive Difficulty
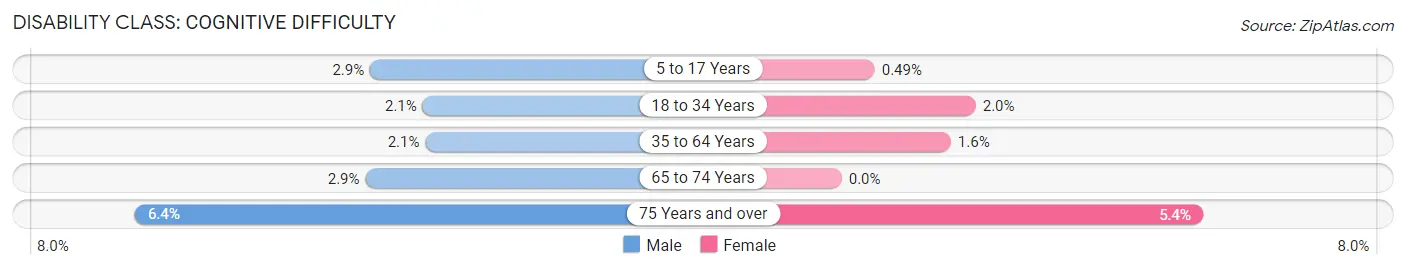
| Age Bracket | Male | Female |
| 5 to 17 Years | 58 (2.9%) | 9 (0.5%) |
| 18 to 34 Years | 27 (2.1%) | 23 (2.0%) |
| 35 to 64 Years | 69 (2.1%) | 53 (1.6%) |
| 65 to 74 Years | 7 (2.9%) | 0 (0.0%) |
| 75 Years and over | 11 (6.4%) | 14 (5.4%) |
Disability Class: Ambulatory Difficulty
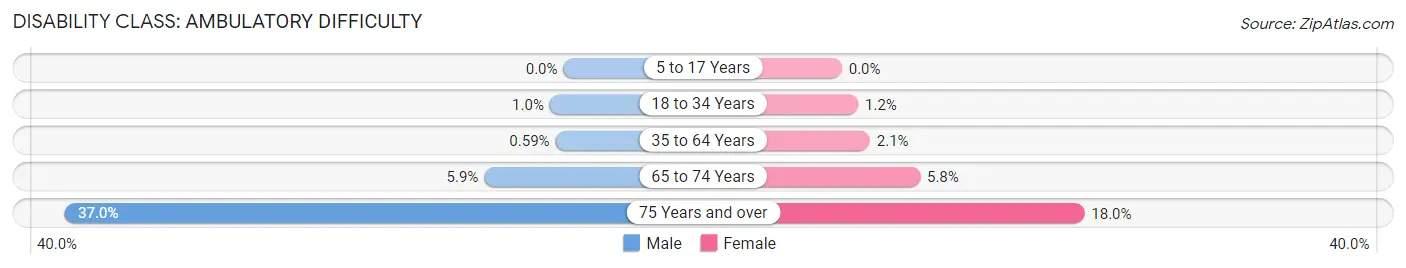
| Age Bracket | Male | Female |
| 5 to 17 Years | 0 (0.0%) | 0 (0.0%) |
| 18 to 34 Years | 13 (1.0%) | 14 (1.2%) |
| 35 to 64 Years | 20 (0.6%) | 68 (2.1%) |
| 65 to 74 Years | 14 (5.9%) | 20 (5.8%) |
| 75 Years and over | 64 (37.0%) | 47 (18.0%) |
Disability Class: Self-Care Difficulty
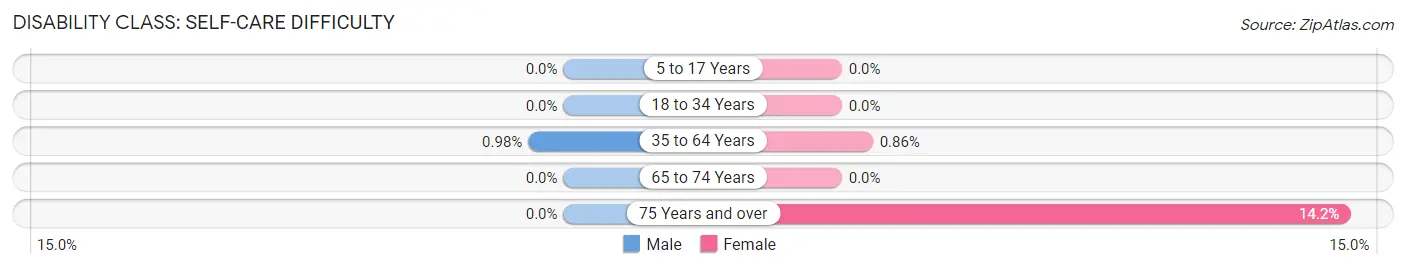
| Age Bracket | Male | Female |
| 5 to 17 Years | 0 (0.0%) | 0 (0.0%) |
| 18 to 34 Years | 0 (0.0%) | 0 (0.0%) |
| 35 to 64 Years | 33 (1.0%) | 28 (0.9%) |
| 65 to 74 Years | 0 (0.0%) | 0 (0.0%) |
| 75 Years and over | 0 (0.0%) | 37 (14.2%) |
Technology Access in Broadlands
Computing Device Access in Broadlands
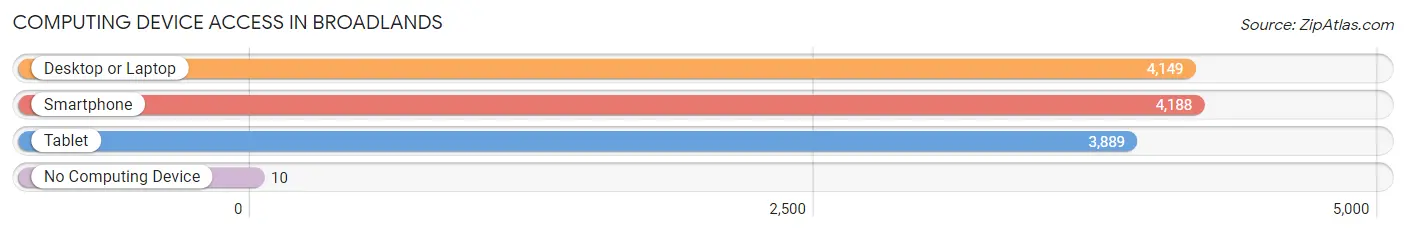
| Device Type | # Households | % Households |
| Desktop or Laptop | 4,149 | 95.5% |
| Smartphone | 4,188 | 96.4% |
| Tablet | 3,889 | 89.5% |
| No Computing Device | 10 | 0.2% |
| Total | 4,345 | 100.0% |
Internet Access in Broadlands
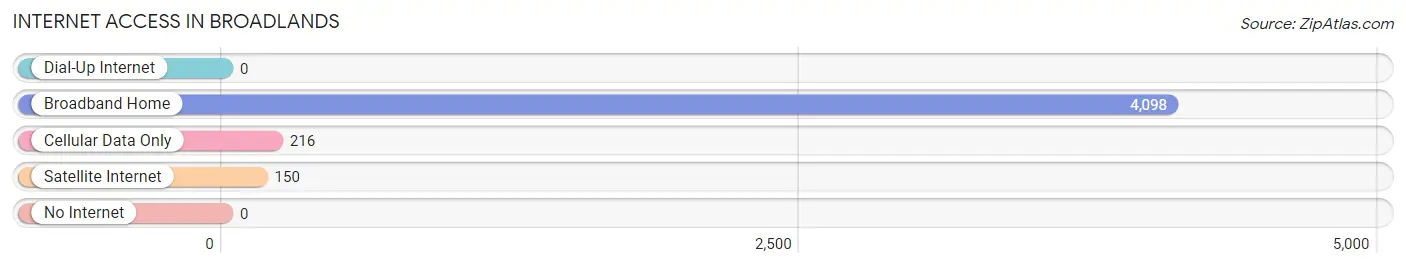
| Internet Type | # Households | % Households |
| Dial-Up Internet | 0 | 0.0% |
| Broadband Home | 4,098 | 94.3% |
| Cellular Data Only | 216 | 5.0% |
| Satellite Internet | 150 | 3.5% |
| No Internet | 0 | 0.0% |
| Total | 4,345 | 100.0% |
Broadlands Summary
Broadlands, Virginia is a census-designated place located in Loudoun County, Virginia. It is a small, unincorporated community located in the Washington, D.C. metropolitan area. The population of Broadlands was 8,845 at the 2010 census.
History
The area that is now Broadlands was originally inhabited by Native Americans, including the Iroquois and the Piscataway. The first European settlers arrived in the area in the late 1700s. The area was known as “Broadlands” by the early 1800s, and the name was derived from the broad, open fields in the area.
In the late 1800s, the area was primarily used for farming. The area was also home to a number of small businesses, including a general store, a blacksmith shop, and a post office.
In the early 1900s, the area began to experience rapid growth due to its proximity to Washington, D.C. The area was annexed by the town of Leesburg in the 1950s, and the population of Broadlands continued to grow.
Geography
Broadlands is located in Loudoun County, Virginia, in the Washington, D.C. metropolitan area. It is situated in the foothills of the Blue Ridge Mountains, and is bordered by the Potomac River to the east.
The area is characterized by rolling hills and open fields. The terrain is mostly flat, with some areas of steep slopes. The climate is temperate, with hot summers and cold winters.
Economy
Broadlands is primarily a residential community, and the economy is largely based on the service industry. The area is home to a number of retail stores, restaurants, and other businesses.
The area is also home to a number of technology companies, including Oracle, Microsoft, and Amazon. The area is also home to a number of government contractors, including Northrop Grumman and Lockheed Martin.
Demographics
As of the 2010 census, the population of Broadlands was 8,845. The racial makeup of the area was 79.3% White, 8.2% African American, 0.3% Native American, 6.2% Asian, and 4.9% from other races.
The median household income in Broadlands was $117,945, and the median family income was $133,945. The per capita income was $50,945.
Conclusion
Broadlands, Virginia is a small, unincorporated community located in the Washington, D.C. metropolitan area. The area was originally inhabited by Native Americans, and was later settled by European settlers in the late 1700s. The area is characterized by rolling hills and open fields, and is home to a number of technology companies and government contractors. The population of Broadlands was 8,845 at the 2010 census, and the median household income was $117,945.
Common Questions
What is Per Capita Income in Broadlands?
Per Capita income in Broadlands is $77,783.
What is the Median Family Income in Broadlands?
Median Family Income in Broadlands is $243,828.
What is the Median Household income in Broadlands?
Median Household Income in Broadlands is $231,854.
What is Income or Wage Gap in Broadlands?
Income or Wage Gap in Broadlands is 53.6%.
Women in Broadlands earn 46.4 cents for every dollar earned by a man.
What is Inequality or Gini Index in Broadlands?
Inequality or Gini Index in Broadlands is 0.32.
What is the Total Population of Broadlands?
Total Population of Broadlands is 14,582.
What is the Total Male Population of Broadlands?
Total Male Population of Broadlands is 7,470.
What is the Total Female Population of Broadlands?
Total Female Population of Broadlands is 7,112.
What is the Ratio of Males per 100 Females in Broadlands?
There are 105.03 Males per 100 Females in Broadlands.
What is the Ratio of Females per 100 Males in Broadlands?
There are 95.21 Females per 100 Males in Broadlands.
What is the Median Population Age in Broadlands?
Median Population Age in Broadlands is 37.5 Years.
What is the Average Family Size in Broadlands
Average Family Size in Broadlands is 3.7 People.
What is the Average Household Size in Broadlands
Average Household Size in Broadlands is 3.4 People.
How Large is the Labor Force in Broadlands?
There are 8,066 People in the Labor Forcein in Broadlands.
What is the Percentage of People in the Labor Force in Broadlands?
74.9% of People are in the Labor Force in Broadlands.
What is the Unemployment Rate in Broadlands?
Unemployment Rate in Broadlands is 2.4%.