Dahlgren Center, VA Map & Demographics
Dahlgren Center Map
Dahlgren Center Overview
$32,767
PER CAPITA INCOME
$81,875
AVG FAMILY INCOME
$82,188
AVG HOUSEHOLD INCOME
49.2%
WAGE / INCOME GAP [ % ]
50.8¢/ $1
WAGE / INCOME GAP [ $ ]
0.32
INEQUALITY / GINI INDEX
723
TOTAL POPULATION
420
MALE POPULATION
303
FEMALE POPULATION
138.61
MALES / 100 FEMALES
72.14
FEMALES / 100 MALES
24.1
MEDIAN AGE
3.4
AVG FAMILY SIZE
2.9
AVG HOUSEHOLD SIZE
415
LABOR FORCE [ PEOPLE ]
78.3%
PERCENT IN LABOR FORCE
5.2%
UNEMPLOYMENT RATE
Income in Dahlgren Center
Income Overview in Dahlgren Center
Per Capita Income in Dahlgren Center is $32,767, while median incomes of families and households are $81,875 and $82,188 respectively.
| Characteristic | Number | Measure |
| Per Capita Income | 723 | $32,767 |
| Median Family Income | 162 | $81,875 |
| Mean Family Income | 162 | $105,100 |
| Median Household Income | 202 | $82,188 |
| Mean Household Income | 202 | $100,621 |
| Income Deficit | 162 | $0 |
| Wage / Income Gap (%) | 723 | 49.22% |
| Wage / Income Gap ($) | 723 | 50.78¢ per $1 |
| Gini / Inequality Index | 723 | 0.32 |
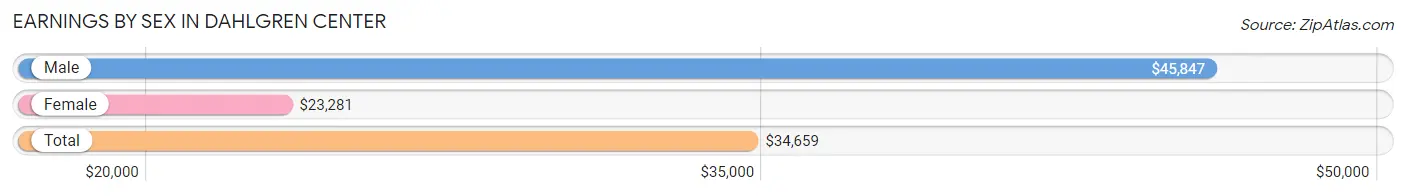
Earnings by Sex in Dahlgren Center
Average Earnings in Dahlgren Center are $34,659, $45,847 for men and $23,281 for women, a difference of 49.2%.
| Sex | Number | Average Earnings |
| Male | 309 (69.8%) | $45,847 |
| Female | 134 (30.2%) | $23,281 |
| Total | 443 (100.0%) | $34,659 |
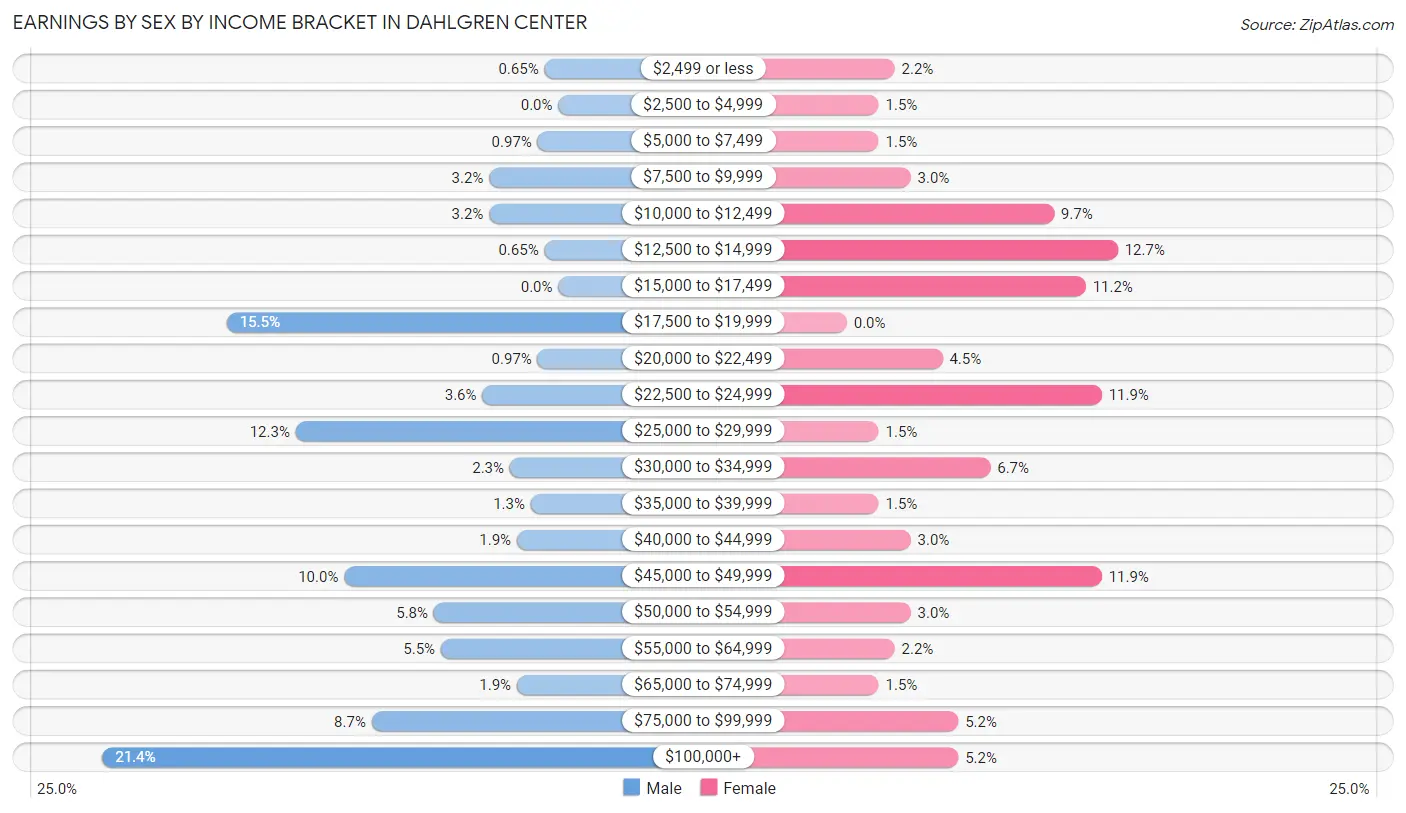
Earnings by Sex by Income Bracket in Dahlgren Center
The most common earnings brackets in Dahlgren Center are $100,000+ for men (66 | 21.4%) and $12,500 to $14,999 for women (17 | 12.7%).
| Income | Male | Female |
| $2,499 or less | 2 (0.6%) | 3 (2.2%) |
| $2,500 to $4,999 | 0 (0.0%) | 2 (1.5%) |
| $5,000 to $7,499 | 3 (1.0%) | 2 (1.5%) |
| $7,500 to $9,999 | 10 (3.2%) | 4 (3.0%) |
| $10,000 to $12,499 | 10 (3.2%) | 13 (9.7%) |
| $12,500 to $14,999 | 2 (0.6%) | 17 (12.7%) |
| $15,000 to $17,499 | 0 (0.0%) | 15 (11.2%) |
| $17,500 to $19,999 | 48 (15.5%) | 0 (0.0%) |
| $20,000 to $22,499 | 3 (1.0%) | 6 (4.5%) |
| $22,500 to $24,999 | 11 (3.6%) | 16 (11.9%) |
| $25,000 to $29,999 | 38 (12.3%) | 2 (1.5%) |
| $30,000 to $34,999 | 7 (2.3%) | 9 (6.7%) |
| $35,000 to $39,999 | 4 (1.3%) | 2 (1.5%) |
| $40,000 to $44,999 | 6 (1.9%) | 4 (3.0%) |
| $45,000 to $49,999 | 31 (10.0%) | 16 (11.9%) |
| $50,000 to $54,999 | 18 (5.8%) | 4 (3.0%) |
| $55,000 to $64,999 | 17 (5.5%) | 3 (2.2%) |
| $65,000 to $74,999 | 6 (1.9%) | 2 (1.5%) |
| $75,000 to $99,999 | 27 (8.7%) | 7 (5.2%) |
| $100,000+ | 66 (21.4%) | 7 (5.2%) |
| Total | 309 (100.0%) | 134 (100.0%) |
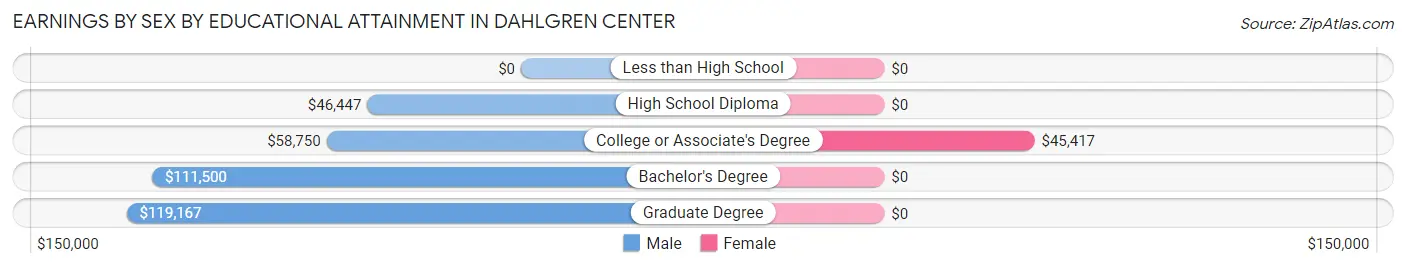
Earnings by Sex by Educational Attainment in Dahlgren Center
Average earnings in Dahlgren Center are $80,385 for men and $40,938 for women, a difference of 49.1%. Men with an educational attainment of graduate degree enjoy the highest average annual earnings of $119,167, while those with high school diploma education earn the least with $46,447. Women with an educational attainment of college or associate's degree earn the most with the average annual earnings of $45,417, while those with college or associate's degree education have the smallest earnings of $45,417.
| Educational Attainment | Male Income | Female Income |
| Less than High School | - | - |
| High School Diploma | $46,447 | $0 |
| College or Associate's Degree | $58,750 | $45,417 |
| Bachelor's Degree | $111,500 | $0 |
| Graduate Degree | $119,167 | $0 |
| Total | $80,385 | $40,938 |
Family Income in Dahlgren Center
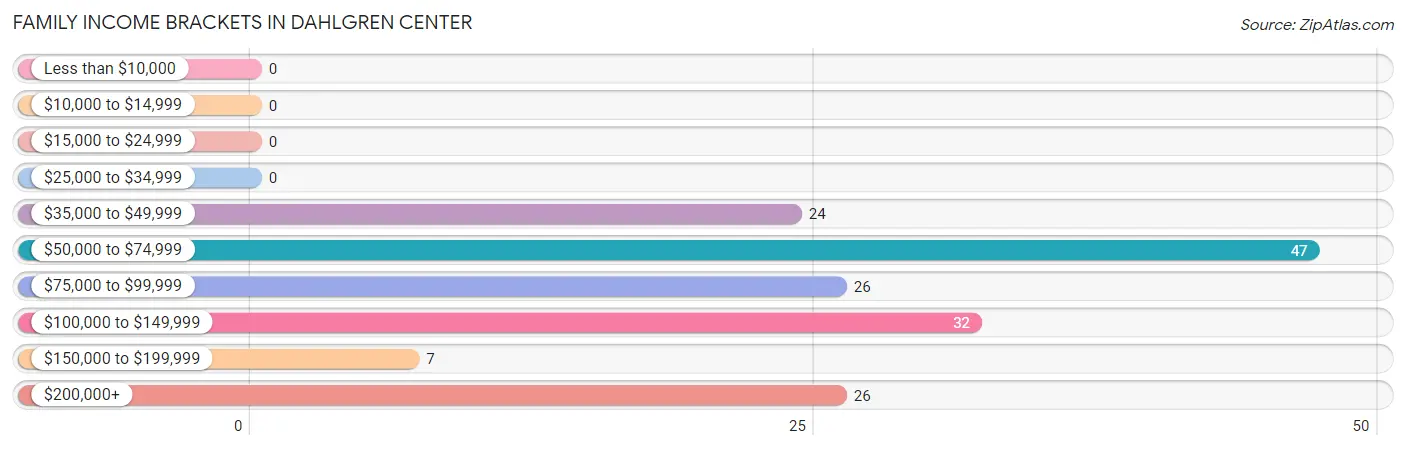
Family Income Brackets in Dahlgren Center
According to the Dahlgren Center family income data, there are 47 families falling into the $50,000 to $74,999 income range, which is the most common income bracket and makes up 29.0% of all families.
| Income Bracket | # Families | % Families |
| Less than $10,000 | 0 | 0.0% |
| $10,000 to $14,999 | 0 | 0.0% |
| $15,000 to $24,999 | 0 | 0.0% |
| $25,000 to $34,999 | 0 | 0.0% |
| $35,000 to $49,999 | 24 | 14.8% |
| $50,000 to $74,999 | 47 | 29.0% |
| $75,000 to $99,999 | 26 | 16.0% |
| $100,000 to $149,999 | 32 | 19.8% |
| $150,000 to $199,999 | 7 | 4.3% |
| $200,000+ | 26 | 16.0% |
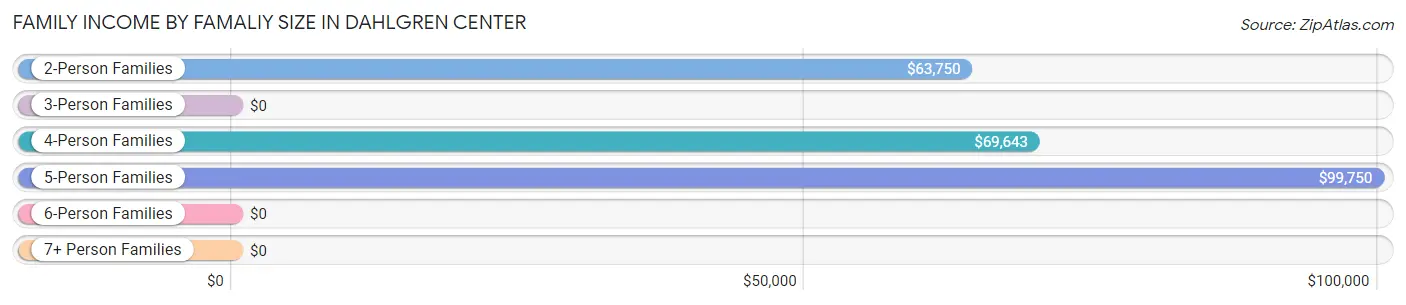
Family Income by Famaliy Size in Dahlgren Center
5-person families (19 | 11.7%) account for the highest median family income in Dahlgren Center with $99,750 per family, while 2-person families (57 | 35.2%) have the highest median income of $31,875 per family member.
| Income Bracket | # Families | Median Income |
| 2-Person Families | 57 (35.2%) | $63,750 |
| 3-Person Families | 53 (32.7%) | $0 |
| 4-Person Families | 28 (17.3%) | $69,643 |
| 5-Person Families | 19 (11.7%) | $99,750 |
| 6-Person Families | 5 (3.1%) | $0 |
| 7+ Person Families | 0 (0.0%) | $0 |
| Total | 162 (100.0%) | $81,875 |
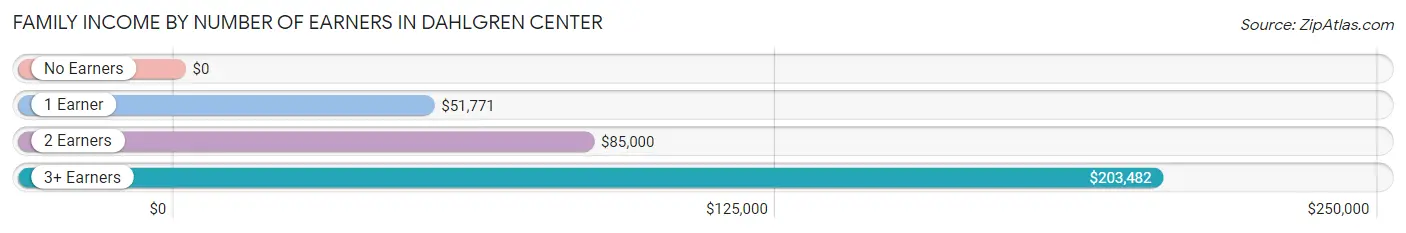
Family Income by Number of Earners in Dahlgren Center
| Number of Earners | # Families | Median Income |
| No Earners | 0 (0.0%) | $0 |
| 1 Earner | 61 (37.7%) | $51,771 |
| 2 Earners | 78 (48.1%) | $85,000 |
| 3+ Earners | 23 (14.2%) | $203,482 |
| Total | 162 (100.0%) | $81,875 |
Household Income in Dahlgren Center
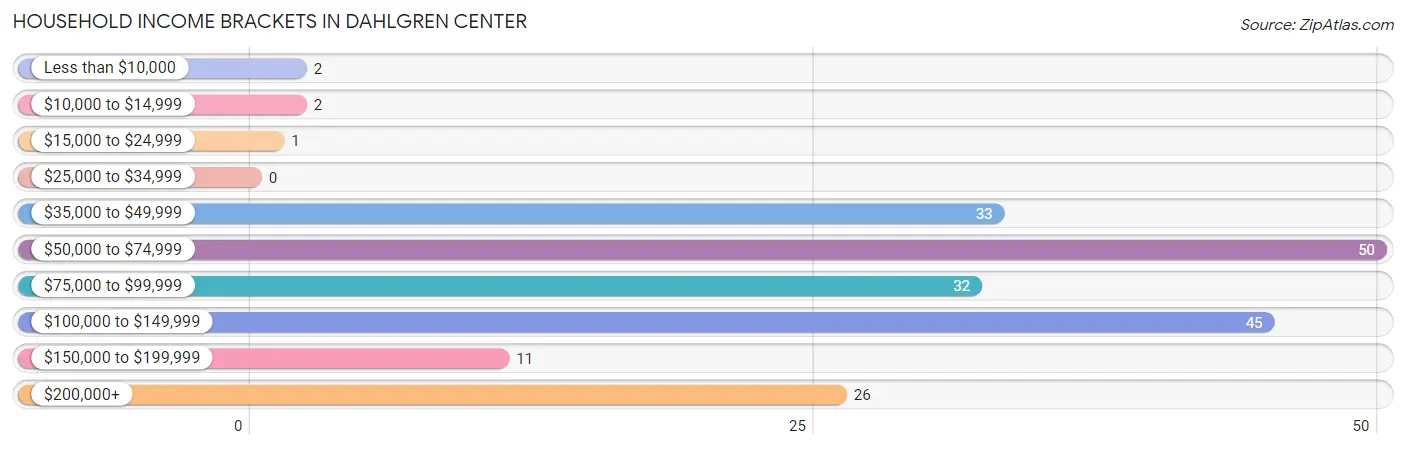
Household Income Brackets in Dahlgren Center
With 50 households falling in the category, the $50,000 to $74,999 income range is the most frequent in Dahlgren Center, accounting for 24.7% of all households.
| Income Bracket | # Households | % Households |
| Less than $10,000 | 2 | 1.0% |
| $10,000 to $14,999 | 2 | 1.0% |
| $15,000 to $24,999 | 1 | 0.5% |
| $25,000 to $34,999 | 0 | 0.0% |
| $35,000 to $49,999 | 33 | 16.3% |
| $50,000 to $74,999 | 50 | 24.8% |
| $75,000 to $99,999 | 32 | 15.8% |
| $100,000 to $149,999 | 45 | 22.3% |
| $150,000 to $199,999 | 11 | 5.4% |
| $200,000+ | 26 | 12.9% |
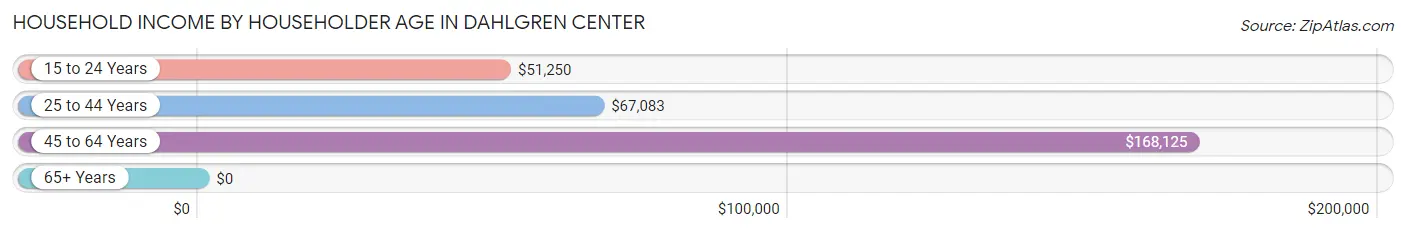
Household Income by Householder Age in Dahlgren Center
The median household income in Dahlgren Center is $82,188, with the highest median household income of $168,125 found in the 45 to 64 years age bracket for the primary householder. A total of 51 households (25.3%) fall into this category. Meanwhile, the 65+ years age bracket for the primary householder has the lowest median household income of $0, with 2 households (1.0%) in this group.
| Income Bracket | # Households | Median Income |
| 15 to 24 Years | 14 (6.9%) | $51,250 |
| 25 to 44 Years | 135 (66.8%) | $67,083 |
| 45 to 64 Years | 51 (25.3%) | $168,125 |
| 65+ Years | 2 (1.0%) | $0 |
| Total | 202 (100.0%) | $82,188 |
Poverty in Dahlgren Center
Income Below Poverty by Sex and Age in Dahlgren Center
With 0.6% poverty level for males and 1.4% for females among the residents of Dahlgren Center, 18 to 24 year old males and 35 to 44 year old females are the most vulnerable to poverty, with 2 males (8.3%) and 2 females (10.5%) in their respective age groups living below the poverty level.
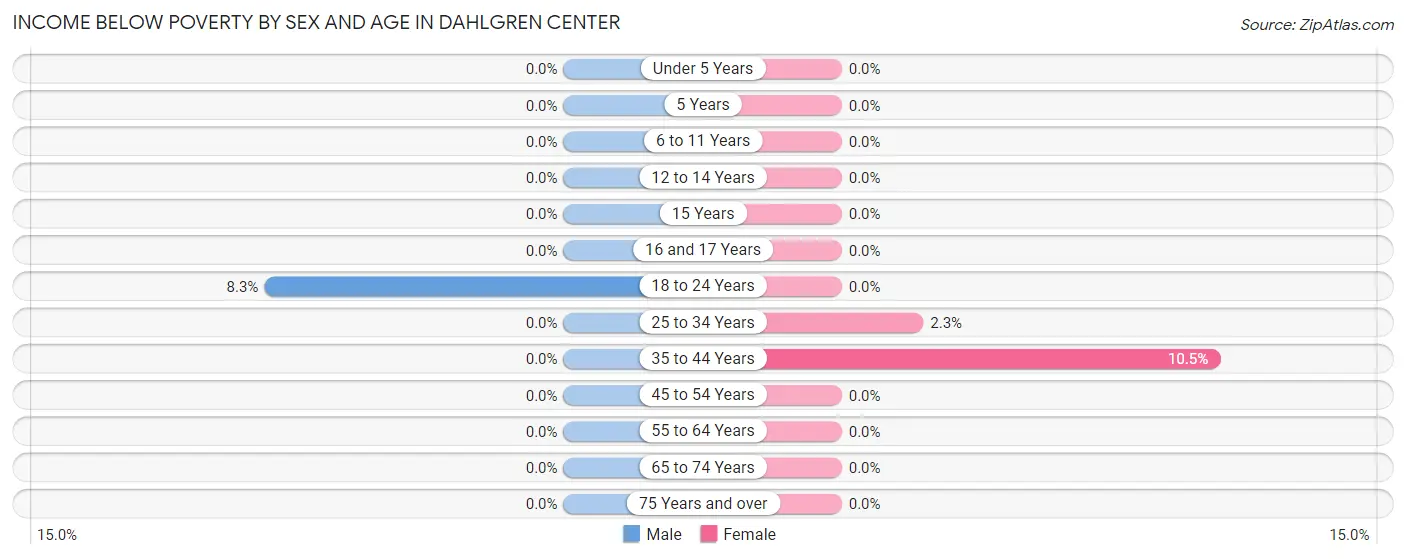
| Age Bracket | Male | Female |
| Under 5 Years | 0 (0.0%) | 0 (0.0%) |
| 5 Years | 0 (0.0%) | 0 (0.0%) |
| 6 to 11 Years | 0 (0.0%) | 0 (0.0%) |
| 12 to 14 Years | 0 (0.0%) | 0 (0.0%) |
| 15 Years | 0 (0.0%) | 0 (0.0%) |
| 16 and 17 Years | 0 (0.0%) | 0 (0.0%) |
| 18 to 24 Years | 2 (8.3%) | 0 (0.0%) |
| 25 to 34 Years | 0 (0.0%) | 2 (2.3%) |
| 35 to 44 Years | 0 (0.0%) | 2 (10.5%) |
| 45 to 54 Years | 0 (0.0%) | 0 (0.0%) |
| 55 to 64 Years | 0 (0.0%) | 0 (0.0%) |
| 65 to 74 Years | 0 (0.0%) | 0 (0.0%) |
| 75 Years and over | 0 (0.0%) | 0 (0.0%) |
| Total | 2 (0.6%) | 4 (1.4%) |
Income Above Poverty by Sex and Age in Dahlgren Center
According to the poverty statistics in Dahlgren Center, males aged under 5 years and females aged under 5 years are the age groups that are most secure financially, with 100.0% of males and 100.0% of females in these age groups living above the poverty line.
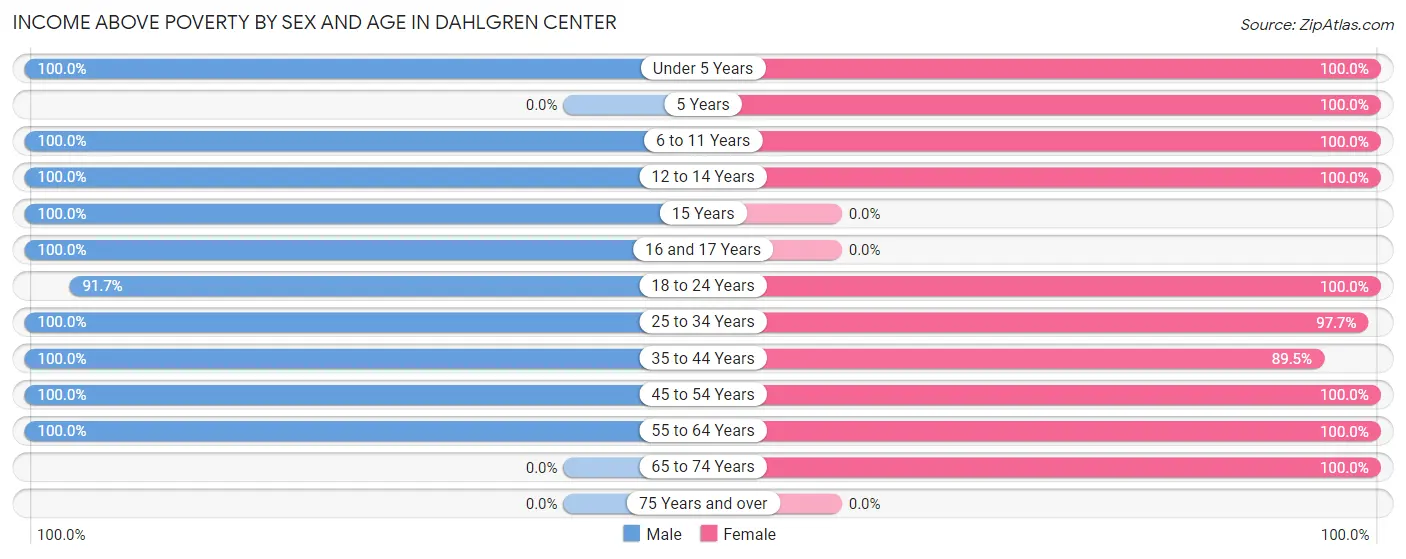
| Age Bracket | Male | Female |
| Under 5 Years | 43 (100.0%) | 61 (100.0%) |
| 5 Years | 0 (0.0%) | 1 (100.0%) |
| 6 to 11 Years | 34 (100.0%) | 32 (100.0%) |
| 12 to 14 Years | 12 (100.0%) | 3 (100.0%) |
| 15 Years | 7 (100.0%) | 0 (0.0%) |
| 16 and 17 Years | 11 (100.0%) | 0 (0.0%) |
| 18 to 24 Years | 22 (91.7%) | 39 (100.0%) |
| 25 to 34 Years | 90 (100.0%) | 86 (97.7%) |
| 35 to 44 Years | 39 (100.0%) | 17 (89.5%) |
| 45 to 54 Years | 20 (100.0%) | 20 (100.0%) |
| 55 to 64 Years | 31 (100.0%) | 18 (100.0%) |
| 65 to 74 Years | 0 (0.0%) | 2 (100.0%) |
| 75 Years and over | 0 (0.0%) | 0 (0.0%) |
| Total | 309 (99.4%) | 279 (98.6%) |
Income Below Poverty Among Married-Couple Families in Dahlgren Center
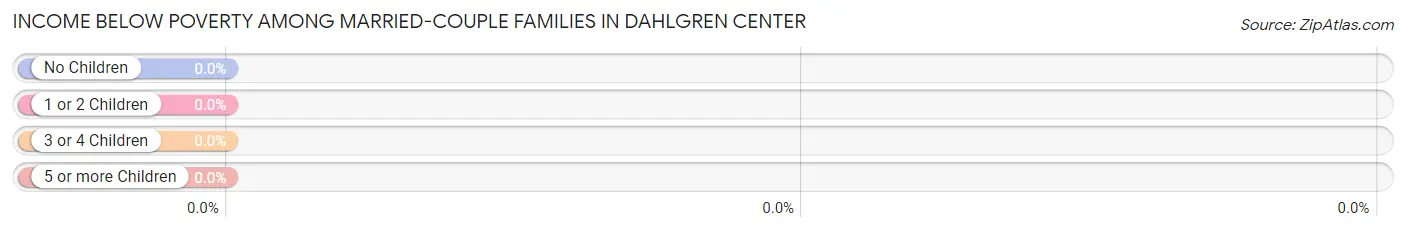
| Children | Above Poverty | Below Poverty |
| No Children | 65 (100.0%) | 0 (0.0%) |
| 1 or 2 Children | 69 (100.0%) | 0 (0.0%) |
| 3 or 4 Children | 19 (100.0%) | 0 (0.0%) |
| 5 or more Children | 0 (0.0%) | 0 (0.0%) |
| Total | 153 (100.0%) | 0 (0.0%) |
Income Below Poverty Among Single-Parent Households in Dahlgren Center
| Children | Single Father | Single Mother |
| No Children | 0 (0.0%) | 0 (0.0%) |
| 1 or 2 Children | 0 (0.0%) | 0 (0.0%) |
| 3 or 4 Children | 0 (0.0%) | 0 (0.0%) |
| 5 or more Children | 0 (0.0%) | 0 (0.0%) |
| Total | 0 (0.0%) | 0 (0.0%) |
Income Below Poverty Among Married-Couple vs Single-Parent Households in Dahlgren Center
| Children | Married-Couple Families | Single-Parent Households |
| No Children | 0 (0.0%) | 0 (0.0%) |
| 1 or 2 Children | 0 (0.0%) | 0 (0.0%) |
| 3 or 4 Children | 0 (0.0%) | 0 (0.0%) |
| 5 or more Children | 0 (0.0%) | 0 (0.0%) |
| Total | 0 (0.0%) | 0 (0.0%) |
Race in Dahlgren Center
The most populous races in Dahlgren Center are White / Caucasian (446 | 61.7%), Two or more Races (118 | 16.3%), and Asian (77 | 10.6%).
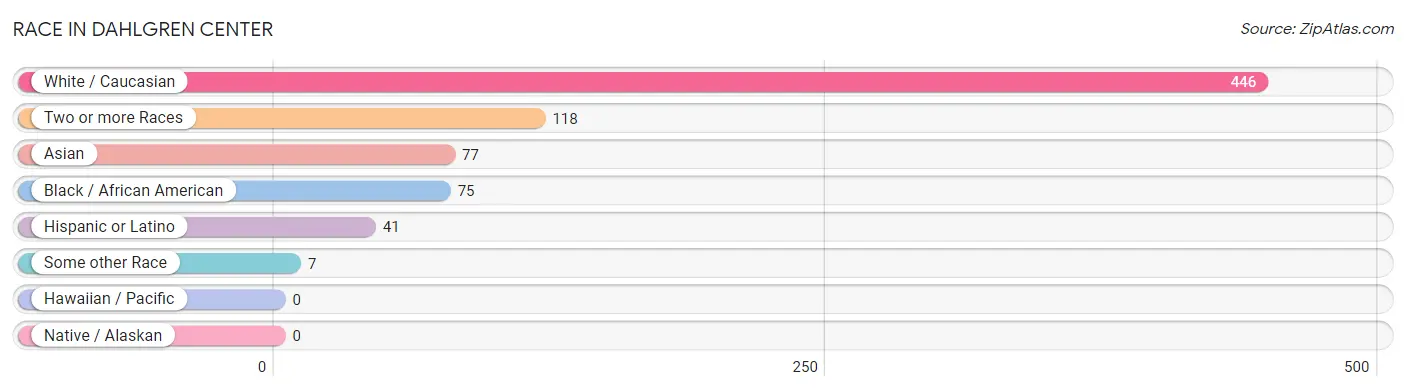
| Race | # Population | % Population |
| Asian | 77 | 10.6% |
| Black / African American | 75 | 10.4% |
| Hawaiian / Pacific | 0 | 0.0% |
| Hispanic or Latino | 41 | 5.7% |
| Native / Alaskan | 0 | 0.0% |
| White / Caucasian | 446 | 61.7% |
| Two or more Races | 118 | 16.3% |
| Some other Race | 7 | 1.0% |
| Total | 723 | 100.0% |
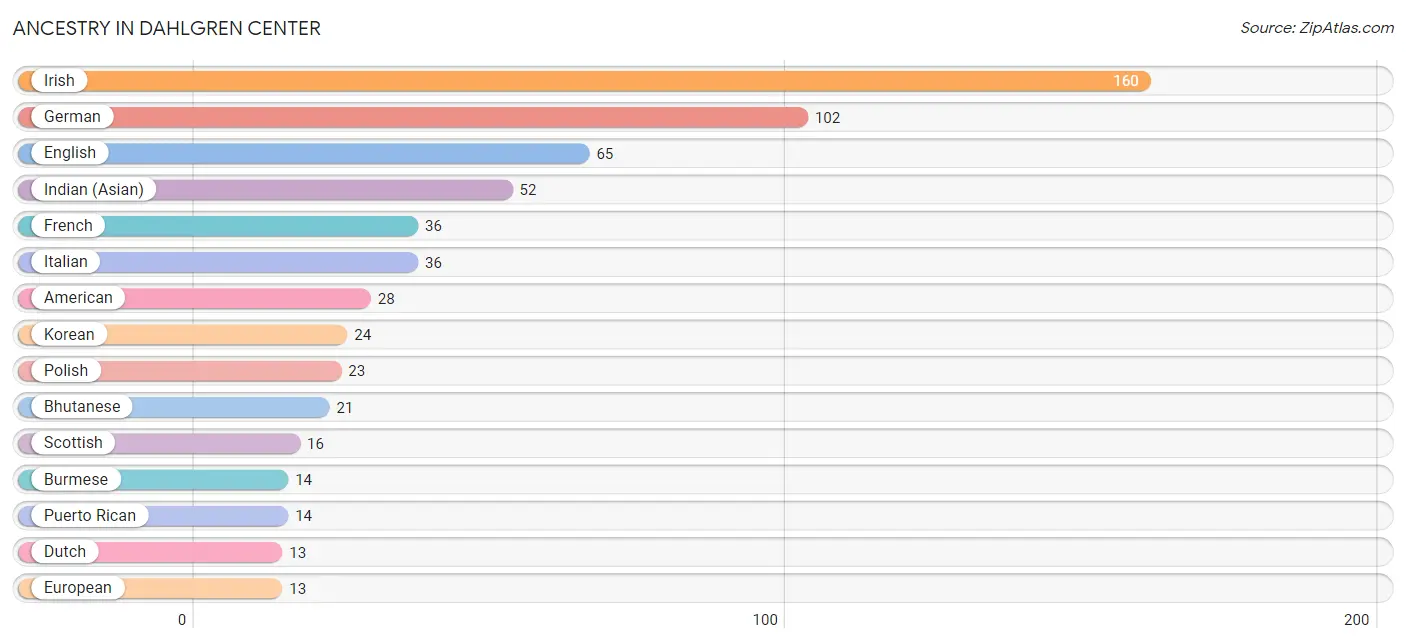
Ancestry in Dahlgren Center
The most populous ancestries reported in Dahlgren Center are Irish (160 | 22.1%), German (102 | 14.1%), English (65 | 9.0%), Indian (Asian) (52 | 7.2%), and French (36 | 5.0%), together accounting for 57.4% of all Dahlgren Center residents.
| Ancestry | # Population | % Population |
| African | 2 | 0.3% |
| American | 28 | 3.9% |
| Apache | 2 | 0.3% |
| Australian | 12 | 1.7% |
| Belgian | 8 | 1.1% |
| Bhutanese | 21 | 2.9% |
| British | 6 | 0.8% |
| Burmese | 14 | 1.9% |
| Cuban | 2 | 0.3% |
| Czech | 3 | 0.4% |
| Danish | 4 | 0.5% |
| Dominican | 7 | 1.0% |
| Dutch | 13 | 1.8% |
| English | 65 | 9.0% |
| European | 13 | 1.8% |
| French | 36 | 5.0% |
| French Canadian | 2 | 0.3% |
| German | 102 | 14.1% |
| Hungarian | 7 | 1.0% |
| Indian (Asian) | 52 | 7.2% |
| Irish | 160 | 22.1% |
| Italian | 36 | 5.0% |
| Jamaican | 8 | 1.1% |
| Korean | 24 | 3.3% |
| Mexican | 5 | 0.7% |
| Native Hawaiian | 5 | 0.7% |
| Nigerian | 3 | 0.4% |
| Norwegian | 3 | 0.4% |
| Pakistani | 6 | 0.8% |
| Polish | 23 | 3.2% |
| Puerto Rican | 14 | 1.9% |
| Scotch-Irish | 4 | 0.5% |
| Scottish | 16 | 2.2% |
| Slavic | 2 | 0.3% |
| Spaniard | 4 | 0.5% |
| Spanish | 9 | 1.2% |
| Sri Lankan | 4 | 0.5% |
| Subsaharan African | 5 | 0.7% |
| Swedish | 2 | 0.3% | View All 39 Rows |
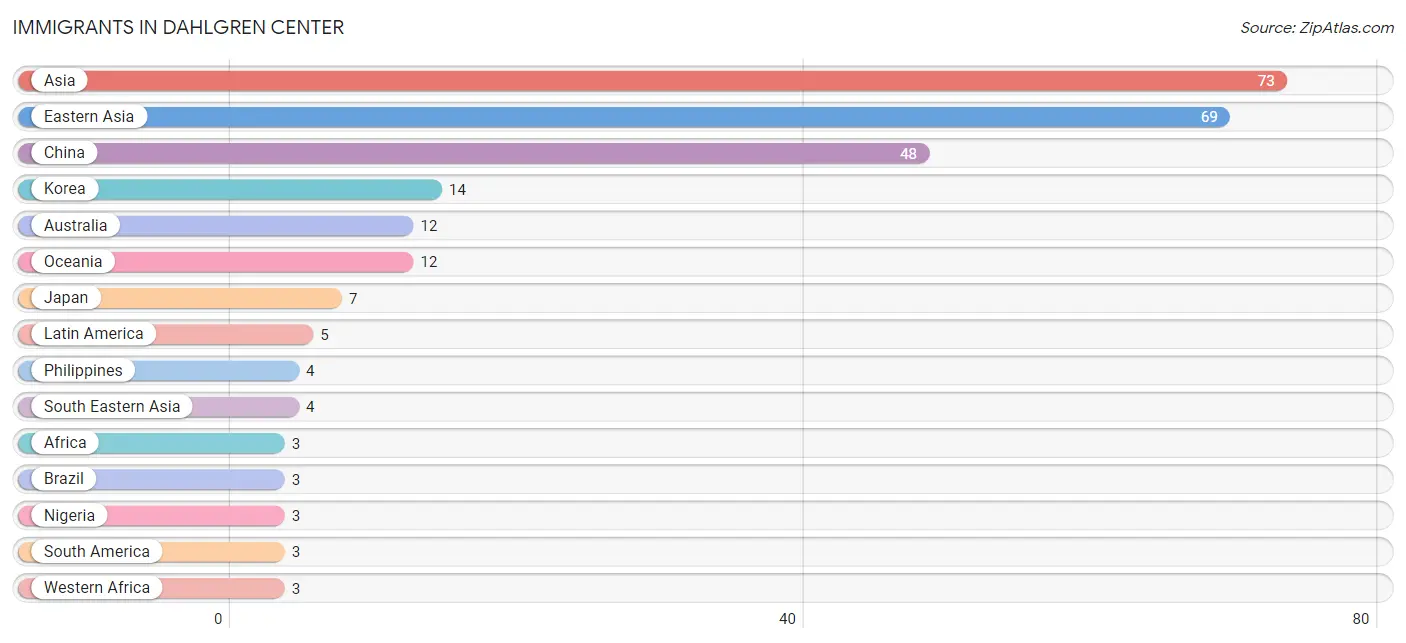
Immigrants in Dahlgren Center
The most numerous immigrant groups reported in Dahlgren Center came from Asia (73 | 10.1%), Eastern Asia (69 | 9.5%), China (48 | 6.6%), Korea (14 | 1.9%), and Australia (12 | 1.7%), together accounting for 29.9% of all Dahlgren Center residents.
| Immigration Origin | # Population | % Population |
| Africa | 3 | 0.4% |
| Asia | 73 | 10.1% |
| Australia | 12 | 1.7% |
| Brazil | 3 | 0.4% |
| Canada | 1 | 0.1% |
| Caribbean | 2 | 0.3% |
| China | 48 | 6.6% |
| Eastern Asia | 69 | 9.5% |
| Eastern Europe | 2 | 0.3% |
| Europe | 2 | 0.3% |
| Jamaica | 2 | 0.3% |
| Japan | 7 | 1.0% |
| Korea | 14 | 1.9% |
| Latin America | 5 | 0.7% |
| Nigeria | 3 | 0.4% |
| Oceania | 12 | 1.7% |
| Philippines | 4 | 0.5% |
| Poland | 2 | 0.3% |
| South America | 3 | 0.4% |
| South Eastern Asia | 4 | 0.5% |
| Western Africa | 3 | 0.4% | View All 21 Rows |
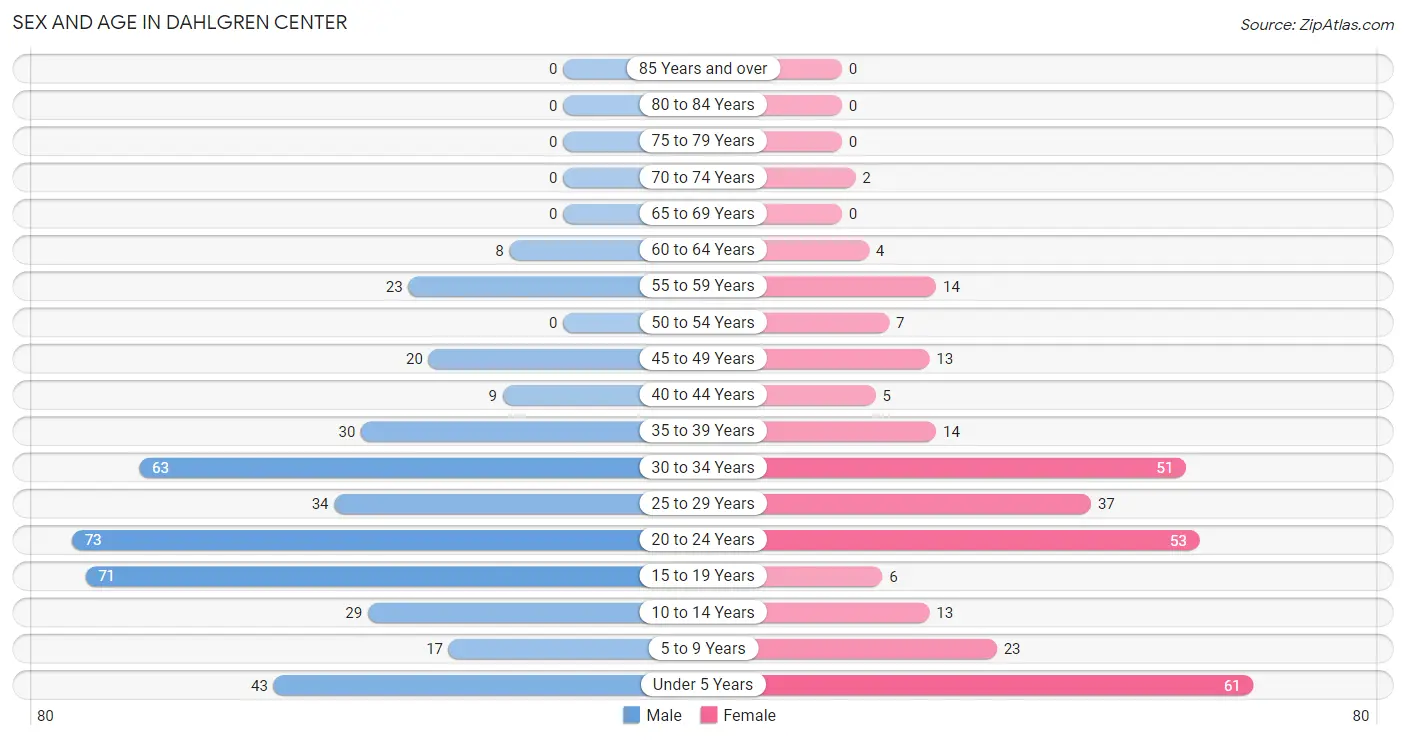
Sex and Age in Dahlgren Center
Sex and Age in Dahlgren Center
The most populous age groups in Dahlgren Center are 20 to 24 Years (73 | 17.4%) for men and Under 5 Years (61 | 20.1%) for women.
| Age Bracket | Male | Female |
| Under 5 Years | 43 (10.2%) | 61 (20.1%) |
| 5 to 9 Years | 17 (4.1%) | 23 (7.6%) |
| 10 to 14 Years | 29 (6.9%) | 13 (4.3%) |
| 15 to 19 Years | 71 (16.9%) | 6 (2.0%) |
| 20 to 24 Years | 73 (17.4%) | 53 (17.5%) |
| 25 to 29 Years | 34 (8.1%) | 37 (12.2%) |
| 30 to 34 Years | 63 (15.0%) | 51 (16.8%) |
| 35 to 39 Years | 30 (7.1%) | 14 (4.6%) |
| 40 to 44 Years | 9 (2.1%) | 5 (1.7%) |
| 45 to 49 Years | 20 (4.8%) | 13 (4.3%) |
| 50 to 54 Years | 0 (0.0%) | 7 (2.3%) |
| 55 to 59 Years | 23 (5.5%) | 14 (4.6%) |
| 60 to 64 Years | 8 (1.9%) | 4 (1.3%) |
| 65 to 69 Years | 0 (0.0%) | 0 (0.0%) |
| 70 to 74 Years | 0 (0.0%) | 2 (0.7%) |
| 75 to 79 Years | 0 (0.0%) | 0 (0.0%) |
| 80 to 84 Years | 0 (0.0%) | 0 (0.0%) |
| 85 Years and over | 0 (0.0%) | 0 (0.0%) |
| Total | 420 (100.0%) | 303 (100.0%) |
Families and Households in Dahlgren Center
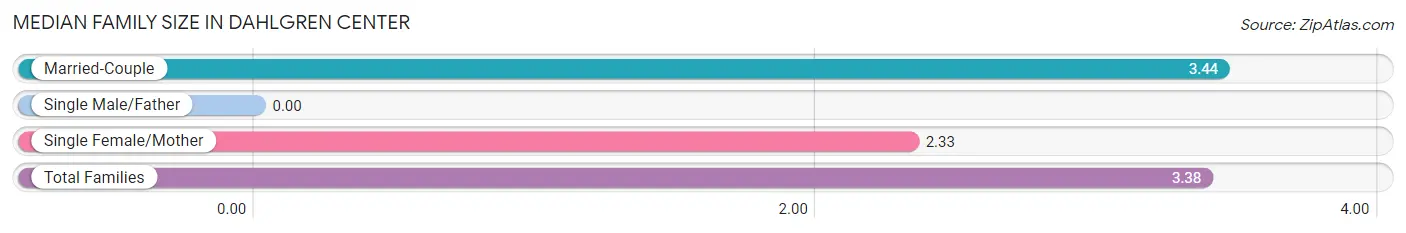
Median Family Size in Dahlgren Center
| Family Type | # Families | Family Size |
| Married-Couple | 153 (94.4%) | 3.44 |
| Single Male/Father | 0 (0.0%) | - |
| Single Female/Mother | 9 (5.6%) | 2.33 |
| Total Families | 162 (100.0%) | 3.38 |
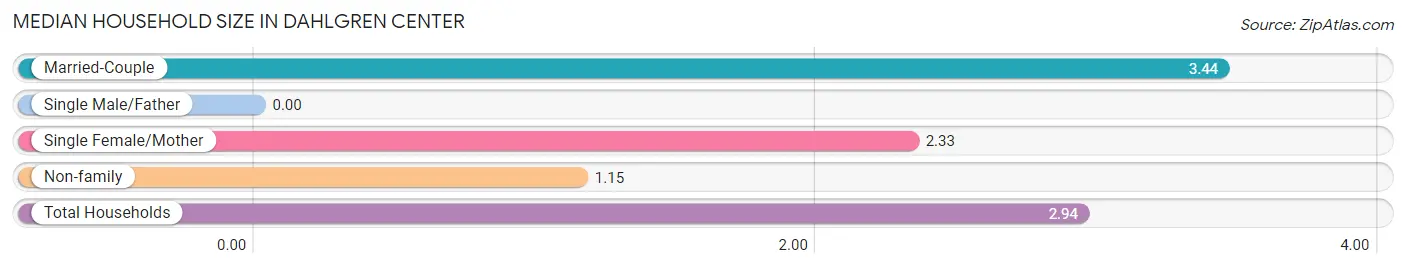
Median Household Size in Dahlgren Center
| Household Type | # Households | Household Size |
| Married-Couple | 153 (75.7%) | 3.44 |
| Single Male/Father | 0 (0.0%) | - |
| Single Female/Mother | 9 (4.5%) | 2.33 |
| Non-family | 40 (19.8%) | 1.15 |
| Total Households | 202 (100.0%) | 2.94 |
Household Size by Marriage Status in Dahlgren Center
Out of a total of 202 households in Dahlgren Center, 162 (80.2%) are family households, while 40 (19.8%) are nonfamily households. The most numerous type of family households are 2-person households, comprising 57, and the most common type of nonfamily households are 1-person households, comprising 36.
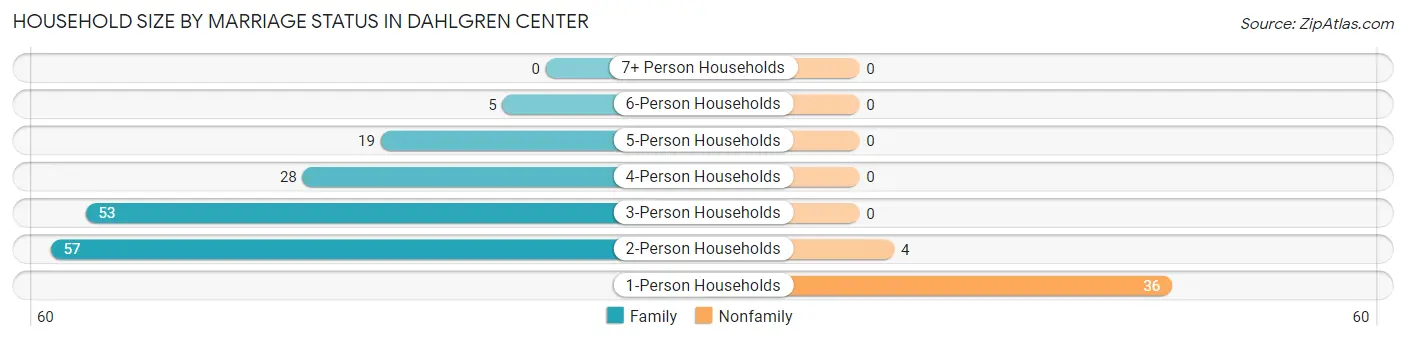
| Household Size | Family Households | Nonfamily Households |
| 1-Person Households | - | 36 (17.8%) |
| 2-Person Households | 57 (28.2%) | 4 (2.0%) |
| 3-Person Households | 53 (26.2%) | 0 (0.0%) |
| 4-Person Households | 28 (13.9%) | 0 (0.0%) |
| 5-Person Households | 19 (9.4%) | 0 (0.0%) |
| 6-Person Households | 5 (2.5%) | 0 (0.0%) |
| 7+ Person Households | 0 (0.0%) | 0 (0.0%) |
| Total | 162 (80.2%) | 40 (19.8%) |
Female Fertility in Dahlgren Center
Fertility by Age in Dahlgren Center
Average fertility rate in Dahlgren Center is 123.0 births per 1,000 women. Women in the age bracket of 20 to 34 years have the highest fertility rate with 156.0 births per 1,000 women. Women in the age bracket of 20 to 34 years acount for 100.0% of all women with births.
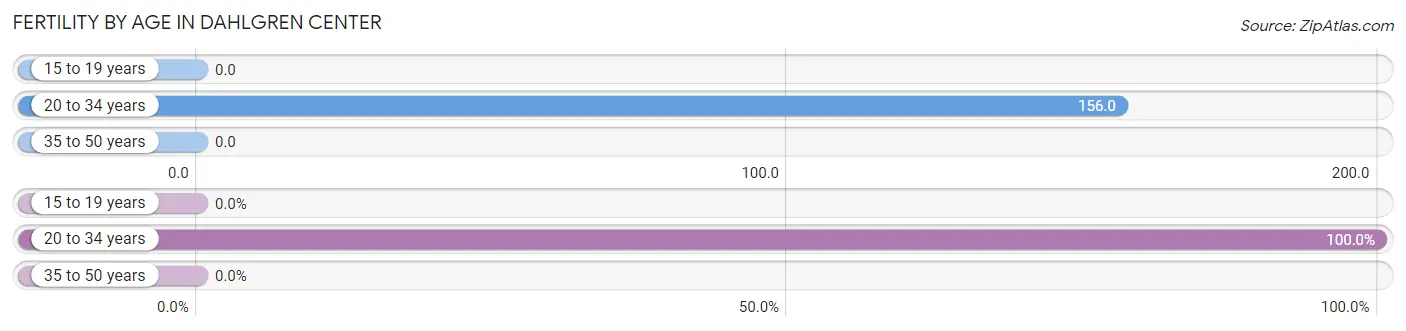
| Age Bracket | Women with Births | Births / 1,000 Women |
| 15 to 19 years | 0 (0.0%) | 0.0 |
| 20 to 34 years | 22 (100.0%) | 156.0 |
| 35 to 50 years | 0 (0.0%) | 0.0 |
| Total | 22 (100.0%) | 123.0 |
Fertility by Age by Marriage Status in Dahlgren Center
59.1% of women with births (22) in Dahlgren Center are married. The highest percentage of unmarried women with births falls into 20 to 34 years age bracket with 40.9% of them unmarried at the time of birth, while the lowest percentage of unmarried women with births belong to 20 to 34 years age bracket with 40.9% of them unmarried.
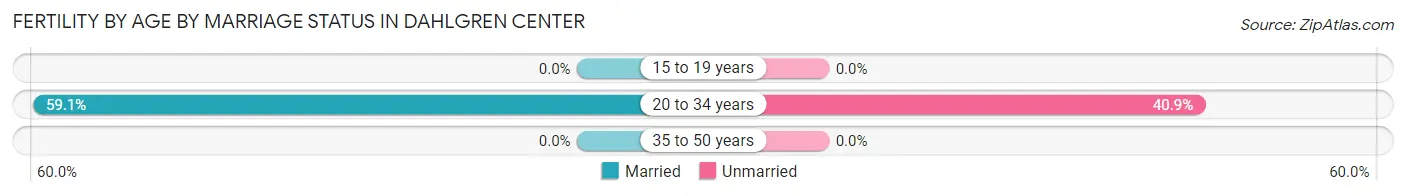
| Age Bracket | Married | Unmarried |
| 15 to 19 years | 0 (0.0%) | 0 (0.0%) |
| 20 to 34 years | 13 (59.1%) | 9 (40.9%) |
| 35 to 50 years | 0 (0.0%) | 0 (0.0%) |
| Total | 13 (59.1%) | 9 (40.9%) |
Fertility by Education in Dahlgren Center
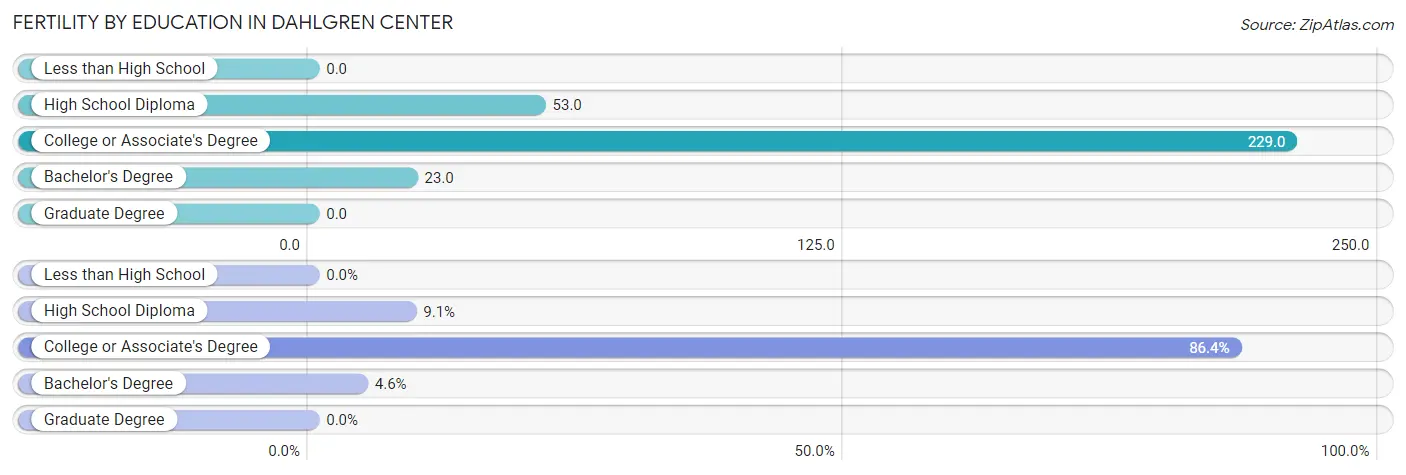
| Educational Attainment | Women with Births | Births / 1,000 Women |
| Less than High School | 0 (0.0%) | 0.0 |
| High School Diploma | 2 (9.1%) | 53.0 |
| College or Associate's Degree | 19 (86.4%) | 229.0 |
| Bachelor's Degree | 1 (4.5%) | 23.0 |
| Graduate Degree | 0 (0.0%) | 0.0 |
| Total | 22 (100.0%) | 123.0 |
Fertility by Education by Marriage Status in Dahlgren Center
40.9% of women with births in Dahlgren Center are unmarried. Women with the educational attainment of high school diploma are most likely to be married with 100.0% of them married at childbirth, while women with the educational attainment of college or associate's degree are least likely to be married with 47.4% of them unmarried at childbirth.
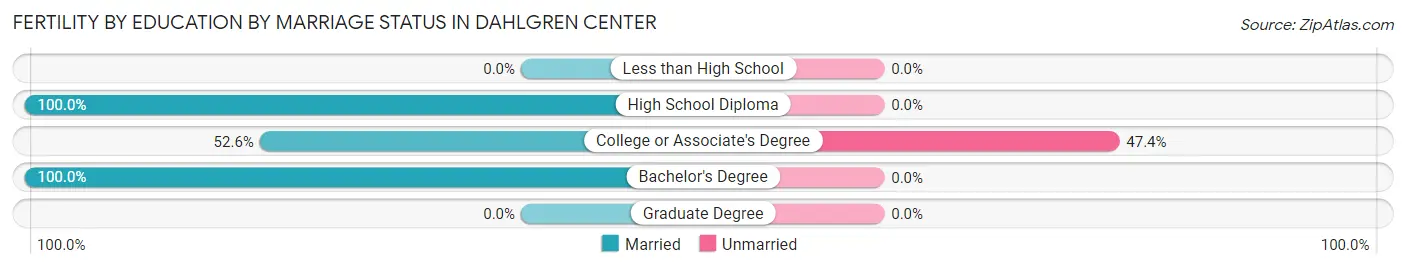
| Educational Attainment | Married | Unmarried |
| Less than High School | 0 (0.0%) | 0 (0.0%) |
| High School Diploma | 2 (100.0%) | 0 (0.0%) |
| College or Associate's Degree | 10 (52.6%) | 9 (47.4%) |
| Bachelor's Degree | 1 (100.0%) | 0 (0.0%) |
| Graduate Degree | 0 (0.0%) | 0 (0.0%) |
| Total | 13 (59.1%) | 9 (40.9%) |
Employment Characteristics in Dahlgren Center
Employment by Class of Employer in Dahlgren Center
Among the 399 employed individuals in Dahlgren Center, federal government employees (328 | 82.2%), private company employees (54 | 13.5%), and self-employed (incorporated) (7 | 1.8%) make up the most common classes of employment.
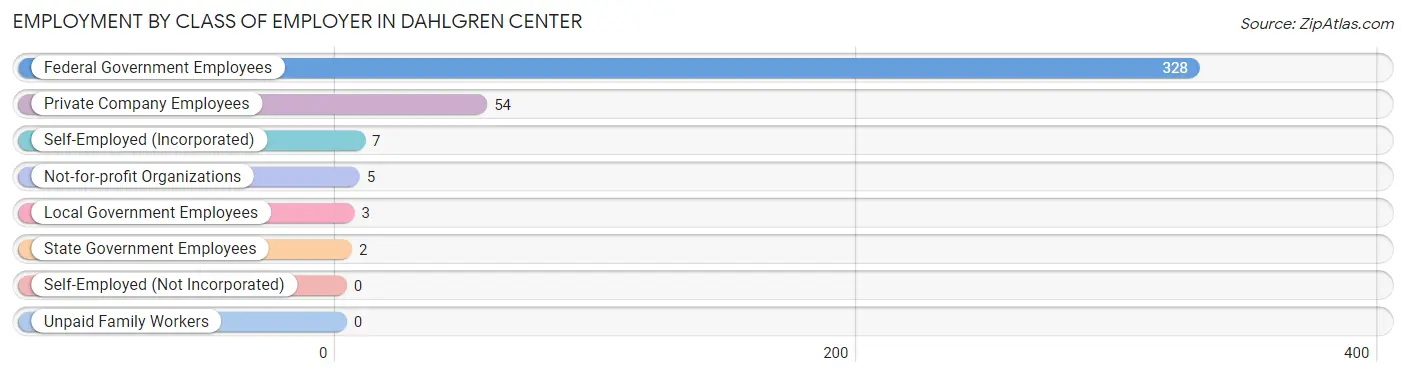
| Employer Class | # Employees | % Employees |
| Private Company Employees | 54 | 13.5% |
| Self-Employed (Incorporated) | 7 | 1.8% |
| Self-Employed (Not Incorporated) | 0 | 0.0% |
| Not-for-profit Organizations | 5 | 1.3% |
| Local Government Employees | 3 | 0.7% |
| State Government Employees | 2 | 0.5% |
| Federal Government Employees | 328 | 82.2% |
| Unpaid Family Workers | 0 | 0.0% |
| Total | 399 | 100.0% |
Employment Status by Age in Dahlgren Center
According to the labor force statistics for Dahlgren Center, out of the total population over 16 years of age (530), 78.3% or 415 individuals are in the labor force, with 5.2% or 22 of them unemployed. The age group with the highest labor force participation rate is 45 to 54 years, with 95.0% or 38 individuals in the labor force. Within the labor force, the 60 to 64 years age range has the highest percentage of unemployed individuals, with 20.0% or 2 of them being unemployed.
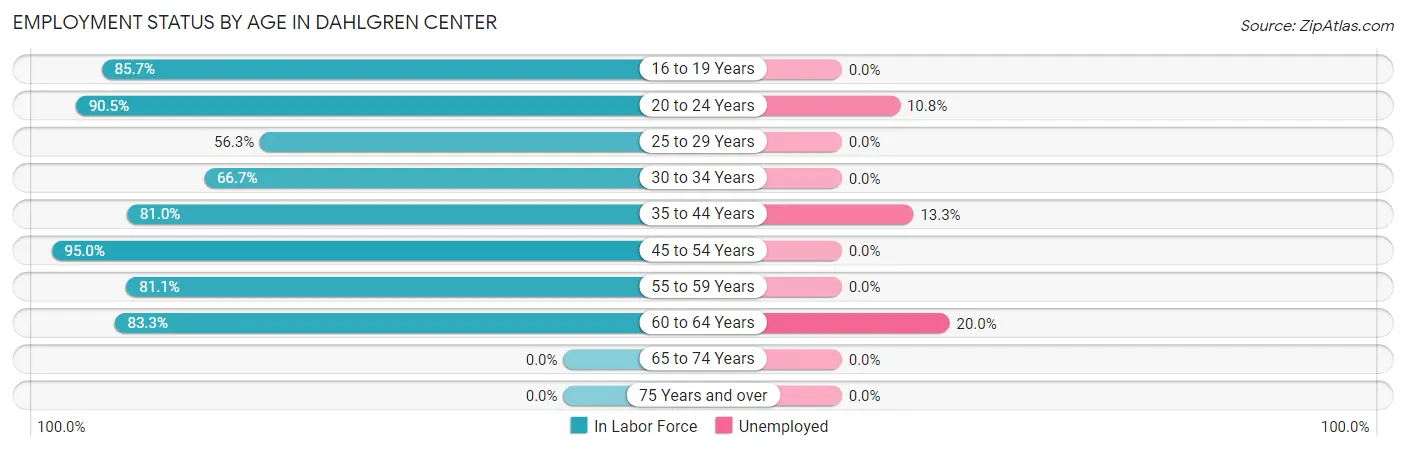
| Age Bracket | In Labor Force | Unemployed |
| 16 to 19 Years | 60 (85.7%) | 0 (0.0%) |
| 20 to 24 Years | 114 (90.5%) | 12 (10.8%) |
| 25 to 29 Years | 40 (56.3%) | 0 (0.0%) |
| 30 to 34 Years | 76 (66.7%) | 0 (0.0%) |
| 35 to 44 Years | 47 (81.0%) | 6 (13.3%) |
| 45 to 54 Years | 38 (95.0%) | 0 (0.0%) |
| 55 to 59 Years | 30 (81.1%) | 0 (0.0%) |
| 60 to 64 Years | 10 (83.3%) | 2 (20.0%) |
| 65 to 74 Years | 0 (0.0%) | 0 (0.0%) |
| 75 Years and over | 0 (0.0%) | 0 (0.0%) |
| Total | 415 (78.3%) | 22 (5.2%) |
Employment Status by Educational Attainment in Dahlgren Center
According to labor force statistics for Dahlgren Center, 72.6% of individuals (241) out of the total population between 25 and 64 years of age (332) are in the labor force, with 3.6% or 9 of them being unemployed. The group with the highest labor force participation rate are those with the educational attainment of high school diploma, with 89.4% or 42 individuals in the labor force. Within the labor force, individuals with college / associate degree education have the highest percentage of unemployment, with 20.0% or 14 of them being unemployed.
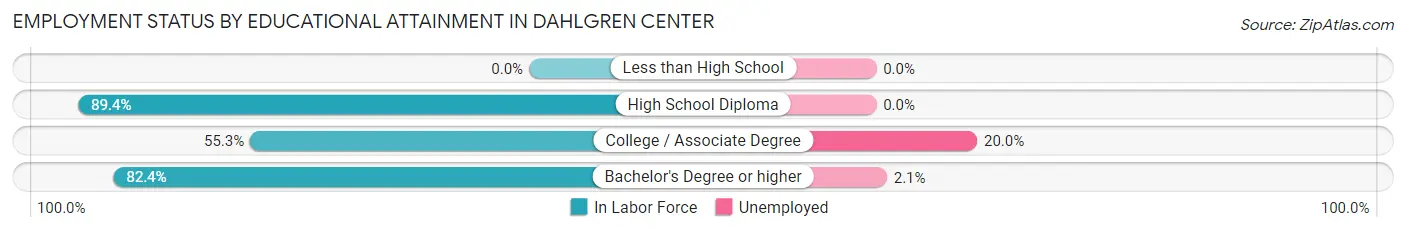
| Educational Attainment | In Labor Force | Unemployed |
| Less than High School | 0 (0.0%) | 0 (0.0%) |
| High School Diploma | 42 (89.4%) | 0 (0.0%) |
| College / Associate Degree | 68 (55.3%) | 25 (20.0%) |
| Bachelor's Degree or higher | 131 (82.4%) | 3 (2.1%) |
| Total | 241 (72.6%) | 12 (3.6%) |
Employment Occupations by Sex in Dahlgren Center
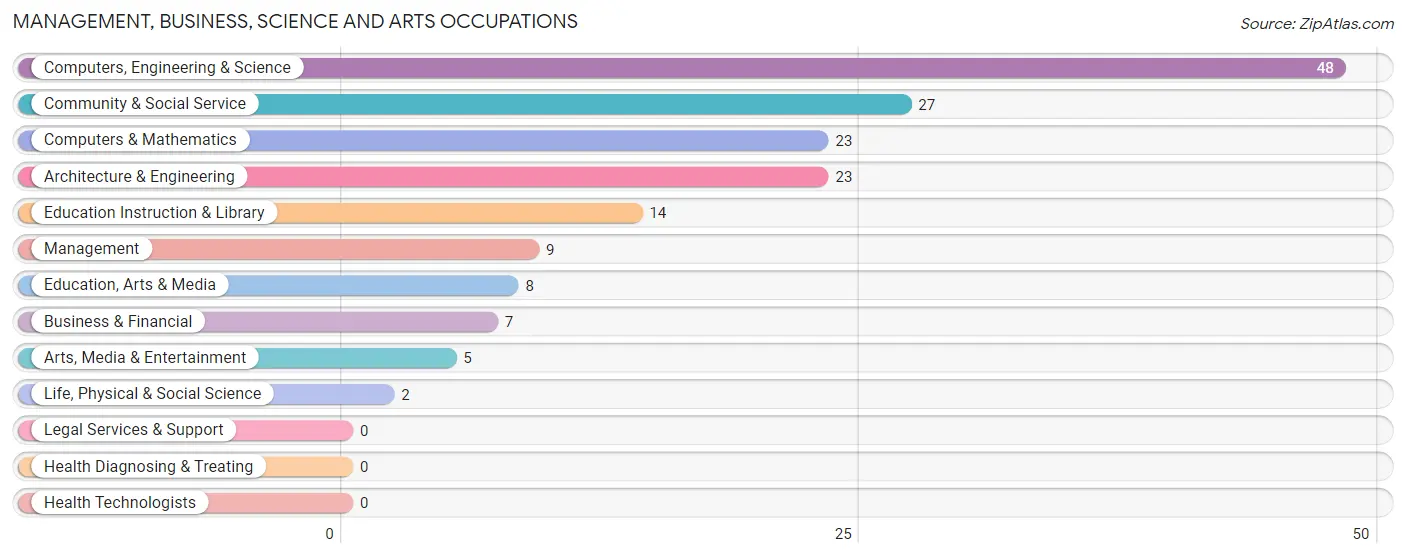
Management, Business, Science and Arts Occupations
The most common Management, Business, Science and Arts occupations in Dahlgren Center are Computers, Engineering & Science (48 | 32.9%), Community & Social Service (27 | 18.5%), Computers & Mathematics (23 | 15.8%), Architecture & Engineering (23 | 15.8%), and Education Instruction & Library (14 | 9.6%).
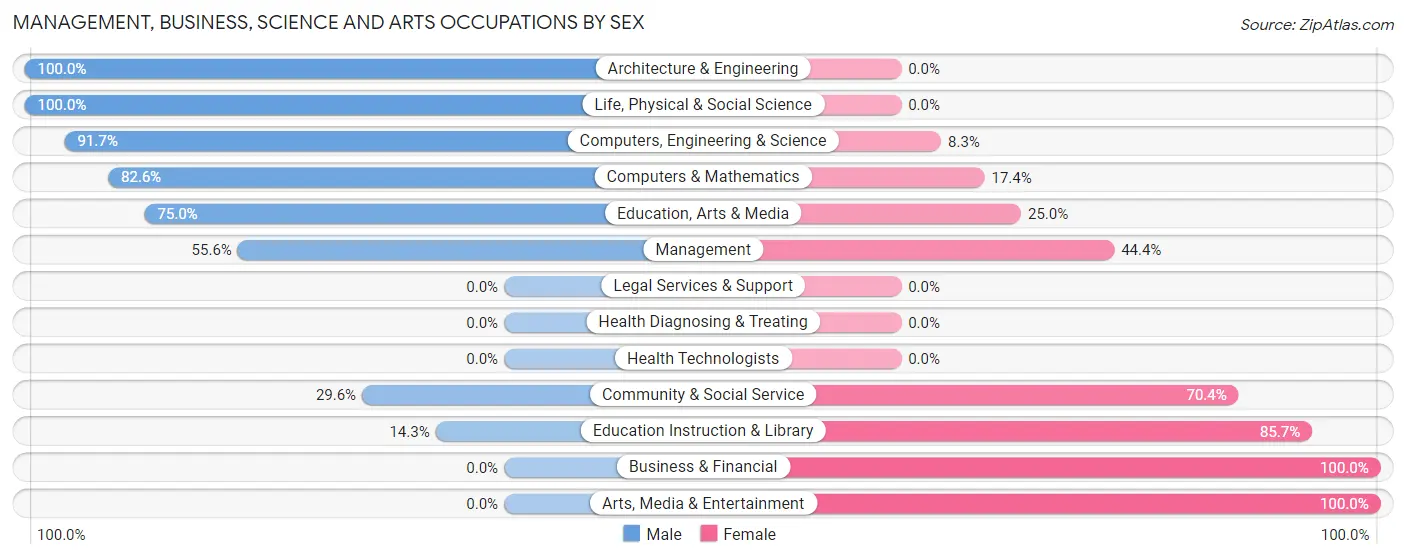
Management, Business, Science and Arts Occupations by Sex
Within the Management, Business, Science and Arts occupations in Dahlgren Center, the most male-oriented occupations are Architecture & Engineering (100.0%), Life, Physical & Social Science (100.0%), and Computers, Engineering & Science (91.7%), while the most female-oriented occupations are Business & Financial (100.0%), Arts, Media & Entertainment (100.0%), and Education Instruction & Library (85.7%).
| Occupation | Male | Female |
| Management | 5 (55.6%) | 4 (44.4%) |
| Business & Financial | 0 (0.0%) | 7 (100.0%) |
| Computers, Engineering & Science | 44 (91.7%) | 4 (8.3%) |
| Computers & Mathematics | 19 (82.6%) | 4 (17.4%) |
| Architecture & Engineering | 23 (100.0%) | 0 (0.0%) |
| Life, Physical & Social Science | 2 (100.0%) | 0 (0.0%) |
| Community & Social Service | 8 (29.6%) | 19 (70.4%) |
| Education, Arts & Media | 6 (75.0%) | 2 (25.0%) |
| Legal Services & Support | 0 (0.0%) | 0 (0.0%) |
| Education Instruction & Library | 2 (14.3%) | 12 (85.7%) |
| Arts, Media & Entertainment | 0 (0.0%) | 5 (100.0%) |
| Health Diagnosing & Treating | 0 (0.0%) | 0 (0.0%) |
| Health Technologists | 0 (0.0%) | 0 (0.0%) |
| Total (Category) | 57 (62.6%) | 34 (37.4%) |
| Total (Overall) | 76 (52.0%) | 70 (47.9%) |
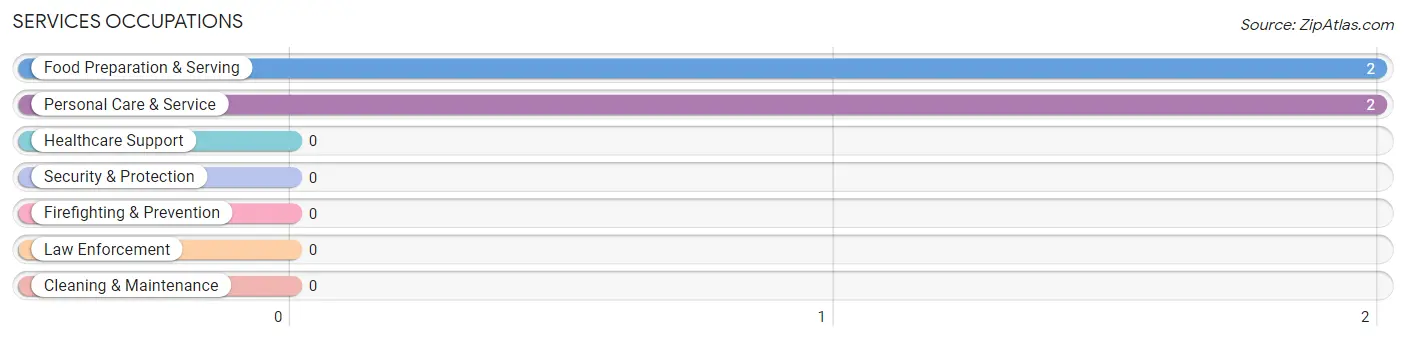
Services Occupations
The most common Services occupations in Dahlgren Center are Food Preparation & Serving (2 | 1.4%), and Personal Care & Service (2 | 1.4%).
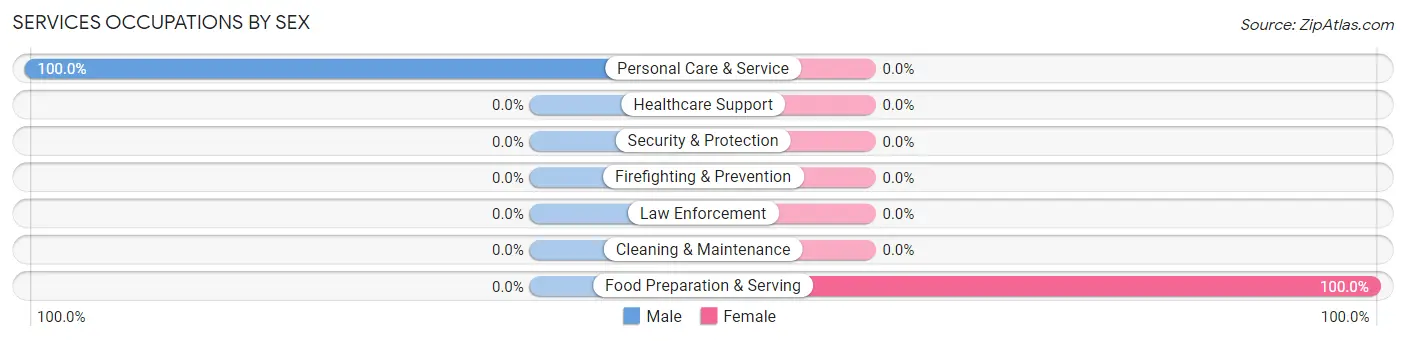
Services Occupations by Sex
| Occupation | Male | Female |
| Healthcare Support | 0 (0.0%) | 0 (0.0%) |
| Security & Protection | 0 (0.0%) | 0 (0.0%) |
| Firefighting & Prevention | 0 (0.0%) | 0 (0.0%) |
| Law Enforcement | 0 (0.0%) | 0 (0.0%) |
| Food Preparation & Serving | 0 (0.0%) | 2 (100.0%) |
| Cleaning & Maintenance | 0 (0.0%) | 0 (0.0%) |
| Personal Care & Service | 2 (100.0%) | 0 (0.0%) |
| Total (Category) | 2 (50.0%) | 2 (50.0%) |
| Total (Overall) | 76 (52.0%) | 70 (47.9%) |
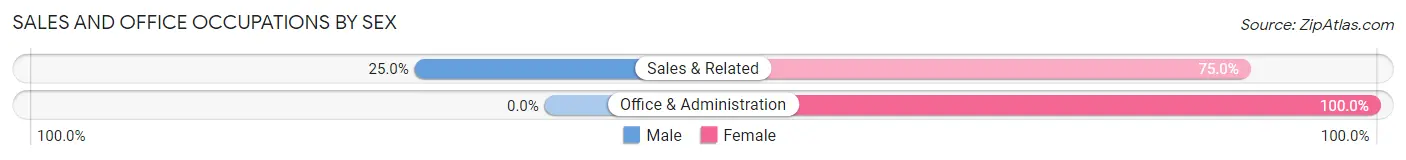
Sales and Office Occupations
The most common Sales and Office occupations in Dahlgren Center are Sales & Related (28 | 19.2%), and Office & Administration (9 | 6.2%).
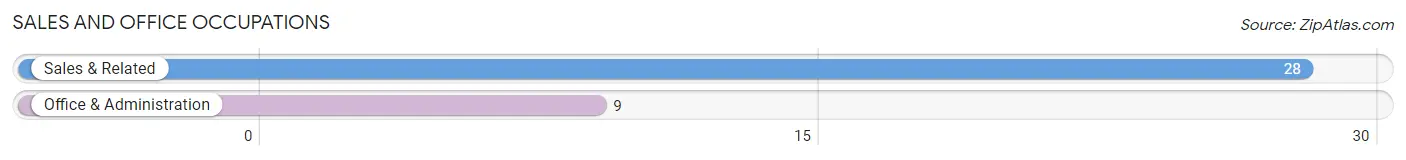
Sales and Office Occupations by Sex
| Occupation | Male | Female |
| Sales & Related | 7 (25.0%) | 21 (75.0%) |
| Office & Administration | 0 (0.0%) | 9 (100.0%) |
| Total (Category) | 7 (18.9%) | 30 (81.1%) |
| Total (Overall) | 76 (52.0%) | 70 (47.9%) |
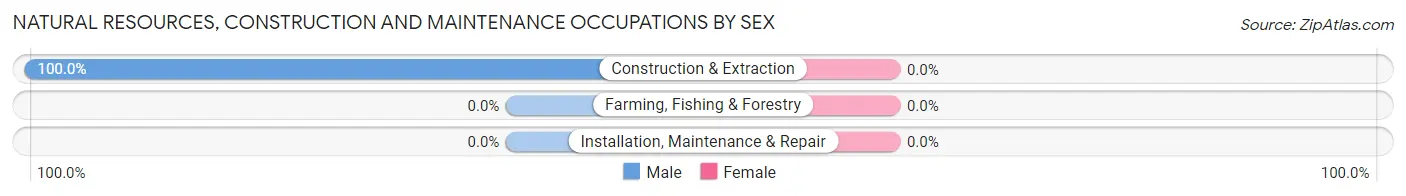
Natural Resources, Construction and Maintenance Occupations
The most common Natural Resources, Construction and Maintenance occupations in Dahlgren Center are , and Construction & Extraction (8 | 5.5%).
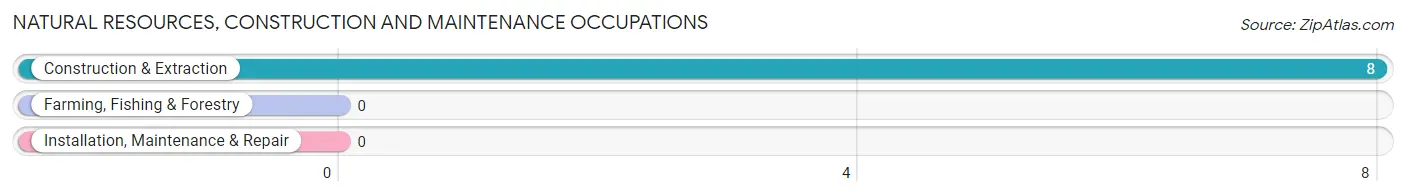
Natural Resources, Construction and Maintenance Occupations by Sex
| Occupation | Male | Female |
| Farming, Fishing & Forestry | 0 (0.0%) | 0 (0.0%) |
| Construction & Extraction | 8 (100.0%) | 0 (0.0%) |
| Installation, Maintenance & Repair | 0 (0.0%) | 0 (0.0%) |
| Total (Category) | 8 (100.0%) | 0 (0.0%) |
| Total (Overall) | 76 (52.0%) | 70 (47.9%) |
Production, Transportation and Moving Occupations
The most common Production, Transportation and Moving occupations in Dahlgren Center are Material Moving (4 | 2.7%), and Transportation (2 | 1.4%).
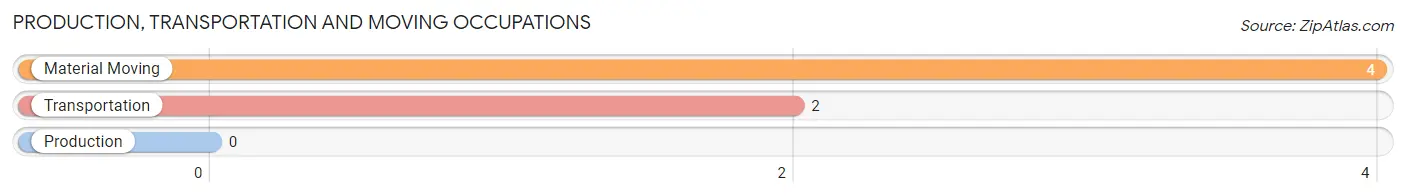
Production, Transportation and Moving Occupations by Sex
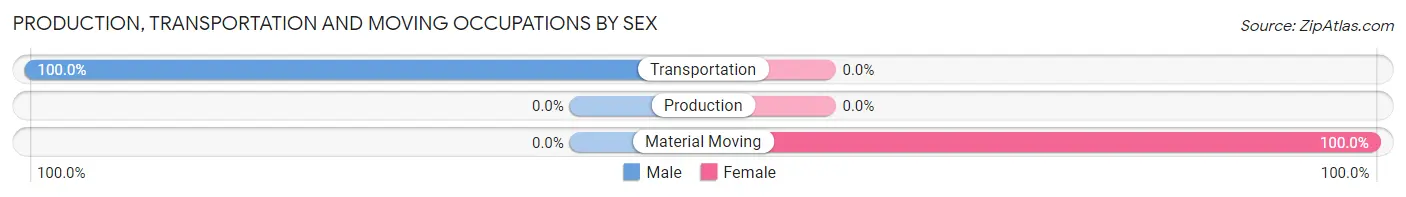
| Occupation | Male | Female |
| Production | 0 (0.0%) | 0 (0.0%) |
| Transportation | 2 (100.0%) | 0 (0.0%) |
| Material Moving | 0 (0.0%) | 4 (100.0%) |
| Total (Category) | 2 (33.3%) | 4 (66.7%) |
| Total (Overall) | 76 (52.0%) | 70 (47.9%) |
Employment Industries by Sex in Dahlgren Center
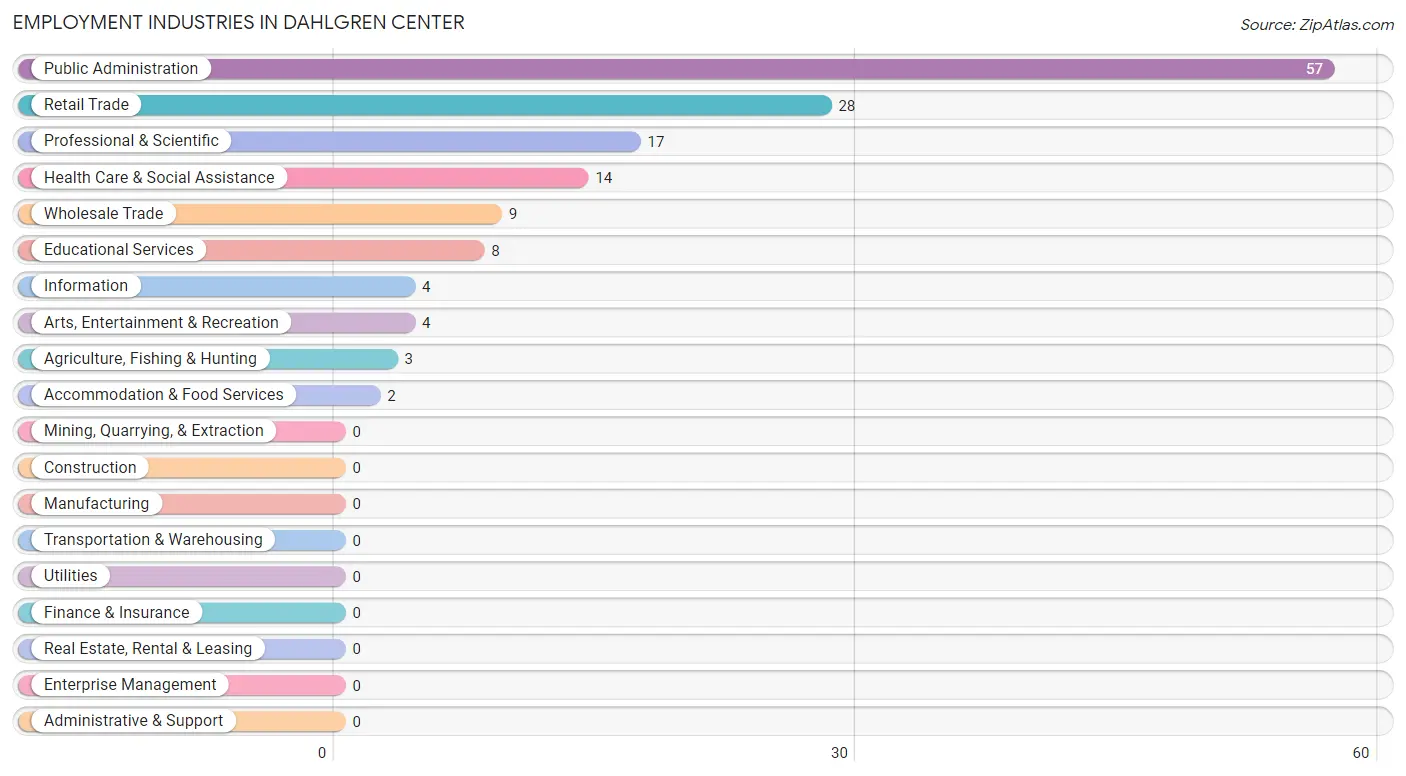
Employment Industries in Dahlgren Center
The major employment industries in Dahlgren Center include Public Administration (57 | 39.0%), Retail Trade (28 | 19.2%), Professional & Scientific (17 | 11.6%), Health Care & Social Assistance (14 | 9.6%), and Wholesale Trade (9 | 6.2%).
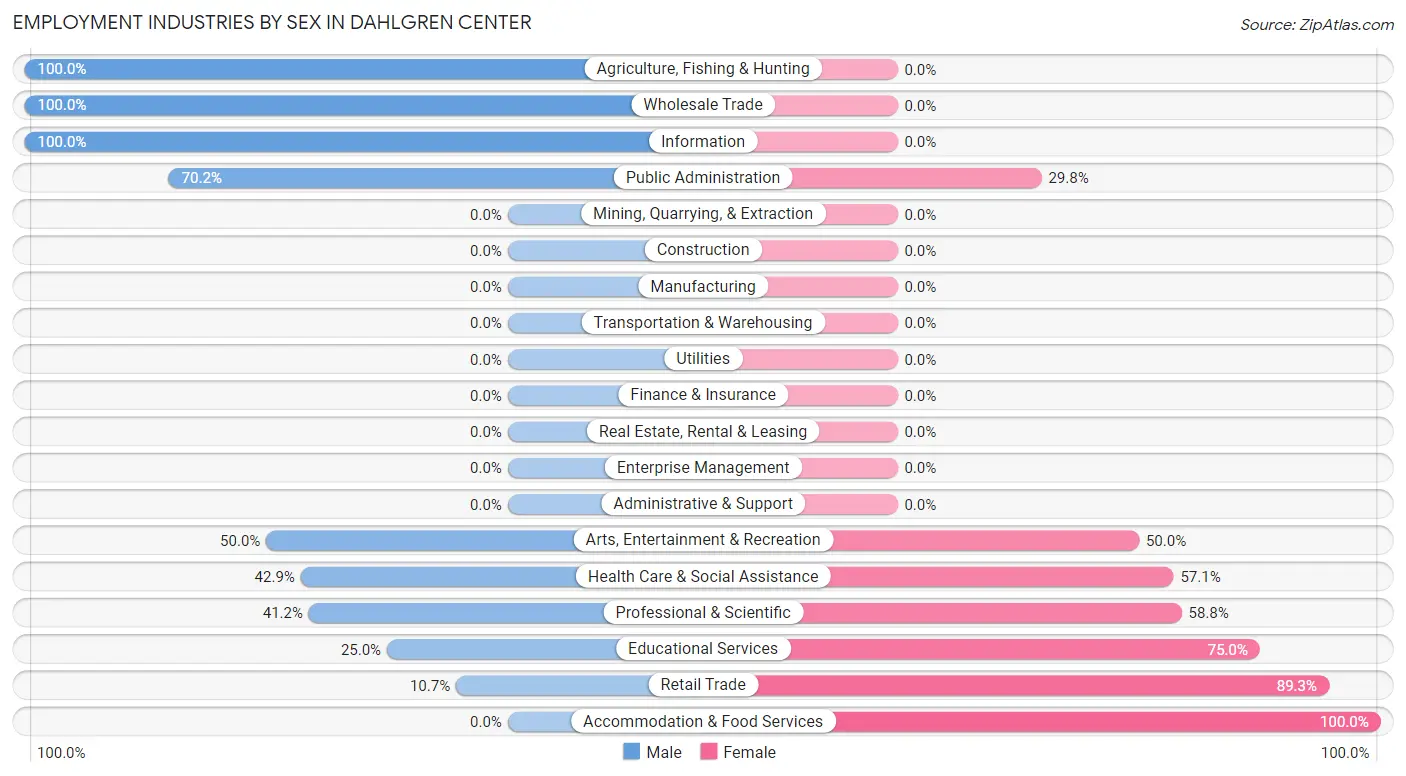
Employment Industries by Sex in Dahlgren Center
The Dahlgren Center industries that see more men than women are Agriculture, Fishing & Hunting (100.0%), Wholesale Trade (100.0%), and Information (100.0%), whereas the industries that tend to have a higher number of women are Accommodation & Food Services (100.0%), Retail Trade (89.3%), and Educational Services (75.0%).
| Industry | Male | Female |
| Agriculture, Fishing & Hunting | 3 (100.0%) | 0 (0.0%) |
| Mining, Quarrying, & Extraction | 0 (0.0%) | 0 (0.0%) |
| Construction | 0 (0.0%) | 0 (0.0%) |
| Manufacturing | 0 (0.0%) | 0 (0.0%) |
| Wholesale Trade | 9 (100.0%) | 0 (0.0%) |
| Retail Trade | 3 (10.7%) | 25 (89.3%) |
| Transportation & Warehousing | 0 (0.0%) | 0 (0.0%) |
| Utilities | 0 (0.0%) | 0 (0.0%) |
| Information | 4 (100.0%) | 0 (0.0%) |
| Finance & Insurance | 0 (0.0%) | 0 (0.0%) |
| Real Estate, Rental & Leasing | 0 (0.0%) | 0 (0.0%) |
| Professional & Scientific | 7 (41.2%) | 10 (58.8%) |
| Enterprise Management | 0 (0.0%) | 0 (0.0%) |
| Administrative & Support | 0 (0.0%) | 0 (0.0%) |
| Educational Services | 2 (25.0%) | 6 (75.0%) |
| Health Care & Social Assistance | 6 (42.9%) | 8 (57.1%) |
| Arts, Entertainment & Recreation | 2 (50.0%) | 2 (50.0%) |
| Accommodation & Food Services | 0 (0.0%) | 2 (100.0%) |
| Public Administration | 40 (70.2%) | 17 (29.8%) |
| Total | 76 (52.0%) | 70 (47.9%) |
Education in Dahlgren Center
School Enrollment in Dahlgren Center
The most common levels of schooling among the 174 students in Dahlgren Center are college / undergraduate (42 | 24.1%), elementary school (39 | 22.4%), and middle school (39 | 22.4%).
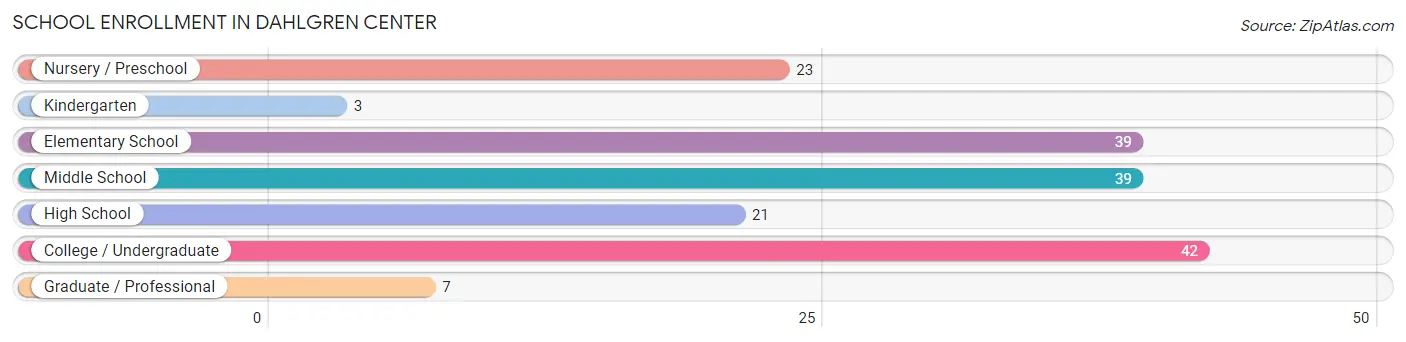
| School Level | # Students | % Students |
| Nursery / Preschool | 23 | 13.2% |
| Kindergarten | 3 | 1.7% |
| Elementary School | 39 | 22.4% |
| Middle School | 39 | 22.4% |
| High School | 21 | 12.1% |
| College / Undergraduate | 42 | 24.1% |
| Graduate / Professional | 7 | 4.0% |
| Total | 174 | 100.0% |
School Enrollment by Age by Funding Source in Dahlgren Center
Out of a total of 174 students who are enrolled in schools in Dahlgren Center, 52 (29.9%) attend a private institution, while the remaining 122 (70.1%) are enrolled in public schools. The age group of 25 to 34 year olds has the highest likelihood of being enrolled in private schools, with 15 (57.7% in the age bracket) enrolled. Conversely, the age group of 18 to 19 year olds has the lowest likelihood of being enrolled in a private school, with 4 (100.0% in the age bracket) attending a public institution.
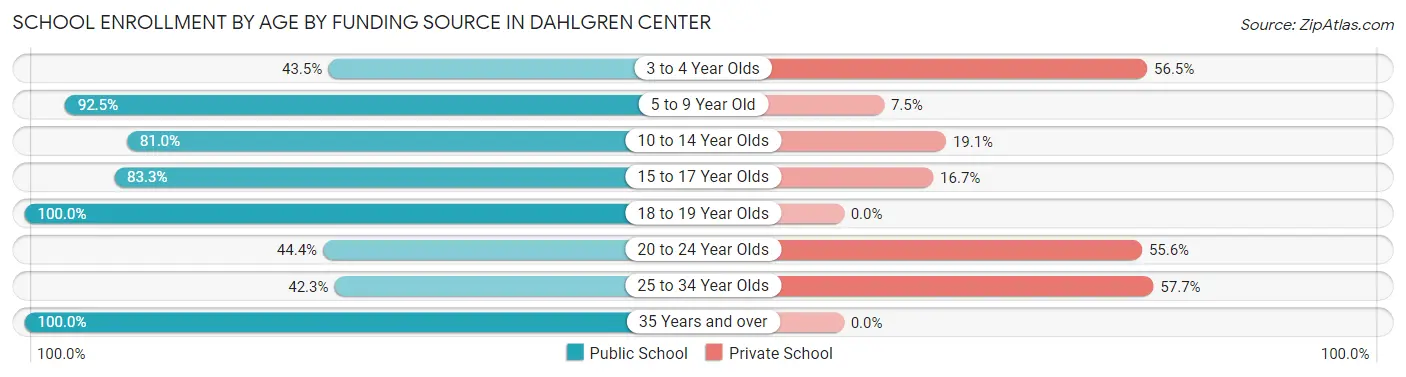
| Age Bracket | Public School | Private School |
| 3 to 4 Year Olds | 10 (43.5%) | 13 (56.5%) |
| 5 to 9 Year Old | 37 (92.5%) | 3 (7.5%) |
| 10 to 14 Year Olds | 34 (80.9%) | 8 (19.1%) |
| 15 to 17 Year Olds | 15 (83.3%) | 3 (16.7%) |
| 18 to 19 Year Olds | 4 (100.0%) | 0 (0.0%) |
| 20 to 24 Year Olds | 8 (44.4%) | 10 (55.6%) |
| 25 to 34 Year Olds | 11 (42.3%) | 15 (57.7%) |
| 35 Years and over | 3 (100.0%) | 0 (0.0%) |
| Total | 122 (70.1%) | 52 (29.9%) |
Educational Attainment by Field of Study in Dahlgren Center
Business (62 | 37.3%), engineering (29 | 17.5%), science & technology (9 | 5.4%), liberal arts & history (9 | 5.4%), and arts & humanities (9 | 5.4%) are the most common fields of study among 166 individuals in Dahlgren Center who have obtained a bachelor's degree or higher.
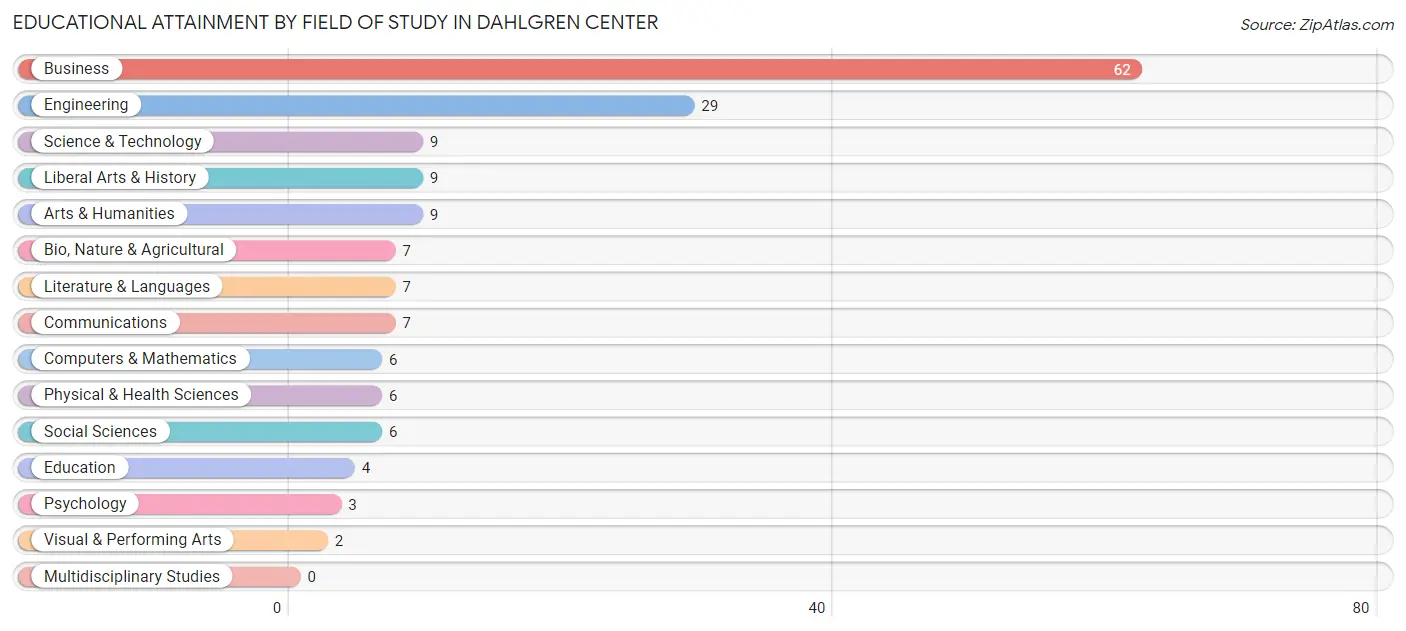
| Field of Study | # Graduates | % Graduates |
| Computers & Mathematics | 6 | 3.6% |
| Bio, Nature & Agricultural | 7 | 4.2% |
| Physical & Health Sciences | 6 | 3.6% |
| Psychology | 3 | 1.8% |
| Social Sciences | 6 | 3.6% |
| Engineering | 29 | 17.5% |
| Multidisciplinary Studies | 0 | 0.0% |
| Science & Technology | 9 | 5.4% |
| Business | 62 | 37.3% |
| Education | 4 | 2.4% |
| Literature & Languages | 7 | 4.2% |
| Liberal Arts & History | 9 | 5.4% |
| Visual & Performing Arts | 2 | 1.2% |
| Communications | 7 | 4.2% |
| Arts & Humanities | 9 | 5.4% |
| Total | 166 | 100.0% |
Transportation & Commute in Dahlgren Center
Vehicle Availability by Sex in Dahlgren Center
The most prevalent vehicle ownership categories in Dahlgren Center are males with 2 vehicles (76, accounting for 39.6%) and females with 2 vehicles (31, making up 89.4%).
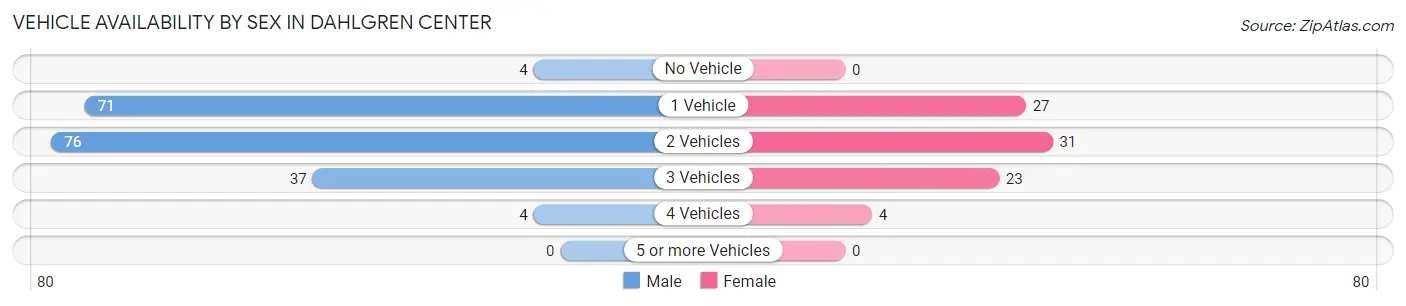
| Vehicles Available | Male | Female |
| No Vehicle | 4 (2.1%) | 0 (0.0%) |
| 1 Vehicle | 71 (37.0%) | 27 (31.8%) |
| 2 Vehicles | 76 (39.6%) | 31 (36.5%) |
| 3 Vehicles | 37 (19.3%) | 23 (27.1%) |
| 4 Vehicles | 4 (2.1%) | 4 (4.7%) |
| 5 or more Vehicles | 0 (0.0%) | 0 (0.0%) |
| Total | 192 (100.0%) | 85 (100.0%) |
Commute Time in Dahlgren Center
The most frequently occuring commute durations in Dahlgren Center are 5 to 9 minutes (110 commuters, 31.3%), 10 to 14 minutes (108 commuters, 30.8%), and less than 5 minutes (86 commuters, 24.5%).
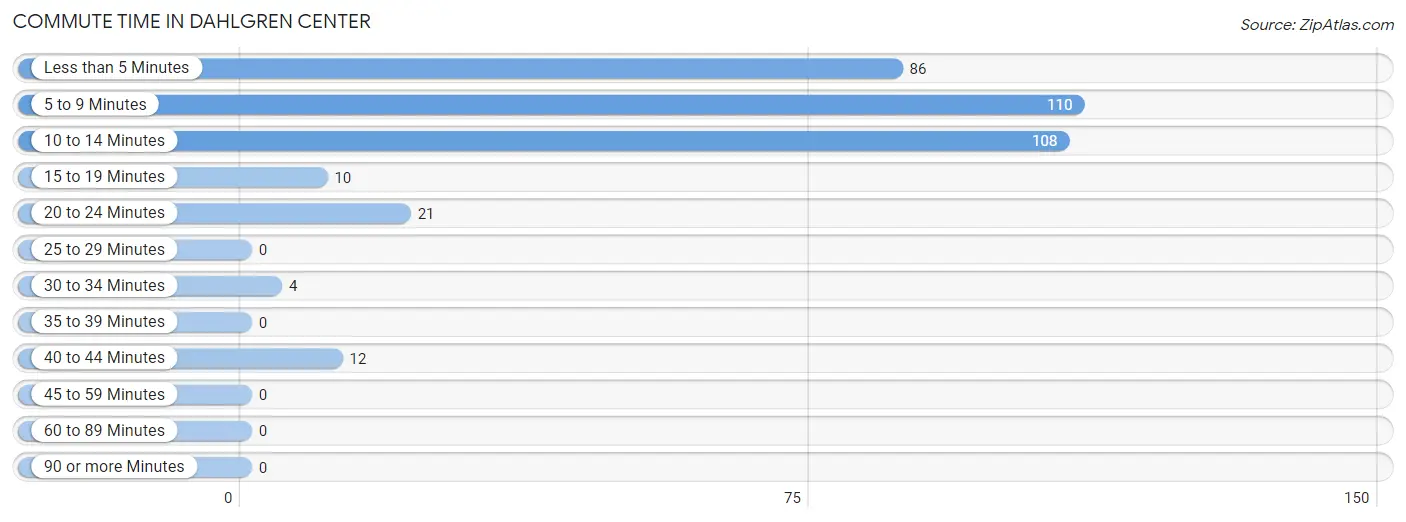
| Commute Time | # Commuters | % Commuters |
| Less than 5 Minutes | 86 | 24.5% |
| 5 to 9 Minutes | 110 | 31.3% |
| 10 to 14 Minutes | 108 | 30.8% |
| 15 to 19 Minutes | 10 | 2.9% |
| 20 to 24 Minutes | 21 | 6.0% |
| 25 to 29 Minutes | 0 | 0.0% |
| 30 to 34 Minutes | 4 | 1.1% |
| 35 to 39 Minutes | 0 | 0.0% |
| 40 to 44 Minutes | 12 | 3.4% |
| 45 to 59 Minutes | 0 | 0.0% |
| 60 to 89 Minutes | 0 | 0.0% |
| 90 or more Minutes | 0 | 0.0% |
Commute Time by Sex in Dahlgren Center
The most common commute times in Dahlgren Center are 5 to 9 minutes (91 commuters, 33.2%) for males and 10 to 14 minutes (24 commuters, 31.2%) for females.
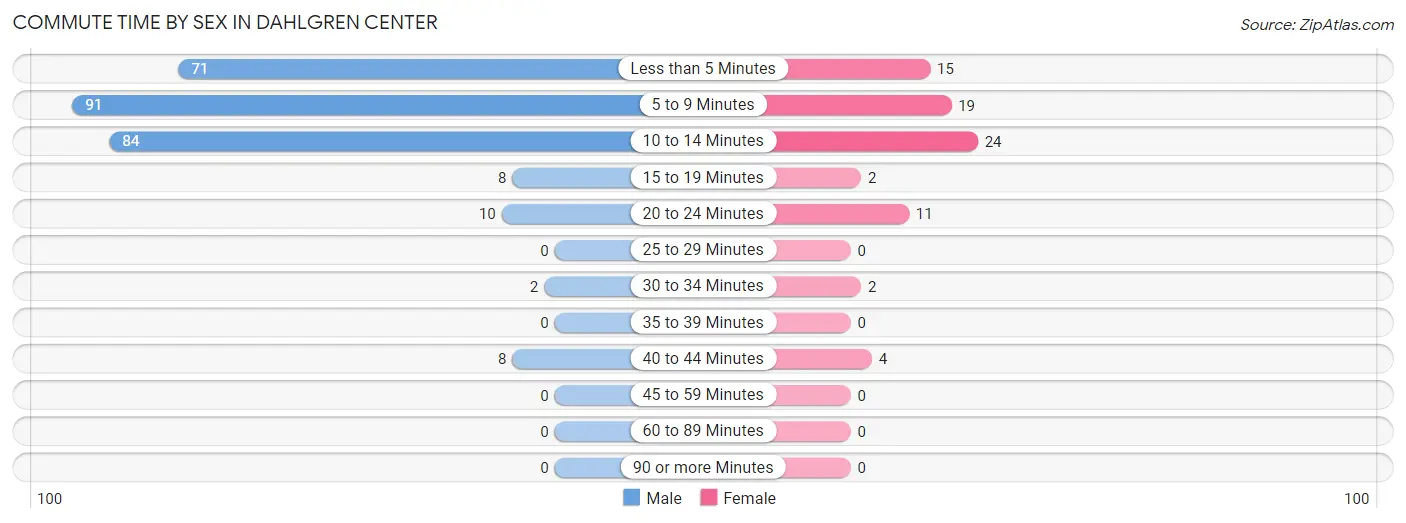
| Commute Time | Male | Female |
| Less than 5 Minutes | 71 (25.9%) | 15 (19.5%) |
| 5 to 9 Minutes | 91 (33.2%) | 19 (24.7%) |
| 10 to 14 Minutes | 84 (30.7%) | 24 (31.2%) |
| 15 to 19 Minutes | 8 (2.9%) | 2 (2.6%) |
| 20 to 24 Minutes | 10 (3.6%) | 11 (14.3%) |
| 25 to 29 Minutes | 0 (0.0%) | 0 (0.0%) |
| 30 to 34 Minutes | 2 (0.7%) | 2 (2.6%) |
| 35 to 39 Minutes | 0 (0.0%) | 0 (0.0%) |
| 40 to 44 Minutes | 8 (2.9%) | 4 (5.2%) |
| 45 to 59 Minutes | 0 (0.0%) | 0 (0.0%) |
| 60 to 89 Minutes | 0 (0.0%) | 0 (0.0%) |
| 90 or more Minutes | 0 (0.0%) | 0 (0.0%) |
Time of Departure to Work by Sex in Dahlgren Center
The most frequent times of departure to work in Dahlgren Center are 6:00 AM to 6:29 AM (56, 20.4%) for males and 6:30 AM to 6:59 AM (20, 26.0%) for females.
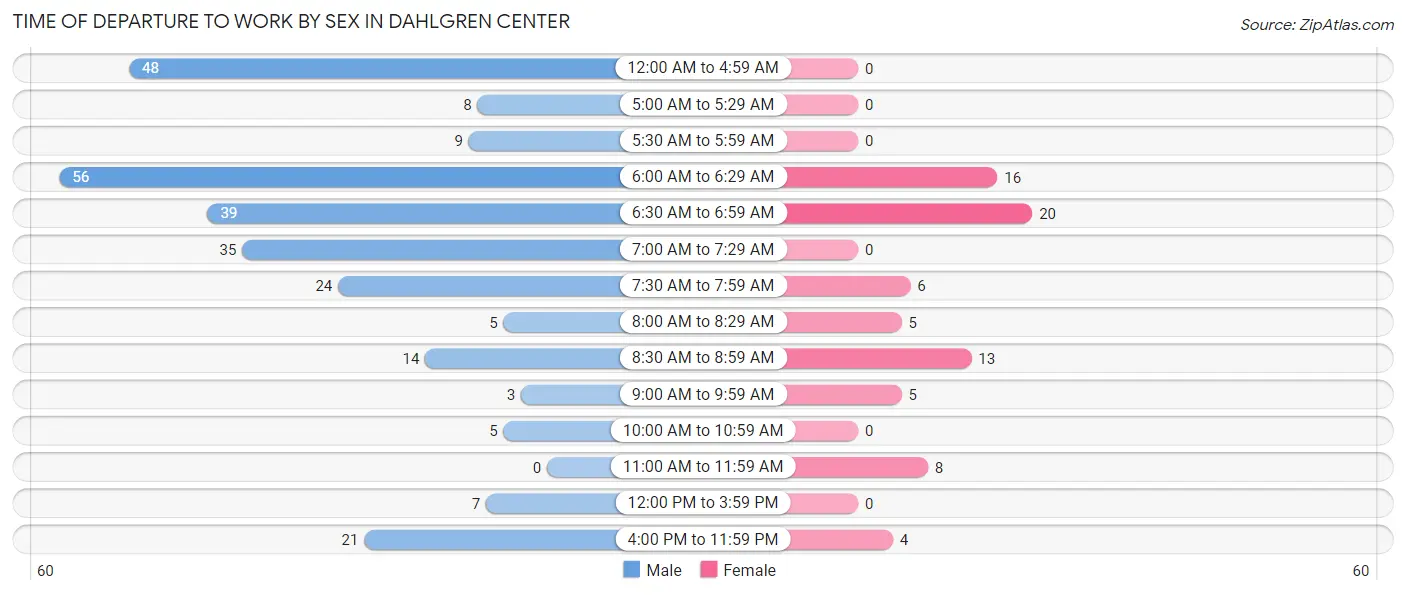
| Time of Departure | Male | Female |
| 12:00 AM to 4:59 AM | 48 (17.5%) | 0 (0.0%) |
| 5:00 AM to 5:29 AM | 8 (2.9%) | 0 (0.0%) |
| 5:30 AM to 5:59 AM | 9 (3.3%) | 0 (0.0%) |
| 6:00 AM to 6:29 AM | 56 (20.4%) | 16 (20.8%) |
| 6:30 AM to 6:59 AM | 39 (14.2%) | 20 (26.0%) |
| 7:00 AM to 7:29 AM | 35 (12.8%) | 0 (0.0%) |
| 7:30 AM to 7:59 AM | 24 (8.8%) | 6 (7.8%) |
| 8:00 AM to 8:29 AM | 5 (1.8%) | 5 (6.5%) |
| 8:30 AM to 8:59 AM | 14 (5.1%) | 13 (16.9%) |
| 9:00 AM to 9:59 AM | 3 (1.1%) | 5 (6.5%) |
| 10:00 AM to 10:59 AM | 5 (1.8%) | 0 (0.0%) |
| 11:00 AM to 11:59 AM | 0 (0.0%) | 8 (10.4%) |
| 12:00 PM to 3:59 PM | 7 (2.5%) | 0 (0.0%) |
| 4:00 PM to 11:59 PM | 21 (7.7%) | 4 (5.2%) |
| Total | 274 (100.0%) | 77 (100.0%) |
Housing Occupancy in Dahlgren Center
Occupancy by Ownership in Dahlgren Center
Of the total 202 dwellings in Dahlgren Center, owner-occupied units account for 0 (0.0%), while renter-occupied units make up 202 (100.0%).
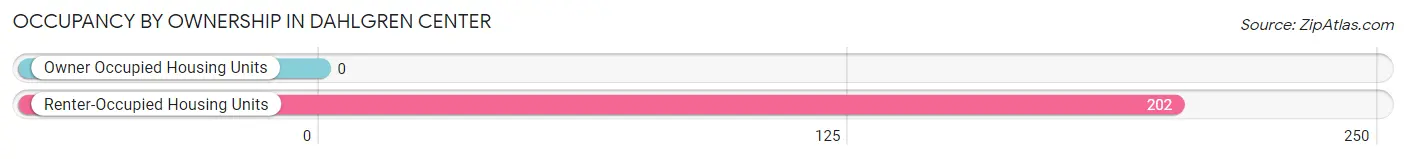
| Occupancy | # Housing Units | % Housing Units |
| Owner Occupied Housing Units | 0 | 0.0% |
| Renter-Occupied Housing Units | 202 | 100.0% |
| Total Occupied Housing Units | 202 | 100.0% |
Occupancy by Household Size in Dahlgren Center
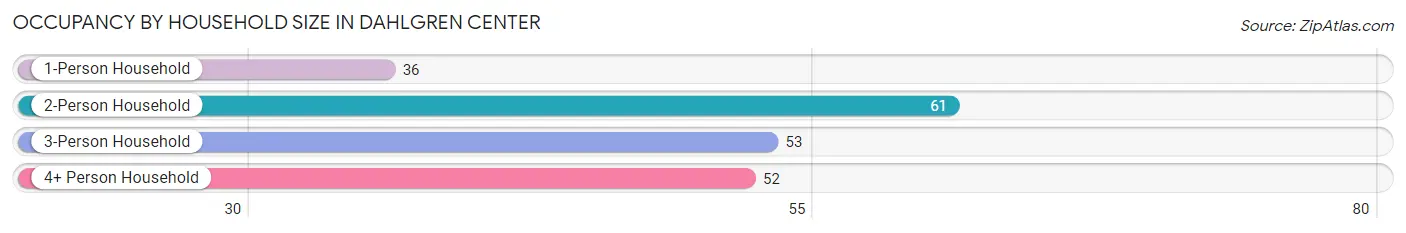
| Household Size | # Housing Units | % Housing Units |
| 1-Person Household | 36 | 17.8% |
| 2-Person Household | 61 | 30.2% |
| 3-Person Household | 53 | 26.2% |
| 4+ Person Household | 52 | 25.7% |
| Total Housing Units | 202 | 100.0% |
Occupancy by Ownership by Household Size in Dahlgren Center
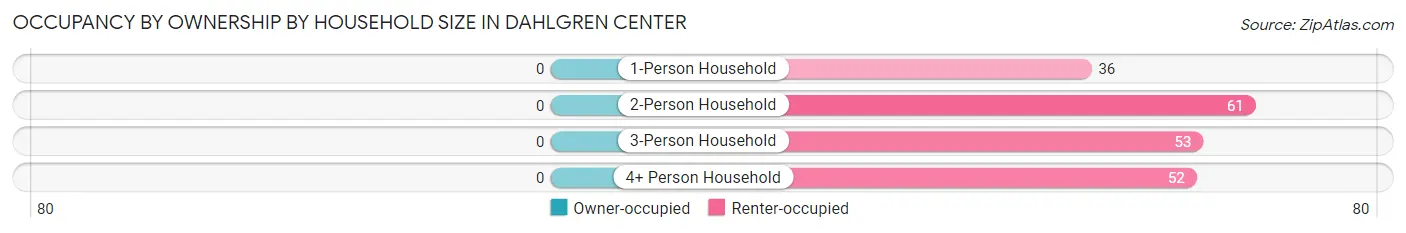
| Household Size | Owner-occupied | Renter-occupied |
| 1-Person Household | 0 (0.0%) | 36 (100.0%) |
| 2-Person Household | 0 (0.0%) | 61 (100.0%) |
| 3-Person Household | 0 (0.0%) | 53 (100.0%) |
| 4+ Person Household | 0 (0.0%) | 52 (100.0%) |
| Total Housing Units | 0 (0.0%) | 202 (100.0%) |
Occupancy by Educational Attainment in Dahlgren Center
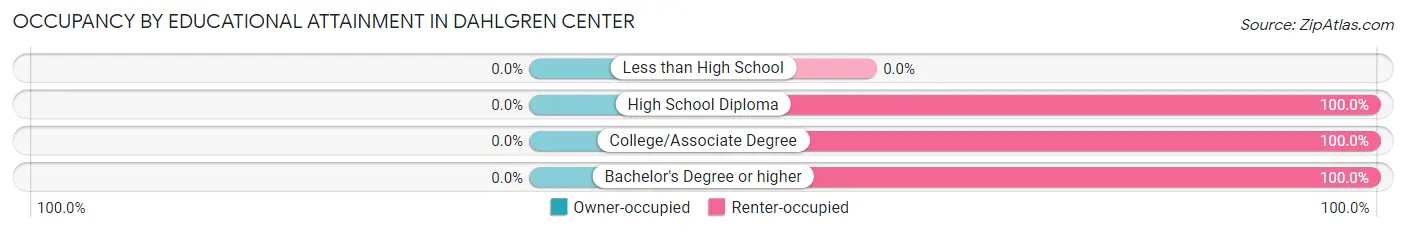
| Household Size | Owner-occupied | Renter-occupied |
| Less than High School | 0 (0.0%) | 0 (0.0%) |
| High School Diploma | 0 (0.0%) | 32 (100.0%) |
| College/Associate Degree | 0 (0.0%) | 82 (100.0%) |
| Bachelor's Degree or higher | 0 (0.0%) | 88 (100.0%) |
Occupancy by Age of Householder in Dahlgren Center
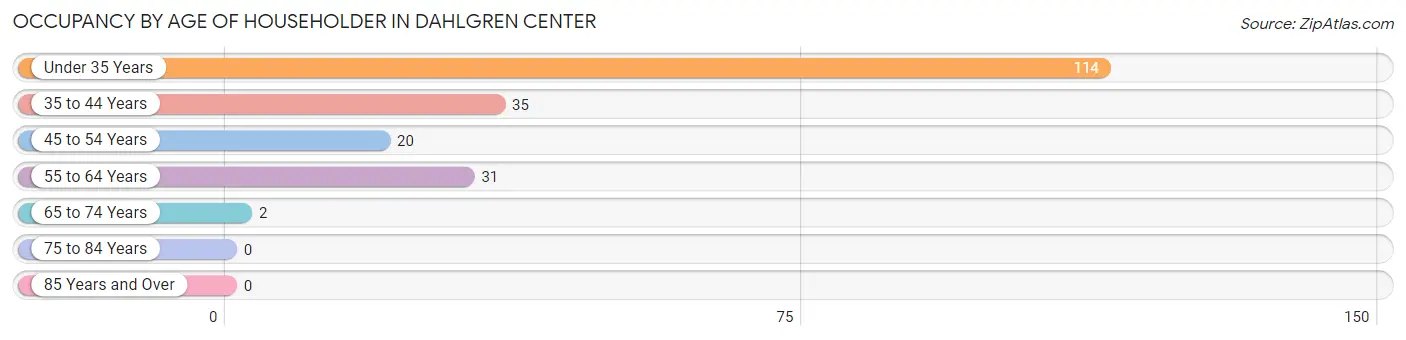
| Age Bracket | # Households | % Households |
| Under 35 Years | 114 | 56.4% |
| 35 to 44 Years | 35 | 17.3% |
| 45 to 54 Years | 20 | 9.9% |
| 55 to 64 Years | 31 | 15.3% |
| 65 to 74 Years | 2 | 1.0% |
| 75 to 84 Years | 0 | 0.0% |
| 85 Years and Over | 0 | 0.0% |
| Total | 202 | 100.0% |
Housing Finances in Dahlgren Center
Median Income by Occupancy in Dahlgren Center
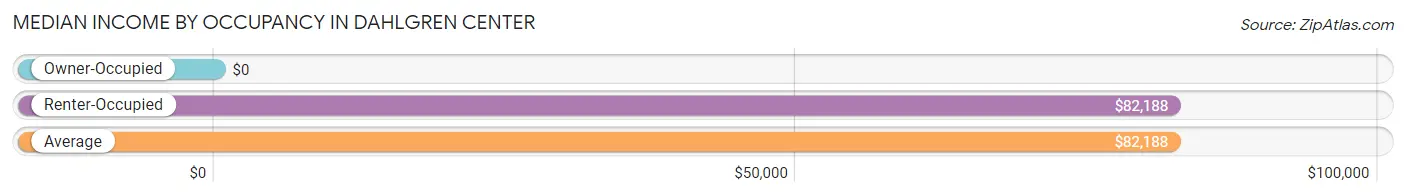
| Occupancy Type | # Households | Median Income |
| Owner-Occupied | 0 (0.0%) | $0 |
| Renter-Occupied | 202 (100.0%) | $82,188 |
| Average | 202 (100.0%) | $82,188 |
Occupancy by Householder Income Bracket in Dahlgren Center
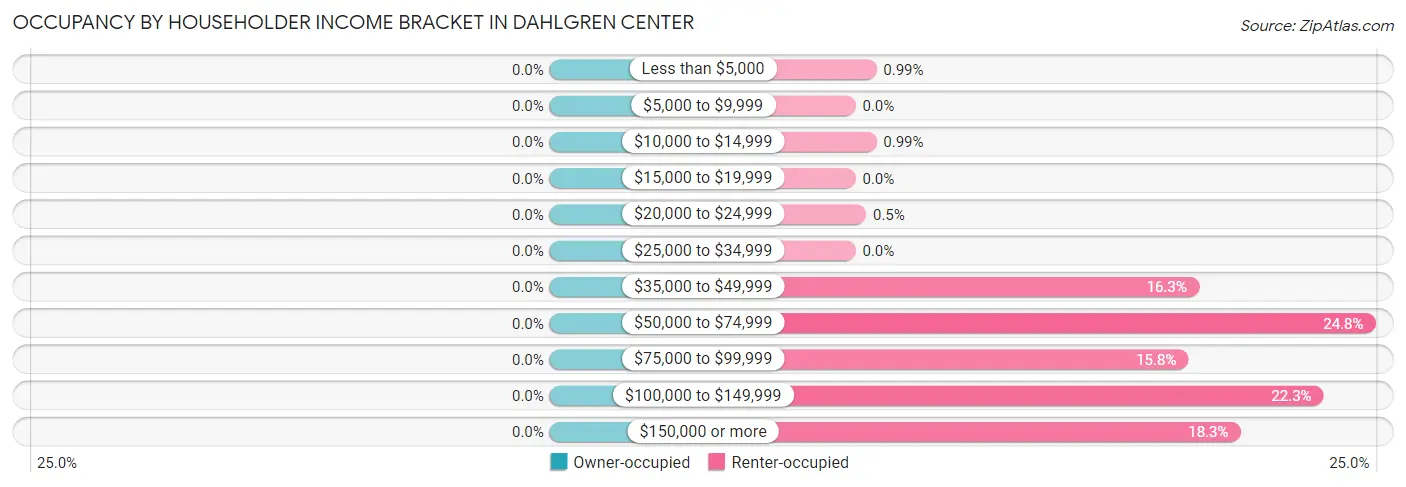
| Income Bracket | Owner-occupied | Renter-occupied |
| Less than $5,000 | 0 (0.0%) | 2 (1.0%) |
| $5,000 to $9,999 | 0 (0.0%) | 0 (0.0%) |
| $10,000 to $14,999 | 0 (0.0%) | 2 (1.0%) |
| $15,000 to $19,999 | 0 (0.0%) | 0 (0.0%) |
| $20,000 to $24,999 | 0 (0.0%) | 1 (0.5%) |
| $25,000 to $34,999 | 0 (0.0%) | 0 (0.0%) |
| $35,000 to $49,999 | 0 (0.0%) | 33 (16.3%) |
| $50,000 to $74,999 | 0 (0.0%) | 50 (24.7%) |
| $75,000 to $99,999 | 0 (0.0%) | 32 (15.8%) |
| $100,000 to $149,999 | 0 (0.0%) | 45 (22.3%) |
| $150,000 or more | 0 (0.0%) | 37 (18.3%) |
| Total | 0 (0.0%) | 202 (100.0%) |
Monthly Housing Cost Tiers in Dahlgren Center
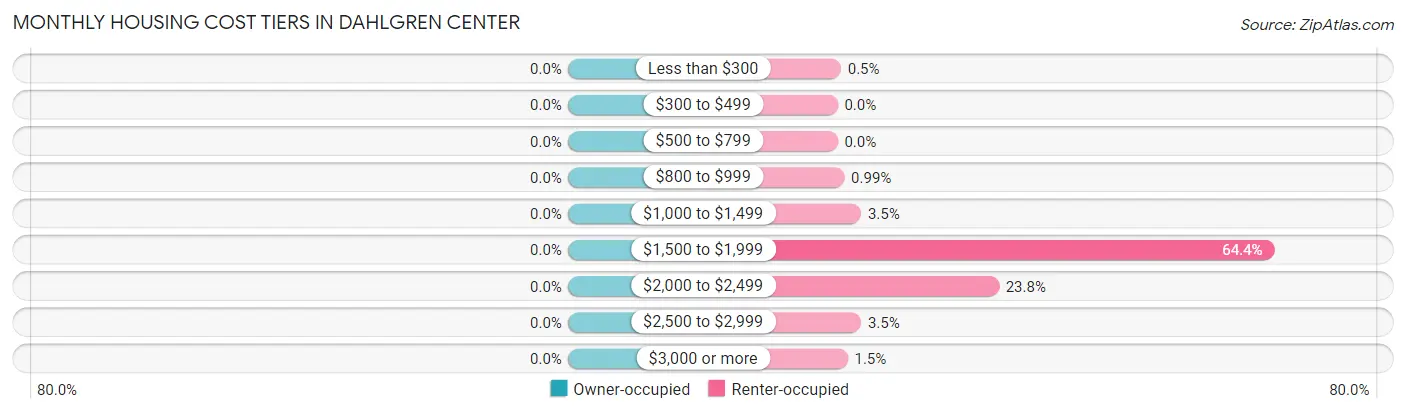
| Monthly Cost | Owner-occupied | Renter-occupied |
| Less than $300 | 0 (0.0%) | 1 (0.5%) |
| $300 to $499 | 0 (0.0%) | 0 (0.0%) |
| $500 to $799 | 0 (0.0%) | 0 (0.0%) |
| $800 to $999 | 0 (0.0%) | 2 (1.0%) |
| $1,000 to $1,499 | 0 (0.0%) | 7 (3.5%) |
| $1,500 to $1,999 | 0 (0.0%) | 130 (64.4%) |
| $2,000 to $2,499 | 0 (0.0%) | 48 (23.8%) |
| $2,500 to $2,999 | 0 (0.0%) | 7 (3.5%) |
| $3,000 or more | 0 (0.0%) | 3 (1.5%) |
| Total | 0 (0.0%) | 202 (100.0%) |
Physical Housing Characteristics in Dahlgren Center
Housing Structures in Dahlgren Center
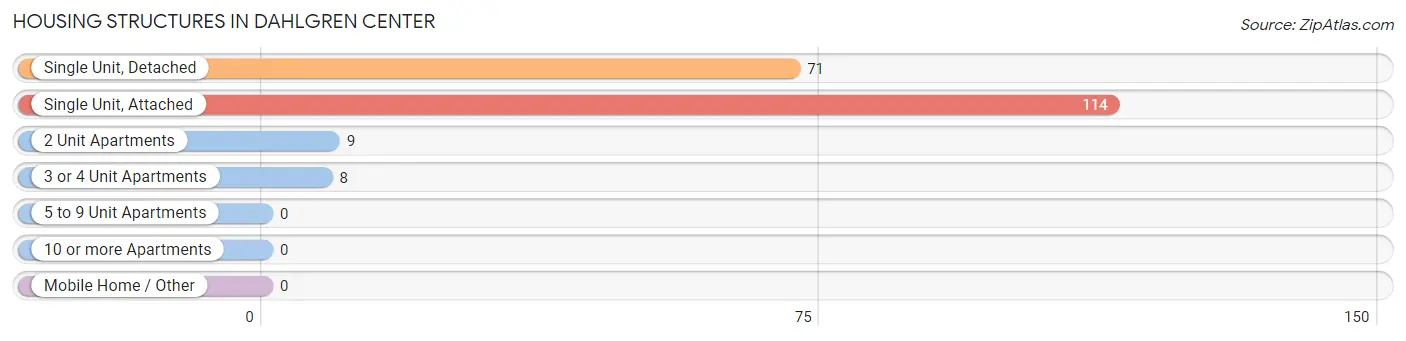
| Structure Type | # Housing Units | % Housing Units |
| Single Unit, Detached | 71 | 35.1% |
| Single Unit, Attached | 114 | 56.4% |
| 2 Unit Apartments | 9 | 4.5% |
| 3 or 4 Unit Apartments | 8 | 4.0% |
| 5 to 9 Unit Apartments | 0 | 0.0% |
| 10 or more Apartments | 0 | 0.0% |
| Mobile Home / Other | 0 | 0.0% |
| Total | 202 | 100.0% |
Housing Structures by Occupancy in Dahlgren Center
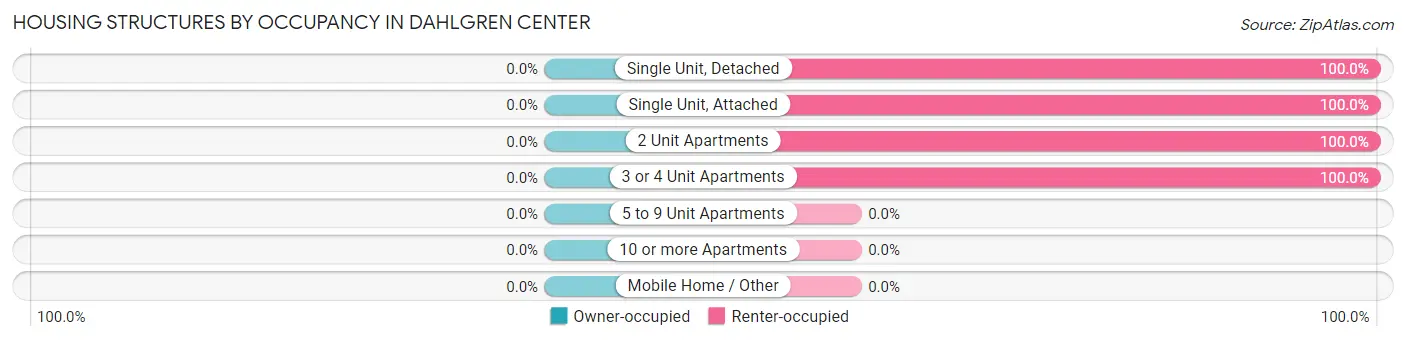
| Structure Type | Owner-occupied | Renter-occupied |
| Single Unit, Detached | 0 (0.0%) | 71 (100.0%) |
| Single Unit, Attached | 0 (0.0%) | 114 (100.0%) |
| 2 Unit Apartments | 0 (0.0%) | 9 (100.0%) |
| 3 or 4 Unit Apartments | 0 (0.0%) | 8 (100.0%) |
| 5 to 9 Unit Apartments | 0 (0.0%) | 0 (0.0%) |
| 10 or more Apartments | 0 (0.0%) | 0 (0.0%) |
| Mobile Home / Other | 0 (0.0%) | 0 (0.0%) |
| Total | 0 (0.0%) | 202 (100.0%) |
Housing Structures by Number of Rooms in Dahlgren Center
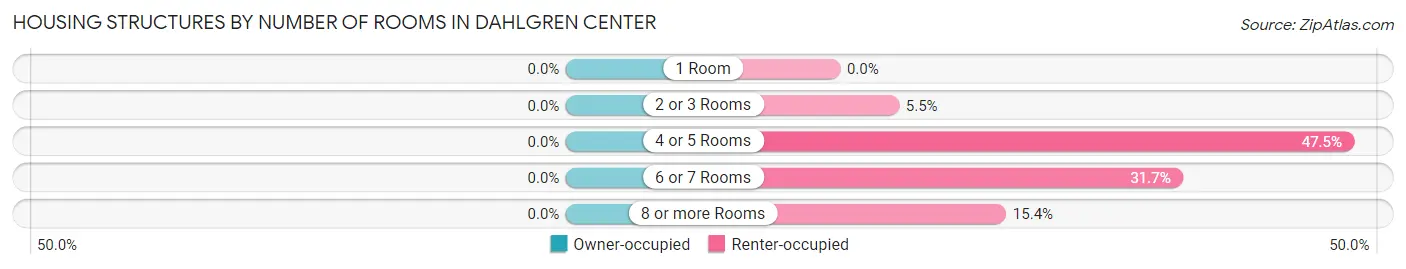
| Number of Rooms | Owner-occupied | Renter-occupied |
| 1 Room | 0 (0.0%) | 0 (0.0%) |
| 2 or 3 Rooms | 0 (0.0%) | 11 (5.4%) |
| 4 or 5 Rooms | 0 (0.0%) | 96 (47.5%) |
| 6 or 7 Rooms | 0 (0.0%) | 64 (31.7%) |
| 8 or more Rooms | 0 (0.0%) | 31 (15.3%) |
| Total | 0 (0.0%) | 202 (100.0%) |
Housing Structure by Heating Type in Dahlgren Center
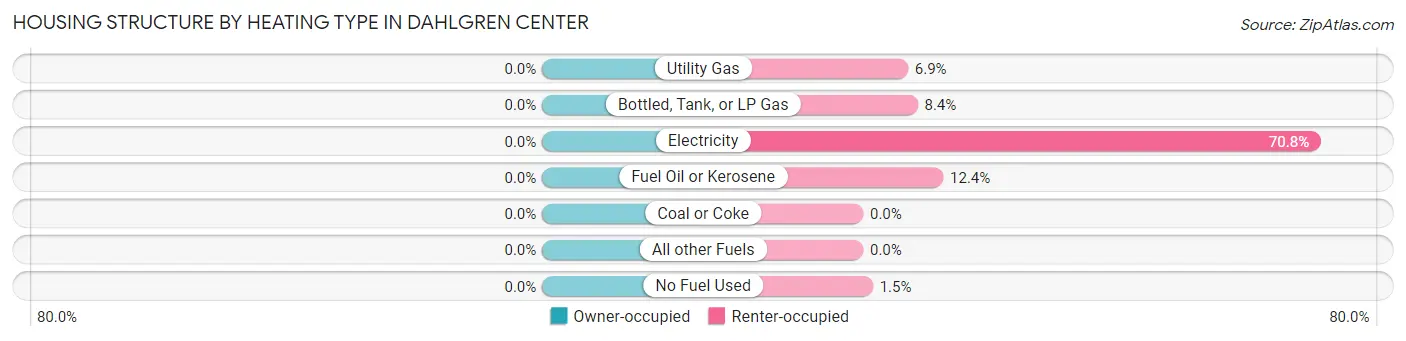
| Heating Type | Owner-occupied | Renter-occupied |
| Utility Gas | 0 (0.0%) | 14 (6.9%) |
| Bottled, Tank, or LP Gas | 0 (0.0%) | 17 (8.4%) |
| Electricity | 0 (0.0%) | 143 (70.8%) |
| Fuel Oil or Kerosene | 0 (0.0%) | 25 (12.4%) |
| Coal or Coke | 0 (0.0%) | 0 (0.0%) |
| All other Fuels | 0 (0.0%) | 0 (0.0%) |
| No Fuel Used | 0 (0.0%) | 3 (1.5%) |
| Total | 0 (0.0%) | 202 (100.0%) |
Household Vehicle Usage in Dahlgren Center
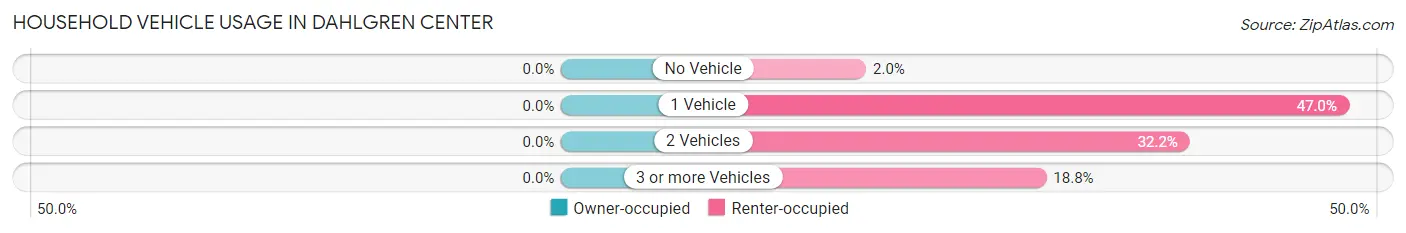
| Vehicles per Household | Owner-occupied | Renter-occupied |
| No Vehicle | 0 (0.0%) | 4 (2.0%) |
| 1 Vehicle | 0 (0.0%) | 95 (47.0%) |
| 2 Vehicles | 0 (0.0%) | 65 (32.2%) |
| 3 or more Vehicles | 0 (0.0%) | 38 (18.8%) |
| Total | 0 (0.0%) | 202 (100.0%) |
Real Estate & Mortgages in Dahlgren Center
Real Estate and Mortgage Overview in Dahlgren Center
| Characteristic | Without Mortgage | With Mortgage |
| Housing Units | 0 | 0 |
| Median Property Value | - | - |
| Median Household Income | - | - |
| Monthly Housing Costs | - | - |
| Real Estate Taxes | - | - |
Property Value by Mortgage Status in Dahlgren Center
| Property Value | Without Mortgage | With Mortgage |
| Less than $50,000 | 0 (0.0%) | 0 (0.0%) |
| $50,000 to $99,999 | 0 (0.0%) | 0 (0.0%) |
| $100,000 to $299,999 | 0 (0.0%) | 0 (0.0%) |
| $300,000 to $499,999 | 0 (0.0%) | 0 (0.0%) |
| $500,000 to $749,999 | 0 (0.0%) | 0 (0.0%) |
| $750,000 to $999,999 | 0 (0.0%) | 0 (0.0%) |
| $1,000,000 or more | 0 (0.0%) | 0 (0.0%) |
| Total | 0 (0.0%) | 0 (0.0%) |
Household Income by Mortgage Status in Dahlgren Center
| Household Income | Without Mortgage | With Mortgage |
| Less than $10,000 | 0 (0.0%) | 0 (0.0%) |
| $10,000 to $24,999 | 0 (0.0%) | 0 (0.0%) |
| $25,000 to $34,999 | 0 (0.0%) | 0 (0.0%) |
| $35,000 to $49,999 | 0 (0.0%) | 0 (0.0%) |
| $50,000 to $74,999 | 0 (0.0%) | 0 (0.0%) |
| $75,000 to $99,999 | 0 (0.0%) | 0 (0.0%) |
| $100,000 to $149,999 | 0 (0.0%) | 0 (0.0%) |
| $150,000 or more | 0 (0.0%) | 0 (0.0%) |
| Total | 0 (0.0%) | 0 (0.0%) |
Property Value to Household Income Ratio in Dahlgren Center
| Value-to-Income Ratio | Without Mortgage | With Mortgage |
| Less than 2.0x | 0 (0.0%) | 0 (0.0%) |
| 2.0x to 2.9x | 0 (0.0%) | 0 (0.0%) |
| 3.0x to 3.9x | 0 (0.0%) | 0 (0.0%) |
| 4.0x or more | 0 (0.0%) | 0 (0.0%) |
| Total | 0 (0.0%) | 0 (0.0%) |
Real Estate Taxes by Mortgage Status in Dahlgren Center
| Property Taxes | Without Mortgage | With Mortgage |
| Less than $800 | 0 (0.0%) | 0 (0.0%) |
| $800 to $1,499 | 0 (0.0%) | 0 (0.0%) |
| $800 to $1,499 | 0 (0.0%) | 0 (0.0%) |
| Total | 0 (0.0%) | 0 (0.0%) |
Health & Disability in Dahlgren Center
Health Insurance Coverage by Age in Dahlgren Center
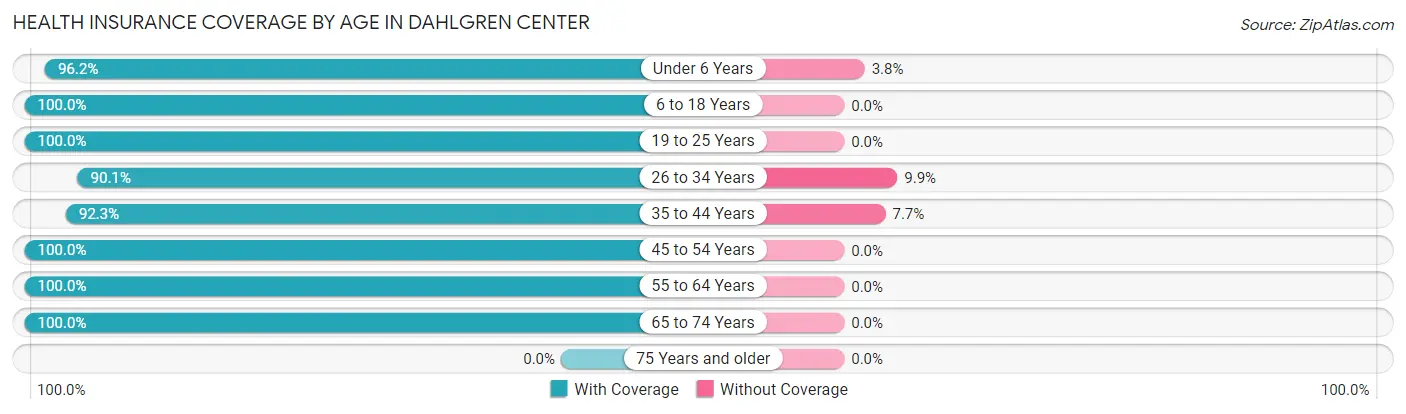
| Age Bracket | With Coverage | Without Coverage |
| Under 6 Years | 101 (96.2%) | 4 (3.8%) |
| 6 to 18 Years | 101 (100.0%) | 0 (0.0%) |
| 19 to 25 Years | 48 (100.0%) | 0 (0.0%) |
| 26 to 34 Years | 82 (90.1%) | 9 (9.9%) |
| 35 to 44 Years | 24 (92.3%) | 2 (7.7%) |
| 45 to 54 Years | 25 (100.0%) | 0 (0.0%) |
| 55 to 64 Years | 49 (100.0%) | 0 (0.0%) |
| 65 to 74 Years | 2 (100.0%) | 0 (0.0%) |
| 75 Years and older | 0 (0.0%) | 0 (0.0%) |
| Total | 432 (96.6%) | 15 (3.4%) |
Health Insurance Coverage by Citizenship Status in Dahlgren Center
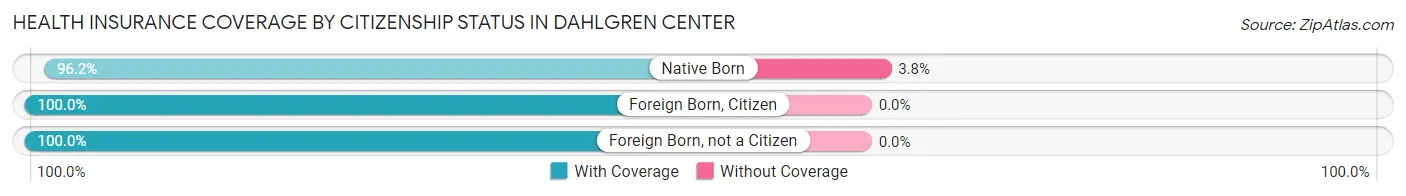
| Citizenship Status | With Coverage | Without Coverage |
| Native Born | 101 (96.2%) | 4 (3.8%) |
| Foreign Born, Citizen | 101 (100.0%) | 0 (0.0%) |
| Foreign Born, not a Citizen | 48 (100.0%) | 0 (0.0%) |
Health Insurance Coverage by Household Income in Dahlgren Center
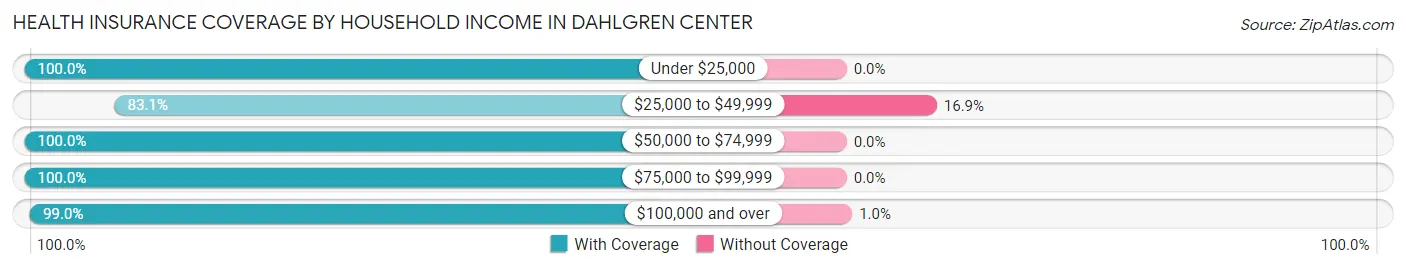
| Household Income | With Coverage | Without Coverage |
| Under $25,000 | 5 (100.0%) | 0 (0.0%) |
| $25,000 to $49,999 | 64 (83.1%) | 13 (16.9%) |
| $50,000 to $74,999 | 103 (100.0%) | 0 (0.0%) |
| $75,000 to $99,999 | 63 (100.0%) | 0 (0.0%) |
| $100,000 and over | 197 (99.0%) | 2 (1.0%) |
Public vs Private Health Insurance Coverage by Age in Dahlgren Center
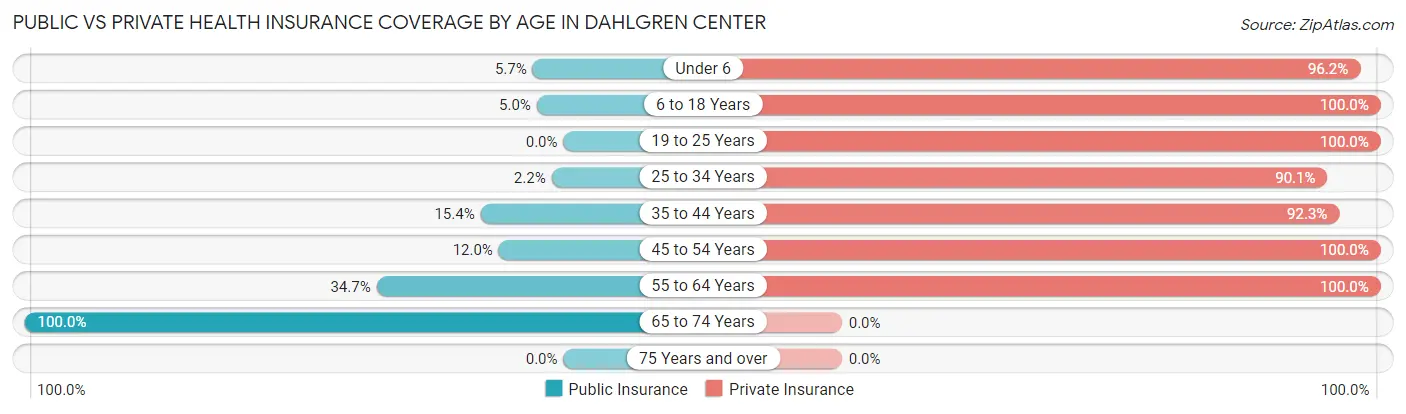
| Age Bracket | Public Insurance | Private Insurance |
| Under 6 | 6 (5.7%) | 101 (96.2%) |
| 6 to 18 Years | 5 (5.0%) | 101 (100.0%) |
| 19 to 25 Years | 0 (0.0%) | 48 (100.0%) |
| 25 to 34 Years | 2 (2.2%) | 82 (90.1%) |
| 35 to 44 Years | 4 (15.4%) | 24 (92.3%) |
| 45 to 54 Years | 3 (12.0%) | 25 (100.0%) |
| 55 to 64 Years | 17 (34.7%) | 49 (100.0%) |
| 65 to 74 Years | 2 (100.0%) | 0 (0.0%) |
| 75 Years and over | 0 (0.0%) | 0 (0.0%) |
| Total | 39 (8.7%) | 430 (96.2%) |
Disability Status by Sex by Age in Dahlgren Center
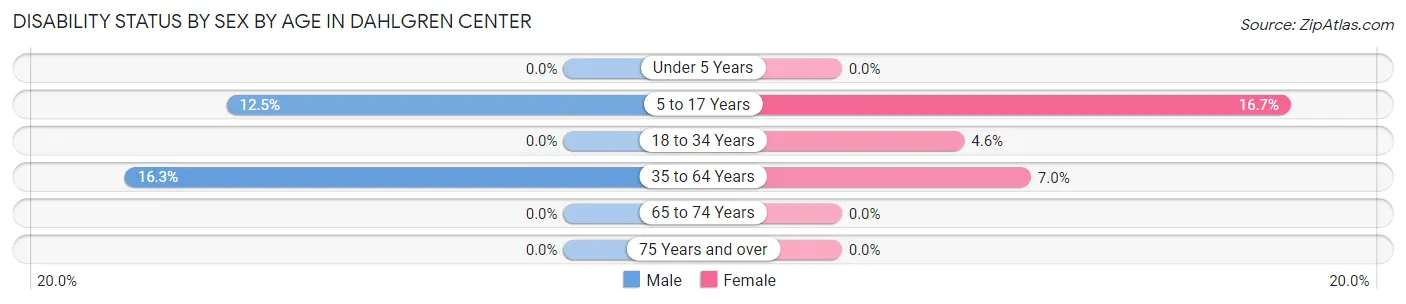
| Age Bracket | Male | Female |
| Under 5 Years | 0 (0.0%) | 0 (0.0%) |
| 5 to 17 Years | 8 (12.5%) | 6 (16.7%) |
| 18 to 34 Years | 0 (0.0%) | 5 (4.5%) |
| 35 to 64 Years | 7 (16.3%) | 4 (7.0%) |
| 65 to 74 Years | 0 (0.0%) | 0 (0.0%) |
| 75 Years and over | 0 (0.0%) | 0 (0.0%) |
Disability Class by Sex by Age in Dahlgren Center
Disability Class: Hearing Difficulty
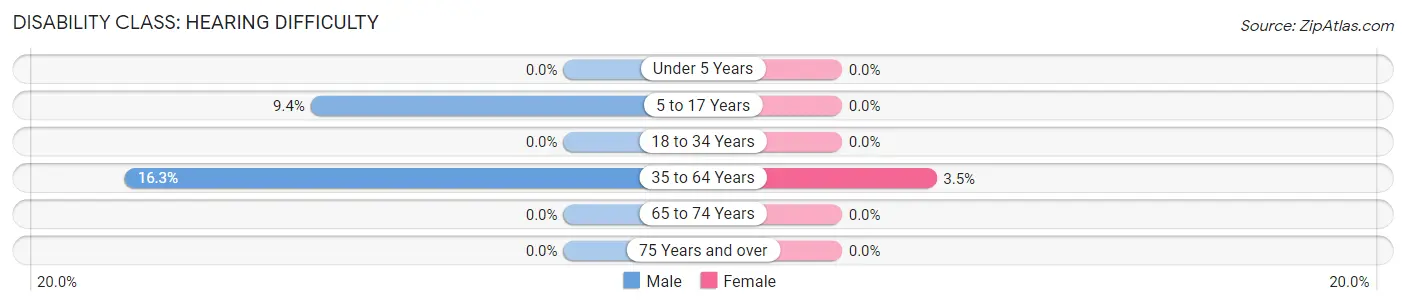
| Age Bracket | Male | Female |
| Under 5 Years | 0 (0.0%) | 0 (0.0%) |
| 5 to 17 Years | 6 (9.4%) | 0 (0.0%) |
| 18 to 34 Years | 0 (0.0%) | 0 (0.0%) |
| 35 to 64 Years | 7 (16.3%) | 2 (3.5%) |
| 65 to 74 Years | 0 (0.0%) | 0 (0.0%) |
| 75 Years and over | 0 (0.0%) | 0 (0.0%) |
Disability Class: Vision Difficulty
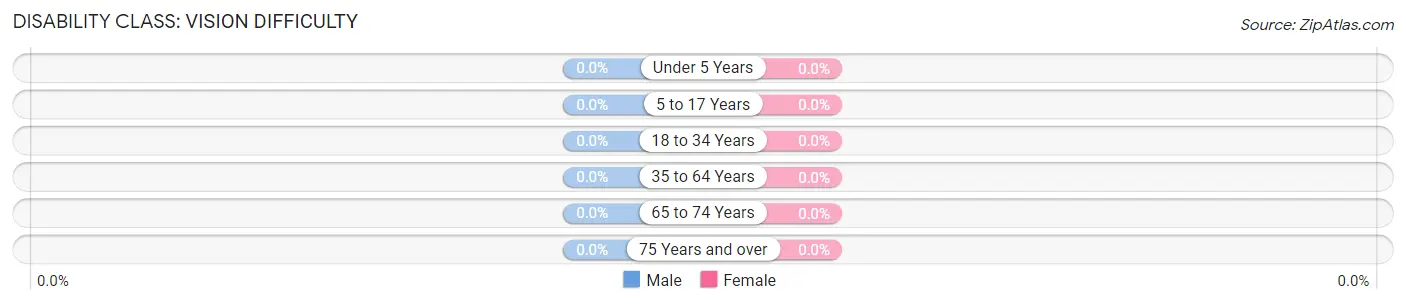
| Age Bracket | Male | Female |
| Under 5 Years | 0 (0.0%) | 0 (0.0%) |
| 5 to 17 Years | 0 (0.0%) | 0 (0.0%) |
| 18 to 34 Years | 0 (0.0%) | 0 (0.0%) |
| 35 to 64 Years | 0 (0.0%) | 0 (0.0%) |
| 65 to 74 Years | 0 (0.0%) | 0 (0.0%) |
| 75 Years and over | 0 (0.0%) | 0 (0.0%) |
Disability Class: Cognitive Difficulty
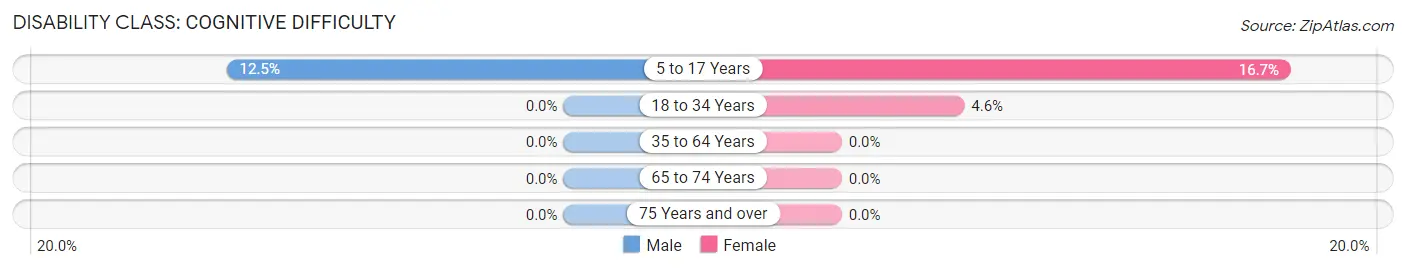
| Age Bracket | Male | Female |
| 5 to 17 Years | 8 (12.5%) | 6 (16.7%) |
| 18 to 34 Years | 0 (0.0%) | 5 (4.5%) |
| 35 to 64 Years | 0 (0.0%) | 0 (0.0%) |
| 65 to 74 Years | 0 (0.0%) | 0 (0.0%) |
| 75 Years and over | 0 (0.0%) | 0 (0.0%) |
Disability Class: Ambulatory Difficulty
| Age Bracket | Male | Female |
| 5 to 17 Years | 0 (0.0%) | 0 (0.0%) |
| 18 to 34 Years | 0 (0.0%) | 0 (0.0%) |
| 35 to 64 Years | 0 (0.0%) | 0 (0.0%) |
| 65 to 74 Years | 0 (0.0%) | 0 (0.0%) |
| 75 Years and over | 0 (0.0%) | 0 (0.0%) |
Disability Class: Self-Care Difficulty
| Age Bracket | Male | Female |
| 5 to 17 Years | 0 (0.0%) | 0 (0.0%) |
| 18 to 34 Years | 0 (0.0%) | 0 (0.0%) |
| 35 to 64 Years | 0 (0.0%) | 0 (0.0%) |
| 65 to 74 Years | 0 (0.0%) | 0 (0.0%) |
| 75 Years and over | 0 (0.0%) | 0 (0.0%) |
Technology Access in Dahlgren Center
Computing Device Access in Dahlgren Center
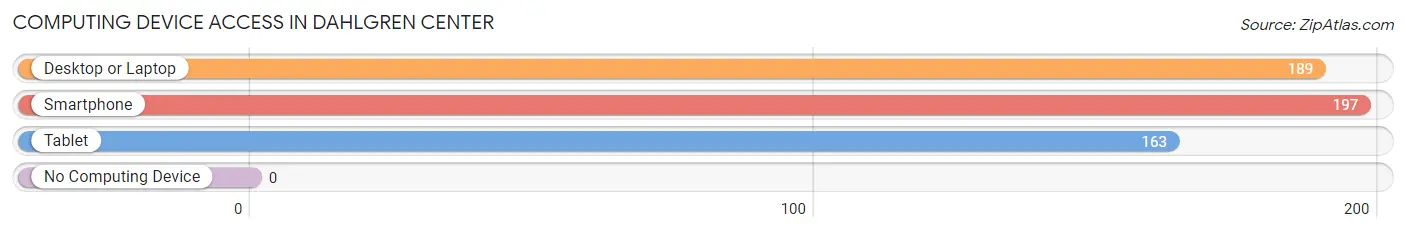
| Device Type | # Households | % Households |
| Desktop or Laptop | 189 | 93.6% |
| Smartphone | 197 | 97.5% |
| Tablet | 163 | 80.7% |
| No Computing Device | 0 | 0.0% |
| Total | 202 | 100.0% |
Internet Access in Dahlgren Center
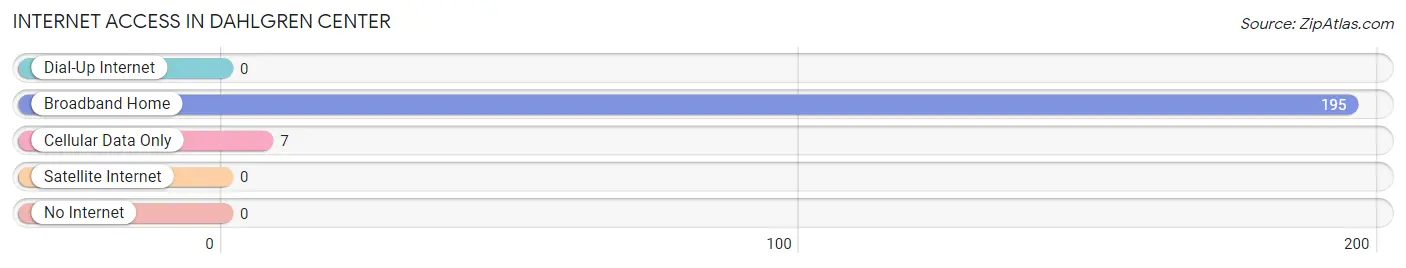
| Internet Type | # Households | % Households |
| Dial-Up Internet | 0 | 0.0% |
| Broadband Home | 195 | 96.5% |
| Cellular Data Only | 7 | 3.5% |
| Satellite Internet | 0 | 0.0% |
| No Internet | 0 | 0.0% |
| Total | 202 | 100.0% |
Dahlgren Center Summary
Dahlgren Center is a census-designated place (CDP) located in King George County, Virginia. It is situated on the Potomac River, approximately 50 miles south of Washington, D.C. The population of Dahlgren Center was 1,845 at the 2010 census.
History
The area that is now Dahlgren Center was first settled in the early 1700s by the Dahlgren family, who were Swedish immigrants. The family established a trading post and ferry service on the Potomac River, which became a popular stop for travelers. The area was known as “Dahlgren’s Landing” until the early 1900s, when it was renamed “Dahlgren Center.”
In the late 1800s, the area began to develop as a resort destination. The Dahlgren Hotel was built in 1891 and was a popular destination for visitors from Washington, D.C. and other nearby cities. The hotel was destroyed by fire in the early 1900s, but the area continued to attract visitors.
In the early 1900s, the U.S. Navy established a base in Dahlgren Center. The base was used for training and research, and it was also the site of the first successful test of a guided missile in the United States. The base was closed in the late 1990s, but the area still retains a strong military presence.
Geography
Dahlgren Center is located in King George County, Virginia. It is situated on the Potomac River, approximately 50 miles south of Washington, D.C. The area is mostly flat, with some rolling hills. The climate is humid subtropical, with hot, humid summers and mild winters.
Economy
The economy of Dahlgren Center is largely based on the military presence in the area. The U.S. Navy base provides jobs for many local residents, and the area is also home to several defense contractors. In addition, the area is home to several small businesses, including restaurants, retail stores, and other services.
Demographics
As of the 2010 census, the population of Dahlgren Center was 1,845. The racial makeup of the area was 79.3% White, 15.2% African American, 0.7% Native American, 0.7% Asian, 0.1% Pacific Islander, and 3.9% from other races. The median household income was $50,938, and the median family income was $60,938. The per capita income was $25,938.
Conclusion
Dahlgren Center is a census-designated place located in King George County, Virginia. It is situated on the Potomac River, approximately 50 miles south of Washington, D.C. The area was first settled in the early 1700s by the Dahlgren family, and it has since developed into a popular resort destination and military base. The economy of Dahlgren Center is largely based on the military presence in the area, and the population of the area was 1,845 at the 2010 census.
Common Questions
What is Per Capita Income in Dahlgren Center?
Per Capita income in Dahlgren Center is $32,767.
What is the Median Family Income in Dahlgren Center?
Median Family Income in Dahlgren Center is $81,875.
What is the Median Household income in Dahlgren Center?
Median Household Income in Dahlgren Center is $82,188.
What is Income or Wage Gap in Dahlgren Center?
Income or Wage Gap in Dahlgren Center is 49.2%.
Women in Dahlgren Center earn 50.8 cents for every dollar earned by a man.
What is Inequality or Gini Index in Dahlgren Center?
Inequality or Gini Index in Dahlgren Center is 0.32.
What is the Total Population of Dahlgren Center?
Total Population of Dahlgren Center is 723.
What is the Total Male Population of Dahlgren Center?
Total Male Population of Dahlgren Center is 420.
What is the Total Female Population of Dahlgren Center?
Total Female Population of Dahlgren Center is 303.
What is the Ratio of Males per 100 Females in Dahlgren Center?
There are 138.61 Males per 100 Females in Dahlgren Center.
What is the Ratio of Females per 100 Males in Dahlgren Center?
There are 72.14 Females per 100 Males in Dahlgren Center.
What is the Median Population Age in Dahlgren Center?
Median Population Age in Dahlgren Center is 24.1 Years.
What is the Average Family Size in Dahlgren Center
Average Family Size in Dahlgren Center is 3.4 People.
What is the Average Household Size in Dahlgren Center
Average Household Size in Dahlgren Center is 2.9 People.
How Large is the Labor Force in Dahlgren Center?
There are 415 People in the Labor Forcein in Dahlgren Center.
What is the Percentage of People in the Labor Force in Dahlgren Center?
78.3% of People are in the Labor Force in Dahlgren Center.
What is the Unemployment Rate in Dahlgren Center?
Unemployment Rate in Dahlgren Center is 5.2%.