South Hill, VA Map & Demographics
South Hill Map
South Hill Overview
$39,665
PER CAPITA INCOME
$94,112
AVG FAMILY INCOME
$56,250
AVG HOUSEHOLD INCOME
61.2%
WAGE / INCOME GAP [ % ]
38.8¢/ $1
WAGE / INCOME GAP [ $ ]
0.53
INEQUALITY / GINI INDEX
4,683
TOTAL POPULATION
2,527
MALE POPULATION
2,156
FEMALE POPULATION
117.21
MALES / 100 FEMALES
85.32
FEMALES / 100 MALES
39.6
MEDIAN AGE
3.0
AVG FAMILY SIZE
2.1
AVG HOUSEHOLD SIZE
2,278
LABOR FORCE [ PEOPLE ]
57.8%
PERCENT IN LABOR FORCE
4.5%
UNEMPLOYMENT RATE
South Hill Zip Codes
South Hill Area Codes
Income in South Hill
Income Overview in South Hill
Per Capita Income in South Hill is $39,665, while median incomes of families and households are $94,112 and $56,250 respectively.
| Characteristic | Number | Measure |
| Per Capita Income | 4,683 | $39,665 |
| Median Family Income | 945 | $94,112 |
| Mean Family Income | 945 | $94,124 |
| Median Household Income | 2,211 | $56,250 |
| Mean Household Income | 2,211 | $82,067 |
| Income Deficit | 945 | $0 |
| Wage / Income Gap (%) | 4,683 | 61.15% |
| Wage / Income Gap ($) | 4,683 | 38.85¢ per $1 |
| Gini / Inequality Index | 4,683 | 0.53 |
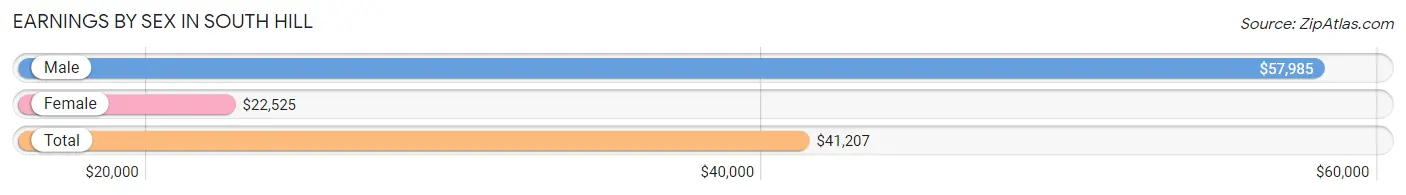
Earnings by Sex in South Hill
Average Earnings in South Hill are $41,207, $57,985 for men and $22,525 for women, a difference of 61.2%.
| Sex | Number | Average Earnings |
| Male | 1,413 (58.1%) | $57,985 |
| Female | 1,018 (41.9%) | $22,525 |
| Total | 2,431 (100.0%) | $41,207 |
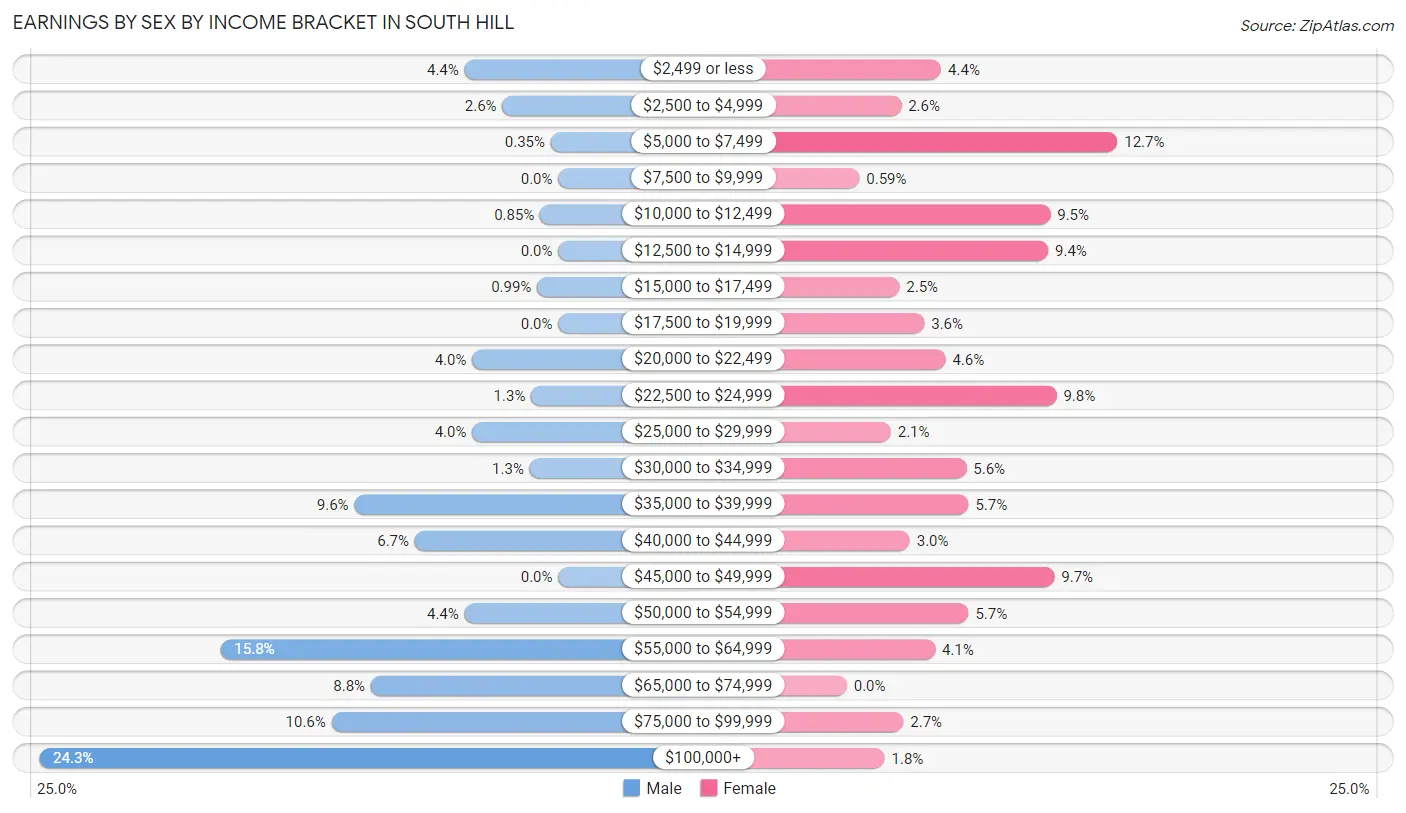
Earnings by Sex by Income Bracket in South Hill
The most common earnings brackets in South Hill are $100,000+ for men (343 | 24.3%) and $5,000 to $7,499 for women (129 | 12.7%).
| Income | Male | Female |
| $2,499 or less | 62 (4.4%) | 45 (4.4%) |
| $2,500 to $4,999 | 37 (2.6%) | 26 (2.5%) |
| $5,000 to $7,499 | 5 (0.4%) | 129 (12.7%) |
| $7,500 to $9,999 | 0 (0.0%) | 6 (0.6%) |
| $10,000 to $12,499 | 12 (0.9%) | 97 (9.5%) |
| $12,500 to $14,999 | 0 (0.0%) | 96 (9.4%) |
| $15,000 to $17,499 | 14 (1.0%) | 25 (2.5%) |
| $17,500 to $19,999 | 0 (0.0%) | 37 (3.6%) |
| $20,000 to $22,499 | 57 (4.0%) | 47 (4.6%) |
| $22,500 to $24,999 | 18 (1.3%) | 100 (9.8%) |
| $25,000 to $29,999 | 57 (4.0%) | 21 (2.1%) |
| $30,000 to $34,999 | 19 (1.3%) | 57 (5.6%) |
| $35,000 to $39,999 | 135 (9.6%) | 58 (5.7%) |
| $40,000 to $44,999 | 95 (6.7%) | 30 (2.9%) |
| $45,000 to $49,999 | 0 (0.0%) | 99 (9.7%) |
| $50,000 to $54,999 | 62 (4.4%) | 58 (5.7%) |
| $55,000 to $64,999 | 223 (15.8%) | 42 (4.1%) |
| $65,000 to $74,999 | 124 (8.8%) | 0 (0.0%) |
| $75,000 to $99,999 | 150 (10.6%) | 27 (2.6%) |
| $100,000+ | 343 (24.3%) | 18 (1.8%) |
| Total | 1,413 (100.0%) | 1,018 (100.0%) |
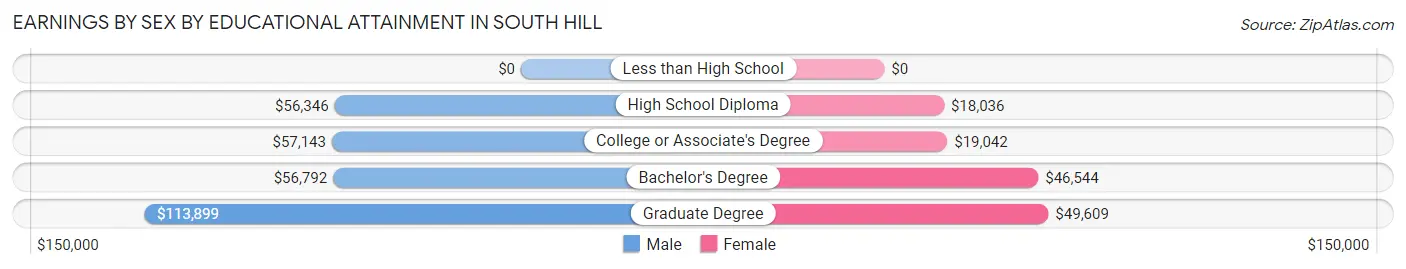
Earnings by Sex by Educational Attainment in South Hill
Average earnings in South Hill are $73,147 for men and $22,021 for women, a difference of 69.9%. Men with an educational attainment of graduate degree enjoy the highest average annual earnings of $113,899, while those with high school diploma education earn the least with $56,346. Women with an educational attainment of graduate degree earn the most with the average annual earnings of $49,609, while those with high school diploma education have the smallest earnings of $18,036.
| Educational Attainment | Male Income | Female Income |
| Less than High School | - | - |
| High School Diploma | $56,346 | $18,036 |
| College or Associate's Degree | $57,143 | $19,042 |
| Bachelor's Degree | $56,792 | $46,544 |
| Graduate Degree | $113,899 | $49,609 |
| Total | $73,147 | $22,021 |
Family Income in South Hill
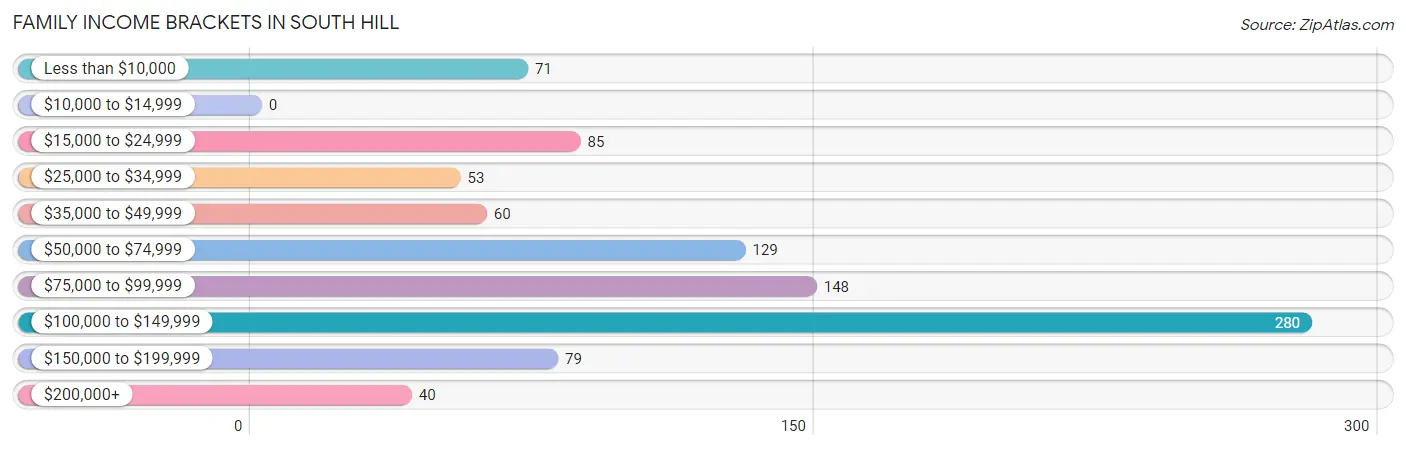
Family Income Brackets in South Hill
According to the South Hill family income data, there are 280 families falling into the $100,000 to $149,999 income range, which is the most common income bracket and makes up 29.6% of all families.
| Income Bracket | # Families | % Families |
| Less than $10,000 | 71 | 7.5% |
| $10,000 to $14,999 | 0 | 0.0% |
| $15,000 to $24,999 | 85 | 9.0% |
| $25,000 to $34,999 | 53 | 5.6% |
| $35,000 to $49,999 | 60 | 6.3% |
| $50,000 to $74,999 | 129 | 13.7% |
| $75,000 to $99,999 | 148 | 15.7% |
| $100,000 to $149,999 | 280 | 29.6% |
| $150,000 to $199,999 | 79 | 8.4% |
| $200,000+ | 40 | 4.2% |
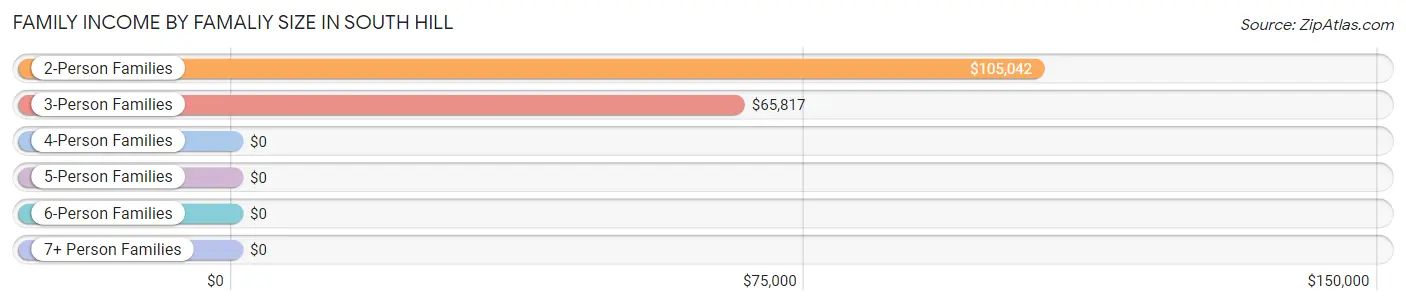
Family Income by Famaliy Size in South Hill
2-person families (387 | 40.9%) account for the highest median family income in South Hill with $105,042 per family, while 2-person families (387 | 40.9%) have the highest median income of $52,521 per family member.
| Income Bracket | # Families | Median Income |
| 2-Person Families | 387 (40.9%) | $105,042 |
| 3-Person Families | 355 (37.6%) | $65,817 |
| 4-Person Families | 171 (18.1%) | $0 |
| 5-Person Families | 16 (1.7%) | $0 |
| 6-Person Families | 16 (1.7%) | $0 |
| 7+ Person Families | 0 (0.0%) | $0 |
| Total | 945 (100.0%) | $94,112 |
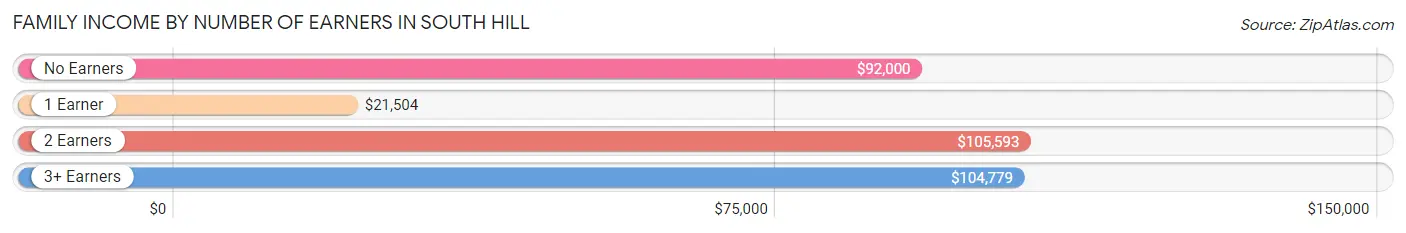
Family Income by Number of Earners in South Hill
The median family income in South Hill is $94,112, with families comprising 2 earners (537) having the highest median family income of $105,593, while families with 1 earner (235) have the lowest median family income of $21,504, accounting for 56.8% and 24.9% of families, respectively.
| Number of Earners | # Families | Median Income |
| No Earners | 80 (8.5%) | $92,000 |
| 1 Earner | 235 (24.9%) | $21,504 |
| 2 Earners | 537 (56.8%) | $105,593 |
| 3+ Earners | 93 (9.8%) | $104,779 |
| Total | 945 (100.0%) | $94,112 |
Household Income in South Hill
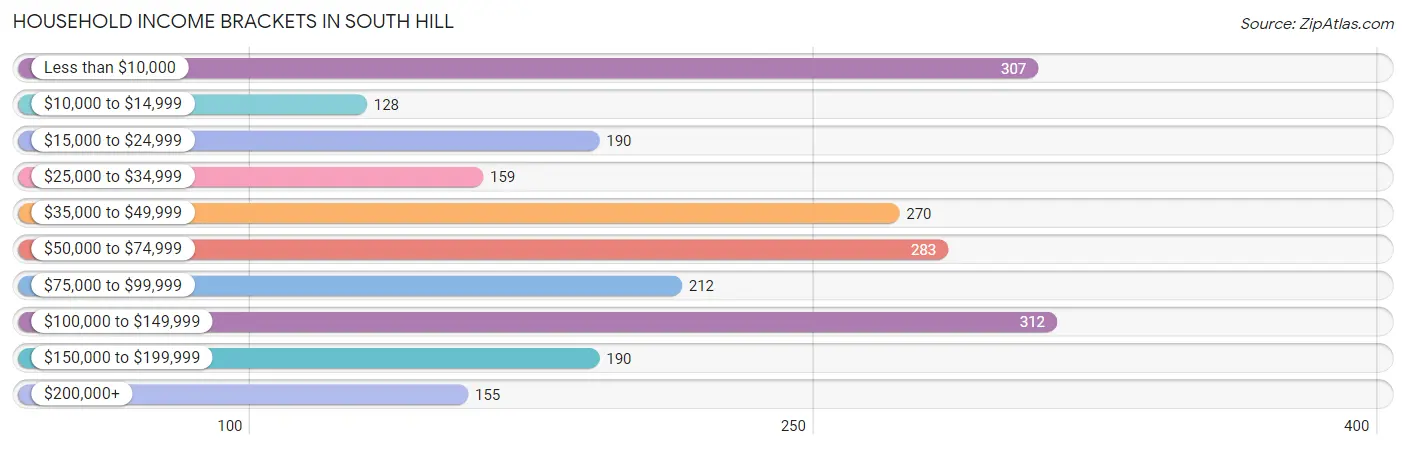
Household Income Brackets in South Hill
With 312 households falling in the category, the $100,000 to $149,999 income range is the most frequent in South Hill, accounting for 14.1% of all households. In contrast, only 128 households (5.8%) fall into the $10,000 to $14,999 income bracket, making it the least populous group.
| Income Bracket | # Households | % Households |
| Less than $10,000 | 307 | 13.9% |
| $10,000 to $14,999 | 128 | 5.8% |
| $15,000 to $24,999 | 190 | 8.6% |
| $25,000 to $34,999 | 159 | 7.2% |
| $35,000 to $49,999 | 270 | 12.2% |
| $50,000 to $74,999 | 283 | 12.8% |
| $75,000 to $99,999 | 212 | 9.6% |
| $100,000 to $149,999 | 312 | 14.1% |
| $150,000 to $199,999 | 190 | 8.6% |
| $200,000+ | 155 | 7.0% |
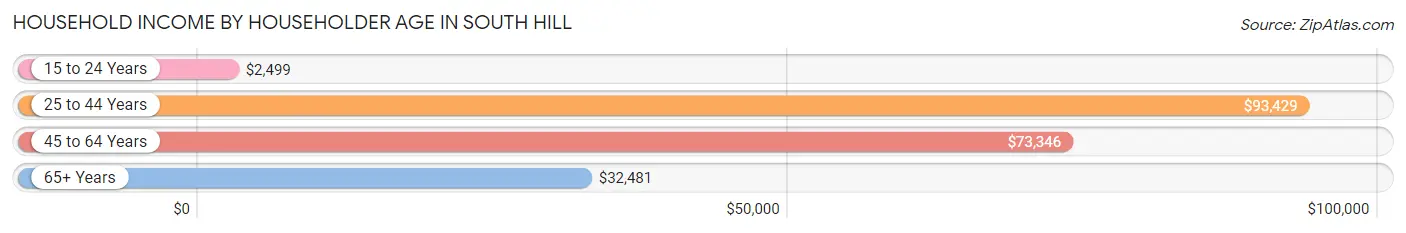
Household Income by Householder Age in South Hill
The median household income in South Hill is $56,250, with the highest median household income of $93,429 found in the 25 to 44 years age bracket for the primary householder. A total of 685 households (31.0%) fall into this category. Meanwhile, the 15 to 24 years age bracket for the primary householder has the lowest median household income of $2,499, with 140 households (6.3%) in this group.
| Income Bracket | # Households | Median Income |
| 15 to 24 Years | 140 (6.3%) | $2,499 |
| 25 to 44 Years | 685 (31.0%) | $93,429 |
| 45 to 64 Years | 575 (26.0%) | $73,346 |
| 65+ Years | 811 (36.7%) | $32,481 |
| Total | 2,211 (100.0%) | $56,250 |
Poverty in South Hill
Income Below Poverty by Sex and Age in South Hill
With 19.1% poverty level for males and 26.2% for females among the residents of South Hill, under 5 year old males and under 5 year old females are the most vulnerable to poverty, with 64 males (73.6%) and 81 females (76.4%) in their respective age groups living below the poverty level.
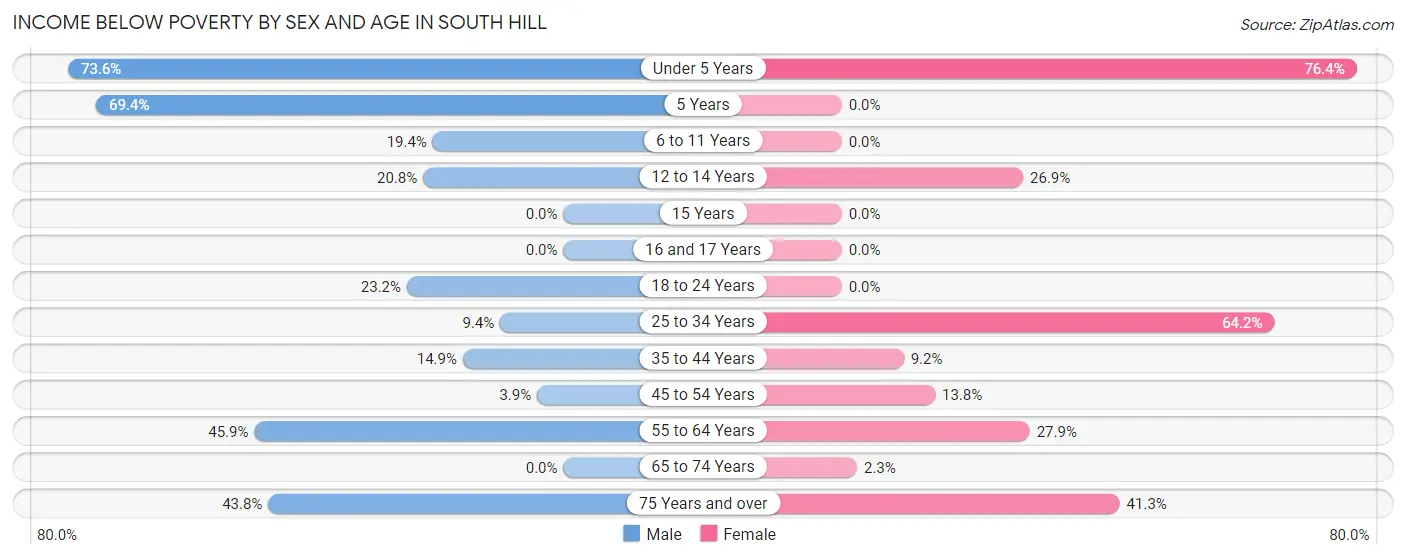
| Age Bracket | Male | Female |
| Under 5 Years | 64 (73.6%) | 81 (76.4%) |
| 5 Years | 34 (69.4%) | 0 (0.0%) |
| 6 to 11 Years | 26 (19.4%) | 0 (0.0%) |
| 12 to 14 Years | 10 (20.8%) | 35 (26.9%) |
| 15 Years | 0 (0.0%) | 0 (0.0%) |
| 16 and 17 Years | 0 (0.0%) | 0 (0.0%) |
| 18 to 24 Years | 79 (23.2%) | 0 (0.0%) |
| 25 to 34 Years | 46 (9.4%) | 122 (64.2%) |
| 35 to 44 Years | 33 (14.9%) | 25 (9.2%) |
| 45 to 54 Years | 11 (3.9%) | 22 (13.8%) |
| 55 to 64 Years | 95 (45.9%) | 72 (27.9%) |
| 65 to 74 Years | 0 (0.0%) | 7 (2.2%) |
| 75 Years and over | 71 (43.8%) | 184 (41.3%) |
| Total | 469 (19.1%) | 548 (26.2%) |
Income Above Poverty by Sex and Age in South Hill
According to the poverty statistics in South Hill, males aged 15 years and females aged 6 to 11 years are the age groups that are most secure financially, with 100.0% of males and 100.0% of females in these age groups living above the poverty line.
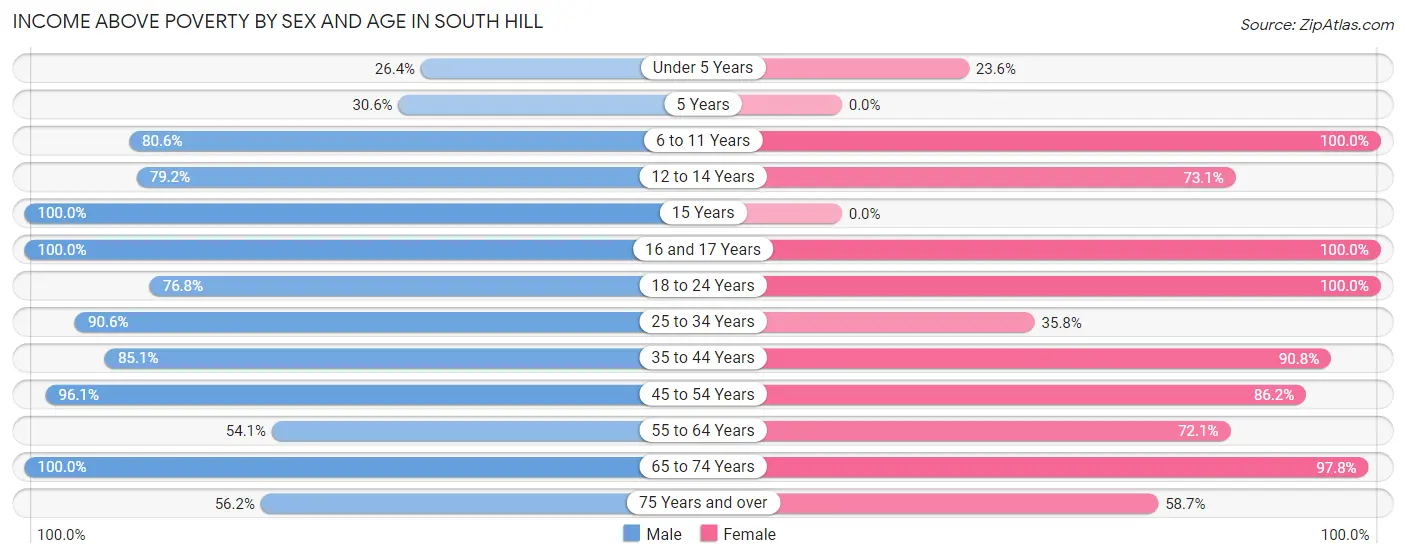
| Age Bracket | Male | Female |
| Under 5 Years | 23 (26.4%) | 25 (23.6%) |
| 5 Years | 15 (30.6%) | 0 (0.0%) |
| 6 to 11 Years | 108 (80.6%) | 59 (100.0%) |
| 12 to 14 Years | 38 (79.2%) | 95 (73.1%) |
| 15 Years | 98 (100.0%) | 0 (0.0%) |
| 16 and 17 Years | 202 (100.0%) | 18 (100.0%) |
| 18 to 24 Years | 261 (76.8%) | 140 (100.0%) |
| 25 to 34 Years | 444 (90.6%) | 68 (35.8%) |
| 35 to 44 Years | 188 (85.1%) | 247 (90.8%) |
| 45 to 54 Years | 270 (96.1%) | 137 (86.2%) |
| 55 to 64 Years | 112 (54.1%) | 186 (72.1%) |
| 65 to 74 Years | 136 (100.0%) | 304 (97.8%) |
| 75 Years and over | 91 (56.2%) | 262 (58.7%) |
| Total | 1,986 (80.9%) | 1,541 (73.8%) |
Income Below Poverty Among Married-Couple Families in South Hill
The poverty statistics for married-couple families in South Hill show that 3.6% or 17 of the total 477 families live below the poverty line. Families with 1 or 2 children have the highest poverty rate of 9.0%, comprising of 17 families. On the other hand, families with no children have the lowest poverty rate of 0.0%, which includes 0 families.
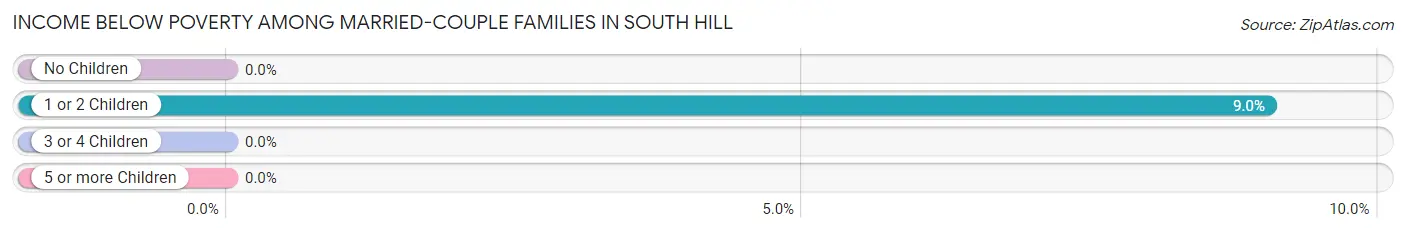
| Children | Above Poverty | Below Poverty |
| No Children | 289 (100.0%) | 0 (0.0%) |
| 1 or 2 Children | 171 (91.0%) | 17 (9.0%) |
| 3 or 4 Children | 0 (0.0%) | 0 (0.0%) |
| 5 or more Children | 0 (0.0%) | 0 (0.0%) |
| Total | 460 (96.4%) | 17 (3.6%) |
Income Below Poverty Among Single-Parent Households in South Hill
According to the poverty data in South Hill, 9.7% or 11 single-father households and 36.2% or 128 single-mother households are living below the poverty line. Among single-father households, those with 1 or 2 children have the highest poverty rate, with 11 households (52.4%) experiencing poverty. Likewise, among single-mother households, those with 1 or 2 children have the highest poverty rate, with 128 households (48.3%) falling below the poverty line.
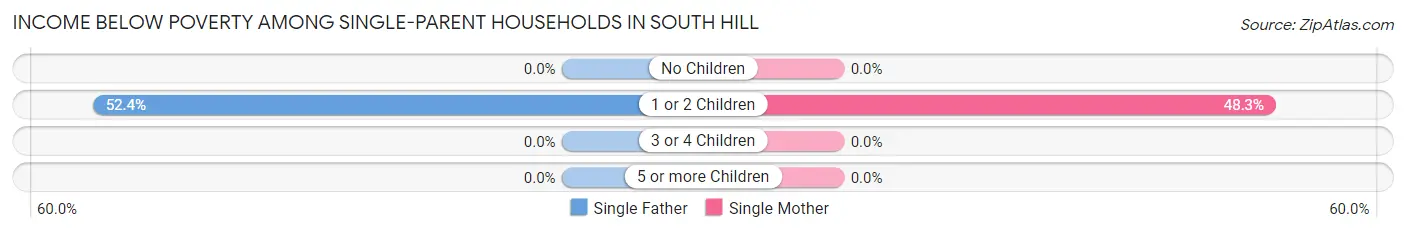
| Children | Single Father | Single Mother |
| No Children | 0 (0.0%) | 0 (0.0%) |
| 1 or 2 Children | 11 (52.4%) | 128 (48.3%) |
| 3 or 4 Children | 0 (0.0%) | 0 (0.0%) |
| 5 or more Children | 0 (0.0%) | 0 (0.0%) |
| Total | 11 (9.7%) | 128 (36.2%) |
Income Below Poverty Among Married-Couple vs Single-Parent Households in South Hill
The poverty data for South Hill shows that 17 of the married-couple family households (3.6%) and 139 of the single-parent households (29.7%) are living below the poverty level. Within the married-couple family households, those with 1 or 2 children have the highest poverty rate, with 17 households (9.0%) falling below the poverty line. Among the single-parent households, those with 1 or 2 children have the highest poverty rate, with 139 household (48.6%) living below poverty.
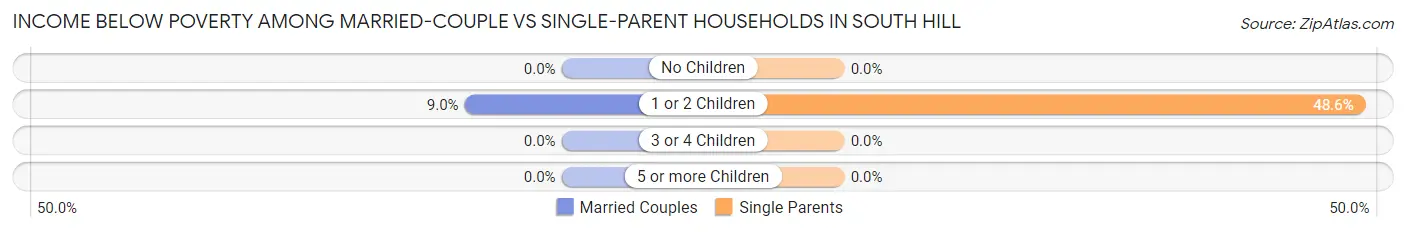
| Children | Married-Couple Families | Single-Parent Households |
| No Children | 0 (0.0%) | 0 (0.0%) |
| 1 or 2 Children | 17 (9.0%) | 139 (48.6%) |
| 3 or 4 Children | 0 (0.0%) | 0 (0.0%) |
| 5 or more Children | 0 (0.0%) | 0 (0.0%) |
| Total | 17 (3.6%) | 139 (29.7%) |
Race in South Hill
The most populous races in South Hill are Black / African American (2,228 | 47.6%), White / Caucasian (2,000 | 42.7%), and Hispanic or Latino (314 | 6.7%).
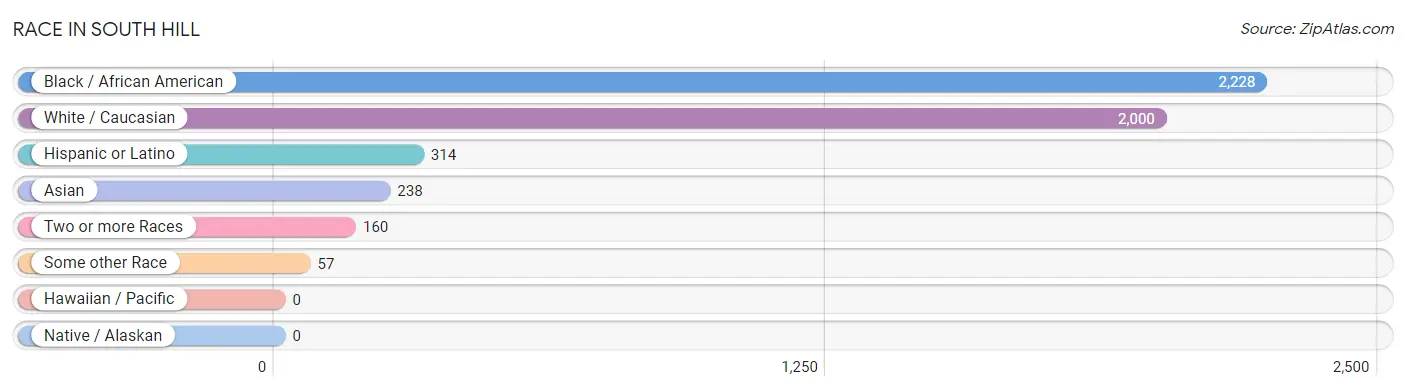
| Race | # Population | % Population |
| Asian | 238 | 5.1% |
| Black / African American | 2,228 | 47.6% |
| Hawaiian / Pacific | 0 | 0.0% |
| Hispanic or Latino | 314 | 6.7% |
| Native / Alaskan | 0 | 0.0% |
| White / Caucasian | 2,000 | 42.7% |
| Two or more Races | 160 | 3.4% |
| Some other Race | 57 | 1.2% |
| Total | 4,683 | 100.0% |
Ancestry in South Hill
The most populous ancestries reported in South Hill are American (923 | 19.7%), English (490 | 10.5%), Thai (238 | 5.1%), Central American (170 | 3.6%), and Salvadoran (170 | 3.6%), together accounting for 42.5% of all South Hill residents.
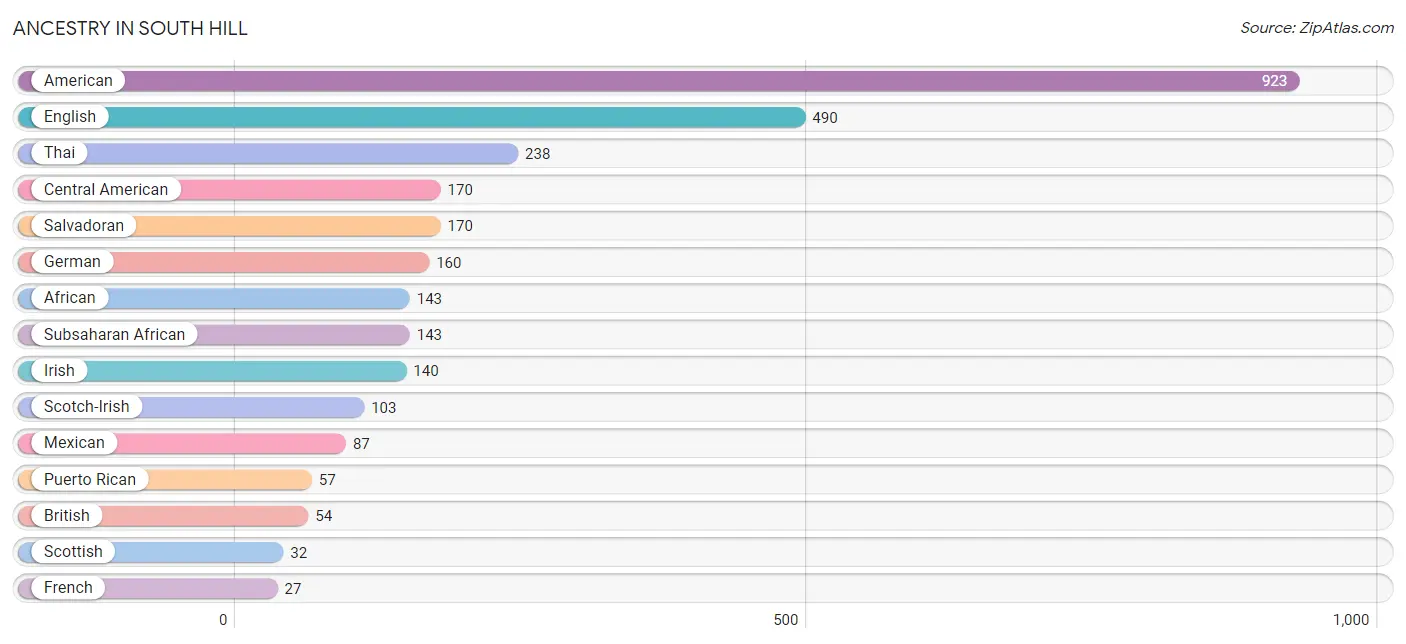
| Ancestry | # Population | % Population |
| African | 143 | 3.0% |
| American | 923 | 19.7% |
| British | 54 | 1.1% |
| Central American | 170 | 3.6% |
| Dutch | 19 | 0.4% |
| English | 490 | 10.5% |
| French | 27 | 0.6% |
| German | 160 | 3.4% |
| Irish | 140 | 3.0% |
| Mexican | 87 | 1.9% |
| Puerto Rican | 57 | 1.2% |
| Salvadoran | 170 | 3.6% |
| Scotch-Irish | 103 | 2.2% |
| Scottish | 32 | 0.7% |
| Slovak | 11 | 0.2% |
| Subsaharan African | 143 | 3.0% |
| Thai | 238 | 5.1% |
| Ukrainian | 13 | 0.3% | View All 18 Rows |
Immigrants in South Hill
The most numerous immigrant groups reported in South Hill came from Asia (238 | 5.1%), India (238 | 5.1%), South Central Asia (238 | 5.1%), Central America (170 | 3.6%), and El Salvador (170 | 3.6%), together accounting for 22.5% of all South Hill residents.
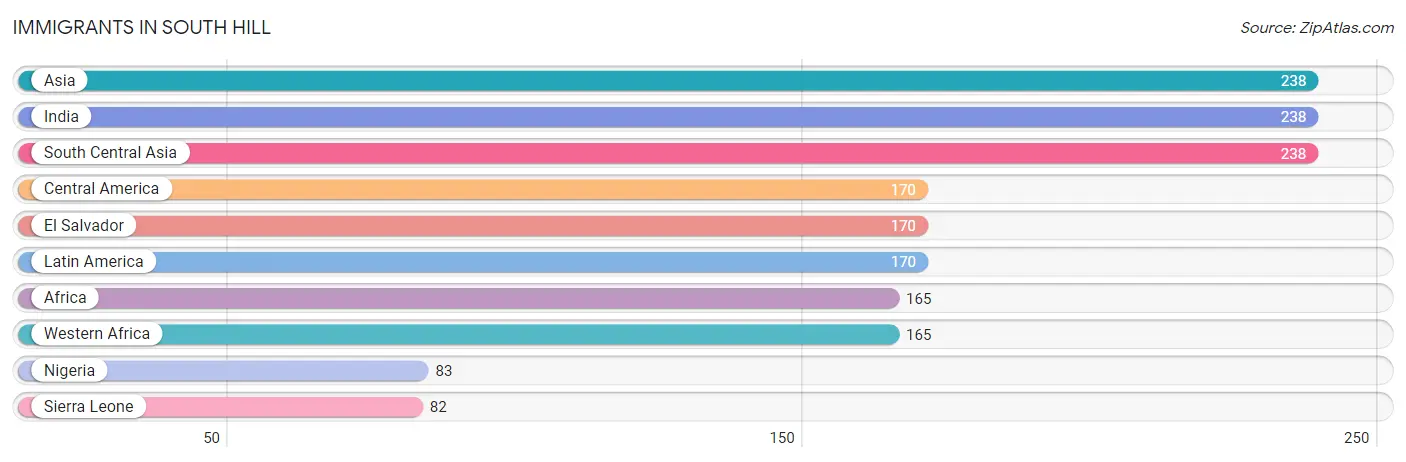
| Immigration Origin | # Population | % Population |
| Africa | 165 | 3.5% |
| Asia | 238 | 5.1% |
| Central America | 170 | 3.6% |
| El Salvador | 170 | 3.6% |
| India | 238 | 5.1% |
| Latin America | 170 | 3.6% |
| Nigeria | 83 | 1.8% |
| Sierra Leone | 82 | 1.8% |
| South Central Asia | 238 | 5.1% |
| Western Africa | 165 | 3.5% | View All 10 Rows |
Sex and Age in South Hill
Sex and Age in South Hill
The most populous age groups in South Hill are 15 to 19 Years (400 | 15.8%) for men and 85 Years and over (247 | 11.5%) for women.
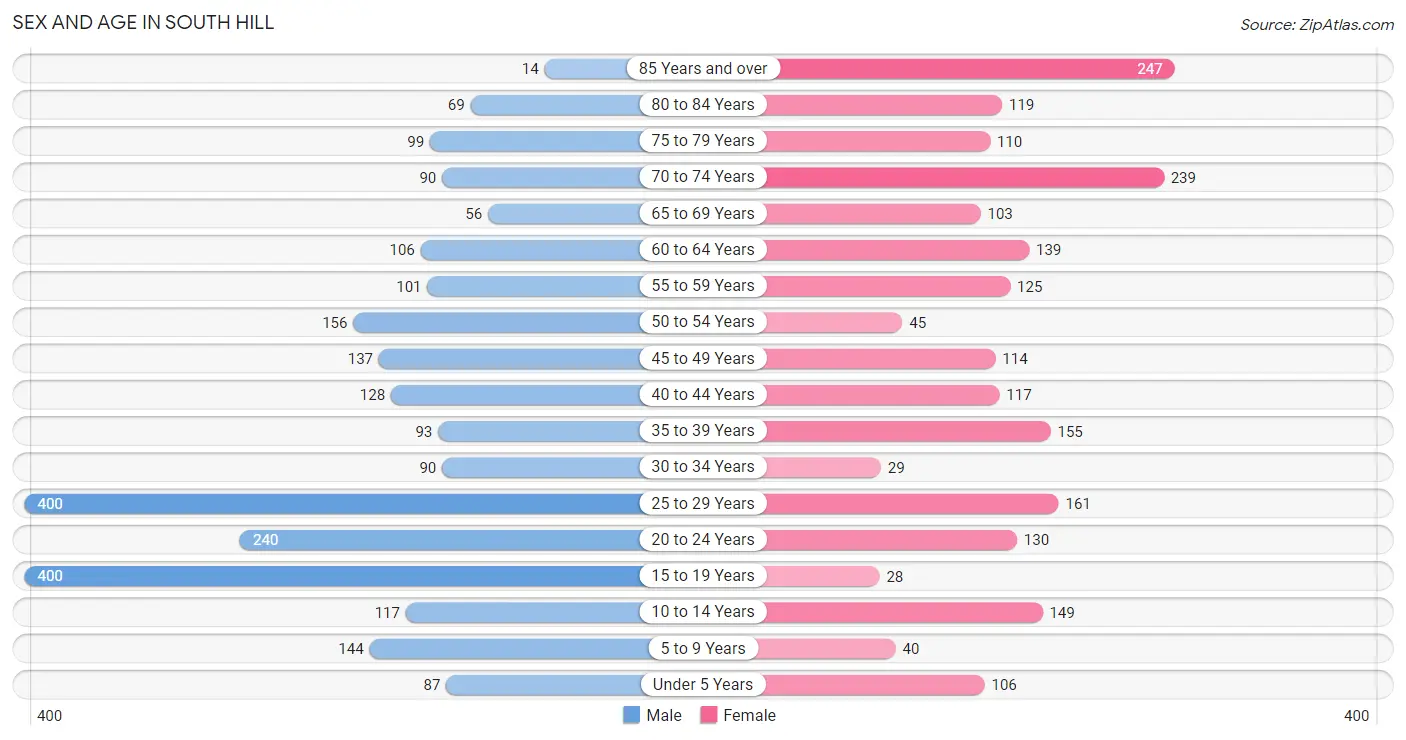
| Age Bracket | Male | Female |
| Under 5 Years | 87 (3.4%) | 106 (4.9%) |
| 5 to 9 Years | 144 (5.7%) | 40 (1.9%) |
| 10 to 14 Years | 117 (4.6%) | 149 (6.9%) |
| 15 to 19 Years | 400 (15.8%) | 28 (1.3%) |
| 20 to 24 Years | 240 (9.5%) | 130 (6.0%) |
| 25 to 29 Years | 400 (15.8%) | 161 (7.5%) |
| 30 to 34 Years | 90 (3.6%) | 29 (1.3%) |
| 35 to 39 Years | 93 (3.7%) | 155 (7.2%) |
| 40 to 44 Years | 128 (5.1%) | 117 (5.4%) |
| 45 to 49 Years | 137 (5.4%) | 114 (5.3%) |
| 50 to 54 Years | 156 (6.2%) | 45 (2.1%) |
| 55 to 59 Years | 101 (4.0%) | 125 (5.8%) |
| 60 to 64 Years | 106 (4.2%) | 139 (6.5%) |
| 65 to 69 Years | 56 (2.2%) | 103 (4.8%) |
| 70 to 74 Years | 90 (3.6%) | 239 (11.1%) |
| 75 to 79 Years | 99 (3.9%) | 110 (5.1%) |
| 80 to 84 Years | 69 (2.7%) | 119 (5.5%) |
| 85 Years and over | 14 (0.5%) | 247 (11.5%) |
| Total | 2,527 (100.0%) | 2,156 (100.0%) |
Families and Households in South Hill
Median Family Size in South Hill
The median family size in South Hill is 2.99 persons per family, with single female/mother families (354 | 37.5%) accounting for the largest median family size of 3.45 persons per family. On the other hand, single male/father families (114 | 12.1%) represent the smallest median family size with 2.61 persons per family.
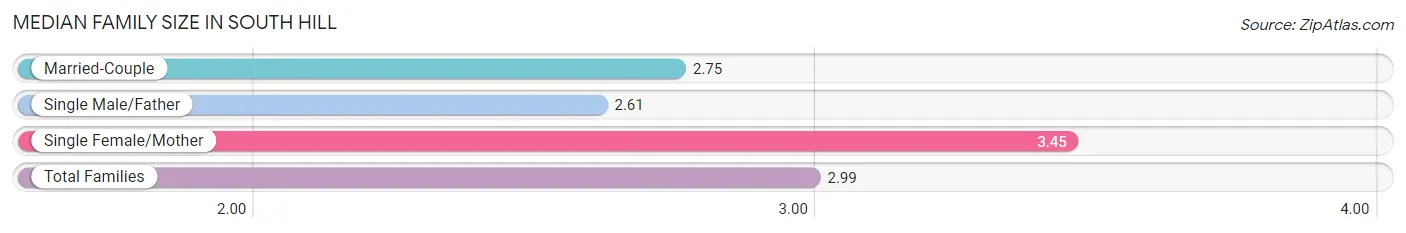
| Family Type | # Families | Family Size |
| Married-Couple | 477 (50.5%) | 2.75 |
| Single Male/Father | 114 (12.1%) | 2.61 |
| Single Female/Mother | 354 (37.5%) | 3.45 |
| Total Families | 945 (100.0%) | 2.99 |
Median Household Size in South Hill
The median household size in South Hill is 2.06 persons per household, with single female/mother households (354 | 16.0%) accounting for the largest median household size of 3.95 persons per household. non-family households (1,266 | 57.3%) represent the smallest median household size with 1.22 persons per household.
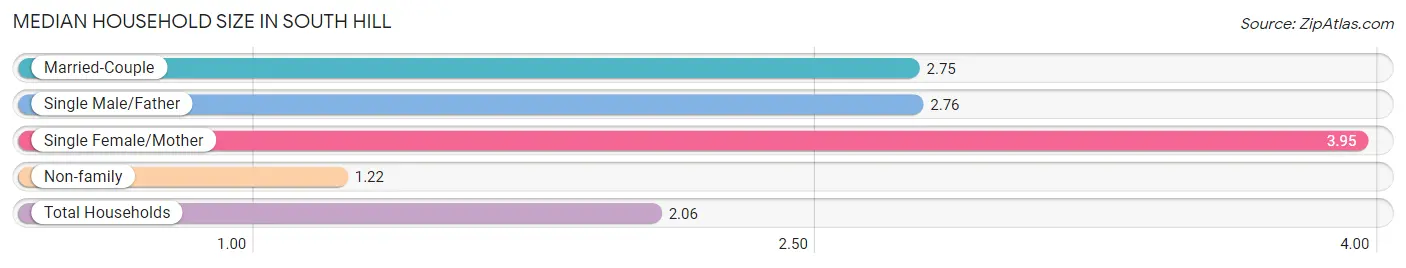
| Household Type | # Households | Household Size |
| Married-Couple | 477 (21.6%) | 2.75 |
| Single Male/Father | 114 (5.2%) | 2.76 |
| Single Female/Mother | 354 (16.0%) | 3.95 |
| Non-family | 1,266 (57.3%) | 1.22 |
| Total Households | 2,211 (100.0%) | 2.06 |
Household Size by Marriage Status in South Hill
Out of a total of 2,211 households in South Hill, 945 (42.7%) are family households, while 1,266 (57.3%) are nonfamily households. The most numerous type of family households are 2-person households, comprising 366, and the most common type of nonfamily households are 1-person households, comprising 1,043.
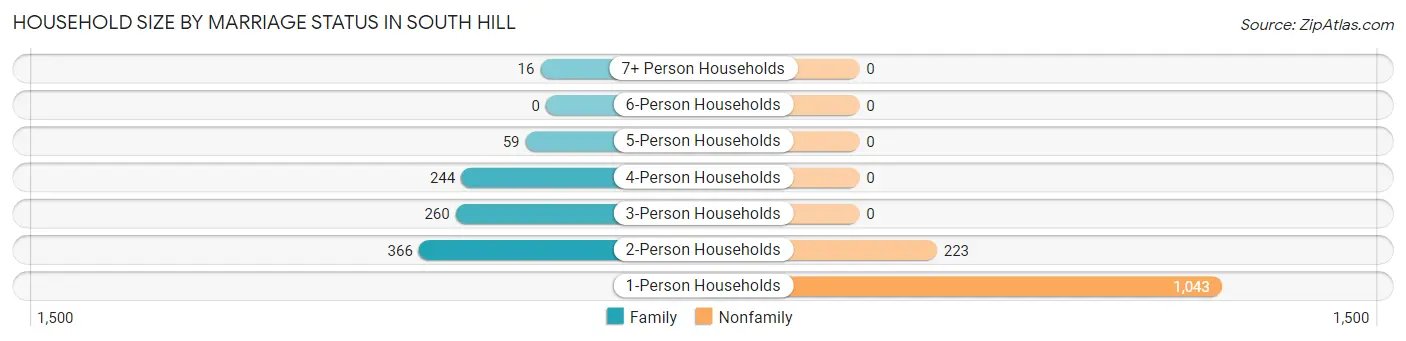
| Household Size | Family Households | Nonfamily Households |
| 1-Person Households | - | 1,043 (47.2%) |
| 2-Person Households | 366 (16.6%) | 223 (10.1%) |
| 3-Person Households | 260 (11.8%) | 0 (0.0%) |
| 4-Person Households | 244 (11.0%) | 0 (0.0%) |
| 5-Person Households | 59 (2.7%) | 0 (0.0%) |
| 6-Person Households | 0 (0.0%) | 0 (0.0%) |
| 7+ Person Households | 16 (0.7%) | 0 (0.0%) |
| Total | 945 (42.7%) | 1,266 (57.3%) |
Female Fertility in South Hill
Fertility by Age in South Hill
Average fertility rate in South Hill is 74.0 births per 1,000 women. Women in the age bracket of 20 to 34 years have the highest fertility rate with 169.0 births per 1,000 women. Women in the age bracket of 20 to 34 years acount for 100.0% of all women with births.
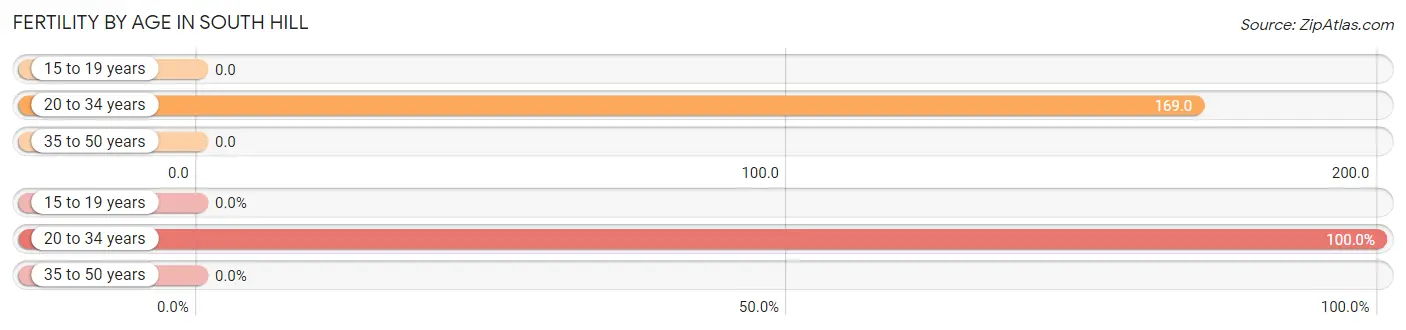
| Age Bracket | Women with Births | Births / 1,000 Women |
| 15 to 19 years | 0 (0.0%) | 0.0 |
| 20 to 34 years | 54 (100.0%) | 169.0 |
| 35 to 50 years | 0 (0.0%) | 0.0 |
| Total | 54 (100.0%) | 74.0 |
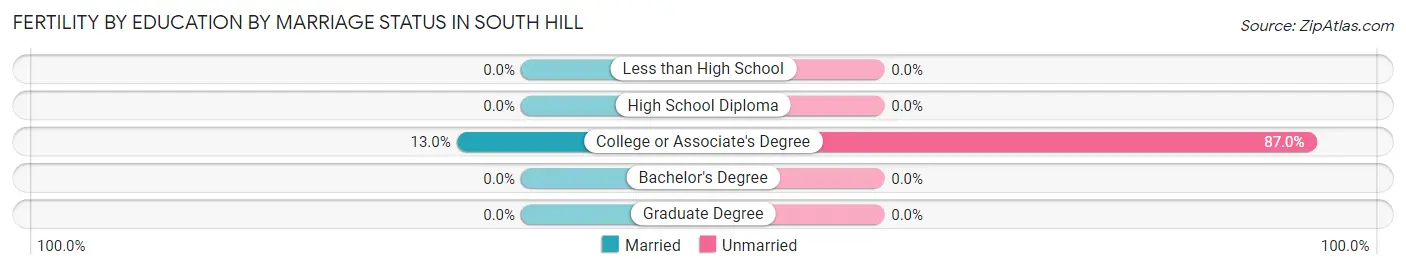
Fertility by Age by Marriage Status in South Hill
13.0% of women with births (54) in South Hill are married. The highest percentage of unmarried women with births falls into 20 to 34 years age bracket with 87.0% of them unmarried at the time of birth, while the lowest percentage of unmarried women with births belong to 20 to 34 years age bracket with 87.0% of them unmarried.
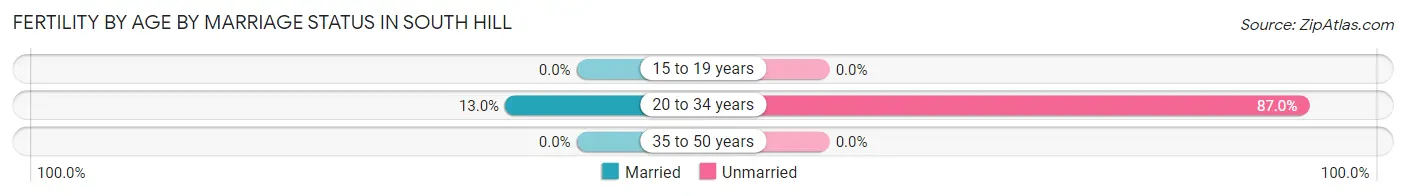
| Age Bracket | Married | Unmarried |
| 15 to 19 years | 0 (0.0%) | 0 (0.0%) |
| 20 to 34 years | 7 (13.0%) | 47 (87.0%) |
| 35 to 50 years | 0 (0.0%) | 0 (0.0%) |
| Total | 7 (13.0%) | 47 (87.0%) |
Fertility by Education in South Hill
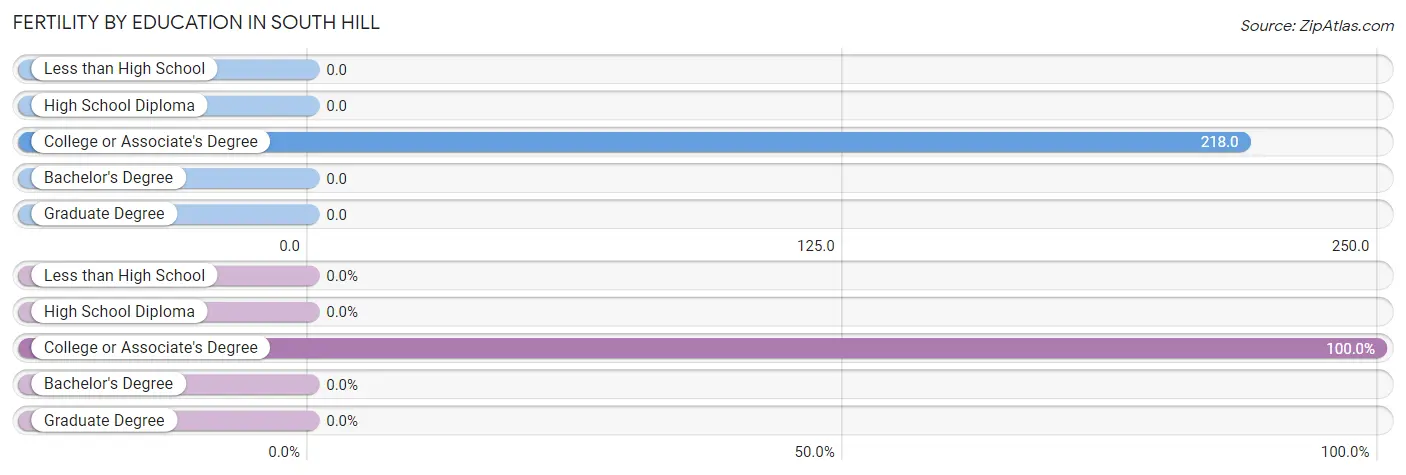
| Educational Attainment | Women with Births | Births / 1,000 Women |
| Less than High School | 0 (0.0%) | 0.0 |
| High School Diploma | 0 (0.0%) | 0.0 |
| College or Associate's Degree | 54 (100.0%) | 218.0 |
| Bachelor's Degree | 0 (0.0%) | 0.0 |
| Graduate Degree | 0 (0.0%) | 0.0 |
| Total | 54 (100.0%) | 74.0 |
Fertility by Education by Marriage Status in South Hill
87.0% of women with births in South Hill are unmarried. Women with the educational attainment of college or associate's degree are most likely to be married with 13.0% of them married at childbirth, while women with the educational attainment of college or associate's degree are least likely to be married with 87.0% of them unmarried at childbirth.
| Educational Attainment | Married | Unmarried |
| Less than High School | 0 (0.0%) | 0 (0.0%) |
| High School Diploma | 0 (0.0%) | 0 (0.0%) |
| College or Associate's Degree | 7 (13.0%) | 47 (87.0%) |
| Bachelor's Degree | 0 (0.0%) | 0 (0.0%) |
| Graduate Degree | 0 (0.0%) | 0 (0.0%) |
| Total | 7 (13.0%) | 47 (87.0%) |
Employment Characteristics in South Hill
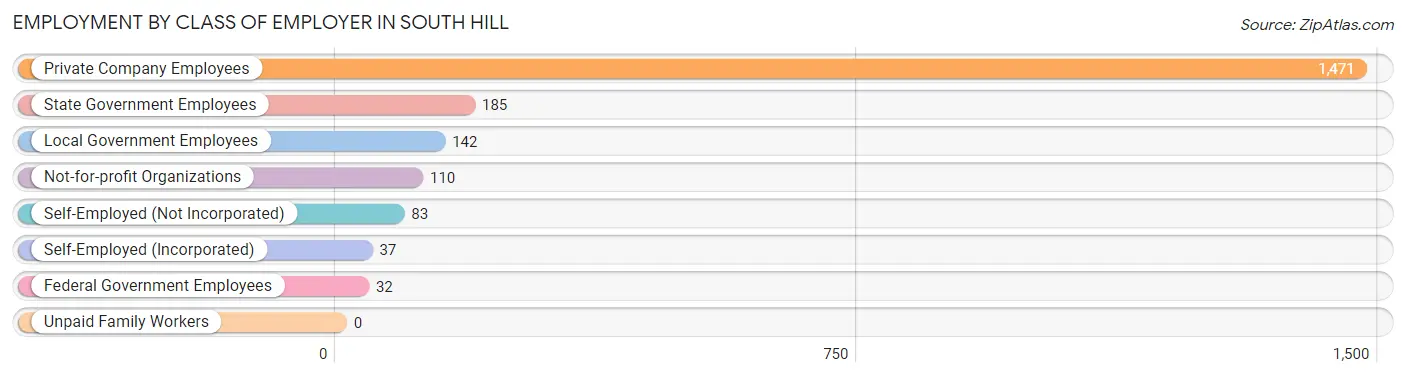
Employment by Class of Employer in South Hill
Among the 2,060 employed individuals in South Hill, private company employees (1,471 | 71.4%), state government employees (185 | 9.0%), and local government employees (142 | 6.9%) make up the most common classes of employment.
| Employer Class | # Employees | % Employees |
| Private Company Employees | 1,471 | 71.4% |
| Self-Employed (Incorporated) | 37 | 1.8% |
| Self-Employed (Not Incorporated) | 83 | 4.0% |
| Not-for-profit Organizations | 110 | 5.3% |
| Local Government Employees | 142 | 6.9% |
| State Government Employees | 185 | 9.0% |
| Federal Government Employees | 32 | 1.5% |
| Unpaid Family Workers | 0 | 0.0% |
| Total | 2,060 | 100.0% |
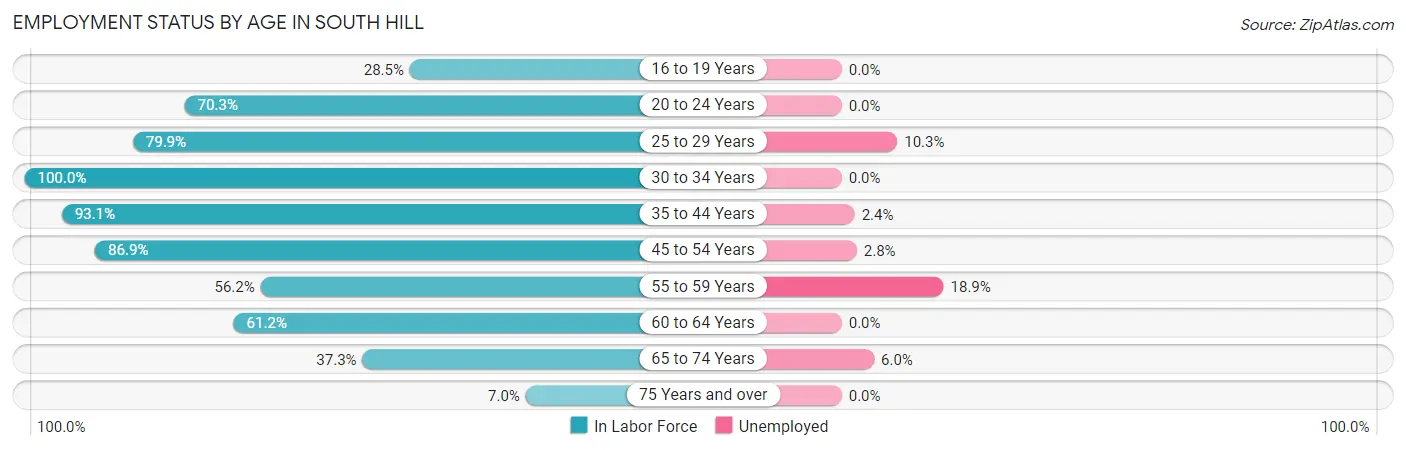
Employment Status by Age in South Hill
According to the labor force statistics for South Hill, out of the total population over 16 years of age (3,942), 57.8% or 2,278 individuals are in the labor force, with 4.5% or 103 of them unemployed. The age group with the highest labor force participation rate is 30 to 34 years, with 100.0% or 119 individuals in the labor force. Within the labor force, the 55 to 59 years age range has the highest percentage of unemployed individuals, with 18.9% or 24 of them being unemployed.
| Age Bracket | In Labor Force | Unemployed |
| 16 to 19 Years | 94 (28.5%) | 0 (0.0%) |
| 20 to 24 Years | 260 (70.3%) | 0 (0.0%) |
| 25 to 29 Years | 448 (79.9%) | 46 (10.3%) |
| 30 to 34 Years | 119 (100.0%) | 0 (0.0%) |
| 35 to 44 Years | 459 (93.1%) | 11 (2.4%) |
| 45 to 54 Years | 393 (86.9%) | 11 (2.8%) |
| 55 to 59 Years | 127 (56.2%) | 24 (18.9%) |
| 60 to 64 Years | 150 (61.2%) | 0 (0.0%) |
| 65 to 74 Years | 182 (37.3%) | 11 (6.0%) |
| 75 Years and over | 46 (7.0%) | 0 (0.0%) |
| Total | 2,278 (57.8%) | 103 (4.5%) |
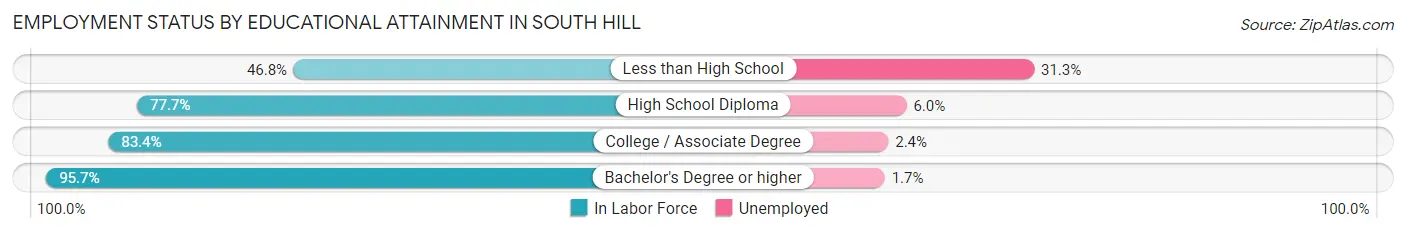
Employment Status by Educational Attainment in South Hill
According to labor force statistics for South Hill, 80.9% of individuals (1,696) out of the total population between 25 and 64 years of age (2,096) are in the labor force, with 5.4% or 92 of them being unemployed. The group with the highest labor force participation rate are those with the educational attainment of bachelor's degree or higher, with 95.7% or 709 individuals in the labor force. Within the labor force, individuals with less than high school education have the highest percentage of unemployment, with 31.3% or 46 of them being unemployed.
| Educational Attainment | In Labor Force | Unemployed |
| Less than High School | 147 (46.8%) | 98 (31.3%) |
| High School Diploma | 383 (77.7%) | 30 (6.0%) |
| College / Associate Degree | 457 (83.4%) | 13 (2.4%) |
| Bachelor's Degree or higher | 709 (95.7%) | 13 (1.7%) |
| Total | 1,696 (80.9%) | 113 (5.4%) |
Employment Occupations by Sex in South Hill
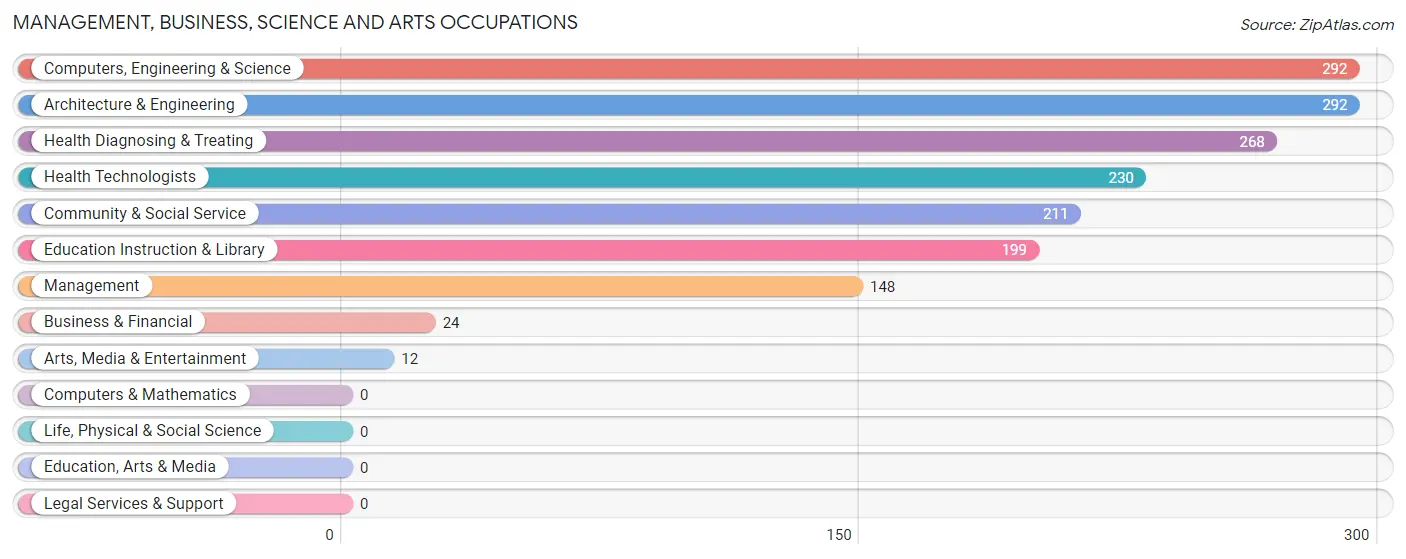
Management, Business, Science and Arts Occupations
The most common Management, Business, Science and Arts occupations in South Hill are Computers, Engineering & Science (292 | 13.4%), Architecture & Engineering (292 | 13.4%), Health Diagnosing & Treating (268 | 12.3%), Health Technologists (230 | 10.6%), and Community & Social Service (211 | 9.7%).
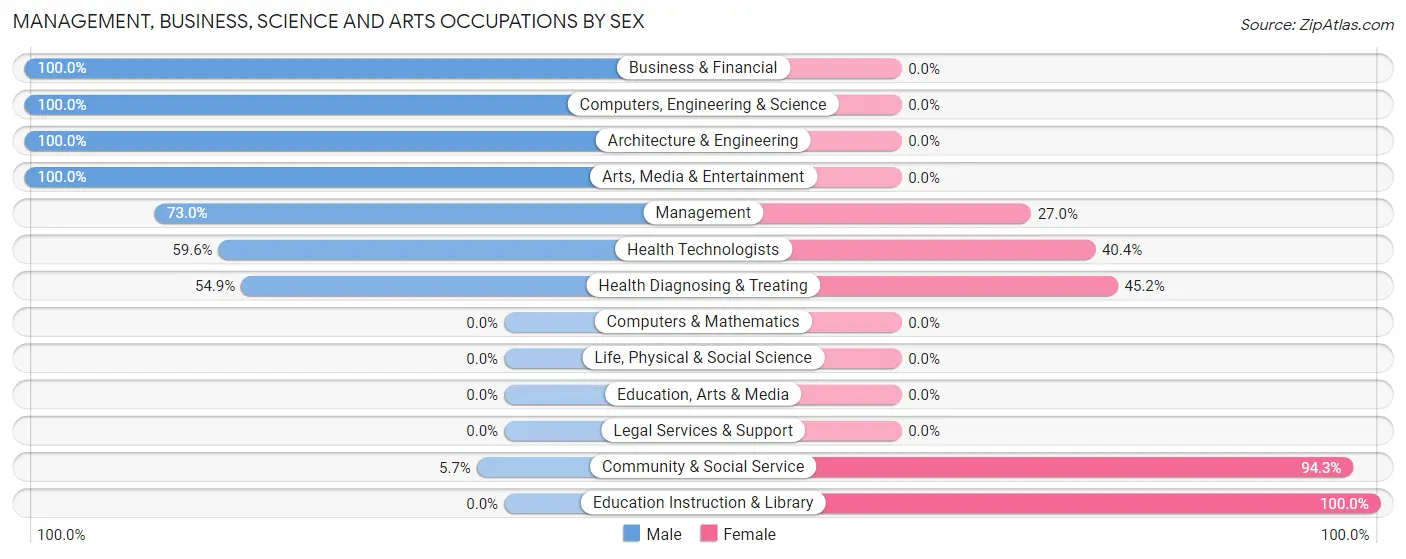
Management, Business, Science and Arts Occupations by Sex
Within the Management, Business, Science and Arts occupations in South Hill, the most male-oriented occupations are Business & Financial (100.0%), Computers, Engineering & Science (100.0%), and Architecture & Engineering (100.0%), while the most female-oriented occupations are Education Instruction & Library (100.0%), Community & Social Service (94.3%), and Health Diagnosing & Treating (45.2%).
| Occupation | Male | Female |
| Management | 108 (73.0%) | 40 (27.0%) |
| Business & Financial | 24 (100.0%) | 0 (0.0%) |
| Computers, Engineering & Science | 292 (100.0%) | 0 (0.0%) |
| Computers & Mathematics | 0 (0.0%) | 0 (0.0%) |
| Architecture & Engineering | 292 (100.0%) | 0 (0.0%) |
| Life, Physical & Social Science | 0 (0.0%) | 0 (0.0%) |
| Community & Social Service | 12 (5.7%) | 199 (94.3%) |
| Education, Arts & Media | 0 (0.0%) | 0 (0.0%) |
| Legal Services & Support | 0 (0.0%) | 0 (0.0%) |
| Education Instruction & Library | 0 (0.0%) | 199 (100.0%) |
| Arts, Media & Entertainment | 12 (100.0%) | 0 (0.0%) |
| Health Diagnosing & Treating | 147 (54.8%) | 121 (45.2%) |
| Health Technologists | 137 (59.6%) | 93 (40.4%) |
| Total (Category) | 583 (61.8%) | 360 (38.2%) |
| Total (Overall) | 1,329 (61.1%) | 846 (38.9%) |
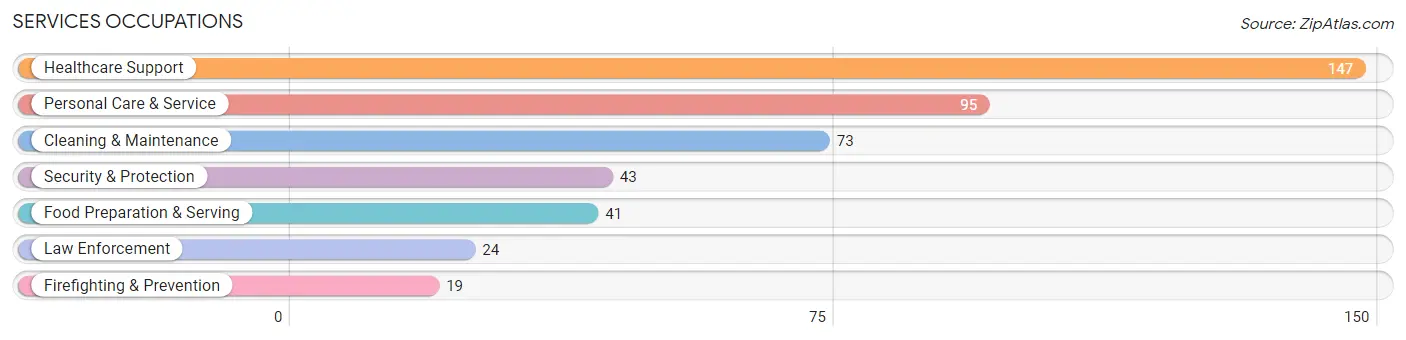
Services Occupations
The most common Services occupations in South Hill are Healthcare Support (147 | 6.8%), Personal Care & Service (95 | 4.4%), Cleaning & Maintenance (73 | 3.4%), Security & Protection (43 | 2.0%), and Food Preparation & Serving (41 | 1.9%).
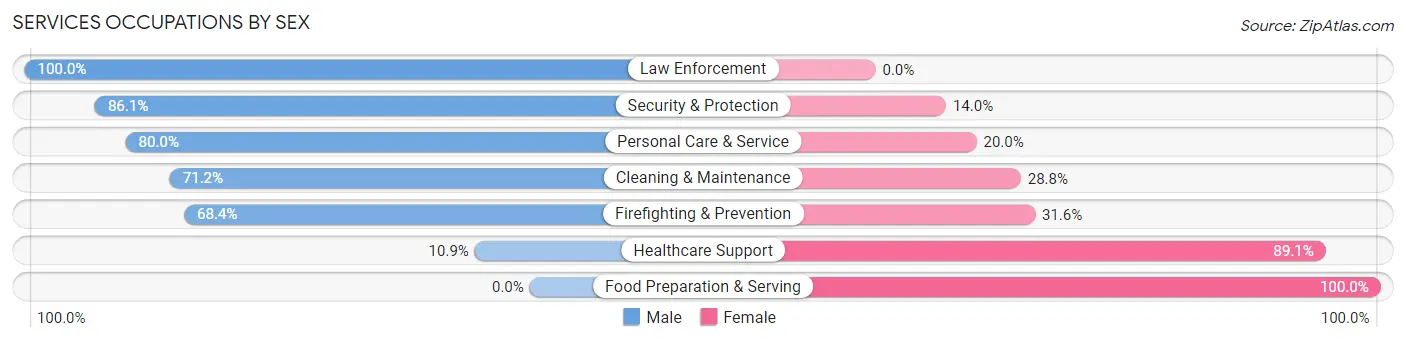
Services Occupations by Sex
Within the Services occupations in South Hill, the most male-oriented occupations are Law Enforcement (100.0%), Security & Protection (86.1%), and Personal Care & Service (80.0%), while the most female-oriented occupations are Food Preparation & Serving (100.0%), Healthcare Support (89.1%), and Firefighting & Prevention (31.6%).
| Occupation | Male | Female |
| Healthcare Support | 16 (10.9%) | 131 (89.1%) |
| Security & Protection | 37 (86.1%) | 6 (14.0%) |
| Firefighting & Prevention | 13 (68.4%) | 6 (31.6%) |
| Law Enforcement | 24 (100.0%) | 0 (0.0%) |
| Food Preparation & Serving | 0 (0.0%) | 41 (100.0%) |
| Cleaning & Maintenance | 52 (71.2%) | 21 (28.8%) |
| Personal Care & Service | 76 (80.0%) | 19 (20.0%) |
| Total (Category) | 181 (45.4%) | 218 (54.6%) |
| Total (Overall) | 1,329 (61.1%) | 846 (38.9%) |
Sales and Office Occupations
The most common Sales and Office occupations in South Hill are Sales & Related (179 | 8.2%), and Office & Administration (105 | 4.8%).
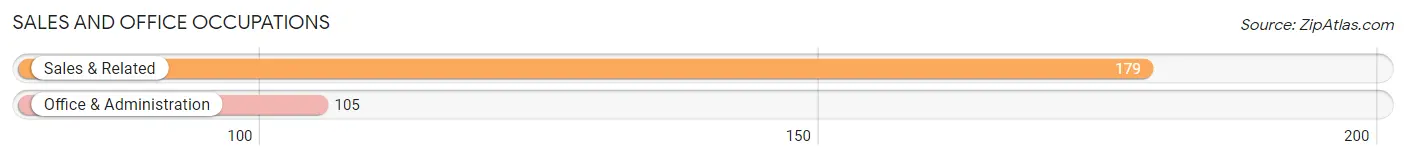
Sales and Office Occupations by Sex
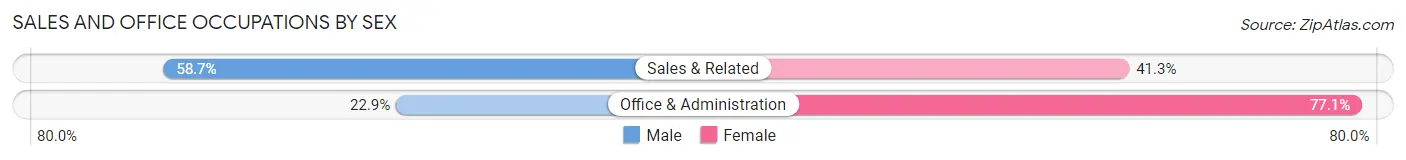
| Occupation | Male | Female |
| Sales & Related | 105 (58.7%) | 74 (41.3%) |
| Office & Administration | 24 (22.9%) | 81 (77.1%) |
| Total (Category) | 129 (45.4%) | 155 (54.6%) |
| Total (Overall) | 1,329 (61.1%) | 846 (38.9%) |
Natural Resources, Construction and Maintenance Occupations
The most common Natural Resources, Construction and Maintenance occupations in South Hill are Construction & Extraction (98 | 4.5%), and Installation, Maintenance & Repair (53 | 2.4%).

Natural Resources, Construction and Maintenance Occupations by Sex
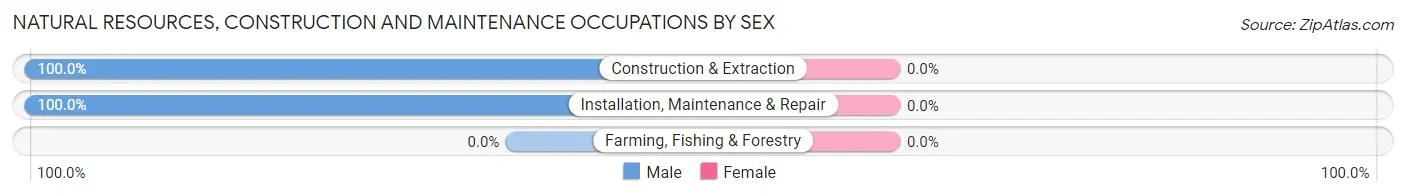
| Occupation | Male | Female |
| Farming, Fishing & Forestry | 0 (0.0%) | 0 (0.0%) |
| Construction & Extraction | 98 (100.0%) | 0 (0.0%) |
| Installation, Maintenance & Repair | 53 (100.0%) | 0 (0.0%) |
| Total (Category) | 151 (100.0%) | 0 (0.0%) |
| Total (Overall) | 1,329 (61.1%) | 846 (38.9%) |
Production, Transportation and Moving Occupations
The most common Production, Transportation and Moving occupations in South Hill are Material Moving (169 | 7.8%), Transportation (126 | 5.8%), and Production (103 | 4.7%).
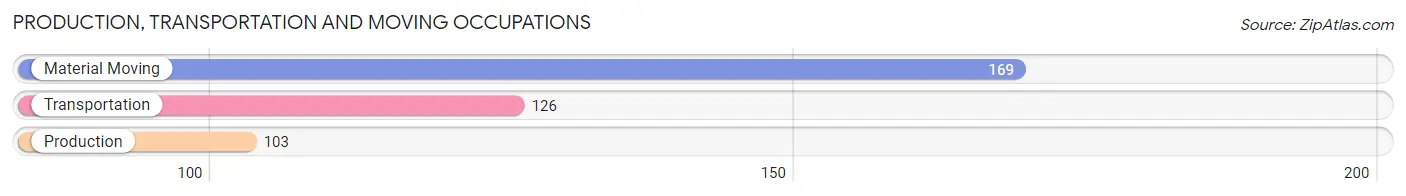
Production, Transportation and Moving Occupations by Sex
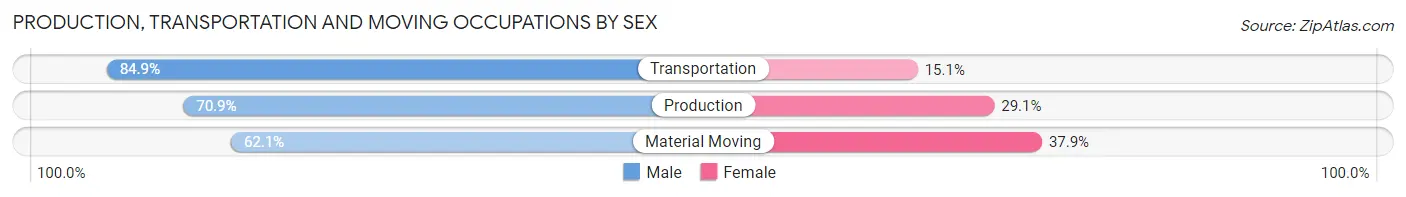
| Occupation | Male | Female |
| Production | 73 (70.9%) | 30 (29.1%) |
| Transportation | 107 (84.9%) | 19 (15.1%) |
| Material Moving | 105 (62.1%) | 64 (37.9%) |
| Total (Category) | 285 (71.6%) | 113 (28.4%) |
| Total (Overall) | 1,329 (61.1%) | 846 (38.9%) |
Employment Industries by Sex in South Hill
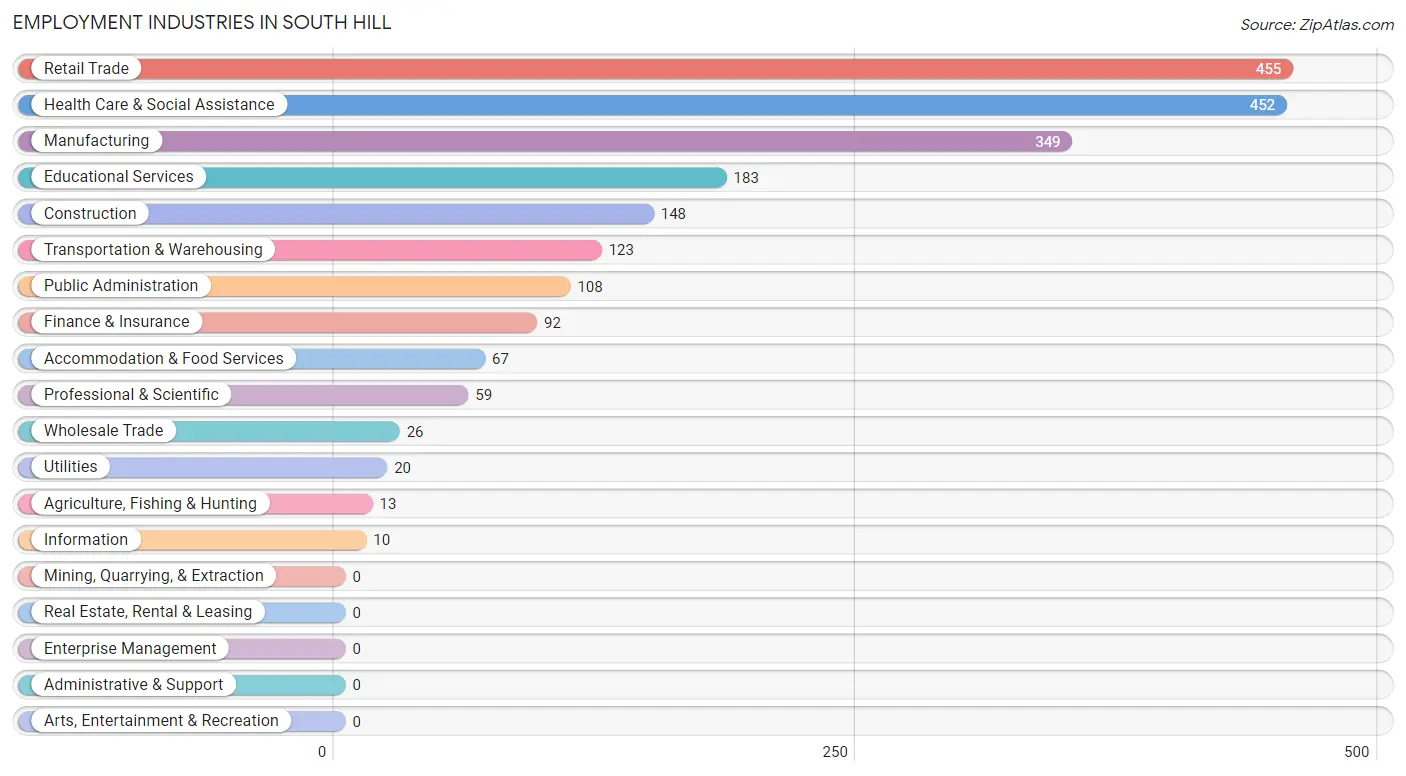
Employment Industries in South Hill
The major employment industries in South Hill include Retail Trade (455 | 20.9%), Health Care & Social Assistance (452 | 20.8%), Manufacturing (349 | 16.1%), Educational Services (183 | 8.4%), and Construction (148 | 6.8%).
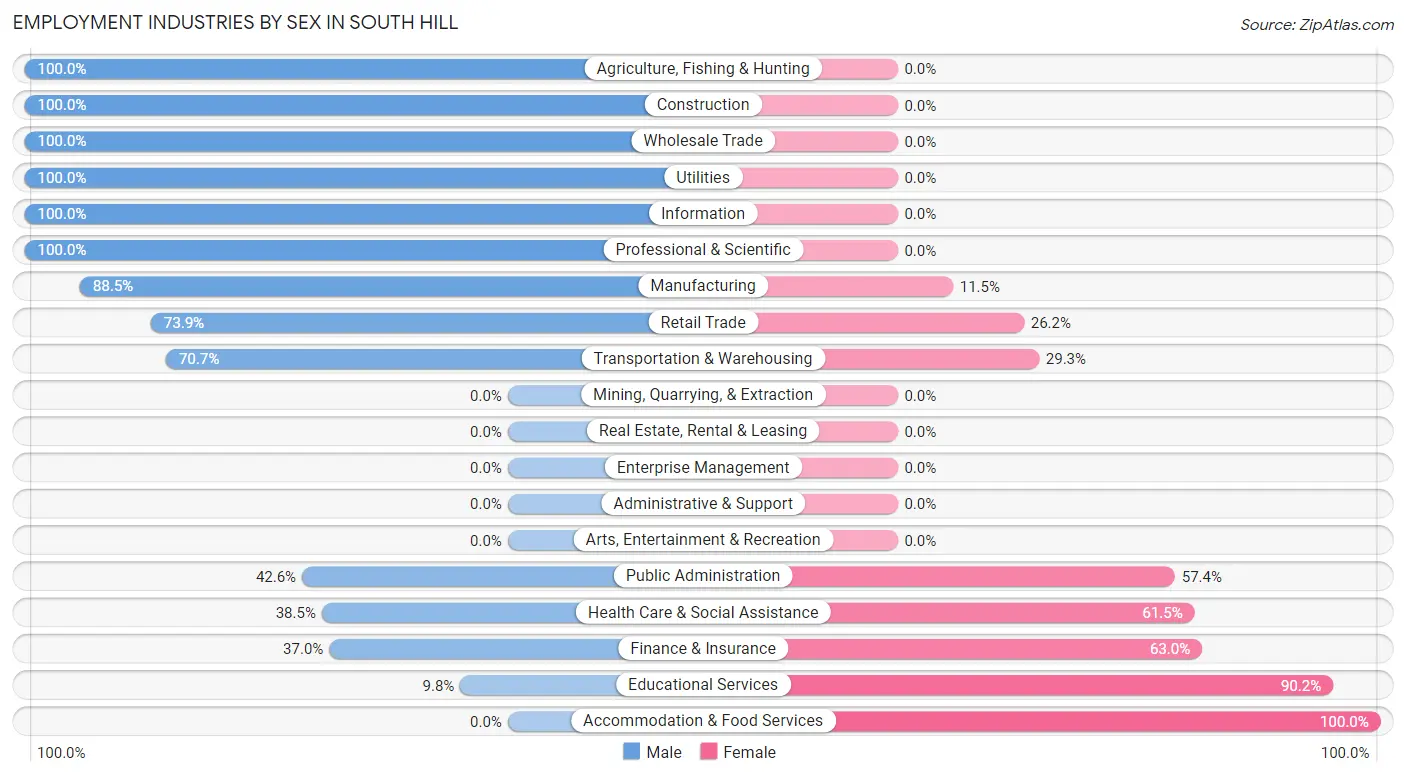
Employment Industries by Sex in South Hill
The South Hill industries that see more men than women are Agriculture, Fishing & Hunting (100.0%), Construction (100.0%), and Wholesale Trade (100.0%), whereas the industries that tend to have a higher number of women are Accommodation & Food Services (100.0%), Educational Services (90.2%), and Finance & Insurance (63.0%).
| Industry | Male | Female |
| Agriculture, Fishing & Hunting | 13 (100.0%) | 0 (0.0%) |
| Mining, Quarrying, & Extraction | 0 (0.0%) | 0 (0.0%) |
| Construction | 148 (100.0%) | 0 (0.0%) |
| Manufacturing | 309 (88.5%) | 40 (11.5%) |
| Wholesale Trade | 26 (100.0%) | 0 (0.0%) |
| Retail Trade | 336 (73.9%) | 119 (26.2%) |
| Transportation & Warehousing | 87 (70.7%) | 36 (29.3%) |
| Utilities | 20 (100.0%) | 0 (0.0%) |
| Information | 10 (100.0%) | 0 (0.0%) |
| Finance & Insurance | 34 (37.0%) | 58 (63.0%) |
| Real Estate, Rental & Leasing | 0 (0.0%) | 0 (0.0%) |
| Professional & Scientific | 59 (100.0%) | 0 (0.0%) |
| Enterprise Management | 0 (0.0%) | 0 (0.0%) |
| Administrative & Support | 0 (0.0%) | 0 (0.0%) |
| Educational Services | 18 (9.8%) | 165 (90.2%) |
| Health Care & Social Assistance | 174 (38.5%) | 278 (61.5%) |
| Arts, Entertainment & Recreation | 0 (0.0%) | 0 (0.0%) |
| Accommodation & Food Services | 0 (0.0%) | 67 (100.0%) |
| Public Administration | 46 (42.6%) | 62 (57.4%) |
| Total | 1,329 (61.1%) | 846 (38.9%) |
Education in South Hill
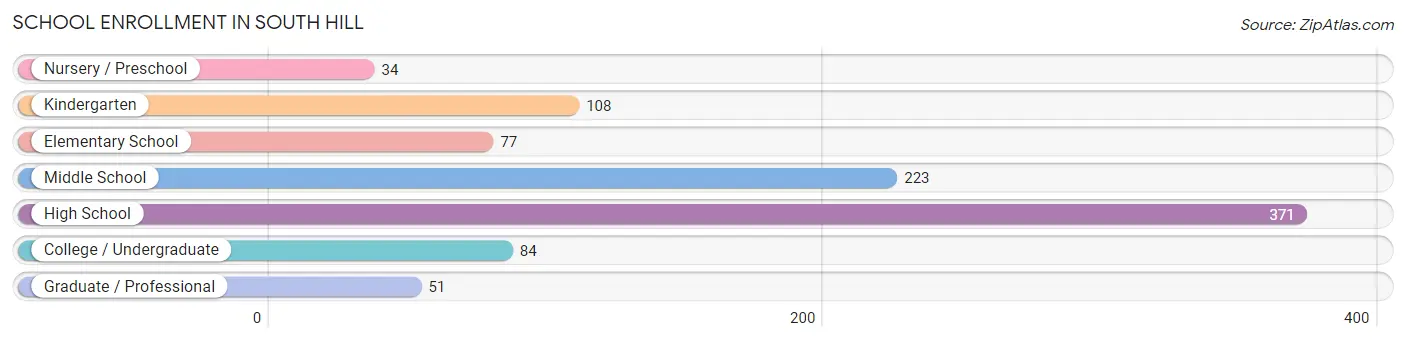
School Enrollment in South Hill
The most common levels of schooling among the 948 students in South Hill are high school (371 | 39.1%), middle school (223 | 23.5%), and kindergarten (108 | 11.4%).
| School Level | # Students | % Students |
| Nursery / Preschool | 34 | 3.6% |
| Kindergarten | 108 | 11.4% |
| Elementary School | 77 | 8.1% |
| Middle School | 223 | 23.5% |
| High School | 371 | 39.1% |
| College / Undergraduate | 84 | 8.9% |
| Graduate / Professional | 51 | 5.4% |
| Total | 948 | 100.0% |
School Enrollment by Age by Funding Source in South Hill
Out of a total of 948 students who are enrolled in schools in South Hill, 158 (16.7%) attend a private institution, while the remaining 790 (83.3%) are enrolled in public schools. The age group of 3 to 4 year olds has the highest likelihood of being enrolled in private schools, with 12 (63.2% in the age bracket) enrolled. Conversely, the age group of 5 to 9 year old has the lowest likelihood of being enrolled in a private school, with 184 (100.0% in the age bracket) attending a public institution.
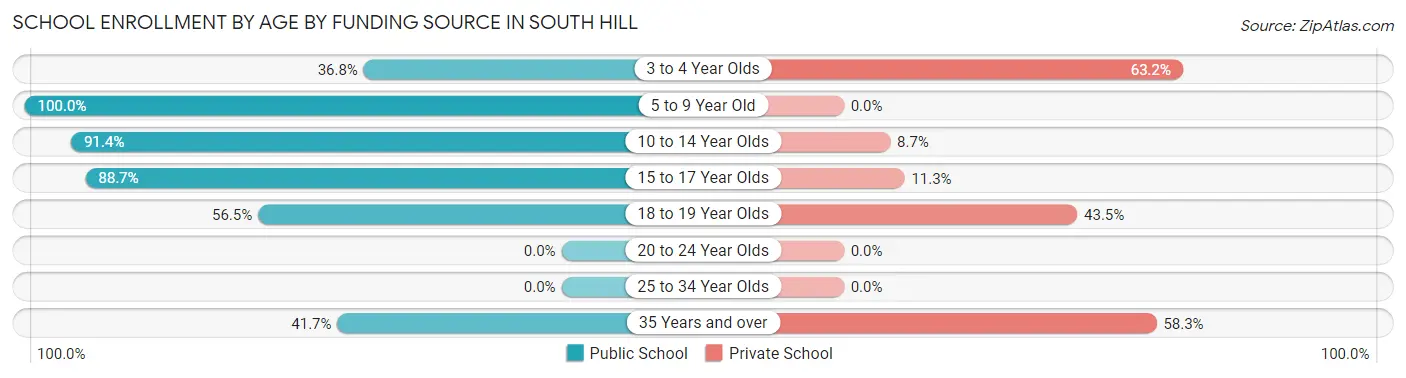
| Age Bracket | Public School | Private School |
| 3 to 4 Year Olds | 7 (36.8%) | 12 (63.2%) |
| 5 to 9 Year Old | 184 (100.0%) | 0 (0.0%) |
| 10 to 14 Year Olds | 243 (91.3%) | 23 (8.6%) |
| 15 to 17 Year Olds | 282 (88.7%) | 36 (11.3%) |
| 18 to 19 Year Olds | 26 (56.5%) | 20 (43.5%) |
| 20 to 24 Year Olds | 0 (0.0%) | 0 (0.0%) |
| 25 to 34 Year Olds | 0 (0.0%) | 0 (0.0%) |
| 35 Years and over | 48 (41.7%) | 67 (58.3%) |
| Total | 790 (83.3%) | 158 (16.7%) |
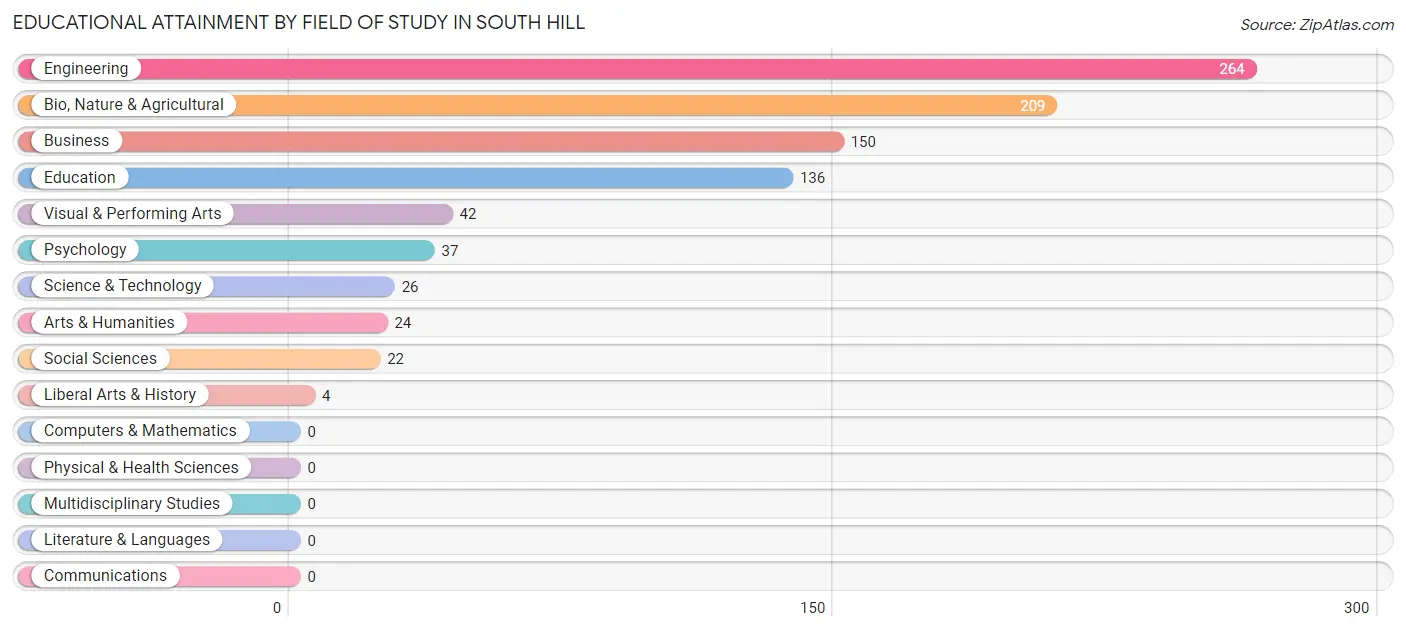
Educational Attainment by Field of Study in South Hill
Engineering (264 | 28.9%), bio, nature & agricultural (209 | 22.9%), business (150 | 16.4%), education (136 | 14.9%), and visual & performing arts (42 | 4.6%) are the most common fields of study among 914 individuals in South Hill who have obtained a bachelor's degree or higher.
| Field of Study | # Graduates | % Graduates |
| Computers & Mathematics | 0 | 0.0% |
| Bio, Nature & Agricultural | 209 | 22.9% |
| Physical & Health Sciences | 0 | 0.0% |
| Psychology | 37 | 4.1% |
| Social Sciences | 22 | 2.4% |
| Engineering | 264 | 28.9% |
| Multidisciplinary Studies | 0 | 0.0% |
| Science & Technology | 26 | 2.8% |
| Business | 150 | 16.4% |
| Education | 136 | 14.9% |
| Literature & Languages | 0 | 0.0% |
| Liberal Arts & History | 4 | 0.4% |
| Visual & Performing Arts | 42 | 4.6% |
| Communications | 0 | 0.0% |
| Arts & Humanities | 24 | 2.6% |
| Total | 914 | 100.0% |
Transportation & Commute in South Hill
Vehicle Availability by Sex in South Hill
The most prevalent vehicle ownership categories in South Hill are males with 2 vehicles (541, accounting for 41.3%) and females with 2 vehicles (373, making up 72.4%).
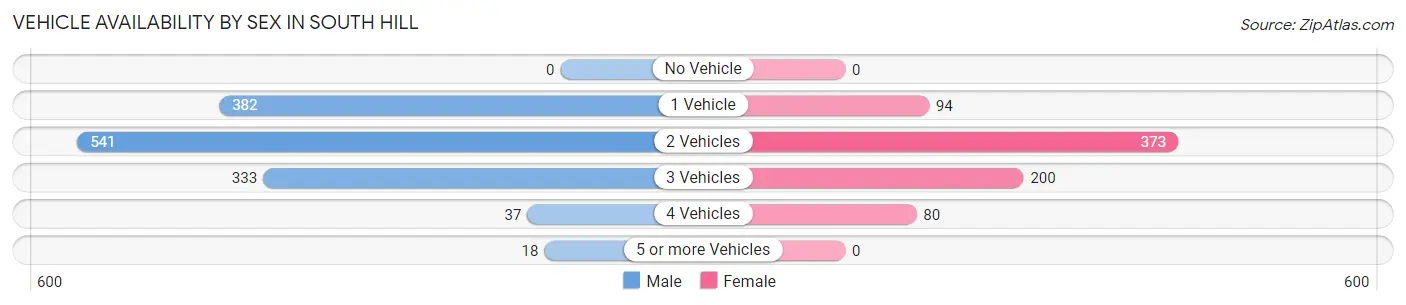
| Vehicles Available | Male | Female |
| No Vehicle | 0 (0.0%) | 0 (0.0%) |
| 1 Vehicle | 382 (29.1%) | 94 (12.6%) |
| 2 Vehicles | 541 (41.3%) | 373 (49.9%) |
| 3 Vehicles | 333 (25.4%) | 200 (26.8%) |
| 4 Vehicles | 37 (2.8%) | 80 (10.7%) |
| 5 or more Vehicles | 18 (1.4%) | 0 (0.0%) |
| Total | 1,311 (100.0%) | 747 (100.0%) |
Commute Time in South Hill
The most frequently occuring commute durations in South Hill are 5 to 9 minutes (660 commuters, 33.0%), 10 to 14 minutes (574 commuters, 28.7%), and less than 5 minutes (234 commuters, 11.7%).
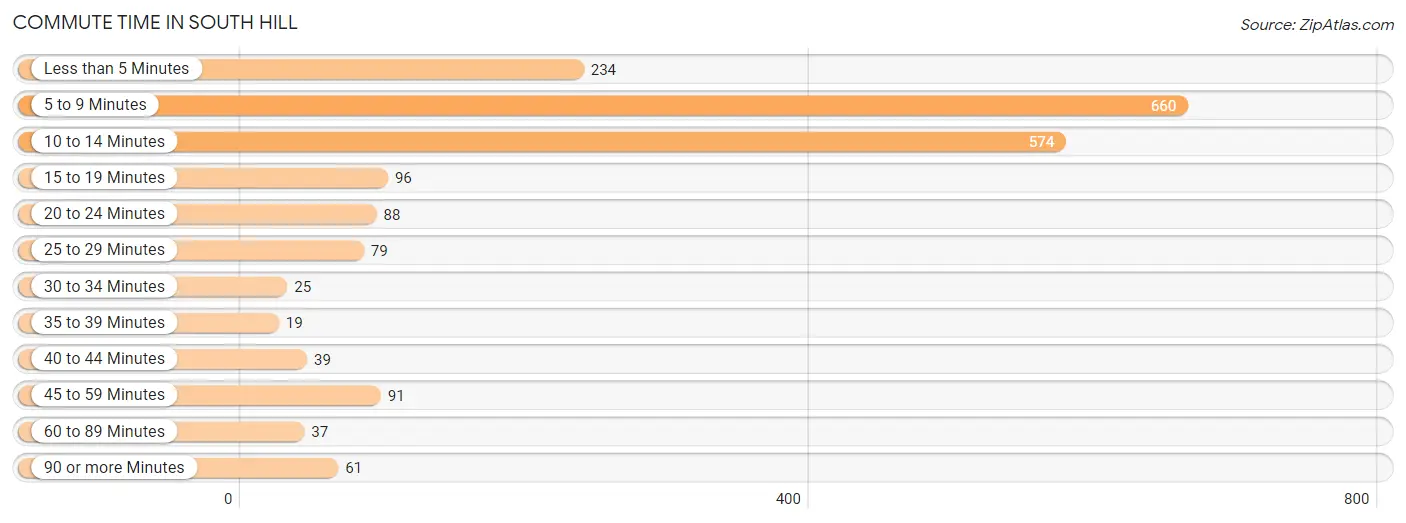
| Commute Time | # Commuters | % Commuters |
| Less than 5 Minutes | 234 | 11.7% |
| 5 to 9 Minutes | 660 | 33.0% |
| 10 to 14 Minutes | 574 | 28.7% |
| 15 to 19 Minutes | 96 | 4.8% |
| 20 to 24 Minutes | 88 | 4.4% |
| 25 to 29 Minutes | 79 | 3.9% |
| 30 to 34 Minutes | 25 | 1.3% |
| 35 to 39 Minutes | 19 | 0.9% |
| 40 to 44 Minutes | 39 | 1.9% |
| 45 to 59 Minutes | 91 | 4.5% |
| 60 to 89 Minutes | 37 | 1.8% |
| 90 or more Minutes | 61 | 3.0% |
Commute Time by Sex in South Hill
The most common commute times in South Hill are 10 to 14 minutes (460 commuters, 35.8%) for males and 5 to 9 minutes (373 commuters, 52.0%) for females.
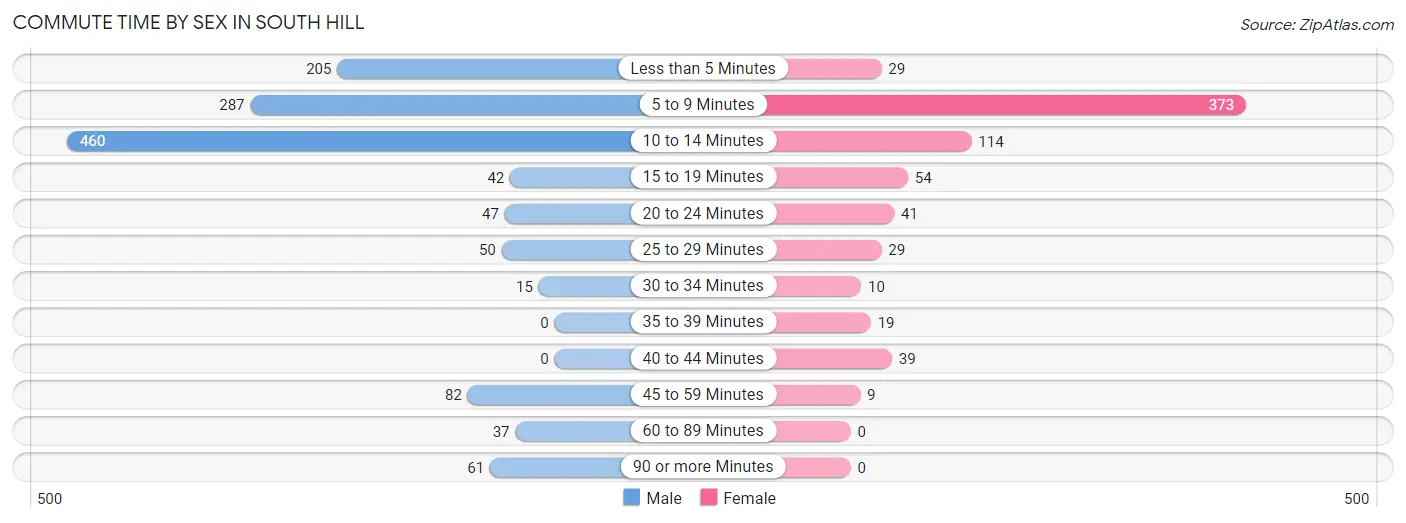
| Commute Time | Male | Female |
| Less than 5 Minutes | 205 (15.9%) | 29 (4.0%) |
| 5 to 9 Minutes | 287 (22.3%) | 373 (52.0%) |
| 10 to 14 Minutes | 460 (35.8%) | 114 (15.9%) |
| 15 to 19 Minutes | 42 (3.3%) | 54 (7.5%) |
| 20 to 24 Minutes | 47 (3.6%) | 41 (5.7%) |
| 25 to 29 Minutes | 50 (3.9%) | 29 (4.0%) |
| 30 to 34 Minutes | 15 (1.2%) | 10 (1.4%) |
| 35 to 39 Minutes | 0 (0.0%) | 19 (2.6%) |
| 40 to 44 Minutes | 0 (0.0%) | 39 (5.4%) |
| 45 to 59 Minutes | 82 (6.4%) | 9 (1.3%) |
| 60 to 89 Minutes | 37 (2.9%) | 0 (0.0%) |
| 90 or more Minutes | 61 (4.7%) | 0 (0.0%) |
Time of Departure to Work by Sex in South Hill
The most frequent times of departure to work in South Hill are 6:00 AM to 6:29 AM (316, 24.6%) for males and 12:00 AM to 4:59 AM (152, 21.2%) for females.
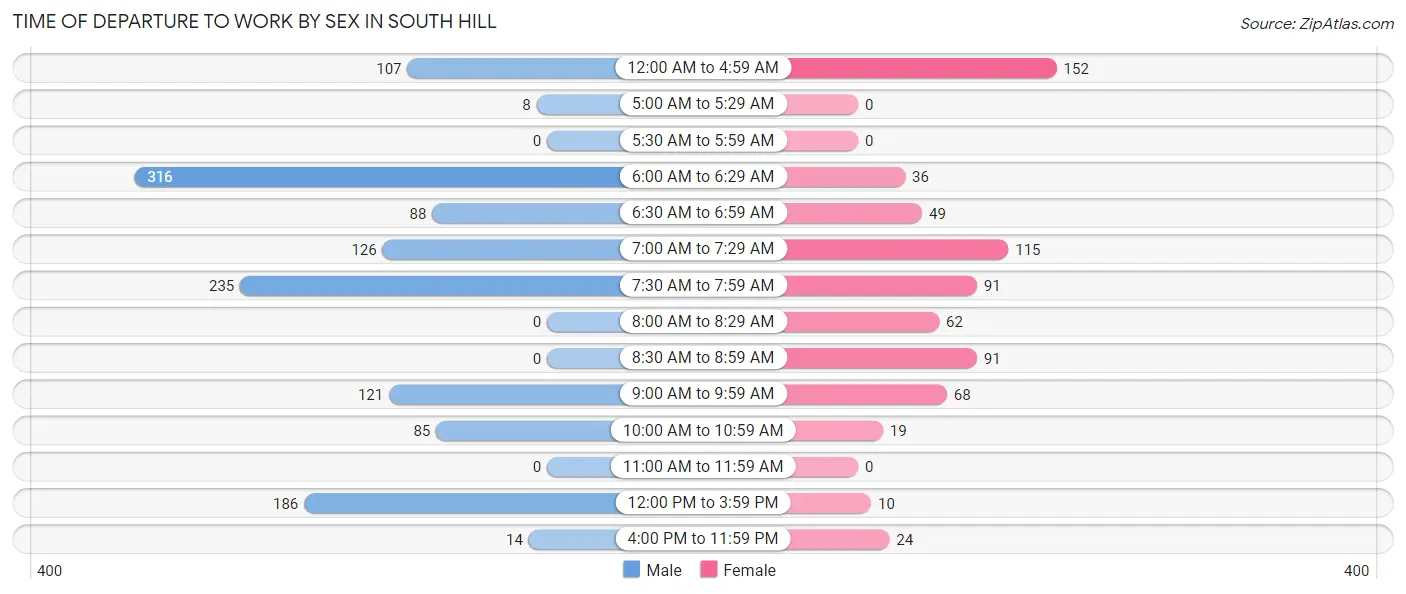
| Time of Departure | Male | Female |
| 12:00 AM to 4:59 AM | 107 (8.3%) | 152 (21.2%) |
| 5:00 AM to 5:29 AM | 8 (0.6%) | 0 (0.0%) |
| 5:30 AM to 5:59 AM | 0 (0.0%) | 0 (0.0%) |
| 6:00 AM to 6:29 AM | 316 (24.6%) | 36 (5.0%) |
| 6:30 AM to 6:59 AM | 88 (6.8%) | 49 (6.8%) |
| 7:00 AM to 7:29 AM | 126 (9.8%) | 115 (16.0%) |
| 7:30 AM to 7:59 AM | 235 (18.3%) | 91 (12.7%) |
| 8:00 AM to 8:29 AM | 0 (0.0%) | 62 (8.6%) |
| 8:30 AM to 8:59 AM | 0 (0.0%) | 91 (12.7%) |
| 9:00 AM to 9:59 AM | 121 (9.4%) | 68 (9.5%) |
| 10:00 AM to 10:59 AM | 85 (6.6%) | 19 (2.6%) |
| 11:00 AM to 11:59 AM | 0 (0.0%) | 0 (0.0%) |
| 12:00 PM to 3:59 PM | 186 (14.5%) | 10 (1.4%) |
| 4:00 PM to 11:59 PM | 14 (1.1%) | 24 (3.4%) |
| Total | 1,286 (100.0%) | 717 (100.0%) |
Housing Occupancy in South Hill
Occupancy by Ownership in South Hill
Of the total 2,211 dwellings in South Hill, owner-occupied units account for 1,096 (49.6%), while renter-occupied units make up 1,115 (50.4%).
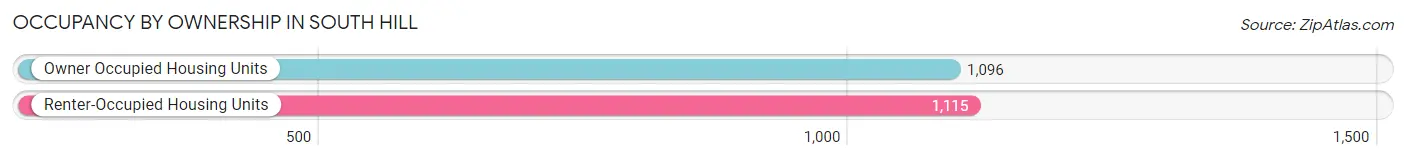
| Occupancy | # Housing Units | % Housing Units |
| Owner Occupied Housing Units | 1,096 | 49.6% |
| Renter-Occupied Housing Units | 1,115 | 50.4% |
| Total Occupied Housing Units | 2,211 | 100.0% |
Occupancy by Household Size in South Hill
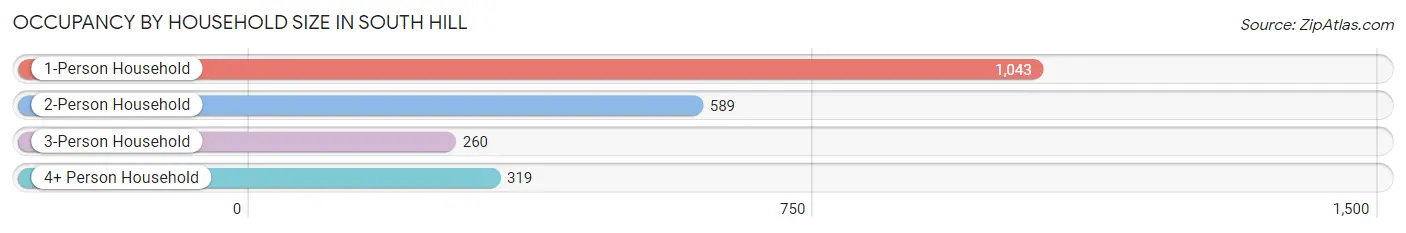
| Household Size | # Housing Units | % Housing Units |
| 1-Person Household | 1,043 | 47.2% |
| 2-Person Household | 589 | 26.6% |
| 3-Person Household | 260 | 11.8% |
| 4+ Person Household | 319 | 14.4% |
| Total Housing Units | 2,211 | 100.0% |
Occupancy by Ownership by Household Size in South Hill
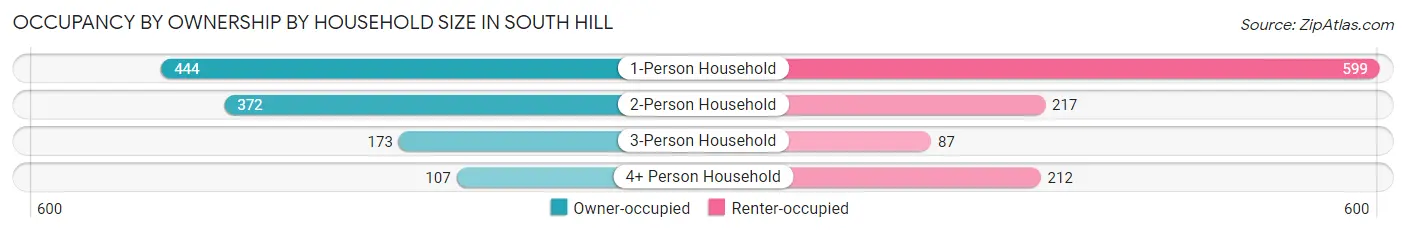
| Household Size | Owner-occupied | Renter-occupied |
| 1-Person Household | 444 (42.6%) | 599 (57.4%) |
| 2-Person Household | 372 (63.2%) | 217 (36.8%) |
| 3-Person Household | 173 (66.5%) | 87 (33.5%) |
| 4+ Person Household | 107 (33.5%) | 212 (66.5%) |
| Total Housing Units | 1,096 (49.6%) | 1,115 (50.4%) |
Occupancy by Educational Attainment in South Hill
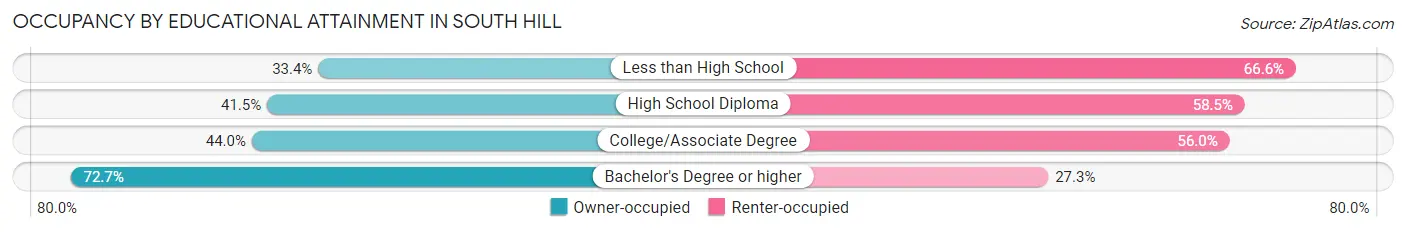
| Household Size | Owner-occupied | Renter-occupied |
| Less than High School | 114 (33.4%) | 227 (66.6%) |
| High School Diploma | 275 (41.5%) | 387 (58.5%) |
| College/Associate Degree | 262 (44.0%) | 334 (56.0%) |
| Bachelor's Degree or higher | 445 (72.7%) | 167 (27.3%) |
Occupancy by Age of Householder in South Hill
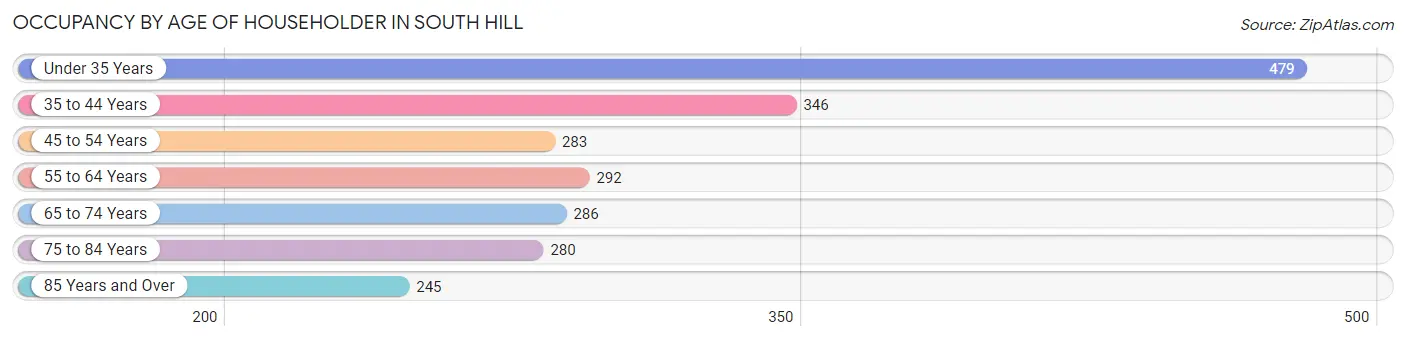
| Age Bracket | # Households | % Households |
| Under 35 Years | 479 | 21.7% |
| 35 to 44 Years | 346 | 15.7% |
| 45 to 54 Years | 283 | 12.8% |
| 55 to 64 Years | 292 | 13.2% |
| 65 to 74 Years | 286 | 12.9% |
| 75 to 84 Years | 280 | 12.7% |
| 85 Years and Over | 245 | 11.1% |
| Total | 2,211 | 100.0% |
Housing Finances in South Hill
Median Income by Occupancy in South Hill
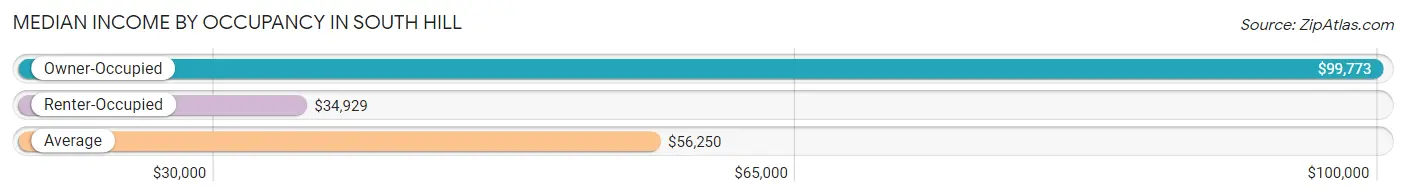
| Occupancy Type | # Households | Median Income |
| Owner-Occupied | 1,096 (49.6%) | $99,773 |
| Renter-Occupied | 1,115 (50.4%) | $34,929 |
| Average | 2,211 (100.0%) | $56,250 |
Occupancy by Householder Income Bracket in South Hill
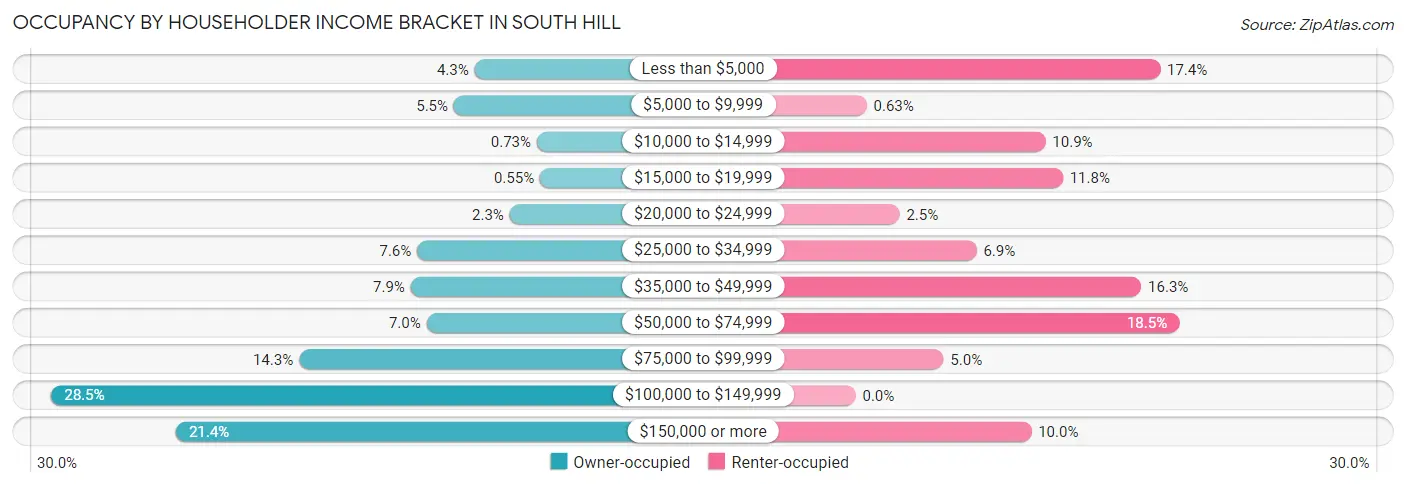
| Income Bracket | Owner-occupied | Renter-occupied |
| Less than $5,000 | 47 (4.3%) | 194 (17.4%) |
| $5,000 to $9,999 | 60 (5.5%) | 7 (0.6%) |
| $10,000 to $14,999 | 8 (0.7%) | 121 (10.8%) |
| $15,000 to $19,999 | 6 (0.5%) | 132 (11.8%) |
| $20,000 to $24,999 | 25 (2.3%) | 28 (2.5%) |
| $25,000 to $34,999 | 83 (7.6%) | 77 (6.9%) |
| $35,000 to $49,999 | 87 (7.9%) | 182 (16.3%) |
| $50,000 to $74,999 | 77 (7.0%) | 206 (18.5%) |
| $75,000 to $99,999 | 157 (14.3%) | 56 (5.0%) |
| $100,000 to $149,999 | 312 (28.5%) | 0 (0.0%) |
| $150,000 or more | 234 (21.3%) | 112 (10.0%) |
| Total | 1,096 (100.0%) | 1,115 (100.0%) |
Monthly Housing Cost Tiers in South Hill
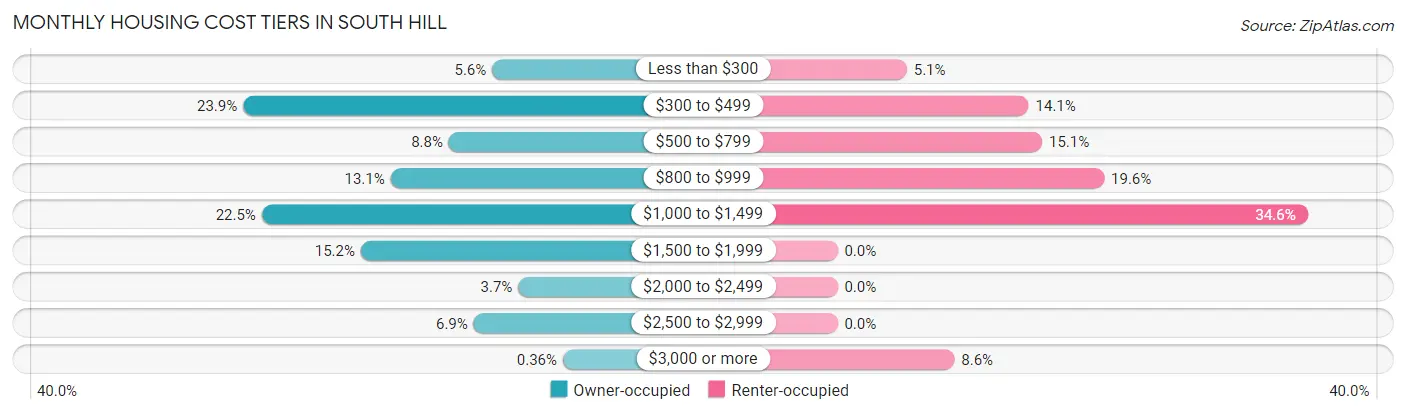
| Monthly Cost | Owner-occupied | Renter-occupied |
| Less than $300 | 61 (5.6%) | 57 (5.1%) |
| $300 to $499 | 262 (23.9%) | 157 (14.1%) |
| $500 to $799 | 96 (8.8%) | 168 (15.1%) |
| $800 to $999 | 143 (13.1%) | 219 (19.6%) |
| $1,000 to $1,499 | 247 (22.5%) | 386 (34.6%) |
| $1,500 to $1,999 | 167 (15.2%) | 0 (0.0%) |
| $2,000 to $2,499 | 40 (3.6%) | 0 (0.0%) |
| $2,500 to $2,999 | 76 (6.9%) | 0 (0.0%) |
| $3,000 or more | 4 (0.4%) | 96 (8.6%) |
| Total | 1,096 (100.0%) | 1,115 (100.0%) |
Physical Housing Characteristics in South Hill
Housing Structures in South Hill
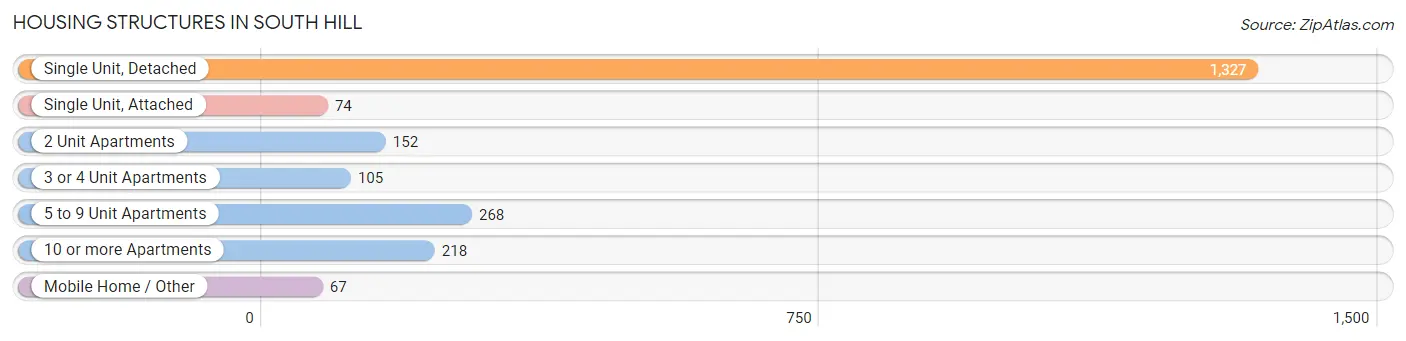
| Structure Type | # Housing Units | % Housing Units |
| Single Unit, Detached | 1,327 | 60.0% |
| Single Unit, Attached | 74 | 3.4% |
| 2 Unit Apartments | 152 | 6.9% |
| 3 or 4 Unit Apartments | 105 | 4.8% |
| 5 to 9 Unit Apartments | 268 | 12.1% |
| 10 or more Apartments | 218 | 9.9% |
| Mobile Home / Other | 67 | 3.0% |
| Total | 2,211 | 100.0% |
Housing Structures by Occupancy in South Hill
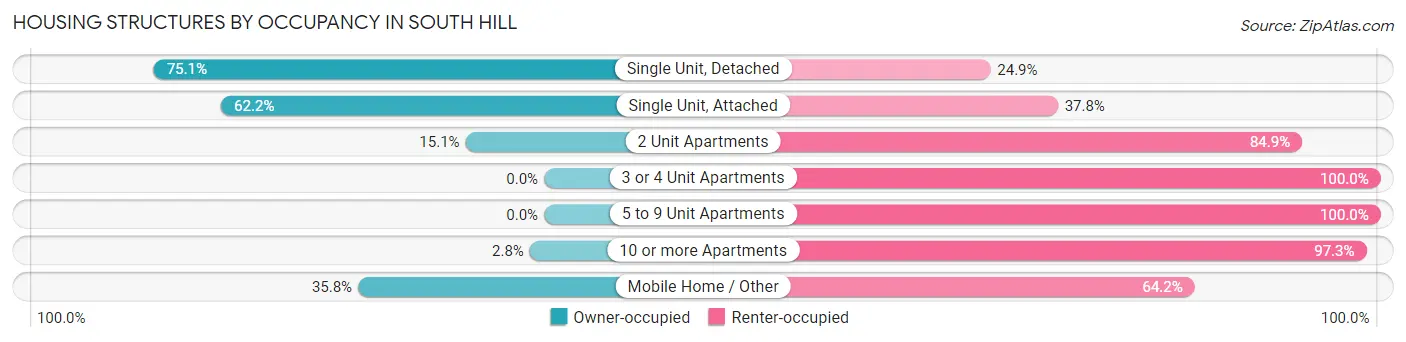
| Structure Type | Owner-occupied | Renter-occupied |
| Single Unit, Detached | 997 (75.1%) | 330 (24.9%) |
| Single Unit, Attached | 46 (62.2%) | 28 (37.8%) |
| 2 Unit Apartments | 23 (15.1%) | 129 (84.9%) |
| 3 or 4 Unit Apartments | 0 (0.0%) | 105 (100.0%) |
| 5 to 9 Unit Apartments | 0 (0.0%) | 268 (100.0%) |
| 10 or more Apartments | 6 (2.8%) | 212 (97.3%) |
| Mobile Home / Other | 24 (35.8%) | 43 (64.2%) |
| Total | 1,096 (49.6%) | 1,115 (50.4%) |
Housing Structures by Number of Rooms in South Hill
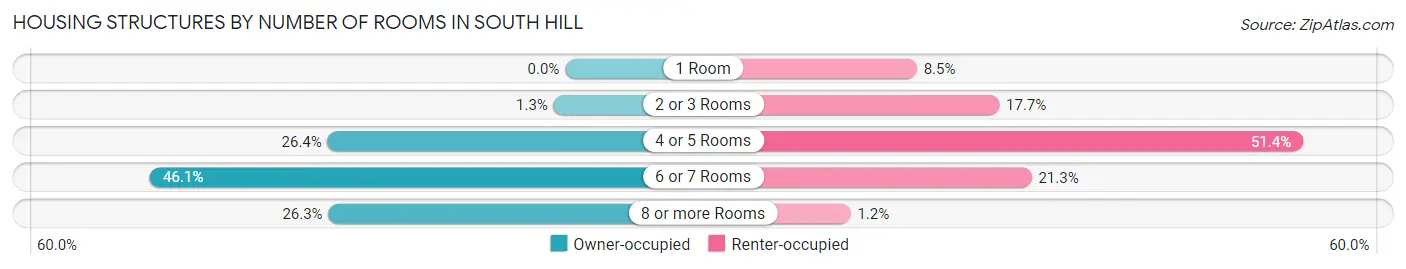
| Number of Rooms | Owner-occupied | Renter-occupied |
| 1 Room | 0 (0.0%) | 95 (8.5%) |
| 2 or 3 Rooms | 14 (1.3%) | 197 (17.7%) |
| 4 or 5 Rooms | 289 (26.4%) | 573 (51.4%) |
| 6 or 7 Rooms | 505 (46.1%) | 237 (21.3%) |
| 8 or more Rooms | 288 (26.3%) | 13 (1.2%) |
| Total | 1,096 (100.0%) | 1,115 (100.0%) |
Housing Structure by Heating Type in South Hill
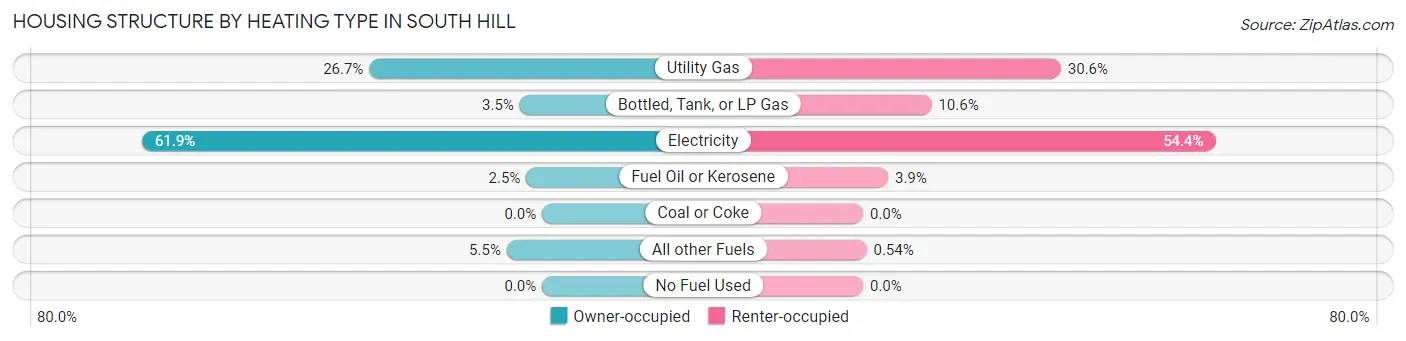
| Heating Type | Owner-occupied | Renter-occupied |
| Utility Gas | 293 (26.7%) | 341 (30.6%) |
| Bottled, Tank, or LP Gas | 38 (3.5%) | 118 (10.6%) |
| Electricity | 678 (61.9%) | 607 (54.4%) |
| Fuel Oil or Kerosene | 27 (2.5%) | 43 (3.9%) |
| Coal or Coke | 0 (0.0%) | 0 (0.0%) |
| All other Fuels | 60 (5.5%) | 6 (0.5%) |
| No Fuel Used | 0 (0.0%) | 0 (0.0%) |
| Total | 1,096 (100.0%) | 1,115 (100.0%) |
Household Vehicle Usage in South Hill
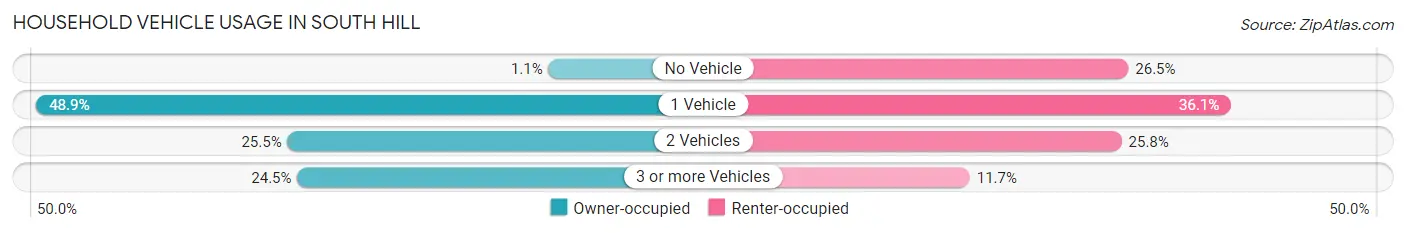
| Vehicles per Household | Owner-occupied | Renter-occupied |
| No Vehicle | 12 (1.1%) | 295 (26.5%) |
| 1 Vehicle | 536 (48.9%) | 402 (36.0%) |
| 2 Vehicles | 279 (25.5%) | 288 (25.8%) |
| 3 or more Vehicles | 269 (24.5%) | 130 (11.7%) |
| Total | 1,096 (100.0%) | 1,115 (100.0%) |
Real Estate & Mortgages in South Hill
Real Estate and Mortgage Overview in South Hill
| Characteristic | Without Mortgage | With Mortgage |
| Housing Units | 391 | 705 |
| Median Property Value | $149,200 | $200,300 |
| Median Household Income | - | - |
| Monthly Housing Costs | $399 | $4 |
| Real Estate Taxes | $698 | $24 |
Property Value by Mortgage Status in South Hill
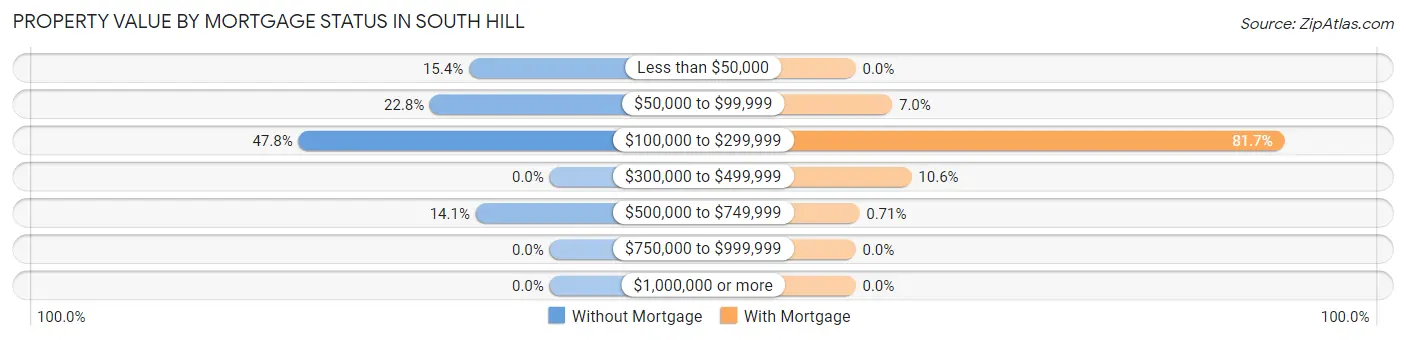
| Property Value | Without Mortgage | With Mortgage |
| Less than $50,000 | 60 (15.3%) | 0 (0.0%) |
| $50,000 to $99,999 | 89 (22.8%) | 49 (7.0%) |
| $100,000 to $299,999 | 187 (47.8%) | 576 (81.7%) |
| $300,000 to $499,999 | 0 (0.0%) | 75 (10.6%) |
| $500,000 to $749,999 | 55 (14.1%) | 5 (0.7%) |
| $750,000 to $999,999 | 0 (0.0%) | 0 (0.0%) |
| $1,000,000 or more | 0 (0.0%) | 0 (0.0%) |
| Total | 391 (100.0%) | 705 (100.0%) |
Household Income by Mortgage Status in South Hill
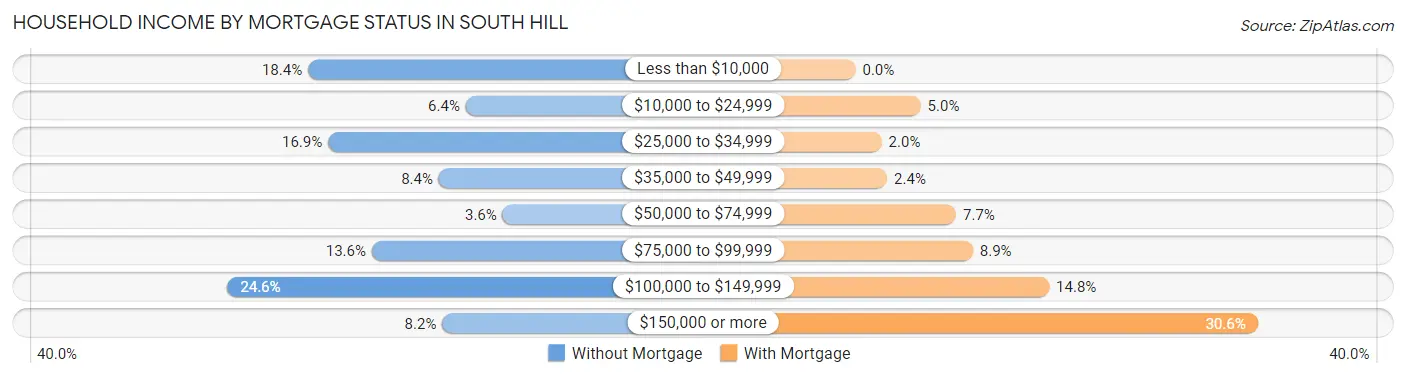
| Household Income | Without Mortgage | With Mortgage |
| Less than $10,000 | 72 (18.4%) | 0 (0.0%) |
| $10,000 to $24,999 | 25 (6.4%) | 35 (5.0%) |
| $25,000 to $34,999 | 66 (16.9%) | 14 (2.0%) |
| $35,000 to $49,999 | 33 (8.4%) | 17 (2.4%) |
| $50,000 to $74,999 | 14 (3.6%) | 54 (7.7%) |
| $75,000 to $99,999 | 53 (13.6%) | 63 (8.9%) |
| $100,000 to $149,999 | 96 (24.5%) | 104 (14.7%) |
| $150,000 or more | 32 (8.2%) | 216 (30.6%) |
| Total | 391 (100.0%) | 705 (100.0%) |
Property Value to Household Income Ratio in South Hill
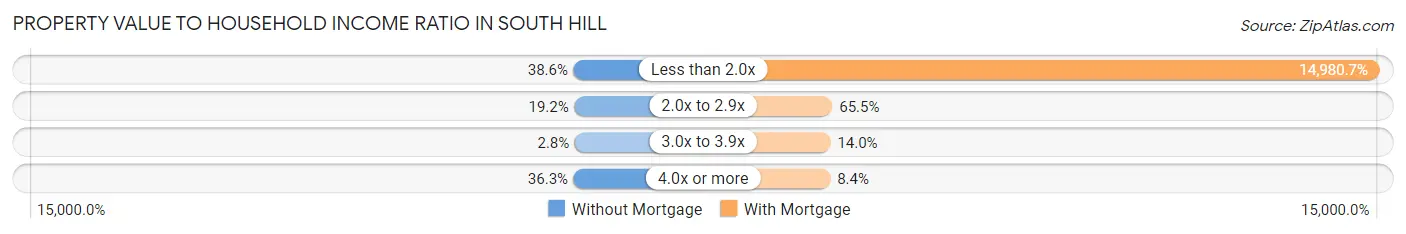
| Value-to-Income Ratio | Without Mortgage | With Mortgage |
| Less than 2.0x | 151 (38.6%) | 105,614 (14,980.7%) |
| 2.0x to 2.9x | 75 (19.2%) | 462 (65.5%) |
| 3.0x to 3.9x | 11 (2.8%) | 99 (14.0%) |
| 4.0x or more | 142 (36.3%) | 59 (8.4%) |
| Total | 391 (100.0%) | 705 (100.0%) |
Real Estate Taxes by Mortgage Status in South Hill
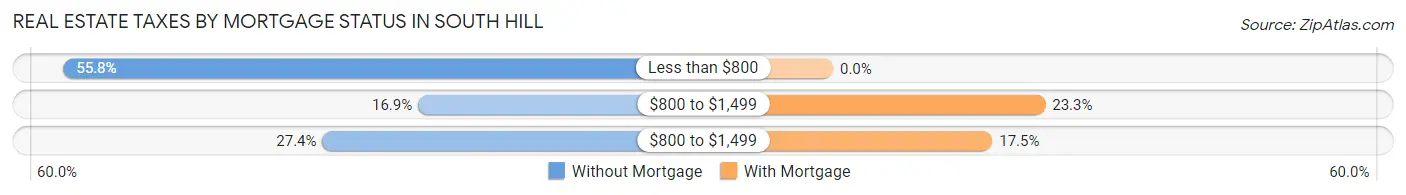
| Property Taxes | Without Mortgage | With Mortgage |
| Less than $800 | 218 (55.7%) | 0 (0.0%) |
| $800 to $1,499 | 66 (16.9%) | 164 (23.3%) |
| $800 to $1,499 | 107 (27.4%) | 123 (17.4%) |
| Total | 391 (100.0%) | 705 (100.0%) |
Health & Disability in South Hill
Health Insurance Coverage by Age in South Hill
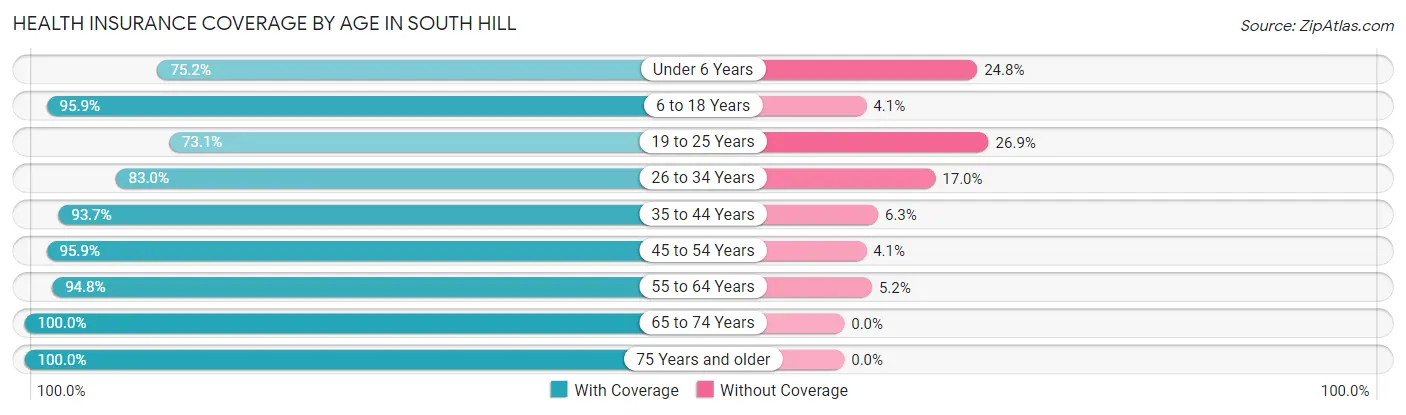
| Age Bracket | With Coverage | Without Coverage |
| Under 6 Years | 182 (75.2%) | 60 (24.8%) |
| 6 to 18 Years | 699 (95.9%) | 30 (4.1%) |
| 19 to 25 Years | 410 (73.1%) | 151 (26.9%) |
| 26 to 34 Years | 489 (83.0%) | 100 (17.0%) |
| 35 to 44 Years | 462 (93.7%) | 31 (6.3%) |
| 45 to 54 Years | 422 (95.9%) | 18 (4.1%) |
| 55 to 64 Years | 441 (94.8%) | 24 (5.2%) |
| 65 to 74 Years | 447 (100.0%) | 0 (0.0%) |
| 75 Years and older | 608 (100.0%) | 0 (0.0%) |
| Total | 4,160 (90.9%) | 414 (9.0%) |
Health Insurance Coverage by Citizenship Status in South Hill
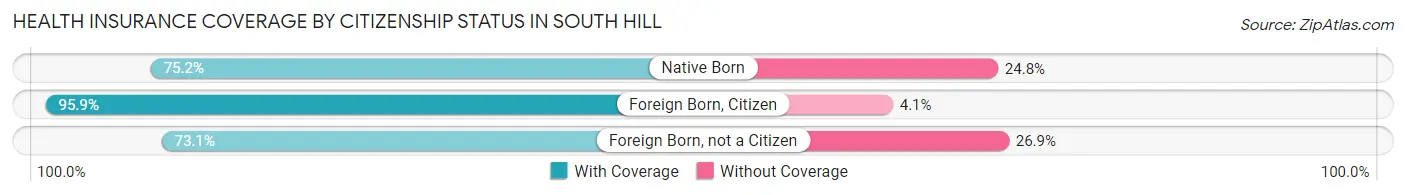
| Citizenship Status | With Coverage | Without Coverage |
| Native Born | 182 (75.2%) | 60 (24.8%) |
| Foreign Born, Citizen | 699 (95.9%) | 30 (4.1%) |
| Foreign Born, not a Citizen | 410 (73.1%) | 151 (26.9%) |
Health Insurance Coverage by Household Income in South Hill
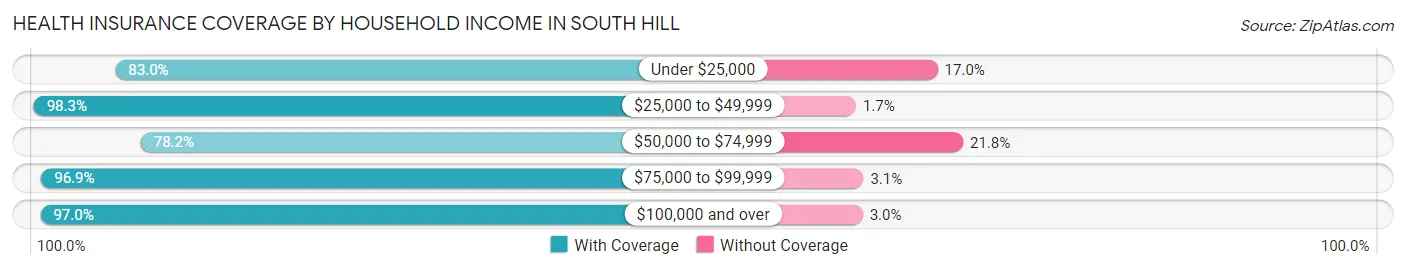
| Household Income | With Coverage | Without Coverage |
| Under $25,000 | 741 (83.0%) | 152 (17.0%) |
| $25,000 to $49,999 | 687 (98.3%) | 12 (1.7%) |
| $50,000 to $74,999 | 668 (78.2%) | 186 (21.8%) |
| $75,000 to $99,999 | 526 (96.9%) | 17 (3.1%) |
| $100,000 and over | 1,529 (97.0%) | 47 (3.0%) |
Public vs Private Health Insurance Coverage by Age in South Hill
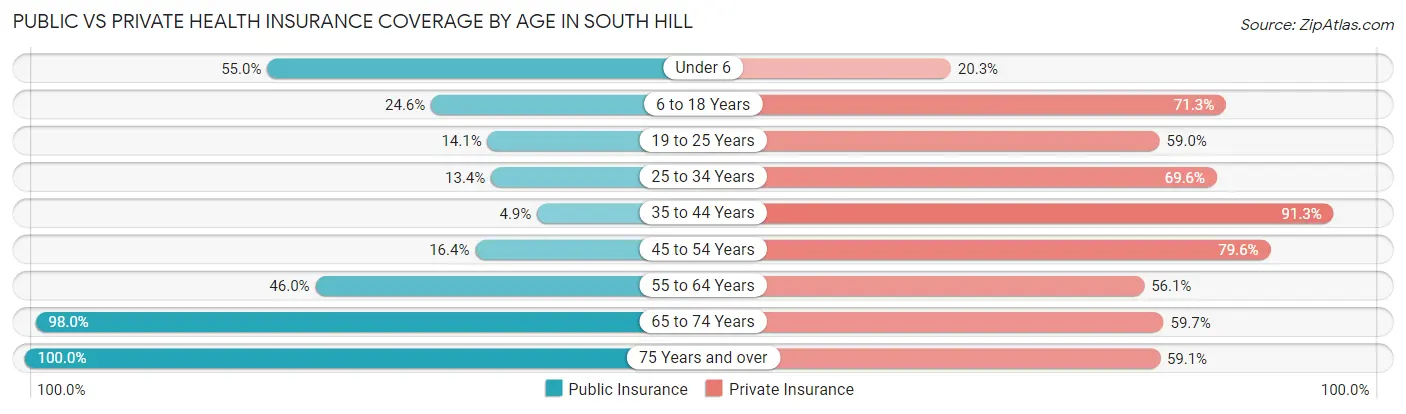
| Age Bracket | Public Insurance | Private Insurance |
| Under 6 | 133 (55.0%) | 49 (20.3%) |
| 6 to 18 Years | 179 (24.5%) | 520 (71.3%) |
| 19 to 25 Years | 79 (14.1%) | 331 (59.0%) |
| 25 to 34 Years | 79 (13.4%) | 410 (69.6%) |
| 35 to 44 Years | 24 (4.9%) | 450 (91.3%) |
| 45 to 54 Years | 72 (16.4%) | 350 (79.5%) |
| 55 to 64 Years | 214 (46.0%) | 261 (56.1%) |
| 65 to 74 Years | 438 (98.0%) | 267 (59.7%) |
| 75 Years and over | 608 (100.0%) | 359 (59.1%) |
| Total | 1,826 (39.9%) | 2,997 (65.5%) |
Disability Status by Sex by Age in South Hill
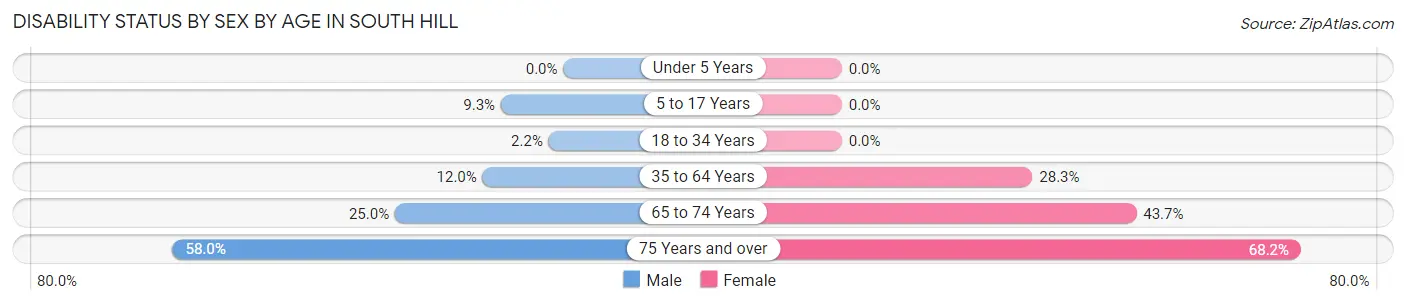
| Age Bracket | Male | Female |
| Under 5 Years | 0 (0.0%) | 0 (0.0%) |
| 5 to 17 Years | 52 (9.3%) | 0 (0.0%) |
| 18 to 34 Years | 18 (2.2%) | 0 (0.0%) |
| 35 to 64 Years | 85 (12.0%) | 195 (28.3%) |
| 65 to 74 Years | 34 (25.0%) | 136 (43.7%) |
| 75 Years and over | 94 (58.0%) | 304 (68.2%) |
Disability Class by Sex by Age in South Hill
Disability Class: Hearing Difficulty
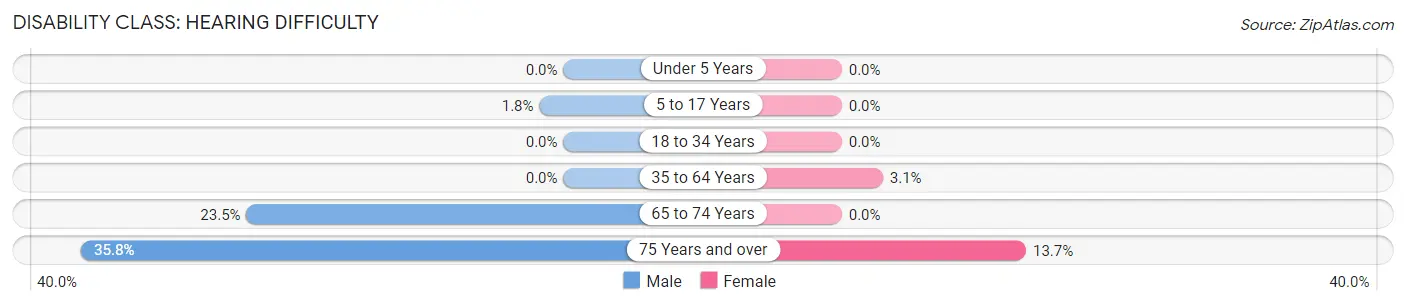
| Age Bracket | Male | Female |
| Under 5 Years | 0 (0.0%) | 0 (0.0%) |
| 5 to 17 Years | 10 (1.8%) | 0 (0.0%) |
| 18 to 34 Years | 0 (0.0%) | 0 (0.0%) |
| 35 to 64 Years | 0 (0.0%) | 21 (3.0%) |
| 65 to 74 Years | 32 (23.5%) | 0 (0.0%) |
| 75 Years and over | 58 (35.8%) | 61 (13.7%) |
Disability Class: Vision Difficulty
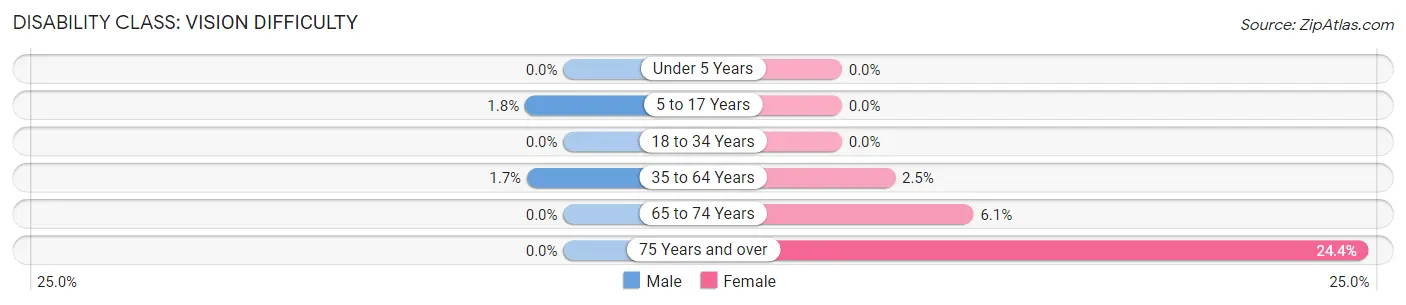
| Age Bracket | Male | Female |
| Under 5 Years | 0 (0.0%) | 0 (0.0%) |
| 5 to 17 Years | 10 (1.8%) | 0 (0.0%) |
| 18 to 34 Years | 0 (0.0%) | 0 (0.0%) |
| 35 to 64 Years | 12 (1.7%) | 17 (2.5%) |
| 65 to 74 Years | 0 (0.0%) | 19 (6.1%) |
| 75 Years and over | 0 (0.0%) | 109 (24.4%) |
Disability Class: Cognitive Difficulty
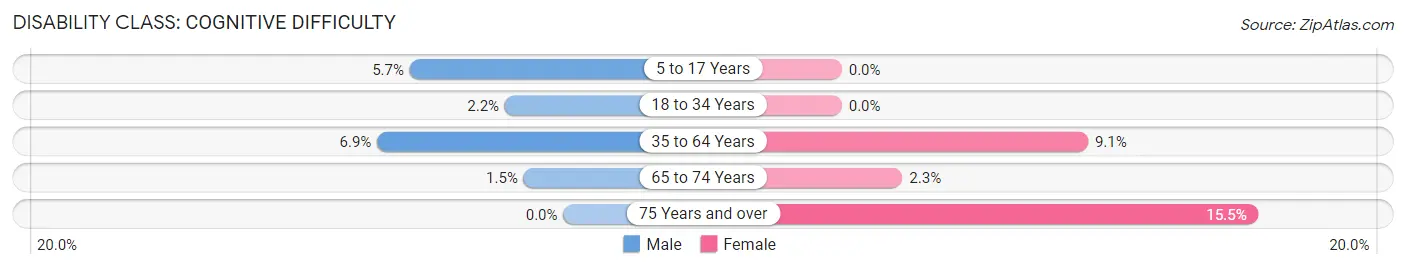
| Age Bracket | Male | Female |
| 5 to 17 Years | 32 (5.7%) | 0 (0.0%) |
| 18 to 34 Years | 18 (2.2%) | 0 (0.0%) |
| 35 to 64 Years | 49 (6.9%) | 63 (9.1%) |
| 65 to 74 Years | 2 (1.5%) | 7 (2.2%) |
| 75 Years and over | 0 (0.0%) | 69 (15.5%) |
Disability Class: Ambulatory Difficulty
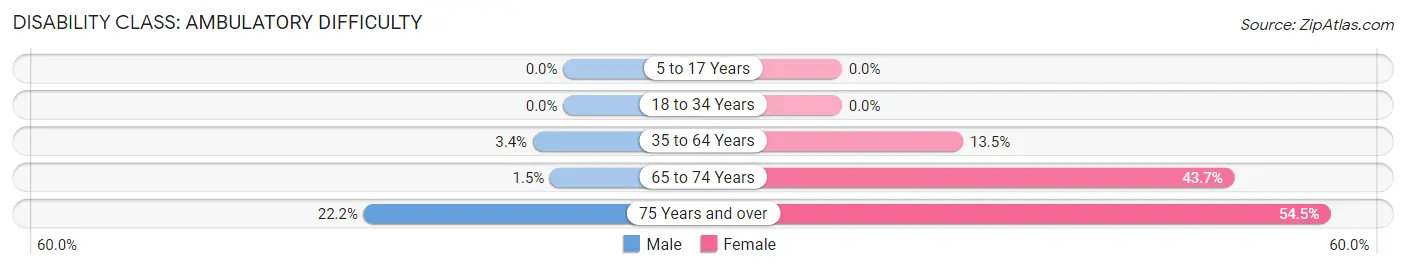
| Age Bracket | Male | Female |
| 5 to 17 Years | 0 (0.0%) | 0 (0.0%) |
| 18 to 34 Years | 0 (0.0%) | 0 (0.0%) |
| 35 to 64 Years | 24 (3.4%) | 93 (13.5%) |
| 65 to 74 Years | 2 (1.5%) | 136 (43.7%) |
| 75 Years and over | 36 (22.2%) | 243 (54.5%) |
Disability Class: Self-Care Difficulty
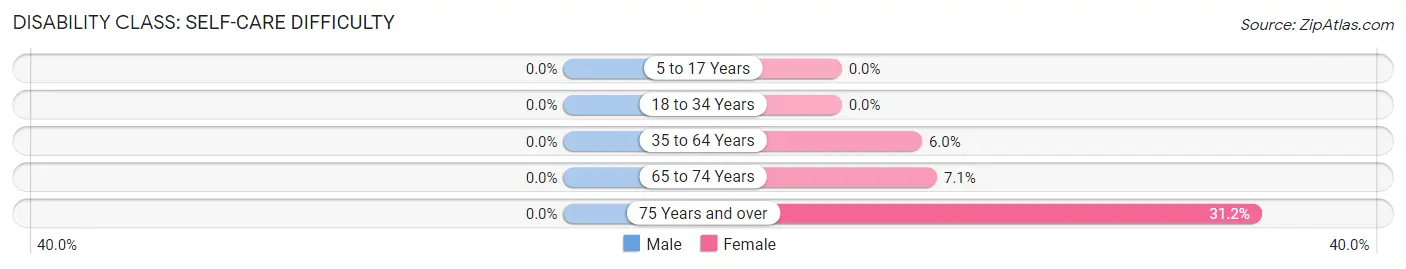
| Age Bracket | Male | Female |
| 5 to 17 Years | 0 (0.0%) | 0 (0.0%) |
| 18 to 34 Years | 0 (0.0%) | 0 (0.0%) |
| 35 to 64 Years | 0 (0.0%) | 41 (5.9%) |
| 65 to 74 Years | 0 (0.0%) | 22 (7.1%) |
| 75 Years and over | 0 (0.0%) | 139 (31.2%) |
Technology Access in South Hill
Computing Device Access in South Hill
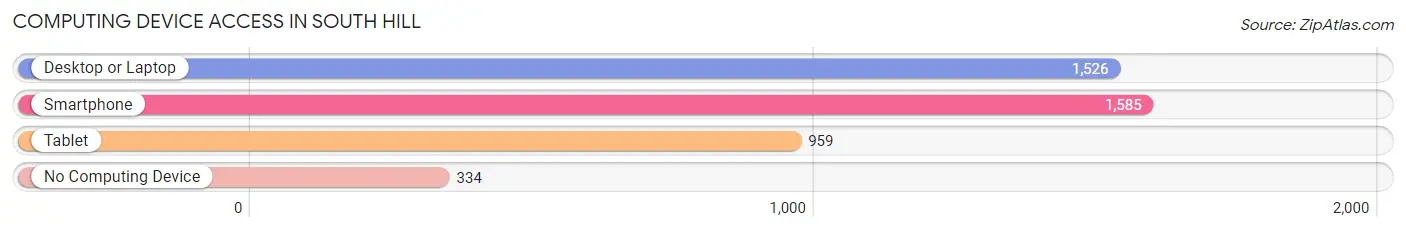
| Device Type | # Households | % Households |
| Desktop or Laptop | 1,526 | 69.0% |
| Smartphone | 1,585 | 71.7% |
| Tablet | 959 | 43.4% |
| No Computing Device | 334 | 15.1% |
| Total | 2,211 | 100.0% |
Internet Access in South Hill
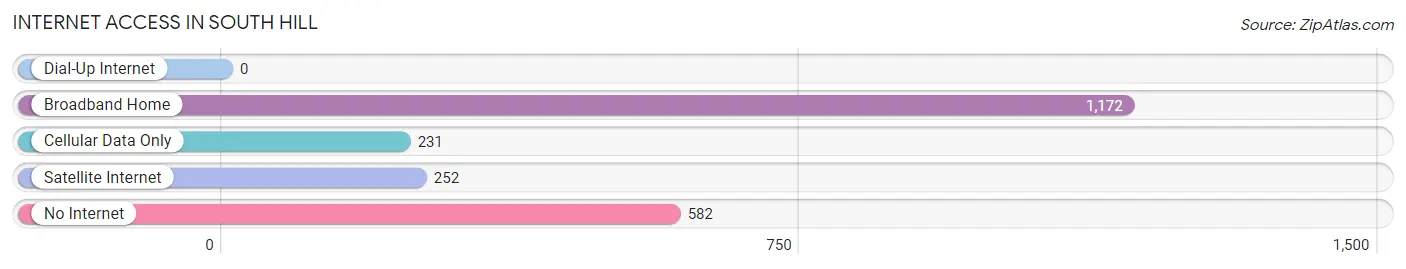
| Internet Type | # Households | % Households |
| Dial-Up Internet | 0 | 0.0% |
| Broadband Home | 1,172 | 53.0% |
| Cellular Data Only | 231 | 10.4% |
| Satellite Internet | 252 | 11.4% |
| No Internet | 582 | 26.3% |
| Total | 2,211 | 100.0% |
South Hill Summary
History
South Hill is a town located in Mecklenburg County, Virginia. It is situated in the south-central part of the state, approximately 70 miles south of Richmond and 50 miles north of Raleigh, North Carolina. The town was founded in 1803 and incorporated in 1887. It is the county seat of Mecklenburg County and is home to a population of approximately 4,500 people.
The town of South Hill was originally known as “The Crossroads” due to its location at the intersection of two major roads. The first road was the Halifax-Petersburg Turnpike, which was built in 1803 and connected the towns of Halifax and Petersburg. The second road was the Southside Railroad, which was built in 1854 and connected the towns of Petersburg and Lynchburg.
The town was officially incorporated in 1887 and was named after the nearby South Hill Plantation, which was owned by the prominent local family of the same name. The plantation was established in 1790 and was home to a large number of slaves.
The town of South Hill experienced a period of growth and prosperity in the late 19th and early 20th centuries. The town was home to a number of businesses, including a cotton mill, a tobacco warehouse, a furniture factory, and a canning factory. The town also had a number of churches, schools, and other civic organizations.
Geography
South Hill is located in Mecklenburg County, Virginia. It is situated in the south-central part of the state, approximately 70 miles south of Richmond and 50 miles north of Raleigh, North Carolina. The town is located at the intersection of two major roads, the Halifax-Petersburg Turnpike and the Southside Railroad.
The town is situated on a plateau that is surrounded by rolling hills and valleys. The terrain is mostly flat, with some areas of gently rolling hills. The town is located in the Piedmont region of Virginia, which is characterized by a humid subtropical climate.
The town is located in the Roanoke River watershed, which is part of the larger Chesapeake Bay watershed. The Roanoke River flows through the town and is a major source of water for the area.
Economy
The economy of South Hill is largely based on agriculture and manufacturing. The town is home to a number of farms, which produce a variety of crops, including corn, soybeans, wheat, and tobacco. The town is also home to a number of manufacturing businesses, including a furniture factory, a canning factory, and a tobacco warehouse.
The town is also home to a number of retail businesses, including a grocery store, a hardware store, and a number of restaurants. The town is also home to a number of professional services, including a bank, a post office, and a number of medical offices.
Demographics
As of the 2010 census, the town of South Hill had a population of 4,500 people. The racial makeup of the town was 79.2% White, 17.2% African American, 0.7% Native American, 0.4% Asian, 0.1% Pacific Islander, and 2.4% from other races. The median household income was $37,917, and the median family income was $45,938.
The town is home to a number of churches, including Baptist, Methodist, Presbyterian, and Episcopal. The town is also home to a number of civic organizations, including the South Hill Lions Club, the South Hill Rotary Club, and the South Hill Chamber of Commerce.
Conclusion
South Hill is a small town located in Mecklenburg County, Virginia. It is situated in the south-central part of the state, approximately 70 miles south of Richmond and 50 miles north of Raleigh, North Carolina. The town was founded in 1803 and incorporated in 1887. It is the county seat of Mecklenburg County and is home to a population of approximately 4,500 people. The town’s economy is largely based on agriculture and manufacturing, and it is home to a number of retail businesses, professional services, and civic organizations. The town is also home to a number of churches and is a part of the larger Roanoke River watershed.
Common Questions
What is Per Capita Income in South Hill?
Per Capita income in South Hill is $39,665.
What is the Median Family Income in South Hill?
Median Family Income in South Hill is $94,112.
What is the Median Household income in South Hill?
Median Household Income in South Hill is $56,250.
What is Income or Wage Gap in South Hill?
Income or Wage Gap in South Hill is 61.2%.
Women in South Hill earn 38.8 cents for every dollar earned by a man.
What is Inequality or Gini Index in South Hill?
Inequality or Gini Index in South Hill is 0.53.
What is the Total Population of South Hill?
Total Population of South Hill is 4,683.
What is the Total Male Population of South Hill?
Total Male Population of South Hill is 2,527.
What is the Total Female Population of South Hill?
Total Female Population of South Hill is 2,156.
What is the Ratio of Males per 100 Females in South Hill?
There are 117.21 Males per 100 Females in South Hill.
What is the Ratio of Females per 100 Males in South Hill?
There are 85.32 Females per 100 Males in South Hill.
What is the Median Population Age in South Hill?
Median Population Age in South Hill is 39.6 Years.
What is the Average Family Size in South Hill
Average Family Size in South Hill is 3.0 People.
What is the Average Household Size in South Hill
Average Household Size in South Hill is 2.1 People.
How Large is the Labor Force in South Hill?
There are 2,278 People in the Labor Forcein in South Hill.
What is the Percentage of People in the Labor Force in South Hill?
57.8% of People are in the Labor Force in South Hill.
What is the Unemployment Rate in South Hill?
Unemployment Rate in South Hill is 4.5%.