Zip Codes with the Highest Percentage of Population Employed in Architecture & Engineering in Springfield, VA
RELATED REPORTS & OPTIONS
Architecture & Engineering
Springfield
Compare Zip Codes
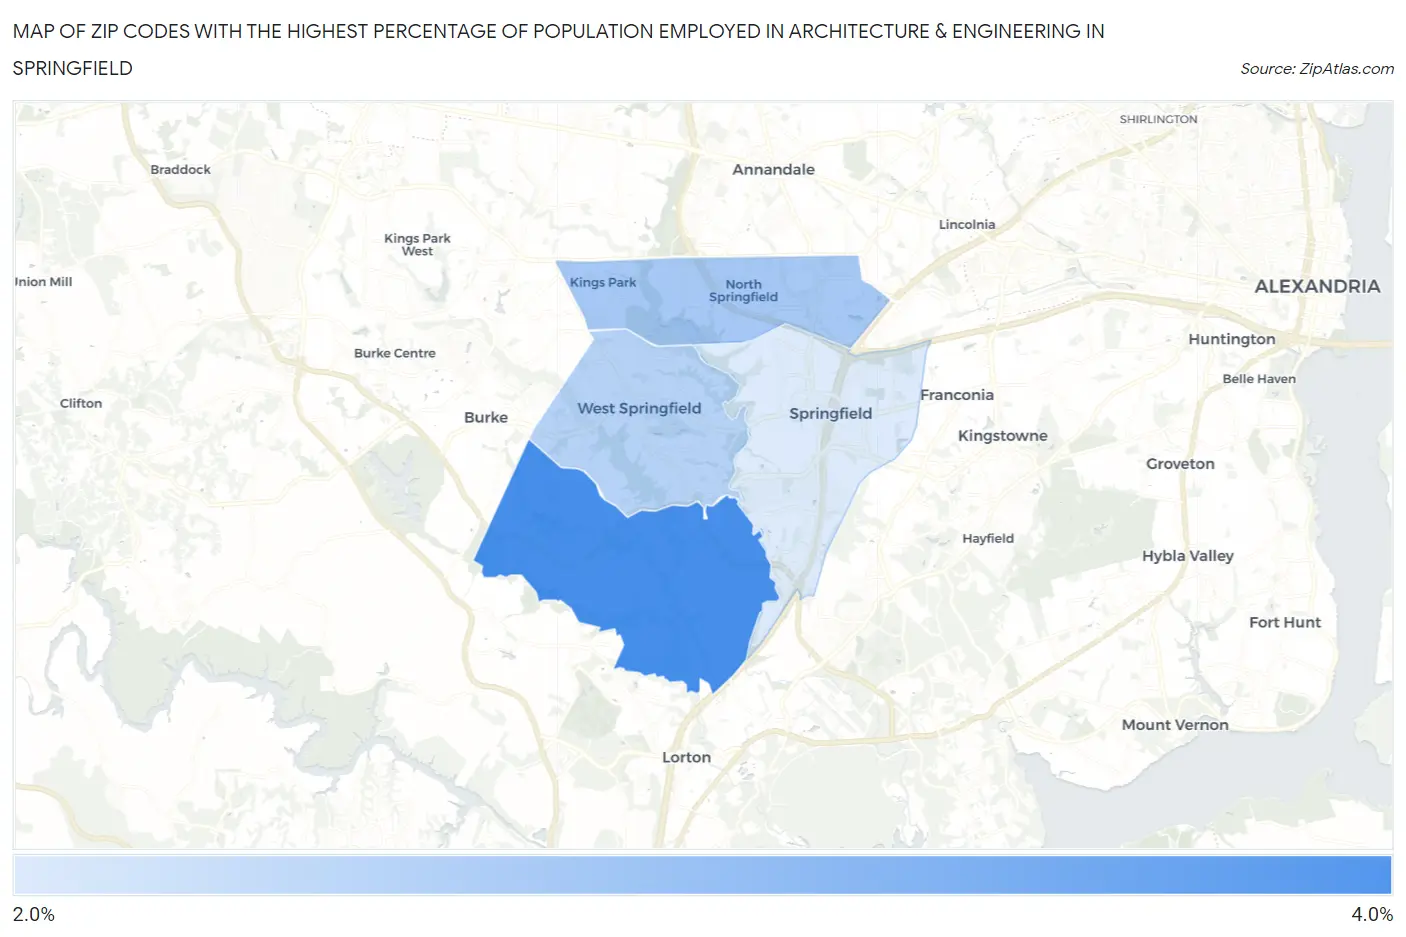
Map of Zip Codes with the Highest Percentage of Population Employed in Architecture & Engineering in Springfield
2.1%
3.7%
Zip Codes with the Highest Percentage of Population Employed in Architecture & Engineering in Springfield, VA
| Zip Code | % Employed | vs State | vs National | |
| 1. | 22153 | 3.7% | 2.3%(+1.43)#102 | 2.1%(+1.58)#3,234 |
| 2. | 22151 | 2.7% | 2.3%(+0.373)#184 | 2.1%(+0.528)#6,254 |
| 3. | 22152 | 2.5% | 2.3%(+0.216)#206 | 2.1%(+0.371)#6,909 |
| 4. | 22150 | 2.1% | 2.3%(-0.220)#263 | 2.1%(-0.064)#9,133 |
1
Common Questions
What are the Top 3 Zip Codes with the Highest Percentage of Population Employed in Architecture & Engineering in Springfield, VA?
Top 3 Zip Codes with the Highest Percentage of Population Employed in Architecture & Engineering in Springfield, VA are:
What zip code has the Highest Percentage of Population Employed in Architecture & Engineering in Springfield, VA?
22153 has the Highest Percentage of Population Employed in Architecture & Engineering in Springfield, VA with 3.7%.
What is the Percentage of Population Employed in Architecture & Engineering in Springfield, VA?
Percentage of Population Employed in Architecture & Engineering in Springfield is 1.9%.
What is the Percentage of Population Employed in Architecture & Engineering in Virginia?
Percentage of Population Employed in Architecture & Engineering in Virginia is 2.3%.
What is the Percentage of Population Employed in Architecture & Engineering in the United States?
Percentage of Population Employed in Architecture & Engineering in the United States is 2.1%.