Reston, VA Map & Demographics
Reston Map

Reston Overview
$75,953
PER CAPITA INCOME
$162,917
AVG FAMILY INCOME
$135,503
AVG HOUSEHOLD INCOME
39.1%
WAGE / INCOME GAP [ % ]
60.9¢/ $1
WAGE / INCOME GAP [ $ ]
$10,762
FAMILY INCOME DEFICIT
0.42
INEQUALITY / GINI INDEX
62,339
TOTAL POPULATION
30,148
MALE POPULATION
32,191
FEMALE POPULATION
93.65
MALES / 100 FEMALES
106.78
FEMALES / 100 MALES
40.1
MEDIAN AGE
2.9
AVG FAMILY SIZE
2.2
AVG HOUSEHOLD SIZE
38,258
LABOR FORCE [ PEOPLE ]
74.1%
PERCENT IN LABOR FORCE
4.3%
UNEMPLOYMENT RATE
Income in Reston
Income Overview in Reston
Per Capita Income in Reston is $75,953, while median incomes of families and households are $162,917 and $135,503 respectively.
| Characteristic | Number | Measure |
| Per Capita Income | 62,339 | $75,953 |
| Median Family Income | 15,931 | $162,917 |
| Mean Family Income | 15,931 | $196,572 |
| Median Household Income | 27,808 | $135,503 |
| Mean Household Income | 27,808 | $168,794 |
| Income Deficit | 15,931 | $10,762 |
| Wage / Income Gap (%) | 62,339 | 39.15% |
| Wage / Income Gap ($) | 62,339 | 60.85¢ per $1 |
| Gini / Inequality Index | 62,339 | 0.42 |
Earnings by Sex in Reston
Average Earnings in Reston are $75,554, $97,965 for men and $59,615 for women, a difference of 39.2%.
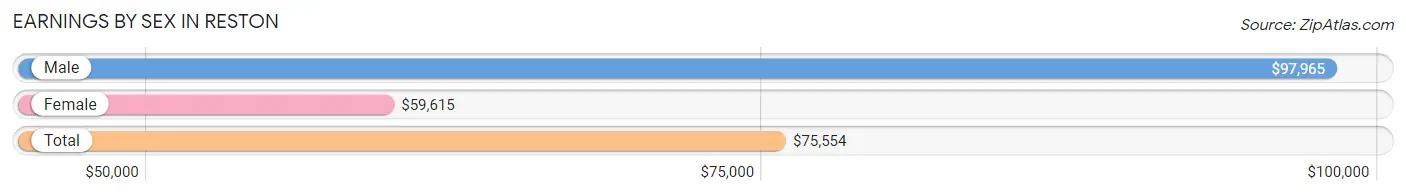
| Sex | Number | Average Earnings |
| Male | 20,002 (50.3%) | $97,965 |
| Female | 19,781 (49.7%) | $59,615 |
| Total | 39,783 (100.0%) | $75,554 |
Earnings by Sex by Income Bracket in Reston
The most common earnings brackets in Reston are $100,000+ for men (9,896 | 49.5%) and $100,000+ for women (5,615 | 28.4%).
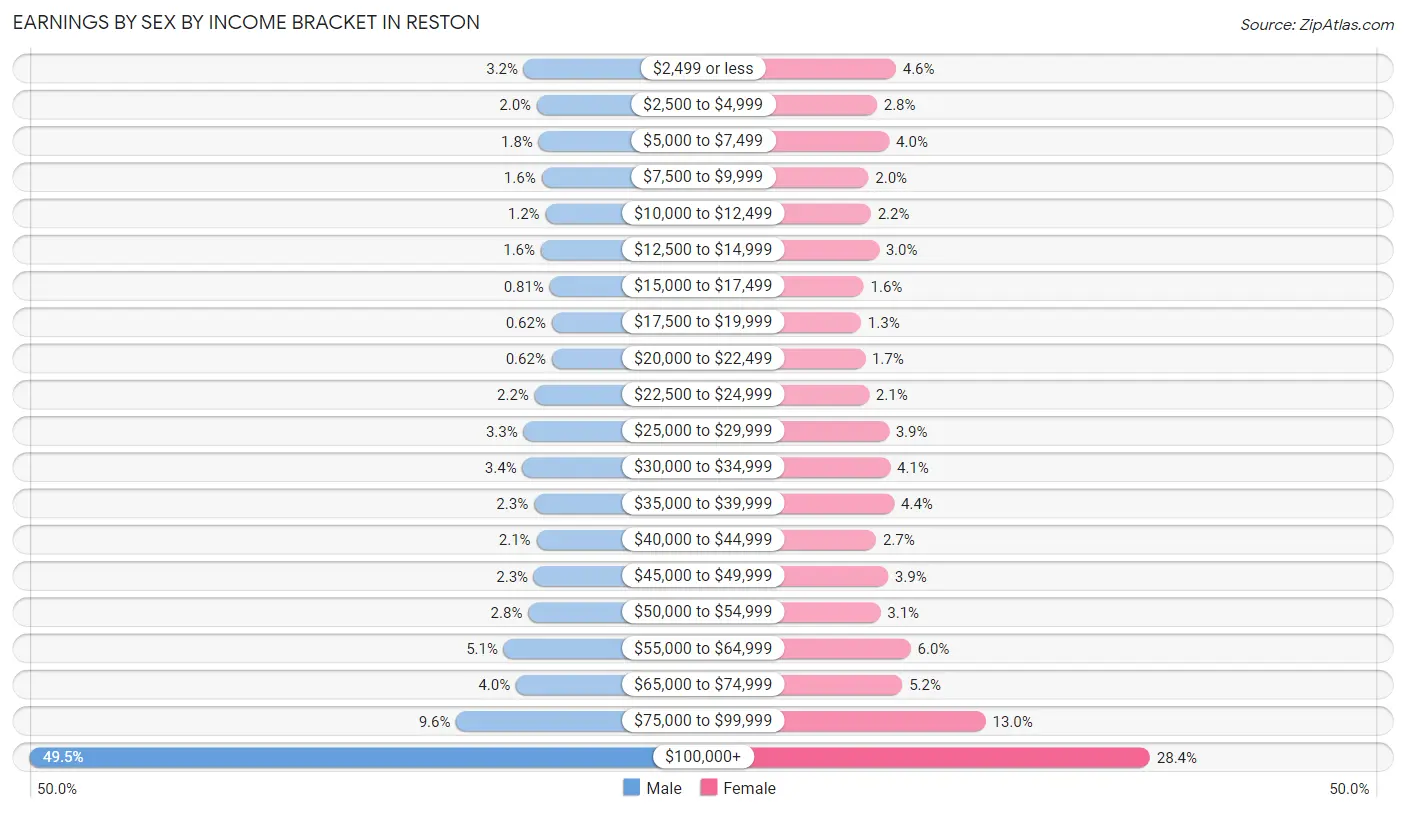
| Income | Male | Female |
| $2,499 or less | 647 (3.2%) | 908 (4.6%) |
| $2,500 to $4,999 | 403 (2.0%) | 556 (2.8%) |
| $5,000 to $7,499 | 368 (1.8%) | 786 (4.0%) |
| $7,500 to $9,999 | 316 (1.6%) | 399 (2.0%) |
| $10,000 to $12,499 | 242 (1.2%) | 444 (2.2%) |
| $12,500 to $14,999 | 329 (1.6%) | 591 (3.0%) |
| $15,000 to $17,499 | 162 (0.8%) | 311 (1.6%) |
| $17,500 to $19,999 | 124 (0.6%) | 262 (1.3%) |
| $20,000 to $22,499 | 124 (0.6%) | 337 (1.7%) |
| $22,500 to $24,999 | 444 (2.2%) | 410 (2.1%) |
| $25,000 to $29,999 | 652 (3.3%) | 778 (3.9%) |
| $30,000 to $34,999 | 673 (3.4%) | 802 (4.1%) |
| $35,000 to $39,999 | 457 (2.3%) | 876 (4.4%) |
| $40,000 to $44,999 | 411 (2.1%) | 541 (2.7%) |
| $45,000 to $49,999 | 459 (2.3%) | 762 (3.8%) |
| $50,000 to $54,999 | 564 (2.8%) | 622 (3.1%) |
| $55,000 to $64,999 | 1,023 (5.1%) | 1,183 (6.0%) |
| $65,000 to $74,999 | 795 (4.0%) | 1,027 (5.2%) |
| $75,000 to $99,999 | 1,913 (9.6%) | 2,571 (13.0%) |
| $100,000+ | 9,896 (49.5%) | 5,615 (28.4%) |
| Total | 20,002 (100.0%) | 19,781 (100.0%) |
Earnings by Sex by Educational Attainment in Reston
Average earnings in Reston are $107,500 for men and $67,638 for women, a difference of 37.1%. Men with an educational attainment of graduate degree enjoy the highest average annual earnings of $134,016, while those with less than high school education earn the least with $38,362. Women with an educational attainment of graduate degree earn the most with the average annual earnings of $95,796, while those with less than high school education have the smallest earnings of $23,138.
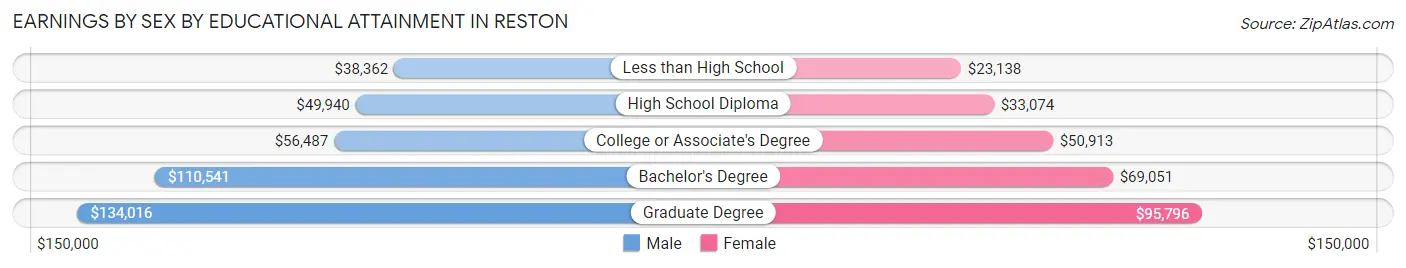
| Educational Attainment | Male Income | Female Income |
| Less than High School | $38,362 | $23,138 |
| High School Diploma | $49,940 | $33,074 |
| College or Associate's Degree | $56,487 | $50,913 |
| Bachelor's Degree | $110,541 | $69,051 |
| Graduate Degree | $134,016 | $95,796 |
| Total | $107,500 | $67,638 |
Family Income in Reston
Family Income Brackets in Reston
According to the Reston family income data, there are 6,054 families falling into the $200,000+ income range, which is the most common income bracket and makes up 38.0% of all families. Conversely, the $10,000 to $14,999 income bracket is the least frequent group with only 96 families (0.6%) belonging to this category.
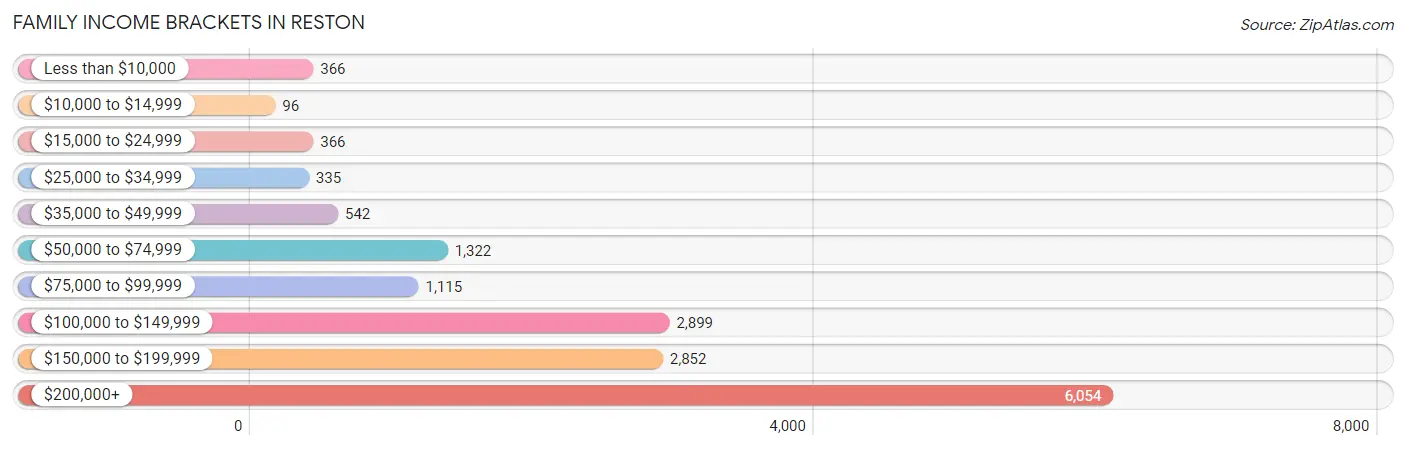
| Income Bracket | # Families | % Families |
| Less than $10,000 | 366 | 2.3% |
| $10,000 to $14,999 | 96 | 0.6% |
| $15,000 to $24,999 | 366 | 2.3% |
| $25,000 to $34,999 | 335 | 2.1% |
| $35,000 to $49,999 | 542 | 3.4% |
| $50,000 to $74,999 | 1,322 | 8.3% |
| $75,000 to $99,999 | 1,115 | 7.0% |
| $100,000 to $149,999 | 2,899 | 18.2% |
| $150,000 to $199,999 | 2,852 | 17.9% |
| $200,000+ | 6,054 | 38.0% |
Family Income by Famaliy Size in Reston
4-person families (2,509 | 15.8%) account for the highest median family income in Reston with $196,797 per family, while 2-person families (8,620 | 54.1%) have the highest median income of $80,730 per family member.
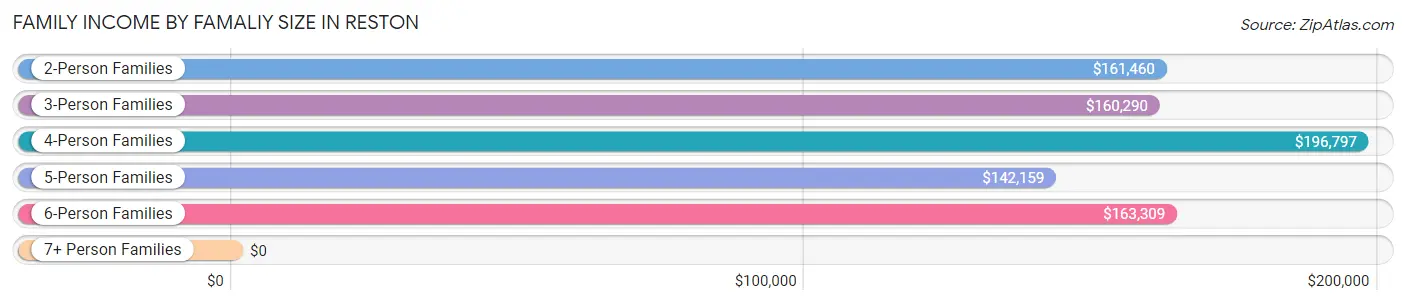
| Income Bracket | # Families | Median Income |
| 2-Person Families | 8,620 (54.1%) | $161,460 |
| 3-Person Families | 3,330 (20.9%) | $160,290 |
| 4-Person Families | 2,509 (15.8%) | $196,797 |
| 5-Person Families | 1,059 (6.7%) | $142,159 |
| 6-Person Families | 307 (1.9%) | $163,309 |
| 7+ Person Families | 106 (0.7%) | $0 |
| Total | 15,931 (100.0%) | $162,917 |
Family Income by Number of Earners in Reston
The median family income in Reston is $162,917, with families comprising 2 earners (8,278) having the highest median family income of $197,912, while families with no earners (1,613) have the lowest median family income of $96,375, accounting for 52.0% and 10.1% of families, respectively.
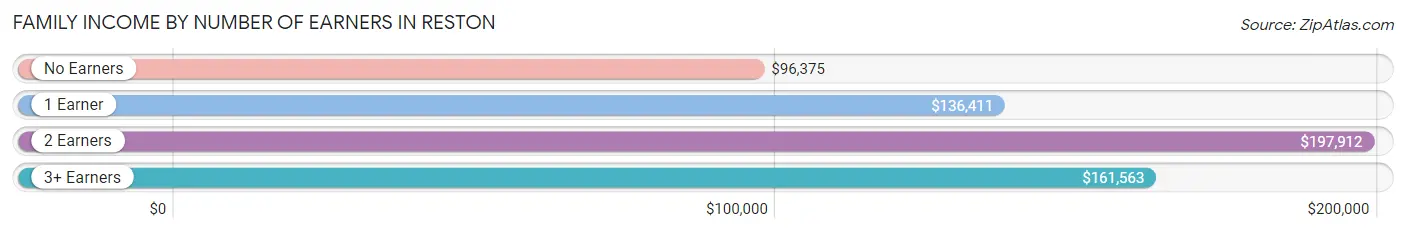
| Number of Earners | # Families | Median Income |
| No Earners | 1,613 (10.1%) | $96,375 |
| 1 Earner | 4,401 (27.6%) | $136,411 |
| 2 Earners | 8,278 (52.0%) | $197,912 |
| 3+ Earners | 1,639 (10.3%) | $161,563 |
| Total | 15,931 (100.0%) | $162,917 |
Household Income in Reston
Household Income Brackets in Reston
With 7,925 households falling in the category, the $200,000+ income range is the most frequent in Reston, accounting for 28.5% of all households. In contrast, only 501 households (1.8%) fall into the $10,000 to $14,999 income bracket, making it the least populous group.
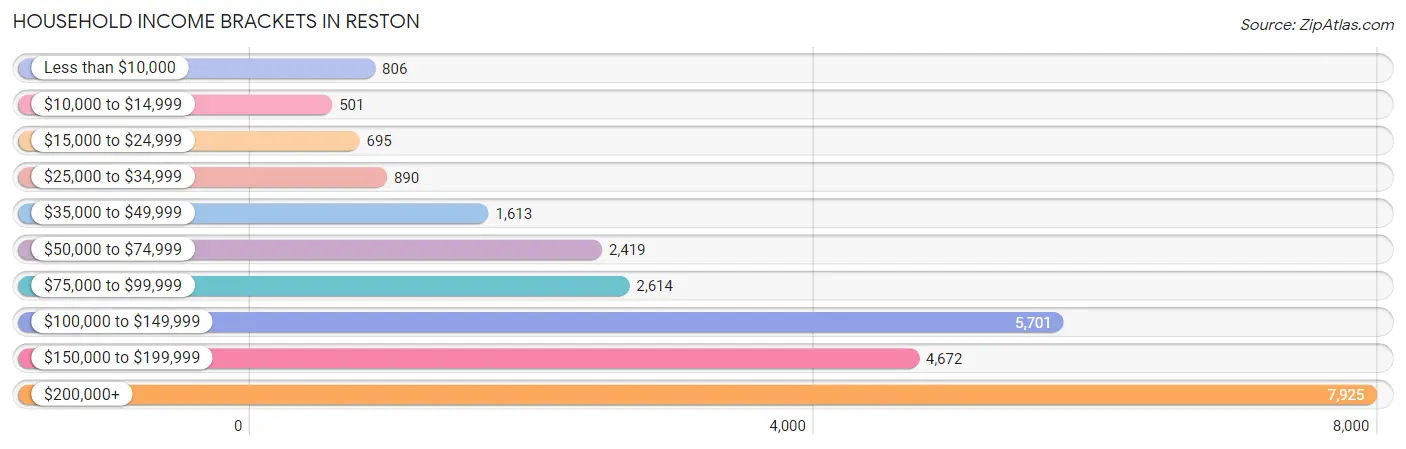
| Income Bracket | # Households | % Households |
| Less than $10,000 | 806 | 2.9% |
| $10,000 to $14,999 | 501 | 1.8% |
| $15,000 to $24,999 | 695 | 2.5% |
| $25,000 to $34,999 | 890 | 3.2% |
| $35,000 to $49,999 | 1,613 | 5.8% |
| $50,000 to $74,999 | 2,419 | 8.7% |
| $75,000 to $99,999 | 2,614 | 9.4% |
| $100,000 to $149,999 | 5,701 | 20.5% |
| $150,000 to $199,999 | 4,672 | 16.8% |
| $200,000+ | 7,925 | 28.5% |
Household Income by Householder Age in Reston
The median household income in Reston is $135,503, with the highest median household income of $158,539 found in the 45 to 64 years age bracket for the primary householder. A total of 10,611 households (38.2%) fall into this category. Meanwhile, the 15 to 24 years age bracket for the primary householder has the lowest median household income of $88,827, with 724 households (2.6%) in this group.
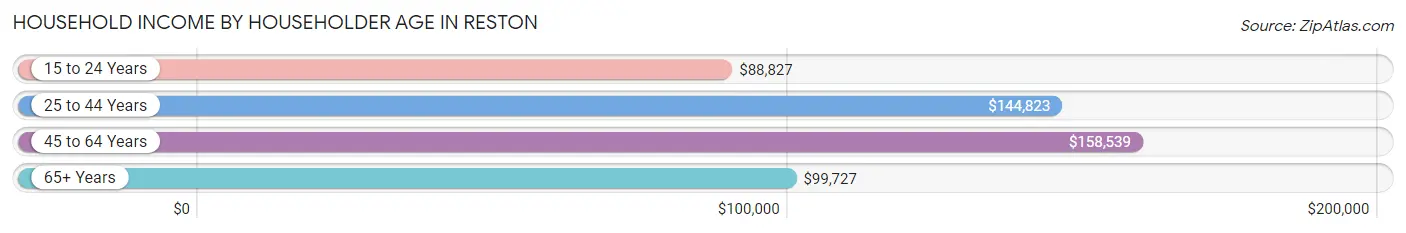
| Income Bracket | # Households | Median Income |
| 15 to 24 Years | 724 (2.6%) | $88,827 |
| 25 to 44 Years | 9,681 (34.8%) | $144,823 |
| 45 to 64 Years | 10,611 (38.2%) | $158,539 |
| 65+ Years | 6,792 (24.4%) | $99,727 |
| Total | 27,808 (100.0%) | $135,503 |
Poverty in Reston
Income Below Poverty by Sex and Age in Reston
With 4.2% poverty level for males and 7.2% for females among the residents of Reston, 16 and 17 year old males and 75 year old and over females are the most vulnerable to poverty, with 85 males (14.0%) and 331 females (14.0%) in their respective age groups living below the poverty level.
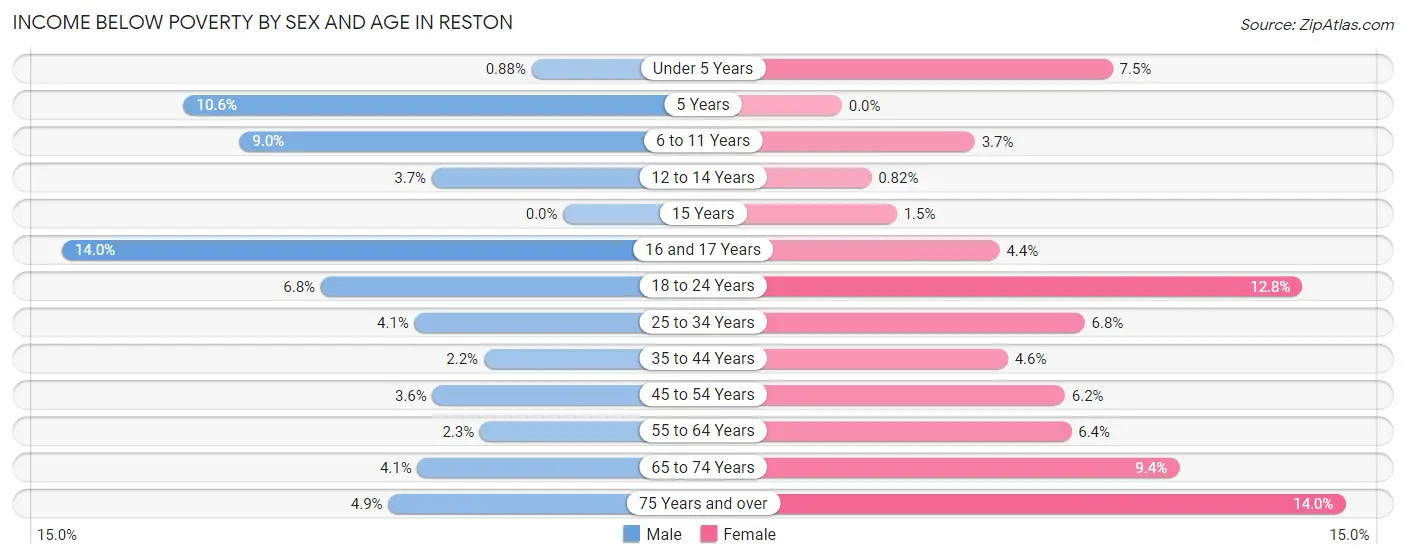
| Age Bracket | Male | Female |
| Under 5 Years | 15 (0.9%) | 132 (7.5%) |
| 5 Years | 41 (10.6%) | 0 (0.0%) |
| 6 to 11 Years | 192 (9.0%) | 66 (3.7%) |
| 12 to 14 Years | 37 (3.7%) | 8 (0.8%) |
| 15 Years | 0 (0.0%) | 6 (1.5%) |
| 16 and 17 Years | 85 (14.0%) | 23 (4.4%) |
| 18 to 24 Years | 127 (6.8%) | 342 (12.8%) |
| 25 to 34 Years | 216 (4.1%) | 357 (6.8%) |
| 35 to 44 Years | 95 (2.2%) | 195 (4.6%) |
| 45 to 54 Years | 154 (3.6%) | 251 (6.2%) |
| 55 to 64 Years | 88 (2.3%) | 287 (6.4%) |
| 65 to 74 Years | 97 (4.1%) | 318 (9.4%) |
| 75 Years and over | 107 (4.9%) | 331 (14.0%) |
| Total | 1,254 (4.2%) | 2,316 (7.2%) |
Income Above Poverty by Sex and Age in Reston
According to the poverty statistics in Reston, males aged 15 years and females aged 5 years are the age groups that are most secure financially, with 100.0% of males and 100.0% of females in these age groups living above the poverty line.
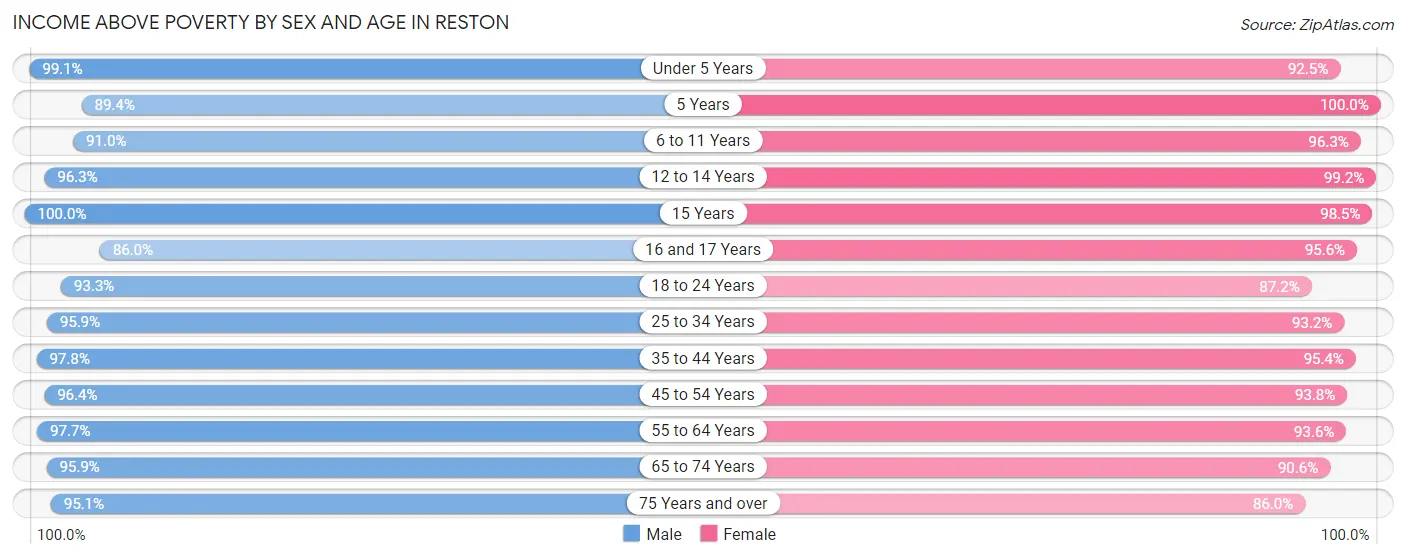
| Age Bracket | Male | Female |
| Under 5 Years | 1,698 (99.1%) | 1,618 (92.5%) |
| 5 Years | 347 (89.4%) | 285 (100.0%) |
| 6 to 11 Years | 1,937 (91.0%) | 1,717 (96.3%) |
| 12 to 14 Years | 975 (96.3%) | 967 (99.2%) |
| 15 Years | 252 (100.0%) | 386 (98.5%) |
| 16 and 17 Years | 524 (86.0%) | 501 (95.6%) |
| 18 to 24 Years | 1,755 (93.2%) | 2,326 (87.2%) |
| 25 to 34 Years | 4,998 (95.9%) | 4,923 (93.2%) |
| 35 to 44 Years | 4,205 (97.8%) | 4,023 (95.4%) |
| 45 to 54 Years | 4,073 (96.4%) | 3,788 (93.8%) |
| 55 to 64 Years | 3,712 (97.7%) | 4,204 (93.6%) |
| 65 to 74 Years | 2,290 (95.9%) | 3,068 (90.6%) |
| 75 Years and over | 2,089 (95.1%) | 2,030 (86.0%) |
| Total | 28,855 (95.8%) | 29,836 (92.8%) |
Income Below Poverty Among Married-Couple Families in Reston
The poverty statistics for married-couple families in Reston show that 2.5% or 317 of the total 12,550 families live below the poverty line. Families with 1 or 2 children have the highest poverty rate of 4.0%, comprising of 156 families. On the other hand, families with 5 or more children have the lowest poverty rate of 0.0%, which includes 0 families.
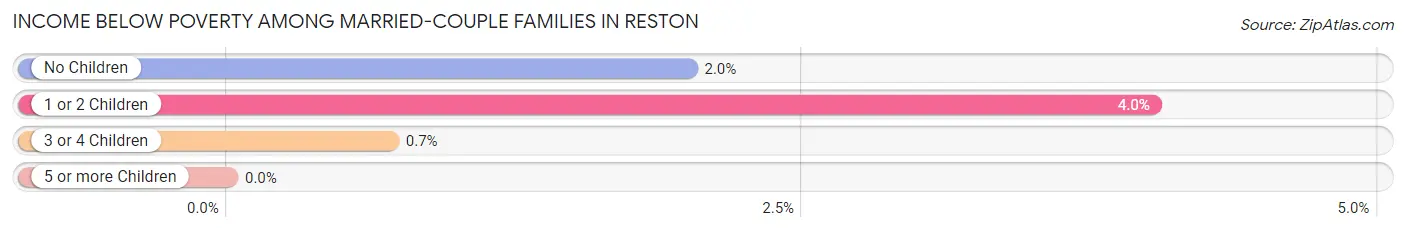
| Children | Above Poverty | Below Poverty |
| No Children | 7,595 (98.0%) | 155 (2.0%) |
| 1 or 2 Children | 3,729 (96.0%) | 156 (4.0%) |
| 3 or 4 Children | 848 (99.3%) | 6 (0.7%) |
| 5 or more Children | 61 (100.0%) | 0 (0.0%) |
| Total | 12,233 (97.5%) | 317 (2.5%) |
Income Below Poverty Among Single-Parent Households in Reston
According to the poverty data in Reston, 5.2% or 60 single-father households and 14.6% or 326 single-mother households are living below the poverty line. Among single-father households, those with 3 or 4 children have the highest poverty rate, with 18 households (32.7%) experiencing poverty. Likewise, among single-mother households, those with 1 or 2 children have the highest poverty rate, with 227 households (20.8%) falling below the poverty line.
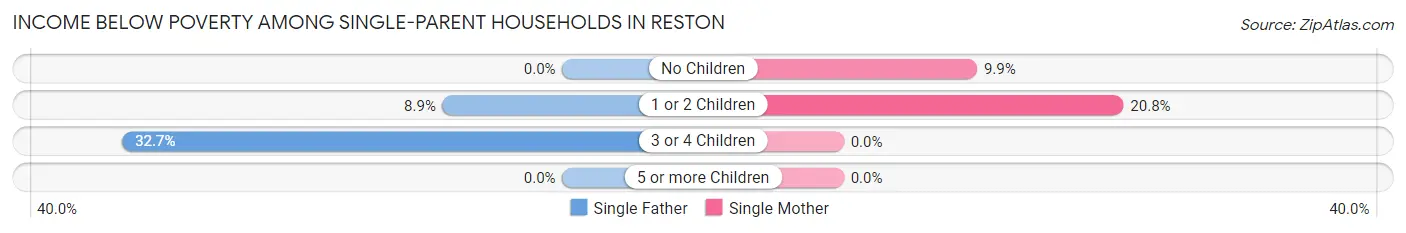
| Children | Single Father | Single Mother |
| No Children | 0 (0.0%) | 99 (9.9%) |
| 1 or 2 Children | 42 (8.9%) | 227 (20.8%) |
| 3 or 4 Children | 18 (32.7%) | 0 (0.0%) |
| 5 or more Children | 0 (0.0%) | 0 (0.0%) |
| Total | 60 (5.2%) | 326 (14.6%) |
Income Below Poverty Among Married-Couple vs Single-Parent Households in Reston
The poverty data for Reston shows that 317 of the married-couple family households (2.5%) and 386 of the single-parent households (11.4%) are living below the poverty level. Within the married-couple family households, those with 1 or 2 children have the highest poverty rate, with 156 households (4.0%) falling below the poverty line. Among the single-parent households, those with 1 or 2 children have the highest poverty rate, with 269 household (17.2%) living below poverty.
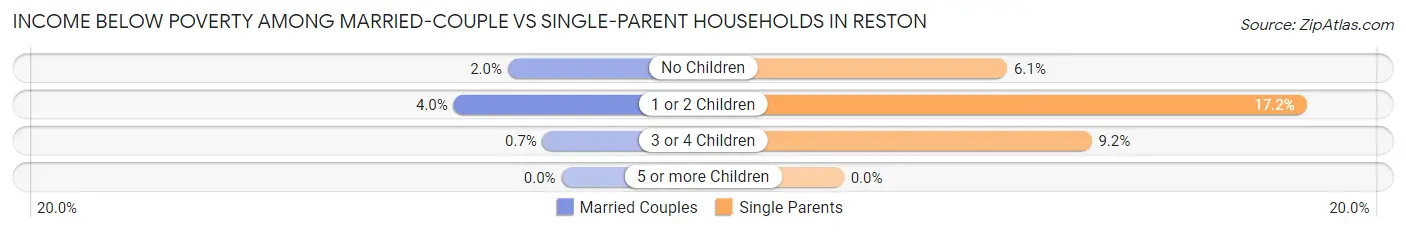
| Children | Married-Couple Families | Single-Parent Households |
| No Children | 155 (2.0%) | 99 (6.1%) |
| 1 or 2 Children | 156 (4.0%) | 269 (17.2%) |
| 3 or 4 Children | 6 (0.7%) | 18 (9.2%) |
| 5 or more Children | 0 (0.0%) | 0 (0.0%) |
| Total | 317 (2.5%) | 386 (11.4%) |
Race in Reston
The most populous races in Reston are White / Caucasian (40,000 | 64.2%), Hispanic or Latino (8,815 | 14.1%), and Asian (7,267 | 11.7%).
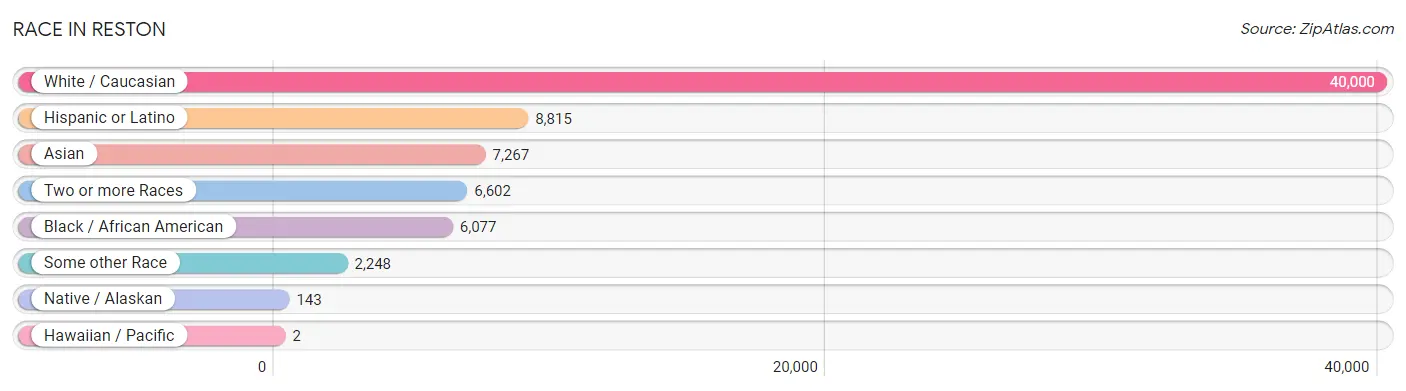
| Race | # Population | % Population |
| Asian | 7,267 | 11.7% |
| Black / African American | 6,077 | 9.8% |
| Hawaiian / Pacific | 2 | 0.0% |
| Hispanic or Latino | 8,815 | 14.1% |
| Native / Alaskan | 143 | 0.2% |
| White / Caucasian | 40,000 | 64.2% |
| Two or more Races | 6,602 | 10.6% |
| Some other Race | 2,248 | 3.6% |
| Total | 62,339 | 100.0% |
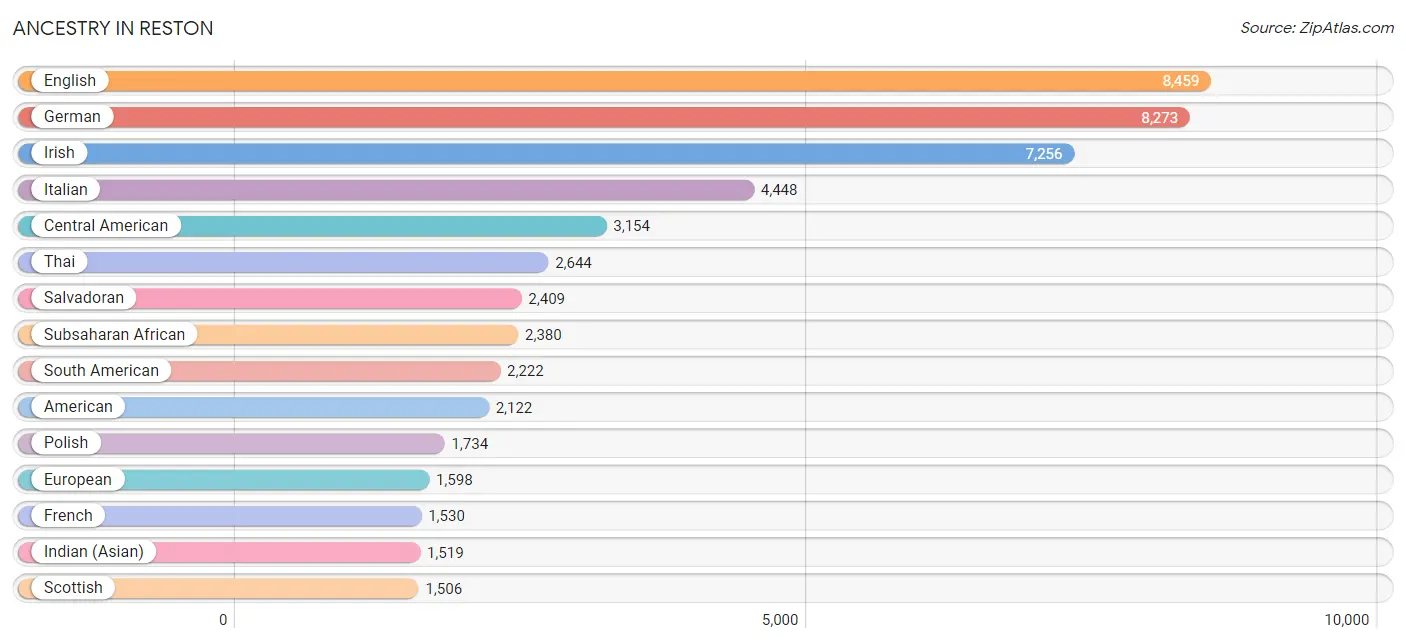
Ancestry in Reston
The most populous ancestries reported in Reston are English (8,459 | 13.6%), German (8,273 | 13.3%), Irish (7,256 | 11.6%), Italian (4,448 | 7.1%), and Central American (3,154 | 5.1%), together accounting for 50.7% of all Reston residents.
| Ancestry | # Population | % Population |
| Afghan | 413 | 0.7% |
| African | 749 | 1.2% |
| American | 2,122 | 3.4% |
| Arab | 1,083 | 1.7% |
| Argentinean | 148 | 0.2% |
| Armenian | 72 | 0.1% |
| Australian | 26 | 0.0% |
| Austrian | 243 | 0.4% |
| Barbadian | 5 | 0.0% |
| Belgian | 50 | 0.1% |
| Bhutanese | 364 | 0.6% |
| Bolivian | 505 | 0.8% |
| Brazilian | 174 | 0.3% |
| British | 712 | 1.1% |
| British West Indian | 11 | 0.0% |
| Bulgarian | 76 | 0.1% |
| Burmese | 533 | 0.9% |
| Cajun | 10 | 0.0% |
| Canadian | 79 | 0.1% |
| Celtic | 10 | 0.0% |
| Central American | 3,154 | 5.1% |
| Central American Indian | 38 | 0.1% |
| Cherokee | 43 | 0.1% |
| Chilean | 183 | 0.3% |
| Colombian | 395 | 0.6% |
| Costa Rican | 61 | 0.1% |
| Creek | 18 | 0.0% |
| Croatian | 85 | 0.1% |
| Cuban | 187 | 0.3% |
| Czech | 352 | 0.6% |
| Czechoslovakian | 27 | 0.0% |
| Danish | 212 | 0.3% |
| Dominican | 570 | 0.9% |
| Dutch | 703 | 1.1% |
| Eastern European | 325 | 0.5% |
| Ecuadorian | 89 | 0.1% |
| Egyptian | 136 | 0.2% |
| English | 8,459 | 13.6% |
| Estonian | 26 | 0.0% |
| Ethiopian | 759 | 1.2% |
| European | 1,598 | 2.6% |
| Filipino | 148 | 0.2% |
| Finnish | 190 | 0.3% |
| French | 1,530 | 2.5% |
| French Canadian | 163 | 0.3% |
| German | 8,273 | 13.3% |
| Ghanaian | 73 | 0.1% |
| Greek | 540 | 0.9% |
| Guamanian / Chamorro | 51 | 0.1% |
| Guatemalan | 209 | 0.3% |
| Haitian | 29 | 0.1% |
| Honduran | 321 | 0.5% |
| Hungarian | 226 | 0.4% |
| Indian (Asian) | 1,519 | 2.4% |
| Indonesian | 65 | 0.1% |
| Iranian | 793 | 1.3% |
| Iraqi | 73 | 0.1% |
| Irish | 7,256 | 11.6% |
| Italian | 4,448 | 7.1% |
| Jamaican | 85 | 0.1% |
| Japanese | 34 | 0.1% |
| Jordanian | 16 | 0.0% |
| Kenyan | 83 | 0.1% |
| Korean | 1,353 | 2.2% |
| Laotian | 10 | 0.0% |
| Latvian | 19 | 0.0% |
| Lebanese | 151 | 0.2% |
| Lithuanian | 357 | 0.6% |
| Luxembourger | 18 | 0.0% |
| Macedonian | 10 | 0.0% |
| Malaysian | 113 | 0.2% |
| Mexican | 823 | 1.3% |
| Mexican American Indian | 61 | 0.1% |
| Mongolian | 16 | 0.0% |
| Moroccan | 201 | 0.3% |
| Native Hawaiian | 29 | 0.1% |
| Navajo | 5 | 0.0% |
| New Zealander | 14 | 0.0% |
| Nicaraguan | 43 | 0.1% |
| Nigerian | 15 | 0.0% |
| Northern European | 224 | 0.4% |
| Norwegian | 946 | 1.5% |
| Okinawan | 7 | 0.0% |
| Pakistani | 142 | 0.2% |
| Palestinian | 58 | 0.1% |
| Panamanian | 111 | 0.2% |
| Paraguayan | 88 | 0.1% |
| Peruvian | 573 | 0.9% |
| Polish | 1,734 | 2.8% |
| Portuguese | 162 | 0.3% |
| Puerto Rican | 870 | 1.4% |
| Romanian | 187 | 0.3% |
| Russian | 1,469 | 2.4% |
| Salvadoran | 2,409 | 3.9% |
| Samoan | 2 | 0.0% |
| Scandinavian | 77 | 0.1% |
| Scotch-Irish | 857 | 1.4% |
| Scottish | 1,506 | 2.4% |
| Serbian | 44 | 0.1% |
| Shoshone | 19 | 0.0% |
| Sierra Leonean | 264 | 0.4% |
| Sioux | 13 | 0.0% |
| Slavic | 24 | 0.0% |
| Slovak | 203 | 0.3% |
| Slovene | 80 | 0.1% |
| Somali | 107 | 0.2% |
| South African | 10 | 0.0% |
| South American | 2,222 | 3.6% |
| South American Indian | 70 | 0.1% |
| Spaniard | 384 | 0.6% |
| Spanish | 135 | 0.2% |
| Sri Lankan | 1,122 | 1.8% |
| Subsaharan African | 2,380 | 3.8% |
| Sudanese | 152 | 0.2% |
| Swedish | 715 | 1.1% |
| Swiss | 223 | 0.4% |
| Syrian | 31 | 0.1% |
| Thai | 2,644 | 4.2% |
| Turkish | 99 | 0.2% |
| Ukrainian | 630 | 1.0% |
| Uruguayan | 10 | 0.0% |
| Ute | 19 | 0.0% |
| Venezuelan | 231 | 0.4% |
| Vietnamese | 142 | 0.2% |
| Welsh | 216 | 0.4% |
| West Indian | 73 | 0.1% |
| Yugoslavian | 11 | 0.0% | View All 127 Rows |
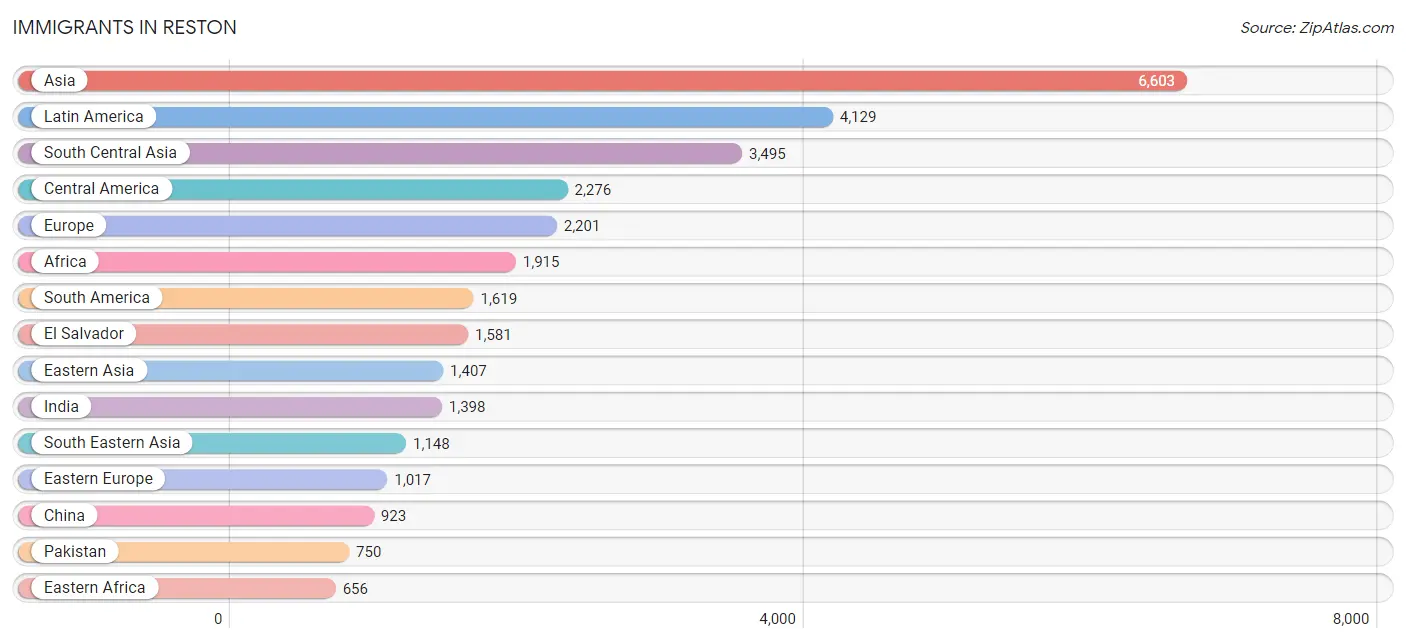
Immigrants in Reston
The most numerous immigrant groups reported in Reston came from Asia (6,603 | 10.6%), Latin America (4,129 | 6.6%), South Central Asia (3,495 | 5.6%), Central America (2,276 | 3.6%), and Europe (2,201 | 3.5%), together accounting for 30.0% of all Reston residents.
| Immigration Origin | # Population | % Population |
| Afghanistan | 246 | 0.4% |
| Africa | 1,915 | 3.1% |
| Argentina | 164 | 0.3% |
| Asia | 6,603 | 10.6% |
| Australia | 49 | 0.1% |
| Bangladesh | 117 | 0.2% |
| Barbados | 5 | 0.0% |
| Belarus | 79 | 0.1% |
| Belgium | 27 | 0.0% |
| Bolivia | 317 | 0.5% |
| Brazil | 168 | 0.3% |
| Bulgaria | 66 | 0.1% |
| Cambodia | 5 | 0.0% |
| Cameroon | 20 | 0.0% |
| Canada | 141 | 0.2% |
| Caribbean | 234 | 0.4% |
| Central America | 2,276 | 3.6% |
| Chile | 55 | 0.1% |
| China | 923 | 1.5% |
| Colombia | 232 | 0.4% |
| Congo | 25 | 0.0% |
| Cuba | 4 | 0.0% |
| Czechoslovakia | 46 | 0.1% |
| Denmark | 9 | 0.0% |
| Dominican Republic | 131 | 0.2% |
| Eastern Africa | 656 | 1.1% |
| Eastern Asia | 1,407 | 2.3% |
| Eastern Europe | 1,017 | 1.6% |
| Ecuador | 71 | 0.1% |
| Egypt | 71 | 0.1% |
| El Salvador | 1,581 | 2.5% |
| England | 225 | 0.4% |
| Eritrea | 9 | 0.0% |
| Ethiopia | 475 | 0.8% |
| Europe | 2,201 | 3.5% |
| France | 217 | 0.4% |
| Germany | 144 | 0.2% |
| Ghana | 82 | 0.1% |
| Greece | 12 | 0.0% |
| Guatemala | 62 | 0.1% |
| Guyana | 38 | 0.1% |
| Haiti | 41 | 0.1% |
| Honduras | 222 | 0.4% |
| Hong Kong | 74 | 0.1% |
| Hungary | 10 | 0.0% |
| India | 1,398 | 2.2% |
| Indonesia | 19 | 0.0% |
| Iran | 535 | 0.9% |
| Iraq | 197 | 0.3% |
| Ireland | 8 | 0.0% |
| Israel | 17 | 0.0% |
| Italy | 92 | 0.2% |
| Jamaica | 27 | 0.0% |
| Japan | 134 | 0.2% |
| Jordan | 49 | 0.1% |
| Kenya | 15 | 0.0% |
| Korea | 350 | 0.6% |
| Kuwait | 33 | 0.1% |
| Laos | 71 | 0.1% |
| Latin America | 4,129 | 6.6% |
| Lebanon | 63 | 0.1% |
| Lithuania | 15 | 0.0% |
| Malaysia | 49 | 0.1% |
| Mexico | 373 | 0.6% |
| Middle Africa | 130 | 0.2% |
| Moldova | 113 | 0.2% |
| Morocco | 134 | 0.2% |
| Nepal | 34 | 0.1% |
| Netherlands | 75 | 0.1% |
| Nicaragua | 29 | 0.1% |
| Nigeria | 15 | 0.0% |
| Northern Africa | 472 | 0.8% |
| Northern Europe | 494 | 0.8% |
| Norway | 13 | 0.0% |
| Oceania | 70 | 0.1% |
| Pakistan | 750 | 1.2% |
| Panama | 9 | 0.0% |
| Peru | 236 | 0.4% |
| Philippines | 355 | 0.6% |
| Poland | 23 | 0.0% |
| Portugal | 10 | 0.0% |
| Romania | 73 | 0.1% |
| Russia | 415 | 0.7% |
| Saudi Arabia | 71 | 0.1% |
| Serbia | 10 | 0.0% |
| Sierra Leone | 296 | 0.5% |
| Singapore | 7 | 0.0% |
| Somalia | 38 | 0.1% |
| South Africa | 5 | 0.0% |
| South America | 1,619 | 2.6% |
| South Central Asia | 3,495 | 5.6% |
| South Eastern Asia | 1,148 | 1.8% |
| Southern Europe | 122 | 0.2% |
| Spain | 8 | 0.0% |
| Sri Lanka | 358 | 0.6% |
| Sudan | 224 | 0.4% |
| Sweden | 48 | 0.1% |
| Switzerland | 23 | 0.0% |
| Syria | 17 | 0.0% |
| Taiwan | 134 | 0.2% |
| Thailand | 112 | 0.2% |
| Trinidad and Tobago | 9 | 0.0% |
| Turkey | 87 | 0.1% |
| Ukraine | 129 | 0.2% |
| Uruguay | 10 | 0.0% |
| Uzbekistan | 35 | 0.1% |
| Venezuela | 245 | 0.4% |
| Vietnam | 481 | 0.8% |
| Western Africa | 511 | 0.8% |
| Western Asia | 553 | 0.9% |
| Western Europe | 486 | 0.8% |
| Yemen | 14 | 0.0% | View All 112 Rows |
Sex and Age in Reston
Sex and Age in Reston
The most populous age groups in Reston are 25 to 29 Years (2,857 | 9.5%) for men and 25 to 29 Years (2,763 | 8.6%) for women.
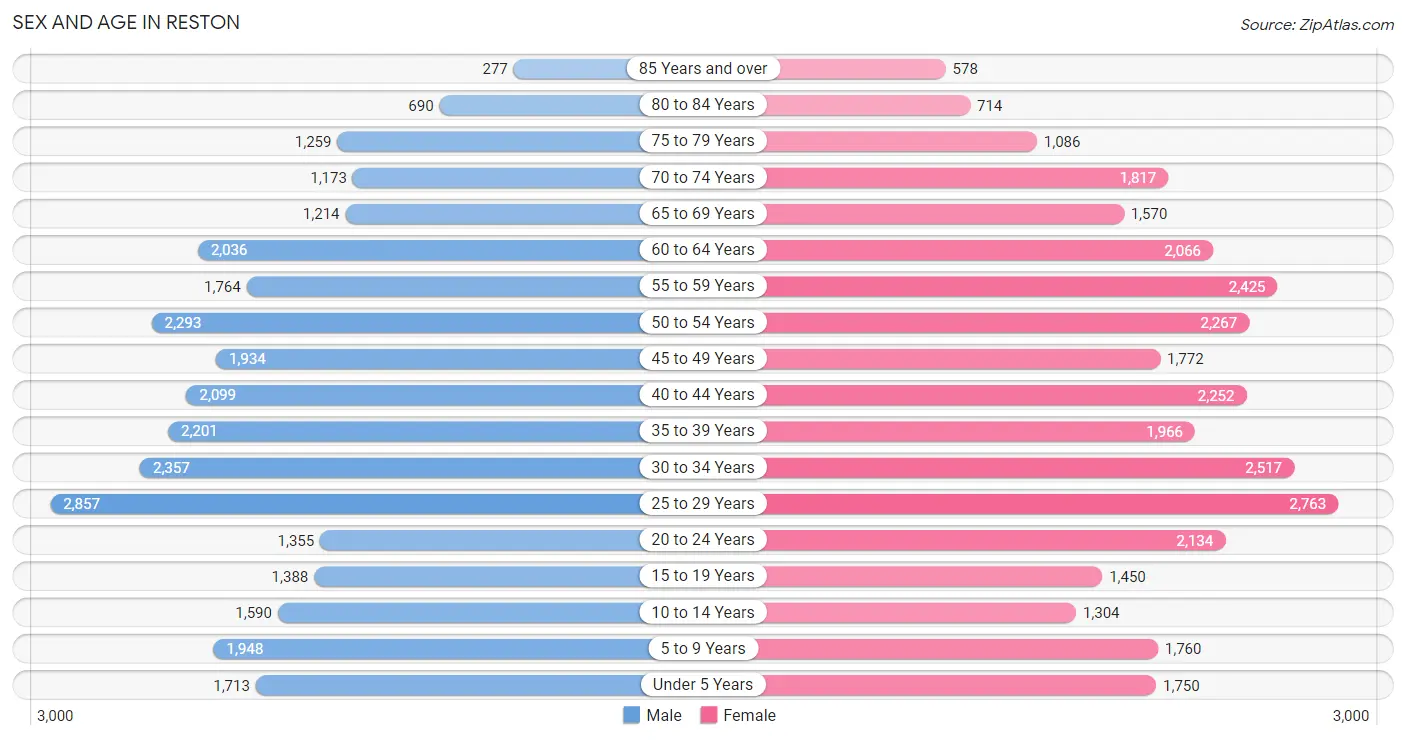
| Age Bracket | Male | Female |
| Under 5 Years | 1,713 (5.7%) | 1,750 (5.4%) |
| 5 to 9 Years | 1,948 (6.5%) | 1,760 (5.5%) |
| 10 to 14 Years | 1,590 (5.3%) | 1,304 (4.1%) |
| 15 to 19 Years | 1,388 (4.6%) | 1,450 (4.5%) |
| 20 to 24 Years | 1,355 (4.5%) | 2,134 (6.6%) |
| 25 to 29 Years | 2,857 (9.5%) | 2,763 (8.6%) |
| 30 to 34 Years | 2,357 (7.8%) | 2,517 (7.8%) |
| 35 to 39 Years | 2,201 (7.3%) | 1,966 (6.1%) |
| 40 to 44 Years | 2,099 (7.0%) | 2,252 (7.0%) |
| 45 to 49 Years | 1,934 (6.4%) | 1,772 (5.5%) |
| 50 to 54 Years | 2,293 (7.6%) | 2,267 (7.0%) |
| 55 to 59 Years | 1,764 (5.9%) | 2,425 (7.5%) |
| 60 to 64 Years | 2,036 (6.8%) | 2,066 (6.4%) |
| 65 to 69 Years | 1,214 (4.0%) | 1,570 (4.9%) |
| 70 to 74 Years | 1,173 (3.9%) | 1,817 (5.6%) |
| 75 to 79 Years | 1,259 (4.2%) | 1,086 (3.4%) |
| 80 to 84 Years | 690 (2.3%) | 714 (2.2%) |
| 85 Years and over | 277 (0.9%) | 578 (1.8%) |
| Total | 30,148 (100.0%) | 32,191 (100.0%) |
Families and Households in Reston
Median Family Size in Reston
The median family size in Reston is 2.91 persons per family, with married-couple families (12,550 | 78.8%) accounting for the largest median family size of 2.95 persons per family. On the other hand, single male/father families (1,155 | 7.2%) represent the smallest median family size with 2.63 persons per family.
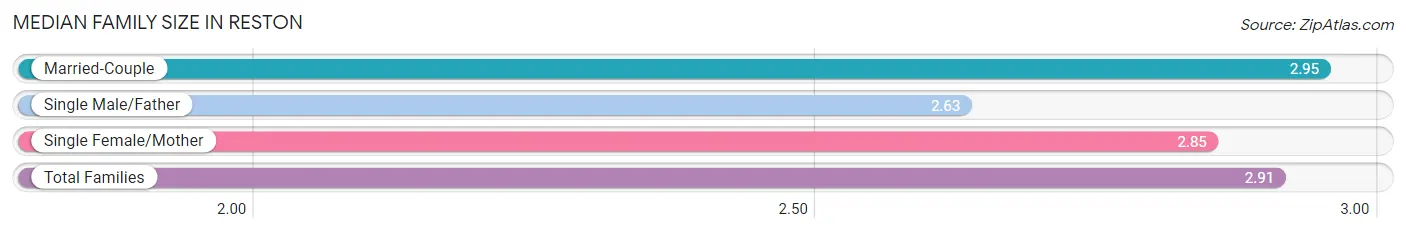
| Family Type | # Families | Family Size |
| Married-Couple | 12,550 (78.8%) | 2.95 |
| Single Male/Father | 1,155 (7.2%) | 2.63 |
| Single Female/Mother | 2,226 (14.0%) | 2.85 |
| Total Families | 15,931 (100.0%) | 2.91 |
Median Household Size in Reston
The median household size in Reston is 2.24 persons per household, with single female/mother households (2,226 | 8.0%) accounting for the largest median household size of 3.08 persons per household. non-family households (11,877 | 42.7%) represent the smallest median household size with 1.24 persons per household.
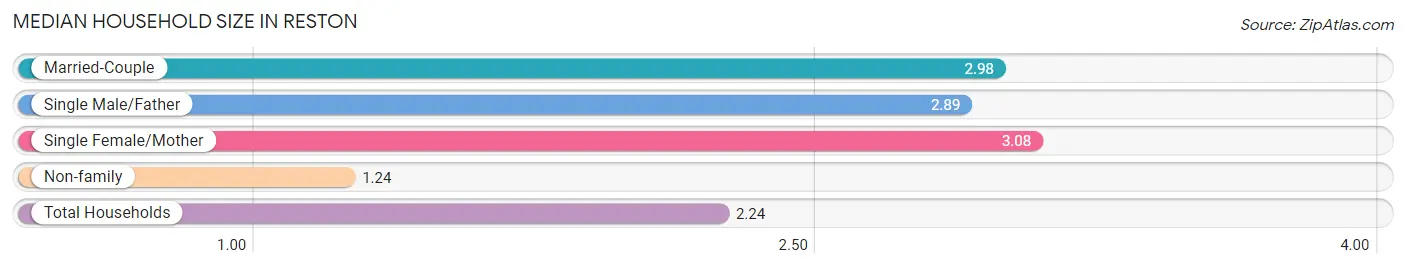
| Household Type | # Households | Household Size |
| Married-Couple | 12,550 (45.1%) | 2.98 |
| Single Male/Father | 1,155 (4.2%) | 2.89 |
| Single Female/Mother | 2,226 (8.0%) | 3.08 |
| Non-family | 11,877 (42.7%) | 1.24 |
| Total Households | 27,808 (100.0%) | 2.24 |
Household Size by Marriage Status in Reston
Out of a total of 27,808 households in Reston, 15,931 (57.3%) are family households, while 11,877 (42.7%) are nonfamily households. The most numerous type of family households are 2-person households, comprising 8,238, and the most common type of nonfamily households are 1-person households, comprising 9,784.
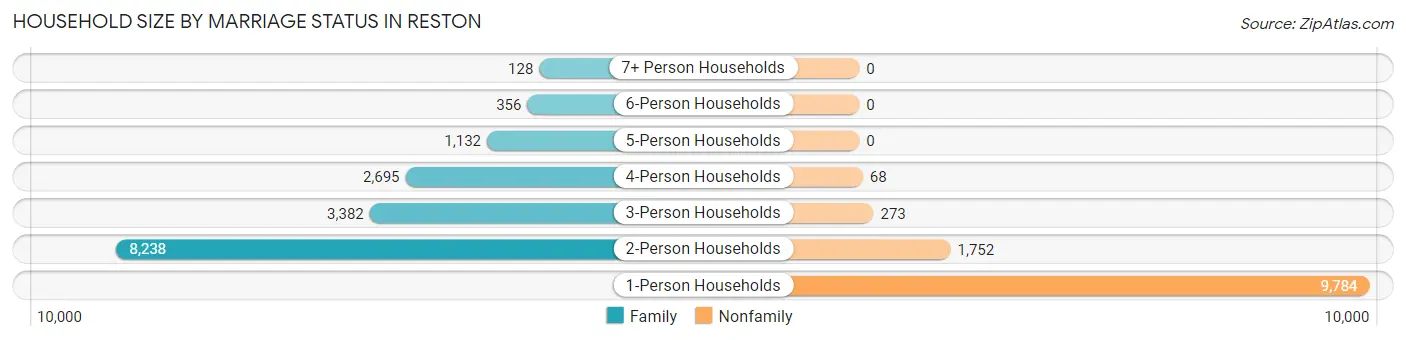
| Household Size | Family Households | Nonfamily Households |
| 1-Person Households | - | 9,784 (35.2%) |
| 2-Person Households | 8,238 (29.6%) | 1,752 (6.3%) |
| 3-Person Households | 3,382 (12.2%) | 273 (1.0%) |
| 4-Person Households | 2,695 (9.7%) | 68 (0.2%) |
| 5-Person Households | 1,132 (4.1%) | 0 (0.0%) |
| 6-Person Households | 356 (1.3%) | 0 (0.0%) |
| 7+ Person Households | 128 (0.5%) | 0 (0.0%) |
| Total | 15,931 (57.3%) | 11,877 (42.7%) |
Female Fertility in Reston
Fertility by Age in Reston
Average fertility rate in Reston is 42.0 births per 1,000 women. Women in the age bracket of 35 to 50 years have the highest fertility rate with 49.0 births per 1,000 women. Women in the age bracket of 20 to 34 years acount for 51.1% of all women with births.
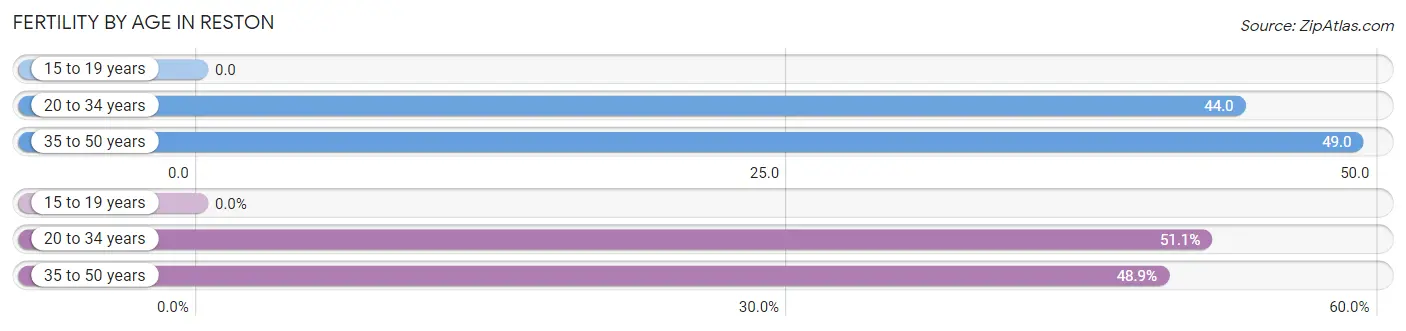
| Age Bracket | Women with Births | Births / 1,000 Women |
| 15 to 19 years | 0 (0.0%) | 0.0 |
| 20 to 34 years | 325 (51.1%) | 44.0 |
| 35 to 50 years | 311 (48.9%) | 49.0 |
| Total | 636 (100.0%) | 42.0 |
Fertility by Age by Marriage Status in Reston
87.1% of women with births (636) in Reston are married. The highest percentage of unmarried women with births falls into 20 to 34 years age bracket with 16.6% of them unmarried at the time of birth, while the lowest percentage of unmarried women with births belong to 35 to 50 years age bracket with 9.0% of them unmarried.
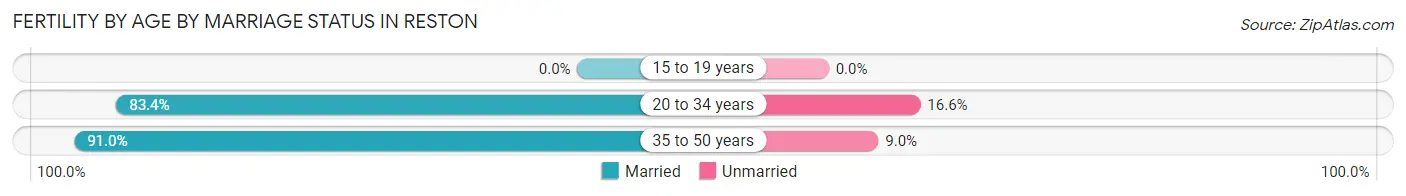
| Age Bracket | Married | Unmarried |
| 15 to 19 years | 0 (0.0%) | 0 (0.0%) |
| 20 to 34 years | 271 (83.4%) | 54 (16.6%) |
| 35 to 50 years | 283 (91.0%) | 28 (9.0%) |
| Total | 554 (87.1%) | 82 (12.9%) |
Fertility by Education in Reston
Average fertility rate in Reston is 42.0 births per 1,000 women. Women with the education attainment of bachelor's degree have the highest fertility rate of 54.0 births per 1,000 women, while women with the education attainment of less than high school have the lowest fertility at 16.0 births per 1,000 women. Women with the education attainment of bachelor's degree represent 47.8% of all women with births.
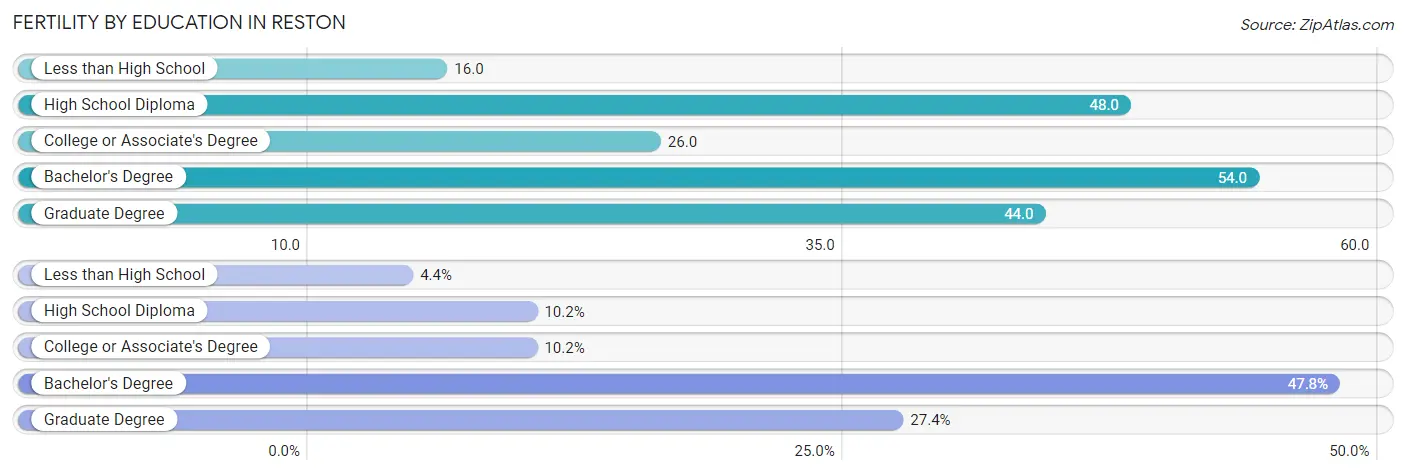
| Educational Attainment | Women with Births | Births / 1,000 Women |
| Less than High School | 28 (4.4%) | 16.0 |
| High School Diploma | 65 (10.2%) | 48.0 |
| College or Associate's Degree | 65 (10.2%) | 26.0 |
| Bachelor's Degree | 304 (47.8%) | 54.0 |
| Graduate Degree | 174 (27.4%) | 44.0 |
| Total | 636 (100.0%) | 42.0 |
Fertility by Education by Marriage Status in Reston
12.9% of women with births in Reston are unmarried. Women with the educational attainment of bachelor's degree are most likely to be married with 100.0% of them married at childbirth, while women with the educational attainment of less than high school are least likely to be married with 100.0% of them unmarried at childbirth.
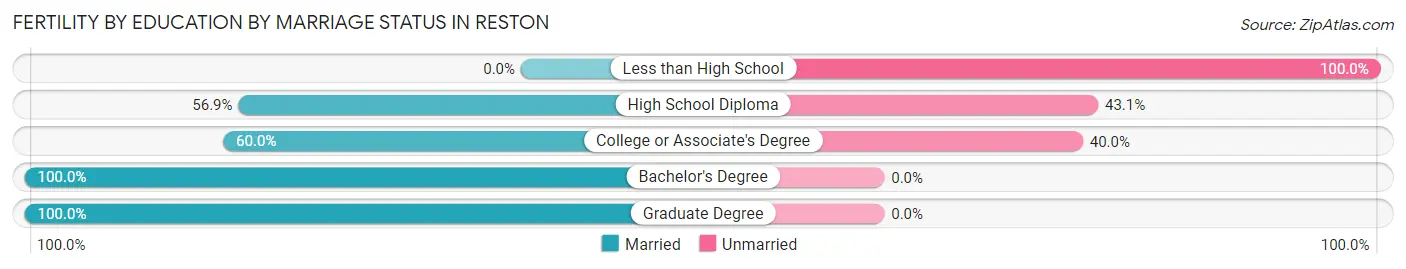
| Educational Attainment | Married | Unmarried |
| Less than High School | 0 (0.0%) | 28 (100.0%) |
| High School Diploma | 37 (56.9%) | 28 (43.1%) |
| College or Associate's Degree | 39 (60.0%) | 26 (40.0%) |
| Bachelor's Degree | 304 (100.0%) | 0 (0.0%) |
| Graduate Degree | 174 (100.0%) | 0 (0.0%) |
| Total | 554 (87.1%) | 82 (12.9%) |
Employment Characteristics in Reston
Employment by Class of Employer in Reston
Among the 36,192 employed individuals in Reston, private company employees (22,957 | 63.4%), federal government employees (3,707 | 10.2%), and not-for-profit organizations (3,154 | 8.7%) make up the most common classes of employment.
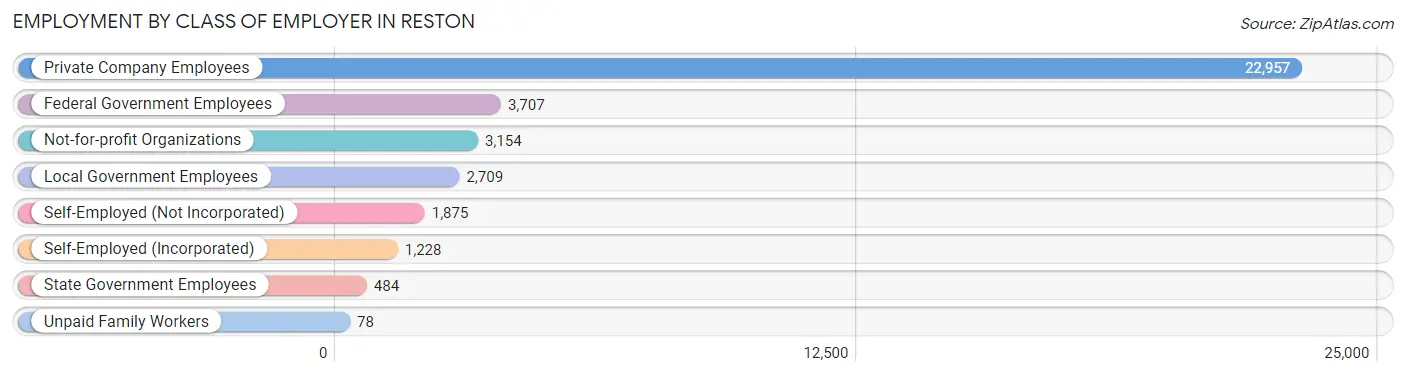
| Employer Class | # Employees | % Employees |
| Private Company Employees | 22,957 | 63.4% |
| Self-Employed (Incorporated) | 1,228 | 3.4% |
| Self-Employed (Not Incorporated) | 1,875 | 5.2% |
| Not-for-profit Organizations | 3,154 | 8.7% |
| Local Government Employees | 2,709 | 7.5% |
| State Government Employees | 484 | 1.3% |
| Federal Government Employees | 3,707 | 10.2% |
| Unpaid Family Workers | 78 | 0.2% |
| Total | 36,192 | 100.0% |
Employment Status by Age in Reston
According to the labor force statistics for Reston, out of the total population over 16 years of age (51,630), 74.1% or 38,258 individuals are in the labor force, with 4.3% or 1,645 of them unemployed. The age group with the highest labor force participation rate is 30 to 34 years, with 91.4% or 4,455 individuals in the labor force. Within the labor force, the 16 to 19 years age range has the highest percentage of unemployed individuals, with 22.3% or 230 of them being unemployed.
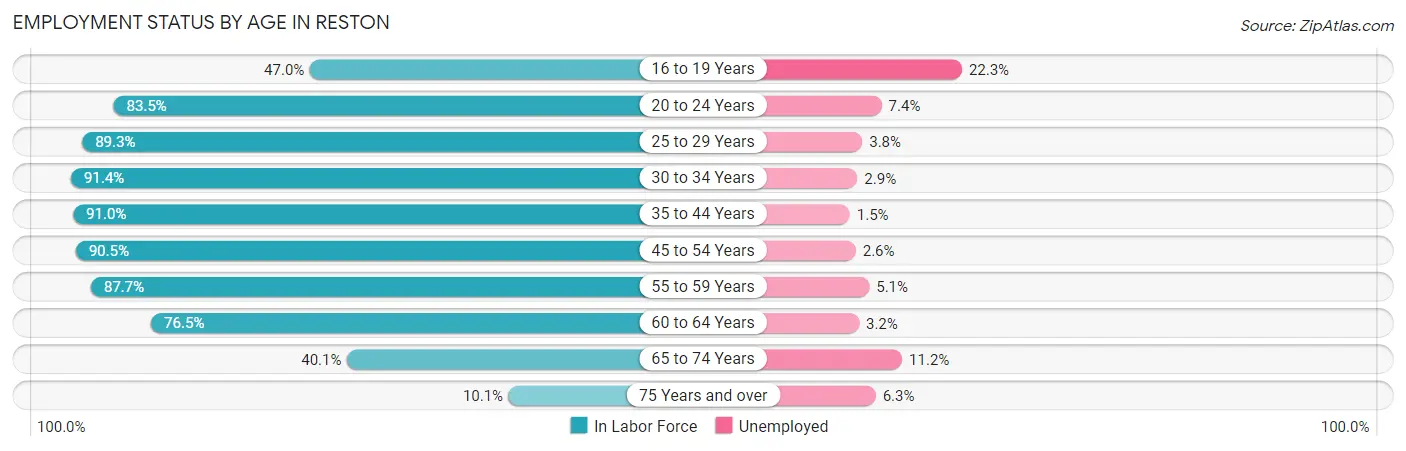
| Age Bracket | In Labor Force | Unemployed |
| 16 to 19 Years | 1,031 (47.0%) | 230 (22.3%) |
| 20 to 24 Years | 2,913 (83.5%) | 216 (7.4%) |
| 25 to 29 Years | 5,019 (89.3%) | 191 (3.8%) |
| 30 to 34 Years | 4,455 (91.4%) | 129 (2.9%) |
| 35 to 44 Years | 7,751 (91.0%) | 116 (1.5%) |
| 45 to 54 Years | 7,481 (90.5%) | 195 (2.6%) |
| 55 to 59 Years | 3,674 (87.7%) | 187 (5.1%) |
| 60 to 64 Years | 3,138 (76.5%) | 100 (3.2%) |
| 65 to 74 Years | 2,315 (40.1%) | 259 (11.2%) |
| 75 Years and over | 465 (10.1%) | 29 (6.3%) |
| Total | 38,258 (74.1%) | 1,645 (4.3%) |
Employment Status by Educational Attainment in Reston
According to labor force statistics for Reston, 88.6% of individuals (31,514) out of the total population between 25 and 64 years of age (35,569) are in the labor force, with 2.9% or 914 of them being unemployed. The group with the highest labor force participation rate are those with the educational attainment of bachelor's degree or higher, with 90.7% or 23,255 individuals in the labor force. Within the labor force, individuals with high school diploma education have the highest percentage of unemployment, with 9.1% or 221 of them being unemployed.
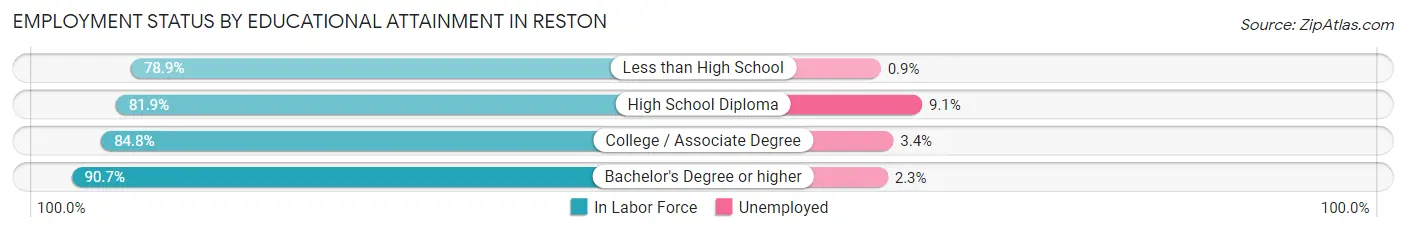
| Educational Attainment | In Labor Force | Unemployed |
| Less than High School | 1,165 (78.9%) | 13 (0.9%) |
| High School Diploma | 2,428 (81.9%) | 270 (9.1%) |
| College / Associate Degree | 4,655 (84.8%) | 187 (3.4%) |
| Bachelor's Degree or higher | 23,255 (90.7%) | 590 (2.3%) |
| Total | 31,514 (88.6%) | 1,032 (2.9%) |
Employment Occupations by Sex in Reston
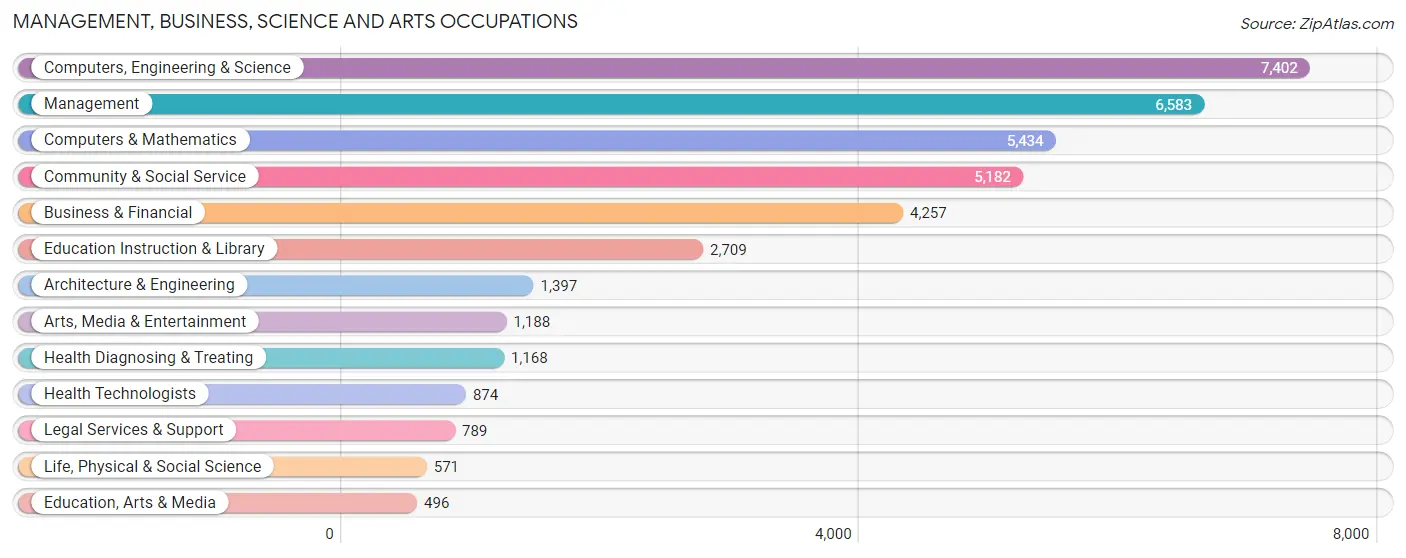
Management, Business, Science and Arts Occupations
The most common Management, Business, Science and Arts occupations in Reston are Computers, Engineering & Science (7,402 | 20.3%), Management (6,583 | 18.1%), Computers & Mathematics (5,434 | 14.9%), Community & Social Service (5,182 | 14.2%), and Business & Financial (4,257 | 11.7%).
Management, Business, Science and Arts Occupations by Sex
Within the Management, Business, Science and Arts occupations in Reston, the most male-oriented occupations are Architecture & Engineering (73.4%), Computers & Mathematics (71.6%), and Computers, Engineering & Science (69.4%), while the most female-oriented occupations are Health Technologists (80.0%), Health Diagnosing & Treating (79.5%), and Education Instruction & Library (73.0%).
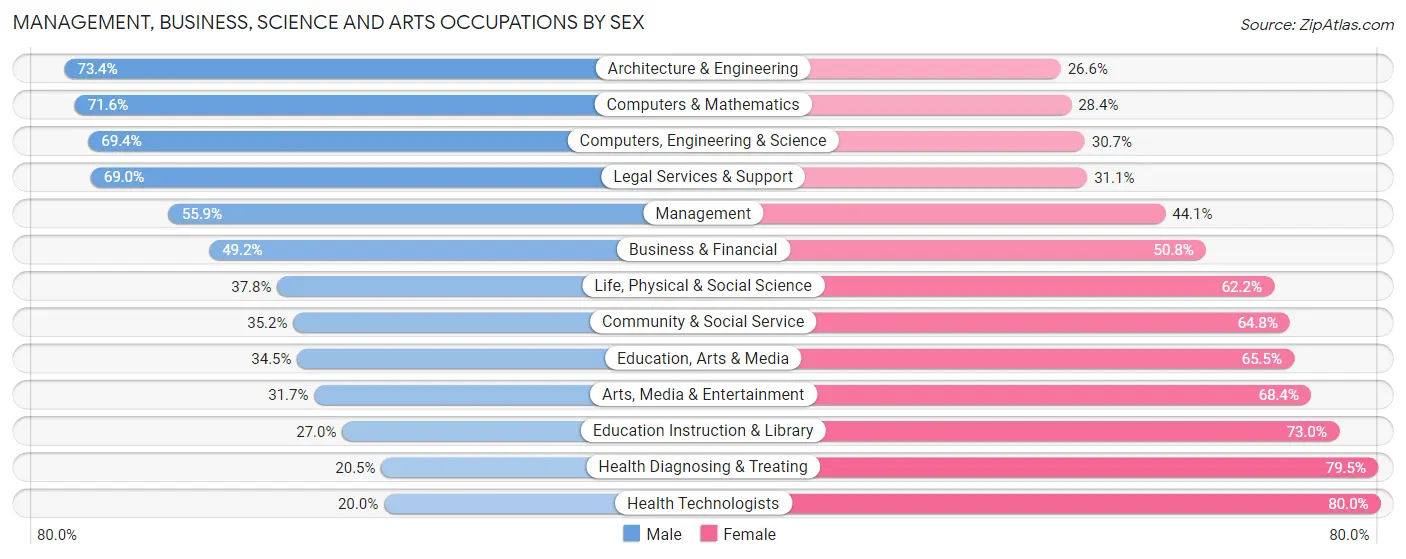
| Occupation | Male | Female |
| Management | 3,681 (55.9%) | 2,902 (44.1%) |
| Business & Financial | 2,094 (49.2%) | 2,163 (50.8%) |
| Computers, Engineering & Science | 5,133 (69.4%) | 2,269 (30.6%) |
| Computers & Mathematics | 3,892 (71.6%) | 1,542 (28.4%) |
| Architecture & Engineering | 1,025 (73.4%) | 372 (26.6%) |
| Life, Physical & Social Science | 216 (37.8%) | 355 (62.2%) |
| Community & Social Service | 1,822 (35.2%) | 3,360 (64.8%) |
| Education, Arts & Media | 171 (34.5%) | 325 (65.5%) |
| Legal Services & Support | 544 (69.0%) | 245 (31.0%) |
| Education Instruction & Library | 731 (27.0%) | 1,978 (73.0%) |
| Arts, Media & Entertainment | 376 (31.7%) | 812 (68.3%) |
| Health Diagnosing & Treating | 239 (20.5%) | 929 (79.5%) |
| Health Technologists | 175 (20.0%) | 699 (80.0%) |
| Total (Category) | 12,969 (52.7%) | 11,623 (47.3%) |
| Total (Overall) | 18,413 (50.5%) | 18,013 (49.4%) |
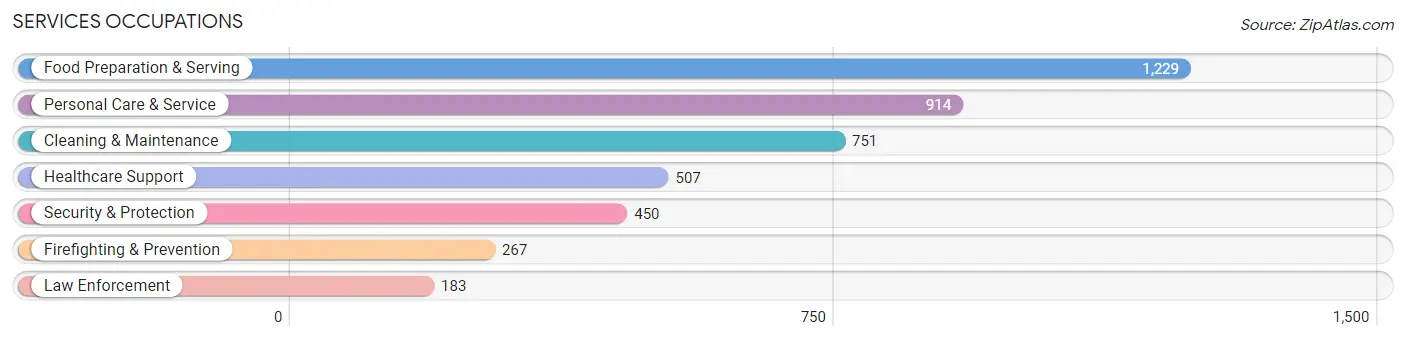
Services Occupations
The most common Services occupations in Reston are Food Preparation & Serving (1,229 | 3.4%), Personal Care & Service (914 | 2.5%), Cleaning & Maintenance (751 | 2.1%), Healthcare Support (507 | 1.4%), and Security & Protection (450 | 1.2%).
Services Occupations by Sex
Within the Services occupations in Reston, the most male-oriented occupations are Law Enforcement (84.2%), Security & Protection (76.0%), and Firefighting & Prevention (70.4%), while the most female-oriented occupations are Healthcare Support (97.2%), Personal Care & Service (90.9%), and Cleaning & Maintenance (51.9%).
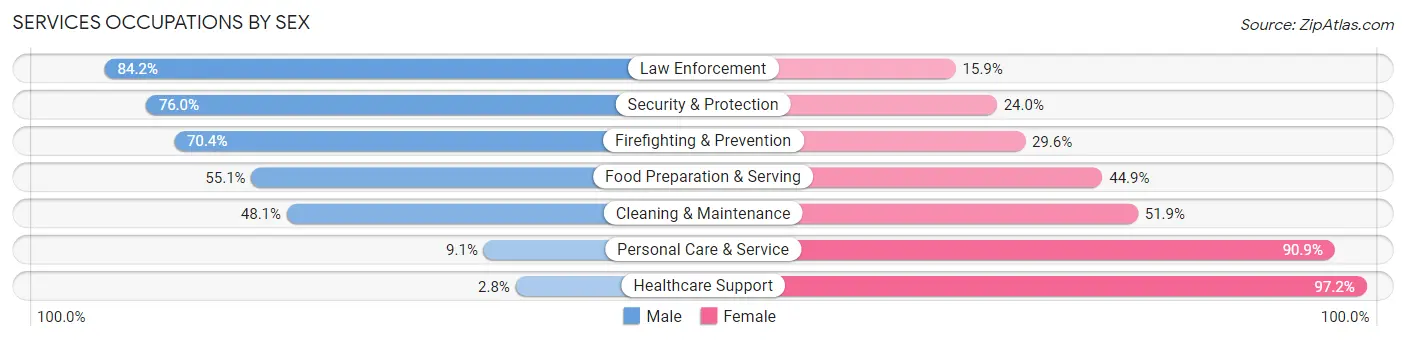
| Occupation | Male | Female |
| Healthcare Support | 14 (2.8%) | 493 (97.2%) |
| Security & Protection | 342 (76.0%) | 108 (24.0%) |
| Firefighting & Prevention | 188 (70.4%) | 79 (29.6%) |
| Law Enforcement | 154 (84.2%) | 29 (15.9%) |
| Food Preparation & Serving | 677 (55.1%) | 552 (44.9%) |
| Cleaning & Maintenance | 361 (48.1%) | 390 (51.9%) |
| Personal Care & Service | 83 (9.1%) | 831 (90.9%) |
| Total (Category) | 1,477 (38.4%) | 2,374 (61.7%) |
| Total (Overall) | 18,413 (50.5%) | 18,013 (49.4%) |
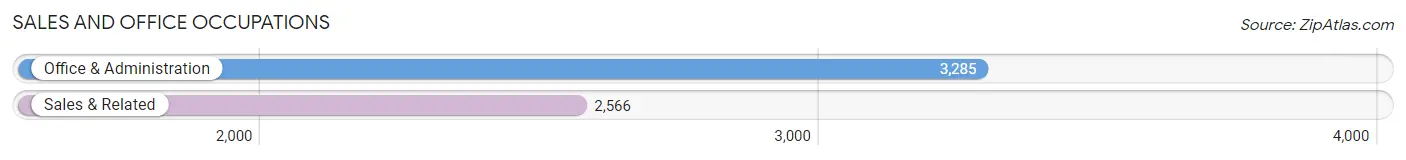
Sales and Office Occupations
The most common Sales and Office occupations in Reston are Office & Administration (3,285 | 9.0%), and Sales & Related (2,566 | 7.0%).
Sales and Office Occupations by Sex
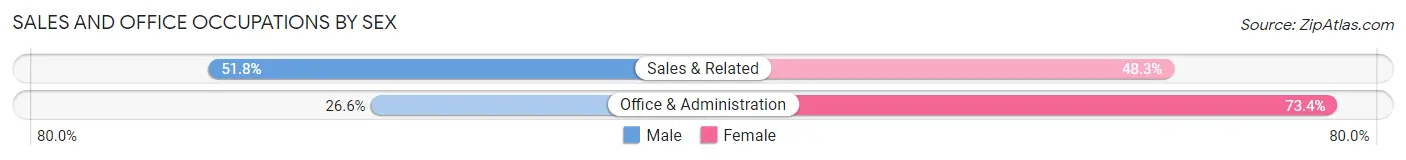
| Occupation | Male | Female |
| Sales & Related | 1,328 (51.7%) | 1,238 (48.2%) |
| Office & Administration | 875 (26.6%) | 2,410 (73.4%) |
| Total (Category) | 2,203 (37.7%) | 3,648 (62.4%) |
| Total (Overall) | 18,413 (50.5%) | 18,013 (49.4%) |
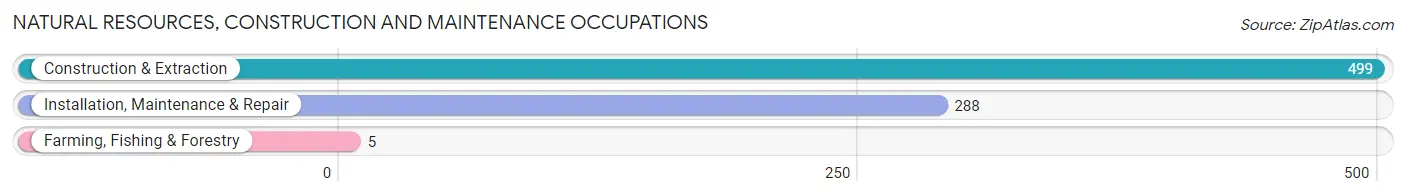
Natural Resources, Construction and Maintenance Occupations
The most common Natural Resources, Construction and Maintenance occupations in Reston are Construction & Extraction (499 | 1.4%), Installation, Maintenance & Repair (288 | 0.8%), and Farming, Fishing & Forestry (5 | 0.0%).
Natural Resources, Construction and Maintenance Occupations by Sex
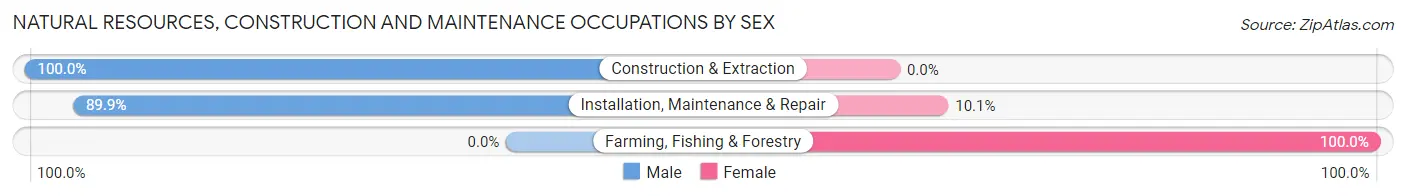
| Occupation | Male | Female |
| Farming, Fishing & Forestry | 0 (0.0%) | 5 (100.0%) |
| Construction & Extraction | 499 (100.0%) | 0 (0.0%) |
| Installation, Maintenance & Repair | 259 (89.9%) | 29 (10.1%) |
| Total (Category) | 758 (95.7%) | 34 (4.3%) |
| Total (Overall) | 18,413 (50.5%) | 18,013 (49.4%) |
Production, Transportation and Moving Occupations
The most common Production, Transportation and Moving occupations in Reston are Transportation (794 | 2.2%), Material Moving (301 | 0.8%), and Production (245 | 0.7%).
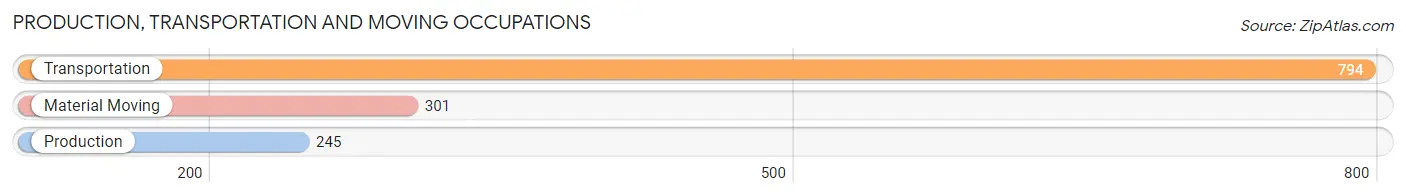
Production, Transportation and Moving Occupations by Sex
| Occupation | Male | Female |
| Production | 106 (43.3%) | 139 (56.7%) |
| Transportation | 652 (82.1%) | 142 (17.9%) |
| Material Moving | 248 (82.4%) | 53 (17.6%) |
| Total (Category) | 1,006 (75.1%) | 334 (24.9%) |
| Total (Overall) | 18,413 (50.5%) | 18,013 (49.4%) |
Employment Industries by Sex in Reston
Employment Industries in Reston
The major employment industries in Reston include Professional & Scientific (10,354 | 28.4%), Public Administration (3,507 | 9.6%), Educational Services (3,398 | 9.3%), Health Care & Social Assistance (2,967 | 8.2%), and Retail Trade (1,925 | 5.3%).
Employment Industries by Sex in Reston
The Reston industries that see more men than women are Mining, Quarrying, & Extraction (100.0%), Agriculture, Fishing & Hunting (87.8%), and Construction (74.5%), whereas the industries that tend to have a higher number of women are Health Care & Social Assistance (81.3%), Enterprise Management (74.4%), and Educational Services (70.9%).
| Industry | Male | Female |
| Agriculture, Fishing & Hunting | 94 (87.8%) | 13 (12.1%) |
| Mining, Quarrying, & Extraction | 6 (100.0%) | 0 (0.0%) |
| Construction | 998 (74.5%) | 342 (25.5%) |
| Manufacturing | 686 (58.0%) | 497 (42.0%) |
| Wholesale Trade | 163 (51.4%) | 154 (48.6%) |
| Retail Trade | 666 (34.6%) | 1,259 (65.4%) |
| Transportation & Warehousing | 941 (64.8%) | 510 (35.1%) |
| Utilities | 34 (56.7%) | 26 (43.3%) |
| Information | 788 (72.2%) | 303 (27.8%) |
| Finance & Insurance | 909 (49.6%) | 923 (50.4%) |
| Real Estate, Rental & Leasing | 320 (47.0%) | 361 (53.0%) |
| Professional & Scientific | 6,227 (60.1%) | 4,127 (39.9%) |
| Enterprise Management | 10 (25.6%) | 29 (74.4%) |
| Administrative & Support | 783 (48.9%) | 817 (51.1%) |
| Educational Services | 988 (29.1%) | 2,410 (70.9%) |
| Health Care & Social Assistance | 555 (18.7%) | 2,412 (81.3%) |
| Arts, Entertainment & Recreation | 472 (54.2%) | 398 (45.8%) |
| Accommodation & Food Services | 1,043 (58.3%) | 745 (41.7%) |
| Public Administration | 2,149 (61.3%) | 1,358 (38.7%) |
| Total | 18,413 (50.5%) | 18,013 (49.4%) |
Education in Reston
School Enrollment in Reston
The most common levels of schooling among the 13,424 students in Reston are elementary school (2,775 | 20.7%), high school (2,623 | 19.5%), and middle school (2,242 | 16.7%).
| School Level | # Students | % Students |
| Nursery / Preschool | 983 | 7.3% |
| Kindergarten | 888 | 6.6% |
| Elementary School | 2,775 | 20.7% |
| Middle School | 2,242 | 16.7% |
| High School | 2,623 | 19.5% |
| College / Undergraduate | 2,219 | 16.5% |
| Graduate / Professional | 1,694 | 12.6% |
| Total | 13,424 | 100.0% |
School Enrollment by Age by Funding Source in Reston
Out of a total of 13,424 students who are enrolled in schools in Reston, 3,114 (23.2%) attend a private institution, while the remaining 10,310 (76.8%) are enrolled in public schools. The age group of 3 to 4 year olds has the highest likelihood of being enrolled in private schools, with 545 (62.8% in the age bracket) enrolled. Conversely, the age group of 18 to 19 year olds has the lowest likelihood of being enrolled in a private school, with 686 (90.6% in the age bracket) attending a public institution.
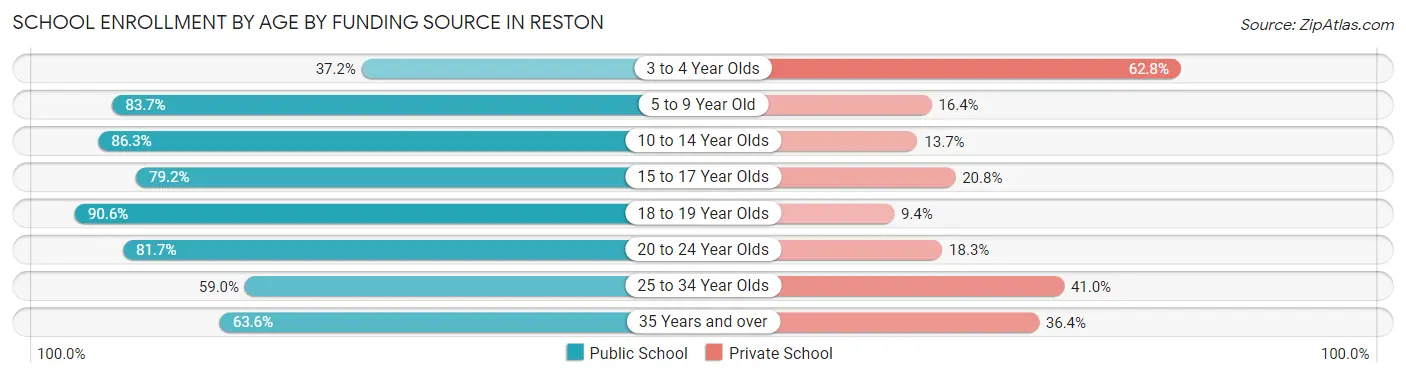
| Age Bracket | Public School | Private School |
| 3 to 4 Year Olds | 323 (37.2%) | 545 (62.8%) |
| 5 to 9 Year Old | 2,952 (83.7%) | 577 (16.4%) |
| 10 to 14 Year Olds | 2,425 (86.3%) | 386 (13.7%) |
| 15 to 17 Year Olds | 1,369 (79.2%) | 359 (20.8%) |
| 18 to 19 Year Olds | 686 (90.6%) | 71 (9.4%) |
| 20 to 24 Year Olds | 1,082 (81.7%) | 243 (18.3%) |
| 25 to 34 Year Olds | 710 (59.0%) | 494 (41.0%) |
| 35 Years and over | 765 (63.6%) | 437 (36.4%) |
| Total | 10,310 (76.8%) | 3,114 (23.2%) |
Educational Attainment by Field of Study in Reston
Business (6,574 | 18.1%), social sciences (4,840 | 13.3%), engineering (3,885 | 10.7%), computers & mathematics (3,115 | 8.6%), and literature & languages (2,831 | 7.8%) are the most common fields of study among 36,312 individuals in Reston who have obtained a bachelor's degree or higher.
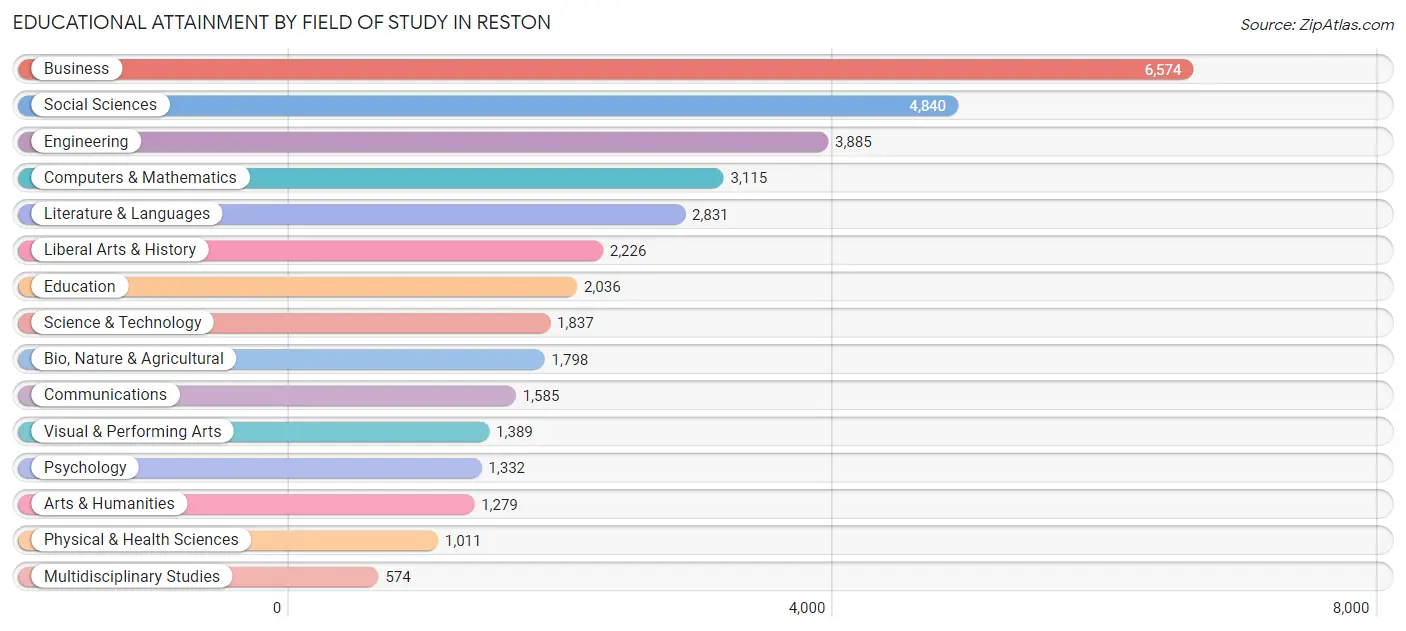
| Field of Study | # Graduates | % Graduates |
| Computers & Mathematics | 3,115 | 8.6% |
| Bio, Nature & Agricultural | 1,798 | 5.0% |
| Physical & Health Sciences | 1,011 | 2.8% |
| Psychology | 1,332 | 3.7% |
| Social Sciences | 4,840 | 13.3% |
| Engineering | 3,885 | 10.7% |
| Multidisciplinary Studies | 574 | 1.6% |
| Science & Technology | 1,837 | 5.1% |
| Business | 6,574 | 18.1% |
| Education | 2,036 | 5.6% |
| Literature & Languages | 2,831 | 7.8% |
| Liberal Arts & History | 2,226 | 6.1% |
| Visual & Performing Arts | 1,389 | 3.8% |
| Communications | 1,585 | 4.4% |
| Arts & Humanities | 1,279 | 3.5% |
| Total | 36,312 | 100.0% |
Transportation & Commute in Reston
Vehicle Availability by Sex in Reston
The most prevalent vehicle ownership categories in Reston are males with 2 vehicles (9,028, accounting for 49.1%) and females with 2 vehicles (8,656, making up 50.7%).
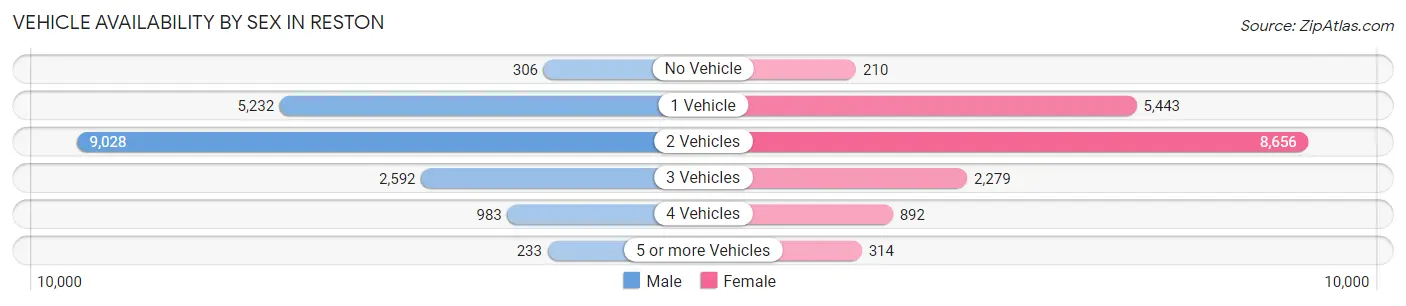
| Vehicles Available | Male | Female |
| No Vehicle | 306 (1.7%) | 210 (1.2%) |
| 1 Vehicle | 5,232 (28.5%) | 5,443 (30.6%) |
| 2 Vehicles | 9,028 (49.1%) | 8,656 (48.6%) |
| 3 Vehicles | 2,592 (14.1%) | 2,279 (12.8%) |
| 4 Vehicles | 983 (5.3%) | 892 (5.0%) |
| 5 or more Vehicles | 233 (1.3%) | 314 (1.8%) |
| Total | 18,374 (100.0%) | 17,794 (100.0%) |
Commute Time in Reston
The most frequently occuring commute durations in Reston are 20 to 24 minutes (4,216 commuters, 15.7%), 30 to 34 minutes (3,710 commuters, 13.9%), and 15 to 19 minutes (3,621 commuters, 13.5%).
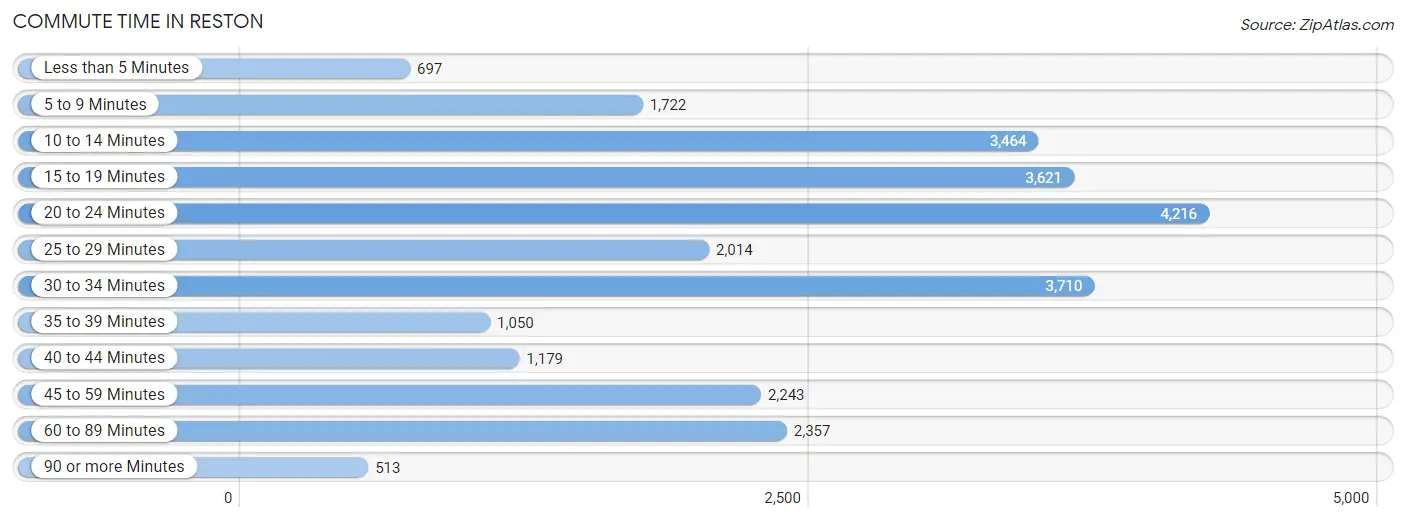
| Commute Time | # Commuters | % Commuters |
| Less than 5 Minutes | 697 | 2.6% |
| 5 to 9 Minutes | 1,722 | 6.4% |
| 10 to 14 Minutes | 3,464 | 12.9% |
| 15 to 19 Minutes | 3,621 | 13.5% |
| 20 to 24 Minutes | 4,216 | 15.7% |
| 25 to 29 Minutes | 2,014 | 7.5% |
| 30 to 34 Minutes | 3,710 | 13.9% |
| 35 to 39 Minutes | 1,050 | 3.9% |
| 40 to 44 Minutes | 1,179 | 4.4% |
| 45 to 59 Minutes | 2,243 | 8.4% |
| 60 to 89 Minutes | 2,357 | 8.8% |
| 90 or more Minutes | 513 | 1.9% |
Commute Time by Sex in Reston
The most common commute times in Reston are 20 to 24 minutes (2,114 commuters, 15.5%) for males and 20 to 24 minutes (2,102 commuters, 16.0%) for females.
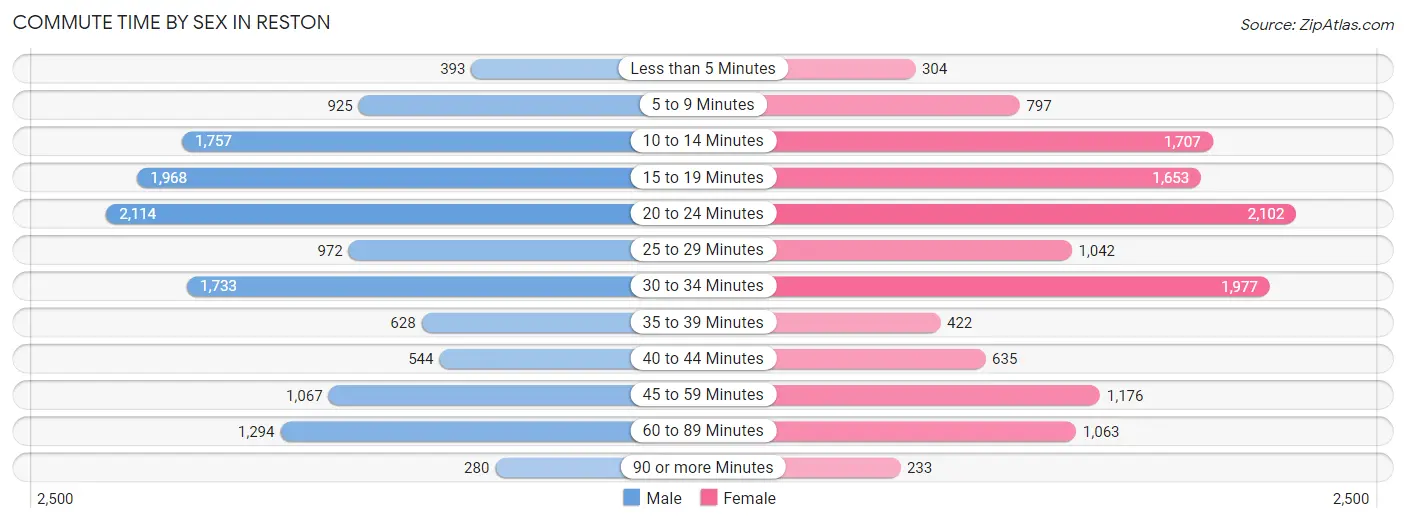
| Commute Time | Male | Female |
| Less than 5 Minutes | 393 (2.9%) | 304 (2.3%) |
| 5 to 9 Minutes | 925 (6.8%) | 797 (6.1%) |
| 10 to 14 Minutes | 1,757 (12.9%) | 1,707 (13.0%) |
| 15 to 19 Minutes | 1,968 (14.4%) | 1,653 (12.6%) |
| 20 to 24 Minutes | 2,114 (15.5%) | 2,102 (16.0%) |
| 25 to 29 Minutes | 972 (7.1%) | 1,042 (8.0%) |
| 30 to 34 Minutes | 1,733 (12.7%) | 1,977 (15.1%) |
| 35 to 39 Minutes | 628 (4.6%) | 422 (3.2%) |
| 40 to 44 Minutes | 544 (4.0%) | 635 (4.8%) |
| 45 to 59 Minutes | 1,067 (7.8%) | 1,176 (9.0%) |
| 60 to 89 Minutes | 1,294 (9.5%) | 1,063 (8.1%) |
| 90 or more Minutes | 280 (2.1%) | 233 (1.8%) |
Time of Departure to Work by Sex in Reston
The most frequent times of departure to work in Reston are 8:00 AM to 8:29 AM (2,328, 17.0%) for males and 8:00 AM to 8:29 AM (2,239, 17.1%) for females.
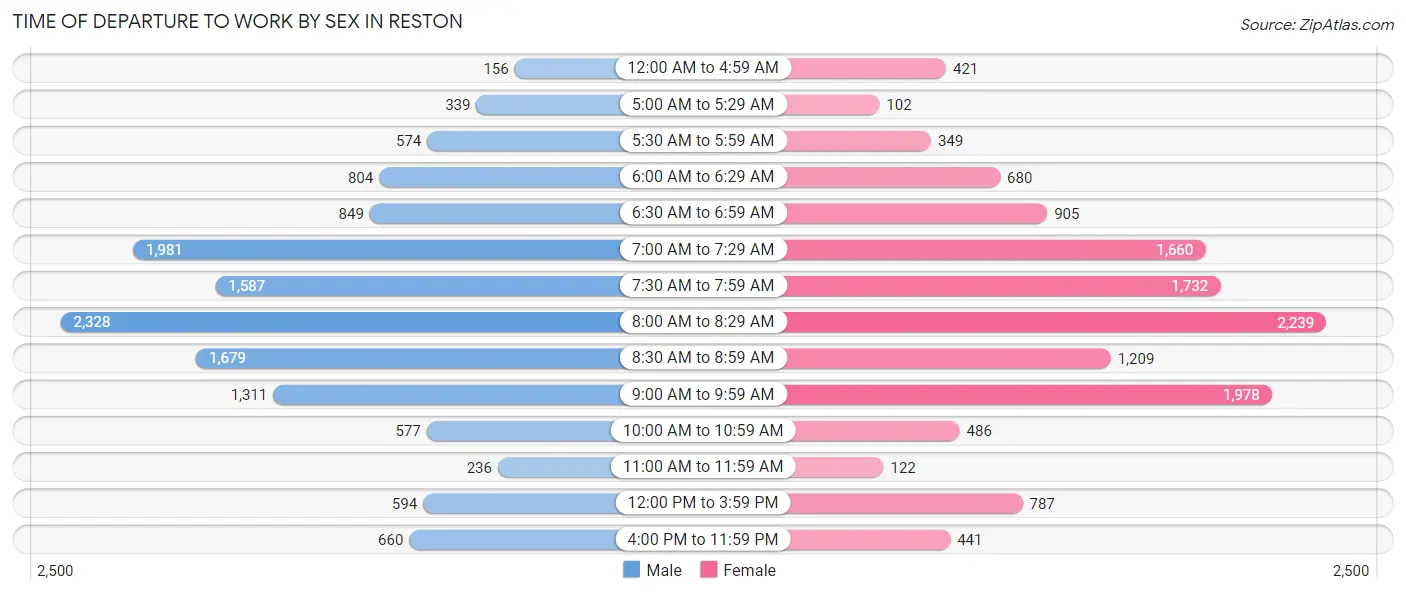
| Time of Departure | Male | Female |
| 12:00 AM to 4:59 AM | 156 (1.1%) | 421 (3.2%) |
| 5:00 AM to 5:29 AM | 339 (2.5%) | 102 (0.8%) |
| 5:30 AM to 5:59 AM | 574 (4.2%) | 349 (2.7%) |
| 6:00 AM to 6:29 AM | 804 (5.9%) | 680 (5.2%) |
| 6:30 AM to 6:59 AM | 849 (6.2%) | 905 (6.9%) |
| 7:00 AM to 7:29 AM | 1,981 (14.5%) | 1,660 (12.7%) |
| 7:30 AM to 7:59 AM | 1,587 (11.6%) | 1,732 (13.2%) |
| 8:00 AM to 8:29 AM | 2,328 (17.0%) | 2,239 (17.1%) |
| 8:30 AM to 8:59 AM | 1,679 (12.3%) | 1,209 (9.2%) |
| 9:00 AM to 9:59 AM | 1,311 (9.6%) | 1,978 (15.1%) |
| 10:00 AM to 10:59 AM | 577 (4.2%) | 486 (3.7%) |
| 11:00 AM to 11:59 AM | 236 (1.7%) | 122 (0.9%) |
| 12:00 PM to 3:59 PM | 594 (4.3%) | 787 (6.0%) |
| 4:00 PM to 11:59 PM | 660 (4.8%) | 441 (3.4%) |
| Total | 13,675 (100.0%) | 13,111 (100.0%) |
Housing Occupancy in Reston
Occupancy by Ownership in Reston
Of the total 27,808 dwellings in Reston, owner-occupied units account for 17,091 (61.5%), while renter-occupied units make up 10,717 (38.5%).
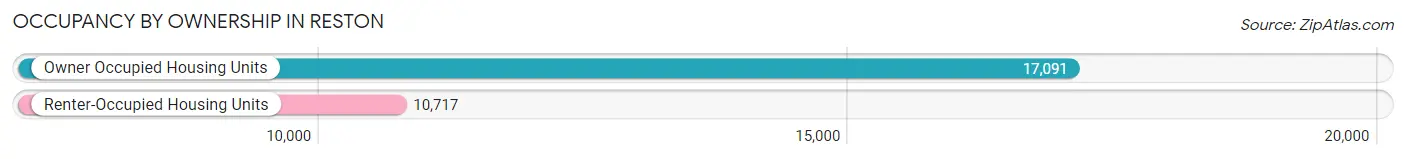
| Occupancy | # Housing Units | % Housing Units |
| Owner Occupied Housing Units | 17,091 | 61.5% |
| Renter-Occupied Housing Units | 10,717 | 38.5% |
| Total Occupied Housing Units | 27,808 | 100.0% |
Occupancy by Household Size in Reston
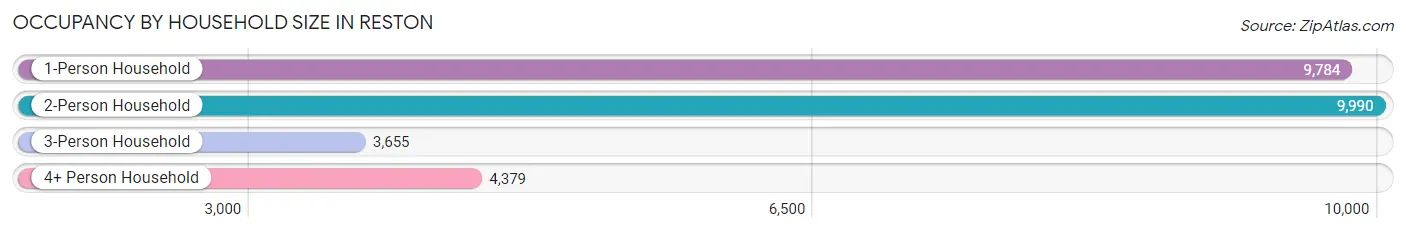
| Household Size | # Housing Units | % Housing Units |
| 1-Person Household | 9,784 | 35.2% |
| 2-Person Household | 9,990 | 35.9% |
| 3-Person Household | 3,655 | 13.1% |
| 4+ Person Household | 4,379 | 15.8% |
| Total Housing Units | 27,808 | 100.0% |
Occupancy by Ownership by Household Size in Reston
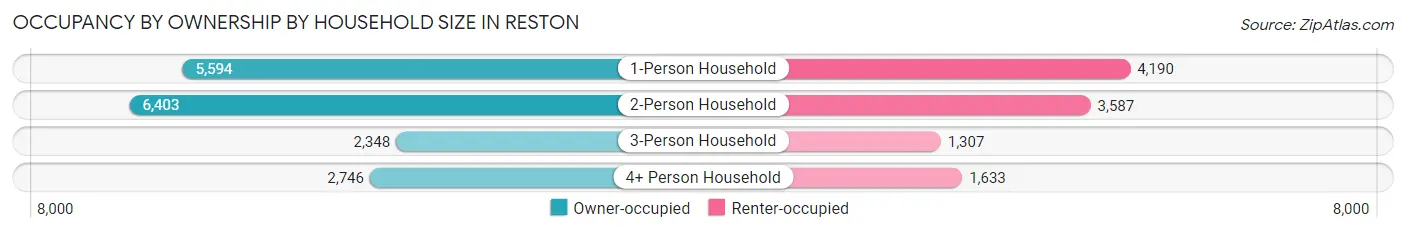
| Household Size | Owner-occupied | Renter-occupied |
| 1-Person Household | 5,594 (57.2%) | 4,190 (42.8%) |
| 2-Person Household | 6,403 (64.1%) | 3,587 (35.9%) |
| 3-Person Household | 2,348 (64.2%) | 1,307 (35.8%) |
| 4+ Person Household | 2,746 (62.7%) | 1,633 (37.3%) |
| Total Housing Units | 17,091 (61.5%) | 10,717 (38.5%) |
Occupancy by Educational Attainment in Reston
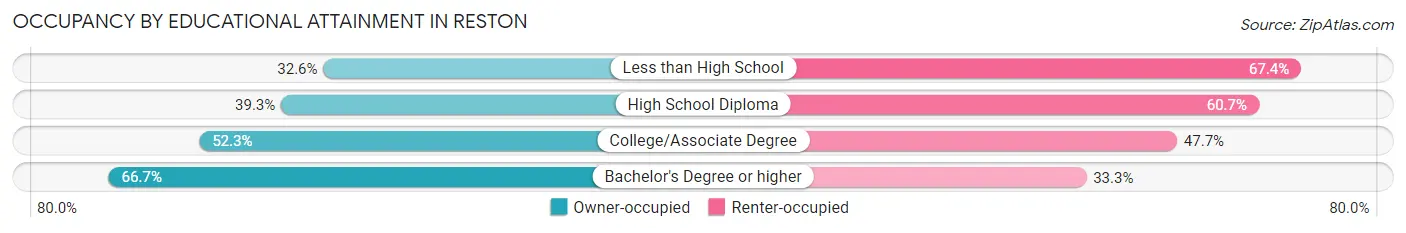
| Household Size | Owner-occupied | Renter-occupied |
| Less than High School | 315 (32.6%) | 651 (67.4%) |
| High School Diploma | 772 (39.3%) | 1,192 (60.7%) |
| College/Associate Degree | 2,128 (52.3%) | 1,941 (47.7%) |
| Bachelor's Degree or higher | 13,876 (66.7%) | 6,933 (33.3%) |
Occupancy by Age of Householder in Reston
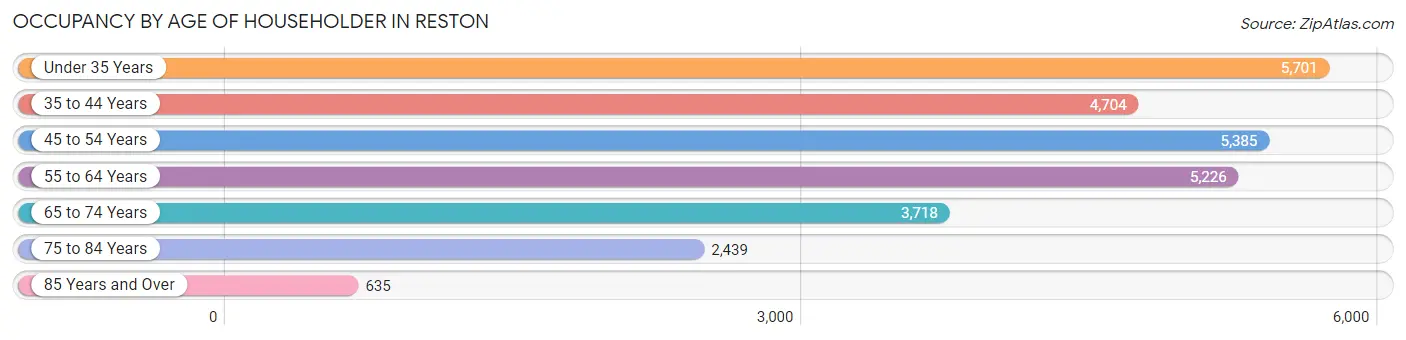
| Age Bracket | # Households | % Households |
| Under 35 Years | 5,701 | 20.5% |
| 35 to 44 Years | 4,704 | 16.9% |
| 45 to 54 Years | 5,385 | 19.4% |
| 55 to 64 Years | 5,226 | 18.8% |
| 65 to 74 Years | 3,718 | 13.4% |
| 75 to 84 Years | 2,439 | 8.8% |
| 85 Years and Over | 635 | 2.3% |
| Total | 27,808 | 100.0% |
Housing Finances in Reston
Median Income by Occupancy in Reston
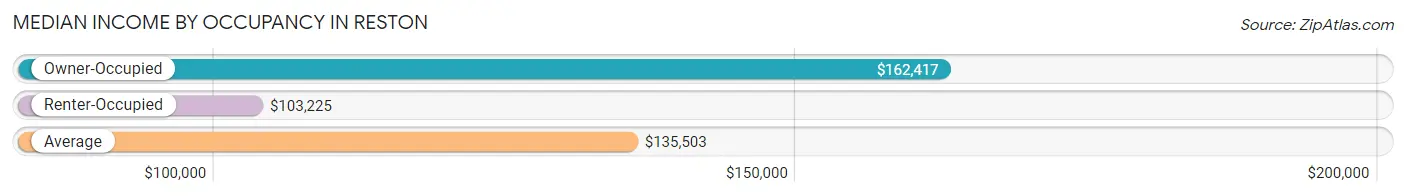
| Occupancy Type | # Households | Median Income |
| Owner-Occupied | 17,091 (61.5%) | $162,417 |
| Renter-Occupied | 10,717 (38.5%) | $103,225 |
| Average | 27,808 (100.0%) | $135,503 |
Occupancy by Householder Income Bracket in Reston
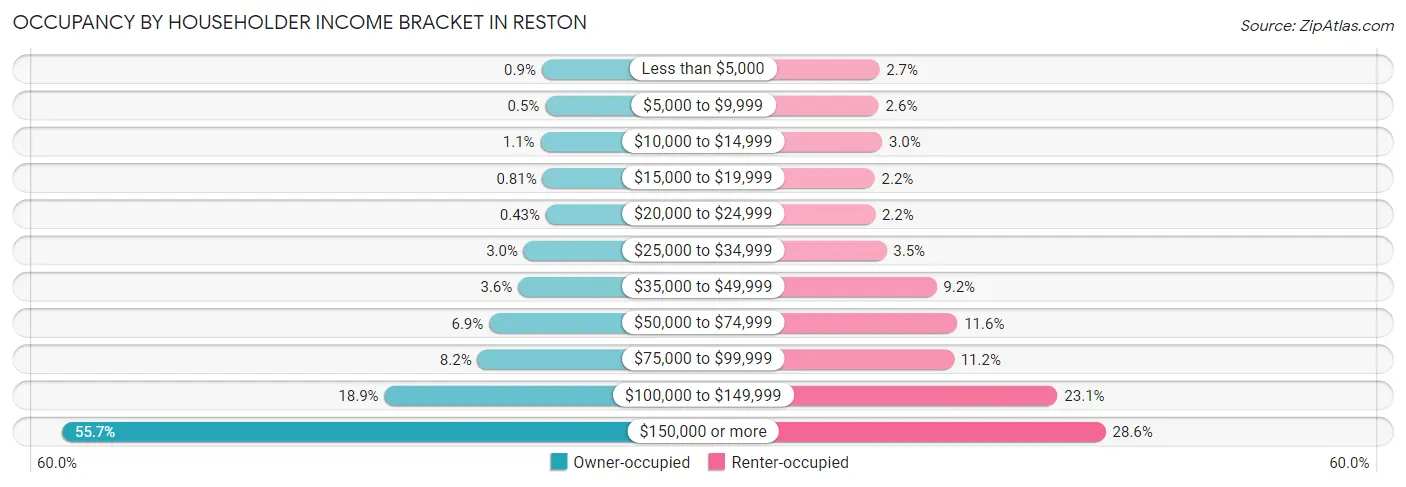
| Income Bracket | Owner-occupied | Renter-occupied |
| Less than $5,000 | 154 (0.9%) | 290 (2.7%) |
| $5,000 to $9,999 | 86 (0.5%) | 283 (2.6%) |
| $10,000 to $14,999 | 180 (1.1%) | 325 (3.0%) |
| $15,000 to $19,999 | 138 (0.8%) | 234 (2.2%) |
| $20,000 to $24,999 | 73 (0.4%) | 238 (2.2%) |
| $25,000 to $34,999 | 505 (2.9%) | 377 (3.5%) |
| $35,000 to $49,999 | 615 (3.6%) | 989 (9.2%) |
| $50,000 to $74,999 | 1,181 (6.9%) | 1,245 (11.6%) |
| $75,000 to $99,999 | 1,408 (8.2%) | 1,202 (11.2%) |
| $100,000 to $149,999 | 3,227 (18.9%) | 2,472 (23.1%) |
| $150,000 or more | 9,524 (55.7%) | 3,062 (28.6%) |
| Total | 17,091 (100.0%) | 10,717 (100.0%) |
Monthly Housing Cost Tiers in Reston
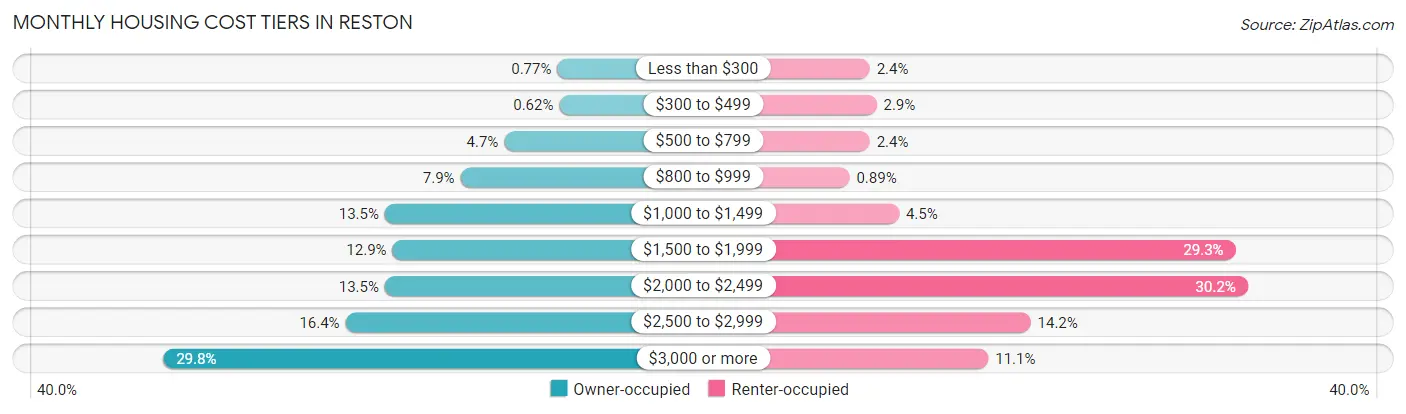
| Monthly Cost | Owner-occupied | Renter-occupied |
| Less than $300 | 132 (0.8%) | 255 (2.4%) |
| $300 to $499 | 106 (0.6%) | 309 (2.9%) |
| $500 to $799 | 800 (4.7%) | 255 (2.4%) |
| $800 to $999 | 1,351 (7.9%) | 95 (0.9%) |
| $1,000 to $1,499 | 2,303 (13.5%) | 486 (4.5%) |
| $1,500 to $1,999 | 2,206 (12.9%) | 3,141 (29.3%) |
| $2,000 to $2,499 | 2,303 (13.5%) | 3,238 (30.2%) |
| $2,500 to $2,999 | 2,798 (16.4%) | 1,525 (14.2%) |
| $3,000 or more | 5,092 (29.8%) | 1,191 (11.1%) |
| Total | 17,091 (100.0%) | 10,717 (100.0%) |
Physical Housing Characteristics in Reston
Housing Structures in Reston
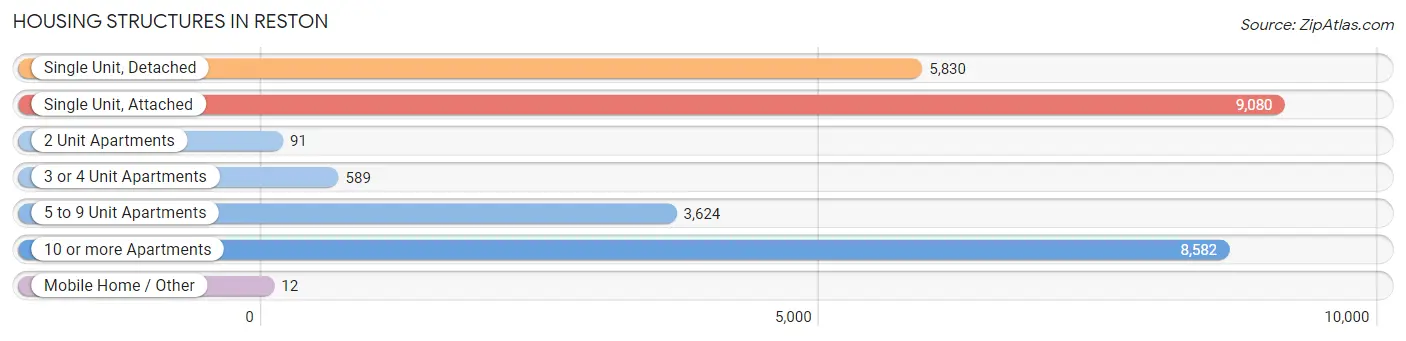
| Structure Type | # Housing Units | % Housing Units |
| Single Unit, Detached | 5,830 | 21.0% |
| Single Unit, Attached | 9,080 | 32.7% |
| 2 Unit Apartments | 91 | 0.3% |
| 3 or 4 Unit Apartments | 589 | 2.1% |
| 5 to 9 Unit Apartments | 3,624 | 13.0% |
| 10 or more Apartments | 8,582 | 30.9% |
| Mobile Home / Other | 12 | 0.0% |
| Total | 27,808 | 100.0% |
Housing Structures by Occupancy in Reston
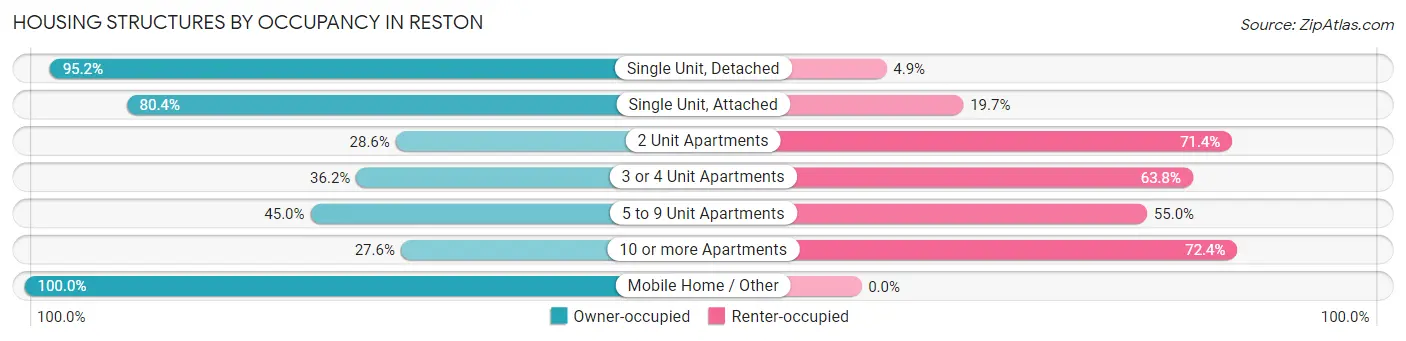
| Structure Type | Owner-occupied | Renter-occupied |
| Single Unit, Detached | 5,547 (95.2%) | 283 (4.9%) |
| Single Unit, Attached | 7,296 (80.3%) | 1,784 (19.7%) |
| 2 Unit Apartments | 26 (28.6%) | 65 (71.4%) |
| 3 or 4 Unit Apartments | 213 (36.2%) | 376 (63.8%) |
| 5 to 9 Unit Apartments | 1,630 (45.0%) | 1,994 (55.0%) |
| 10 or more Apartments | 2,367 (27.6%) | 6,215 (72.4%) |
| Mobile Home / Other | 12 (100.0%) | 0 (0.0%) |
| Total | 17,091 (61.5%) | 10,717 (38.5%) |
Housing Structures by Number of Rooms in Reston
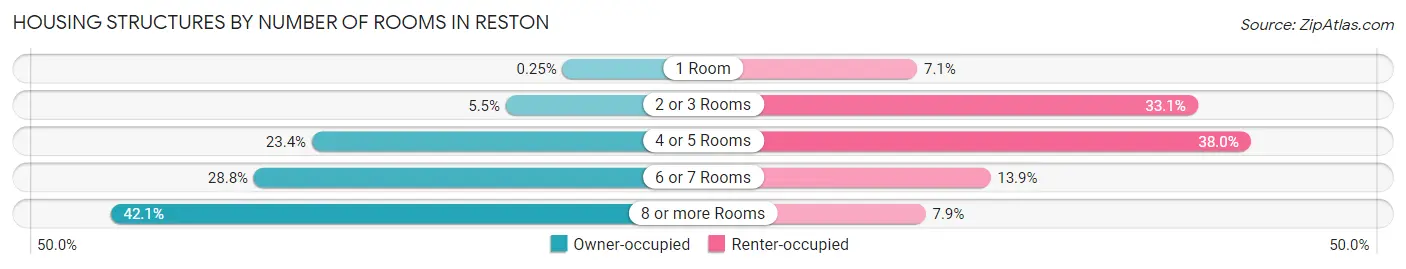
| Number of Rooms | Owner-occupied | Renter-occupied |
| 1 Room | 42 (0.3%) | 764 (7.1%) |
| 2 or 3 Rooms | 939 (5.5%) | 3,544 (33.1%) |
| 4 or 5 Rooms | 4,004 (23.4%) | 4,069 (38.0%) |
| 6 or 7 Rooms | 4,920 (28.8%) | 1,491 (13.9%) |
| 8 or more Rooms | 7,186 (42.0%) | 849 (7.9%) |
| Total | 17,091 (100.0%) | 10,717 (100.0%) |
Housing Structure by Heating Type in Reston
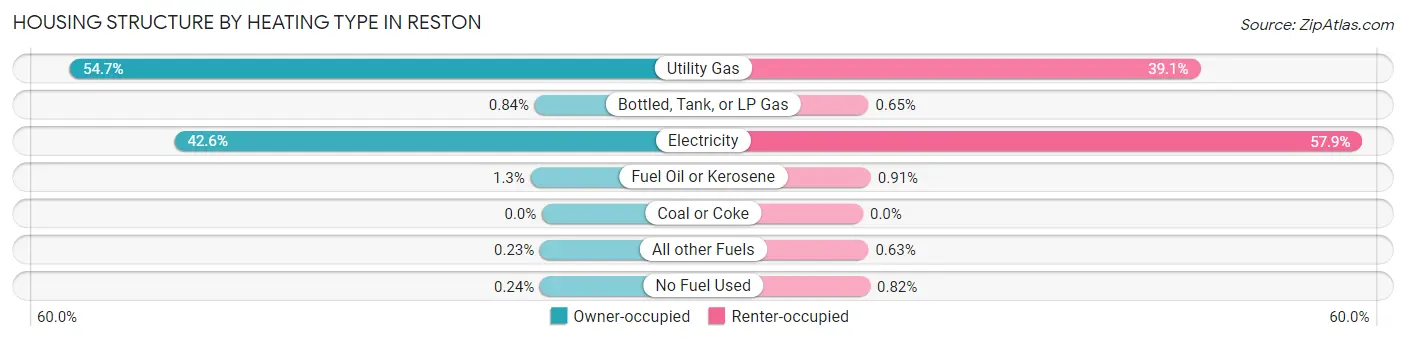
| Heating Type | Owner-occupied | Renter-occupied |
| Utility Gas | 9,354 (54.7%) | 4,190 (39.1%) |
| Bottled, Tank, or LP Gas | 144 (0.8%) | 70 (0.6%) |
| Electricity | 7,284 (42.6%) | 6,203 (57.9%) |
| Fuel Oil or Kerosene | 228 (1.3%) | 98 (0.9%) |
| Coal or Coke | 0 (0.0%) | 0 (0.0%) |
| All other Fuels | 40 (0.2%) | 68 (0.6%) |
| No Fuel Used | 41 (0.2%) | 88 (0.8%) |
| Total | 17,091 (100.0%) | 10,717 (100.0%) |
Household Vehicle Usage in Reston
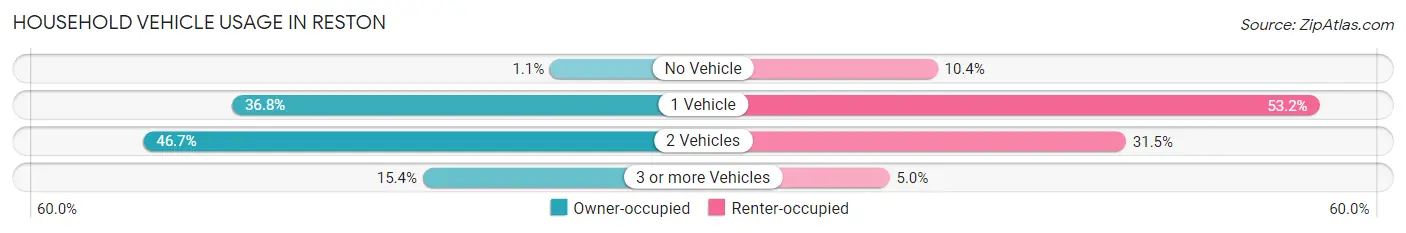
| Vehicles per Household | Owner-occupied | Renter-occupied |
| No Vehicle | 195 (1.1%) | 1,112 (10.4%) |
| 1 Vehicle | 6,284 (36.8%) | 5,696 (53.1%) |
| 2 Vehicles | 7,982 (46.7%) | 3,373 (31.5%) |
| 3 or more Vehicles | 2,630 (15.4%) | 536 (5.0%) |
| Total | 17,091 (100.0%) | 10,717 (100.0%) |
Real Estate & Mortgages in Reston
Real Estate and Mortgage Overview in Reston
| Characteristic | Without Mortgage | With Mortgage |
| Housing Units | 4,404 | 12,687 |
| Median Property Value | $624,600 | $580,000 |
| Median Household Income | $131,045 | $7,609 |
| Monthly Housing Costs | $987 | $5,092 |
| Real Estate Taxes | $6,878 | $243 |
Property Value by Mortgage Status in Reston
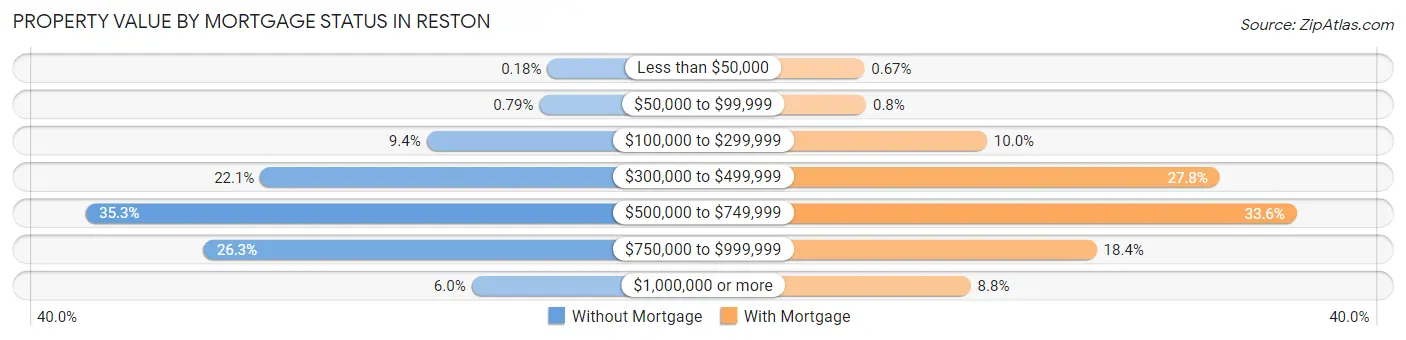
| Property Value | Without Mortgage | With Mortgage |
| Less than $50,000 | 8 (0.2%) | 85 (0.7%) |
| $50,000 to $99,999 | 35 (0.8%) | 102 (0.8%) |
| $100,000 to $299,999 | 413 (9.4%) | 1,270 (10.0%) |
| $300,000 to $499,999 | 971 (22.1%) | 3,521 (27.8%) |
| $500,000 to $749,999 | 1,555 (35.3%) | 4,266 (33.6%) |
| $750,000 to $999,999 | 1,160 (26.3%) | 2,330 (18.4%) |
| $1,000,000 or more | 262 (5.9%) | 1,113 (8.8%) |
| Total | 4,404 (100.0%) | 12,687 (100.0%) |
Household Income by Mortgage Status in Reston
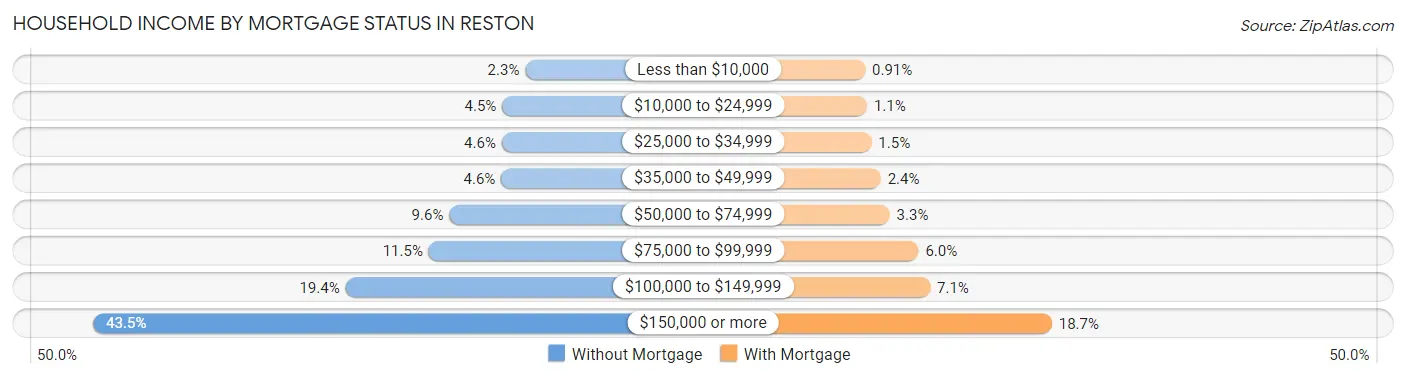
| Household Income | Without Mortgage | With Mortgage |
| Less than $10,000 | 102 (2.3%) | 115 (0.9%) |
| $10,000 to $24,999 | 199 (4.5%) | 138 (1.1%) |
| $25,000 to $34,999 | 201 (4.6%) | 192 (1.5%) |
| $35,000 to $49,999 | 203 (4.6%) | 304 (2.4%) |
| $50,000 to $74,999 | 421 (9.6%) | 412 (3.3%) |
| $75,000 to $99,999 | 507 (11.5%) | 760 (6.0%) |
| $100,000 to $149,999 | 856 (19.4%) | 901 (7.1%) |
| $150,000 or more | 1,915 (43.5%) | 2,371 (18.7%) |
| Total | 4,404 (100.0%) | 12,687 (100.0%) |
Property Value to Household Income Ratio in Reston
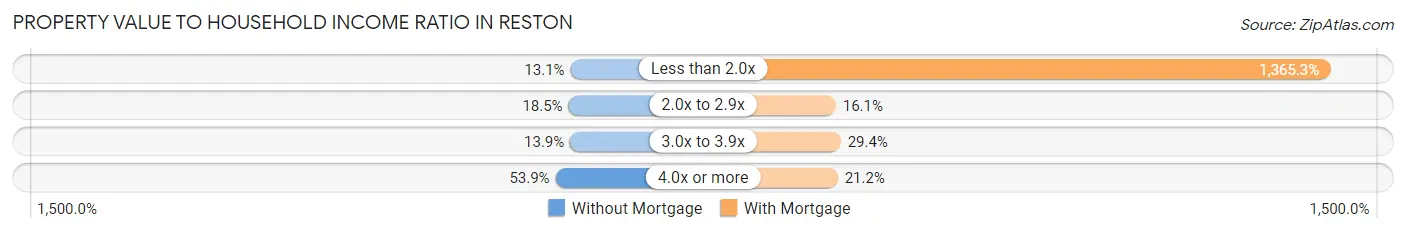
| Value-to-Income Ratio | Without Mortgage | With Mortgage |
| Less than 2.0x | 578 (13.1%) | 173,213 (1,365.3%) |
| 2.0x to 2.9x | 815 (18.5%) | 2,041 (16.1%) |
| 3.0x to 3.9x | 614 (13.9%) | 3,731 (29.4%) |
| 4.0x or more | 2,372 (53.9%) | 2,687 (21.2%) |
| Total | 4,404 (100.0%) | 12,687 (100.0%) |
Real Estate Taxes by Mortgage Status in Reston
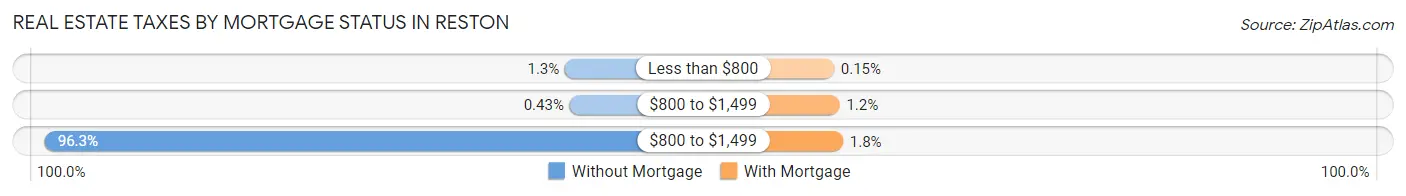
| Property Taxes | Without Mortgage | With Mortgage |
| Less than $800 | 56 (1.3%) | 19 (0.2%) |
| $800 to $1,499 | 19 (0.4%) | 148 (1.2%) |
| $800 to $1,499 | 4,241 (96.3%) | 227 (1.8%) |
| Total | 4,404 (100.0%) | 12,687 (100.0%) |
Health & Disability in Reston
Health Insurance Coverage by Age in Reston
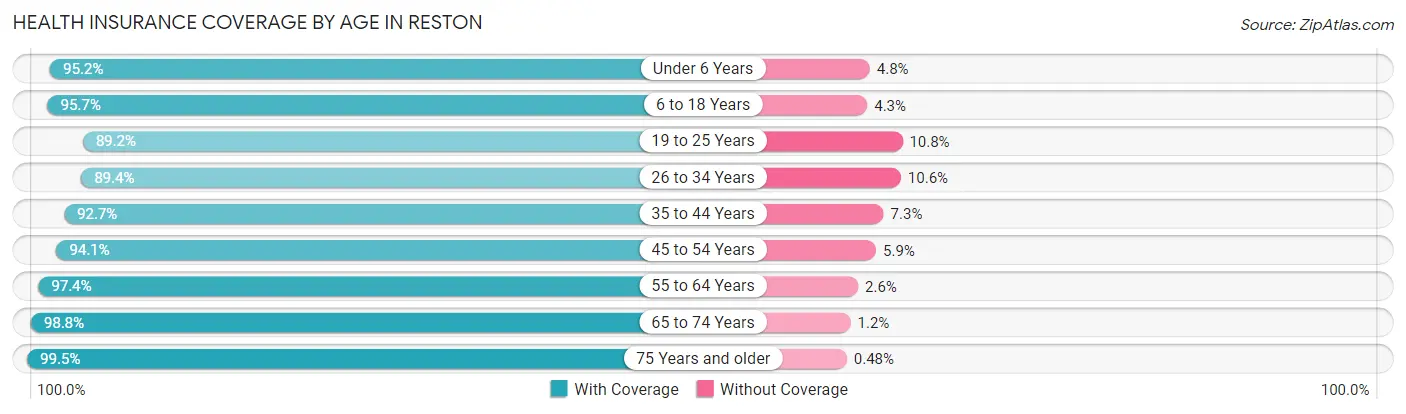
| Age Bracket | With Coverage | Without Coverage |
| Under 6 Years | 3,939 (95.2%) | 197 (4.8%) |
| 6 to 18 Years | 7,903 (95.7%) | 354 (4.3%) |
| 19 to 25 Years | 4,637 (89.2%) | 564 (10.8%) |
| 26 to 34 Years | 8,246 (89.4%) | 974 (10.6%) |
| 35 to 44 Years | 7,849 (92.7%) | 622 (7.3%) |
| 45 to 54 Years | 7,735 (94.1%) | 488 (5.9%) |
| 55 to 64 Years | 8,075 (97.4%) | 213 (2.6%) |
| 65 to 74 Years | 5,705 (98.8%) | 68 (1.2%) |
| 75 Years and older | 4,535 (99.5%) | 22 (0.5%) |
| Total | 58,624 (94.4%) | 3,502 (5.6%) |
Health Insurance Coverage by Citizenship Status in Reston
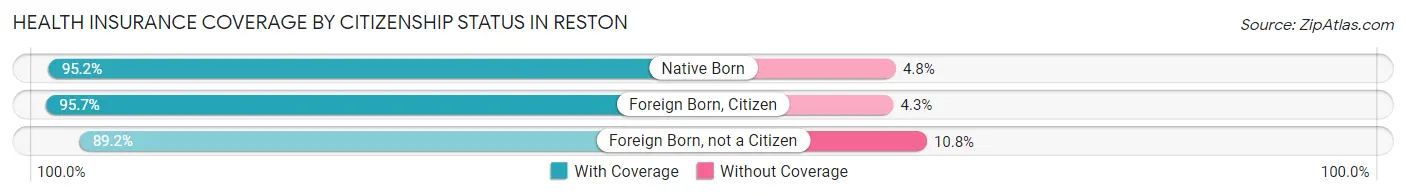
| Citizenship Status | With Coverage | Without Coverage |
| Native Born | 3,939 (95.2%) | 197 (4.8%) |
| Foreign Born, Citizen | 7,903 (95.7%) | 354 (4.3%) |
| Foreign Born, not a Citizen | 4,637 (89.2%) | 564 (10.8%) |
Health Insurance Coverage by Household Income in Reston
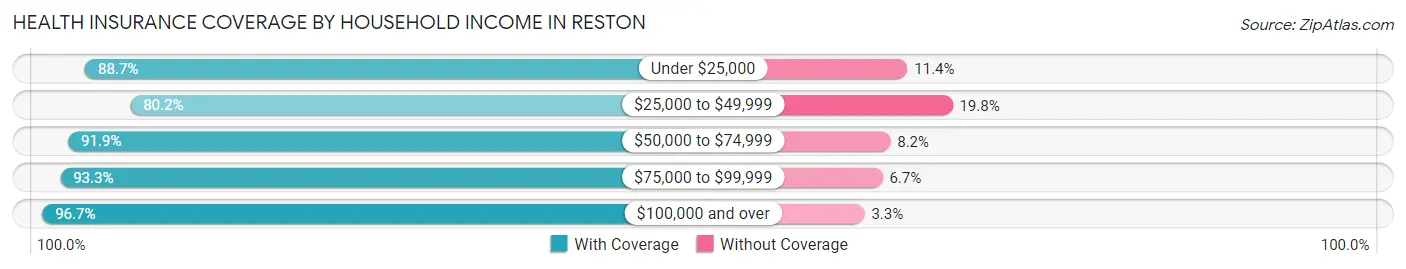
| Household Income | With Coverage | Without Coverage |
| Under $25,000 | 2,750 (88.6%) | 352 (11.4%) |
| $25,000 to $49,999 | 3,683 (80.2%) | 909 (19.8%) |
| $50,000 to $74,999 | 4,972 (91.8%) | 441 (8.2%) |
| $75,000 to $99,999 | 4,774 (93.3%) | 342 (6.7%) |
| $100,000 and over | 42,394 (96.7%) | 1,450 (3.3%) |
Public vs Private Health Insurance Coverage by Age in Reston
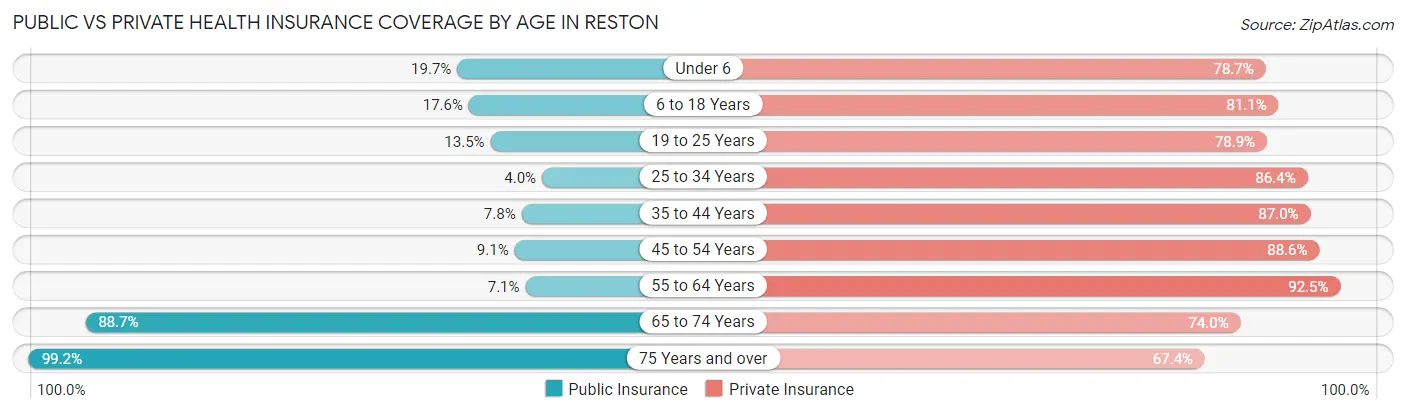
| Age Bracket | Public Insurance | Private Insurance |
| Under 6 | 815 (19.7%) | 3,253 (78.6%) |
| 6 to 18 Years | 1,449 (17.5%) | 6,693 (81.1%) |
| 19 to 25 Years | 704 (13.5%) | 4,104 (78.9%) |
| 25 to 34 Years | 366 (4.0%) | 7,969 (86.4%) |
| 35 to 44 Years | 658 (7.8%) | 7,368 (87.0%) |
| 45 to 54 Years | 746 (9.1%) | 7,287 (88.6%) |
| 55 to 64 Years | 584 (7.0%) | 7,668 (92.5%) |
| 65 to 74 Years | 5,123 (88.7%) | 4,272 (74.0%) |
| 75 Years and over | 4,522 (99.2%) | 3,071 (67.4%) |
| Total | 14,967 (24.1%) | 51,685 (83.2%) |
Disability Status by Sex by Age in Reston
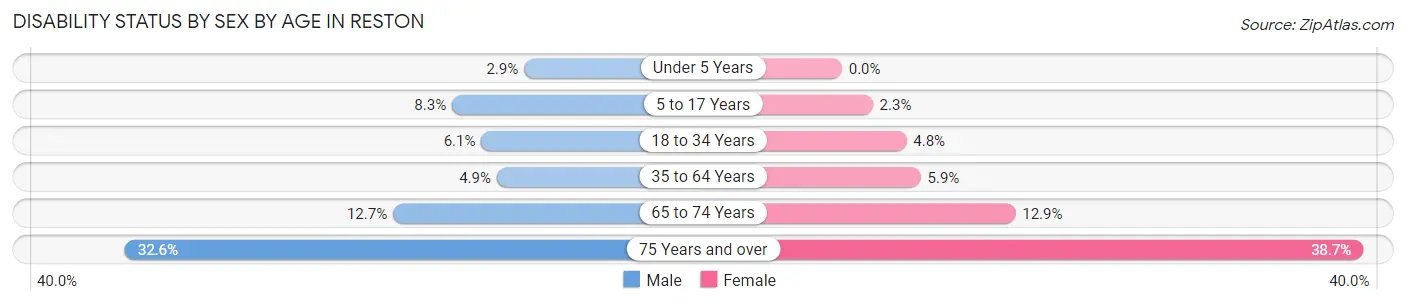
| Age Bracket | Male | Female |
| Under 5 Years | 50 (2.9%) | 0 (0.0%) |
| 5 to 17 Years | 364 (8.3%) | 91 (2.3%) |
| 18 to 34 Years | 429 (6.1%) | 380 (4.8%) |
| 35 to 64 Years | 605 (4.9%) | 746 (5.9%) |
| 65 to 74 Years | 302 (12.7%) | 436 (12.9%) |
| 75 Years and over | 715 (32.6%) | 914 (38.7%) |
Disability Class by Sex by Age in Reston
Disability Class: Hearing Difficulty
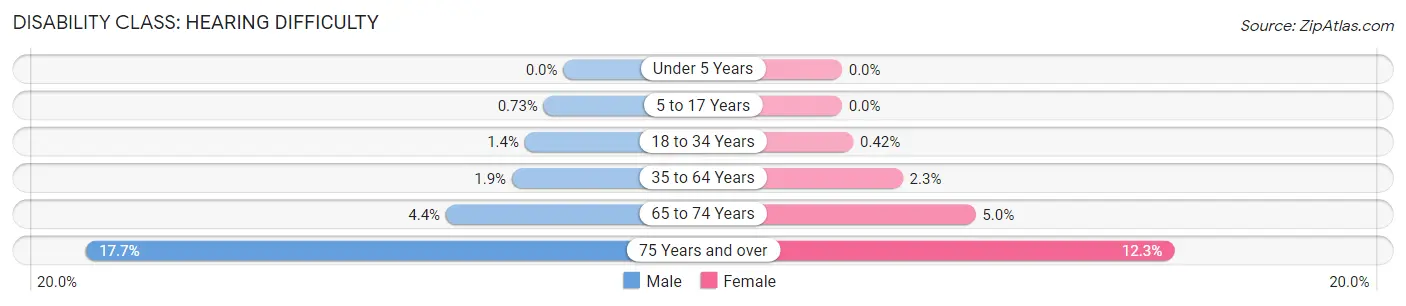
| Age Bracket | Male | Female |
| Under 5 Years | 0 (0.0%) | 0 (0.0%) |
| 5 to 17 Years | 32 (0.7%) | 0 (0.0%) |
| 18 to 34 Years | 101 (1.4%) | 33 (0.4%) |
| 35 to 64 Years | 234 (1.9%) | 288 (2.3%) |
| 65 to 74 Years | 104 (4.4%) | 168 (5.0%) |
| 75 Years and over | 389 (17.7%) | 291 (12.3%) |
Disability Class: Vision Difficulty
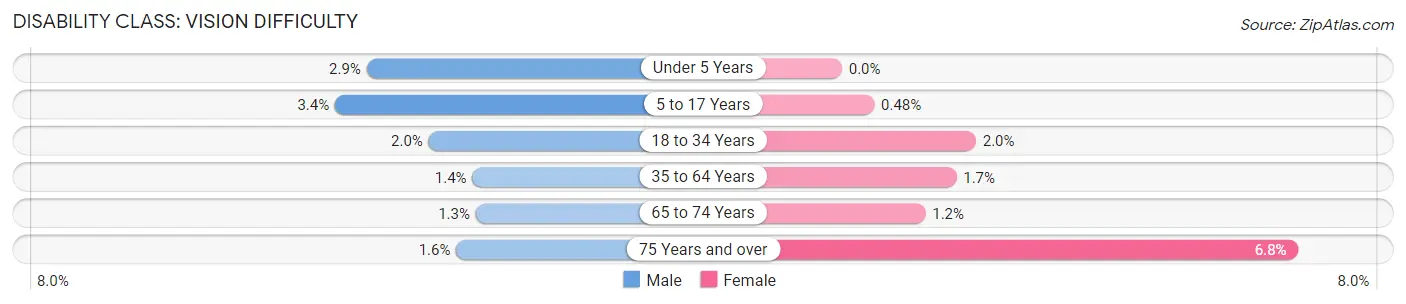
| Age Bracket | Male | Female |
| Under 5 Years | 50 (2.9%) | 0 (0.0%) |
| 5 to 17 Years | 149 (3.4%) | 19 (0.5%) |
| 18 to 34 Years | 141 (2.0%) | 158 (2.0%) |
| 35 to 64 Years | 165 (1.3%) | 217 (1.7%) |
| 65 to 74 Years | 31 (1.3%) | 42 (1.2%) |
| 75 Years and over | 35 (1.6%) | 160 (6.8%) |
Disability Class: Cognitive Difficulty
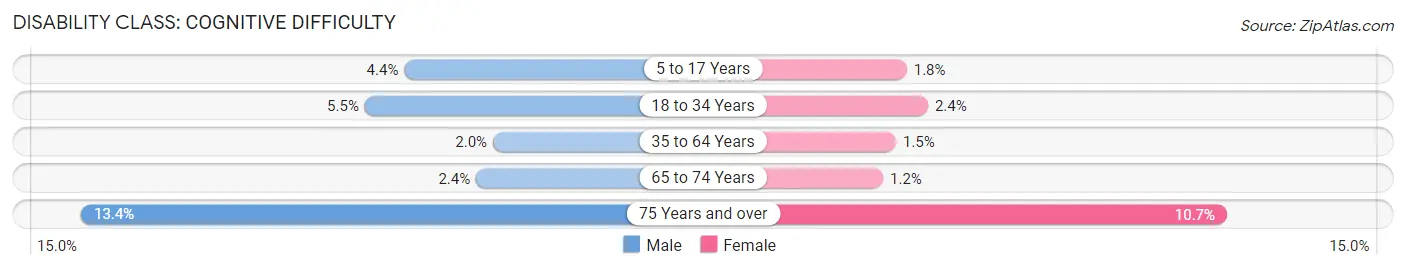
| Age Bracket | Male | Female |
| 5 to 17 Years | 195 (4.4%) | 72 (1.8%) |
| 18 to 34 Years | 389 (5.5%) | 190 (2.4%) |
| 35 to 64 Years | 240 (2.0%) | 193 (1.5%) |
| 65 to 74 Years | 58 (2.4%) | 39 (1.1%) |
| 75 Years and over | 295 (13.4%) | 253 (10.7%) |
Disability Class: Ambulatory Difficulty
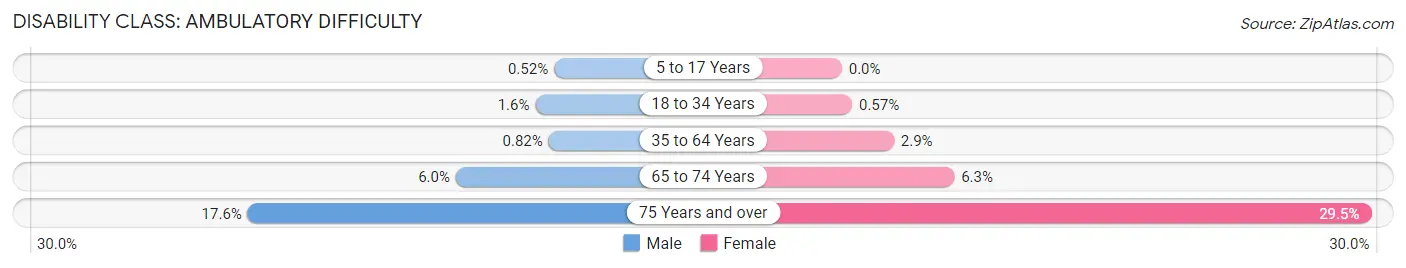
| Age Bracket | Male | Female |
| 5 to 17 Years | 23 (0.5%) | 0 (0.0%) |
| 18 to 34 Years | 110 (1.6%) | 45 (0.6%) |
| 35 to 64 Years | 100 (0.8%) | 369 (2.9%) |
| 65 to 74 Years | 143 (6.0%) | 212 (6.3%) |
| 75 Years and over | 386 (17.6%) | 696 (29.5%) |
Disability Class: Self-Care Difficulty
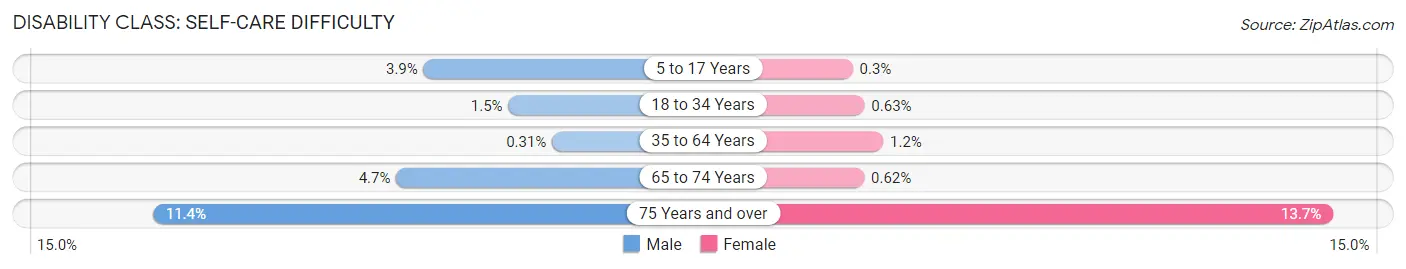
| Age Bracket | Male | Female |
| 5 to 17 Years | 171 (3.9%) | 12 (0.3%) |
| 18 to 34 Years | 108 (1.5%) | 50 (0.6%) |
| 35 to 64 Years | 38 (0.3%) | 146 (1.1%) |
| 65 to 74 Years | 111 (4.6%) | 21 (0.6%) |
| 75 Years and over | 251 (11.4%) | 323 (13.7%) |
Technology Access in Reston
Computing Device Access in Reston
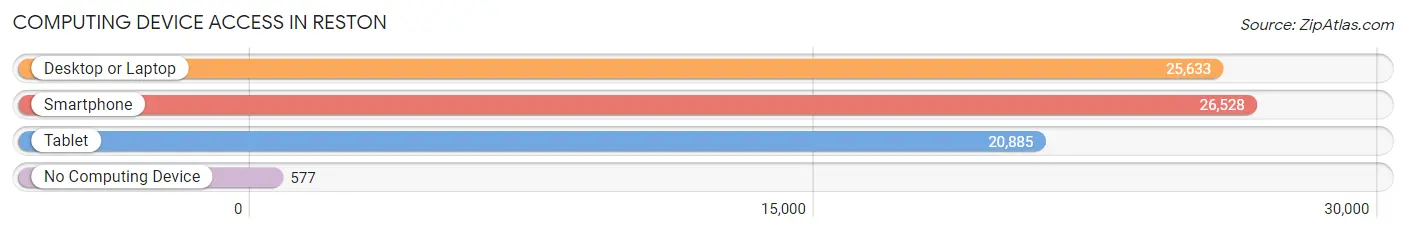
| Device Type | # Households | % Households |
| Desktop or Laptop | 25,633 | 92.2% |
| Smartphone | 26,528 | 95.4% |
| Tablet | 20,885 | 75.1% |
| No Computing Device | 577 | 2.1% |
| Total | 27,808 | 100.0% |
Internet Access in Reston
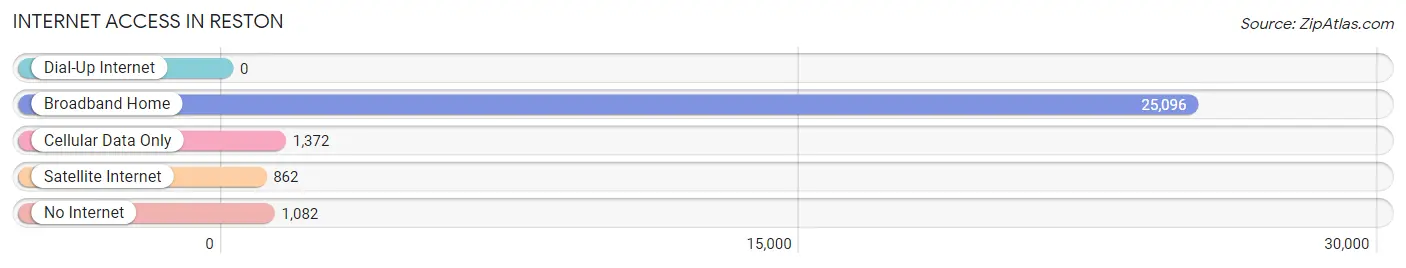
| Internet Type | # Households | % Households |
| Dial-Up Internet | 0 | 0.0% |
| Broadband Home | 25,096 | 90.2% |
| Cellular Data Only | 1,372 | 4.9% |
| Satellite Internet | 862 | 3.1% |
| No Internet | 1,082 | 3.9% |
| Total | 27,808 | 100.0% |
Reston Summary
Reston, Virginia is a census-designated place (CDP) located in Fairfax County, Virginia. It is part of the Washington metropolitan area and is located approximately 20 miles west of Washington, D.C. The population of Reston was 58,404 as of the 2010 census.
History
Reston was founded in 1964 by Robert E. Simon, Jr., a real estate developer. Simon envisioned a planned community that would be a model for suburban development. He named the community after his initials, R.E.S. The first section of Reston was completed in 1966 and included the first high-rise residential and commercial buildings in the area.
Reston was the first modern planned community in the United States and was designed to be a self-contained community with its own shopping centers, schools, and recreational facilities. The community was designed to be pedestrian-friendly and to provide a variety of housing options.
Geography
Reston is located in Fairfax County, Virginia, approximately 20 miles west of Washington, D.C. The CDP has a total area of 15.2 square miles, of which 14.9 square miles is land and 0.3 square miles is water.
Reston is located in the Piedmont region of Virginia and is characterized by rolling hills and wooded areas. The area is drained by the Difficult Run and the Potomac River.
Economy
Reston is home to a variety of businesses, including technology, finance, and professional services. The largest employers in the area are the U.S. Department of Defense, Northrop Grumman, and Booz Allen Hamilton.
Reston is also home to a number of corporate headquarters, including Comscore, Leidos, and Neustar. The area is also home to a number of technology companies, including AOL, Microsoft, and Oracle.
Demographics
As of the 2010 census, the population of Reston was 58,404. The racial makeup of the CDP was 68.2% White, 15.3% Asian, 8.2% African American, 0.3% Native American, 0.1% Pacific Islander, and 5.9% from other races. Hispanic or Latino of any race were 11.2% of the population.
The median income for a household in Reston was $107,811, and the median income for a family was $125,919. The per capita income for the CDP was $50,945. About 4.2% of families and 5.7% of the population were below the poverty line, including 6.3% of those under age 18 and 4.2% of those age 65 or over.
Common Questions
What is Per Capita Income in Reston?
Per Capita income in Reston is $75,953.
What is the Median Family Income in Reston?
Median Family Income in Reston is $162,917.
What is the Median Household income in Reston?
Median Household Income in Reston is $135,503.
What is Income or Wage Gap in Reston?
Income or Wage Gap in Reston is 39.1%.
Women in Reston earn 60.9 cents for every dollar earned by a man.
What is Family Income Deficit in Reston?
Family Income Deficit in Reston is $10,762.
Families that are below poverty line in Reston earn $10,762 less on average than the poverty threshold level.
What is Inequality or Gini Index in Reston?
Inequality or Gini Index in Reston is 0.42.
What is the Total Population of Reston?
Total Population of Reston is 62,339.
What is the Total Male Population of Reston?
Total Male Population of Reston is 30,148.
What is the Total Female Population of Reston?
Total Female Population of Reston is 32,191.
What is the Ratio of Males per 100 Females in Reston?
There are 93.65 Males per 100 Females in Reston.
What is the Ratio of Females per 100 Males in Reston?
There are 106.78 Females per 100 Males in Reston.
What is the Median Population Age in Reston?
Median Population Age in Reston is 40.1 Years.
What is the Average Family Size in Reston
Average Family Size in Reston is 2.9 People.
What is the Average Household Size in Reston
Average Household Size in Reston is 2.2 People.
How Large is the Labor Force in Reston?
There are 38,258 People in the Labor Forcein in Reston.
What is the Percentage of People in the Labor Force in Reston?
74.1% of People are in the Labor Force in Reston.
What is the Unemployment Rate in Reston?
Unemployment Rate in Reston is 4.3%.