Zip Codes with the Highest Percentage of Population Employed in Architecture & Engineering in Virginia
RELATED REPORTS & OPTIONS
Architecture & Engineering
Virginia
Compare Zip Codes
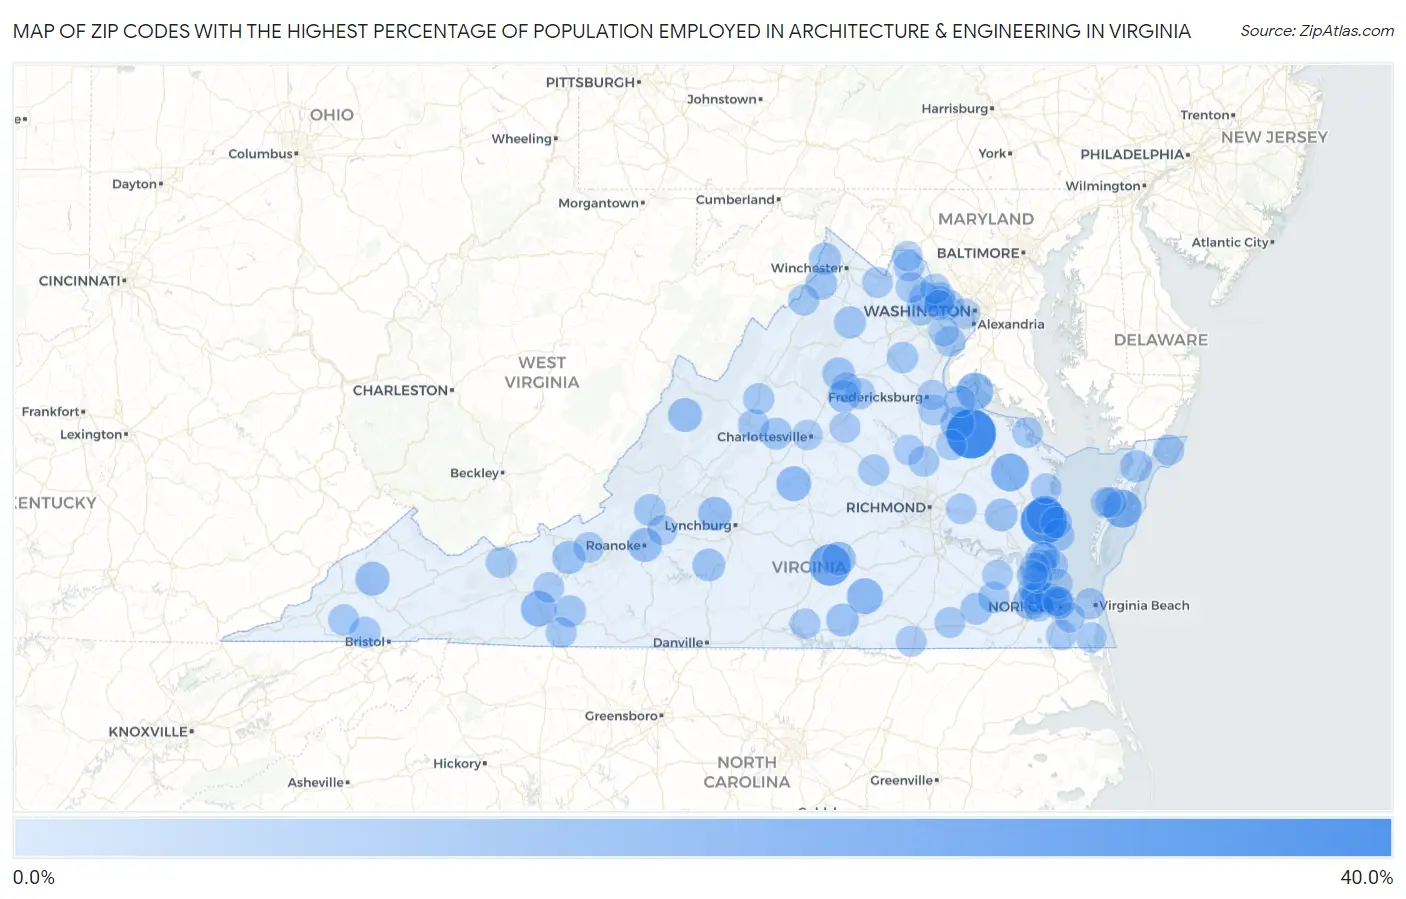
Map of Zip Codes with the Highest Percentage of Population Employed in Architecture & Engineering in Virginia
0.0%
40.0%
Zip Codes with the Highest Percentage of Population Employed in Architecture & Engineering in Virginia
| Zip Code | % Employed | vs State | vs National | |
| 1. | 22476 | 38.5% | 2.3%(+36.2)#1 | 2.1%(+36.3)#30 |
| 2. | 23128 | 31.9% | 2.3%(+29.6)#2 | 2.1%(+29.8)#48 |
| 3. | 23942 | 23.4% | 2.3%(+21.1)#3 | 2.1%(+21.2)#75 |
| 4. | 23423 | 17.4% | 2.3%(+15.1)#4 | 2.1%(+15.3)#119 |
| 5. | 23050 | 17.1% | 2.3%(+14.8)#5 | 2.1%(+14.9)#121 |
| 6. | 22504 | 16.9% | 2.3%(+14.6)#6 | 2.1%(+14.8)#123 |
| 7. | 22448 | 15.8% | 2.3%(+13.4)#7 | 2.1%(+13.6)#136 |
| 8. | 23938 | 13.8% | 2.3%(+11.4)#8 | 2.1%(+11.6)#177 |
| 9. | 24312 | 13.3% | 2.3%(+11.0)#9 | 2.1%(+11.1)#190 |
| 10. | 24562 | 11.9% | 2.3%(+9.57)#10 | 2.1%(+9.73)#248 |
| 11. | 22535 | 10.8% | 2.3%(+8.53)#11 | 2.1%(+8.69)#292 |
| 12. | 24272 | 10.3% | 2.3%(+8.04)#12 | 2.1%(+8.20)#321 |
| 13. | 24011 | 10.3% | 2.3%(+7.96)#13 | 2.1%(+8.12)#326 |
| 14. | 23432 | 10.2% | 2.3%(+7.93)#14 | 2.1%(+8.08)#330 |
| 15. | 23922 | 10.1% | 2.3%(+7.75)#15 | 2.1%(+7.91)#335 |
| 16. | 24487 | 10.0% | 2.3%(+7.70)#16 | 2.1%(+7.85)#340 |
| 17. | 24536 | 9.8% | 2.3%(+7.50)#17 | 2.1%(+7.65)#356 |
| 18. | 24058 | 8.8% | 2.3%(+6.47)#18 | 2.1%(+6.62)#448 |
| 19. | 23433 | 8.4% | 2.3%(+6.08)#19 | 2.1%(+6.23)#505 |
| 20. | 23970 | 8.3% | 2.3%(+6.04)#20 | 2.1%(+6.20)#509 |
| 21. | 23011 | 8.2% | 2.3%(+5.86)#21 | 2.1%(+6.01)#544 |
| 22. | 24571 | 8.0% | 2.3%(+5.68)#22 | 2.1%(+5.84)#578 |
| 23. | 22722 | 8.0% | 2.3%(+5.67)#23 | 2.1%(+5.82)#580 |
| 24. | 22732 | 7.8% | 2.3%(+5.50)#24 | 2.1%(+5.65)#609 |
| 25. | 23308 | 7.4% | 2.3%(+5.05)#25 | 2.1%(+5.21)#680 |
| 26. | 23436 | 7.0% | 2.3%(+4.68)#26 | 2.1%(+4.84)#754 |
| 27. | 22637 | 6.9% | 2.3%(+4.63)#27 | 2.1%(+4.79)#768 |
| 28. | 22640 | 6.8% | 2.3%(+4.52)#28 | 2.1%(+4.68)#791 |
| 29. | 24090 | 6.6% | 2.3%(+4.28)#29 | 2.1%(+4.43)#857 |
| 30. | 22641 | 6.6% | 2.3%(+4.26)#30 | 2.1%(+4.42)#864 |
| 31. | 22943 | 6.5% | 2.3%(+4.23)#31 | 2.1%(+4.39)#875 |
| 32. | 23878 | 6.5% | 2.3%(+4.18)#32 | 2.1%(+4.34)#895 |
| 33. | 24325 | 6.5% | 2.3%(+4.17)#33 | 2.1%(+4.33)#897 |
| 34. | 23692 | 6.3% | 2.3%(+4.00)#34 | 2.1%(+4.15)#957 |
| 35. | 23138 | 6.0% | 2.3%(+3.73)#35 | 2.1%(+3.88)#1,066 |
| 36. | 23866 | 5.9% | 2.3%(+3.59)#36 | 2.1%(+3.74)#1,136 |
| 37. | 23109 | 5.9% | 2.3%(+3.58)#37 | 2.1%(+3.73)#1,138 |
| 38. | 22939 | 5.9% | 2.3%(+3.57)#38 | 2.1%(+3.72)#1,147 |
| 39. | 22485 | 5.9% | 2.3%(+3.55)#39 | 2.1%(+3.70)#1,156 |
| 40. | 22728 | 5.7% | 2.3%(+3.38)#40 | 2.1%(+3.54)#1,224 |
| 41. | 24258 | 5.7% | 2.3%(+3.37)#41 | 2.1%(+3.52)#1,234 |
| 42. | 24486 | 5.5% | 2.3%(+3.17)#42 | 2.1%(+3.33)#1,338 |
| 43. | 23065 | 5.4% | 2.3%(+3.06)#43 | 2.1%(+3.21)#1,411 |
| 44. | 22644 | 5.4% | 2.3%(+3.05)#44 | 2.1%(+3.21)#1,420 |
| 45. | 24250 | 5.3% | 2.3%(+3.02)#45 | 2.1%(+3.18)#1,430 |
| 46. | 23420 | 5.2% | 2.3%(+2.92)#46 | 2.1%(+3.07)#1,505 |
| 47. | 23314 | 5.2% | 2.3%(+2.85)#47 | 2.1%(+3.00)#1,558 |
| 48. | 20152 | 5.1% | 2.3%(+2.82)#48 | 2.1%(+2.98)#1,582 |
| 49. | 20194 | 5.1% | 2.3%(+2.78)#49 | 2.1%(+2.94)#1,607 |
| 50. | 24314 | 5.1% | 2.3%(+2.77)#50 | 2.1%(+2.93)#1,611 |
| 51. | 23336 | 5.1% | 2.3%(+2.76)#51 | 2.1%(+2.92)#1,618 |
| 52. | 20166 | 5.1% | 2.3%(+2.75)#52 | 2.1%(+2.91)#1,626 |
| 53. | 23451 | 5.1% | 2.3%(+2.75)#53 | 2.1%(+2.90)#1,629 |
| 54. | 24328 | 5.0% | 2.3%(+2.70)#54 | 2.1%(+2.85)#1,656 |
| 55. | 20175 | 5.0% | 2.3%(+2.69)#55 | 2.1%(+2.85)#1,664 |
| 56. | 23662 | 5.0% | 2.3%(+2.68)#56 | 2.1%(+2.83)#1,674 |
| 57. | 23047 | 4.9% | 2.3%(+2.62)#57 | 2.1%(+2.78)#1,710 |
| 58. | 23703 | 4.9% | 2.3%(+2.55)#58 | 2.1%(+2.71)#1,778 |
| 59. | 23829 | 4.8% | 2.3%(+2.51)#59 | 2.1%(+2.66)#1,825 |
| 60. | 22408 | 4.8% | 2.3%(+2.47)#60 | 2.1%(+2.62)#1,859 |
| 61. | 23879 | 4.8% | 2.3%(+2.46)#61 | 2.1%(+2.61)#1,870 |
| 62. | 20135 | 4.7% | 2.3%(+2.38)#62 | 2.1%(+2.53)#1,955 |
| 63. | 23693 | 4.6% | 2.3%(+2.34)#63 | 2.1%(+2.50)#1,981 |
| 64. | 20197 | 4.6% | 2.3%(+2.33)#64 | 2.1%(+2.49)#1,990 |
| 65. | 24324 | 4.6% | 2.3%(+2.32)#65 | 2.1%(+2.48)#1,996 |
| 66. | 24060 | 4.6% | 2.3%(+2.31)#66 | 2.1%(+2.47)#2,002 |
| 67. | 22733 | 4.6% | 2.3%(+2.31)#67 | 2.1%(+2.46)#2,005 |
| 68. | 22942 | 4.6% | 2.3%(+2.26)#68 | 2.1%(+2.41)#2,060 |
| 69. | 23517 | 4.5% | 2.3%(+2.24)#69 | 2.1%(+2.40)#2,074 |
| 70. | 22730 | 4.5% | 2.3%(+2.24)#70 | 2.1%(+2.40)#2,079 |
| 71. | 23306 | 4.5% | 2.3%(+2.22)#71 | 2.1%(+2.37)#2,098 |
| 72. | 22480 | 4.5% | 2.3%(+2.21)#72 | 2.1%(+2.36)#2,108 |
| 73. | 22125 | 4.4% | 2.3%(+2.05)#73 | 2.1%(+2.21)#2,313 |
| 74. | 23507 | 4.3% | 2.3%(+2.04)#74 | 2.1%(+2.20)#2,326 |
| 75. | 23846 | 4.3% | 2.3%(+1.98)#75 | 2.1%(+2.14)#2,383 |
| 76. | 23141 | 4.2% | 2.3%(+1.94)#76 | 2.1%(+2.10)#2,430 |
| 77. | 23968 | 4.2% | 2.3%(+1.94)#77 | 2.1%(+2.10)#2,432 |
| 78. | 22488 | 4.2% | 2.3%(+1.92)#78 | 2.1%(+2.08)#2,465 |
| 79. | 23322 | 4.2% | 2.3%(+1.88)#79 | 2.1%(+2.03)#2,512 |
| 80. | 22514 | 4.1% | 2.3%(+1.81)#80 | 2.1%(+1.97)#2,595 |
| 81. | 23457 | 4.1% | 2.3%(+1.80)#81 | 2.1%(+1.95)#2,610 |
| 82. | 23435 | 4.1% | 2.3%(+1.79)#82 | 2.1%(+1.95)#2,619 |
| 83. | 23696 | 4.1% | 2.3%(+1.79)#83 | 2.1%(+1.95)#2,620 |
| 84. | 22203 | 4.1% | 2.3%(+1.75)#84 | 2.1%(+1.91)#2,687 |
| 85. | 22904 | 4.0% | 2.3%(+1.72)#85 | 2.1%(+1.88)#2,730 |
| 86. | 22182 | 4.0% | 2.3%(+1.71)#86 | 2.1%(+1.87)#2,743 |
| 87. | 22039 | 4.0% | 2.3%(+1.65)#87 | 2.1%(+1.80)#2,844 |
| 88. | 23651 | 3.9% | 2.3%(+1.61)#88 | 2.1%(+1.76)#2,912 |
| 89. | 20190 | 3.9% | 2.3%(+1.60)#89 | 2.1%(+1.75)#2,931 |
| 90. | 23601 | 3.9% | 2.3%(+1.57)#90 | 2.1%(+1.72)#2,980 |
| 91. | 23320 | 3.8% | 2.3%(+1.54)#91 | 2.1%(+1.70)#3,009 |
| 92. | 24064 | 3.8% | 2.3%(+1.54)#92 | 2.1%(+1.69)#3,018 |
| 93. | 23602 | 3.8% | 2.3%(+1.53)#93 | 2.1%(+1.69)#3,026 |
| 94. | 20180 | 3.8% | 2.3%(+1.48)#94 | 2.1%(+1.64)#3,114 |
| 95. | 23015 | 3.8% | 2.3%(+1.48)#95 | 2.1%(+1.64)#3,115 |
| 96. | 20165 | 3.8% | 2.3%(+1.48)#96 | 2.1%(+1.64)#3,116 |
| 97. | 20191 | 3.8% | 2.3%(+1.48)#97 | 2.1%(+1.64)#3,123 |
| 98. | 23606 | 3.8% | 2.3%(+1.47)#98 | 2.1%(+1.62)#3,153 |
| 99. | 23508 | 3.8% | 2.3%(+1.46)#99 | 2.1%(+1.62)#3,158 |
| 100. | 22405 | 3.8% | 2.3%(+1.46)#100 | 2.1%(+1.61)#3,172 |
Common Questions
What are the Top 10 Zip Codes with the Highest Percentage of Population Employed in Architecture & Engineering in Virginia?
Top 10 Zip Codes with the Highest Percentage of Population Employed in Architecture & Engineering in Virginia are:
What zip code has the Highest Percentage of Population Employed in Architecture & Engineering in Virginia?
22476 has the Highest Percentage of Population Employed in Architecture & Engineering in Virginia with 38.5%.
What is the Percentage of Population Employed in Architecture & Engineering in the State of Virginia?
Percentage of Population Employed in Architecture & Engineering in Virginia is 2.3%.
What is the Percentage of Population Employed in Architecture & Engineering in the United States?
Percentage of Population Employed in Architecture & Engineering in the United States is 2.1%.