Hillsboro, VA Map & Demographics
Hillsboro Map
Hillsboro Overview
$60,185
PER CAPITA INCOME
0.29
INEQUALITY / GINI INDEX
152
TOTAL POPULATION
77
MALE POPULATION
75
FEMALE POPULATION
102.67
MALES / 100 FEMALES
97.40
FEMALES / 100 MALES
60.5
MEDIAN AGE
2.8
AVG FAMILY SIZE
2.8
AVG HOUSEHOLD SIZE
100
LABOR FORCE [ PEOPLE ]
69.9%
PERCENT IN LABOR FORCE
Hillsboro Area Codes
Income in Hillsboro
Income Overview in Hillsboro
| Characteristic | Number | Measure |
| Per Capita Income | 152 | $60,185 |
| Median Family Income | 43 | $0 |
| Mean Family Income | 43 | $165,786 |
| Median Household Income | 54 | $0 |
| Mean Household Income | 54 | $164,902 |
| Income Deficit | 43 | $0 |
| Wage / Income Gap (%) | 152 | 0.00% |
| Wage / Income Gap ($) | 152 | 100.00¢ per $1 |
| Gini / Inequality Index | 152 | 0.29 |
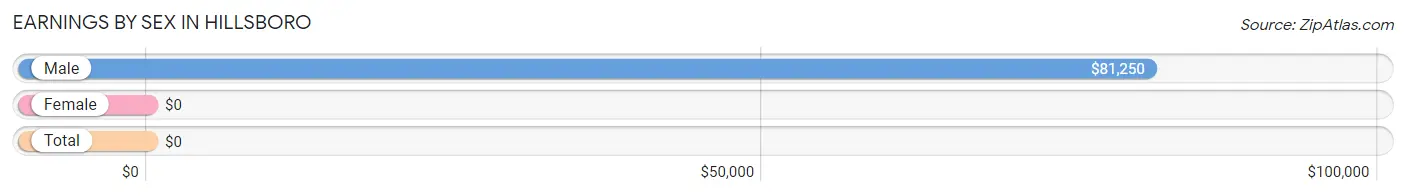
Earnings by Sex in Hillsboro
| Sex | Number | Average Earnings |
| Male | 47 (43.9%) | $81,250 |
| Female | 60 (56.1%) | $0 |
| Total | 107 (100.0%) | $0 |
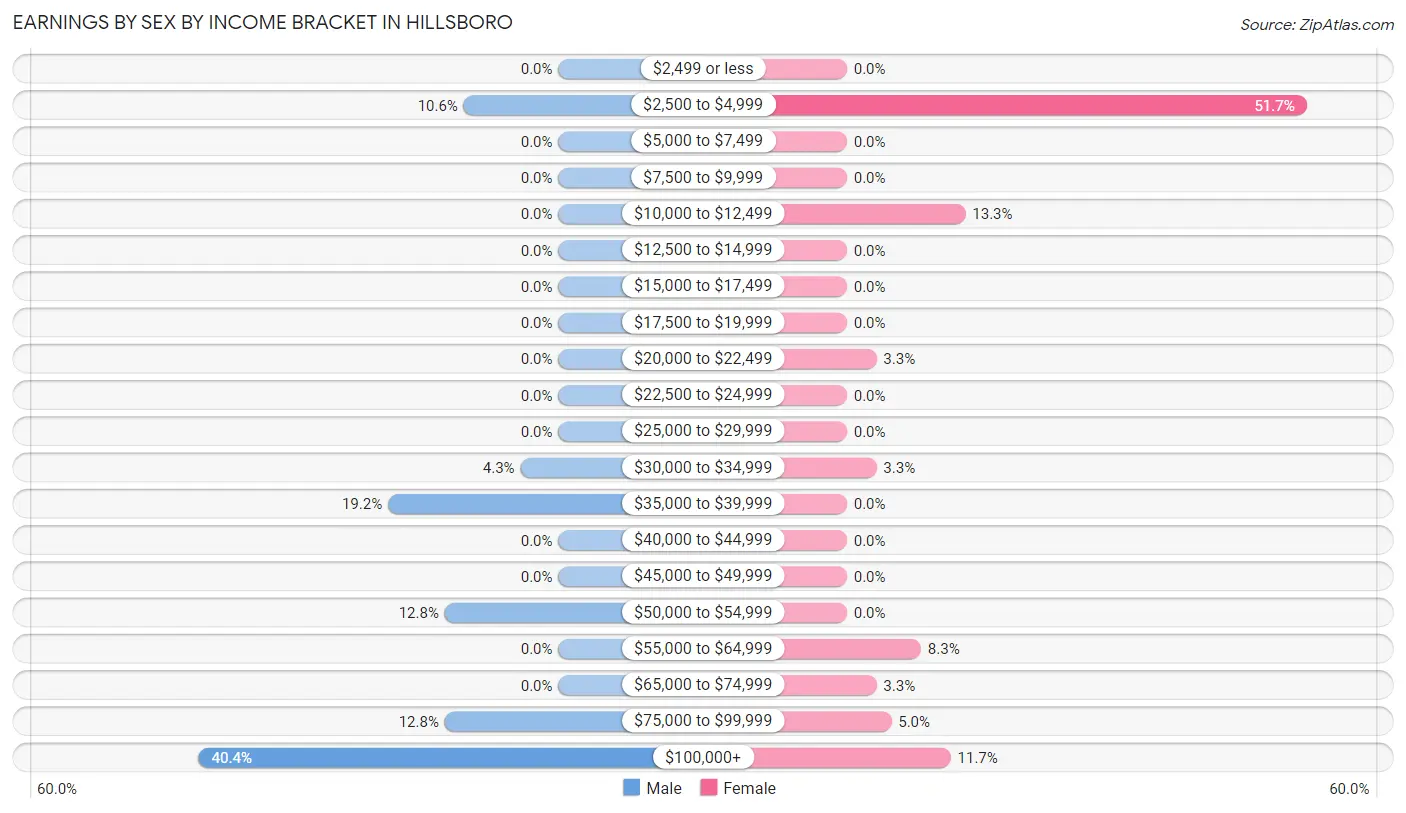
Earnings by Sex by Income Bracket in Hillsboro
The most common earnings brackets in Hillsboro are $100,000+ for men (19 | 40.4%) and $2,500 to $4,999 for women (31 | 51.7%).
| Income | Male | Female |
| $2,499 or less | 0 (0.0%) | 0 (0.0%) |
| $2,500 to $4,999 | 5 (10.6%) | 31 (51.7%) |
| $5,000 to $7,499 | 0 (0.0%) | 0 (0.0%) |
| $7,500 to $9,999 | 0 (0.0%) | 0 (0.0%) |
| $10,000 to $12,499 | 0 (0.0%) | 8 (13.3%) |
| $12,500 to $14,999 | 0 (0.0%) | 0 (0.0%) |
| $15,000 to $17,499 | 0 (0.0%) | 0 (0.0%) |
| $17,500 to $19,999 | 0 (0.0%) | 0 (0.0%) |
| $20,000 to $22,499 | 0 (0.0%) | 2 (3.3%) |
| $22,500 to $24,999 | 0 (0.0%) | 0 (0.0%) |
| $25,000 to $29,999 | 0 (0.0%) | 0 (0.0%) |
| $30,000 to $34,999 | 2 (4.3%) | 2 (3.3%) |
| $35,000 to $39,999 | 9 (19.2%) | 0 (0.0%) |
| $40,000 to $44,999 | 0 (0.0%) | 0 (0.0%) |
| $45,000 to $49,999 | 0 (0.0%) | 0 (0.0%) |
| $50,000 to $54,999 | 6 (12.8%) | 0 (0.0%) |
| $55,000 to $64,999 | 0 (0.0%) | 5 (8.3%) |
| $65,000 to $74,999 | 0 (0.0%) | 2 (3.3%) |
| $75,000 to $99,999 | 6 (12.8%) | 3 (5.0%) |
| $100,000+ | 19 (40.4%) | 7 (11.7%) |
| Total | 47 (100.0%) | 60 (100.0%) |
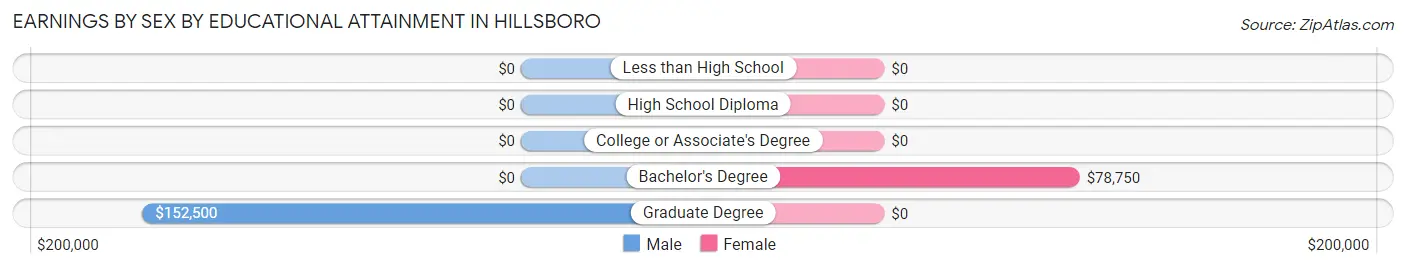
Earnings by Sex by Educational Attainment in Hillsboro
| Educational Attainment | Male Income | Female Income |
| Less than High School | - | - |
| High School Diploma | - | - |
| College or Associate's Degree | - | - |
| Bachelor's Degree | - | - |
| Graduate Degree | $152,500 | $0 |
| Total | $93,333 | $0 |
Family Income in Hillsboro
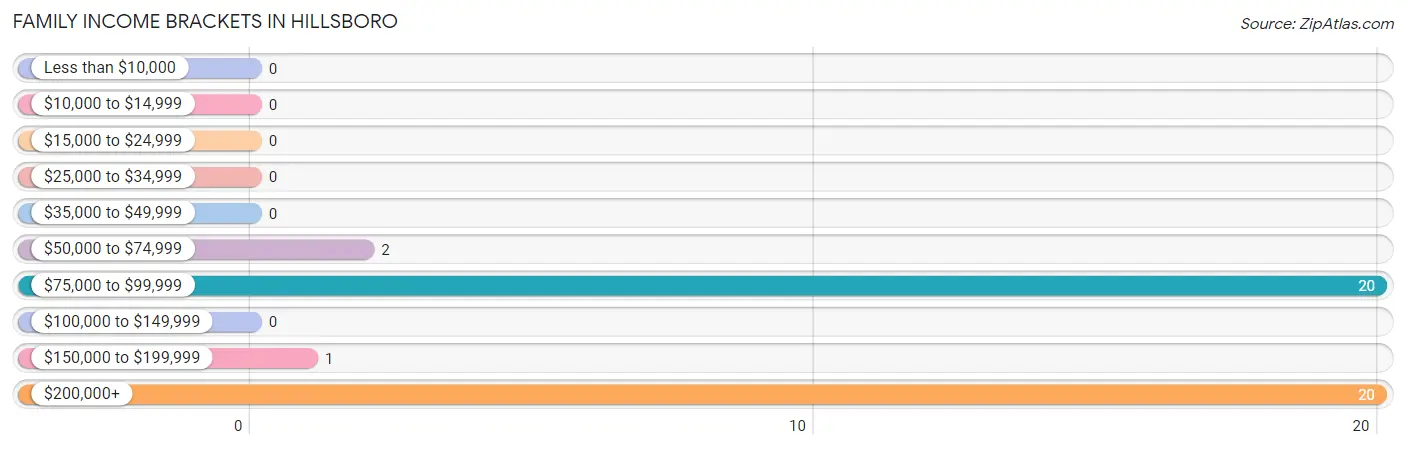
Family Income Brackets in Hillsboro
According to the Hillsboro family income data, there are 20 families falling into the $75,000 to $99,999 income range, which is the most common income bracket and makes up 46.5% of all families.
| Income Bracket | # Families | % Families |
| Less than $10,000 | 0 | 0.0% |
| $10,000 to $14,999 | 0 | 0.0% |
| $15,000 to $24,999 | 0 | 0.0% |
| $25,000 to $34,999 | 0 | 0.0% |
| $35,000 to $49,999 | 0 | 0.0% |
| $50,000 to $74,999 | 2 | 4.7% |
| $75,000 to $99,999 | 20 | 46.5% |
| $100,000 to $149,999 | 0 | 0.0% |
| $150,000 to $199,999 | 1 | 2.3% |
| $200,000+ | 20 | 46.5% |
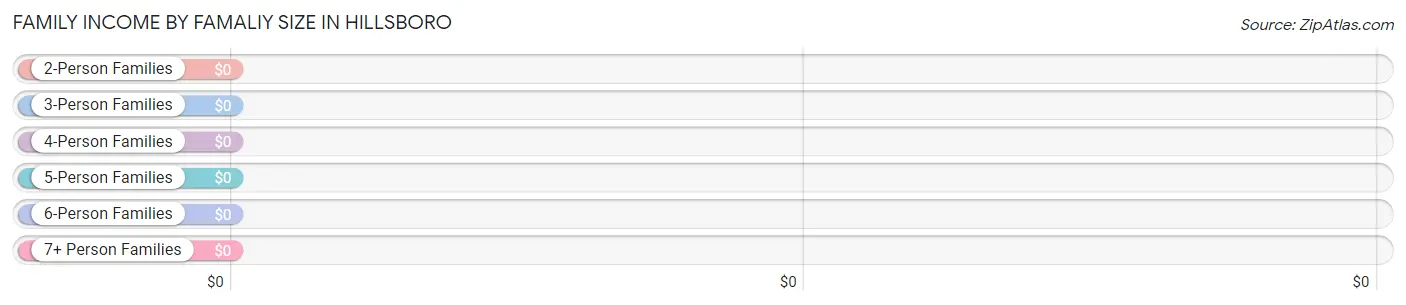
Family Income by Famaliy Size in Hillsboro
| Income Bracket | # Families | Median Income |
| 2-Person Families | 32 (74.4%) | $0 |
| 3-Person Families | 3 (7.0%) | $0 |
| 4-Person Families | 6 (14.0%) | $0 |
| 5-Person Families | 2 (4.6%) | $0 |
| 6-Person Families | 0 (0.0%) | $0 |
| 7+ Person Families | 0 (0.0%) | $0 |
| Total | 43 (100.0%) | $0 |
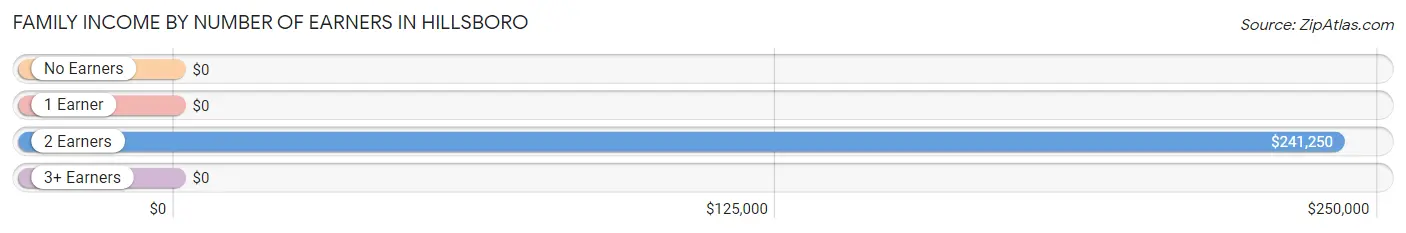
Family Income by Number of Earners in Hillsboro
| Number of Earners | # Families | Median Income |
| No Earners | 0 (0.0%) | $0 |
| 1 Earner | 21 (48.8%) | $0 |
| 2 Earners | 18 (41.9%) | $241,250 |
| 3+ Earners | 4 (9.3%) | $0 |
| Total | 43 (100.0%) | $0 |
Household Income in Hillsboro
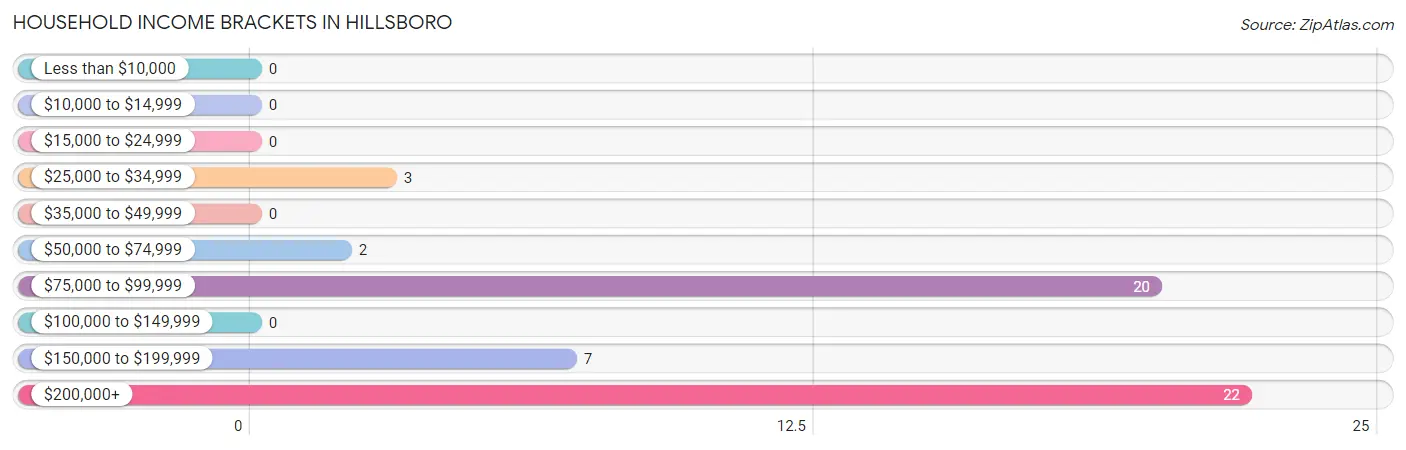
Household Income Brackets in Hillsboro
With 22 households falling in the category, the $200,000+ income range is the most frequent in Hillsboro, accounting for 40.7% of all households.
| Income Bracket | # Households | % Households |
| Less than $10,000 | 0 | 0.0% |
| $10,000 to $14,999 | 0 | 0.0% |
| $15,000 to $24,999 | 0 | 0.0% |
| $25,000 to $34,999 | 3 | 5.6% |
| $35,000 to $49,999 | 0 | 0.0% |
| $50,000 to $74,999 | 2 | 3.7% |
| $75,000 to $99,999 | 20 | 37.0% |
| $100,000 to $149,999 | 0 | 0.0% |
| $150,000 to $199,999 | 7 | 13.0% |
| $200,000+ | 22 | 40.7% |
Household Income by Householder Age in Hillsboro
The median household income in Hillsboro is $0, with the highest median household income of $217,188 found in the 45 to 64 years age bracket for the primary householder. A total of 23 households (42.6%) fall into this category.
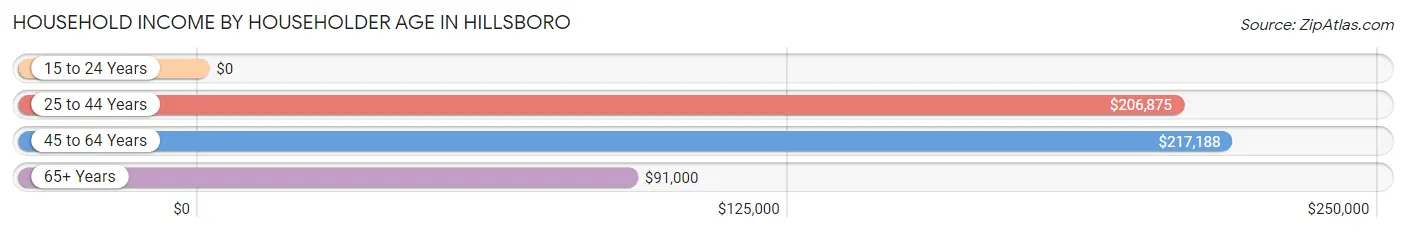
| Income Bracket | # Households | Median Income |
| 15 to 24 Years | 0 (0.0%) | $0 |
| 25 to 44 Years | 5 (9.3%) | $206,875 |
| 45 to 64 Years | 23 (42.6%) | $217,188 |
| 65+ Years | 26 (48.1%) | $91,000 |
| Total | 54 (100.0%) | $0 |
Poverty in Hillsboro
Income Below Poverty by Sex and Age in Hillsboro
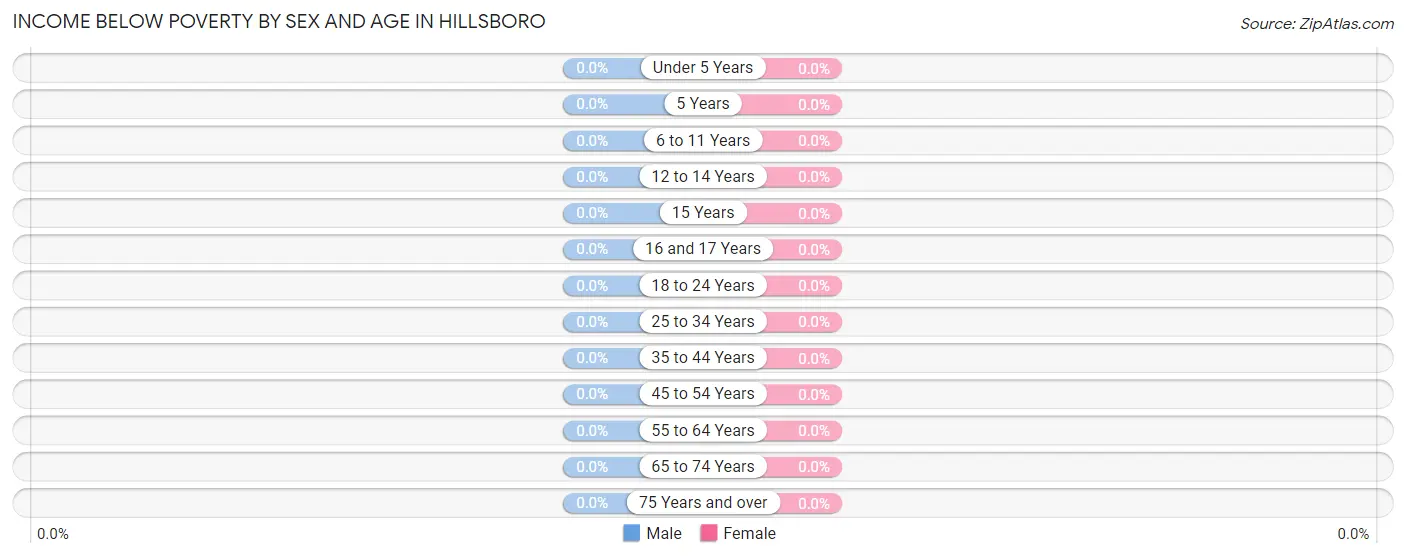
| Age Bracket | Male | Female |
| Under 5 Years | 0 (0.0%) | 0 (0.0%) |
| 5 Years | 0 (0.0%) | 0 (0.0%) |
| 6 to 11 Years | 0 (0.0%) | 0 (0.0%) |
| 12 to 14 Years | 0 (0.0%) | 0 (0.0%) |
| 15 Years | 0 (0.0%) | 0 (0.0%) |
| 16 and 17 Years | 0 (0.0%) | 0 (0.0%) |
| 18 to 24 Years | 0 (0.0%) | 0 (0.0%) |
| 25 to 34 Years | 0 (0.0%) | 0 (0.0%) |
| 35 to 44 Years | 0 (0.0%) | 0 (0.0%) |
| 45 to 54 Years | 0 (0.0%) | 0 (0.0%) |
| 55 to 64 Years | 0 (0.0%) | 0 (0.0%) |
| 65 to 74 Years | 0 (0.0%) | 0 (0.0%) |
| 75 Years and over | 0 (0.0%) | 0 (0.0%) |
| Total | 0 (0.0%) | 0 (0.0%) |
Income Above Poverty by Sex and Age in Hillsboro
According to the poverty statistics in Hillsboro, males aged 6 to 11 years and females aged 6 to 11 years are the age groups that are most secure financially, with 100.0% of males and 100.0% of females in these age groups living above the poverty line.
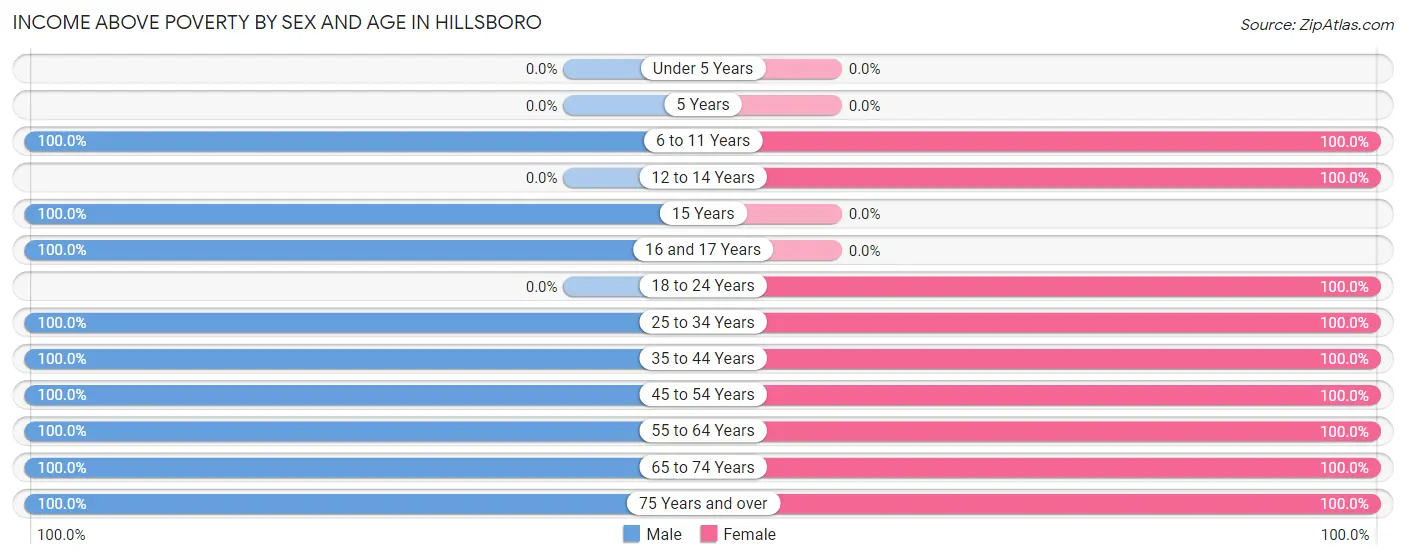
| Age Bracket | Male | Female |
| Under 5 Years | 0 (0.0%) | 0 (0.0%) |
| 5 Years | 0 (0.0%) | 0 (0.0%) |
| 6 to 11 Years | 3 (100.0%) | 3 (100.0%) |
| 12 to 14 Years | 0 (0.0%) | 2 (100.0%) |
| 15 Years | 1 (100.0%) | 0 (0.0%) |
| 16 and 17 Years | 9 (100.0%) | 0 (0.0%) |
| 18 to 24 Years | 0 (0.0%) | 8 (100.0%) |
| 25 to 34 Years | 6 (100.0%) | 2 (100.0%) |
| 35 to 44 Years | 9 (100.0%) | 4 (100.0%) |
| 45 to 54 Years | 9 (100.0%) | 7 (100.0%) |
| 55 to 64 Years | 15 (100.0%) | 6 (100.0%) |
| 65 to 74 Years | 24 (100.0%) | 33 (100.0%) |
| 75 Years and over | 1 (100.0%) | 10 (100.0%) |
| Total | 77 (100.0%) | 75 (100.0%) |
Income Below Poverty Among Married-Couple Families in Hillsboro
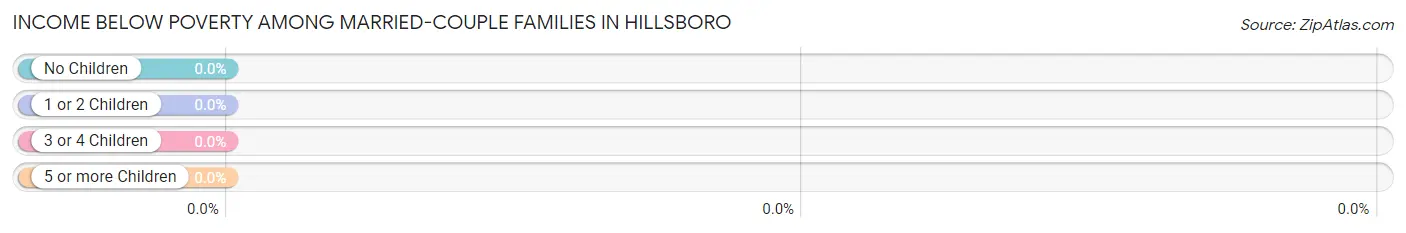
| Children | Above Poverty | Below Poverty |
| No Children | 32 (100.0%) | 0 (0.0%) |
| 1 or 2 Children | 9 (100.0%) | 0 (0.0%) |
| 3 or 4 Children | 2 (100.0%) | 0 (0.0%) |
| 5 or more Children | 0 (0.0%) | 0 (0.0%) |
| Total | 43 (100.0%) | 0 (0.0%) |
Income Below Poverty Among Single-Parent Households in Hillsboro
| Children | Single Father | Single Mother |
| No Children | 0 (0.0%) | 0 (0.0%) |
| 1 or 2 Children | 0 (0.0%) | 0 (0.0%) |
| 3 or 4 Children | 0 (0.0%) | 0 (0.0%) |
| 5 or more Children | 0 (0.0%) | 0 (0.0%) |
| Total | 0 (0.0%) | 0 (0.0%) |
Income Below Poverty Among Married-Couple vs Single-Parent Households in Hillsboro
| Children | Married-Couple Families | Single-Parent Households |
| No Children | 0 (0.0%) | 0 (0.0%) |
| 1 or 2 Children | 0 (0.0%) | 0 (0.0%) |
| 3 or 4 Children | 0 (0.0%) | 0 (0.0%) |
| 5 or more Children | 0 (0.0%) | 0 (0.0%) |
| Total | 0 (0.0%) | 0 (0.0%) |
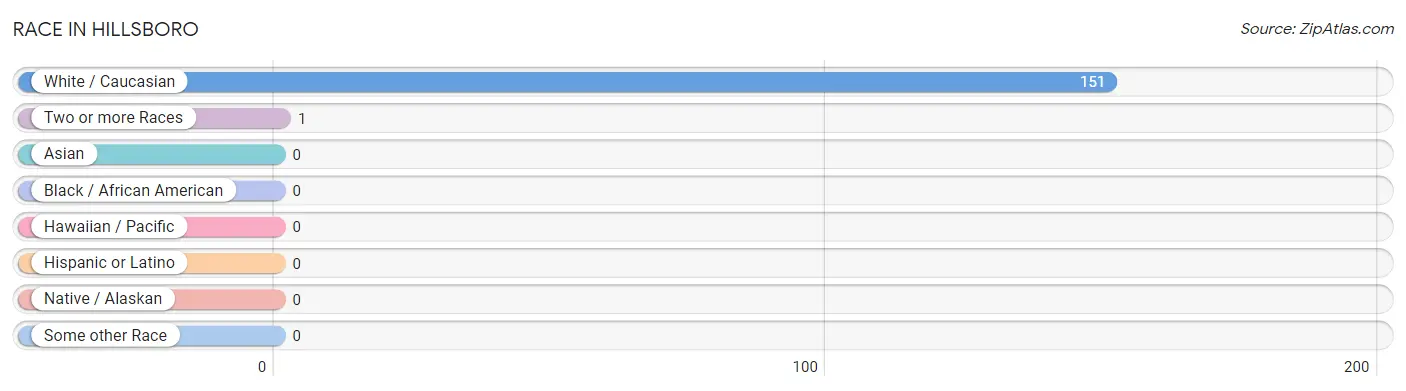
Race in Hillsboro
The most populous races in Hillsboro are White / Caucasian (151 | 99.3%), and Two or more Races (1 | 0.7%).
| Race | # Population | % Population |
| Asian | 0 | 0.0% |
| Black / African American | 0 | 0.0% |
| Hawaiian / Pacific | 0 | 0.0% |
| Hispanic or Latino | 0 | 0.0% |
| Native / Alaskan | 0 | 0.0% |
| White / Caucasian | 151 | 99.3% |
| Two or more Races | 1 | 0.7% |
| Some other Race | 0 | 0.0% |
| Total | 152 | 100.0% |
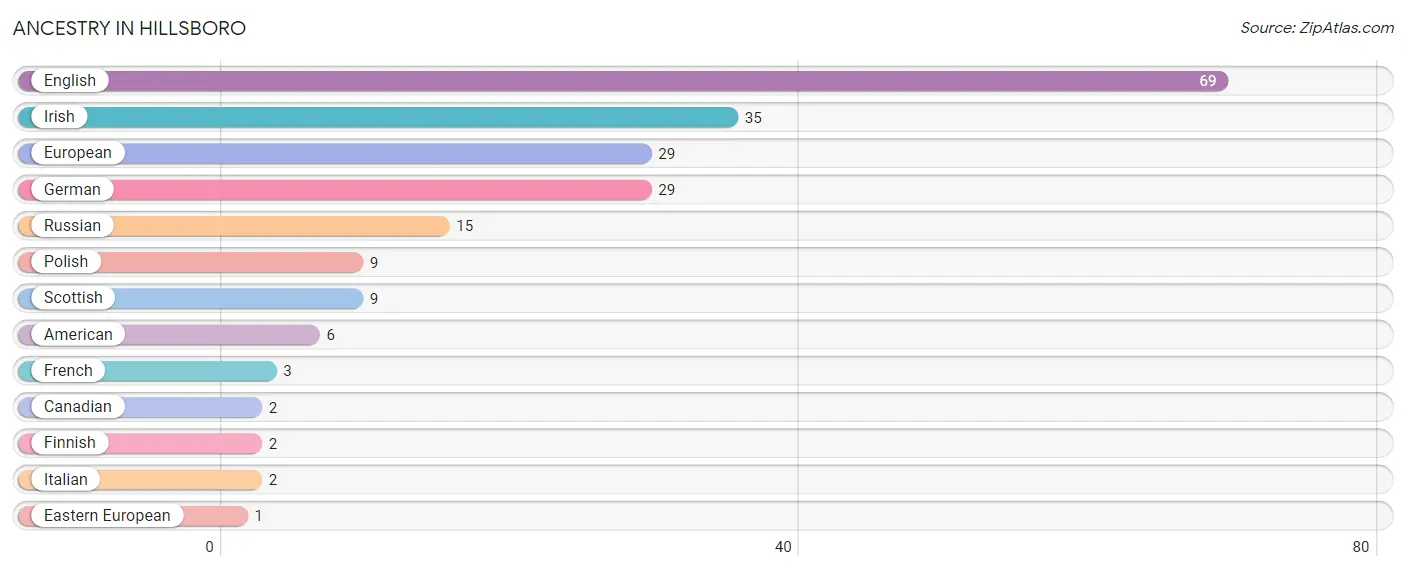
Ancestry in Hillsboro
The most populous ancestries reported in Hillsboro are English (69 | 45.4%), Irish (35 | 23.0%), European (29 | 19.1%), German (29 | 19.1%), and Russian (15 | 9.9%), together accounting for 116.5% of all Hillsboro residents.
| Ancestry | # Population | % Population |
| American | 6 | 4.0% |
| Canadian | 2 | 1.3% |
| Eastern European | 1 | 0.7% |
| English | 69 | 45.4% |
| European | 29 | 19.1% |
| Finnish | 2 | 1.3% |
| French | 3 | 2.0% |
| German | 29 | 19.1% |
| Irish | 35 | 23.0% |
| Italian | 2 | 1.3% |
| Polish | 9 | 5.9% |
| Russian | 15 | 9.9% |
| Scottish | 9 | 5.9% | View All 13 Rows |
Immigrants in Hillsboro
The most numerous immigrant groups reported in Hillsboro came from Europe (39 | 25.7%), England (31 | 20.4%), Northern Europe (31 | 20.4%), Western Europe (8 | 5.3%), and Germany (7 | 4.6%), together accounting for 76.3% of all Hillsboro residents.
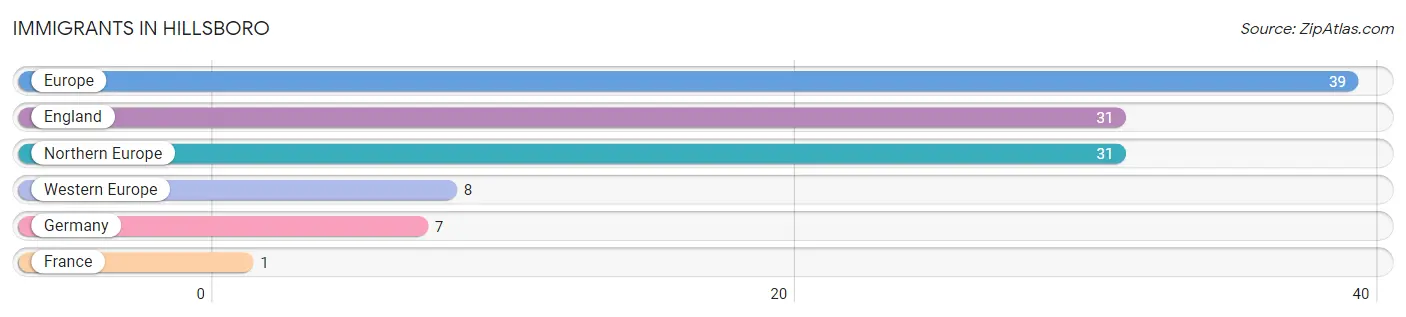
| Immigration Origin | # Population | % Population |
| England | 31 | 20.4% |
| Europe | 39 | 25.7% |
| France | 1 | 0.7% |
| Germany | 7 | 4.6% |
| Northern Europe | 31 | 20.4% |
| Western Europe | 8 | 5.3% | View All 6 Rows |
Sex and Age in Hillsboro
Sex and Age in Hillsboro
The most populous age groups in Hillsboro are 70 to 74 Years (20 | 26.0%) for men and 65 to 69 Years (33 | 44.0%) for women.
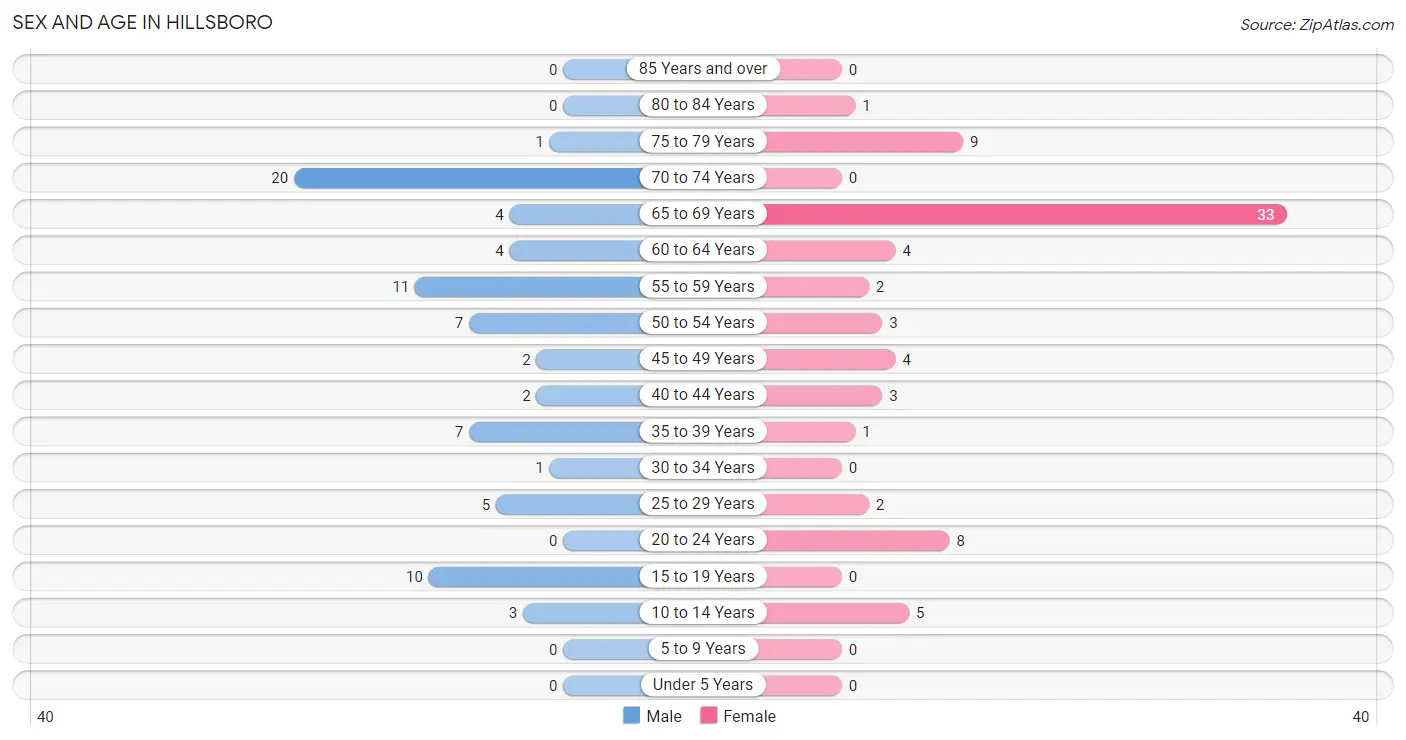
| Age Bracket | Male | Female |
| Under 5 Years | 0 (0.0%) | 0 (0.0%) |
| 5 to 9 Years | 0 (0.0%) | 0 (0.0%) |
| 10 to 14 Years | 3 (3.9%) | 5 (6.7%) |
| 15 to 19 Years | 10 (13.0%) | 0 (0.0%) |
| 20 to 24 Years | 0 (0.0%) | 8 (10.7%) |
| 25 to 29 Years | 5 (6.5%) | 2 (2.7%) |
| 30 to 34 Years | 1 (1.3%) | 0 (0.0%) |
| 35 to 39 Years | 7 (9.1%) | 1 (1.3%) |
| 40 to 44 Years | 2 (2.6%) | 3 (4.0%) |
| 45 to 49 Years | 2 (2.6%) | 4 (5.3%) |
| 50 to 54 Years | 7 (9.1%) | 3 (4.0%) |
| 55 to 59 Years | 11 (14.3%) | 2 (2.7%) |
| 60 to 64 Years | 4 (5.2%) | 4 (5.3%) |
| 65 to 69 Years | 4 (5.2%) | 33 (44.0%) |
| 70 to 74 Years | 20 (26.0%) | 0 (0.0%) |
| 75 to 79 Years | 1 (1.3%) | 9 (12.0%) |
| 80 to 84 Years | 0 (0.0%) | 1 (1.3%) |
| 85 Years and over | 0 (0.0%) | 0 (0.0%) |
| Total | 77 (100.0%) | 75 (100.0%) |
Families and Households in Hillsboro
Median Family Size in Hillsboro
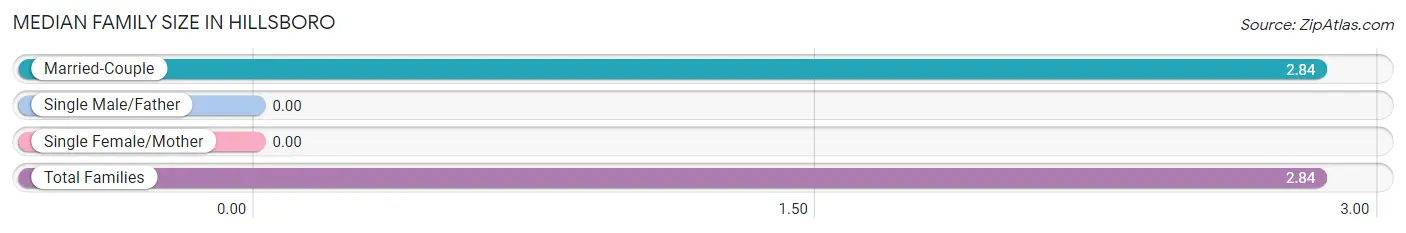
| Family Type | # Families | Family Size |
| Married-Couple | 43 (100.0%) | 2.84 |
| Single Male/Father | 0 (0.0%) | - |
| Single Female/Mother | 0 (0.0%) | - |
| Total Families | 43 (100.0%) | 2.84 |
Median Household Size in Hillsboro
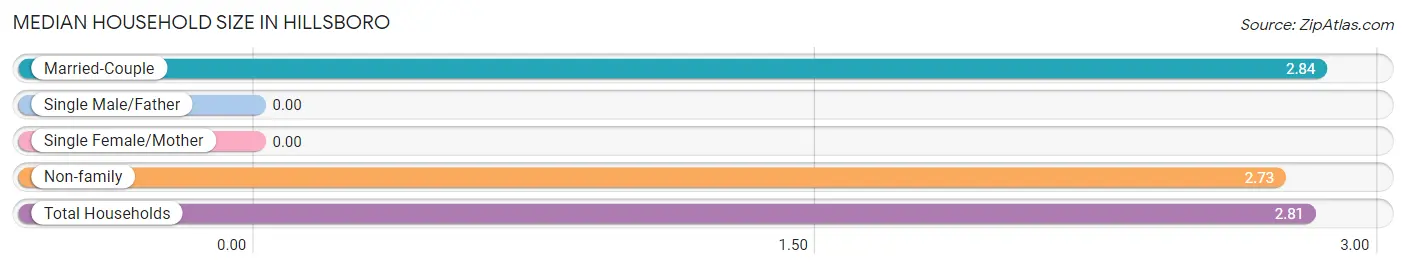
| Household Type | # Households | Household Size |
| Married-Couple | 43 (79.6%) | 2.84 |
| Single Male/Father | 0 (0.0%) | - |
| Single Female/Mother | 0 (0.0%) | - |
| Non-family | 11 (20.4%) | 2.73 |
| Total Households | 54 (100.0%) | 2.81 |
Household Size by Marriage Status in Hillsboro
Out of a total of 54 households in Hillsboro, 43 (79.6%) are family households, while 11 (20.4%) are nonfamily households. The most numerous type of family households are 2-person households, comprising 32, and the most common type of nonfamily households are 3-person households, comprising 8.
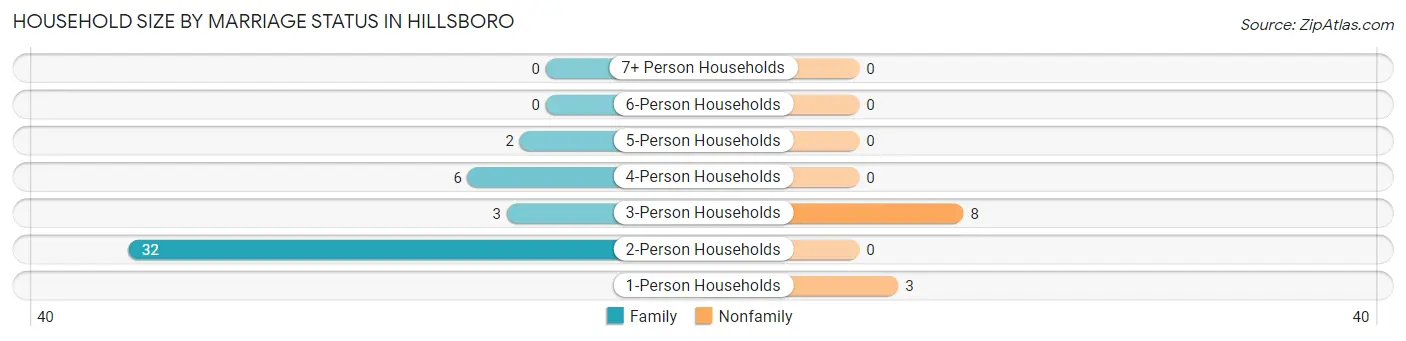
| Household Size | Family Households | Nonfamily Households |
| 1-Person Households | - | 3 (5.6%) |
| 2-Person Households | 32 (59.3%) | 0 (0.0%) |
| 3-Person Households | 3 (5.6%) | 8 (14.8%) |
| 4-Person Households | 6 (11.1%) | 0 (0.0%) |
| 5-Person Households | 2 (3.7%) | 0 (0.0%) |
| 6-Person Households | 0 (0.0%) | 0 (0.0%) |
| 7+ Person Households | 0 (0.0%) | 0 (0.0%) |
| Total | 43 (79.6%) | 11 (20.4%) |
Female Fertility in Hillsboro
Fertility by Age in Hillsboro
| Age Bracket | Women with Births | Births / 1,000 Women |
| 15 to 19 years | 0 (0.0%) | 0.0 |
| 20 to 34 years | 0 (0.0%) | 0.0 |
| 35 to 50 years | 0 (0.0%) | 0.0 |
| Total | 0 (0.0%) | 0.0 |
Fertility by Age by Marriage Status in Hillsboro
| Age Bracket | Married | Unmarried |
| 15 to 19 years | 0 (0.0%) | 0 (0.0%) |
| 20 to 34 years | 0 (0.0%) | 0 (0.0%) |
| 35 to 50 years | 0 (0.0%) | 0 (0.0%) |
| Total | 0 (0.0%) | 0 (0.0%) |
Fertility by Education in Hillsboro
| Educational Attainment | Women with Births | Births / 1,000 Women |
| Less than High School | 0 (0.0%) | 0.0 |
| High School Diploma | 0 (0.0%) | 0.0 |
| College or Associate's Degree | 0 (0.0%) | 0.0 |
| Bachelor's Degree | 0 (0.0%) | 0.0 |
| Graduate Degree | 0 (0.0%) | 0.0 |
| Total | 0 (0.0%) | 0.0 |
Fertility by Education by Marriage Status in Hillsboro
| Educational Attainment | Married | Unmarried |
| Less than High School | 0 (0.0%) | 0 (0.0%) |
| High School Diploma | 0 (0.0%) | 0 (0.0%) |
| College or Associate's Degree | 0 (0.0%) | 0 (0.0%) |
| Bachelor's Degree | 0 (0.0%) | 0 (0.0%) |
| Graduate Degree | 0 (0.0%) | 0 (0.0%) |
| Total | 0 (0.0%) | 0 (0.0%) |
Employment Characteristics in Hillsboro
Employment by Class of Employer in Hillsboro
Among the 94 employed individuals in Hillsboro, self-employed (not incorporated) (31 | 33.0%), private company employees (30 | 31.9%), and federal government employees (14 | 14.9%) make up the most common classes of employment.
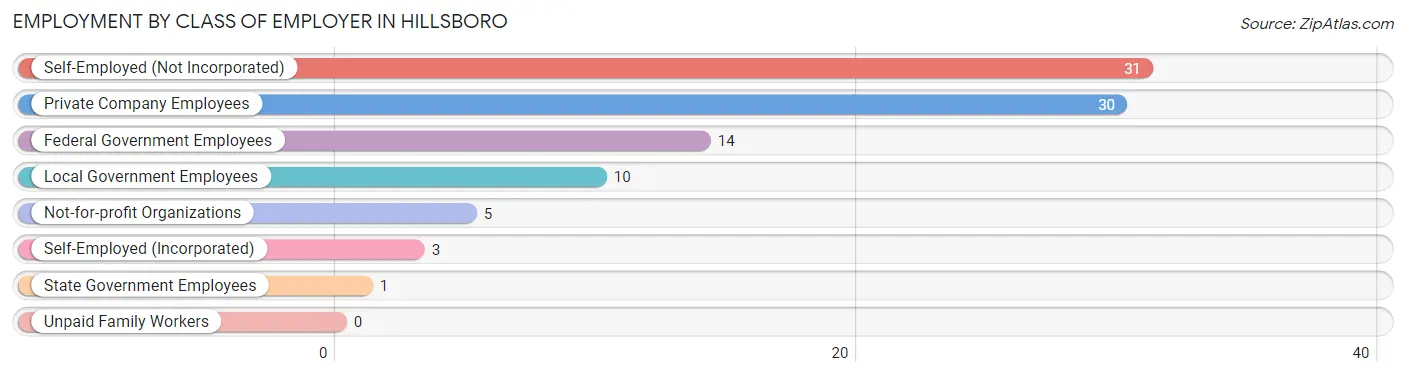
| Employer Class | # Employees | % Employees |
| Private Company Employees | 30 | 31.9% |
| Self-Employed (Incorporated) | 3 | 3.2% |
| Self-Employed (Not Incorporated) | 31 | 33.0% |
| Not-for-profit Organizations | 5 | 5.3% |
| Local Government Employees | 10 | 10.6% |
| State Government Employees | 1 | 1.1% |
| Federal Government Employees | 14 | 14.9% |
| Unpaid Family Workers | 0 | 0.0% |
| Total | 94 | 100.0% |
Employment Status by Age in Hillsboro
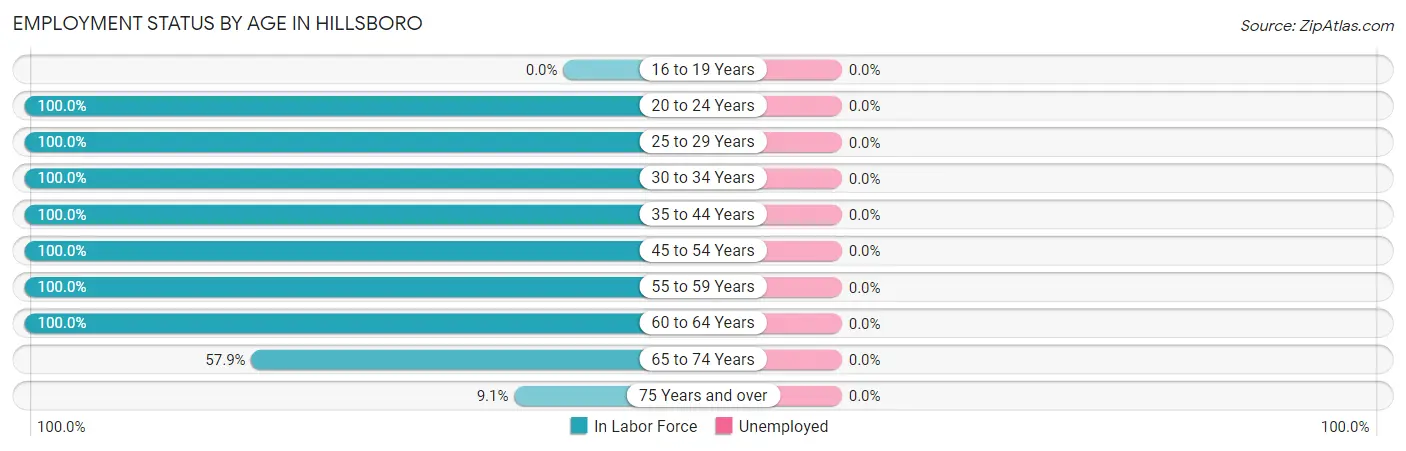
| Age Bracket | In Labor Force | Unemployed |
| 16 to 19 Years | 0 (0.0%) | 0 (0.0%) |
| 20 to 24 Years | 8 (100.0%) | 0 (0.0%) |
| 25 to 29 Years | 7 (100.0%) | 0 (0.0%) |
| 30 to 34 Years | 1 (100.0%) | 0 (0.0%) |
| 35 to 44 Years | 13 (100.0%) | 0 (0.0%) |
| 45 to 54 Years | 16 (100.0%) | 0 (0.0%) |
| 55 to 59 Years | 13 (100.0%) | 0 (0.0%) |
| 60 to 64 Years | 8 (100.0%) | 0 (0.0%) |
| 65 to 74 Years | 33 (57.9%) | 0 (0.0%) |
| 75 Years and over | 1 (9.1%) | 0 (0.0%) |
| Total | 100 (69.9%) | 0 (0.0%) |
Employment Status by Educational Attainment in Hillsboro
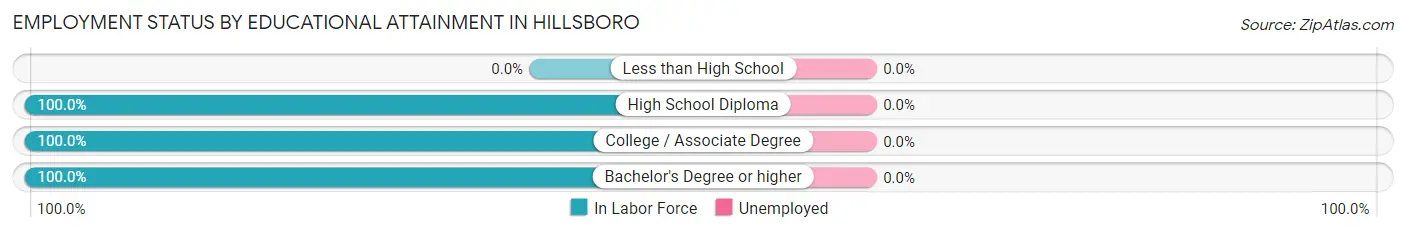
| Educational Attainment | In Labor Force | Unemployed |
| Less than High School | 0 (0.0%) | 0 (0.0%) |
| High School Diploma | 5 (100.0%) | 0 (0.0%) |
| College / Associate Degree | 4 (100.0%) | 0 (0.0%) |
| Bachelor's Degree or higher | 49 (100.0%) | 0 (0.0%) |
| Total | 58 (100.0%) | 0 (0.0%) |
Employment Occupations by Sex in Hillsboro
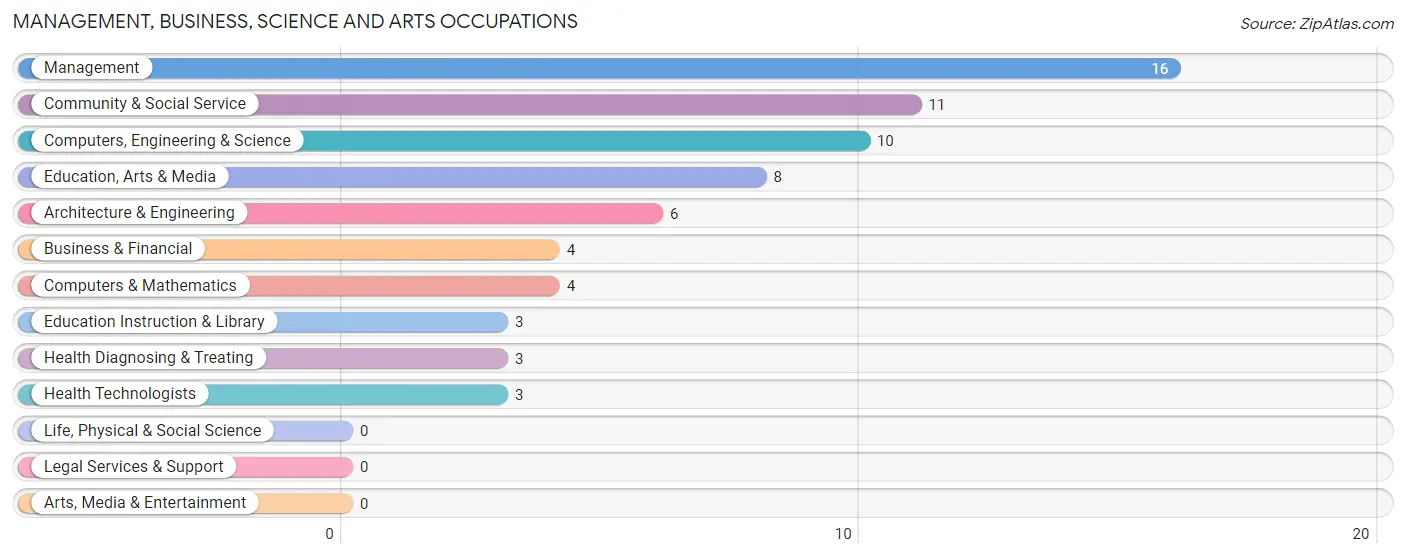
Management, Business, Science and Arts Occupations
The most common Management, Business, Science and Arts occupations in Hillsboro are Management (16 | 16.0%), Community & Social Service (11 | 11.0%), Computers, Engineering & Science (10 | 10.0%), Education, Arts & Media (8 | 8.0%), and Architecture & Engineering (6 | 6.0%).
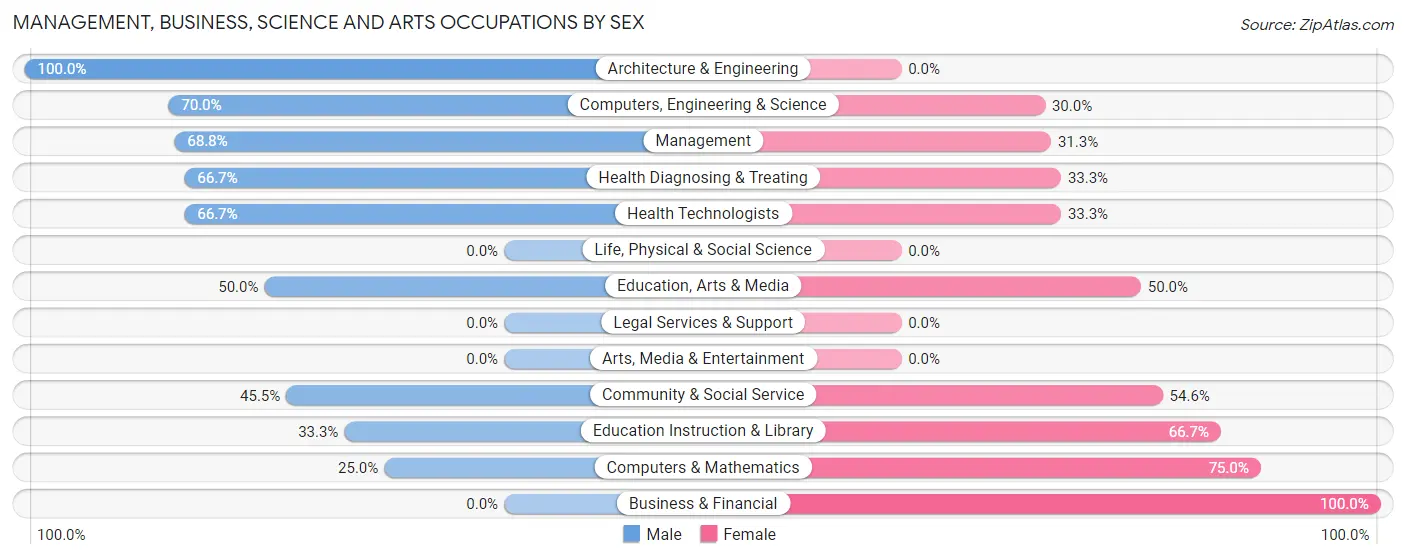
Management, Business, Science and Arts Occupations by Sex
Within the Management, Business, Science and Arts occupations in Hillsboro, the most male-oriented occupations are Architecture & Engineering (100.0%), Computers, Engineering & Science (70.0%), and Management (68.8%), while the most female-oriented occupations are Business & Financial (100.0%), Computers & Mathematics (75.0%), and Education Instruction & Library (66.7%).
| Occupation | Male | Female |
| Management | 11 (68.8%) | 5 (31.2%) |
| Business & Financial | 0 (0.0%) | 4 (100.0%) |
| Computers, Engineering & Science | 7 (70.0%) | 3 (30.0%) |
| Computers & Mathematics | 1 (25.0%) | 3 (75.0%) |
| Architecture & Engineering | 6 (100.0%) | 0 (0.0%) |
| Life, Physical & Social Science | 0 (0.0%) | 0 (0.0%) |
| Community & Social Service | 5 (45.5%) | 6 (54.5%) |
| Education, Arts & Media | 4 (50.0%) | 4 (50.0%) |
| Legal Services & Support | 0 (0.0%) | 0 (0.0%) |
| Education Instruction & Library | 1 (33.3%) | 2 (66.7%) |
| Arts, Media & Entertainment | 0 (0.0%) | 0 (0.0%) |
| Health Diagnosing & Treating | 2 (66.7%) | 1 (33.3%) |
| Health Technologists | 2 (66.7%) | 1 (33.3%) |
| Total (Category) | 25 (56.8%) | 19 (43.2%) |
| Total (Overall) | 42 (42.0%) | 58 (58.0%) |
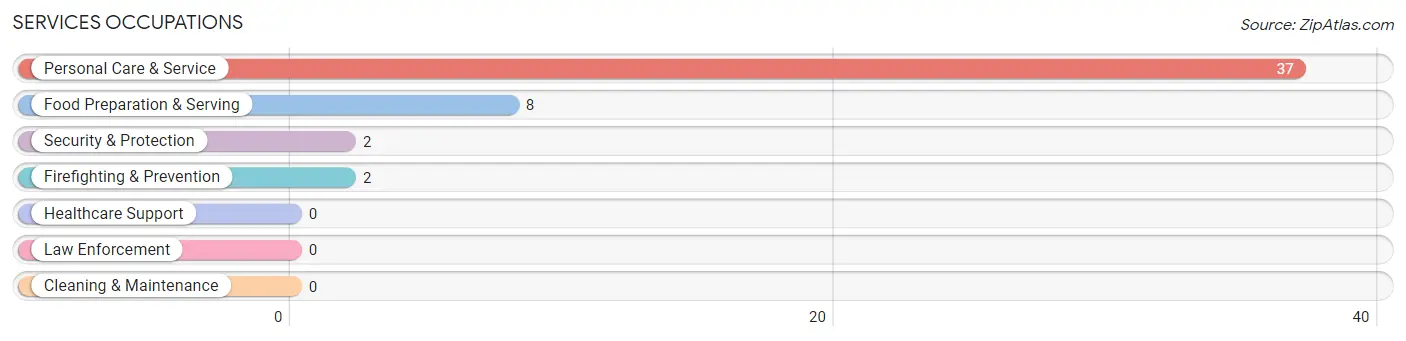
Services Occupations
The most common Services occupations in Hillsboro are Personal Care & Service (37 | 37.0%), Food Preparation & Serving (8 | 8.0%), Security & Protection (2 | 2.0%), and Firefighting & Prevention (2 | 2.0%).
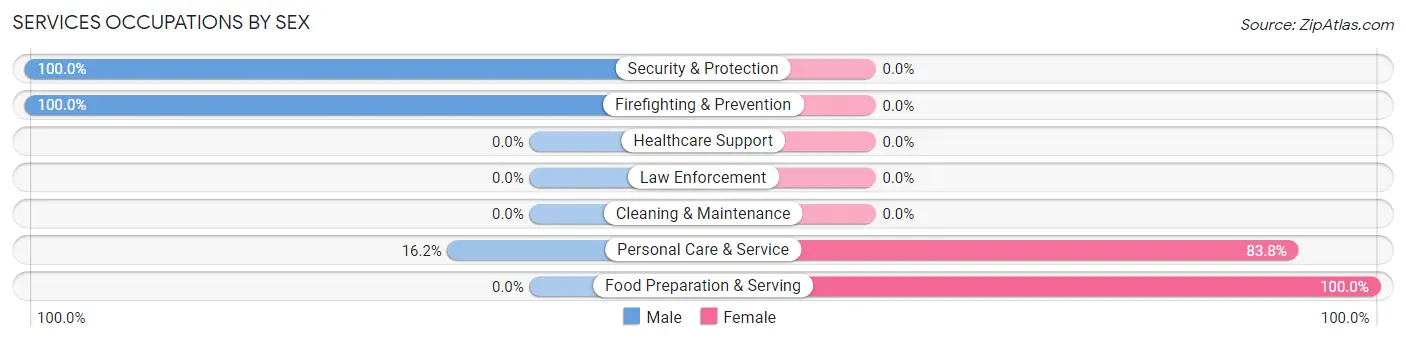
Services Occupations by Sex
Within the Services occupations in Hillsboro, the most male-oriented occupations are Security & Protection (100.0%), Firefighting & Prevention (100.0%), and Personal Care & Service (16.2%), while the most female-oriented occupations are Food Preparation & Serving (100.0%), and Personal Care & Service (83.8%).
| Occupation | Male | Female |
| Healthcare Support | 0 (0.0%) | 0 (0.0%) |
| Security & Protection | 2 (100.0%) | 0 (0.0%) |
| Firefighting & Prevention | 2 (100.0%) | 0 (0.0%) |
| Law Enforcement | 0 (0.0%) | 0 (0.0%) |
| Food Preparation & Serving | 0 (0.0%) | 8 (100.0%) |
| Cleaning & Maintenance | 0 (0.0%) | 0 (0.0%) |
| Personal Care & Service | 6 (16.2%) | 31 (83.8%) |
| Total (Category) | 8 (17.0%) | 39 (83.0%) |
| Total (Overall) | 42 (42.0%) | 58 (58.0%) |
Sales and Office Occupations
The most common Sales and Office occupations in Hillsboro are Sales & Related (7 | 7.0%), and Office & Administration (2 | 2.0%).
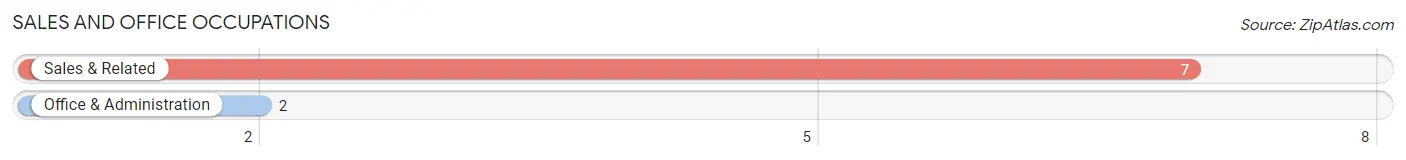
Sales and Office Occupations by Sex
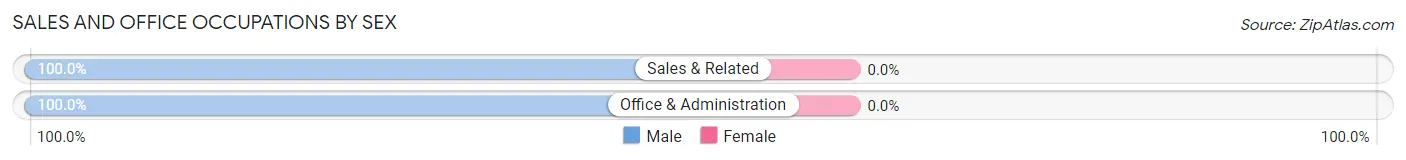
| Occupation | Male | Female |
| Sales & Related | 7 (100.0%) | 0 (0.0%) |
| Office & Administration | 2 (100.0%) | 0 (0.0%) |
| Total (Category) | 9 (100.0%) | 0 (0.0%) |
| Total (Overall) | 42 (42.0%) | 58 (58.0%) |
Natural Resources, Construction and Maintenance Occupations
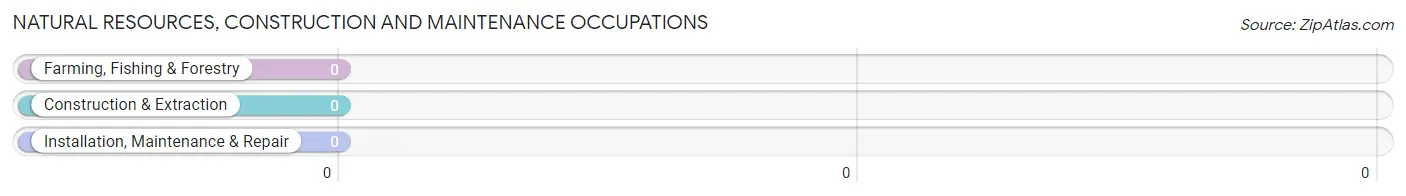
Natural Resources, Construction and Maintenance Occupations by Sex
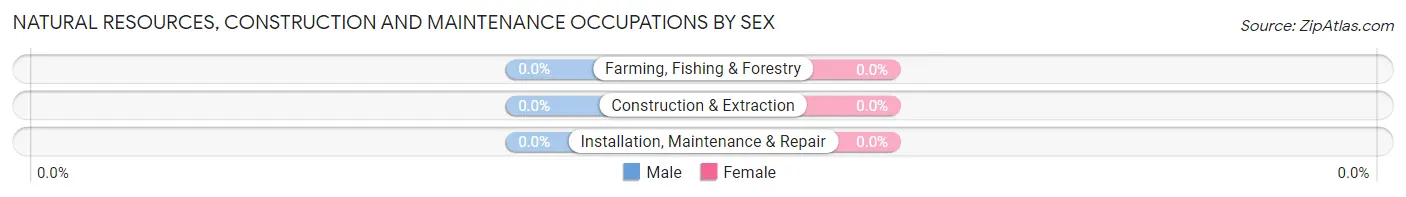
| Occupation | Male | Female |
| Farming, Fishing & Forestry | 0 (0.0%) | 0 (0.0%) |
| Construction & Extraction | 0 (0.0%) | 0 (0.0%) |
| Installation, Maintenance & Repair | 0 (0.0%) | 0 (0.0%) |
| Total (Category) | 0 (0.0%) | 0 (0.0%) |
| Total (Overall) | 42 (42.0%) | 58 (58.0%) |
Production, Transportation and Moving Occupations
Production, Transportation and Moving Occupations by Sex
| Occupation | Male | Female |
| Production | 0 (0.0%) | 0 (0.0%) |
| Transportation | 0 (0.0%) | 0 (0.0%) |
| Material Moving | 0 (0.0%) | 0 (0.0%) |
| Total (Category) | 0 (0.0%) | 0 (0.0%) |
| Total (Overall) | 42 (42.0%) | 58 (58.0%) |
Employment Industries by Sex in Hillsboro
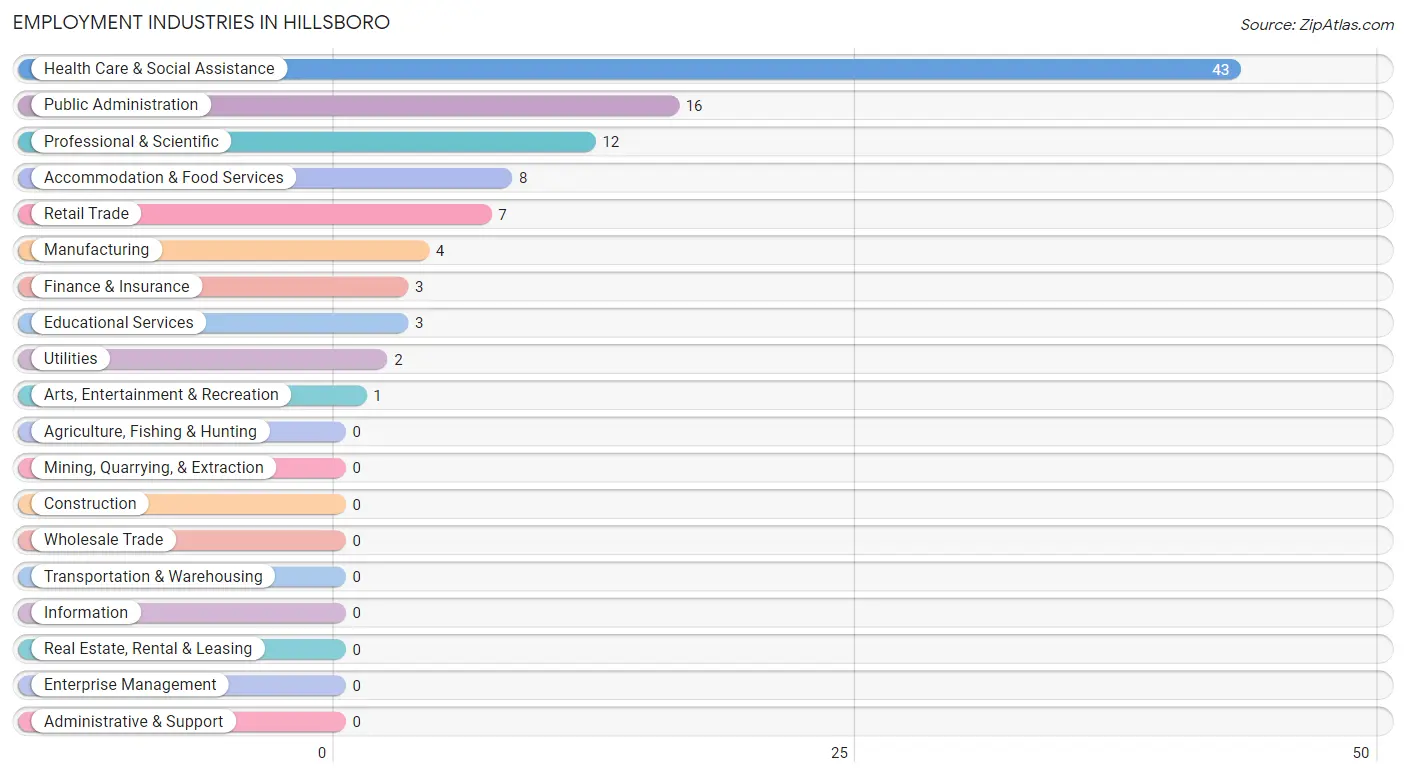
Employment Industries in Hillsboro
The major employment industries in Hillsboro include Health Care & Social Assistance (43 | 43.0%), Public Administration (16 | 16.0%), Professional & Scientific (12 | 12.0%), Accommodation & Food Services (8 | 8.0%), and Retail Trade (7 | 7.0%).
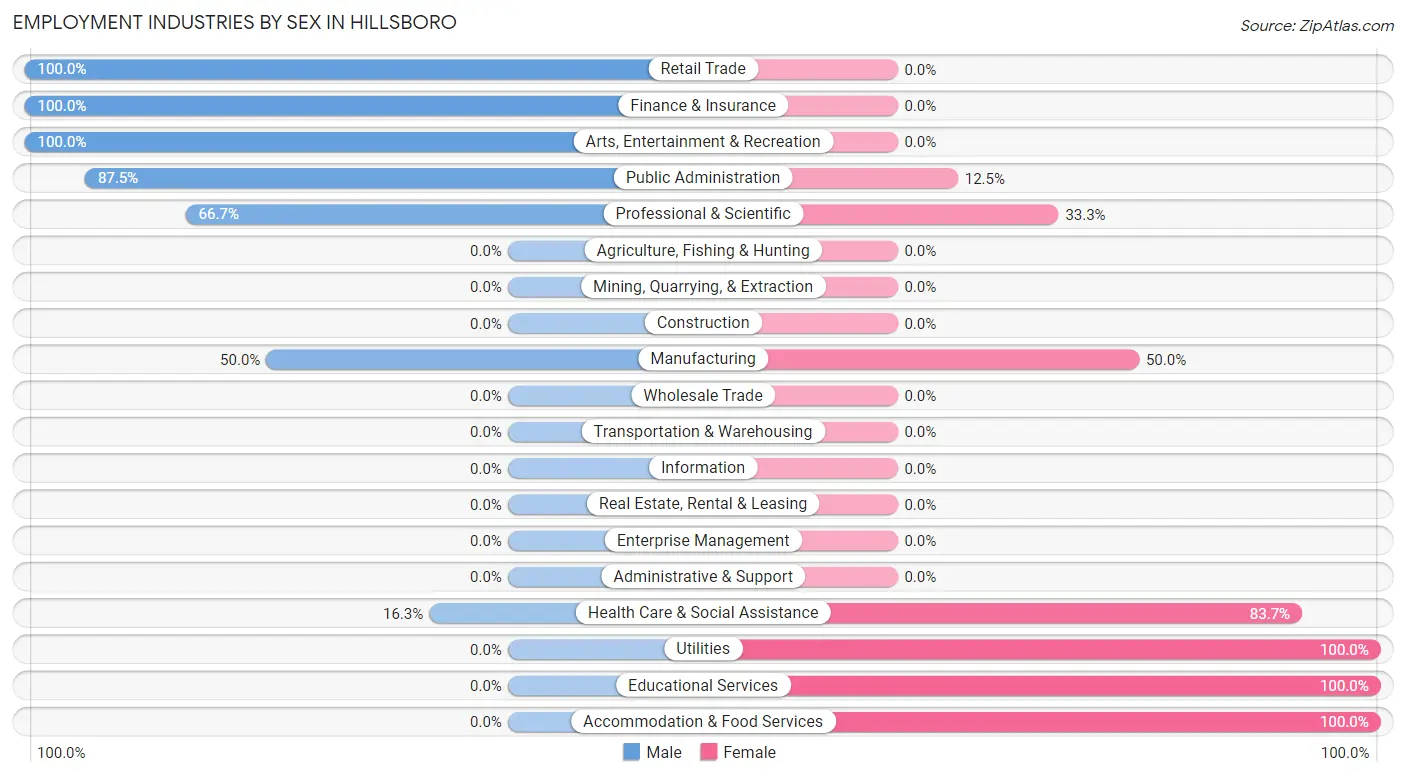
Employment Industries by Sex in Hillsboro
The Hillsboro industries that see more men than women are Retail Trade (100.0%), Finance & Insurance (100.0%), and Arts, Entertainment & Recreation (100.0%), whereas the industries that tend to have a higher number of women are Utilities (100.0%), Educational Services (100.0%), and Accommodation & Food Services (100.0%).
| Industry | Male | Female |
| Agriculture, Fishing & Hunting | 0 (0.0%) | 0 (0.0%) |
| Mining, Quarrying, & Extraction | 0 (0.0%) | 0 (0.0%) |
| Construction | 0 (0.0%) | 0 (0.0%) |
| Manufacturing | 2 (50.0%) | 2 (50.0%) |
| Wholesale Trade | 0 (0.0%) | 0 (0.0%) |
| Retail Trade | 7 (100.0%) | 0 (0.0%) |
| Transportation & Warehousing | 0 (0.0%) | 0 (0.0%) |
| Utilities | 0 (0.0%) | 2 (100.0%) |
| Information | 0 (0.0%) | 0 (0.0%) |
| Finance & Insurance | 3 (100.0%) | 0 (0.0%) |
| Real Estate, Rental & Leasing | 0 (0.0%) | 0 (0.0%) |
| Professional & Scientific | 8 (66.7%) | 4 (33.3%) |
| Enterprise Management | 0 (0.0%) | 0 (0.0%) |
| Administrative & Support | 0 (0.0%) | 0 (0.0%) |
| Educational Services | 0 (0.0%) | 3 (100.0%) |
| Health Care & Social Assistance | 7 (16.3%) | 36 (83.7%) |
| Arts, Entertainment & Recreation | 1 (100.0%) | 0 (0.0%) |
| Accommodation & Food Services | 0 (0.0%) | 8 (100.0%) |
| Public Administration | 14 (87.5%) | 2 (12.5%) |
| Total | 42 (42.0%) | 58 (58.0%) |
Education in Hillsboro
School Enrollment in Hillsboro
The most common levels of schooling among the 18 students in Hillsboro are high school (10 | 55.6%), and middle school (8 | 44.4%).
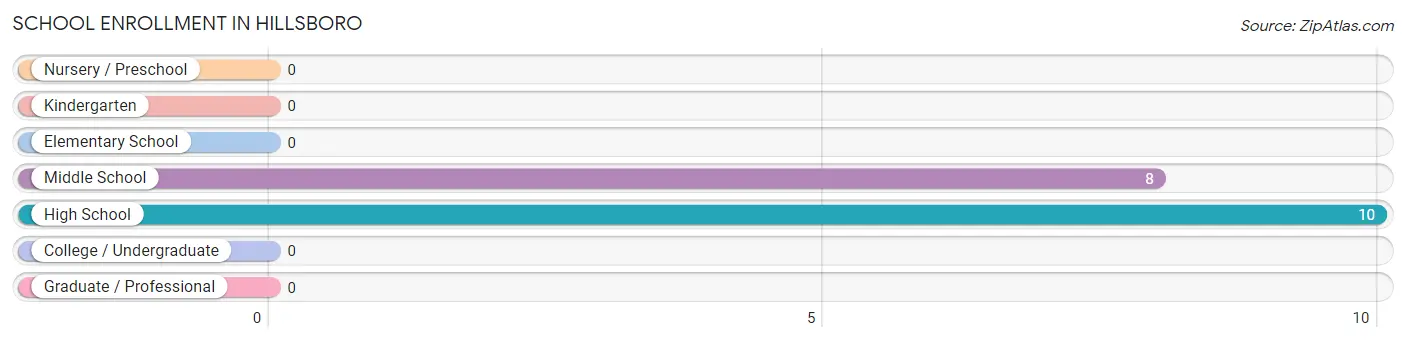
| School Level | # Students | % Students |
| Nursery / Preschool | 0 | 0.0% |
| Kindergarten | 0 | 0.0% |
| Elementary School | 0 | 0.0% |
| Middle School | 8 | 44.4% |
| High School | 10 | 55.6% |
| College / Undergraduate | 0 | 0.0% |
| Graduate / Professional | 0 | 0.0% |
| Total | 18 | 100.0% |
School Enrollment by Age by Funding Source in Hillsboro
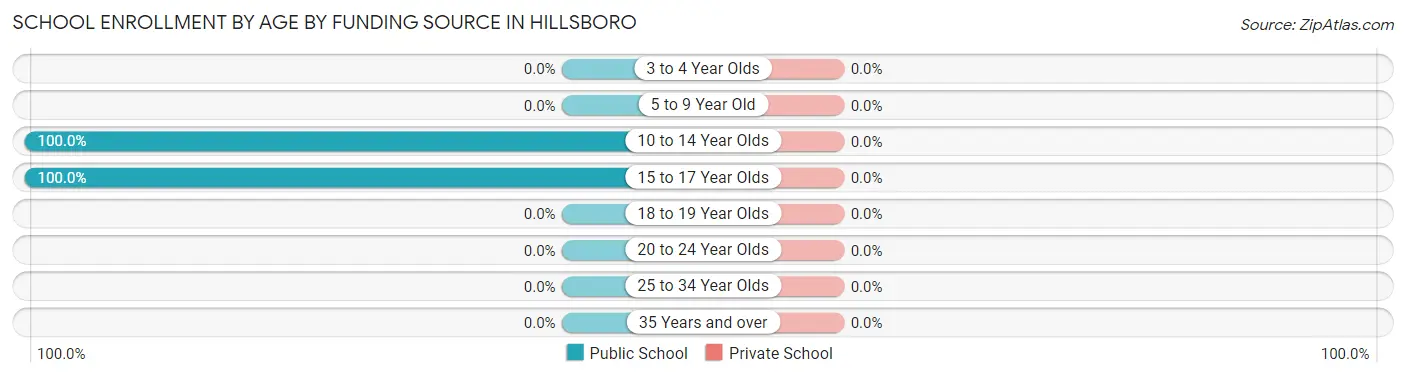
| Age Bracket | Public School | Private School |
| 3 to 4 Year Olds | 0 (0.0%) | 0 (0.0%) |
| 5 to 9 Year Old | 0 (0.0%) | 0 (0.0%) |
| 10 to 14 Year Olds | 8 (100.0%) | 0 (0.0%) |
| 15 to 17 Year Olds | 10 (100.0%) | 0 (0.0%) |
| 18 to 19 Year Olds | 0 (0.0%) | 0 (0.0%) |
| 20 to 24 Year Olds | 0 (0.0%) | 0 (0.0%) |
| 25 to 34 Year Olds | 0 (0.0%) | 0 (0.0%) |
| 35 Years and over | 0 (0.0%) | 0 (0.0%) |
| Total | 18 (100.0%) | 0 (0.0%) |
Educational Attainment by Field of Study in Hillsboro
Business (13 | 20.0%), social sciences (11 | 16.9%), arts & humanities (9 | 13.9%), literature & languages (8 | 12.3%), and engineering (7 | 10.8%) are the most common fields of study among 65 individuals in Hillsboro who have obtained a bachelor's degree or higher.
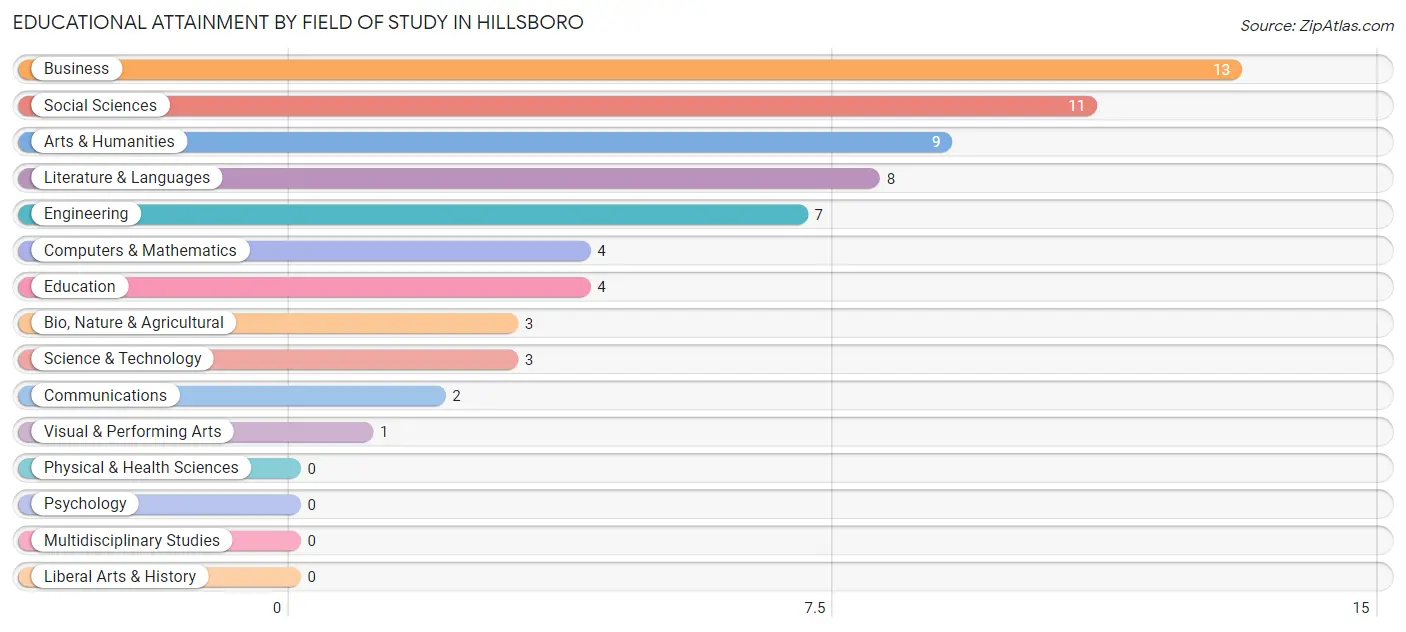
| Field of Study | # Graduates | % Graduates |
| Computers & Mathematics | 4 | 6.1% |
| Bio, Nature & Agricultural | 3 | 4.6% |
| Physical & Health Sciences | 0 | 0.0% |
| Psychology | 0 | 0.0% |
| Social Sciences | 11 | 16.9% |
| Engineering | 7 | 10.8% |
| Multidisciplinary Studies | 0 | 0.0% |
| Science & Technology | 3 | 4.6% |
| Business | 13 | 20.0% |
| Education | 4 | 6.1% |
| Literature & Languages | 8 | 12.3% |
| Liberal Arts & History | 0 | 0.0% |
| Visual & Performing Arts | 1 | 1.5% |
| Communications | 2 | 3.1% |
| Arts & Humanities | 9 | 13.9% |
| Total | 65 | 100.0% |
Transportation & Commute in Hillsboro
Vehicle Availability by Sex in Hillsboro
The most prevalent vehicle ownership categories in Hillsboro are males with 2 vehicles (13, accounting for 34.2%) and females with 2 vehicles (38, making up 23.2%).
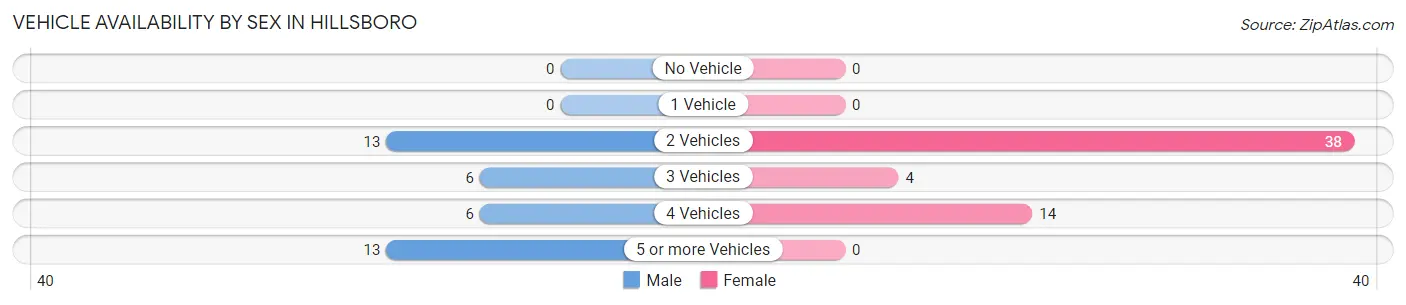
| Vehicles Available | Male | Female |
| No Vehicle | 0 (0.0%) | 0 (0.0%) |
| 1 Vehicle | 0 (0.0%) | 0 (0.0%) |
| 2 Vehicles | 13 (34.2%) | 38 (67.9%) |
| 3 Vehicles | 6 (15.8%) | 4 (7.1%) |
| 4 Vehicles | 6 (15.8%) | 14 (25.0%) |
| 5 or more Vehicles | 13 (34.2%) | 0 (0.0%) |
| Total | 38 (100.0%) | 56 (100.0%) |
Commute Time in Hillsboro
The most frequently occuring commute durations in Hillsboro are 10 to 14 minutes (15 commuters, 31.2%), 90 or more minutes (9 commuters, 18.8%), and 20 to 24 minutes (8 commuters, 16.7%).
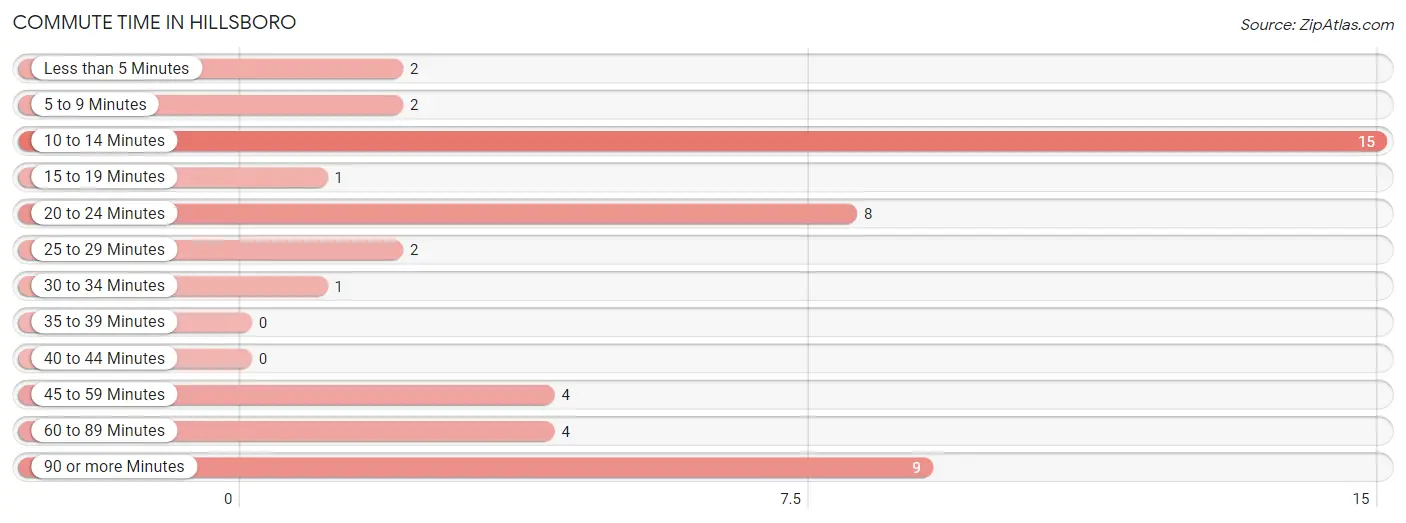
| Commute Time | # Commuters | % Commuters |
| Less than 5 Minutes | 2 | 4.2% |
| 5 to 9 Minutes | 2 | 4.2% |
| 10 to 14 Minutes | 15 | 31.2% |
| 15 to 19 Minutes | 1 | 2.1% |
| 20 to 24 Minutes | 8 | 16.7% |
| 25 to 29 Minutes | 2 | 4.2% |
| 30 to 34 Minutes | 1 | 2.1% |
| 35 to 39 Minutes | 0 | 0.0% |
| 40 to 44 Minutes | 0 | 0.0% |
| 45 to 59 Minutes | 4 | 8.3% |
| 60 to 89 Minutes | 4 | 8.3% |
| 90 or more Minutes | 9 | 18.8% |
Commute Time by Sex in Hillsboro
The most common commute times in Hillsboro are 10 to 14 minutes (11 commuters, 42.3%) for males and 20 to 24 minutes (8 commuters, 36.4%) for females.
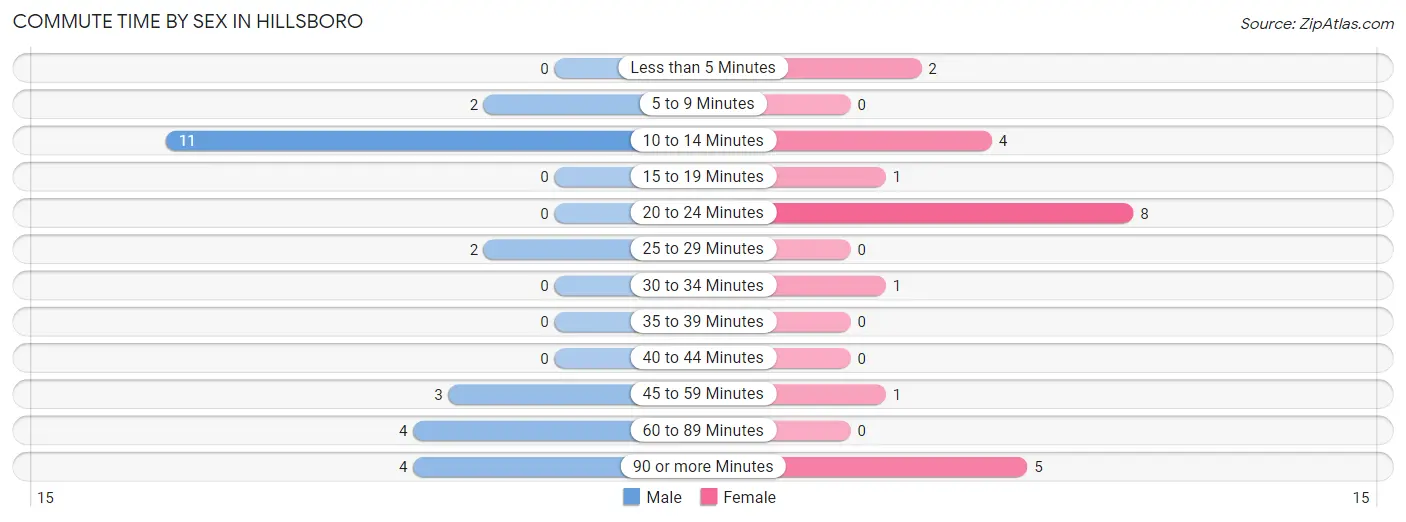
| Commute Time | Male | Female |
| Less than 5 Minutes | 0 (0.0%) | 2 (9.1%) |
| 5 to 9 Minutes | 2 (7.7%) | 0 (0.0%) |
| 10 to 14 Minutes | 11 (42.3%) | 4 (18.2%) |
| 15 to 19 Minutes | 0 (0.0%) | 1 (4.5%) |
| 20 to 24 Minutes | 0 (0.0%) | 8 (36.4%) |
| 25 to 29 Minutes | 2 (7.7%) | 0 (0.0%) |
| 30 to 34 Minutes | 0 (0.0%) | 1 (4.5%) |
| 35 to 39 Minutes | 0 (0.0%) | 0 (0.0%) |
| 40 to 44 Minutes | 0 (0.0%) | 0 (0.0%) |
| 45 to 59 Minutes | 3 (11.5%) | 1 (4.5%) |
| 60 to 89 Minutes | 4 (15.4%) | 0 (0.0%) |
| 90 or more Minutes | 4 (15.4%) | 5 (22.7%) |
Time of Departure to Work by Sex in Hillsboro
The most frequent times of departure to work in Hillsboro are 6:30 AM to 6:59 AM (9, 34.6%) for males and 9:00 AM to 9:59 AM (8, 36.4%) for females.
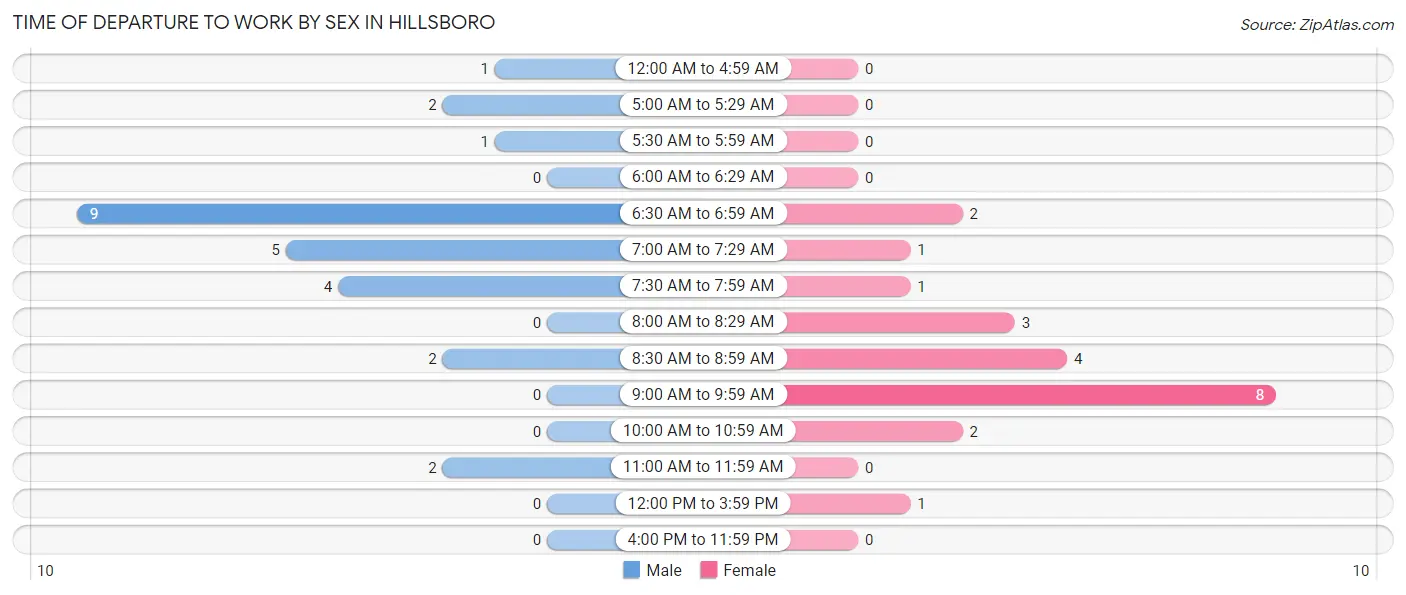
| Time of Departure | Male | Female |
| 12:00 AM to 4:59 AM | 1 (3.8%) | 0 (0.0%) |
| 5:00 AM to 5:29 AM | 2 (7.7%) | 0 (0.0%) |
| 5:30 AM to 5:59 AM | 1 (3.8%) | 0 (0.0%) |
| 6:00 AM to 6:29 AM | 0 (0.0%) | 0 (0.0%) |
| 6:30 AM to 6:59 AM | 9 (34.6%) | 2 (9.1%) |
| 7:00 AM to 7:29 AM | 5 (19.2%) | 1 (4.5%) |
| 7:30 AM to 7:59 AM | 4 (15.4%) | 1 (4.5%) |
| 8:00 AM to 8:29 AM | 0 (0.0%) | 3 (13.6%) |
| 8:30 AM to 8:59 AM | 2 (7.7%) | 4 (18.2%) |
| 9:00 AM to 9:59 AM | 0 (0.0%) | 8 (36.4%) |
| 10:00 AM to 10:59 AM | 0 (0.0%) | 2 (9.1%) |
| 11:00 AM to 11:59 AM | 2 (7.7%) | 0 (0.0%) |
| 12:00 PM to 3:59 PM | 0 (0.0%) | 1 (4.5%) |
| 4:00 PM to 11:59 PM | 0 (0.0%) | 0 (0.0%) |
| Total | 26 (100.0%) | 22 (100.0%) |
Housing Occupancy in Hillsboro
Occupancy by Ownership in Hillsboro
Of the total 54 dwellings in Hillsboro, owner-occupied units account for 51 (94.4%), while renter-occupied units make up 3 (5.6%).
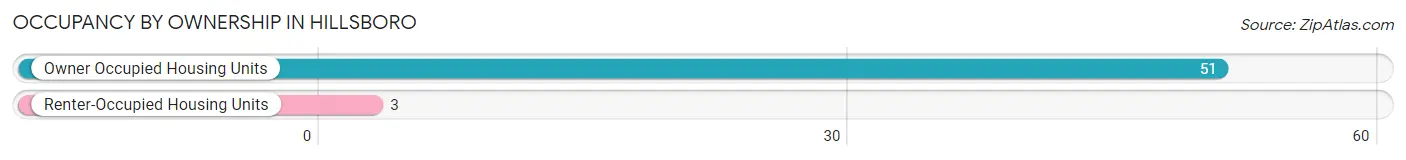
| Occupancy | # Housing Units | % Housing Units |
| Owner Occupied Housing Units | 51 | 94.4% |
| Renter-Occupied Housing Units | 3 | 5.6% |
| Total Occupied Housing Units | 54 | 100.0% |
Occupancy by Household Size in Hillsboro
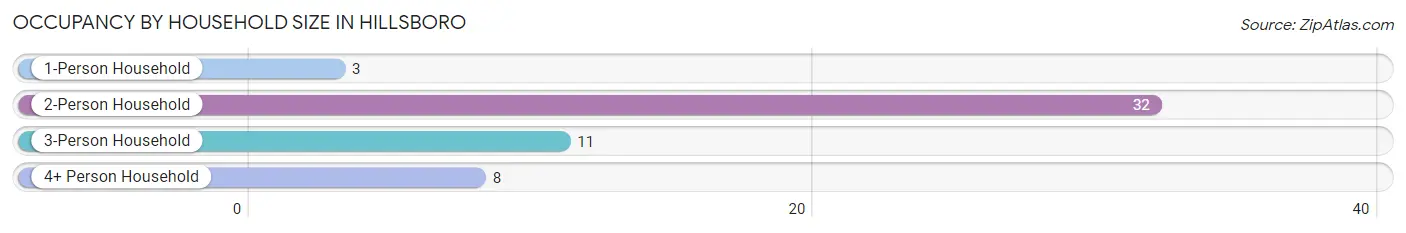
| Household Size | # Housing Units | % Housing Units |
| 1-Person Household | 3 | 5.6% |
| 2-Person Household | 32 | 59.3% |
| 3-Person Household | 11 | 20.4% |
| 4+ Person Household | 8 | 14.8% |
| Total Housing Units | 54 | 100.0% |
Occupancy by Ownership by Household Size in Hillsboro
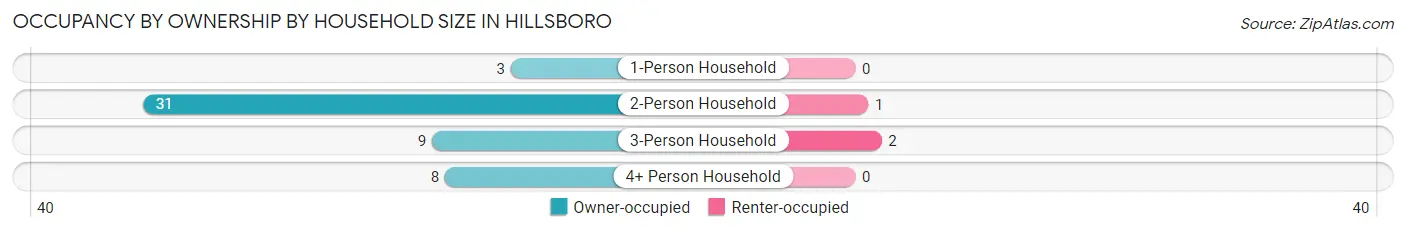
| Household Size | Owner-occupied | Renter-occupied |
| 1-Person Household | 3 (100.0%) | 0 (0.0%) |
| 2-Person Household | 31 (96.9%) | 1 (3.1%) |
| 3-Person Household | 9 (81.8%) | 2 (18.2%) |
| 4+ Person Household | 8 (100.0%) | 0 (0.0%) |
| Total Housing Units | 51 (94.4%) | 3 (5.6%) |
Occupancy by Educational Attainment in Hillsboro
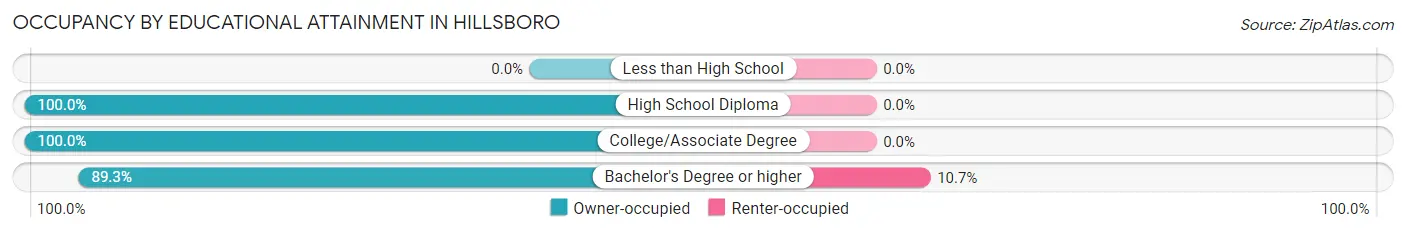
| Household Size | Owner-occupied | Renter-occupied |
| Less than High School | 0 (0.0%) | 0 (0.0%) |
| High School Diploma | 2 (100.0%) | 0 (0.0%) |
| College/Associate Degree | 24 (100.0%) | 0 (0.0%) |
| Bachelor's Degree or higher | 25 (89.3%) | 3 (10.7%) |
Occupancy by Age of Householder in Hillsboro
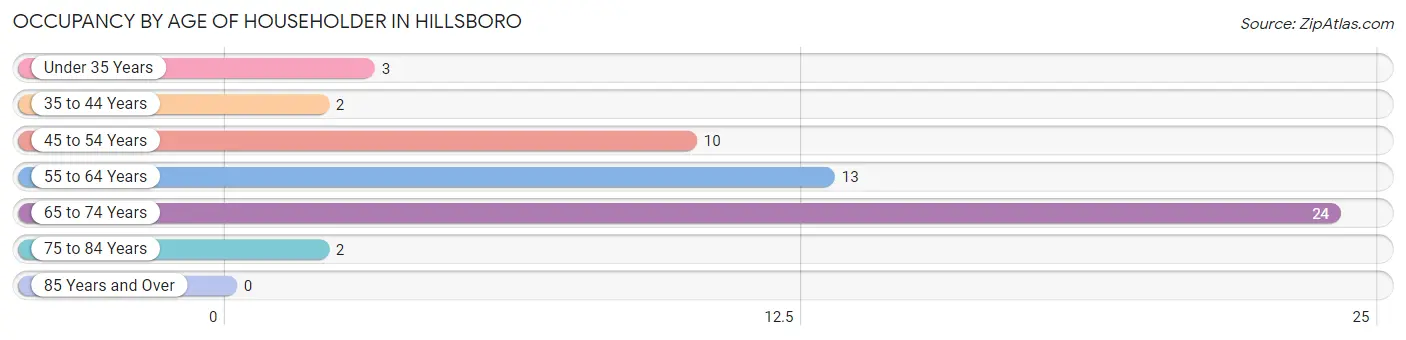
| Age Bracket | # Households | % Households |
| Under 35 Years | 3 | 5.6% |
| 35 to 44 Years | 2 | 3.7% |
| 45 to 54 Years | 10 | 18.5% |
| 55 to 64 Years | 13 | 24.1% |
| 65 to 74 Years | 24 | 44.4% |
| 75 to 84 Years | 2 | 3.7% |
| 85 Years and Over | 0 | 0.0% |
| Total | 54 | 100.0% |
Housing Finances in Hillsboro
Median Income by Occupancy in Hillsboro
| Occupancy Type | # Households | Median Income |
| Owner-Occupied | 51 (94.4%) | $0 |
| Renter-Occupied | 3 (5.6%) | $0 |
| Average | 54 (100.0%) | $0 |
Occupancy by Householder Income Bracket in Hillsboro
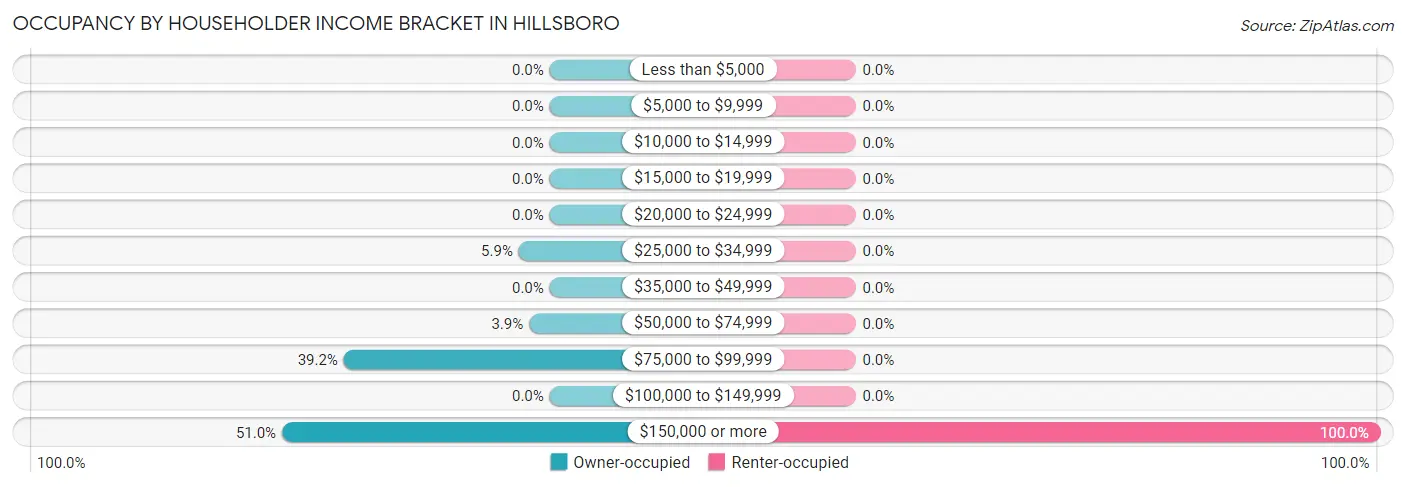
| Income Bracket | Owner-occupied | Renter-occupied |
| Less than $5,000 | 0 (0.0%) | 0 (0.0%) |
| $5,000 to $9,999 | 0 (0.0%) | 0 (0.0%) |
| $10,000 to $14,999 | 0 (0.0%) | 0 (0.0%) |
| $15,000 to $19,999 | 0 (0.0%) | 0 (0.0%) |
| $20,000 to $24,999 | 0 (0.0%) | 0 (0.0%) |
| $25,000 to $34,999 | 3 (5.9%) | 0 (0.0%) |
| $35,000 to $49,999 | 0 (0.0%) | 0 (0.0%) |
| $50,000 to $74,999 | 2 (3.9%) | 0 (0.0%) |
| $75,000 to $99,999 | 20 (39.2%) | 0 (0.0%) |
| $100,000 to $149,999 | 0 (0.0%) | 0 (0.0%) |
| $150,000 or more | 26 (51.0%) | 3 (100.0%) |
| Total | 51 (100.0%) | 3 (100.0%) |
Monthly Housing Cost Tiers in Hillsboro
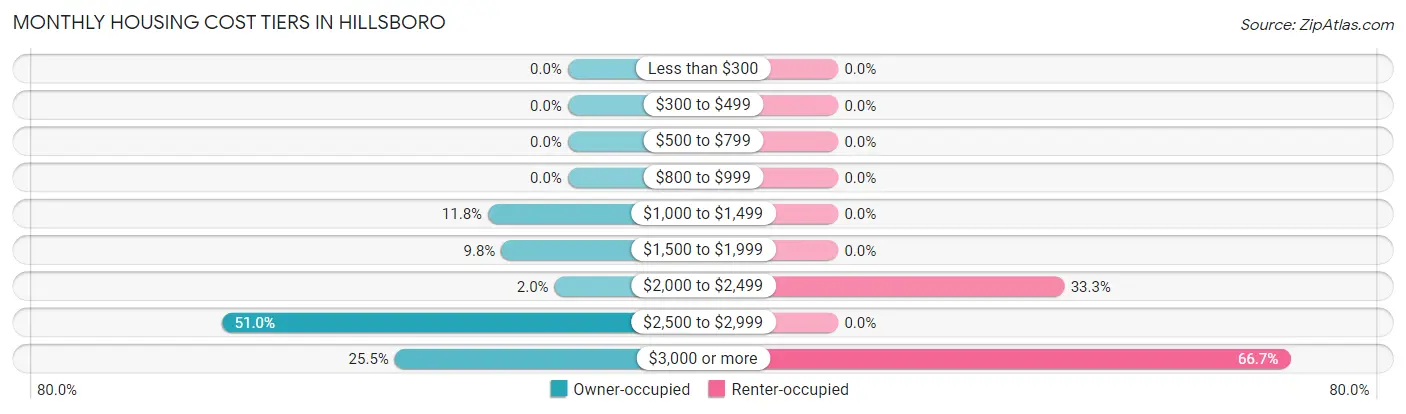
| Monthly Cost | Owner-occupied | Renter-occupied |
| Less than $300 | 0 (0.0%) | 0 (0.0%) |
| $300 to $499 | 0 (0.0%) | 0 (0.0%) |
| $500 to $799 | 0 (0.0%) | 0 (0.0%) |
| $800 to $999 | 0 (0.0%) | 0 (0.0%) |
| $1,000 to $1,499 | 6 (11.8%) | 0 (0.0%) |
| $1,500 to $1,999 | 5 (9.8%) | 0 (0.0%) |
| $2,000 to $2,499 | 1 (2.0%) | 1 (33.3%) |
| $2,500 to $2,999 | 26 (51.0%) | 0 (0.0%) |
| $3,000 or more | 13 (25.5%) | 2 (66.7%) |
| Total | 51 (100.0%) | 3 (100.0%) |
Physical Housing Characteristics in Hillsboro
Housing Structures in Hillsboro
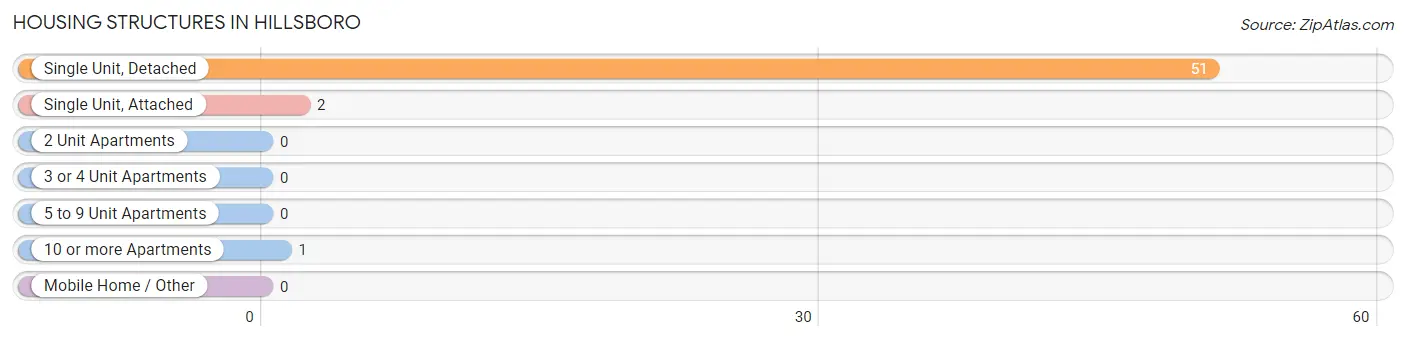
| Structure Type | # Housing Units | % Housing Units |
| Single Unit, Detached | 51 | 94.4% |
| Single Unit, Attached | 2 | 3.7% |
| 2 Unit Apartments | 0 | 0.0% |
| 3 or 4 Unit Apartments | 0 | 0.0% |
| 5 to 9 Unit Apartments | 0 | 0.0% |
| 10 or more Apartments | 1 | 1.8% |
| Mobile Home / Other | 0 | 0.0% |
| Total | 54 | 100.0% |
Housing Structures by Occupancy in Hillsboro
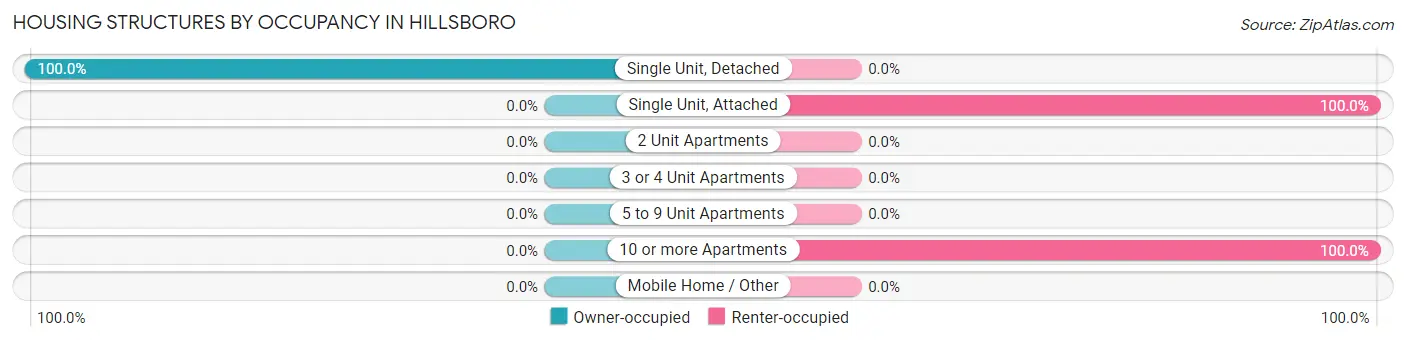
| Structure Type | Owner-occupied | Renter-occupied |
| Single Unit, Detached | 51 (100.0%) | 0 (0.0%) |
| Single Unit, Attached | 0 (0.0%) | 2 (100.0%) |
| 2 Unit Apartments | 0 (0.0%) | 0 (0.0%) |
| 3 or 4 Unit Apartments | 0 (0.0%) | 0 (0.0%) |
| 5 to 9 Unit Apartments | 0 (0.0%) | 0 (0.0%) |
| 10 or more Apartments | 0 (0.0%) | 1 (100.0%) |
| Mobile Home / Other | 0 (0.0%) | 0 (0.0%) |
| Total | 51 (94.4%) | 3 (5.6%) |
Housing Structures by Number of Rooms in Hillsboro
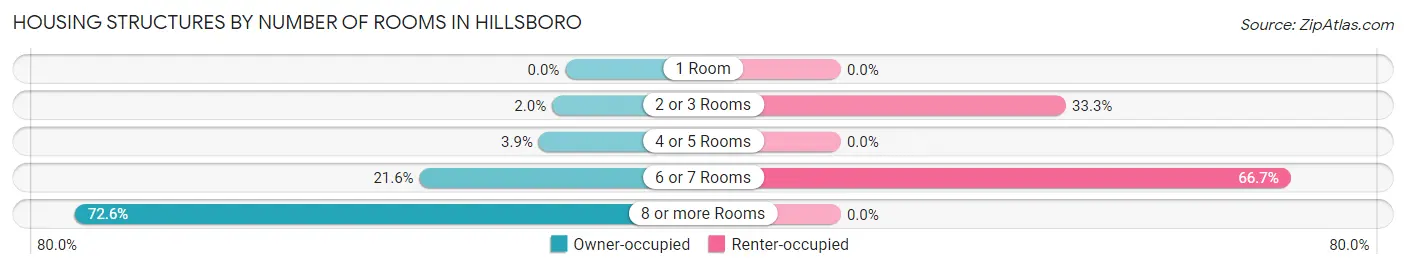
| Number of Rooms | Owner-occupied | Renter-occupied |
| 1 Room | 0 (0.0%) | 0 (0.0%) |
| 2 or 3 Rooms | 1 (2.0%) | 1 (33.3%) |
| 4 or 5 Rooms | 2 (3.9%) | 0 (0.0%) |
| 6 or 7 Rooms | 11 (21.6%) | 2 (66.7%) |
| 8 or more Rooms | 37 (72.6%) | 0 (0.0%) |
| Total | 51 (100.0%) | 3 (100.0%) |
Housing Structure by Heating Type in Hillsboro
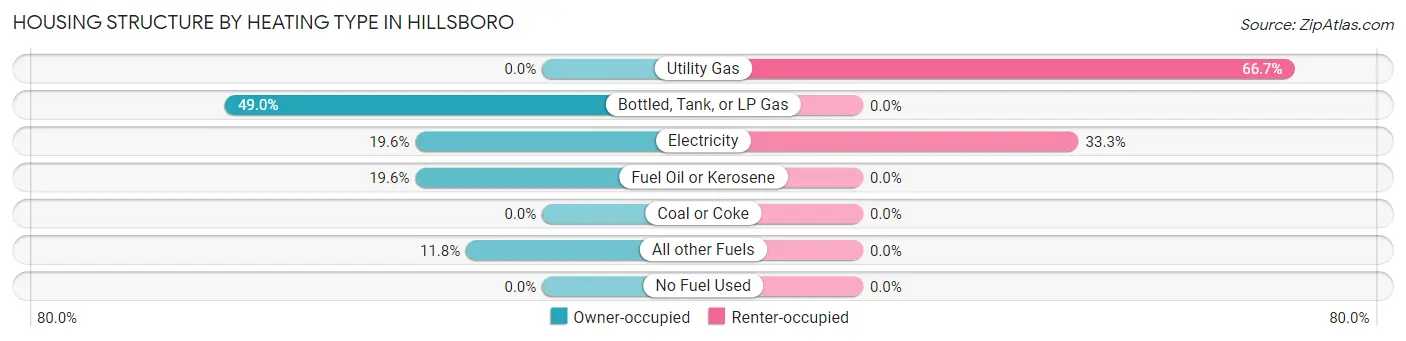
| Heating Type | Owner-occupied | Renter-occupied |
| Utility Gas | 0 (0.0%) | 2 (66.7%) |
| Bottled, Tank, or LP Gas | 25 (49.0%) | 0 (0.0%) |
| Electricity | 10 (19.6%) | 1 (33.3%) |
| Fuel Oil or Kerosene | 10 (19.6%) | 0 (0.0%) |
| Coal or Coke | 0 (0.0%) | 0 (0.0%) |
| All other Fuels | 6 (11.8%) | 0 (0.0%) |
| No Fuel Used | 0 (0.0%) | 0 (0.0%) |
| Total | 51 (100.0%) | 3 (100.0%) |
Household Vehicle Usage in Hillsboro
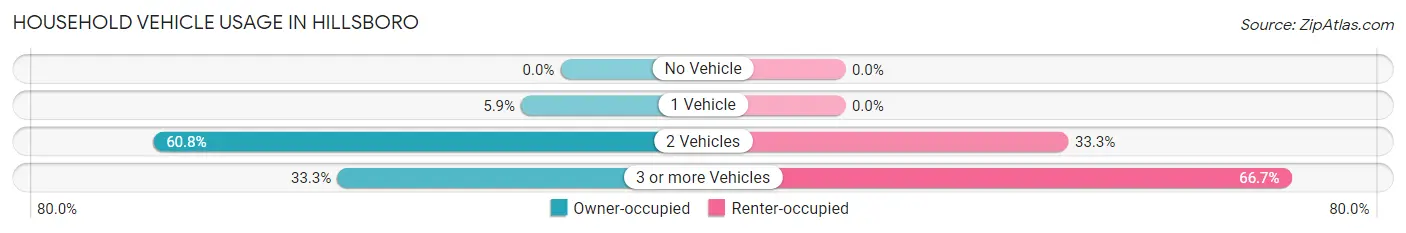
| Vehicles per Household | Owner-occupied | Renter-occupied |
| No Vehicle | 0 (0.0%) | 0 (0.0%) |
| 1 Vehicle | 3 (5.9%) | 0 (0.0%) |
| 2 Vehicles | 31 (60.8%) | 1 (33.3%) |
| 3 or more Vehicles | 17 (33.3%) | 2 (66.7%) |
| Total | 51 (100.0%) | 3 (100.0%) |
Real Estate & Mortgages in Hillsboro
Real Estate and Mortgage Overview in Hillsboro
| Characteristic | Without Mortgage | With Mortgage |
| Housing Units | 6 | 45 |
| Median Property Value | - | - |
| Median Household Income | - | - |
| Monthly Housing Costs | - | - |
| Real Estate Taxes | - | - |
Property Value by Mortgage Status in Hillsboro
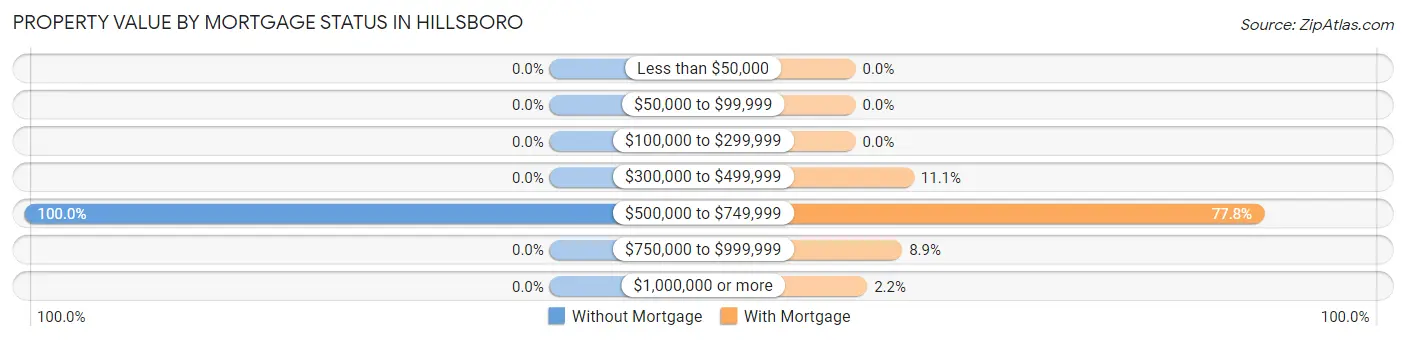
| Property Value | Without Mortgage | With Mortgage |
| Less than $50,000 | 0 (0.0%) | 0 (0.0%) |
| $50,000 to $99,999 | 0 (0.0%) | 0 (0.0%) |
| $100,000 to $299,999 | 0 (0.0%) | 0 (0.0%) |
| $300,000 to $499,999 | 0 (0.0%) | 5 (11.1%) |
| $500,000 to $749,999 | 6 (100.0%) | 35 (77.8%) |
| $750,000 to $999,999 | 0 (0.0%) | 4 (8.9%) |
| $1,000,000 or more | 0 (0.0%) | 1 (2.2%) |
| Total | 6 (100.0%) | 45 (100.0%) |
Household Income by Mortgage Status in Hillsboro
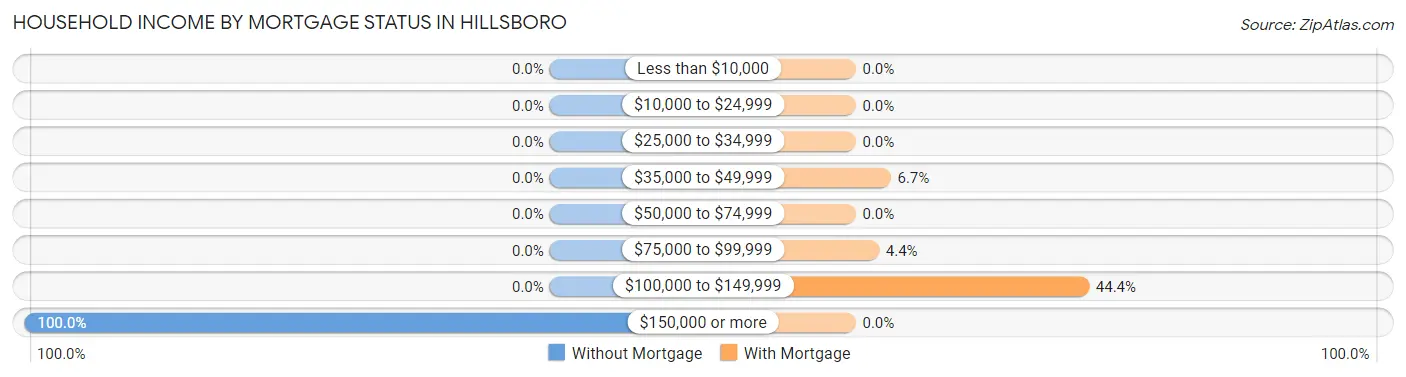
| Household Income | Without Mortgage | With Mortgage |
| Less than $10,000 | 0 (0.0%) | 0 (0.0%) |
| $10,000 to $24,999 | 0 (0.0%) | 0 (0.0%) |
| $25,000 to $34,999 | 0 (0.0%) | 0 (0.0%) |
| $35,000 to $49,999 | 0 (0.0%) | 3 (6.7%) |
| $50,000 to $74,999 | 0 (0.0%) | 0 (0.0%) |
| $75,000 to $99,999 | 0 (0.0%) | 2 (4.4%) |
| $100,000 to $149,999 | 0 (0.0%) | 20 (44.4%) |
| $150,000 or more | 6 (100.0%) | 0 (0.0%) |
| Total | 6 (100.0%) | 45 (100.0%) |
Property Value to Household Income Ratio in Hillsboro
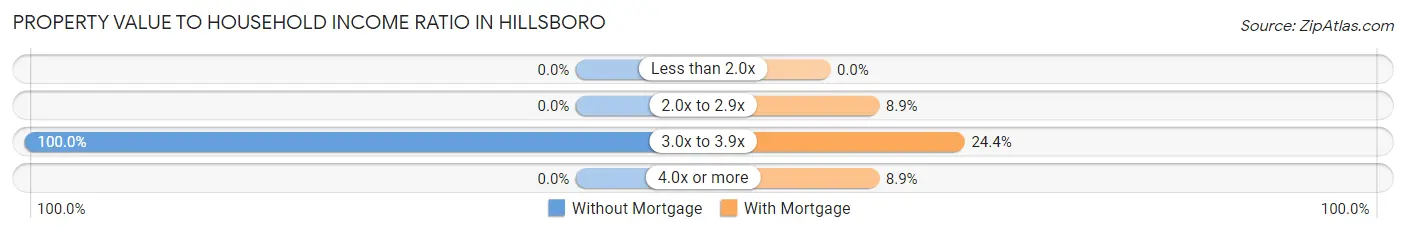
| Value-to-Income Ratio | Without Mortgage | With Mortgage |
| Less than 2.0x | 0 (0.0%) | 0 (0.0%) |
| 2.0x to 2.9x | 0 (0.0%) | 4 (8.9%) |
| 3.0x to 3.9x | 6 (100.0%) | 11 (24.4%) |
| 4.0x or more | 0 (0.0%) | 4 (8.9%) |
| Total | 6 (100.0%) | 45 (100.0%) |
Real Estate Taxes by Mortgage Status in Hillsboro
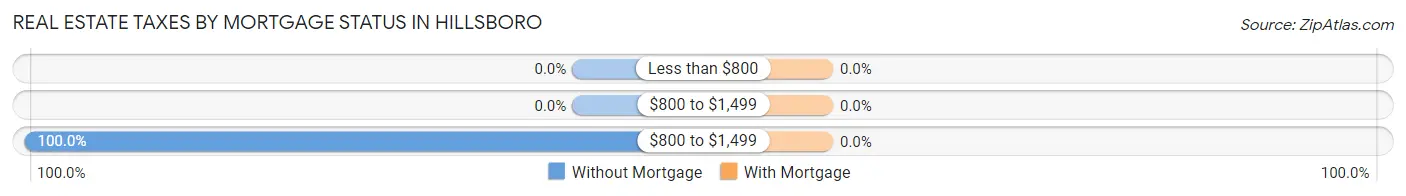
| Property Taxes | Without Mortgage | With Mortgage |
| Less than $800 | 0 (0.0%) | 0 (0.0%) |
| $800 to $1,499 | 0 (0.0%) | 0 (0.0%) |
| $800 to $1,499 | 6 (100.0%) | 0 (0.0%) |
| Total | 6 (100.0%) | 45 (100.0%) |
Health & Disability in Hillsboro
Health Insurance Coverage by Age in Hillsboro
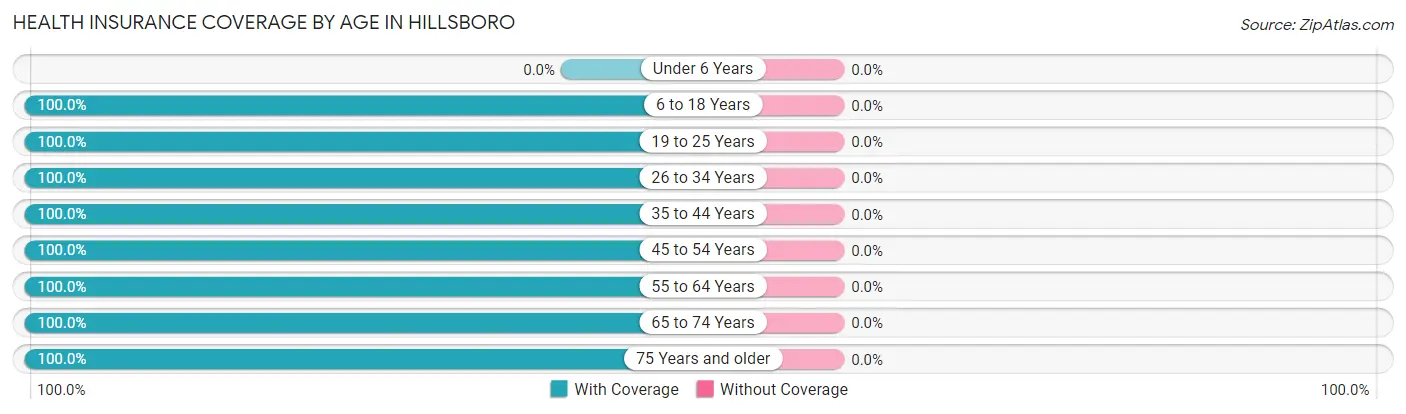
| Age Bracket | With Coverage | Without Coverage |
| Under 6 Years | 0 (0.0%) | 0 (0.0%) |
| 6 to 18 Years | 18 (100.0%) | 0 (0.0%) |
| 19 to 25 Years | 8 (100.0%) | 0 (0.0%) |
| 26 to 34 Years | 8 (100.0%) | 0 (0.0%) |
| 35 to 44 Years | 13 (100.0%) | 0 (0.0%) |
| 45 to 54 Years | 16 (100.0%) | 0 (0.0%) |
| 55 to 64 Years | 21 (100.0%) | 0 (0.0%) |
| 65 to 74 Years | 57 (100.0%) | 0 (0.0%) |
| 75 Years and older | 11 (100.0%) | 0 (0.0%) |
| Total | 152 (100.0%) | 0 (0.0%) |
Health Insurance Coverage by Citizenship Status in Hillsboro
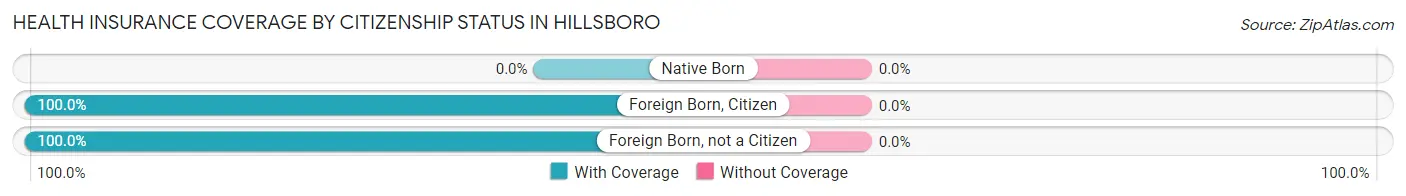
| Citizenship Status | With Coverage | Without Coverage |
| Native Born | 0 (0.0%) | 0 (0.0%) |
| Foreign Born, Citizen | 18 (100.0%) | 0 (0.0%) |
| Foreign Born, not a Citizen | 8 (100.0%) | 0 (0.0%) |
Health Insurance Coverage by Household Income in Hillsboro
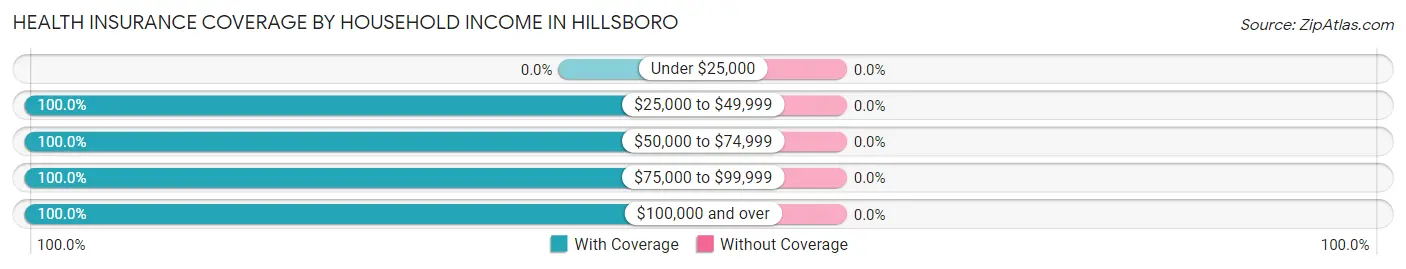
| Household Income | With Coverage | Without Coverage |
| Under $25,000 | 0 (0.0%) | 0 (0.0%) |
| $25,000 to $49,999 | 3 (100.0%) | 0 (0.0%) |
| $50,000 to $74,999 | 4 (100.0%) | 0 (0.0%) |
| $75,000 to $99,999 | 51 (100.0%) | 0 (0.0%) |
| $100,000 and over | 94 (100.0%) | 0 (0.0%) |
Public vs Private Health Insurance Coverage by Age in Hillsboro
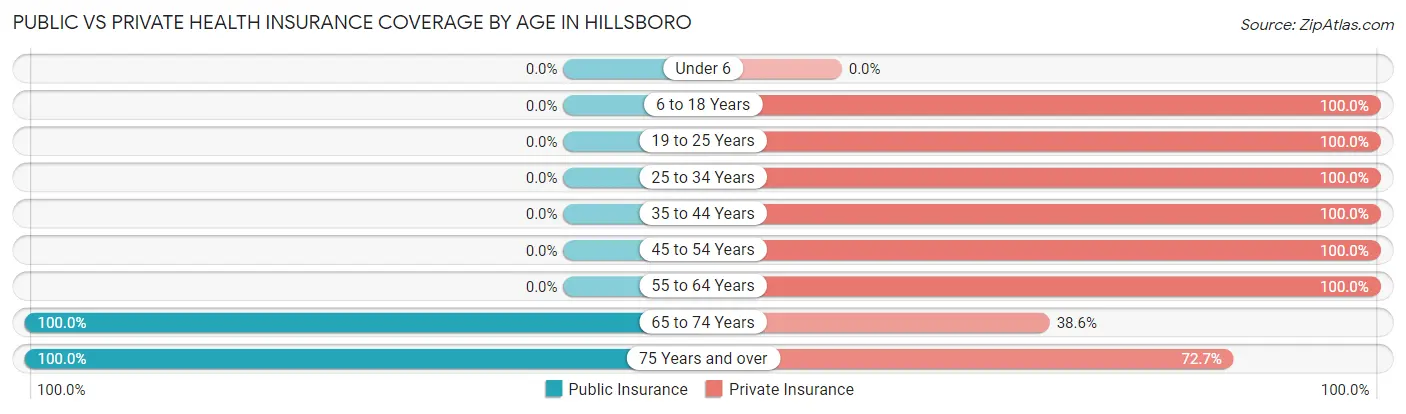
| Age Bracket | Public Insurance | Private Insurance |
| Under 6 | 0 (0.0%) | 0 (0.0%) |
| 6 to 18 Years | 0 (0.0%) | 18 (100.0%) |
| 19 to 25 Years | 0 (0.0%) | 8 (100.0%) |
| 25 to 34 Years | 0 (0.0%) | 8 (100.0%) |
| 35 to 44 Years | 0 (0.0%) | 13 (100.0%) |
| 45 to 54 Years | 0 (0.0%) | 16 (100.0%) |
| 55 to 64 Years | 0 (0.0%) | 21 (100.0%) |
| 65 to 74 Years | 57 (100.0%) | 22 (38.6%) |
| 75 Years and over | 11 (100.0%) | 8 (72.7%) |
| Total | 68 (44.7%) | 114 (75.0%) |
Disability Status by Sex by Age in Hillsboro
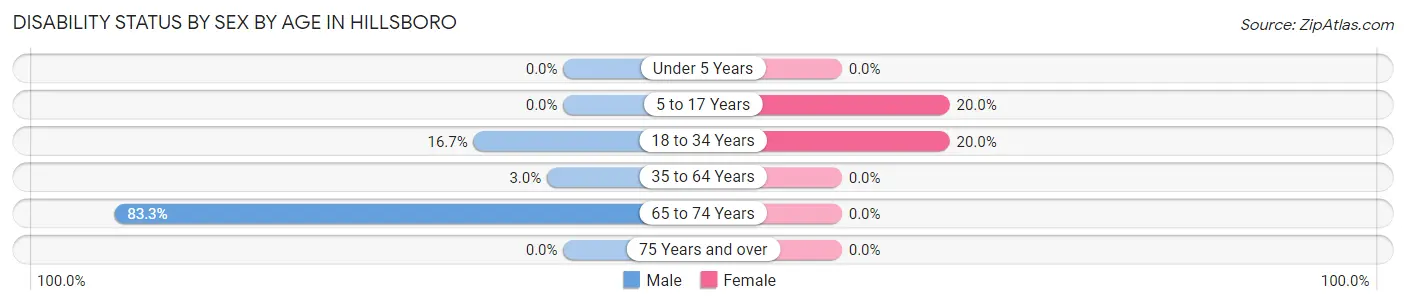
| Age Bracket | Male | Female |
| Under 5 Years | 0 (0.0%) | 0 (0.0%) |
| 5 to 17 Years | 0 (0.0%) | 1 (20.0%) |
| 18 to 34 Years | 1 (16.7%) | 2 (20.0%) |
| 35 to 64 Years | 1 (3.0%) | 0 (0.0%) |
| 65 to 74 Years | 20 (83.3%) | 0 (0.0%) |
| 75 Years and over | 0 (0.0%) | 0 (0.0%) |
Disability Class by Sex by Age in Hillsboro
Disability Class: Hearing Difficulty
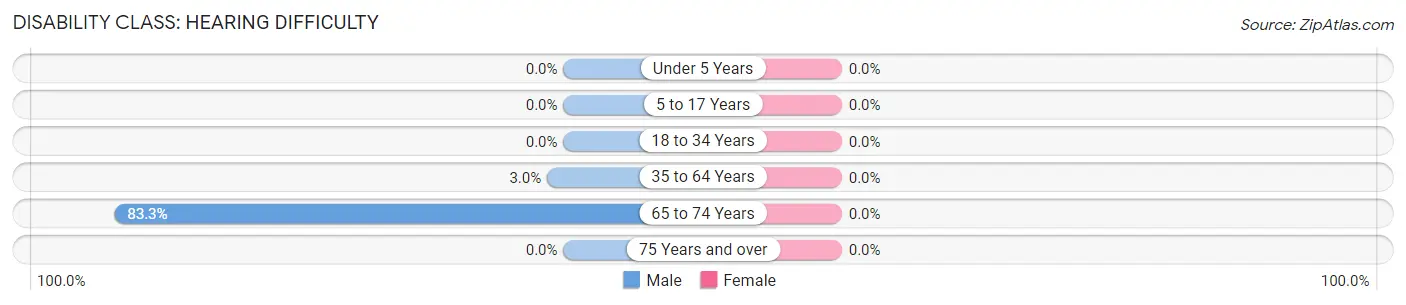
| Age Bracket | Male | Female |
| Under 5 Years | 0 (0.0%) | 0 (0.0%) |
| 5 to 17 Years | 0 (0.0%) | 0 (0.0%) |
| 18 to 34 Years | 0 (0.0%) | 0 (0.0%) |
| 35 to 64 Years | 1 (3.0%) | 0 (0.0%) |
| 65 to 74 Years | 20 (83.3%) | 0 (0.0%) |
| 75 Years and over | 0 (0.0%) | 0 (0.0%) |
Disability Class: Vision Difficulty
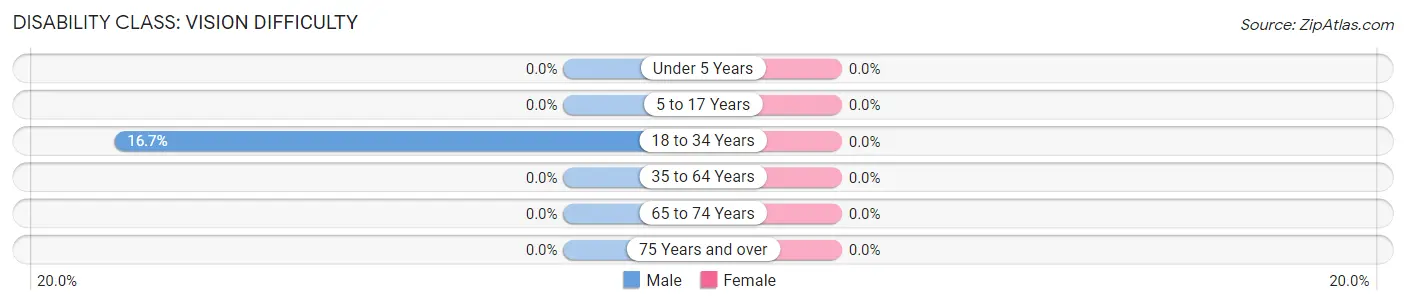
| Age Bracket | Male | Female |
| Under 5 Years | 0 (0.0%) | 0 (0.0%) |
| 5 to 17 Years | 0 (0.0%) | 0 (0.0%) |
| 18 to 34 Years | 1 (16.7%) | 0 (0.0%) |
| 35 to 64 Years | 0 (0.0%) | 0 (0.0%) |
| 65 to 74 Years | 0 (0.0%) | 0 (0.0%) |
| 75 Years and over | 0 (0.0%) | 0 (0.0%) |
Disability Class: Cognitive Difficulty
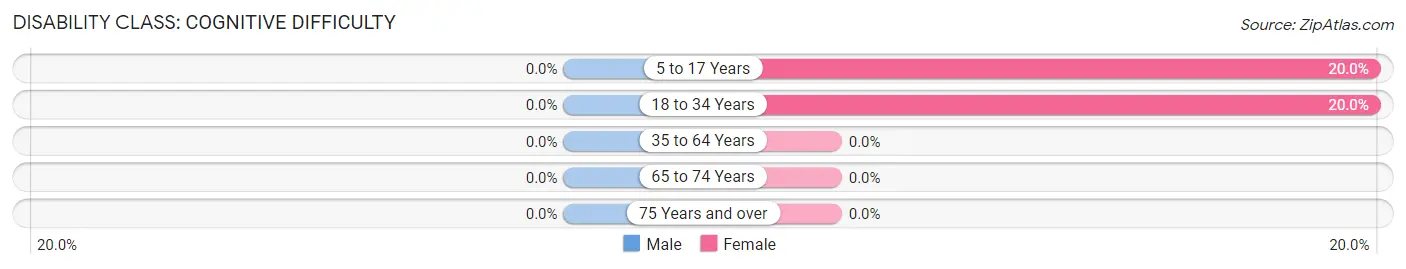
| Age Bracket | Male | Female |
| 5 to 17 Years | 0 (0.0%) | 1 (20.0%) |
| 18 to 34 Years | 0 (0.0%) | 2 (20.0%) |
| 35 to 64 Years | 0 (0.0%) | 0 (0.0%) |
| 65 to 74 Years | 0 (0.0%) | 0 (0.0%) |
| 75 Years and over | 0 (0.0%) | 0 (0.0%) |
Disability Class: Ambulatory Difficulty
| Age Bracket | Male | Female |
| 5 to 17 Years | 0 (0.0%) | 0 (0.0%) |
| 18 to 34 Years | 0 (0.0%) | 0 (0.0%) |
| 35 to 64 Years | 0 (0.0%) | 0 (0.0%) |
| 65 to 74 Years | 0 (0.0%) | 0 (0.0%) |
| 75 Years and over | 0 (0.0%) | 0 (0.0%) |
Disability Class: Self-Care Difficulty
| Age Bracket | Male | Female |
| 5 to 17 Years | 0 (0.0%) | 0 (0.0%) |
| 18 to 34 Years | 0 (0.0%) | 0 (0.0%) |
| 35 to 64 Years | 0 (0.0%) | 0 (0.0%) |
| 65 to 74 Years | 0 (0.0%) | 0 (0.0%) |
| 75 Years and over | 0 (0.0%) | 0 (0.0%) |
Technology Access in Hillsboro
Computing Device Access in Hillsboro
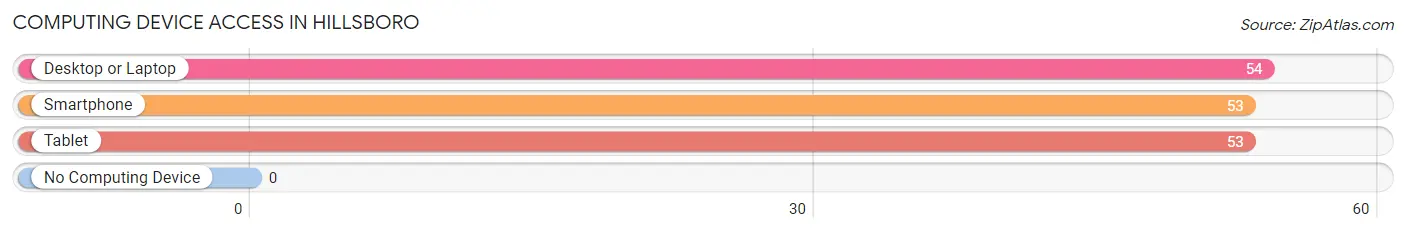
| Device Type | # Households | % Households |
| Desktop or Laptop | 54 | 100.0% |
| Smartphone | 53 | 98.2% |
| Tablet | 53 | 98.2% |
| No Computing Device | 0 | 0.0% |
| Total | 54 | 100.0% |
Internet Access in Hillsboro
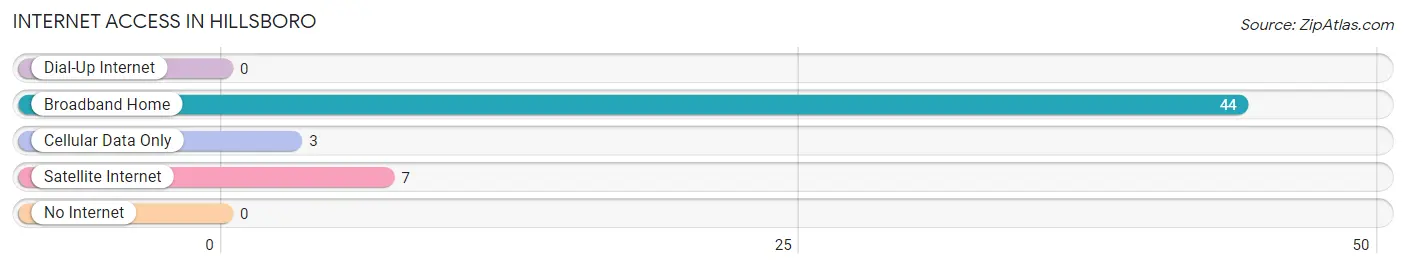
| Internet Type | # Households | % Households |
| Dial-Up Internet | 0 | 0.0% |
| Broadband Home | 44 | 81.5% |
| Cellular Data Only | 3 | 5.6% |
| Satellite Internet | 7 | 13.0% |
| No Internet | 0 | 0.0% |
| Total | 54 | 100.0% |
Hillsboro Summary
Hillsboro is a small town located in Loudoun County, Virginia. It is situated in the foothills of the Blue Ridge Mountains, about 25 miles west of Washington, D.C. The town has a population of approximately 1,000 people and is part of the Washington metropolitan area.
History
Hillsboro was first settled in 1750 by a group of German immigrants. The town was originally known as “Hillsborough” and was named after the Earl of Hillsborough, who was a British politician at the time. The town was officially incorporated in 1809.
During the Civil War, Hillsboro was the site of a major battle between Union and Confederate forces. The Battle of Hillsboro was fought on July 21, 1864 and resulted in a Confederate victory.
In the late 19th century, Hillsboro became a popular summer resort for wealthy Washingtonians. The town was known for its mineral springs, which were believed to have healing properties.
Geography
Hillsboro is located in the Piedmont region of Virginia. The town is situated in the foothills of the Blue Ridge Mountains, about 25 miles west of Washington, D.C. The town is bordered by the towns of Purcellville, Round Hill, and Lovettsville.
The terrain of Hillsboro is mostly rolling hills and valleys. The town is located in the Catoctin Creek watershed, which is part of the Potomac River watershed. The town is also home to several small streams, including the Catoctin Creek, Goose Creek, and Little Catoctin Creek.
Economy
Hillsboro’s economy is largely based on agriculture and tourism. The town is home to several wineries, including the Hillsboro Vineyards and Winery, which produces award-winning wines. The town is also home to several small businesses, including antique stores, art galleries, and restaurants.
The town is also home to several historic sites, including the Hillsboro Historic District, which is listed on the National Register of Historic Places. The district includes several buildings from the 19th century, including the Hillsboro Inn, the Hillsboro Post Office, and the Hillsboro Presbyterian Church.
Demographics
As of the 2010 census, Hillsboro had a population of 1,068 people. The racial makeup of the town was 94.3% White, 1.7% African American, 0.3% Native American, 0.7% Asian, 0.1% Pacific Islander, 1.2% from other races, and 1.9% from two or more races. Hispanic or Latino of any race were 3.2% of the population.
The median household income in Hillsboro was $76,250, and the median family income was $87,500. The per capita income for the town was $35,945. About 4.3% of families and 5.7% of the population were below the poverty line, including 6.3% of those under age 18 and 4.2% of those age 65 or over.
Hillsboro is a small town with a rich history and a vibrant economy. The town is home to several wineries, historic sites, and small businesses, and is a popular destination for tourists and locals alike. The town’s population is diverse, with a mix of races and ethnicities, and a median household income that is higher than the national average.
Common Questions
What is Per Capita Income in Hillsboro?
Per Capita income in Hillsboro is $60,185.
What is Inequality or Gini Index in Hillsboro?
Inequality or Gini Index in Hillsboro is 0.29.
What is the Total Population of Hillsboro?
Total Population of Hillsboro is 152.
What is the Total Male Population of Hillsboro?
Total Male Population of Hillsboro is 77.
What is the Total Female Population of Hillsboro?
Total Female Population of Hillsboro is 75.
What is the Ratio of Males per 100 Females in Hillsboro?
There are 102.67 Males per 100 Females in Hillsboro.
What is the Ratio of Females per 100 Males in Hillsboro?
There are 97.40 Females per 100 Males in Hillsboro.
What is the Median Population Age in Hillsboro?
Median Population Age in Hillsboro is 60.5 Years.
What is the Average Family Size in Hillsboro
Average Family Size in Hillsboro is 2.8 People.
What is the Average Household Size in Hillsboro
Average Household Size in Hillsboro is 2.8 People.
How Large is the Labor Force in Hillsboro?
There are 100 People in the Labor Forcein in Hillsboro.
What is the Percentage of People in the Labor Force in Hillsboro?
69.9% of People are in the Labor Force in Hillsboro.