Cities with the Highest Percentage of Scandinavian Population in Virginia
RELATED REPORTS & OPTIONS
Scandinavian
Virginia
Compare Cities
Map of Cities with the Highest Percentage of Scandinavian Population in Virginia
0.00%
25.00%
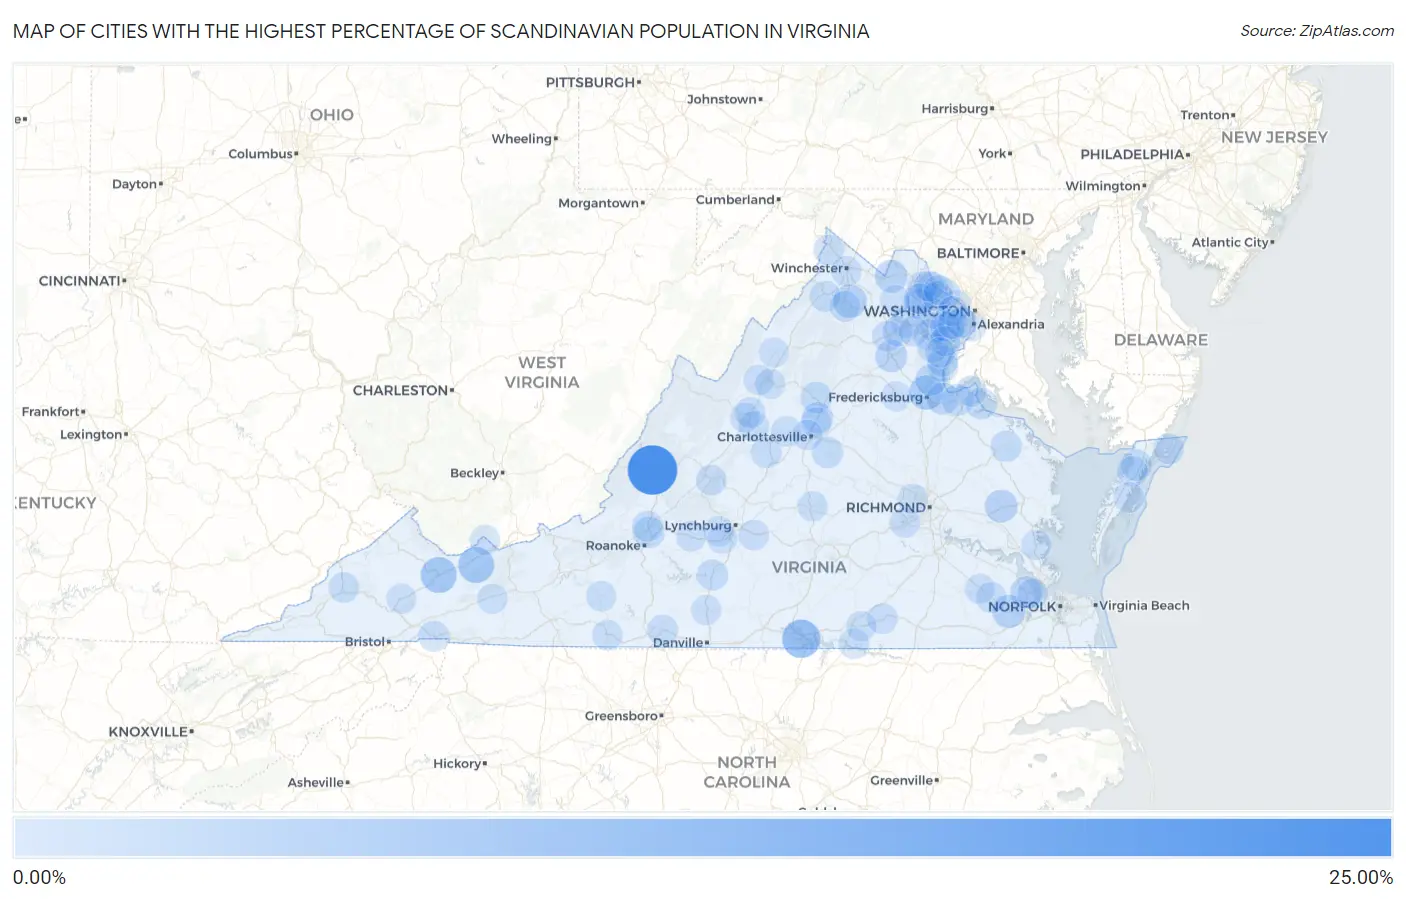
Cities with the Highest Percentage of Scandinavian Population in Virginia
| City | Scandinavian | vs State | vs National | |
| 1. | Low Moor | 20.05% | 0.24%(+19.8)#1 | 0.30%(+19.7)#39 |
| 2. | Clarksville | 8.23% | 0.24%(+7.99)#2 | 0.30%(+7.92)#158 |
| 3. | Gratton | 5.95% | 0.24%(+5.71)#3 | 0.30%(+5.65)#260 |
| 4. | Claypool Hill | 5.91% | 0.24%(+5.67)#4 | 0.30%(+5.60)#263 |
| 5. | Falmouth | 4.48% | 0.24%(+4.24)#5 | 0.30%(+4.17)#398 |
| 6. | Shenandoah Shores | 3.59% | 0.24%(+3.35)#6 | 0.30%(+3.28)#567 |
| 7. | Windsor | 3.29% | 0.24%(+3.05)#7 | 0.30%(+2.99)#642 |
| 8. | Round Hill | 2.84% | 0.24%(+2.61)#8 | 0.30%(+2.54)#801 |
| 9. | West Point | 2.83% | 0.24%(+2.59)#9 | 0.30%(+2.52)#815 |
| 10. | Bealeton | 2.25% | 0.24%(+2.01)#10 | 0.30%(+1.94)#1,111 |
| 11. | Benns Church | 2.25% | 0.24%(+2.01)#11 | 0.30%(+1.94)#1,112 |
| 12. | Passapatanzy | 2.10% | 0.24%(+1.86)#12 | 0.30%(+1.80)#1,236 |
| 13. | Stafford Courthouse | 1.80% | 0.24%(+1.56)#13 | 0.30%(+1.50)#1,494 |
| 14. | Cloverdale | 1.63% | 0.24%(+1.39)#14 | 0.30%(+1.32)#1,696 |
| 15. | Stanardsville | 1.63% | 0.24%(+1.39)#15 | 0.30%(+1.32)#1,700 |
| 16. | King George | 1.62% | 0.24%(+1.38)#16 | 0.30%(+1.31)#1,710 |
| 17. | Bloxom | 1.51% | 0.24%(+1.27)#17 | 0.30%(+1.20)#1,844 |
| 18. | Lake Monticello | 1.42% | 0.24%(+1.18)#18 | 0.30%(+1.12)#1,959 |
| 19. | Colonial Beach | 1.39% | 0.24%(+1.15)#19 | 0.30%(+1.08)#2,013 |
| 20. | Piney Mountain | 1.37% | 0.24%(+1.13)#20 | 0.30%(+1.06)#2,042 |
| 21. | Motley | 1.31% | 0.24%(+1.07)#21 | 0.30%(+1.01)#2,152 |
| 22. | Quantico Base | 1.25% | 0.24%(+1.01)#22 | 0.30%(+0.943)#2,283 |
| 23. | Warsaw | 1.24% | 0.24%(+1.01)#23 | 0.30%(+0.940)#2,290 |
| 24. | Strasburg | 1.15% | 0.24%(+0.915)#24 | 0.30%(+0.850)#2,479 |
| 25. | Daleville | 1.10% | 0.24%(+0.865)#25 | 0.30%(+0.800)#2,600 |
| 26. | Ivor | 1.09% | 0.24%(+0.848)#26 | 0.30%(+0.783)#2,645 |
| 27. | Haymarket | 1.02% | 0.24%(+0.779)#27 | 0.30%(+0.714)#2,812 |
| 28. | Difficult Run | 1.02% | 0.24%(+0.777)#28 | 0.30%(+0.712)#2,816 |
| 29. | Nellysford | 1.00% | 0.24%(+0.764)#29 | 0.30%(+0.699)#2,847 |
| 30. | Warrenton | 0.97% | 0.24%(+0.730)#30 | 0.30%(+0.665)#2,934 |
| 31. | Dahlgren | 0.97% | 0.24%(+0.728)#31 | 0.30%(+0.662)#2,940 |
| 32. | Great Falls | 0.96% | 0.24%(+0.723)#32 | 0.30%(+0.658)#2,949 |
| 33. | Chatmoss | 0.94% | 0.24%(+0.701)#33 | 0.30%(+0.636)#3,019 |
| 34. | Damascus | 0.91% | 0.24%(+0.674)#34 | 0.30%(+0.608)#3,087 |
| 35. | Crosspointe | 0.87% | 0.24%(+0.628)#35 | 0.30%(+0.563)#3,248 |
| 36. | Verona | 0.85% | 0.24%(+0.612)#36 | 0.30%(+0.547)#3,295 |
| 37. | Chincoteague | 0.85% | 0.24%(+0.609)#37 | 0.30%(+0.543)#3,309 |
| 38. | Wise | 0.84% | 0.24%(+0.605)#38 | 0.30%(+0.540)#3,321 |
| 39. | Buena Vista | 0.84% | 0.24%(+0.604)#39 | 0.30%(+0.539)#3,327 |
| 40. | Front Royal | 0.83% | 0.24%(+0.591)#40 | 0.30%(+0.525)#3,383 |
| 41. | Buckhall | 0.82% | 0.24%(+0.582)#41 | 0.30%(+0.517)#3,412 |
| 42. | Parksley | 0.79% | 0.24%(+0.546)#42 | 0.30%(+0.481)#3,568 |
| 43. | Lake Holiday | 0.76% | 0.24%(+0.522)#43 | 0.30%(+0.457)#3,671 |
| 44. | Countryside | 0.76% | 0.24%(+0.518)#44 | 0.30%(+0.452)#3,690 |
| 45. | Great Falls Crossing | 0.75% | 0.24%(+0.513)#45 | 0.30%(+0.448)#3,699 |
| 46. | Wachapreague | 0.74% | 0.24%(+0.502)#46 | 0.30%(+0.436)#3,745 |
| 47. | Concord | 0.72% | 0.24%(+0.477)#47 | 0.30%(+0.412)#3,857 |
| 48. | Winchester | 0.72% | 0.24%(+0.476)#48 | 0.30%(+0.411)#3,864 |
| 49. | Loudoun Valley Estates | 0.71% | 0.24%(+0.474)#49 | 0.30%(+0.409)#3,873 |
| 50. | Lawrenceville | 0.67% | 0.24%(+0.428)#50 | 0.30%(+0.363)#4,069 |
| 51. | Brandermill | 0.66% | 0.24%(+0.419)#51 | 0.30%(+0.354)#4,117 |
| 52. | Hollymead | 0.65% | 0.24%(+0.413)#52 | 0.30%(+0.348)#4,142 |
| 53. | Carrollton | 0.63% | 0.24%(+0.388)#53 | 0.30%(+0.323)#4,266 |
| 54. | Dayton | 0.63% | 0.24%(+0.388)#54 | 0.30%(+0.322)#4,271 |
| 55. | Pocahontas | 0.61% | 0.24%(+0.374)#55 | 0.30%(+0.309)#4,325 |
| 56. | Burke | 0.61% | 0.24%(+0.371)#56 | 0.30%(+0.306)#4,345 |
| 57. | Mclean | 0.61% | 0.24%(+0.370)#57 | 0.30%(+0.305)#4,353 |
| 58. | Triangle | 0.61% | 0.24%(+0.367)#58 | 0.30%(+0.302)#4,366 |
| 59. | Greenbriar | 0.60% | 0.24%(+0.365)#59 | 0.30%(+0.300)#4,381 |
| 60. | Bedford | 0.60% | 0.24%(+0.360)#60 | 0.30%(+0.295)#4,407 |
| 61. | Belmont | 0.60% | 0.24%(+0.358)#61 | 0.30%(+0.292)#4,418 |
| 62. | Stuart | 0.59% | 0.24%(+0.348)#62 | 0.30%(+0.283)#4,473 |
| 63. | Arcola | 0.57% | 0.24%(+0.335)#63 | 0.30%(+0.270)#4,544 |
| 64. | Crozet | 0.57% | 0.24%(+0.334)#64 | 0.30%(+0.269)#4,548 |
| 65. | Fishersville | 0.57% | 0.24%(+0.334)#65 | 0.30%(+0.269)#4,552 |
| 66. | Independent Hill | 0.57% | 0.24%(+0.329)#66 | 0.30%(+0.264)#4,578 |
| 67. | Bracey | 0.56% | 0.24%(+0.325)#67 | 0.30%(+0.260)#4,598 |
| 68. | Clifton | 0.56% | 0.24%(+0.320)#68 | 0.30%(+0.254)#4,629 |
| 69. | New Baltimore | 0.55% | 0.24%(+0.314)#69 | 0.30%(+0.249)#4,660 |
| 70. | Brodnax | 0.55% | 0.24%(+0.309)#70 | 0.30%(+0.244)#4,696 |
| 71. | University Of Virginia | 0.53% | 0.24%(+0.289)#71 | 0.30%(+0.224)#4,805 |
| 72. | Brambleton | 0.53% | 0.24%(+0.287)#72 | 0.30%(+0.222)#4,812 |
| 73. | Floyd | 0.53% | 0.24%(+0.287)#73 | 0.30%(+0.222)#4,814 |
| 74. | Dranesville | 0.52% | 0.24%(+0.279)#74 | 0.30%(+0.214)#4,865 |
| 75. | Dillwyn | 0.52% | 0.24%(+0.278)#75 | 0.30%(+0.213)#4,874 |
| 76. | University Center | 0.50% | 0.24%(+0.258)#76 | 0.30%(+0.193)#5,009 |
| 77. | Wakefield | 0.47% | 0.24%(+0.227)#77 | 0.30%(+0.162)#5,238 |
| 78. | Middleburg | 0.47% | 0.24%(+0.227)#78 | 0.30%(+0.162)#5,240 |
| 79. | Rural Retreat | 0.46% | 0.24%(+0.218)#79 | 0.30%(+0.153)#5,304 |
| 80. | Staunton | 0.45% | 0.24%(+0.207)#80 | 0.30%(+0.141)#5,408 |
| 81. | Midlothian | 0.44% | 0.24%(+0.200)#81 | 0.30%(+0.135)#5,458 |
| 82. | Tuckahoe | 0.44% | 0.24%(+0.200)#82 | 0.30%(+0.135)#5,460 |
| 83. | Burke Centre | 0.44% | 0.24%(+0.196)#83 | 0.30%(+0.131)#5,495 |
| 84. | Forest | 0.43% | 0.24%(+0.193)#84 | 0.30%(+0.128)#5,519 |
| 85. | Moorefield | 0.42% | 0.24%(+0.180)#85 | 0.30%(+0.115)#5,642 |
| 86. | Linton Hall | 0.41% | 0.24%(+0.173)#86 | 0.30%(+0.108)#5,704 |
| 87. | Broadway | 0.41% | 0.24%(+0.169)#87 | 0.30%(+0.103)#5,750 |
| 88. | Lake Ridge | 0.40% | 0.24%(+0.157)#88 | 0.30%(+0.091)#5,837 |
| 89. | Huntington | 0.40% | 0.24%(+0.156)#89 | 0.30%(+0.091)#5,845 |
| 90. | Lowes Island | 0.39% | 0.24%(+0.151)#90 | 0.30%(+0.086)#5,888 |
| 91. | Dunn Loring | 0.39% | 0.24%(+0.151)#91 | 0.30%(+0.086)#5,889 |
| 92. | Timberlake | 0.38% | 0.24%(+0.146)#92 | 0.30%(+0.080)#5,955 |
| 93. | Massanetta Springs | 0.38% | 0.24%(+0.145)#93 | 0.30%(+0.079)#5,964 |
| 94. | Kings Park | 0.37% | 0.24%(+0.136)#94 | 0.30%(+0.070)#6,050 |
| 95. | Chatham | 0.37% | 0.24%(+0.127)#95 | 0.30%(+0.062)#6,140 |
| 96. | Lake Wilderness | 0.35% | 0.24%(+0.113)#96 | 0.30%(+0.048)#6,271 |
| 97. | Lebanon | 0.35% | 0.24%(+0.111)#97 | 0.30%(+0.046)#6,293 |
| 98. | Gloucester Point | 0.34% | 0.24%(+0.106)#98 | 0.30%(+0.041)#6,352 |
| 99. | Montclair | 0.33% | 0.24%(+0.087)#99 | 0.30%(+0.022)#6,550 |
| 100. | Lincolnia | 0.32% | 0.24%(+0.079)#100 | 0.30%(+0.014)#6,627 |
Common Questions
What are the Top 10 Cities with the Highest Percentage of Scandinavian Population in Virginia?
Top 10 Cities with the Highest Percentage of Scandinavian Population in Virginia are:
#1
20.05%
#2
8.23%
#3
5.95%
#4
5.91%
#5
4.48%
#6
3.59%
#7
3.29%
#8
2.84%
#9
2.83%
#10
2.25%
What city has the Highest Percentage of Scandinavian Population in Virginia?
Low Moor has the Highest Percentage of Scandinavian Population in Virginia with 20.05%.
What is the Percentage of Scandinavian Population in the State of Virginia?
Percentage of Scandinavian Population in Virginia is 0.24%.
What is the Percentage of Scandinavian Population in the United States?
Percentage of Scandinavian Population in the United States is 0.30%.