George Mason, VA Map & Demographics
George Mason Map
George Mason Overview
$31,613
PER CAPITA INCOME
$175,455
AVG FAMILY INCOME
$146,985
AVG HOUSEHOLD INCOME
60.7%
WAGE / INCOME GAP [ % ]
39.3¢/ $1
WAGE / INCOME GAP [ $ ]
$15,030
FAMILY INCOME DEFICIT
0.37
INEQUALITY / GINI INDEX
10,017
TOTAL POPULATION
4,884
MALE POPULATION
5,133
FEMALE POPULATION
95.15
MALES / 100 FEMALES
105.10
FEMALES / 100 MALES
20.9
MEDIAN AGE
3.4
AVG FAMILY SIZE
3.0
AVG HOUSEHOLD SIZE
4,786
LABOR FORCE [ PEOPLE ]
54.1%
PERCENT IN LABOR FORCE
11.9%
UNEMPLOYMENT RATE
Income in George Mason
Income Overview in George Mason
Per Capita Income in George Mason is $31,613, while median incomes of families and households are $175,455 and $146,985 respectively.
| Characteristic | Number | Measure |
| Per Capita Income | 10,017 | $31,613 |
| Median Family Income | 1,396 | $175,455 |
| Mean Family Income | 1,396 | $192,118 |
| Median Household Income | 1,755 | $146,985 |
| Mean Household Income | 1,755 | $170,500 |
| Income Deficit | 1,396 | $15,030 |
| Wage / Income Gap (%) | 10,017 | 60.75% |
| Wage / Income Gap ($) | 10,017 | 39.25¢ per $1 |
| Gini / Inequality Index | 10,017 | 0.37 |
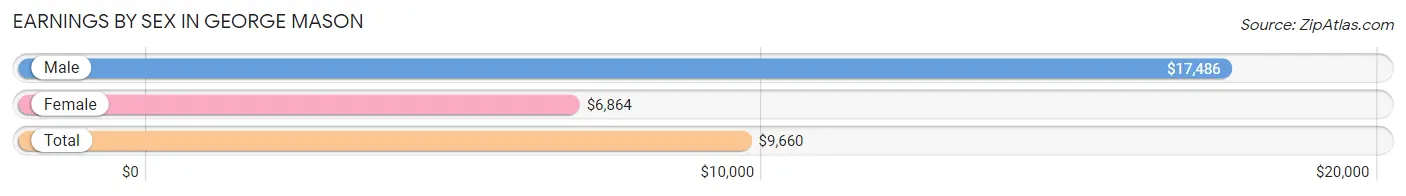
Earnings by Sex in George Mason
Average Earnings in George Mason are $9,660, $17,486 for men and $6,864 for women, a difference of 60.8%.
| Sex | Number | Average Earnings |
| Male | 2,853 (44.5%) | $17,486 |
| Female | 3,554 (55.5%) | $6,864 |
| Total | 6,407 (100.0%) | $9,660 |
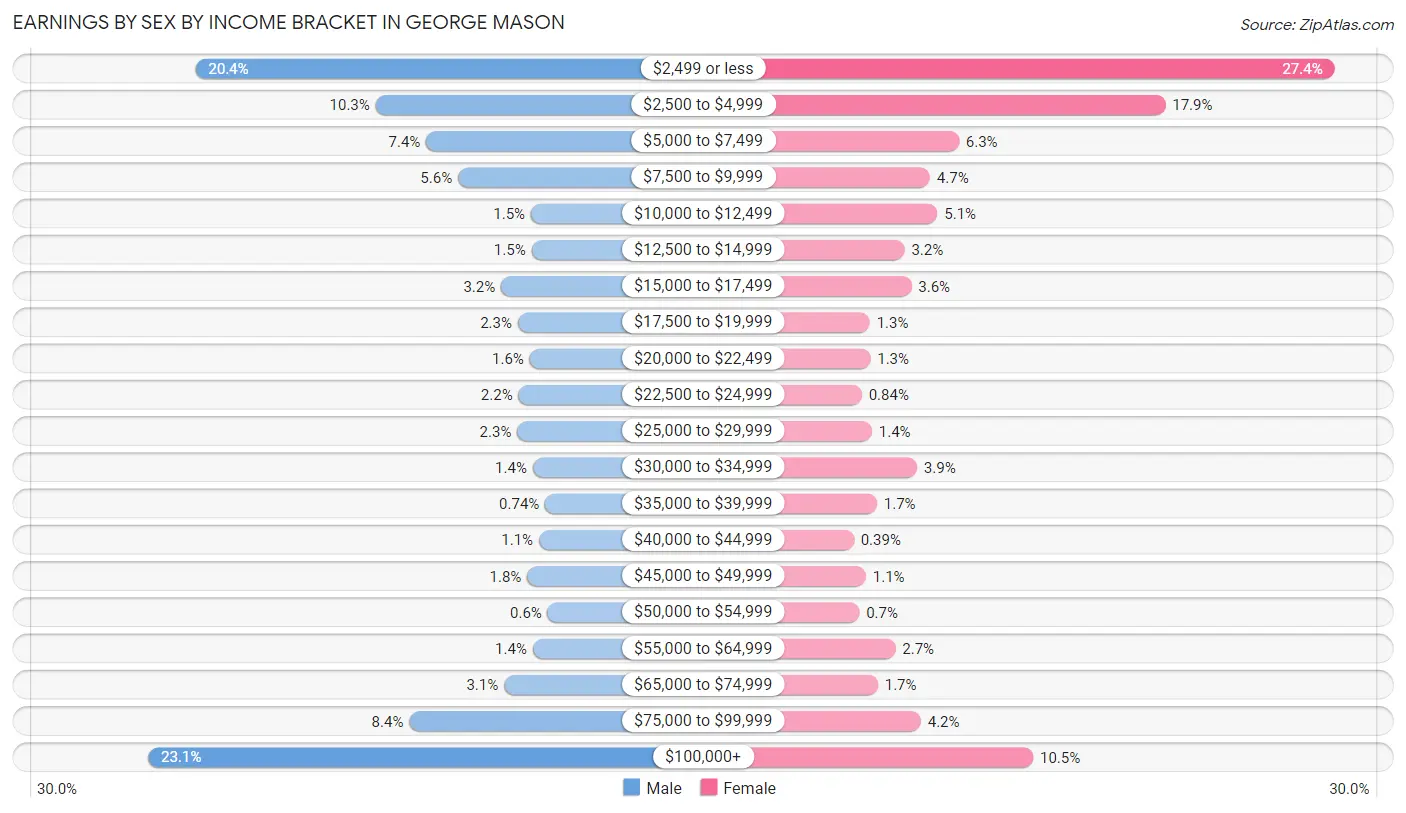
Earnings by Sex by Income Bracket in George Mason
The most common earnings brackets in George Mason are $100,000+ for men (658 | 23.1%) and $2,499 or less for women (974 | 27.4%).
| Income | Male | Female |
| $2,499 or less | 582 (20.4%) | 974 (27.4%) |
| $2,500 to $4,999 | 293 (10.3%) | 636 (17.9%) |
| $5,000 to $7,499 | 212 (7.4%) | 224 (6.3%) |
| $7,500 to $9,999 | 161 (5.6%) | 166 (4.7%) |
| $10,000 to $12,499 | 44 (1.5%) | 181 (5.1%) |
| $12,500 to $14,999 | 43 (1.5%) | 115 (3.2%) |
| $15,000 to $17,499 | 92 (3.2%) | 129 (3.6%) |
| $17,500 to $19,999 | 65 (2.3%) | 46 (1.3%) |
| $20,000 to $22,499 | 46 (1.6%) | 47 (1.3%) |
| $22,500 to $24,999 | 64 (2.2%) | 30 (0.8%) |
| $25,000 to $29,999 | 66 (2.3%) | 50 (1.4%) |
| $30,000 to $34,999 | 41 (1.4%) | 140 (3.9%) |
| $35,000 to $39,999 | 21 (0.7%) | 60 (1.7%) |
| $40,000 to $44,999 | 31 (1.1%) | 14 (0.4%) |
| $45,000 to $49,999 | 50 (1.8%) | 38 (1.1%) |
| $50,000 to $54,999 | 17 (0.6%) | 25 (0.7%) |
| $55,000 to $64,999 | 41 (1.4%) | 97 (2.7%) |
| $65,000 to $74,999 | 87 (3.0%) | 62 (1.7%) |
| $75,000 to $99,999 | 239 (8.4%) | 148 (4.2%) |
| $100,000+ | 658 (23.1%) | 372 (10.5%) |
| Total | 2,853 (100.0%) | 3,554 (100.0%) |
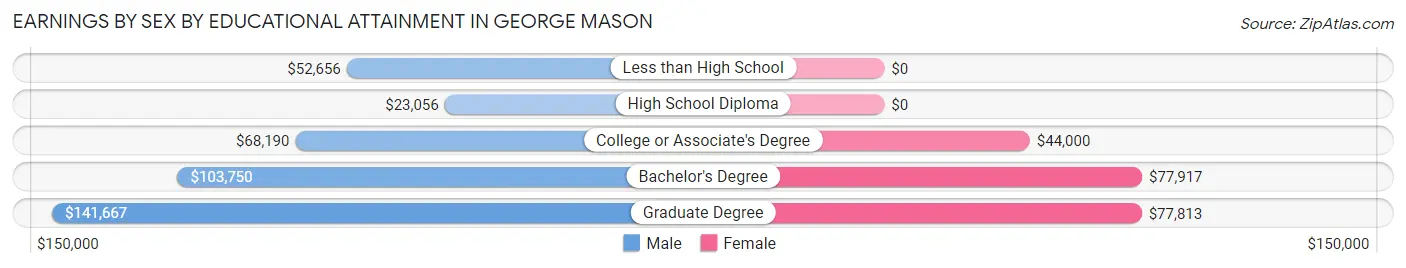
Earnings by Sex by Educational Attainment in George Mason
Average earnings in George Mason are $99,259 for men and $58,802 for women, a difference of 40.8%. Men with an educational attainment of graduate degree enjoy the highest average annual earnings of $141,667, while those with high school diploma education earn the least with $23,056. Women with an educational attainment of bachelor's degree earn the most with the average annual earnings of $77,917, while those with college or associate's degree education have the smallest earnings of $44,000.
| Educational Attainment | Male Income | Female Income |
| Less than High School | $52,656 | $0 |
| High School Diploma | $23,056 | $0 |
| College or Associate's Degree | $68,190 | $44,000 |
| Bachelor's Degree | $103,750 | $77,917 |
| Graduate Degree | $141,667 | $77,813 |
| Total | $99,259 | $58,802 |
Family Income in George Mason
Family Income Brackets in George Mason
According to the George Mason family income data, there are 593 families falling into the $200,000+ income range, which is the most common income bracket and makes up 42.5% of all families.
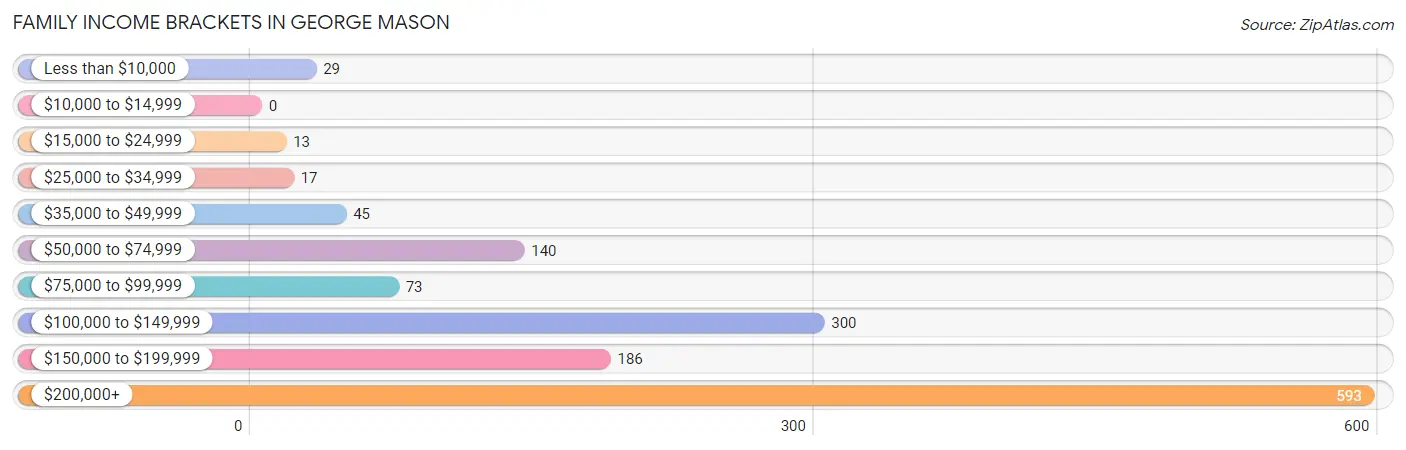
| Income Bracket | # Families | % Families |
| Less than $10,000 | 29 | 2.1% |
| $10,000 to $14,999 | 0 | 0.0% |
| $15,000 to $24,999 | 13 | 0.9% |
| $25,000 to $34,999 | 17 | 1.2% |
| $35,000 to $49,999 | 45 | 3.2% |
| $50,000 to $74,999 | 140 | 10.0% |
| $75,000 to $99,999 | 73 | 5.2% |
| $100,000 to $149,999 | 300 | 21.5% |
| $150,000 to $199,999 | 186 | 13.3% |
| $200,000+ | 593 | 42.5% |
Family Income by Famaliy Size in George Mason
5-person families (112 | 8.0%) account for the highest median family income in George Mason with $250,001 per family, while 2-person families (429 | 30.7%) have the highest median income of $72,216 per family member.
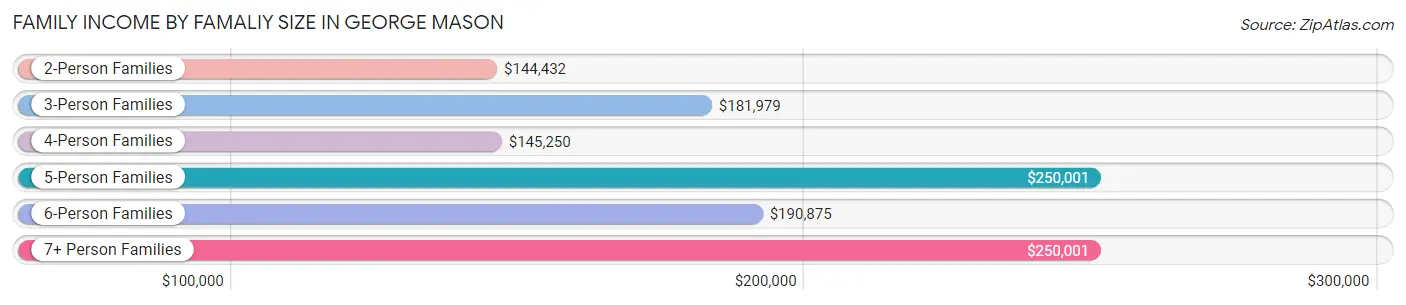
| Income Bracket | # Families | Median Income |
| 2-Person Families | 429 (30.7%) | $144,432 |
| 3-Person Families | 361 (25.9%) | $181,979 |
| 4-Person Families | 395 (28.3%) | $145,250 |
| 5-Person Families | 112 (8.0%) | $250,001 |
| 6-Person Families | 47 (3.4%) | $190,875 |
| 7+ Person Families | 52 (3.7%) | $250,001 |
| Total | 1,396 (100.0%) | $175,455 |
Family Income by Number of Earners in George Mason
The median family income in George Mason is $175,455, with families comprising 2 earners (759) having the highest median family income of $206,442, while families with no earners (147) have the lowest median family income of $98,542, accounting for 54.4% and 10.5% of families, respectively.
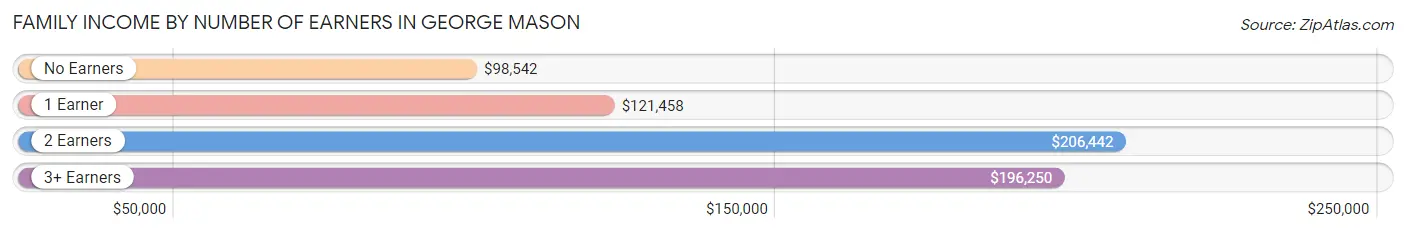
| Number of Earners | # Families | Median Income |
| No Earners | 147 (10.5%) | $98,542 |
| 1 Earner | 265 (19.0%) | $121,458 |
| 2 Earners | 759 (54.4%) | $206,442 |
| 3+ Earners | 225 (16.1%) | $196,250 |
| Total | 1,396 (100.0%) | $175,455 |
Household Income in George Mason
Household Income Brackets in George Mason
With 620 households falling in the category, the $200,000+ income range is the most frequent in George Mason, accounting for 35.3% of all households. In contrast, only 21 households (1.2%) fall into the $10,000 to $14,999 income bracket, making it the least populous group.
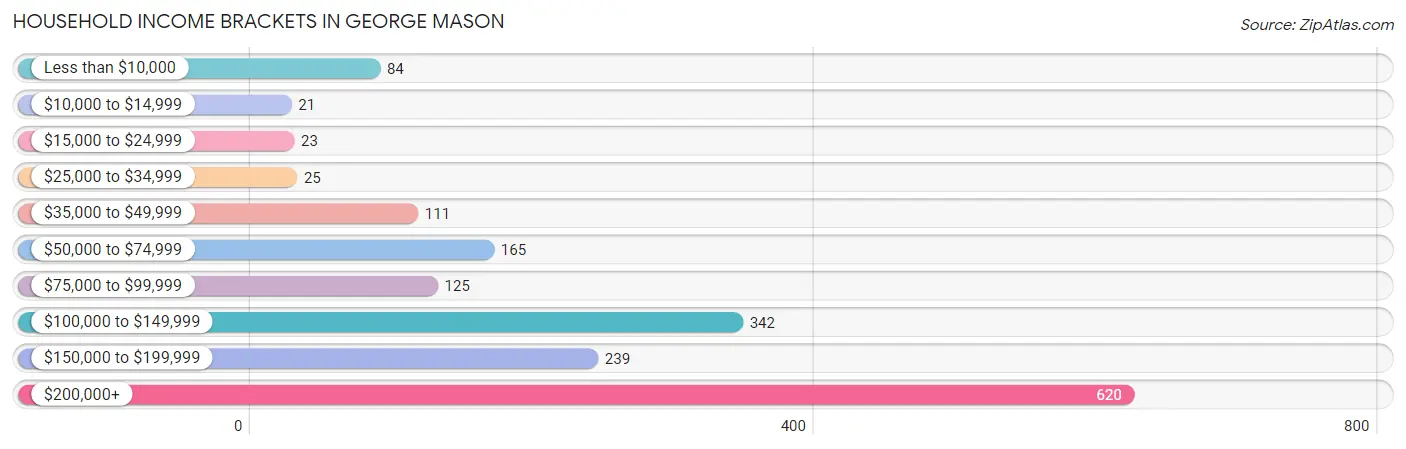
| Income Bracket | # Households | % Households |
| Less than $10,000 | 84 | 4.8% |
| $10,000 to $14,999 | 21 | 1.2% |
| $15,000 to $24,999 | 23 | 1.3% |
| $25,000 to $34,999 | 25 | 1.4% |
| $35,000 to $49,999 | 111 | 6.3% |
| $50,000 to $74,999 | 165 | 9.4% |
| $75,000 to $99,999 | 125 | 7.1% |
| $100,000 to $149,999 | 342 | 19.5% |
| $150,000 to $199,999 | 239 | 13.6% |
| $200,000+ | 620 | 35.3% |
Household Income by Householder Age in George Mason
The median household income in George Mason is $146,985, with the highest median household income of $181,667 found in the 45 to 64 years age bracket for the primary householder. A total of 746 households (42.5%) fall into this category. Meanwhile, the 15 to 24 years age bracket for the primary householder has the lowest median household income of $48,319, with 49 households (2.8%) in this group.
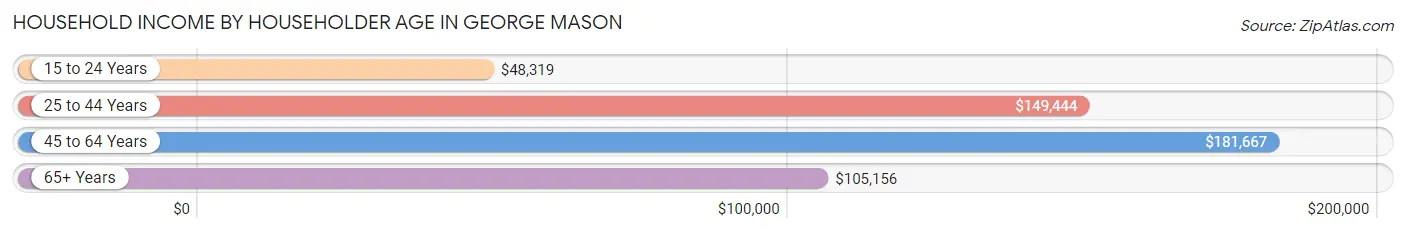
| Income Bracket | # Households | Median Income |
| 15 to 24 Years | 49 (2.8%) | $48,319 |
| 25 to 44 Years | 602 (34.3%) | $149,444 |
| 45 to 64 Years | 746 (42.5%) | $181,667 |
| 65+ Years | 358 (20.4%) | $105,156 |
| Total | 1,755 (100.0%) | $146,985 |
Poverty in George Mason
Income Below Poverty by Sex and Age in George Mason
With 4.2% poverty level for males and 6.3% for females among the residents of George Mason, 12 to 14 year old males and 5 year old females are the most vulnerable to poverty, with 16 males (19.3%) and 15 females (51.7%) in their respective age groups living below the poverty level.
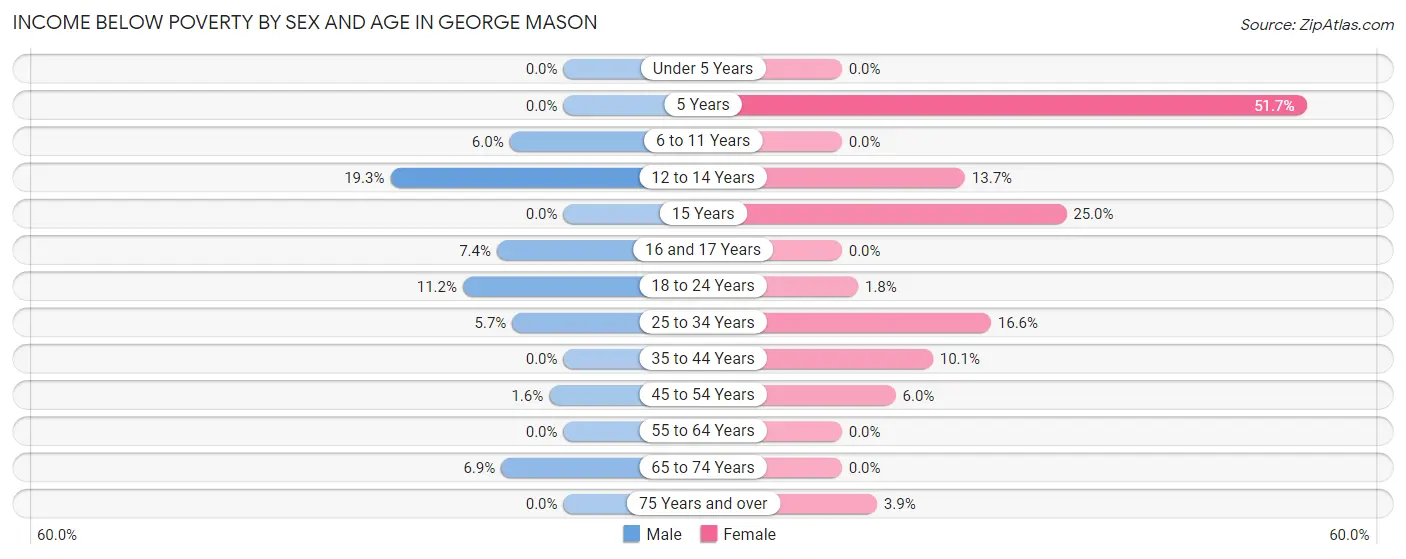
| Age Bracket | Male | Female |
| Under 5 Years | 0 (0.0%) | 0 (0.0%) |
| 5 Years | 0 (0.0%) | 15 (51.7%) |
| 6 to 11 Years | 15 (6.0%) | 0 (0.0%) |
| 12 to 14 Years | 16 (19.3%) | 24 (13.7%) |
| 15 Years | 0 (0.0%) | 4 (25.0%) |
| 16 and 17 Years | 4 (7.4%) | 0 (0.0%) |
| 18 to 24 Years | 40 (11.2%) | 3 (1.8%) |
| 25 to 34 Years | 13 (5.7%) | 42 (16.6%) |
| 35 to 44 Years | 0 (0.0%) | 47 (10.1%) |
| 45 to 54 Years | 6 (1.6%) | 26 (6.0%) |
| 55 to 64 Years | 0 (0.0%) | 0 (0.0%) |
| 65 to 74 Years | 17 (6.9%) | 0 (0.0%) |
| 75 Years and over | 0 (0.0%) | 5 (3.9%) |
| Total | 111 (4.2%) | 166 (6.3%) |
Income Above Poverty by Sex and Age in George Mason
According to the poverty statistics in George Mason, males aged under 5 years and females aged under 5 years are the age groups that are most secure financially, with 100.0% of males and 100.0% of females in these age groups living above the poverty line.
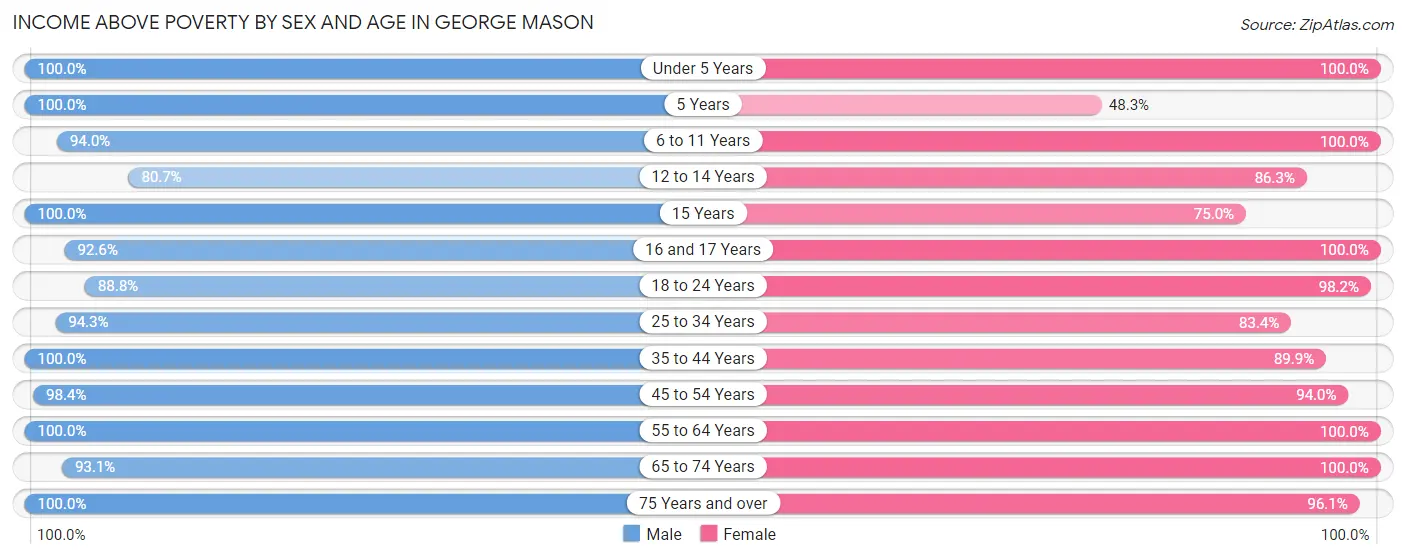
| Age Bracket | Male | Female |
| Under 5 Years | 142 (100.0%) | 144 (100.0%) |
| 5 Years | 17 (100.0%) | 14 (48.3%) |
| 6 to 11 Years | 235 (94.0%) | 250 (100.0%) |
| 12 to 14 Years | 67 (80.7%) | 151 (86.3%) |
| 15 Years | 50 (100.0%) | 12 (75.0%) |
| 16 and 17 Years | 50 (92.6%) | 62 (100.0%) |
| 18 to 24 Years | 317 (88.8%) | 163 (98.2%) |
| 25 to 34 Years | 215 (94.3%) | 211 (83.4%) |
| 35 to 44 Years | 466 (100.0%) | 417 (89.9%) |
| 45 to 54 Years | 371 (98.4%) | 408 (94.0%) |
| 55 to 64 Years | 296 (100.0%) | 284 (100.0%) |
| 65 to 74 Years | 228 (93.1%) | 224 (100.0%) |
| 75 Years and over | 83 (100.0%) | 123 (96.1%) |
| Total | 2,537 (95.8%) | 2,463 (93.7%) |
Income Below Poverty Among Married-Couple Families in George Mason
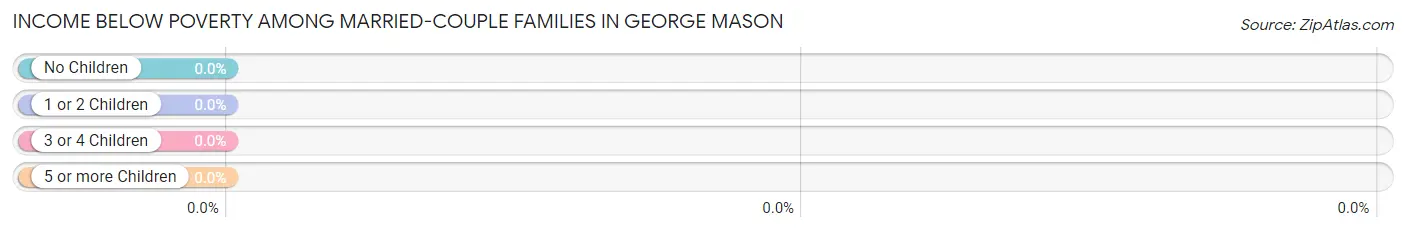
| Children | Above Poverty | Below Poverty |
| No Children | 507 (100.0%) | 0 (0.0%) |
| 1 or 2 Children | 599 (100.0%) | 0 (0.0%) |
| 3 or 4 Children | 78 (100.0%) | 0 (0.0%) |
| 5 or more Children | 13 (100.0%) | 0 (0.0%) |
| Total | 1,197 (100.0%) | 0 (0.0%) |
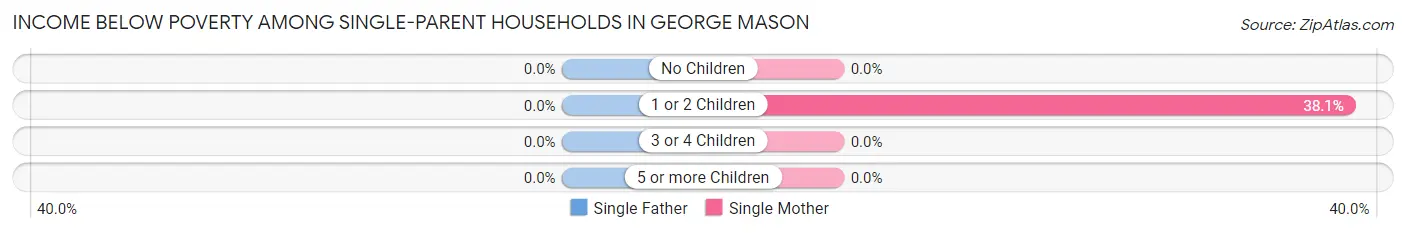
Income Below Poverty Among Single-Parent Households in George Mason
| Children | Single Father | Single Mother |
| No Children | 0 (0.0%) | 0 (0.0%) |
| 1 or 2 Children | 0 (0.0%) | 37 (38.1%) |
| 3 or 4 Children | 0 (0.0%) | 0 (0.0%) |
| 5 or more Children | 0 (0.0%) | 0 (0.0%) |
| Total | 0 (0.0%) | 37 (22.7%) |
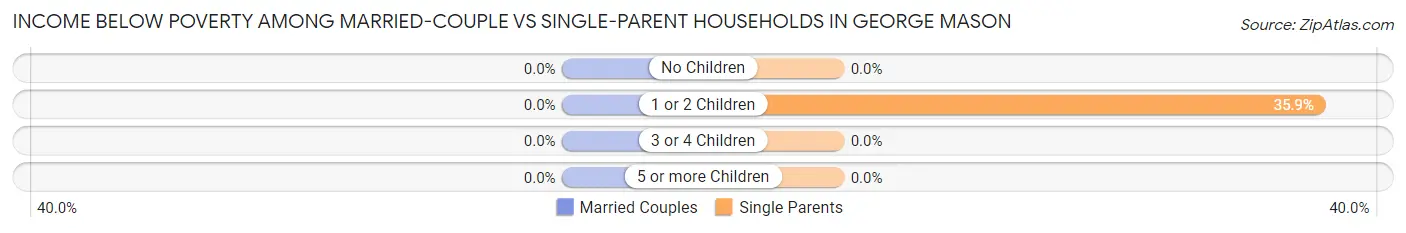
Income Below Poverty Among Married-Couple vs Single-Parent Households in George Mason
| Children | Married-Couple Families | Single-Parent Households |
| No Children | 0 (0.0%) | 0 (0.0%) |
| 1 or 2 Children | 0 (0.0%) | 37 (35.9%) |
| 3 or 4 Children | 0 (0.0%) | 0 (0.0%) |
| 5 or more Children | 0 (0.0%) | 0 (0.0%) |
| Total | 0 (0.0%) | 37 (18.6%) |
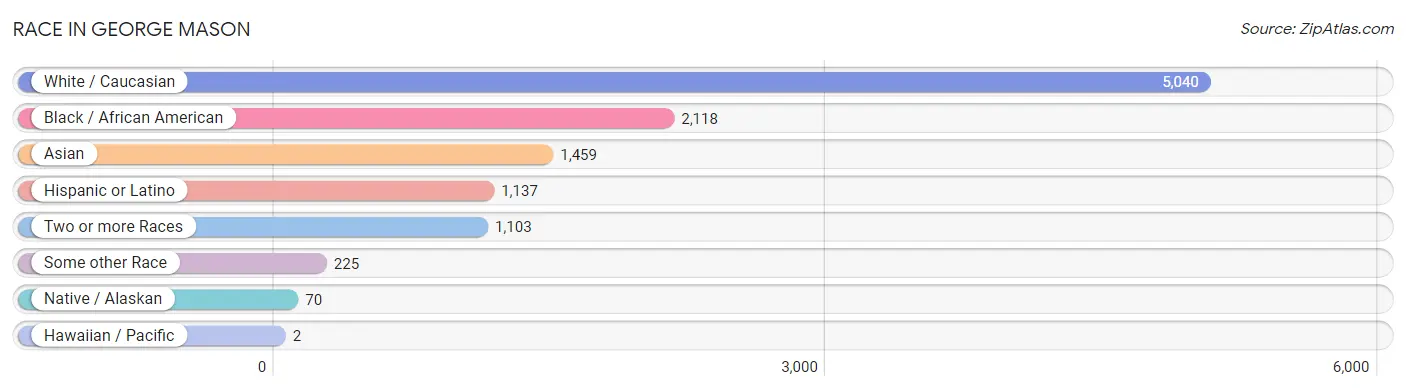
Race in George Mason
The most populous races in George Mason are White / Caucasian (5,040 | 50.3%), Black / African American (2,118 | 21.1%), and Asian (1,459 | 14.6%).
| Race | # Population | % Population |
| Asian | 1,459 | 14.6% |
| Black / African American | 2,118 | 21.1% |
| Hawaiian / Pacific | 2 | 0.0% |
| Hispanic or Latino | 1,137 | 11.4% |
| Native / Alaskan | 70 | 0.7% |
| White / Caucasian | 5,040 | 50.3% |
| Two or more Races | 1,103 | 11.0% |
| Some other Race | 225 | 2.2% |
| Total | 10,017 | 100.0% |
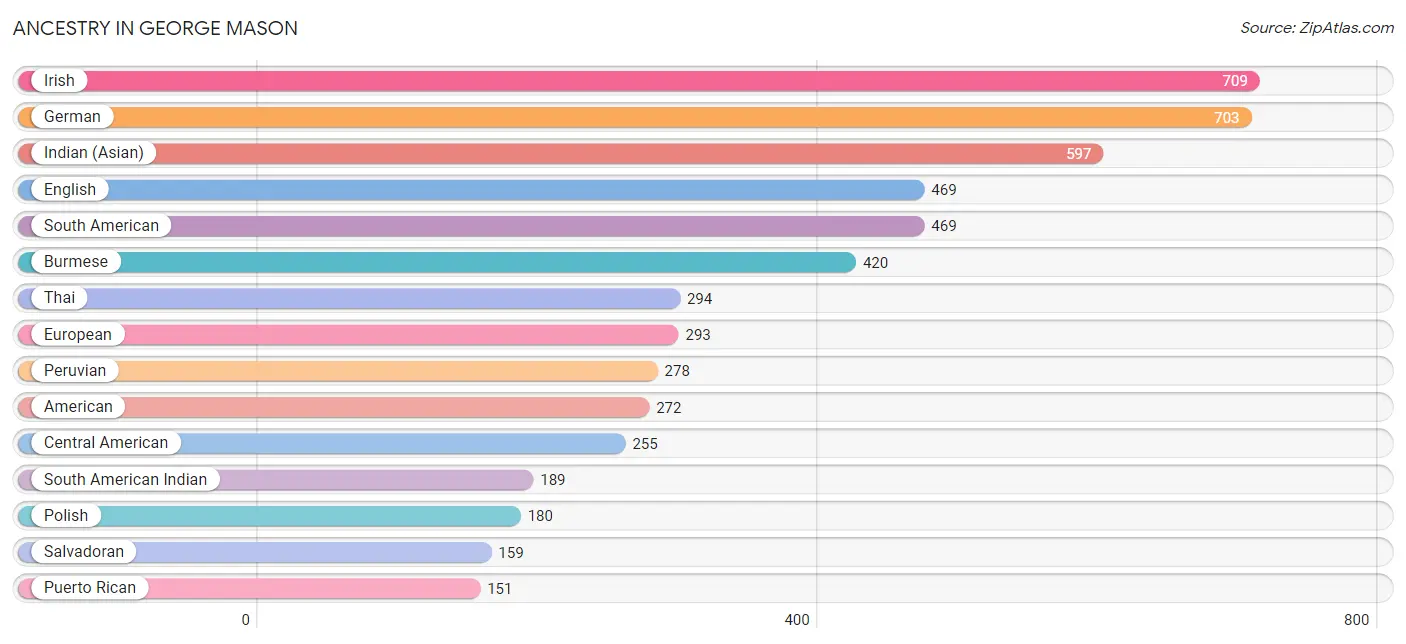
Ancestry in George Mason
The most populous ancestries reported in George Mason are Irish (709 | 7.1%), German (703 | 7.0%), Indian (Asian) (597 | 6.0%), English (469 | 4.7%), and South American (469 | 4.7%), together accounting for 29.4% of all George Mason residents.
| Ancestry | # Population | % Population |
| Afghan | 122 | 1.2% |
| African | 34 | 0.3% |
| American | 272 | 2.7% |
| Arab | 105 | 1.1% |
| Argentinean | 4 | 0.0% |
| Austrian | 25 | 0.3% |
| Bhutanese | 105 | 1.1% |
| Bolivian | 144 | 1.4% |
| British | 63 | 0.6% |
| Burmese | 420 | 4.2% |
| Canadian | 26 | 0.3% |
| Cape Verdean | 13 | 0.1% |
| Central American | 255 | 2.5% |
| Central American Indian | 20 | 0.2% |
| Chilean | 15 | 0.2% |
| Colombian | 9 | 0.1% |
| Croatian | 8 | 0.1% |
| Cuban | 5 | 0.1% |
| Czech | 27 | 0.3% |
| Czechoslovakian | 28 | 0.3% |
| Dominican | 11 | 0.1% |
| Dutch | 14 | 0.1% |
| Eastern European | 30 | 0.3% |
| Egyptian | 65 | 0.6% |
| English | 469 | 4.7% |
| Ethiopian | 46 | 0.5% |
| European | 293 | 2.9% |
| Filipino | 66 | 0.7% |
| Finnish | 4 | 0.0% |
| French | 74 | 0.7% |
| German | 703 | 7.0% |
| Ghanaian | 1 | 0.0% |
| Greek | 72 | 0.7% |
| Guatemalan | 32 | 0.3% |
| Honduran | 8 | 0.1% |
| Hungarian | 4 | 0.0% |
| Icelander | 4 | 0.0% |
| Indian (Asian) | 597 | 6.0% |
| Iranian | 27 | 0.3% |
| Irish | 709 | 7.1% |
| Italian | 143 | 1.4% |
| Jamaican | 6 | 0.1% |
| Japanese | 24 | 0.2% |
| Korean | 149 | 1.5% |
| Lebanese | 24 | 0.2% |
| Liberian | 12 | 0.1% |
| Mexican | 121 | 1.2% |
| Mexican American Indian | 10 | 0.1% |
| Native Hawaiian | 4 | 0.0% |
| Nicaraguan | 56 | 0.6% |
| Northern European | 26 | 0.3% |
| Norwegian | 23 | 0.2% |
| Peruvian | 278 | 2.8% |
| Polish | 180 | 1.8% |
| Portuguese | 19 | 0.2% |
| Puerto Rican | 151 | 1.5% |
| Romanian | 4 | 0.0% |
| Russian | 37 | 0.4% |
| Salvadoran | 159 | 1.6% |
| Scotch-Irish | 48 | 0.5% |
| Scottish | 67 | 0.7% |
| Senegalese | 11 | 0.1% |
| South American | 469 | 4.7% |
| South American Indian | 189 | 1.9% |
| Spaniard | 20 | 0.2% |
| Spanish | 20 | 0.2% |
| Sri Lankan | 124 | 1.2% |
| Subsaharan African | 111 | 1.1% |
| Swedish | 42 | 0.4% |
| Syrian | 5 | 0.1% |
| Thai | 294 | 2.9% |
| Ukrainian | 22 | 0.2% |
| Uruguayan | 19 | 0.2% |
| Welsh | 14 | 0.1% |
| West Indian | 7 | 0.1% | View All 75 Rows |
Immigrants in George Mason
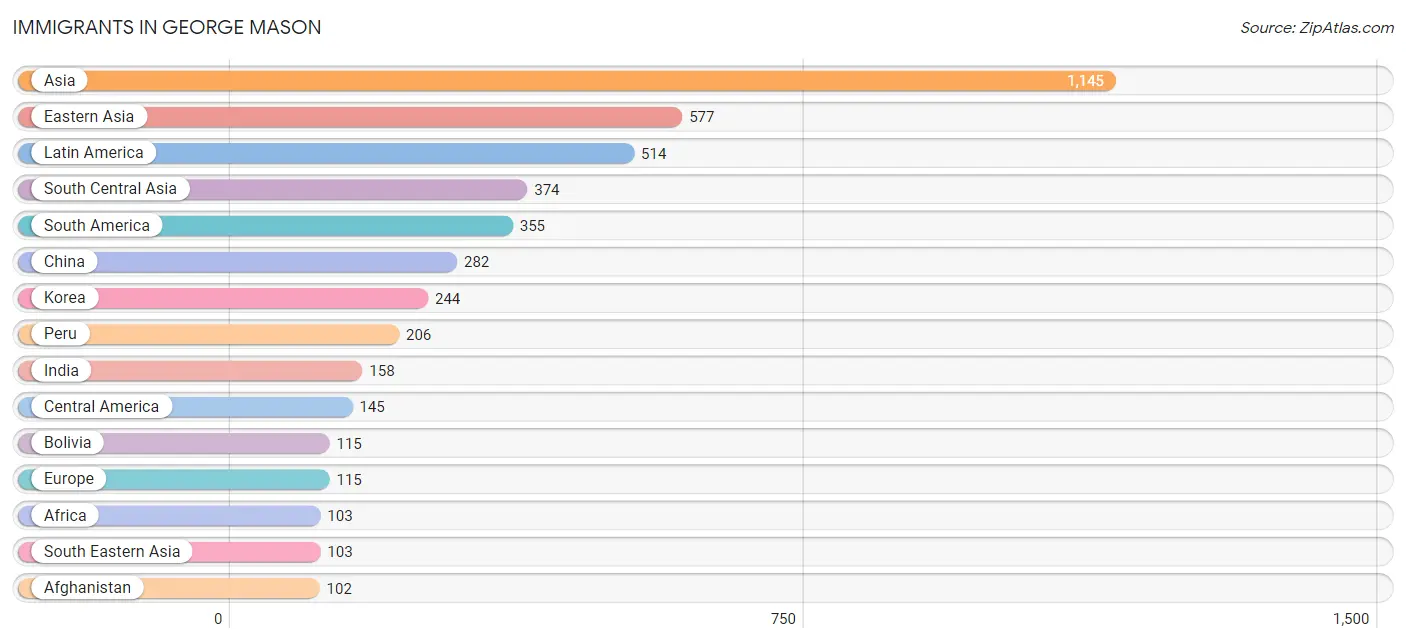
The most numerous immigrant groups reported in George Mason came from Asia (1,145 | 11.4%), Eastern Asia (577 | 5.8%), Latin America (514 | 5.1%), South Central Asia (374 | 3.7%), and South America (355 | 3.5%), together accounting for 29.6% of all George Mason residents.
| Immigration Origin | # Population | % Population |
| Afghanistan | 102 | 1.0% |
| Africa | 103 | 1.0% |
| Asia | 1,145 | 11.4% |
| Bolivia | 115 | 1.1% |
| Cambodia | 7 | 0.1% |
| Canada | 41 | 0.4% |
| Caribbean | 14 | 0.1% |
| Central America | 145 | 1.5% |
| Chile | 15 | 0.2% |
| China | 282 | 2.8% |
| Dominica | 14 | 0.1% |
| Eastern Africa | 32 | 0.3% |
| Eastern Asia | 577 | 5.8% |
| Eastern Europe | 12 | 0.1% |
| Egypt | 54 | 0.5% |
| El Salvador | 74 | 0.7% |
| Ethiopia | 32 | 0.3% |
| Europe | 115 | 1.1% |
| France | 16 | 0.2% |
| Germany | 41 | 0.4% |
| Ghana | 1 | 0.0% |
| Greece | 14 | 0.1% |
| Guatemala | 10 | 0.1% |
| Hong Kong | 28 | 0.3% |
| India | 158 | 1.6% |
| Iran | 10 | 0.1% |
| Iraq | 32 | 0.3% |
| Japan | 51 | 0.5% |
| Korea | 244 | 2.4% |
| Kuwait | 3 | 0.0% |
| Latin America | 514 | 5.1% |
| Lebanon | 24 | 0.2% |
| Mexico | 44 | 0.4% |
| Nepal | 76 | 0.8% |
| Nicaragua | 17 | 0.2% |
| Northern Africa | 54 | 0.5% |
| Northern Europe | 32 | 0.3% |
| Pakistan | 28 | 0.3% |
| Peru | 206 | 2.1% |
| Philippines | 48 | 0.5% |
| Russia | 8 | 0.1% |
| Saudi Arabia | 16 | 0.2% |
| Senegal | 12 | 0.1% |
| Singapore | 5 | 0.1% |
| South Africa | 4 | 0.0% |
| South America | 355 | 3.5% |
| South Central Asia | 374 | 3.7% |
| South Eastern Asia | 103 | 1.0% |
| Southern Europe | 14 | 0.1% |
| Taiwan | 65 | 0.6% |
| Ukraine | 4 | 0.0% |
| Uruguay | 19 | 0.2% |
| Vietnam | 43 | 0.4% |
| Western Africa | 13 | 0.1% |
| Western Asia | 91 | 0.9% |
| Western Europe | 57 | 0.6% | View All 56 Rows |
Sex and Age in George Mason
Sex and Age in George Mason
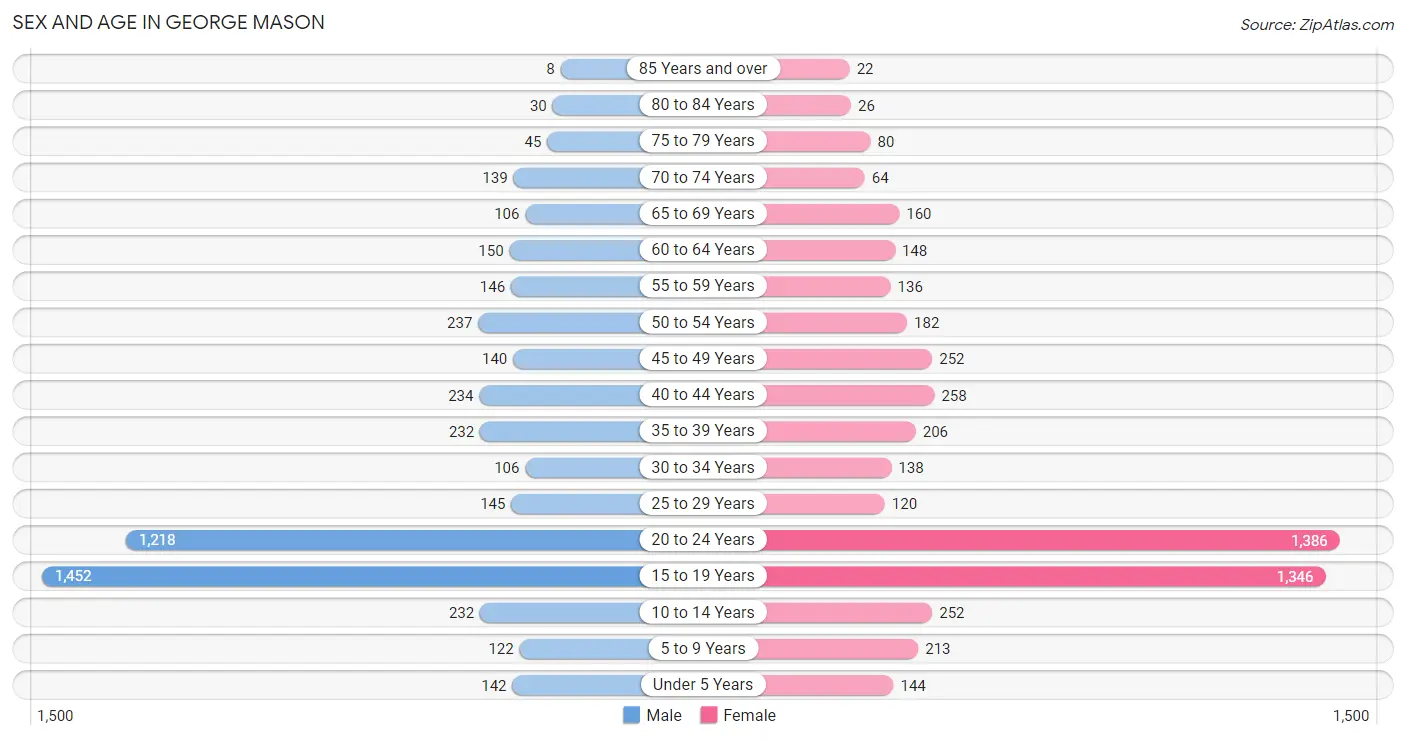
The most populous age groups in George Mason are 15 to 19 Years (1,452 | 29.7%) for men and 20 to 24 Years (1,386 | 27.0%) for women.
| Age Bracket | Male | Female |
| Under 5 Years | 142 (2.9%) | 144 (2.8%) |
| 5 to 9 Years | 122 (2.5%) | 213 (4.2%) |
| 10 to 14 Years | 232 (4.8%) | 252 (4.9%) |
| 15 to 19 Years | 1,452 (29.7%) | 1,346 (26.2%) |
| 20 to 24 Years | 1,218 (24.9%) | 1,386 (27.0%) |
| 25 to 29 Years | 145 (3.0%) | 120 (2.3%) |
| 30 to 34 Years | 106 (2.2%) | 138 (2.7%) |
| 35 to 39 Years | 232 (4.8%) | 206 (4.0%) |
| 40 to 44 Years | 234 (4.8%) | 258 (5.0%) |
| 45 to 49 Years | 140 (2.9%) | 252 (4.9%) |
| 50 to 54 Years | 237 (4.9%) | 182 (3.5%) |
| 55 to 59 Years | 146 (3.0%) | 136 (2.6%) |
| 60 to 64 Years | 150 (3.1%) | 148 (2.9%) |
| 65 to 69 Years | 106 (2.2%) | 160 (3.1%) |
| 70 to 74 Years | 139 (2.9%) | 64 (1.3%) |
| 75 to 79 Years | 45 (0.9%) | 80 (1.6%) |
| 80 to 84 Years | 30 (0.6%) | 26 (0.5%) |
| 85 Years and over | 8 (0.2%) | 22 (0.4%) |
| Total | 4,884 (100.0%) | 5,133 (100.0%) |
Families and Households in George Mason
Median Family Size in George Mason
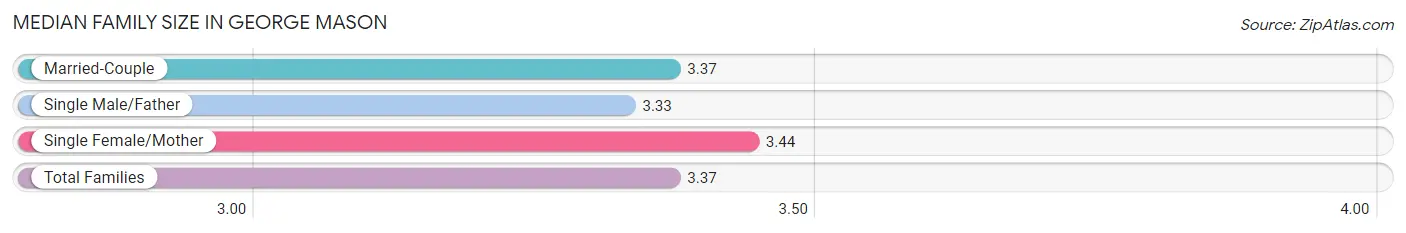
The median family size in George Mason is 3.37 persons per family, with single female/mother families (163 | 11.7%) accounting for the largest median family size of 3.44 persons per family. On the other hand, single male/father families (36 | 2.6%) represent the smallest median family size with 3.33 persons per family.
| Family Type | # Families | Family Size |
| Married-Couple | 1,197 (85.7%) | 3.37 |
| Single Male/Father | 36 (2.6%) | 3.33 |
| Single Female/Mother | 163 (11.7%) | 3.44 |
| Total Families | 1,396 (100.0%) | 3.37 |
Median Household Size in George Mason
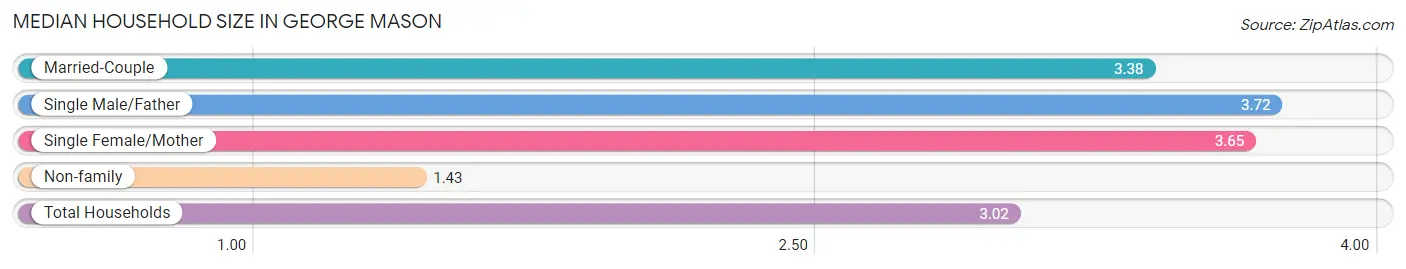
The median household size in George Mason is 3.02 persons per household, with single male/father households (36 | 2.1%) accounting for the largest median household size of 3.72 persons per household. non-family households (359 | 20.5%) represent the smallest median household size with 1.43 persons per household.
| Household Type | # Households | Household Size |
| Married-Couple | 1,197 (68.2%) | 3.38 |
| Single Male/Father | 36 (2.1%) | 3.72 |
| Single Female/Mother | 163 (9.3%) | 3.65 |
| Non-family | 359 (20.5%) | 1.43 |
| Total Households | 1,755 (100.0%) | 3.02 |
Household Size by Marriage Status in George Mason
Out of a total of 1,755 households in George Mason, 1,396 (79.5%) are family households, while 359 (20.5%) are nonfamily households. The most numerous type of family households are 2-person households, comprising 418, and the most common type of nonfamily households are 1-person households, comprising 262.
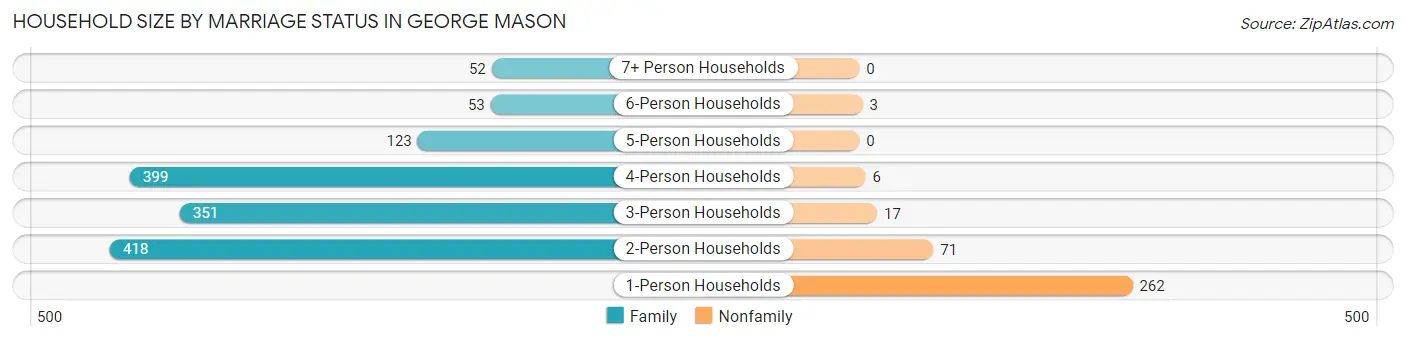
| Household Size | Family Households | Nonfamily Households |
| 1-Person Households | - | 262 (14.9%) |
| 2-Person Households | 418 (23.8%) | 71 (4.1%) |
| 3-Person Households | 351 (20.0%) | 17 (1.0%) |
| 4-Person Households | 399 (22.7%) | 6 (0.3%) |
| 5-Person Households | 123 (7.0%) | 0 (0.0%) |
| 6-Person Households | 53 (3.0%) | 3 (0.2%) |
| 7+ Person Households | 52 (3.0%) | 0 (0.0%) |
| Total | 1,396 (79.5%) | 359 (20.5%) |
Female Fertility in George Mason
Fertility by Age in George Mason
Average fertility rate in George Mason is 11.0 births per 1,000 women. Women in the age bracket of 35 to 50 years have the highest fertility rate with 36.0 births per 1,000 women. Women in the age bracket of 35 to 50 years acount for 68.3% of all women with births.
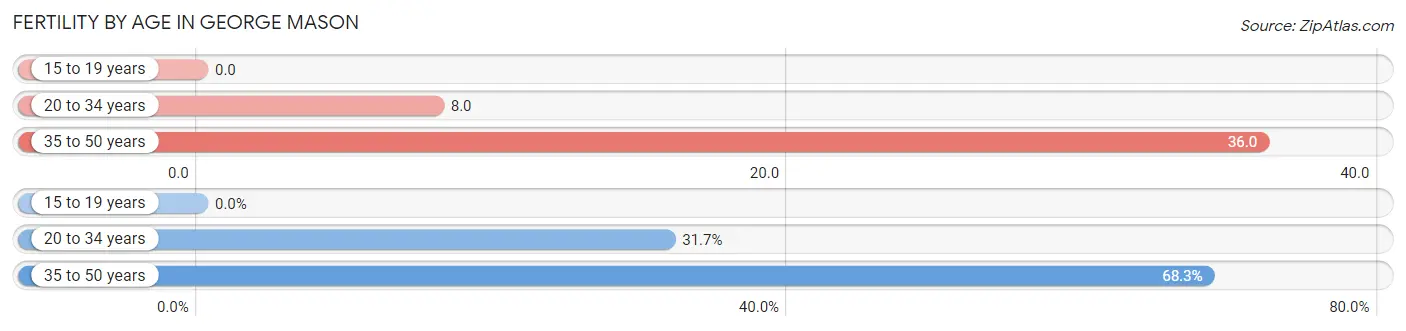
| Age Bracket | Women with Births | Births / 1,000 Women |
| 15 to 19 years | 0 (0.0%) | 0.0 |
| 20 to 34 years | 13 (31.7%) | 8.0 |
| 35 to 50 years | 28 (68.3%) | 36.0 |
| Total | 41 (100.0%) | 11.0 |
Fertility by Age by Marriage Status in George Mason
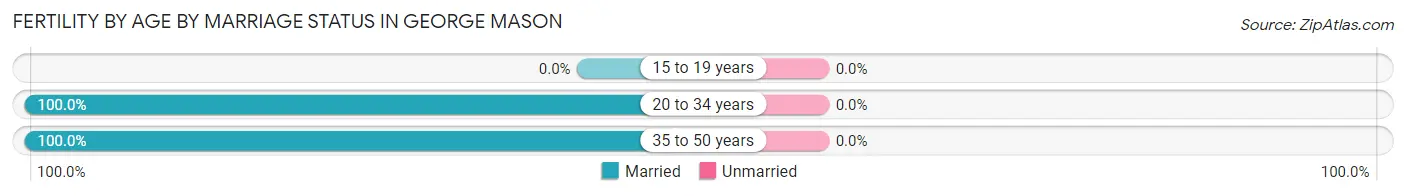
| Age Bracket | Married | Unmarried |
| 15 to 19 years | 0 (0.0%) | 0 (0.0%) |
| 20 to 34 years | 13 (100.0%) | 0 (0.0%) |
| 35 to 50 years | 28 (100.0%) | 0 (0.0%) |
| Total | 41 (100.0%) | 0 (0.0%) |
Fertility by Education in George Mason
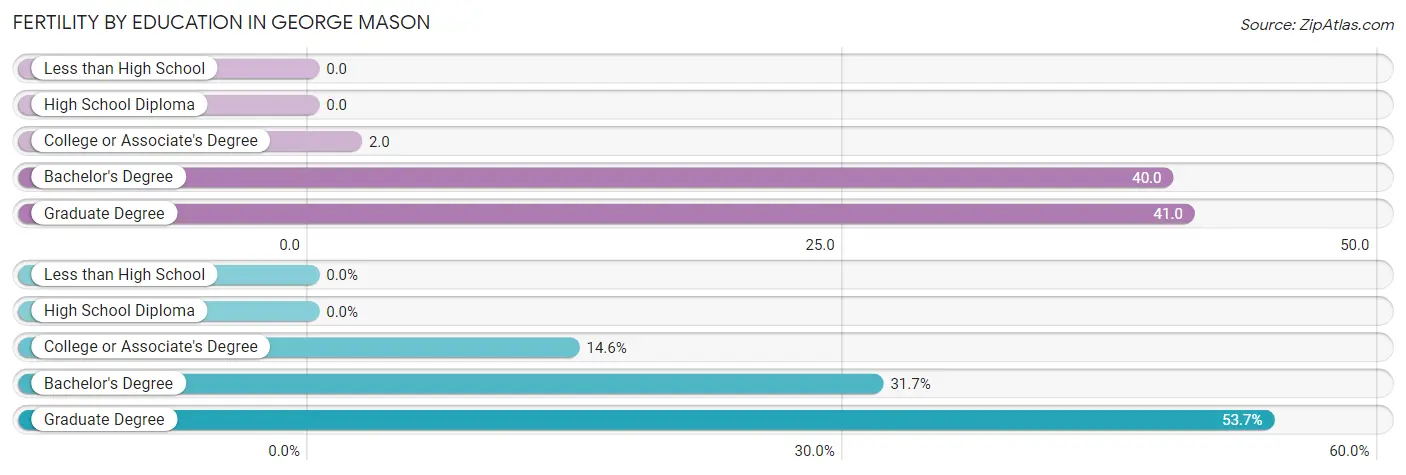
| Educational Attainment | Women with Births | Births / 1,000 Women |
| Less than High School | 0 (0.0%) | 0.0 |
| High School Diploma | 0 (0.0%) | 0.0 |
| College or Associate's Degree | 6 (14.6%) | 2.0 |
| Bachelor's Degree | 13 (31.7%) | 40.0 |
| Graduate Degree | 22 (53.7%) | 41.0 |
| Total | 41 (100.0%) | 11.0 |
Fertility by Education by Marriage Status in George Mason
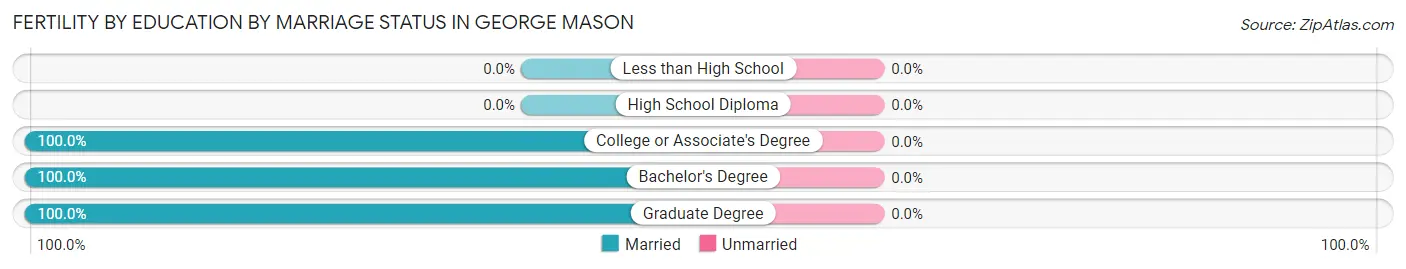
| Educational Attainment | Married | Unmarried |
| Less than High School | 0 (0.0%) | 0 (0.0%) |
| High School Diploma | 0 (0.0%) | 0 (0.0%) |
| College or Associate's Degree | 6 (100.0%) | 0 (0.0%) |
| Bachelor's Degree | 13 (100.0%) | 0 (0.0%) |
| Graduate Degree | 22 (100.0%) | 0 (0.0%) |
| Total | 41 (100.0%) | 0 (0.0%) |
Employment Characteristics in George Mason
Employment by Class of Employer in George Mason
Among the 4,122 employed individuals in George Mason, private company employees (2,303 | 55.9%), not-for-profit organizations (534 | 13.0%), and federal government employees (440 | 10.7%) make up the most common classes of employment.
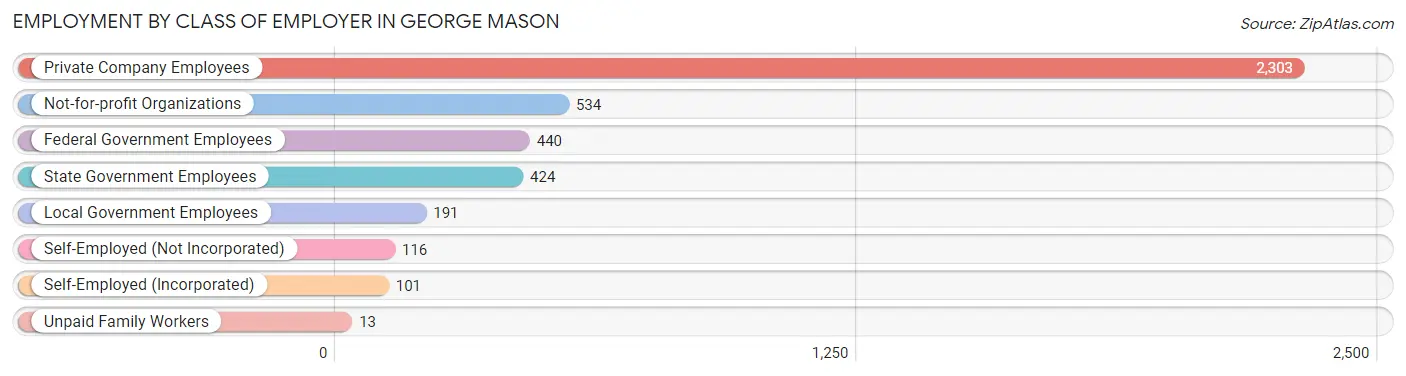
| Employer Class | # Employees | % Employees |
| Private Company Employees | 2,303 | 55.9% |
| Self-Employed (Incorporated) | 101 | 2.5% |
| Self-Employed (Not Incorporated) | 116 | 2.8% |
| Not-for-profit Organizations | 534 | 13.0% |
| Local Government Employees | 191 | 4.6% |
| State Government Employees | 424 | 10.3% |
| Federal Government Employees | 440 | 10.7% |
| Unpaid Family Workers | 13 | 0.3% |
| Total | 4,122 | 100.0% |
Employment Status by Age in George Mason
According to the labor force statistics for George Mason, out of the total population over 16 years of age (8,846), 54.1% or 4,786 individuals are in the labor force, with 11.9% or 570 of them unemployed. The age group with the highest labor force participation rate is 35 to 44 years, with 91.0% or 846 individuals in the labor force. Within the labor force, the 16 to 19 years age range has the highest percentage of unemployed individuals, with 34.5% or 255 of them being unemployed.
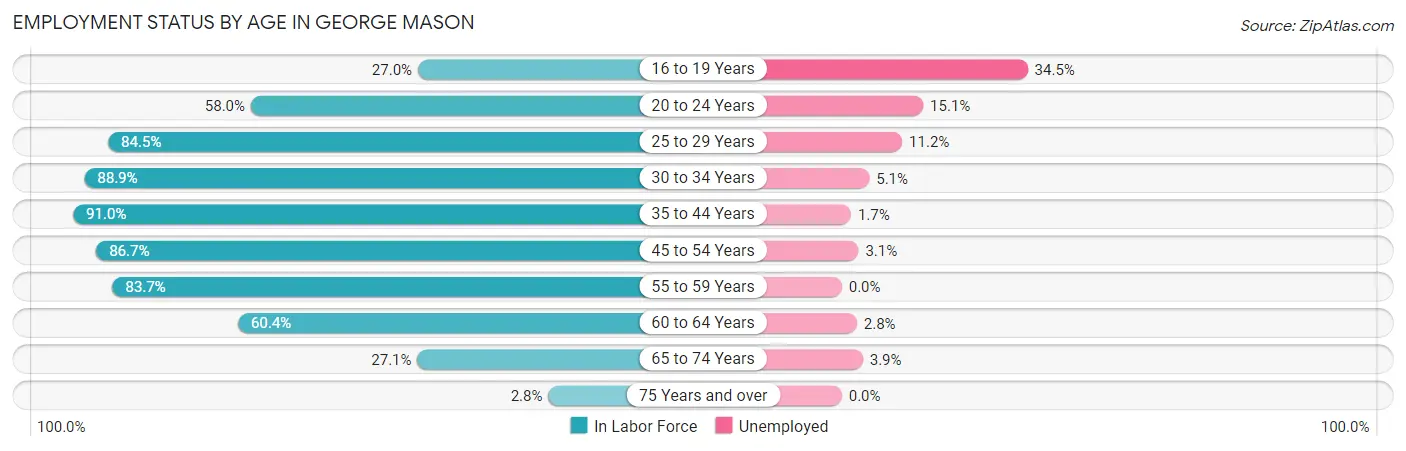
| Age Bracket | In Labor Force | Unemployed |
| 16 to 19 Years | 738 (27.0%) | 255 (34.5%) |
| 20 to 24 Years | 1,510 (58.0%) | 228 (15.1%) |
| 25 to 29 Years | 224 (84.5%) | 25 (11.2%) |
| 30 to 34 Years | 217 (88.9%) | 11 (5.1%) |
| 35 to 44 Years | 846 (91.0%) | 14 (1.7%) |
| 45 to 54 Years | 703 (86.7%) | 22 (3.1%) |
| 55 to 59 Years | 236 (83.7%) | 0 (0.0%) |
| 60 to 64 Years | 180 (60.4%) | 5 (2.8%) |
| 65 to 74 Years | 127 (27.1%) | 5 (3.9%) |
| 75 Years and over | 6 (2.8%) | 0 (0.0%) |
| Total | 4,786 (54.1%) | 570 (11.9%) |
Employment Status by Educational Attainment in George Mason
According to labor force statistics for George Mason, 85.0% of individuals (2,406) out of the total population between 25 and 64 years of age (2,830) are in the labor force, with 3.2% or 77 of them being unemployed. The group with the highest labor force participation rate are those with the educational attainment of bachelor's degree or higher, with 88.4% or 1,747 individuals in the labor force. Within the labor force, individuals with college / associate degree education have the highest percentage of unemployment, with 4.0% or 15 of them being unemployed.
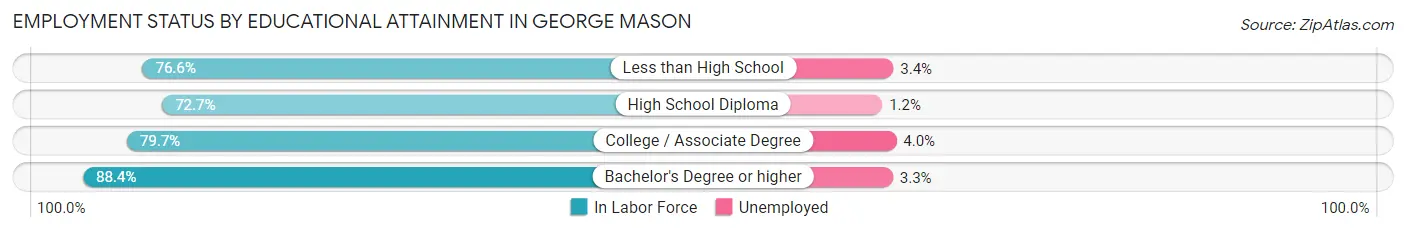
| Educational Attainment | In Labor Force | Unemployed |
| Less than High School | 118 (76.6%) | 5 (3.4%) |
| High School Diploma | 168 (72.7%) | 3 (1.2%) |
| College / Associate Degree | 374 (79.7%) | 19 (4.0%) |
| Bachelor's Degree or higher | 1,747 (88.4%) | 65 (3.3%) |
| Total | 2,406 (85.0%) | 91 (3.2%) |
Employment Occupations by Sex in George Mason
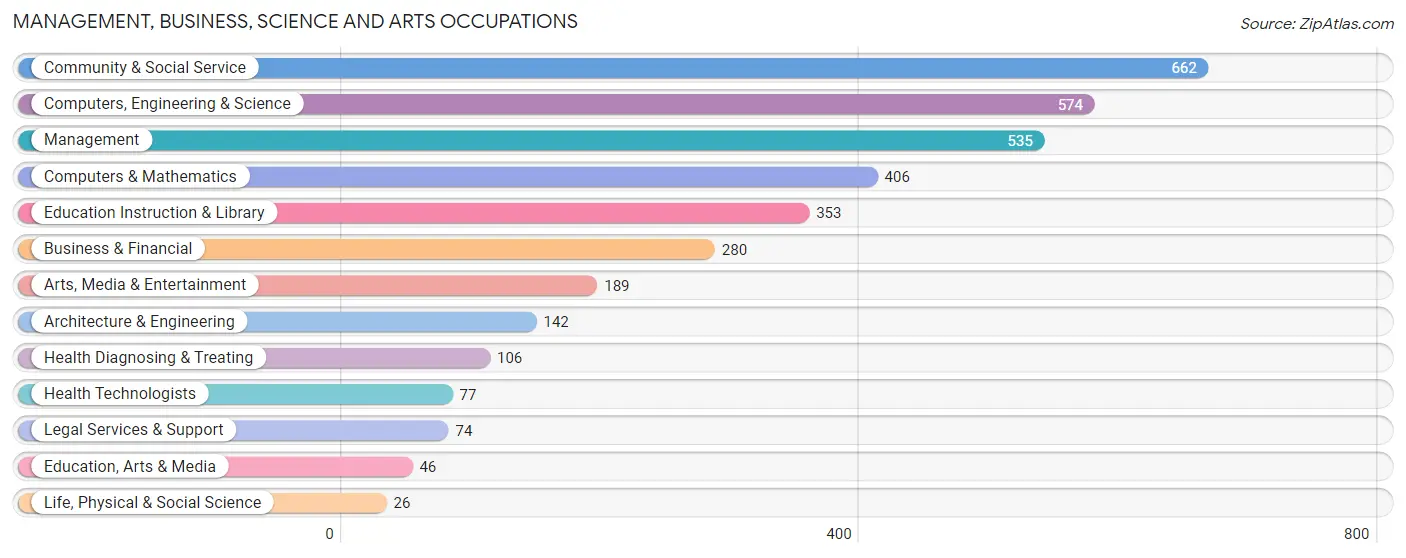
Management, Business, Science and Arts Occupations
The most common Management, Business, Science and Arts occupations in George Mason are Community & Social Service (662 | 15.8%), Computers, Engineering & Science (574 | 13.7%), Management (535 | 12.8%), Computers & Mathematics (406 | 9.7%), and Education Instruction & Library (353 | 8.4%).
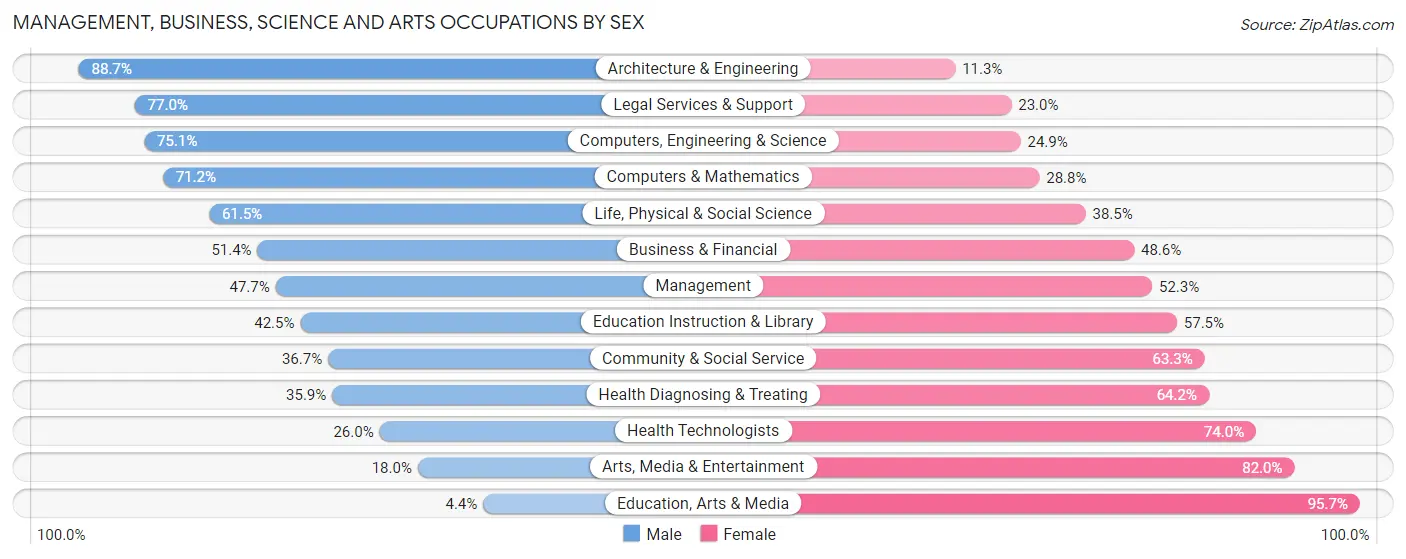
Management, Business, Science and Arts Occupations by Sex
Within the Management, Business, Science and Arts occupations in George Mason, the most male-oriented occupations are Architecture & Engineering (88.7%), Legal Services & Support (77.0%), and Computers, Engineering & Science (75.1%), while the most female-oriented occupations are Education, Arts & Media (95.7%), Arts, Media & Entertainment (82.0%), and Health Technologists (74.0%).
| Occupation | Male | Female |
| Management | 255 (47.7%) | 280 (52.3%) |
| Business & Financial | 144 (51.4%) | 136 (48.6%) |
| Computers, Engineering & Science | 431 (75.1%) | 143 (24.9%) |
| Computers & Mathematics | 289 (71.2%) | 117 (28.8%) |
| Architecture & Engineering | 126 (88.7%) | 16 (11.3%) |
| Life, Physical & Social Science | 16 (61.5%) | 10 (38.5%) |
| Community & Social Service | 243 (36.7%) | 419 (63.3%) |
| Education, Arts & Media | 2 (4.3%) | 44 (95.7%) |
| Legal Services & Support | 57 (77.0%) | 17 (23.0%) |
| Education Instruction & Library | 150 (42.5%) | 203 (57.5%) |
| Arts, Media & Entertainment | 34 (18.0%) | 155 (82.0%) |
| Health Diagnosing & Treating | 38 (35.8%) | 68 (64.1%) |
| Health Technologists | 20 (26.0%) | 57 (74.0%) |
| Total (Category) | 1,111 (51.5%) | 1,046 (48.5%) |
| Total (Overall) | 2,007 (47.9%) | 2,183 (52.1%) |
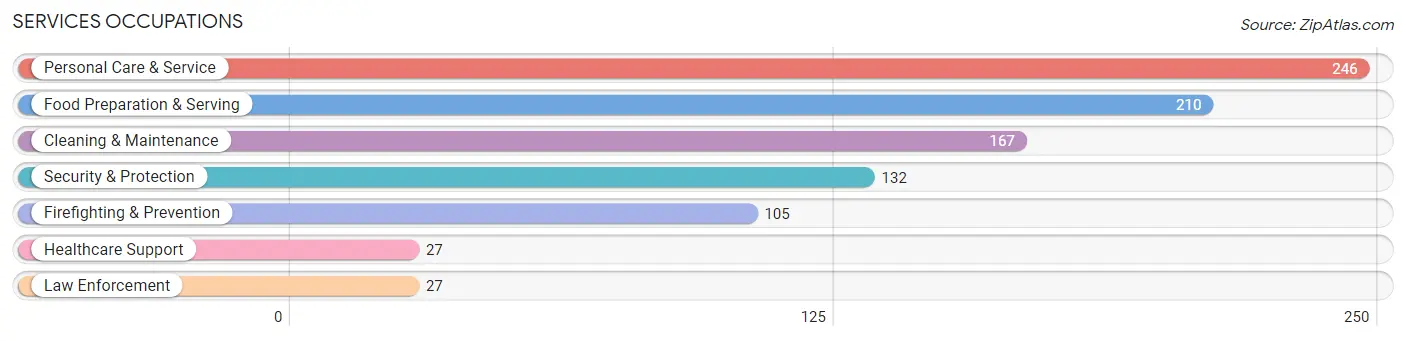
Services Occupations
The most common Services occupations in George Mason are Personal Care & Service (246 | 5.9%), Food Preparation & Serving (210 | 5.0%), Cleaning & Maintenance (167 | 4.0%), Security & Protection (132 | 3.2%), and Firefighting & Prevention (105 | 2.5%).
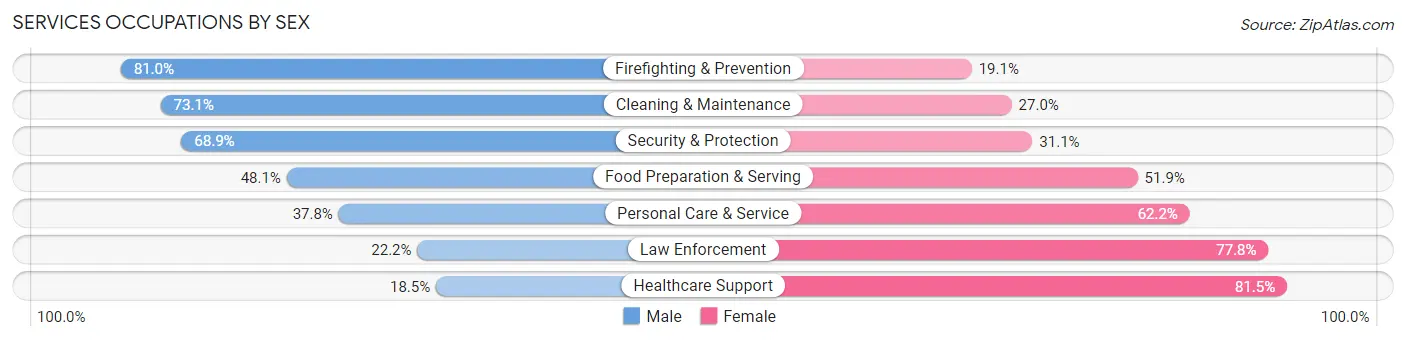
Services Occupations by Sex
Within the Services occupations in George Mason, the most male-oriented occupations are Firefighting & Prevention (80.9%), Cleaning & Maintenance (73.1%), and Security & Protection (68.9%), while the most female-oriented occupations are Healthcare Support (81.5%), Law Enforcement (77.8%), and Personal Care & Service (62.2%).
| Occupation | Male | Female |
| Healthcare Support | 5 (18.5%) | 22 (81.5%) |
| Security & Protection | 91 (68.9%) | 41 (31.1%) |
| Firefighting & Prevention | 85 (80.9%) | 20 (19.1%) |
| Law Enforcement | 6 (22.2%) | 21 (77.8%) |
| Food Preparation & Serving | 101 (48.1%) | 109 (51.9%) |
| Cleaning & Maintenance | 122 (73.1%) | 45 (27.0%) |
| Personal Care & Service | 93 (37.8%) | 153 (62.2%) |
| Total (Category) | 412 (52.7%) | 370 (47.3%) |
| Total (Overall) | 2,007 (47.9%) | 2,183 (52.1%) |
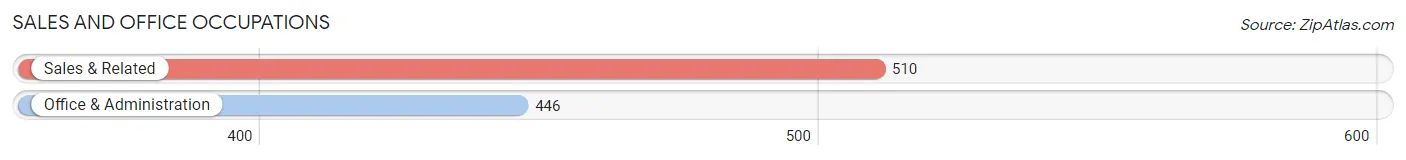
Sales and Office Occupations
The most common Sales and Office occupations in George Mason are Sales & Related (510 | 12.2%), and Office & Administration (446 | 10.6%).
Sales and Office Occupations by Sex
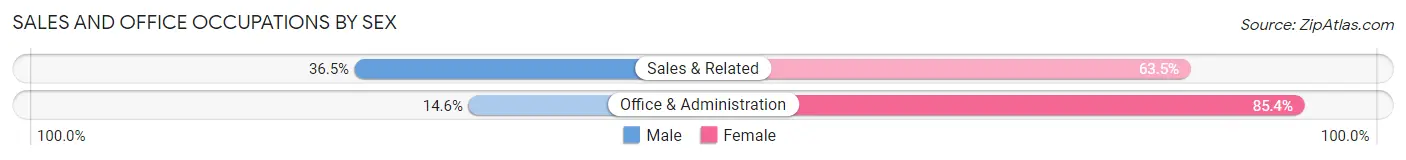
| Occupation | Male | Female |
| Sales & Related | 186 (36.5%) | 324 (63.5%) |
| Office & Administration | 65 (14.6%) | 381 (85.4%) |
| Total (Category) | 251 (26.3%) | 705 (73.7%) |
| Total (Overall) | 2,007 (47.9%) | 2,183 (52.1%) |
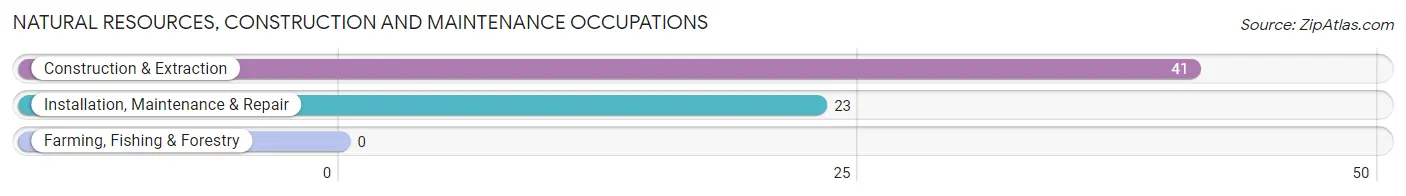
Natural Resources, Construction and Maintenance Occupations
The most common Natural Resources, Construction and Maintenance occupations in George Mason are Construction & Extraction (41 | 1.0%), and Installation, Maintenance & Repair (23 | 0.5%).
Natural Resources, Construction and Maintenance Occupations by Sex
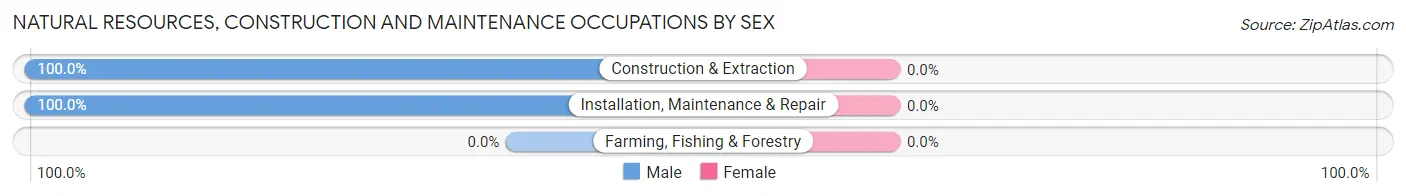
| Occupation | Male | Female |
| Farming, Fishing & Forestry | 0 (0.0%) | 0 (0.0%) |
| Construction & Extraction | 41 (100.0%) | 0 (0.0%) |
| Installation, Maintenance & Repair | 23 (100.0%) | 0 (0.0%) |
| Total (Category) | 64 (100.0%) | 0 (0.0%) |
| Total (Overall) | 2,007 (47.9%) | 2,183 (52.1%) |
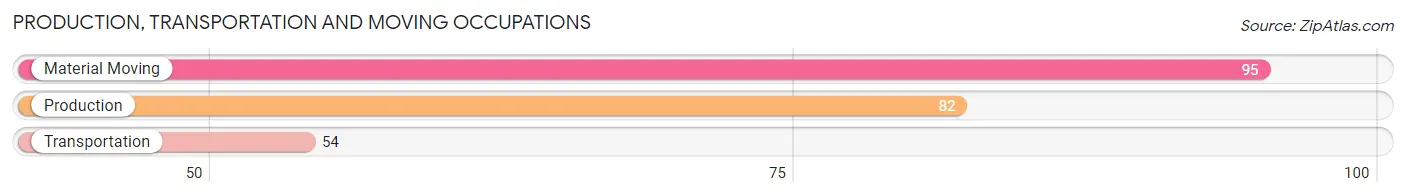
Production, Transportation and Moving Occupations
The most common Production, Transportation and Moving occupations in George Mason are Material Moving (95 | 2.3%), Production (82 | 2.0%), and Transportation (54 | 1.3%).
Production, Transportation and Moving Occupations by Sex
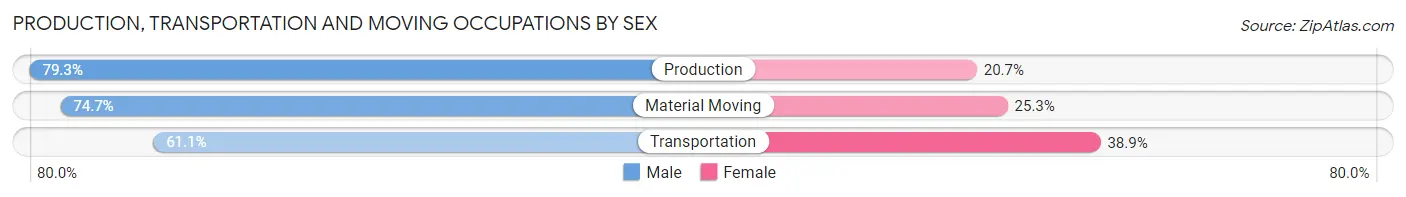
| Occupation | Male | Female |
| Production | 65 (79.3%) | 17 (20.7%) |
| Transportation | 33 (61.1%) | 21 (38.9%) |
| Material Moving | 71 (74.7%) | 24 (25.3%) |
| Total (Category) | 169 (73.2%) | 62 (26.8%) |
| Total (Overall) | 2,007 (47.9%) | 2,183 (52.1%) |
Employment Industries by Sex in George Mason
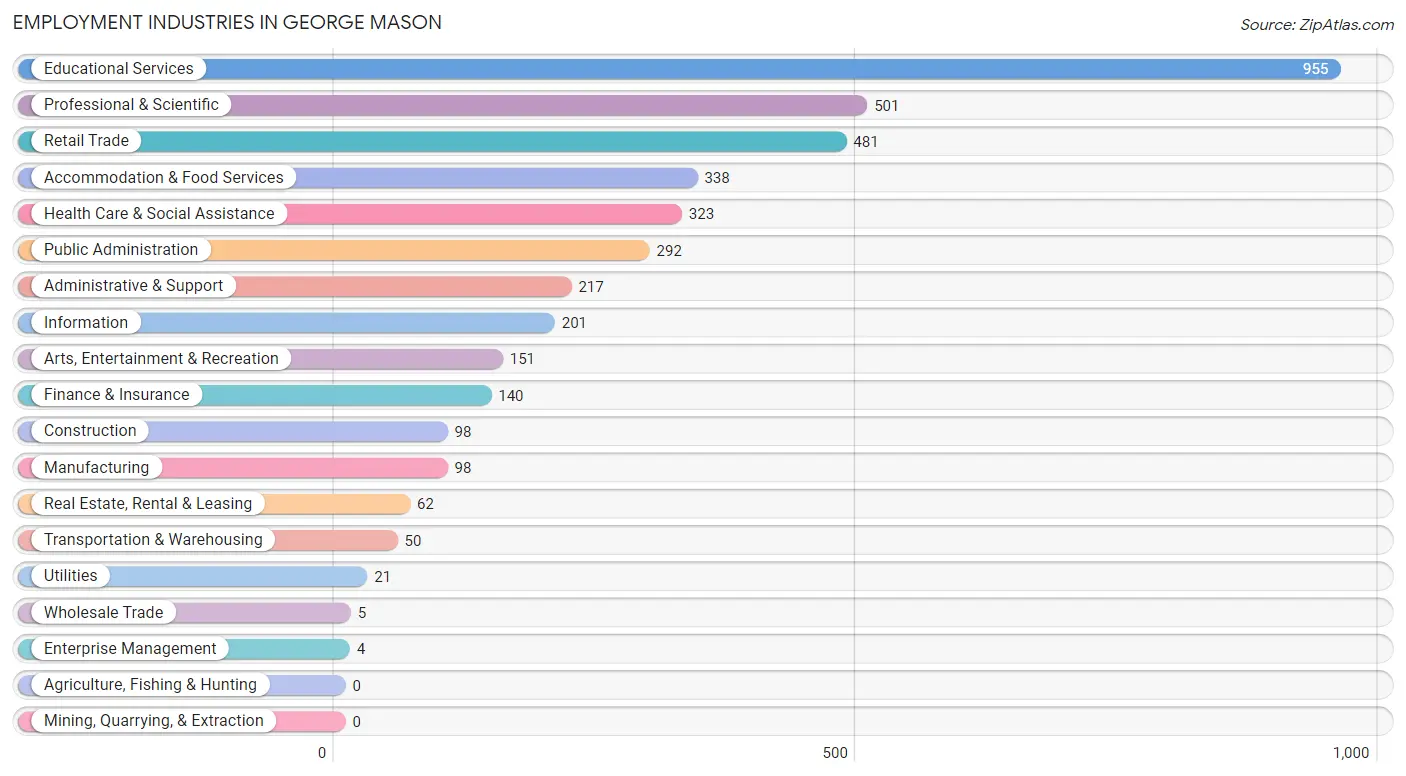
Employment Industries in George Mason
The major employment industries in George Mason include Educational Services (955 | 22.8%), Professional & Scientific (501 | 12.0%), Retail Trade (481 | 11.5%), Accommodation & Food Services (338 | 8.1%), and Health Care & Social Assistance (323 | 7.7%).
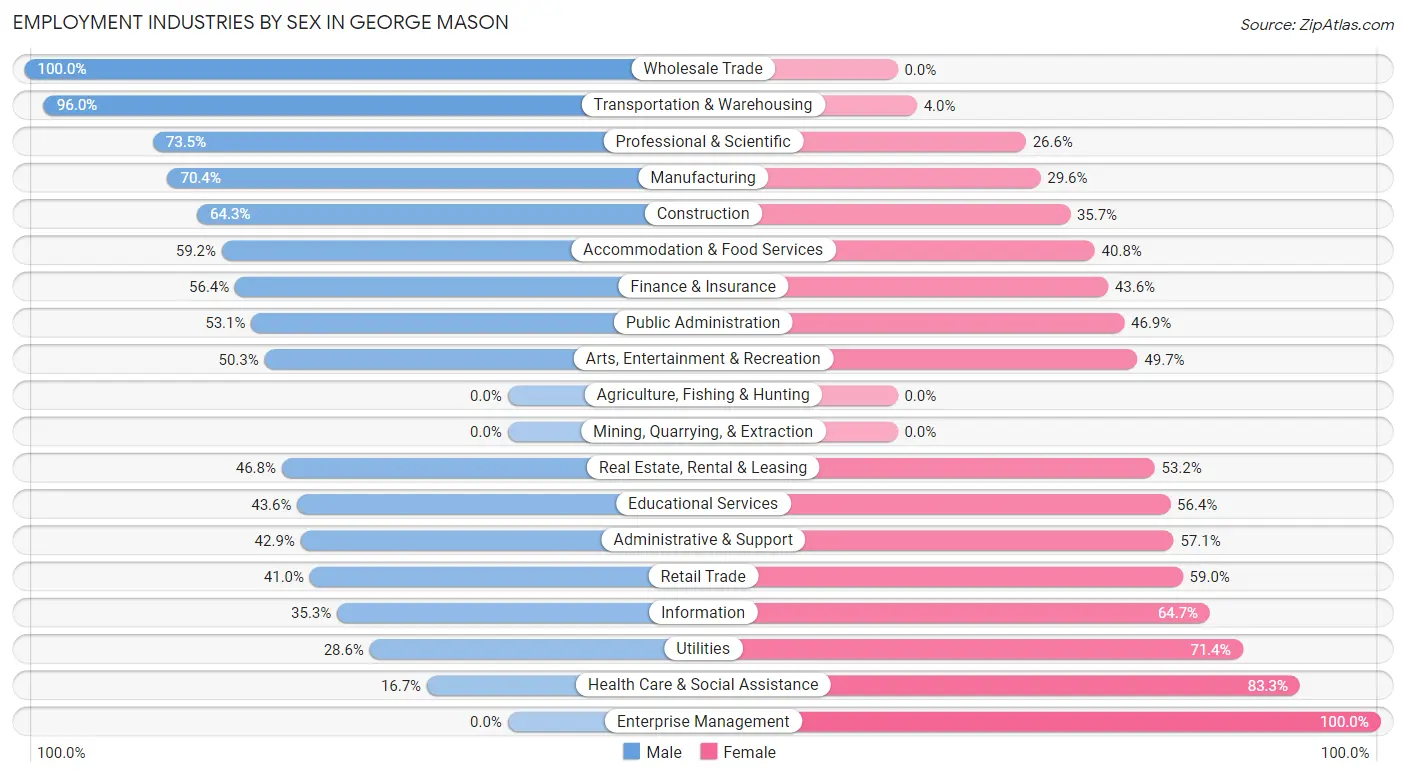
Employment Industries by Sex in George Mason
The George Mason industries that see more men than women are Wholesale Trade (100.0%), Transportation & Warehousing (96.0%), and Professional & Scientific (73.5%), whereas the industries that tend to have a higher number of women are Enterprise Management (100.0%), Health Care & Social Assistance (83.3%), and Utilities (71.4%).
| Industry | Male | Female |
| Agriculture, Fishing & Hunting | 0 (0.0%) | 0 (0.0%) |
| Mining, Quarrying, & Extraction | 0 (0.0%) | 0 (0.0%) |
| Construction | 63 (64.3%) | 35 (35.7%) |
| Manufacturing | 69 (70.4%) | 29 (29.6%) |
| Wholesale Trade | 5 (100.0%) | 0 (0.0%) |
| Retail Trade | 197 (41.0%) | 284 (59.0%) |
| Transportation & Warehousing | 48 (96.0%) | 2 (4.0%) |
| Utilities | 6 (28.6%) | 15 (71.4%) |
| Information | 71 (35.3%) | 130 (64.7%) |
| Finance & Insurance | 79 (56.4%) | 61 (43.6%) |
| Real Estate, Rental & Leasing | 29 (46.8%) | 33 (53.2%) |
| Professional & Scientific | 368 (73.5%) | 133 (26.6%) |
| Enterprise Management | 0 (0.0%) | 4 (100.0%) |
| Administrative & Support | 93 (42.9%) | 124 (57.1%) |
| Educational Services | 416 (43.6%) | 539 (56.4%) |
| Health Care & Social Assistance | 54 (16.7%) | 269 (83.3%) |
| Arts, Entertainment & Recreation | 76 (50.3%) | 75 (49.7%) |
| Accommodation & Food Services | 200 (59.2%) | 138 (40.8%) |
| Public Administration | 155 (53.1%) | 137 (46.9%) |
| Total | 2,007 (47.9%) | 2,183 (52.1%) |
Education in George Mason
School Enrollment in George Mason
The most common levels of schooling among the 6,383 students in George Mason are college / undergraduate (5,027 | 78.8%), middle school (404 | 6.3%), and high school (305 | 4.8%).
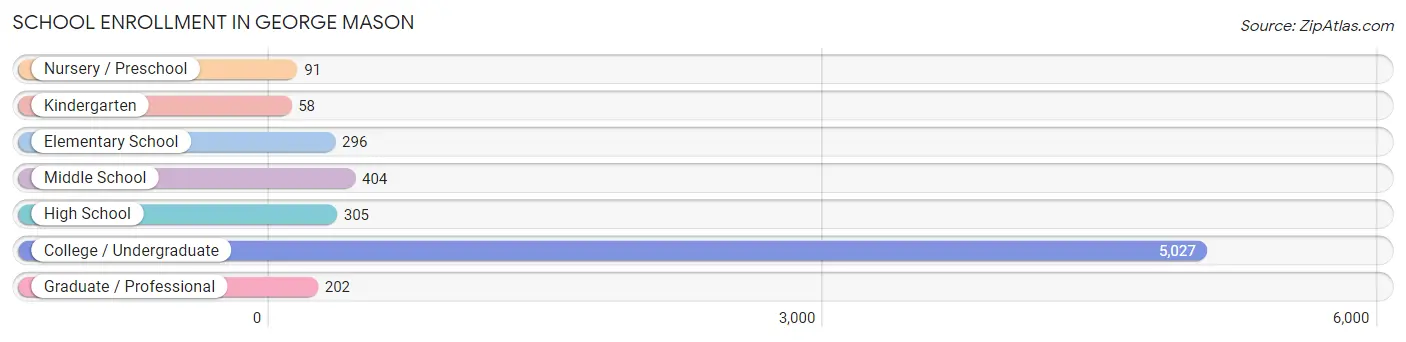
| School Level | # Students | % Students |
| Nursery / Preschool | 91 | 1.4% |
| Kindergarten | 58 | 0.9% |
| Elementary School | 296 | 4.6% |
| Middle School | 404 | 6.3% |
| High School | 305 | 4.8% |
| College / Undergraduate | 5,027 | 78.8% |
| Graduate / Professional | 202 | 3.2% |
| Total | 6,383 | 100.0% |
School Enrollment by Age by Funding Source in George Mason
Out of a total of 6,383 students who are enrolled in schools in George Mason, 332 (5.2%) attend a private institution, while the remaining 6,051 (94.8%) are enrolled in public schools. The age group of 3 to 4 year olds has the highest likelihood of being enrolled in private schools, with 81 (95.3% in the age bracket) enrolled. Conversely, the age group of 18 to 19 year olds has the lowest likelihood of being enrolled in a private school, with 2,529 (98.8% in the age bracket) attending a public institution.
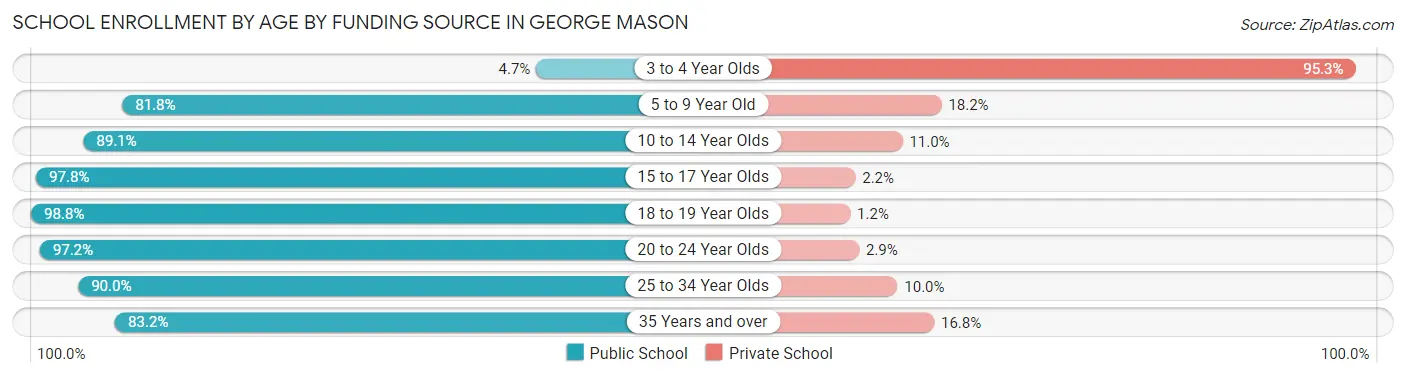
| Age Bracket | Public School | Private School |
| 3 to 4 Year Olds | 4 (4.7%) | 81 (95.3%) |
| 5 to 9 Year Old | 274 (81.8%) | 61 (18.2%) |
| 10 to 14 Year Olds | 431 (89.0%) | 53 (11.0%) |
| 15 to 17 Year Olds | 226 (97.8%) | 5 (2.2%) |
| 18 to 19 Year Olds | 2,529 (98.8%) | 31 (1.2%) |
| 20 to 24 Year Olds | 2,354 (97.2%) | 69 (2.9%) |
| 25 to 34 Year Olds | 153 (90.0%) | 17 (10.0%) |
| 35 Years and over | 79 (83.2%) | 16 (16.8%) |
| Total | 6,051 (94.8%) | 332 (5.2%) |
Educational Attainment by Field of Study in George Mason
Business (420 | 16.7%), social sciences (307 | 12.2%), engineering (266 | 10.6%), computers & mathematics (218 | 8.7%), and science & technology (211 | 8.4%) are the most common fields of study among 2,513 individuals in George Mason who have obtained a bachelor's degree or higher.
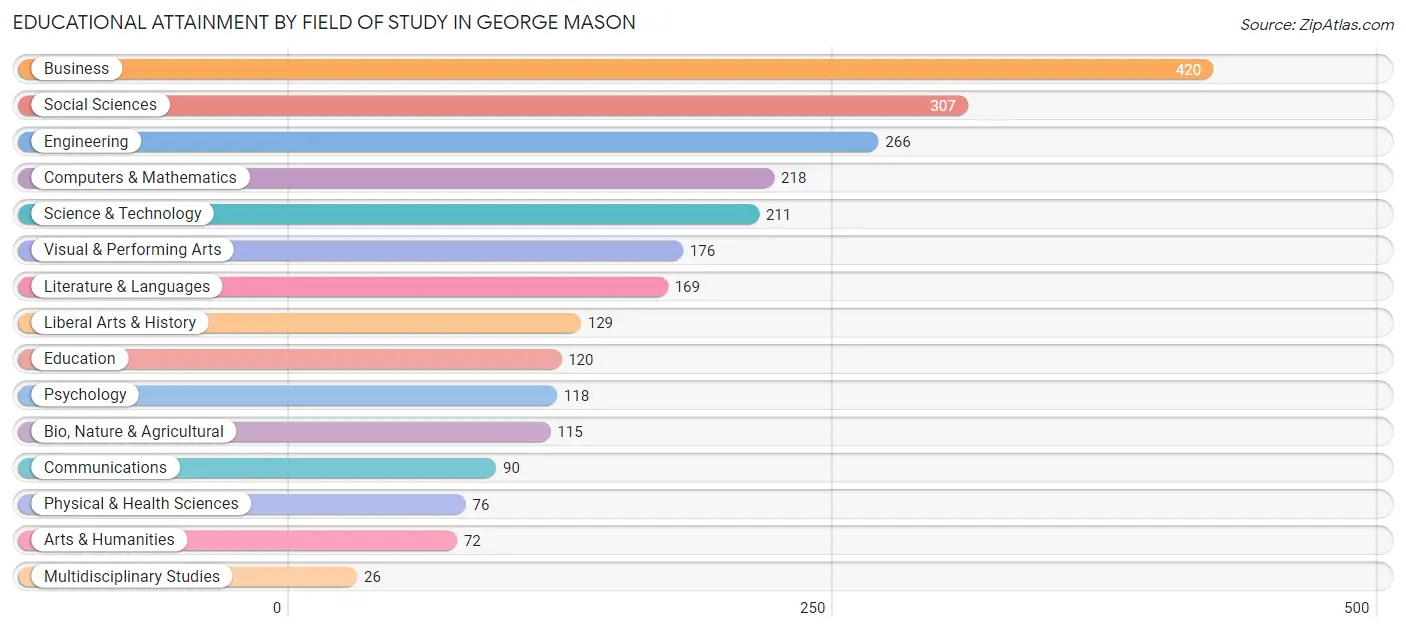
| Field of Study | # Graduates | % Graduates |
| Computers & Mathematics | 218 | 8.7% |
| Bio, Nature & Agricultural | 115 | 4.6% |
| Physical & Health Sciences | 76 | 3.0% |
| Psychology | 118 | 4.7% |
| Social Sciences | 307 | 12.2% |
| Engineering | 266 | 10.6% |
| Multidisciplinary Studies | 26 | 1.0% |
| Science & Technology | 211 | 8.4% |
| Business | 420 | 16.7% |
| Education | 120 | 4.8% |
| Literature & Languages | 169 | 6.7% |
| Liberal Arts & History | 129 | 5.1% |
| Visual & Performing Arts | 176 | 7.0% |
| Communications | 90 | 3.6% |
| Arts & Humanities | 72 | 2.9% |
| Total | 2,513 | 100.0% |
Transportation & Commute in George Mason
Vehicle Availability by Sex in George Mason
The most prevalent vehicle ownership categories in George Mason are males with 2 vehicles (658, accounting for 45.5%) and females with 2 vehicles (648, making up 50.3%).
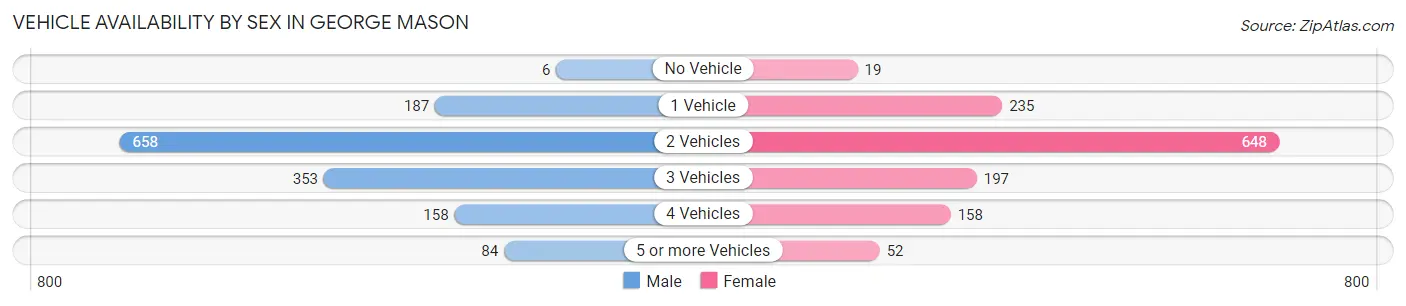
| Vehicles Available | Male | Female |
| No Vehicle | 6 (0.4%) | 19 (1.5%) |
| 1 Vehicle | 187 (12.9%) | 235 (17.9%) |
| 2 Vehicles | 658 (45.5%) | 648 (49.5%) |
| 3 Vehicles | 353 (24.4%) | 197 (15.0%) |
| 4 Vehicles | 158 (10.9%) | 158 (12.1%) |
| 5 or more Vehicles | 84 (5.8%) | 52 (4.0%) |
| Total | 1,446 (100.0%) | 1,309 (100.0%) |
Commute Time in George Mason
The most frequently occuring commute durations in George Mason are 10 to 14 minutes (628 commuters, 19.8%), 30 to 34 minutes (439 commuters, 13.8%), and 15 to 19 minutes (403 commuters, 12.7%).
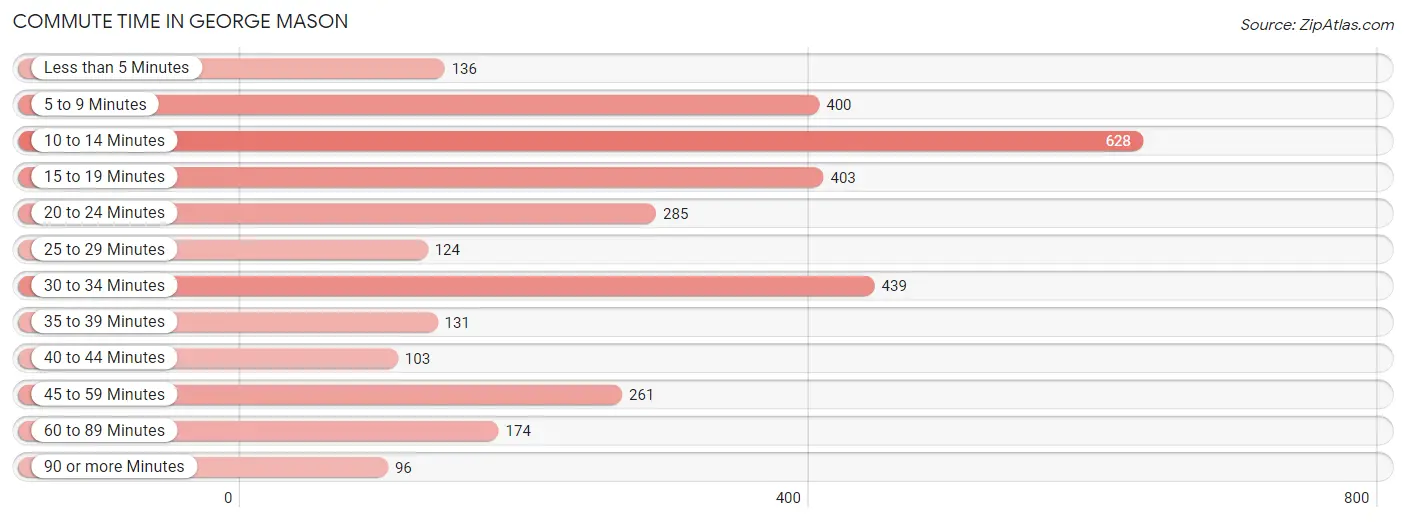
| Commute Time | # Commuters | % Commuters |
| Less than 5 Minutes | 136 | 4.3% |
| 5 to 9 Minutes | 400 | 12.6% |
| 10 to 14 Minutes | 628 | 19.8% |
| 15 to 19 Minutes | 403 | 12.7% |
| 20 to 24 Minutes | 285 | 9.0% |
| 25 to 29 Minutes | 124 | 3.9% |
| 30 to 34 Minutes | 439 | 13.8% |
| 35 to 39 Minutes | 131 | 4.1% |
| 40 to 44 Minutes | 103 | 3.2% |
| 45 to 59 Minutes | 261 | 8.2% |
| 60 to 89 Minutes | 174 | 5.5% |
| 90 or more Minutes | 96 | 3.0% |
Commute Time by Sex in George Mason
The most common commute times in George Mason are 30 to 34 minutes (238 commuters, 15.9%) for males and 10 to 14 minutes (436 commuters, 25.9%) for females.
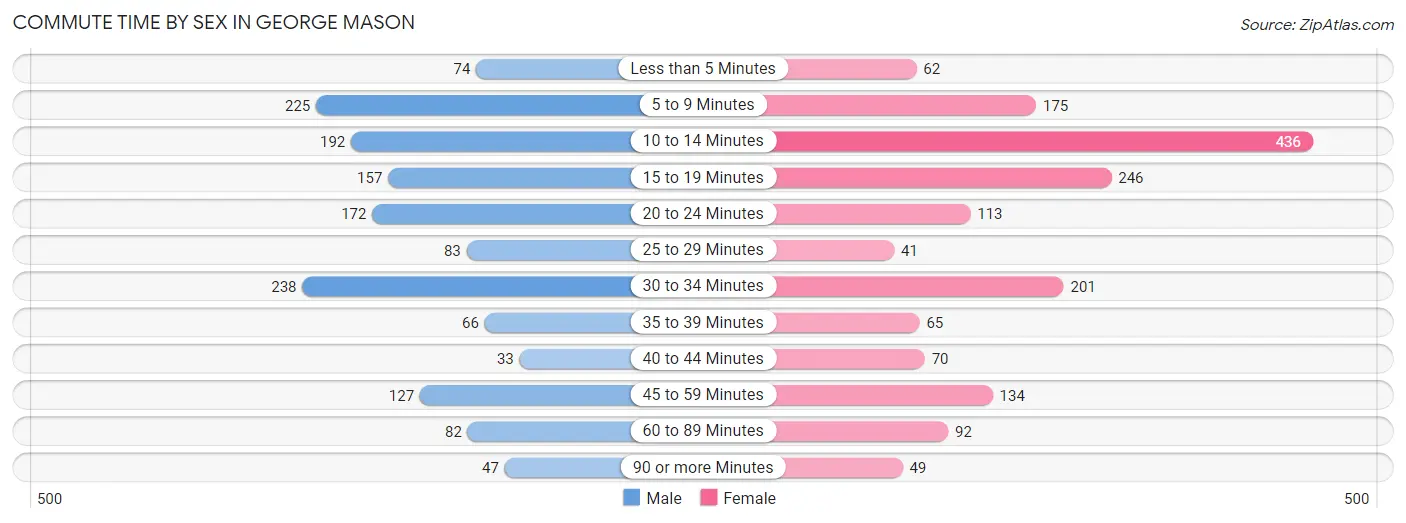
| Commute Time | Male | Female |
| Less than 5 Minutes | 74 (5.0%) | 62 (3.7%) |
| 5 to 9 Minutes | 225 (15.0%) | 175 (10.4%) |
| 10 to 14 Minutes | 192 (12.8%) | 436 (25.9%) |
| 15 to 19 Minutes | 157 (10.5%) | 246 (14.6%) |
| 20 to 24 Minutes | 172 (11.5%) | 113 (6.7%) |
| 25 to 29 Minutes | 83 (5.6%) | 41 (2.4%) |
| 30 to 34 Minutes | 238 (15.9%) | 201 (11.9%) |
| 35 to 39 Minutes | 66 (4.4%) | 65 (3.9%) |
| 40 to 44 Minutes | 33 (2.2%) | 70 (4.2%) |
| 45 to 59 Minutes | 127 (8.5%) | 134 (8.0%) |
| 60 to 89 Minutes | 82 (5.5%) | 92 (5.5%) |
| 90 or more Minutes | 47 (3.1%) | 49 (2.9%) |
Time of Departure to Work by Sex in George Mason
The most frequent times of departure to work in George Mason are 12:00 PM to 3:59 PM (240, 16.0%) for males and 12:00 PM to 3:59 PM (386, 22.9%) for females.
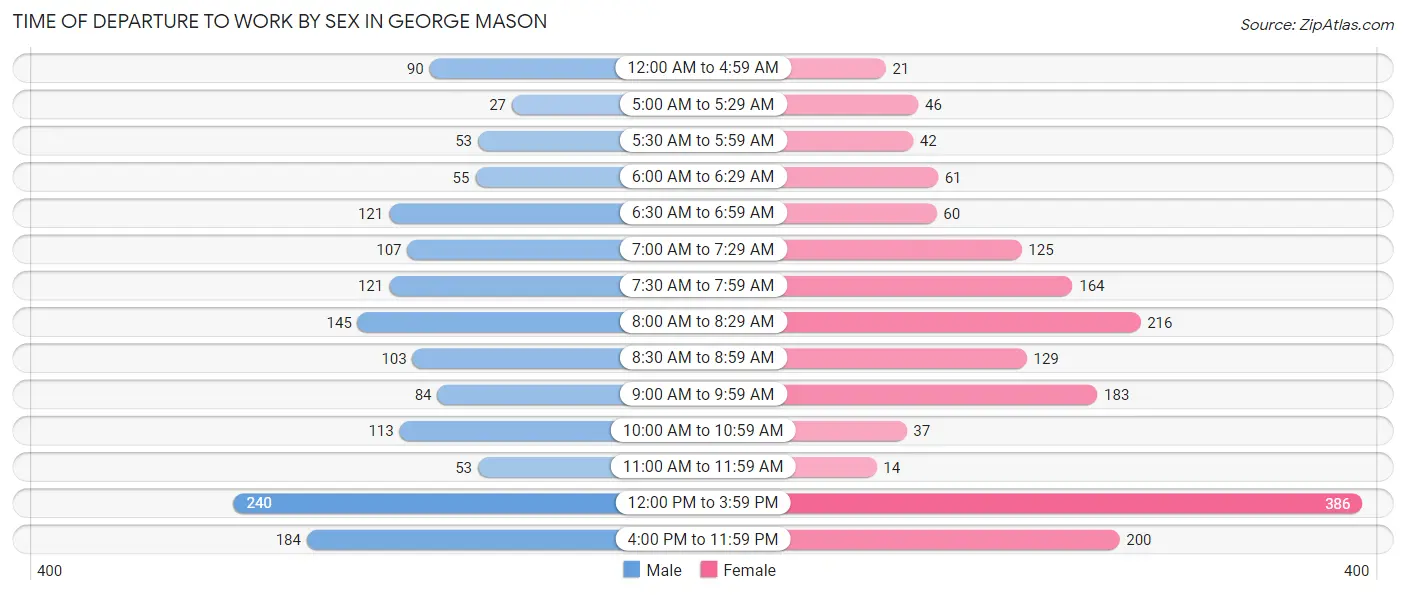
| Time of Departure | Male | Female |
| 12:00 AM to 4:59 AM | 90 (6.0%) | 21 (1.3%) |
| 5:00 AM to 5:29 AM | 27 (1.8%) | 46 (2.7%) |
| 5:30 AM to 5:59 AM | 53 (3.5%) | 42 (2.5%) |
| 6:00 AM to 6:29 AM | 55 (3.7%) | 61 (3.6%) |
| 6:30 AM to 6:59 AM | 121 (8.1%) | 60 (3.6%) |
| 7:00 AM to 7:29 AM | 107 (7.1%) | 125 (7.4%) |
| 7:30 AM to 7:59 AM | 121 (8.1%) | 164 (9.7%) |
| 8:00 AM to 8:29 AM | 145 (9.7%) | 216 (12.8%) |
| 8:30 AM to 8:59 AM | 103 (6.9%) | 129 (7.7%) |
| 9:00 AM to 9:59 AM | 84 (5.6%) | 183 (10.9%) |
| 10:00 AM to 10:59 AM | 113 (7.5%) | 37 (2.2%) |
| 11:00 AM to 11:59 AM | 53 (3.5%) | 14 (0.8%) |
| 12:00 PM to 3:59 PM | 240 (16.0%) | 386 (22.9%) |
| 4:00 PM to 11:59 PM | 184 (12.3%) | 200 (11.9%) |
| Total | 1,496 (100.0%) | 1,684 (100.0%) |
Housing Occupancy in George Mason
Occupancy by Ownership in George Mason
Of the total 1,755 dwellings in George Mason, owner-occupied units account for 1,389 (79.1%), while renter-occupied units make up 366 (20.8%).
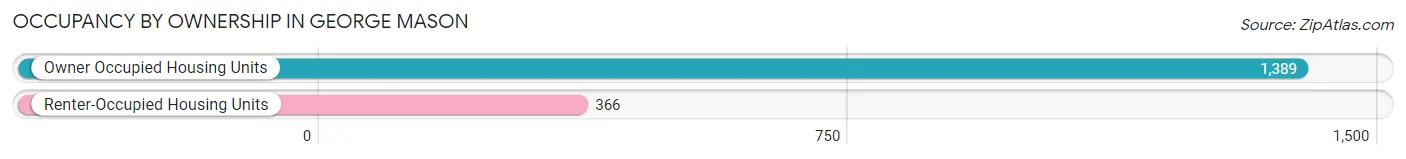
| Occupancy | # Housing Units | % Housing Units |
| Owner Occupied Housing Units | 1,389 | 79.1% |
| Renter-Occupied Housing Units | 366 | 20.8% |
| Total Occupied Housing Units | 1,755 | 100.0% |
Occupancy by Household Size in George Mason
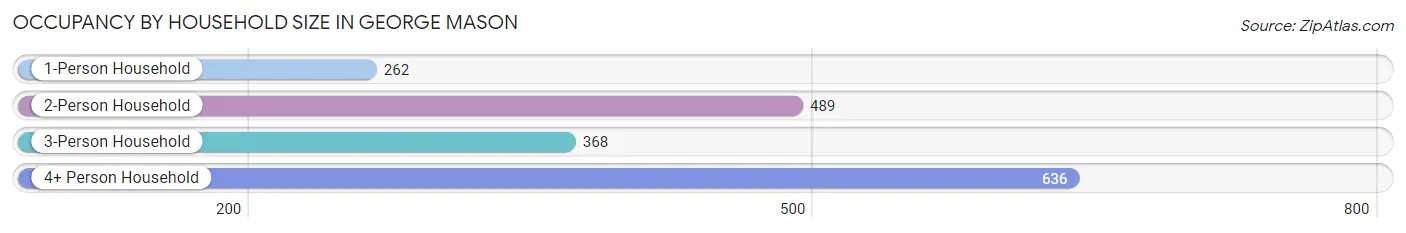
| Household Size | # Housing Units | % Housing Units |
| 1-Person Household | 262 | 14.9% |
| 2-Person Household | 489 | 27.9% |
| 3-Person Household | 368 | 21.0% |
| 4+ Person Household | 636 | 36.2% |
| Total Housing Units | 1,755 | 100.0% |
Occupancy by Ownership by Household Size in George Mason
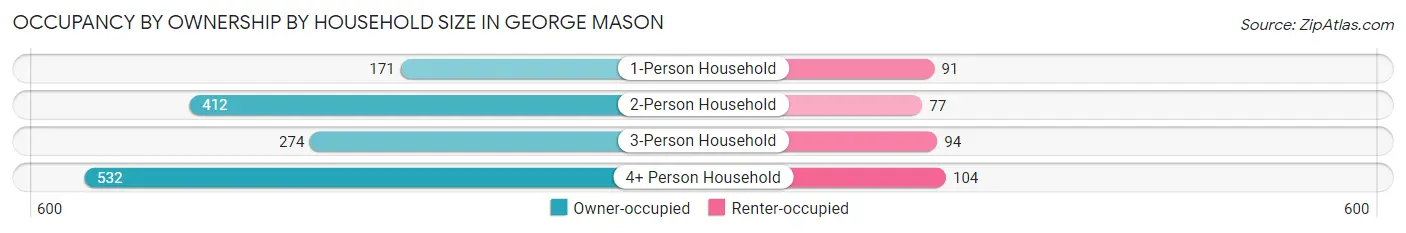
| Household Size | Owner-occupied | Renter-occupied |
| 1-Person Household | 171 (65.3%) | 91 (34.7%) |
| 2-Person Household | 412 (84.3%) | 77 (15.8%) |
| 3-Person Household | 274 (74.5%) | 94 (25.5%) |
| 4+ Person Household | 532 (83.7%) | 104 (16.4%) |
| Total Housing Units | 1,389 (79.1%) | 366 (20.8%) |
Occupancy by Educational Attainment in George Mason
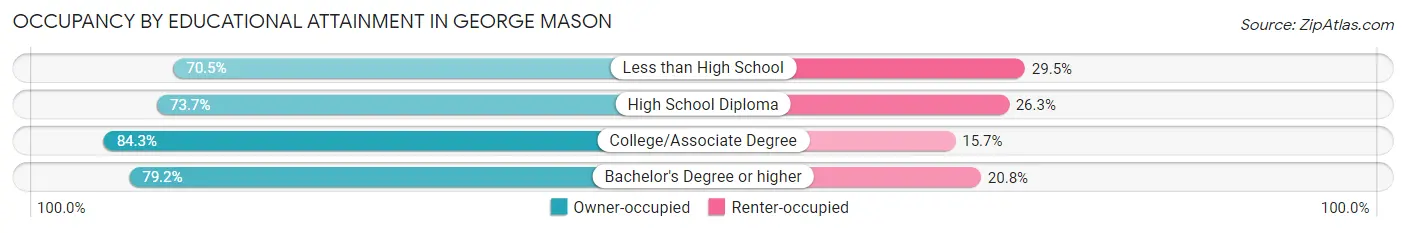
| Household Size | Owner-occupied | Renter-occupied |
| Less than High School | 55 (70.5%) | 23 (29.5%) |
| High School Diploma | 115 (73.7%) | 41 (26.3%) |
| College/Associate Degree | 231 (84.3%) | 43 (15.7%) |
| Bachelor's Degree or higher | 988 (79.2%) | 259 (20.8%) |
Occupancy by Age of Householder in George Mason
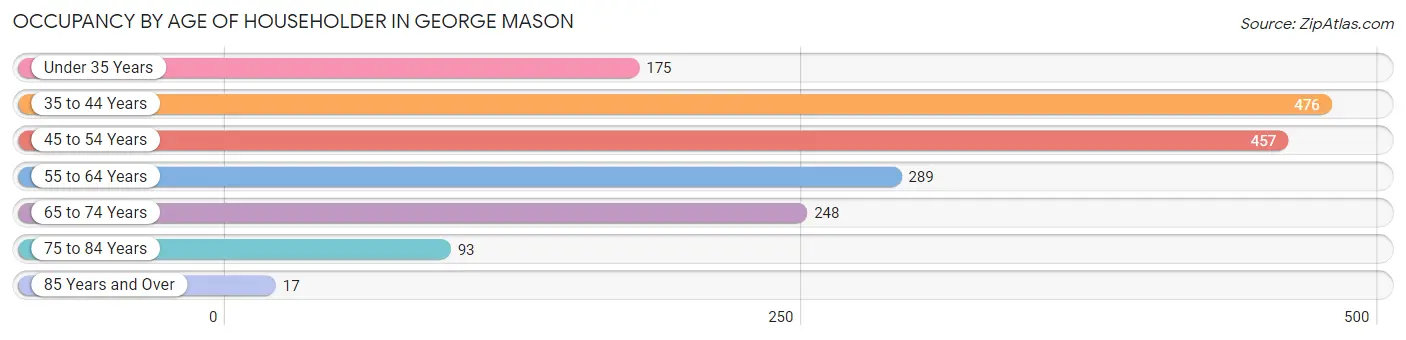
| Age Bracket | # Households | % Households |
| Under 35 Years | 175 | 10.0% |
| 35 to 44 Years | 476 | 27.1% |
| 45 to 54 Years | 457 | 26.0% |
| 55 to 64 Years | 289 | 16.5% |
| 65 to 74 Years | 248 | 14.1% |
| 75 to 84 Years | 93 | 5.3% |
| 85 Years and Over | 17 | 1.0% |
| Total | 1,755 | 100.0% |
Housing Finances in George Mason
Median Income by Occupancy in George Mason
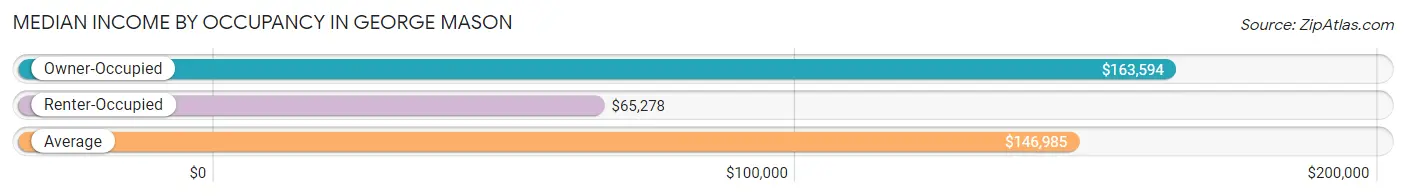
| Occupancy Type | # Households | Median Income |
| Owner-Occupied | 1,389 (79.1%) | $163,594 |
| Renter-Occupied | 366 (20.8%) | $65,278 |
| Average | 1,755 (100.0%) | $146,985 |
Occupancy by Householder Income Bracket in George Mason
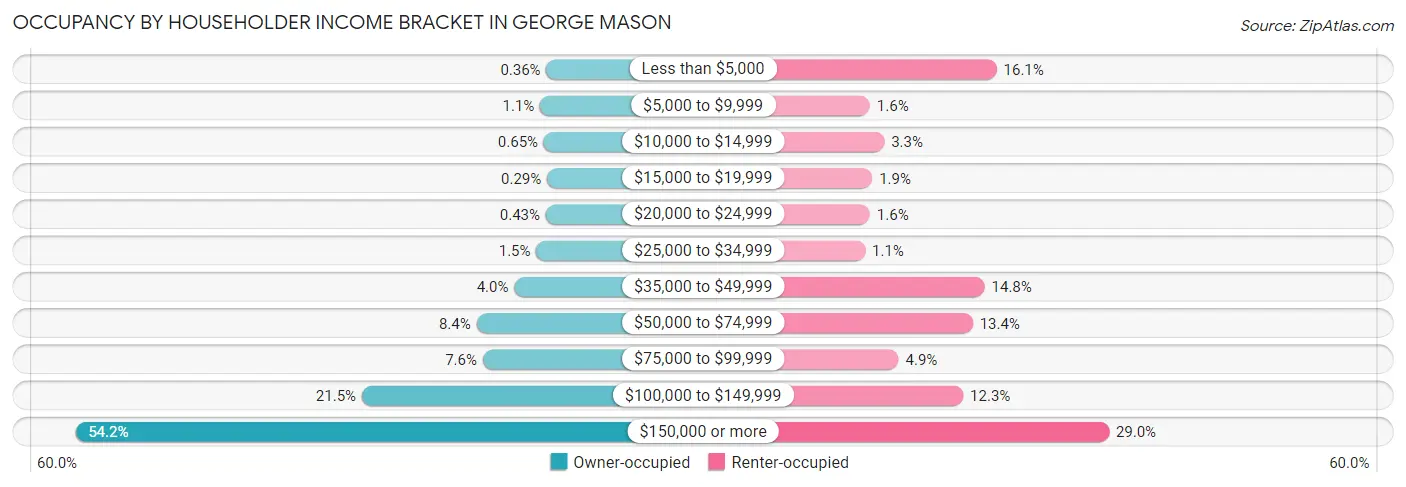
| Income Bracket | Owner-occupied | Renter-occupied |
| Less than $5,000 | 5 (0.4%) | 59 (16.1%) |
| $5,000 to $9,999 | 15 (1.1%) | 6 (1.6%) |
| $10,000 to $14,999 | 9 (0.6%) | 12 (3.3%) |
| $15,000 to $19,999 | 4 (0.3%) | 7 (1.9%) |
| $20,000 to $24,999 | 6 (0.4%) | 6 (1.6%) |
| $25,000 to $34,999 | 21 (1.5%) | 4 (1.1%) |
| $35,000 to $49,999 | 56 (4.0%) | 54 (14.7%) |
| $50,000 to $74,999 | 116 (8.4%) | 49 (13.4%) |
| $75,000 to $99,999 | 106 (7.6%) | 18 (4.9%) |
| $100,000 to $149,999 | 298 (21.4%) | 45 (12.3%) |
| $150,000 or more | 753 (54.2%) | 106 (29.0%) |
| Total | 1,389 (100.0%) | 366 (100.0%) |
Monthly Housing Cost Tiers in George Mason
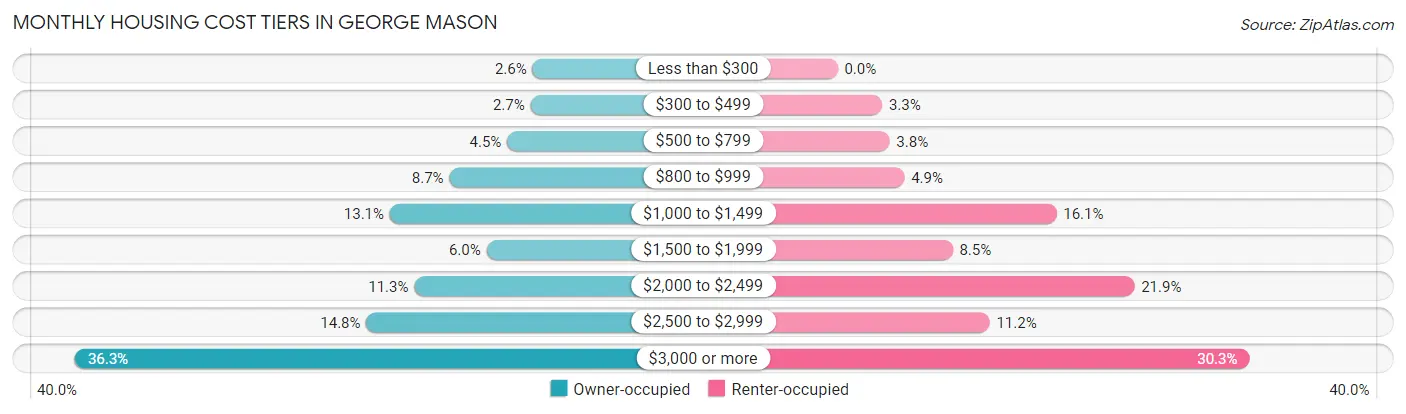
| Monthly Cost | Owner-occupied | Renter-occupied |
| Less than $300 | 36 (2.6%) | 0 (0.0%) |
| $300 to $499 | 38 (2.7%) | 12 (3.3%) |
| $500 to $799 | 62 (4.5%) | 14 (3.8%) |
| $800 to $999 | 121 (8.7%) | 18 (4.9%) |
| $1,000 to $1,499 | 182 (13.1%) | 59 (16.1%) |
| $1,500 to $1,999 | 83 (6.0%) | 31 (8.5%) |
| $2,000 to $2,499 | 157 (11.3%) | 80 (21.9%) |
| $2,500 to $2,999 | 206 (14.8%) | 41 (11.2%) |
| $3,000 or more | 504 (36.3%) | 111 (30.3%) |
| Total | 1,389 (100.0%) | 366 (100.0%) |
Physical Housing Characteristics in George Mason
Housing Structures in George Mason
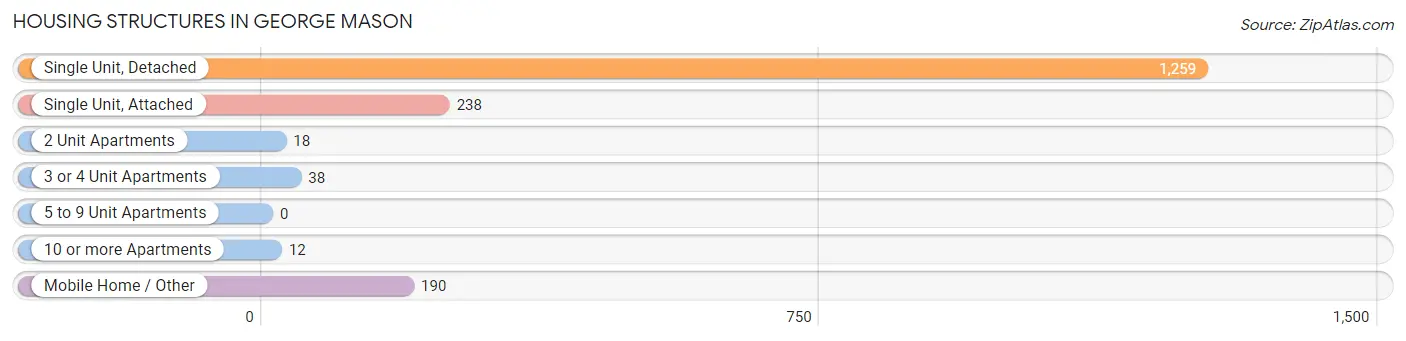
| Structure Type | # Housing Units | % Housing Units |
| Single Unit, Detached | 1,259 | 71.7% |
| Single Unit, Attached | 238 | 13.6% |
| 2 Unit Apartments | 18 | 1.0% |
| 3 or 4 Unit Apartments | 38 | 2.2% |
| 5 to 9 Unit Apartments | 0 | 0.0% |
| 10 or more Apartments | 12 | 0.7% |
| Mobile Home / Other | 190 | 10.8% |
| Total | 1,755 | 100.0% |
Housing Structures by Occupancy in George Mason
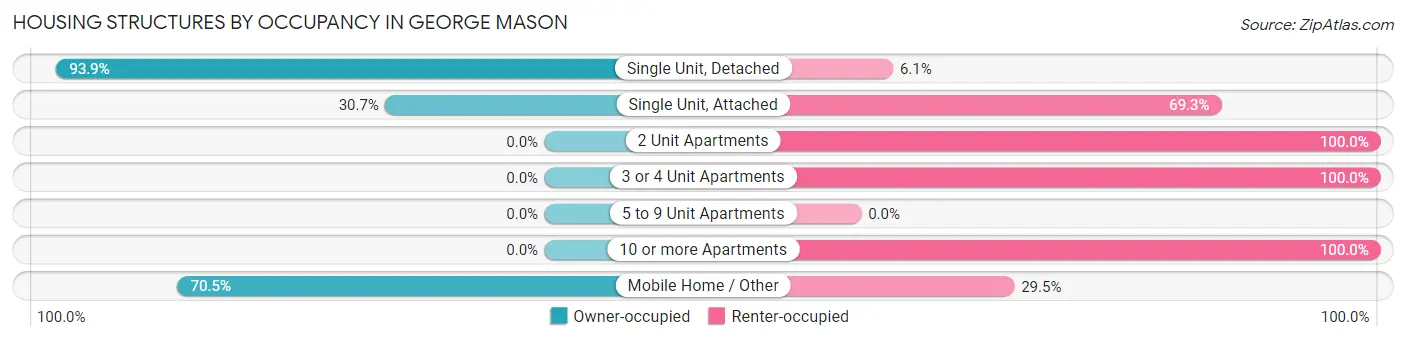
| Structure Type | Owner-occupied | Renter-occupied |
| Single Unit, Detached | 1,182 (93.9%) | 77 (6.1%) |
| Single Unit, Attached | 73 (30.7%) | 165 (69.3%) |
| 2 Unit Apartments | 0 (0.0%) | 18 (100.0%) |
| 3 or 4 Unit Apartments | 0 (0.0%) | 38 (100.0%) |
| 5 to 9 Unit Apartments | 0 (0.0%) | 0 (0.0%) |
| 10 or more Apartments | 0 (0.0%) | 12 (100.0%) |
| Mobile Home / Other | 134 (70.5%) | 56 (29.5%) |
| Total | 1,389 (79.1%) | 366 (20.8%) |
Housing Structures by Number of Rooms in George Mason
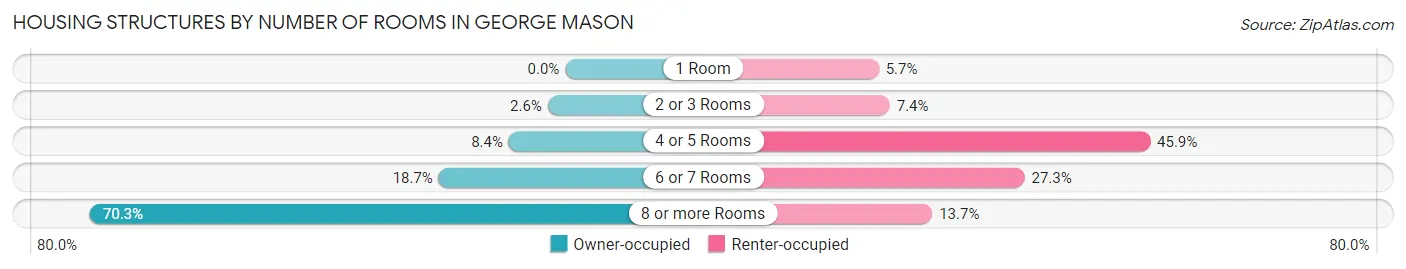
| Number of Rooms | Owner-occupied | Renter-occupied |
| 1 Room | 0 (0.0%) | 21 (5.7%) |
| 2 or 3 Rooms | 36 (2.6%) | 27 (7.4%) |
| 4 or 5 Rooms | 116 (8.4%) | 168 (45.9%) |
| 6 or 7 Rooms | 260 (18.7%) | 100 (27.3%) |
| 8 or more Rooms | 977 (70.3%) | 50 (13.7%) |
| Total | 1,389 (100.0%) | 366 (100.0%) |
Housing Structure by Heating Type in George Mason
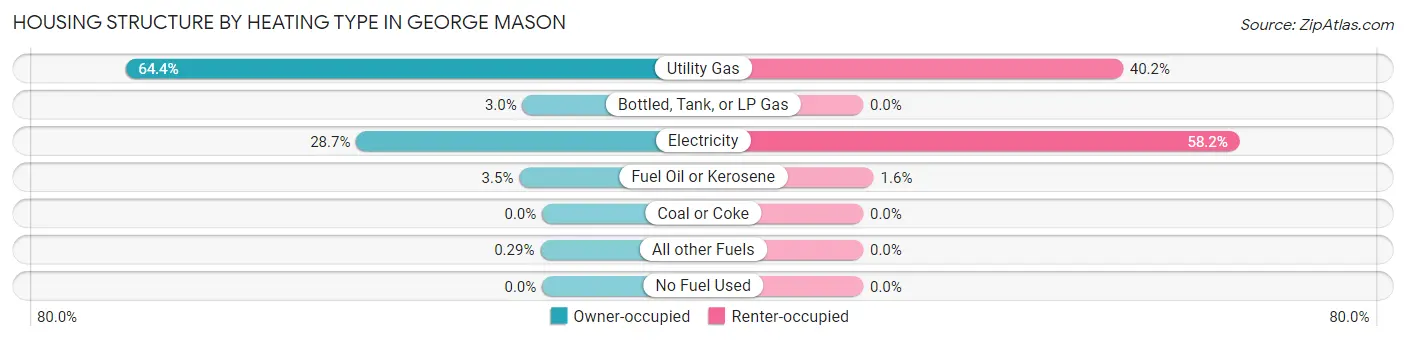
| Heating Type | Owner-occupied | Renter-occupied |
| Utility Gas | 895 (64.4%) | 147 (40.2%) |
| Bottled, Tank, or LP Gas | 42 (3.0%) | 0 (0.0%) |
| Electricity | 399 (28.7%) | 213 (58.2%) |
| Fuel Oil or Kerosene | 49 (3.5%) | 6 (1.6%) |
| Coal or Coke | 0 (0.0%) | 0 (0.0%) |
| All other Fuels | 4 (0.3%) | 0 (0.0%) |
| No Fuel Used | 0 (0.0%) | 0 (0.0%) |
| Total | 1,389 (100.0%) | 366 (100.0%) |
Household Vehicle Usage in George Mason
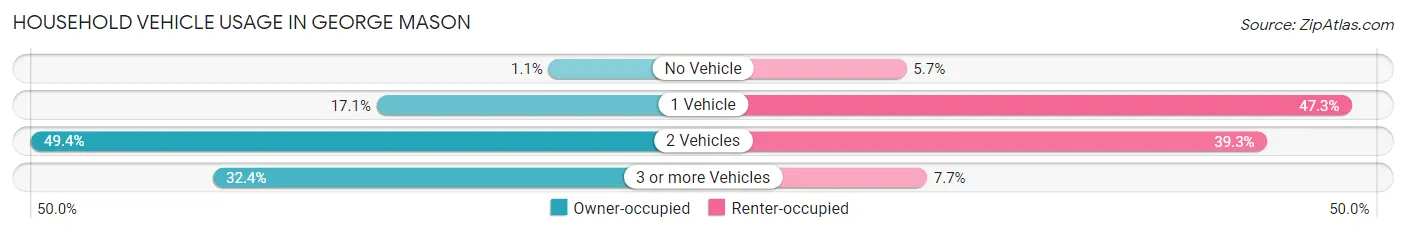
| Vehicles per Household | Owner-occupied | Renter-occupied |
| No Vehicle | 15 (1.1%) | 21 (5.7%) |
| 1 Vehicle | 238 (17.1%) | 173 (47.3%) |
| 2 Vehicles | 686 (49.4%) | 144 (39.3%) |
| 3 or more Vehicles | 450 (32.4%) | 28 (7.6%) |
| Total | 1,389 (100.0%) | 366 (100.0%) |
Real Estate & Mortgages in George Mason
Real Estate and Mortgage Overview in George Mason
| Characteristic | Without Mortgage | With Mortgage |
| Housing Units | 438 | 951 |
| Median Property Value | $624,300 | $685,000 |
| Median Household Income | $105,938 | $595 |
| Monthly Housing Costs | $930 | $504 |
| Real Estate Taxes | $6,482 | $33 |
Property Value by Mortgage Status in George Mason
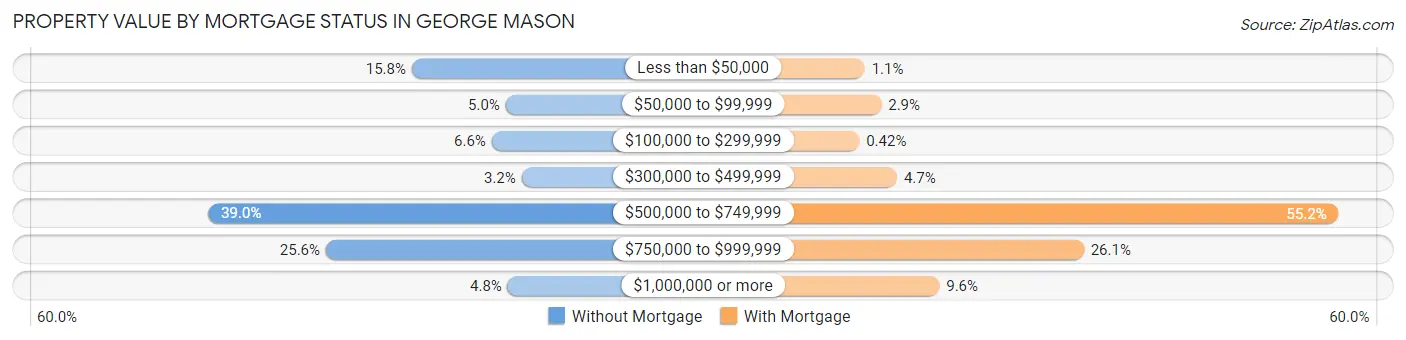
| Property Value | Without Mortgage | With Mortgage |
| Less than $50,000 | 69 (15.8%) | 10 (1.1%) |
| $50,000 to $99,999 | 22 (5.0%) | 28 (2.9%) |
| $100,000 to $299,999 | 29 (6.6%) | 4 (0.4%) |
| $300,000 to $499,999 | 14 (3.2%) | 45 (4.7%) |
| $500,000 to $749,999 | 171 (39.0%) | 525 (55.2%) |
| $750,000 to $999,999 | 112 (25.6%) | 248 (26.1%) |
| $1,000,000 or more | 21 (4.8%) | 91 (9.6%) |
| Total | 438 (100.0%) | 951 (100.0%) |
Household Income by Mortgage Status in George Mason
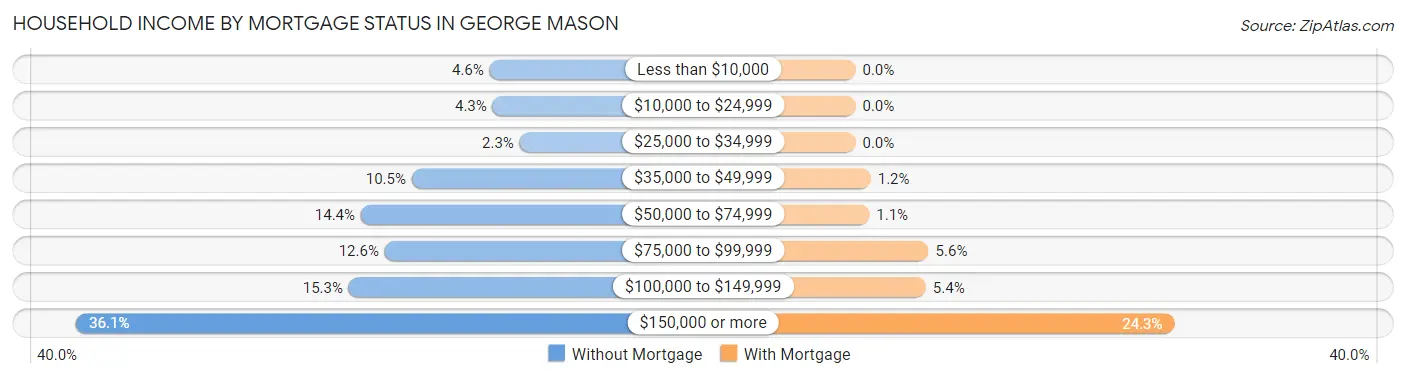
| Household Income | Without Mortgage | With Mortgage |
| Less than $10,000 | 20 (4.6%) | 0 (0.0%) |
| $10,000 to $24,999 | 19 (4.3%) | 0 (0.0%) |
| $25,000 to $34,999 | 10 (2.3%) | 0 (0.0%) |
| $35,000 to $49,999 | 46 (10.5%) | 11 (1.2%) |
| $50,000 to $74,999 | 63 (14.4%) | 10 (1.1%) |
| $75,000 to $99,999 | 55 (12.6%) | 53 (5.6%) |
| $100,000 to $149,999 | 67 (15.3%) | 51 (5.4%) |
| $150,000 or more | 158 (36.1%) | 231 (24.3%) |
| Total | 438 (100.0%) | 951 (100.0%) |
Property Value to Household Income Ratio in George Mason
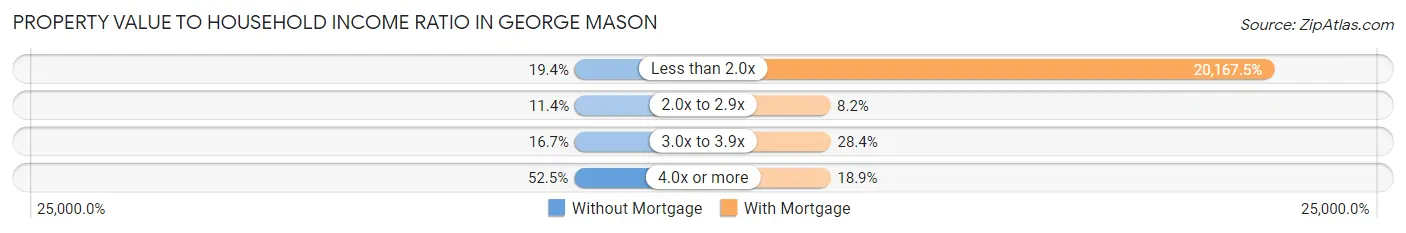
| Value-to-Income Ratio | Without Mortgage | With Mortgage |
| Less than 2.0x | 85 (19.4%) | 191,793 (20,167.5%) |
| 2.0x to 2.9x | 50 (11.4%) | 78 (8.2%) |
| 3.0x to 3.9x | 73 (16.7%) | 270 (28.4%) |
| 4.0x or more | 230 (52.5%) | 180 (18.9%) |
| Total | 438 (100.0%) | 951 (100.0%) |
Real Estate Taxes by Mortgage Status in George Mason
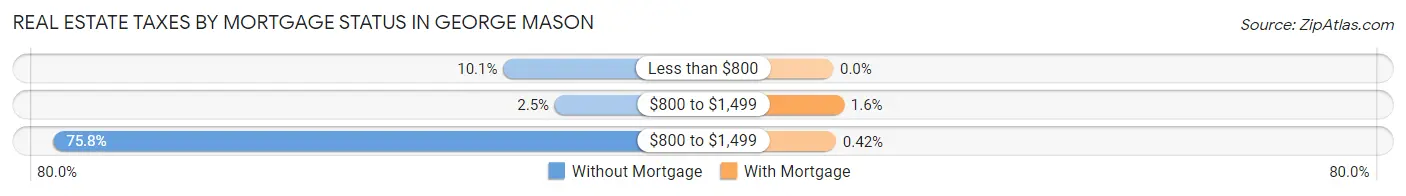
| Property Taxes | Without Mortgage | With Mortgage |
| Less than $800 | 44 (10.1%) | 0 (0.0%) |
| $800 to $1,499 | 11 (2.5%) | 15 (1.6%) |
| $800 to $1,499 | 332 (75.8%) | 4 (0.4%) |
| Total | 438 (100.0%) | 951 (100.0%) |
Health & Disability in George Mason
Health Insurance Coverage by Age in George Mason
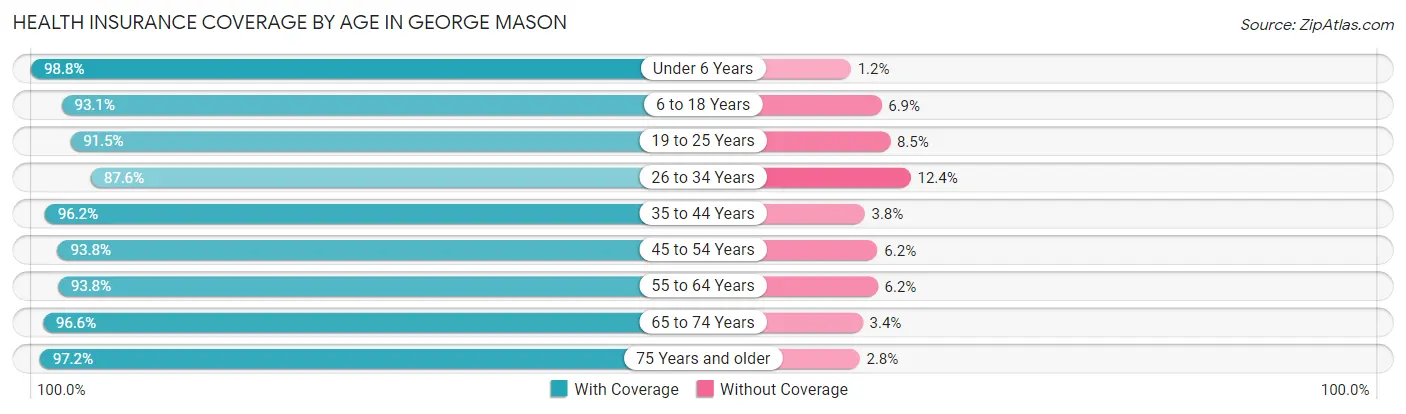
| Age Bracket | With Coverage | Without Coverage |
| Under 6 Years | 328 (98.8%) | 4 (1.2%) |
| 6 to 18 Years | 2,131 (93.1%) | 158 (6.9%) |
| 19 to 25 Years | 3,611 (91.5%) | 336 (8.5%) |
| 26 to 34 Years | 390 (87.6%) | 55 (12.4%) |
| 35 to 44 Years | 866 (96.2%) | 34 (3.8%) |
| 45 to 54 Years | 761 (93.8%) | 50 (6.2%) |
| 55 to 64 Years | 544 (93.8%) | 36 (6.2%) |
| 65 to 74 Years | 453 (96.6%) | 16 (3.4%) |
| 75 Years and older | 205 (97.2%) | 6 (2.8%) |
| Total | 9,289 (93.0%) | 695 (7.0%) |
Health Insurance Coverage by Citizenship Status in George Mason
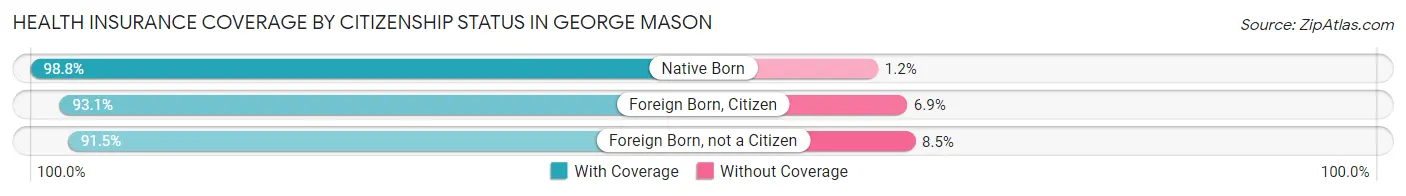
| Citizenship Status | With Coverage | Without Coverage |
| Native Born | 328 (98.8%) | 4 (1.2%) |
| Foreign Born, Citizen | 2,131 (93.1%) | 158 (6.9%) |
| Foreign Born, not a Citizen | 3,611 (91.5%) | 336 (8.5%) |
Health Insurance Coverage by Household Income in George Mason
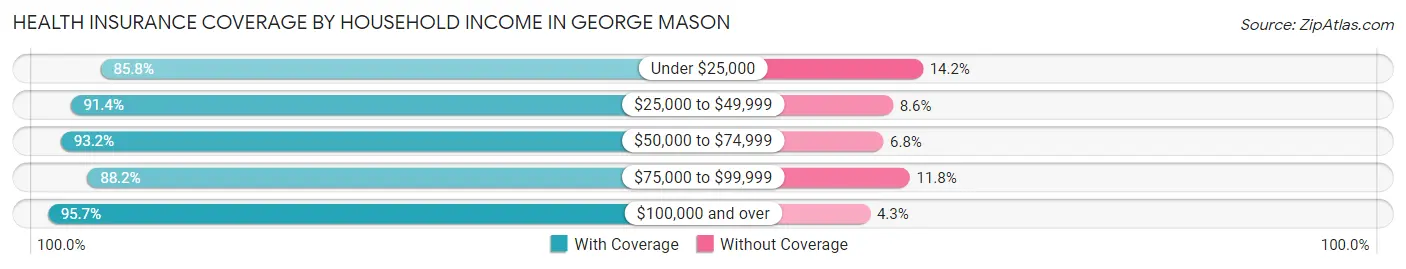
| Household Income | With Coverage | Without Coverage |
| Under $25,000 | 181 (85.8%) | 30 (14.2%) |
| $25,000 to $49,999 | 308 (91.4%) | 29 (8.6%) |
| $50,000 to $74,999 | 425 (93.2%) | 31 (6.8%) |
| $75,000 to $99,999 | 315 (88.2%) | 42 (11.8%) |
| $100,000 and over | 3,729 (95.7%) | 169 (4.3%) |
Public vs Private Health Insurance Coverage by Age in George Mason
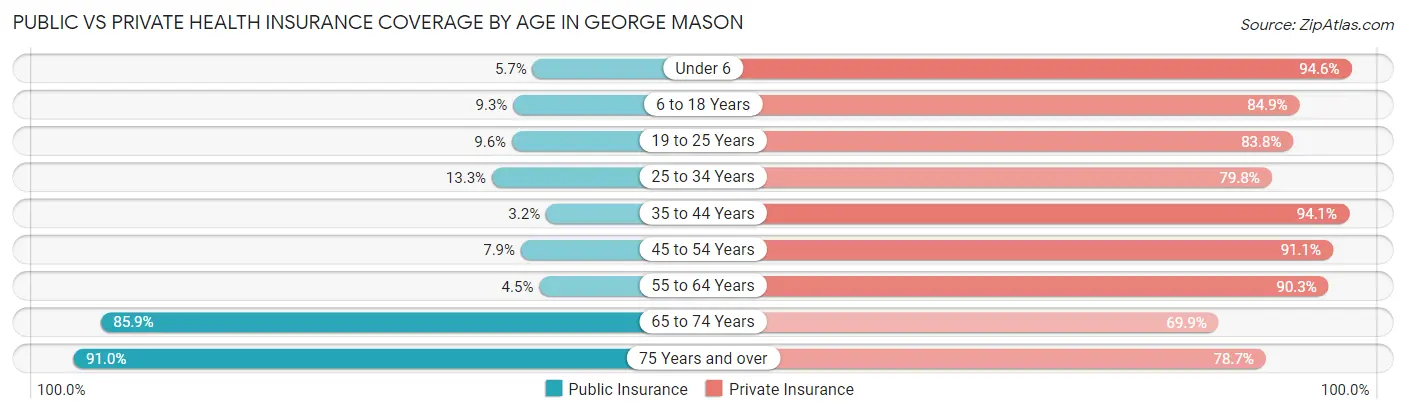
| Age Bracket | Public Insurance | Private Insurance |
| Under 6 | 19 (5.7%) | 314 (94.6%) |
| 6 to 18 Years | 213 (9.3%) | 1,944 (84.9%) |
| 19 to 25 Years | 377 (9.6%) | 3,307 (83.8%) |
| 25 to 34 Years | 59 (13.3%) | 355 (79.8%) |
| 35 to 44 Years | 29 (3.2%) | 847 (94.1%) |
| 45 to 54 Years | 64 (7.9%) | 739 (91.1%) |
| 55 to 64 Years | 26 (4.5%) | 524 (90.3%) |
| 65 to 74 Years | 403 (85.9%) | 328 (69.9%) |
| 75 Years and over | 192 (91.0%) | 166 (78.7%) |
| Total | 1,382 (13.8%) | 8,524 (85.4%) |
Disability Status by Sex by Age in George Mason
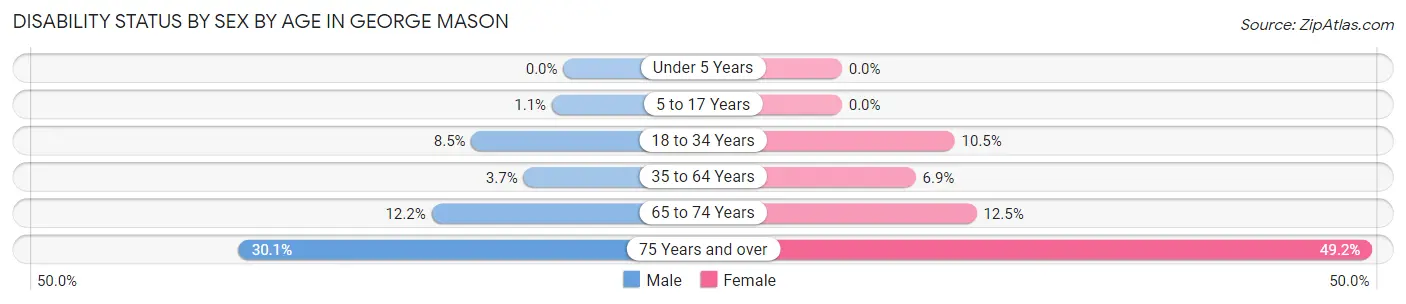
| Age Bracket | Male | Female |
| Under 5 Years | 0 (0.0%) | 0 (0.0%) |
| 5 to 17 Years | 5 (1.1%) | 0 (0.0%) |
| 18 to 34 Years | 239 (8.5%) | 301 (10.5%) |
| 35 to 64 Years | 41 (3.7%) | 81 (6.9%) |
| 65 to 74 Years | 30 (12.2%) | 28 (12.5%) |
| 75 Years and over | 25 (30.1%) | 63 (49.2%) |
Disability Class by Sex by Age in George Mason
Disability Class: Hearing Difficulty
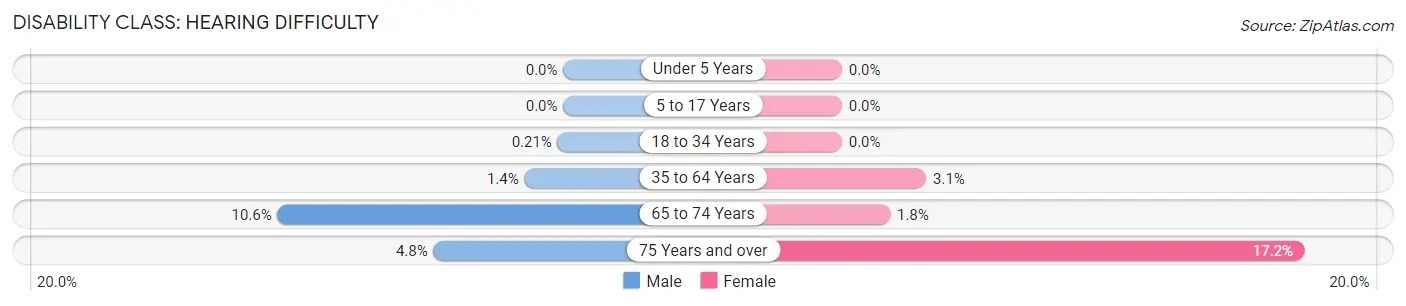
| Age Bracket | Male | Female |
| Under 5 Years | 0 (0.0%) | 0 (0.0%) |
| 5 to 17 Years | 0 (0.0%) | 0 (0.0%) |
| 18 to 34 Years | 6 (0.2%) | 0 (0.0%) |
| 35 to 64 Years | 16 (1.4%) | 37 (3.1%) |
| 65 to 74 Years | 26 (10.6%) | 4 (1.8%) |
| 75 Years and over | 4 (4.8%) | 22 (17.2%) |
Disability Class: Vision Difficulty
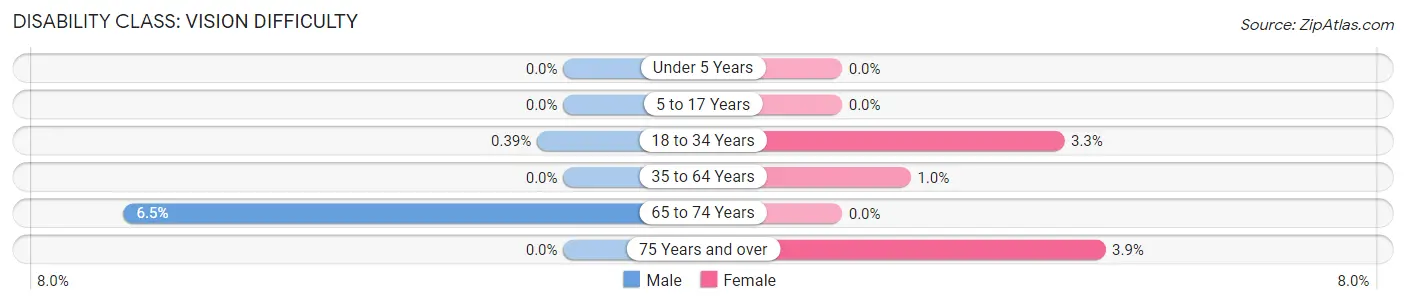
| Age Bracket | Male | Female |
| Under 5 Years | 0 (0.0%) | 0 (0.0%) |
| 5 to 17 Years | 0 (0.0%) | 0 (0.0%) |
| 18 to 34 Years | 11 (0.4%) | 95 (3.3%) |
| 35 to 64 Years | 0 (0.0%) | 12 (1.0%) |
| 65 to 74 Years | 16 (6.5%) | 0 (0.0%) |
| 75 Years and over | 0 (0.0%) | 5 (3.9%) |
Disability Class: Cognitive Difficulty
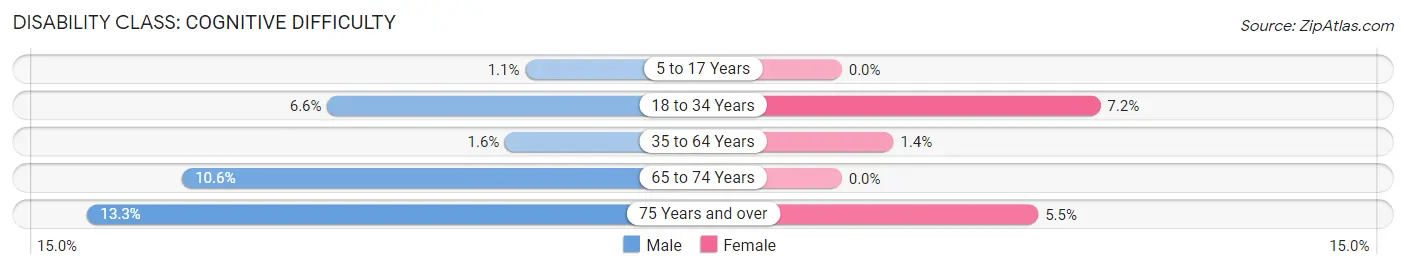
| Age Bracket | Male | Female |
| 5 to 17 Years | 5 (1.1%) | 0 (0.0%) |
| 18 to 34 Years | 184 (6.6%) | 207 (7.2%) |
| 35 to 64 Years | 18 (1.6%) | 17 (1.4%) |
| 65 to 74 Years | 26 (10.6%) | 0 (0.0%) |
| 75 Years and over | 11 (13.3%) | 7 (5.5%) |
Disability Class: Ambulatory Difficulty
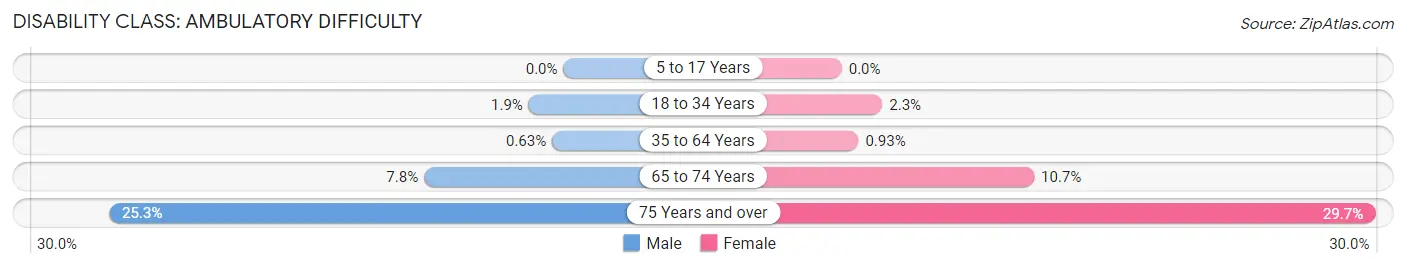
| Age Bracket | Male | Female |
| 5 to 17 Years | 0 (0.0%) | 0 (0.0%) |
| 18 to 34 Years | 54 (1.9%) | 65 (2.3%) |
| 35 to 64 Years | 7 (0.6%) | 11 (0.9%) |
| 65 to 74 Years | 19 (7.8%) | 24 (10.7%) |
| 75 Years and over | 21 (25.3%) | 38 (29.7%) |
Disability Class: Self-Care Difficulty
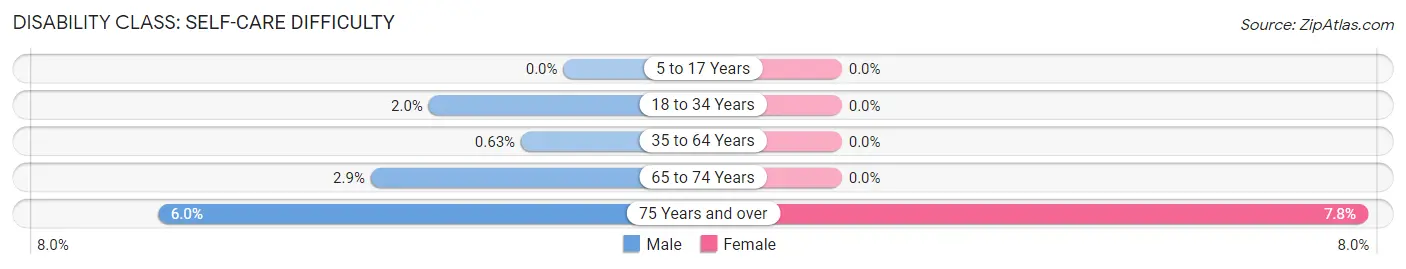
| Age Bracket | Male | Female |
| 5 to 17 Years | 0 (0.0%) | 0 (0.0%) |
| 18 to 34 Years | 56 (2.0%) | 0 (0.0%) |
| 35 to 64 Years | 7 (0.6%) | 0 (0.0%) |
| 65 to 74 Years | 7 (2.9%) | 0 (0.0%) |
| 75 Years and over | 5 (6.0%) | 10 (7.8%) |
Technology Access in George Mason
Computing Device Access in George Mason
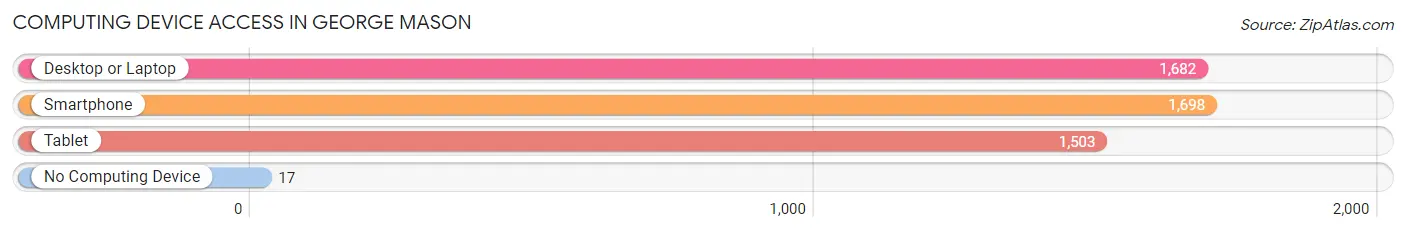
| Device Type | # Households | % Households |
| Desktop or Laptop | 1,682 | 95.8% |
| Smartphone | 1,698 | 96.8% |
| Tablet | 1,503 | 85.6% |
| No Computing Device | 17 | 1.0% |
| Total | 1,755 | 100.0% |
Internet Access in George Mason
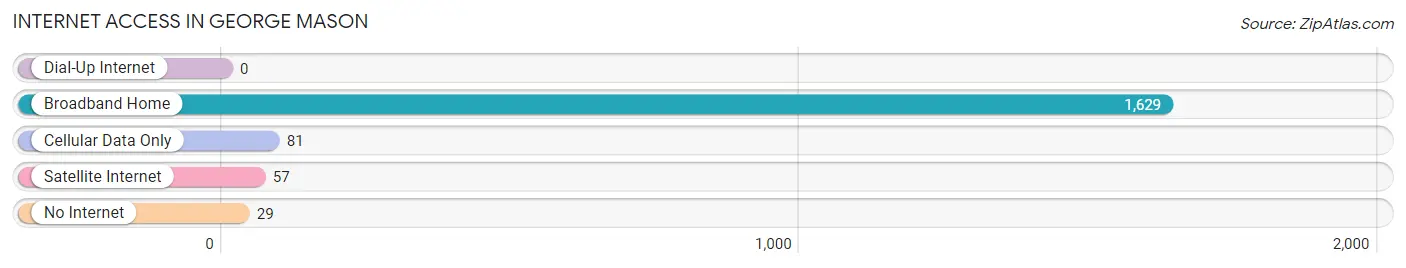
| Internet Type | # Households | % Households |
| Dial-Up Internet | 0 | 0.0% |
| Broadband Home | 1,629 | 92.8% |
| Cellular Data Only | 81 | 4.6% |
| Satellite Internet | 57 | 3.3% |
| No Internet | 29 | 1.7% |
| Total | 1,755 | 100.0% |
George Mason Summary
History
George Mason University (GMU) is a public research university located in Fairfax, Virginia. It was founded in 1957 as a branch of the University of Virginia and named after George Mason, a Founding Father of the United States. GMU is the largest public research university in the Commonwealth of Virginia and the largest university in Northern Virginia.
The university was established in 1957 as a branch of the University of Virginia. The Fairfax campus was originally part of the University of Virginia's College of Arts and Sciences, but it was separated from the university in 1972 and became an independent institution. The university has grown significantly since then, and now offers more than 200 degree programs in a variety of disciplines.
Geography
George Mason University is located in Fairfax, Virginia, a suburb of Washington, D.C. The university is situated on 677 acres of land in the heart of Northern Virginia. The campus is located just off of Interstate 66 and is easily accessible from the Washington, D.C. metropolitan area.
The university is located in a suburban area, but it is close to many of the attractions of Washington, D.C. The university is just a short drive away from the Smithsonian Institution, the National Mall, and the White House.
Economy
George Mason University is a major economic engine for the region. The university has an annual economic impact of more than $2 billion, and it is one of the largest employers in Fairfax County. The university employs more than 5,000 people, and it is estimated that more than 30,000 people are employed in jobs related to the university.
The university also has a significant impact on the local economy through its research and development activities. GMU is home to several research centers and institutes, including the Center for the Study of Public Choice, the Center for the Study of International Migration, and the Center for the Study of Terrorism and Political Violence.
Demographics
George Mason University is a diverse and inclusive institution. The university has a student body of more than 33,000 students, and the student body is composed of students from all 50 states and more than 130 countries. The university also has a faculty and staff of more than 5,000 people.
The university is also home to a diverse student body. The student body is composed of students from a variety of racial and ethnic backgrounds, and the university is committed to creating an inclusive and welcoming environment for all students. The university also has a number of student organizations that promote diversity and inclusion on campus.
Common Questions
What is Per Capita Income in George Mason?
Per Capita income in George Mason is $31,613.
What is the Median Family Income in George Mason?
Median Family Income in George Mason is $175,455.
What is the Median Household income in George Mason?
Median Household Income in George Mason is $146,985.
What is Income or Wage Gap in George Mason?
Income or Wage Gap in George Mason is 60.7%.
Women in George Mason earn 39.3 cents for every dollar earned by a man.
What is Family Income Deficit in George Mason?
Family Income Deficit in George Mason is $15,030.
Families that are below poverty line in George Mason earn $15,030 less on average than the poverty threshold level.
What is Inequality or Gini Index in George Mason?
Inequality or Gini Index in George Mason is 0.37.
What is the Total Population of George Mason?
Total Population of George Mason is 10,017.
What is the Total Male Population of George Mason?
Total Male Population of George Mason is 4,884.
What is the Total Female Population of George Mason?
Total Female Population of George Mason is 5,133.
What is the Ratio of Males per 100 Females in George Mason?
There are 95.15 Males per 100 Females in George Mason.
What is the Ratio of Females per 100 Males in George Mason?
There are 105.10 Females per 100 Males in George Mason.
What is the Median Population Age in George Mason?
Median Population Age in George Mason is 20.9 Years.
What is the Average Family Size in George Mason
Average Family Size in George Mason is 3.4 People.
What is the Average Household Size in George Mason
Average Household Size in George Mason is 3.0 People.
How Large is the Labor Force in George Mason?
There are 4,786 People in the Labor Forcein in George Mason.
What is the Percentage of People in the Labor Force in George Mason?
54.1% of People are in the Labor Force in George Mason.
What is the Unemployment Rate in George Mason?
Unemployment Rate in George Mason is 11.9%.