Zip Codes with the Highest Percentage of Population Employed in Architecture & Engineering in Abingdon, VA
RELATED REPORTS & OPTIONS
Architecture & Engineering
Abingdon
Compare Zip Codes
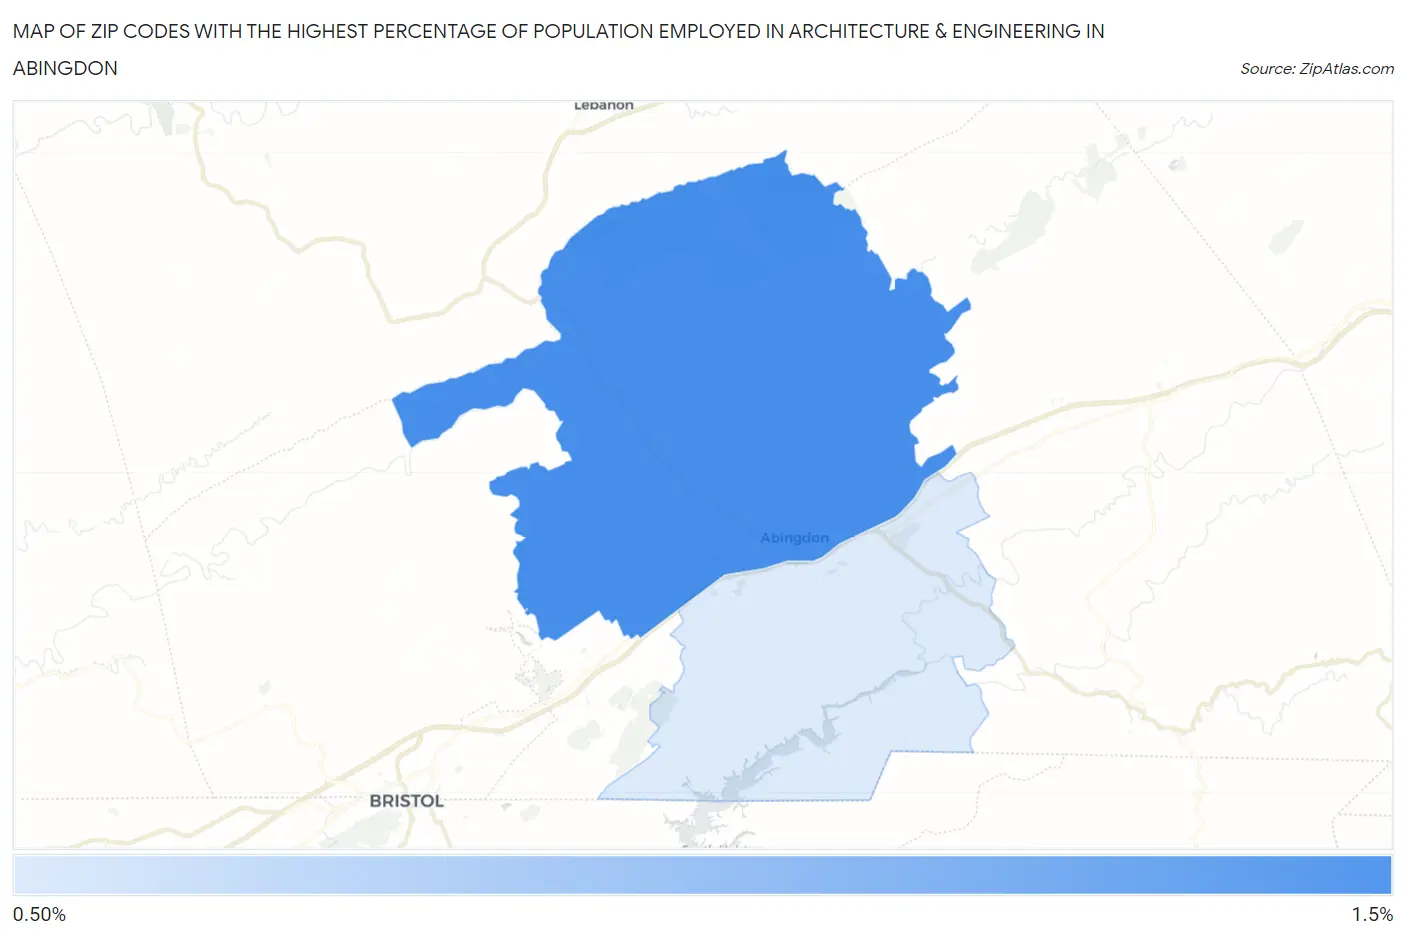
Map of Zip Codes with the Highest Percentage of Population Employed in Architecture & Engineering in Abingdon
0.91%
1.1%
Zip Codes with the Highest Percentage of Population Employed in Architecture & Engineering in Abingdon, VA
| Zip Code | % Employed | vs State | vs National | |
| 1. | 24210 | 1.1% | 2.3%(-1.19)#418 | 2.1%(-1.04)#15,740 |
| 2. | 24211 | 0.91% | 2.3%(-1.40)#461 | 2.1%(-1.24)#17,304 |
1
Common Questions
What are the Top Zip Codes with the Highest Percentage of Population Employed in Architecture & Engineering in Abingdon, VA?
Top Zip Codes with the Highest Percentage of Population Employed in Architecture & Engineering in Abingdon, VA are:
What zip code has the Highest Percentage of Population Employed in Architecture & Engineering in Abingdon, VA?
24210 has the Highest Percentage of Population Employed in Architecture & Engineering in Abingdon, VA with 1.1%.
What is the Percentage of Population Employed in Architecture & Engineering in Abingdon, VA?
Percentage of Population Employed in Architecture & Engineering in Abingdon is 2.1%.
What is the Percentage of Population Employed in Architecture & Engineering in Virginia?
Percentage of Population Employed in Architecture & Engineering in Virginia is 2.3%.
What is the Percentage of Population Employed in Architecture & Engineering in the United States?
Percentage of Population Employed in Architecture & Engineering in the United States is 2.1%.