Zip Codes with the Highest Percentage of Population Employed in Architecture & Engineering in Harrisonburg, VA
RELATED REPORTS & OPTIONS
Architecture & Engineering
Harrisonburg
Compare Zip Codes
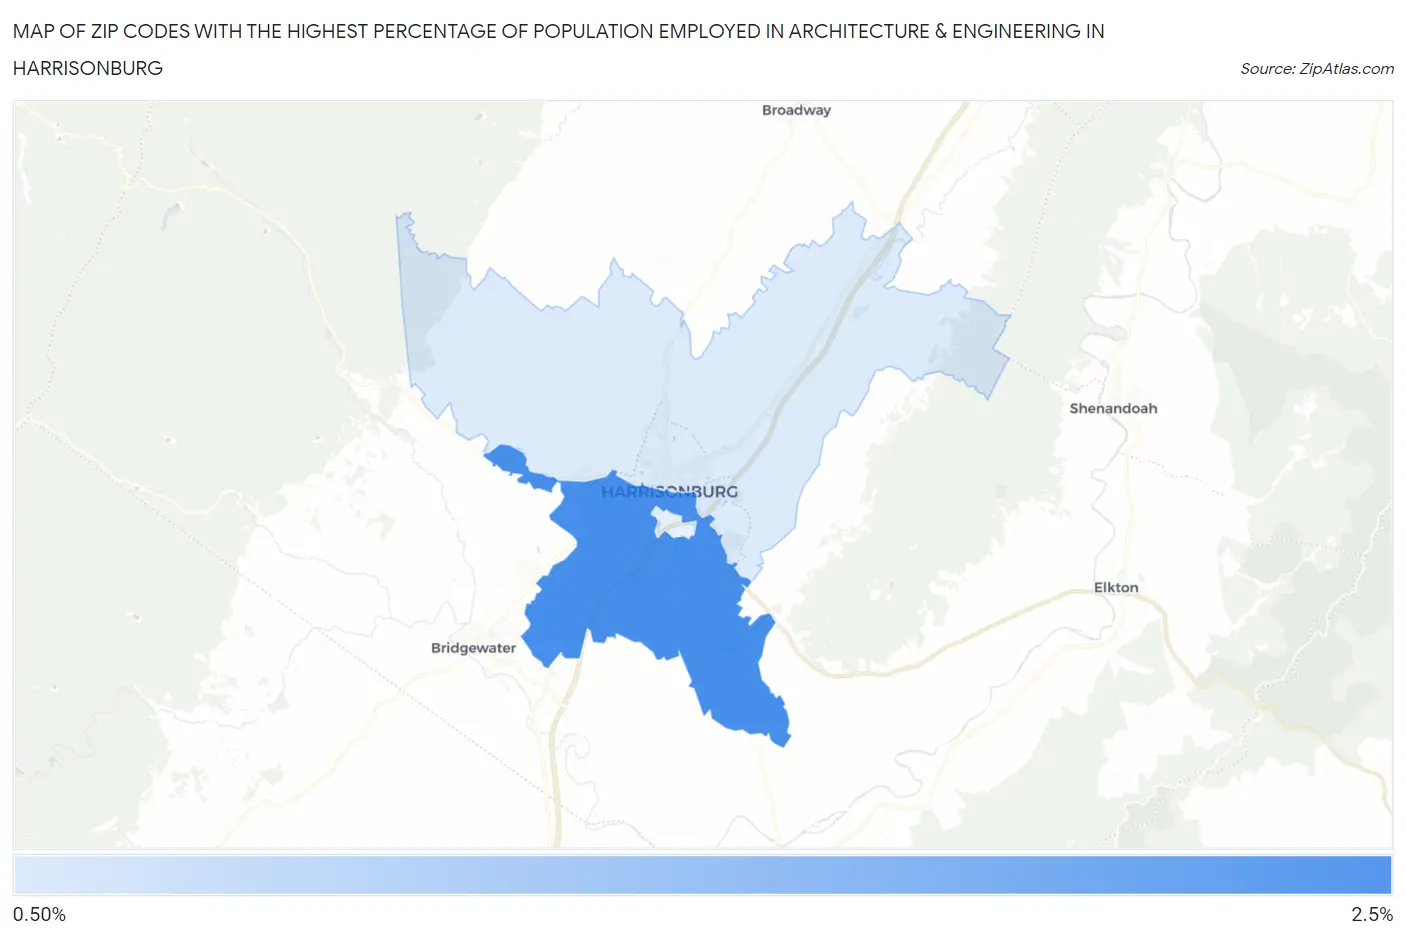
Map of Zip Codes with the Highest Percentage of Population Employed in Architecture & Engineering in Harrisonburg
1.5%
2.2%
Zip Codes with the Highest Percentage of Population Employed in Architecture & Engineering in Harrisonburg, VA
| Zip Code | % Employed | vs State | vs National | |
| 1. | 22801 | 2.2% | 2.3%(-0.152)#250 | 2.1%(+0.003)#8,741 |
| 2. | 22802 | 1.5% | 2.3%(-0.807)#361 | 2.1%(-0.651)#12,900 |
1
Common Questions
What are the Top Zip Codes with the Highest Percentage of Population Employed in Architecture & Engineering in Harrisonburg, VA?
Top Zip Codes with the Highest Percentage of Population Employed in Architecture & Engineering in Harrisonburg, VA are:
What zip code has the Highest Percentage of Population Employed in Architecture & Engineering in Harrisonburg, VA?
22801 has the Highest Percentage of Population Employed in Architecture & Engineering in Harrisonburg, VA with 2.2%.
What is the Percentage of Population Employed in Architecture & Engineering in Harrisonburg, VA?
Percentage of Population Employed in Architecture & Engineering in Harrisonburg is 1.8%.
What is the Percentage of Population Employed in Architecture & Engineering in Virginia?
Percentage of Population Employed in Architecture & Engineering in Virginia is 2.3%.
What is the Percentage of Population Employed in Architecture & Engineering in the United States?
Percentage of Population Employed in Architecture & Engineering in the United States is 2.1%.