King George, VA Map & Demographics
King George Map
King George Overview
$33,254
PER CAPITA INCOME
$82,049
AVG FAMILY INCOME
$83,750
AVG HOUSEHOLD INCOME
46.2%
WAGE / INCOME GAP [ % ]
53.8¢/ $1
WAGE / INCOME GAP [ $ ]
0.38
INEQUALITY / GINI INDEX
4,826
TOTAL POPULATION
2,408
MALE POPULATION
2,418
FEMALE POPULATION
99.59
MALES / 100 FEMALES
100.42
FEMALES / 100 MALES
35.1
MEDIAN AGE
3.4
AVG FAMILY SIZE
3.0
AVG HOUSEHOLD SIZE
2,128
LABOR FORCE [ PEOPLE ]
61.1%
PERCENT IN LABOR FORCE
3.5%
UNEMPLOYMENT RATE
King George Zip Codes
King George Area Codes
Income in King George
Income Overview in King George
Per Capita Income in King George is $33,254, while median incomes of families and households are $82,049 and $83,750 respectively.
| Characteristic | Number | Measure |
| Per Capita Income | 4,826 | $33,254 |
| Median Family Income | 1,261 | $82,049 |
| Mean Family Income | 1,261 | $100,603 |
| Median Household Income | 1,558 | $83,750 |
| Mean Household Income | 1,558 | $99,775 |
| Income Deficit | 1,261 | $0 |
| Wage / Income Gap (%) | 4,826 | 46.24% |
| Wage / Income Gap ($) | 4,826 | 53.76¢ per $1 |
| Gini / Inequality Index | 4,826 | 0.38 |
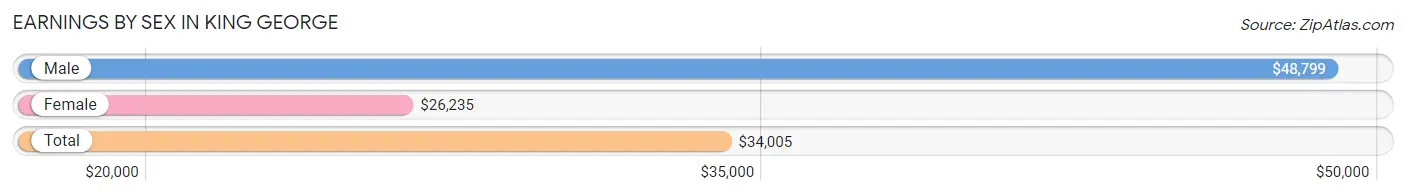
Earnings by Sex in King George
Average Earnings in King George are $34,005, $48,799 for men and $26,235 for women, a difference of 46.2%.
| Sex | Number | Average Earnings |
| Male | 1,161 (49.7%) | $48,799 |
| Female | 1,177 (50.3%) | $26,235 |
| Total | 2,338 (100.0%) | $34,005 |
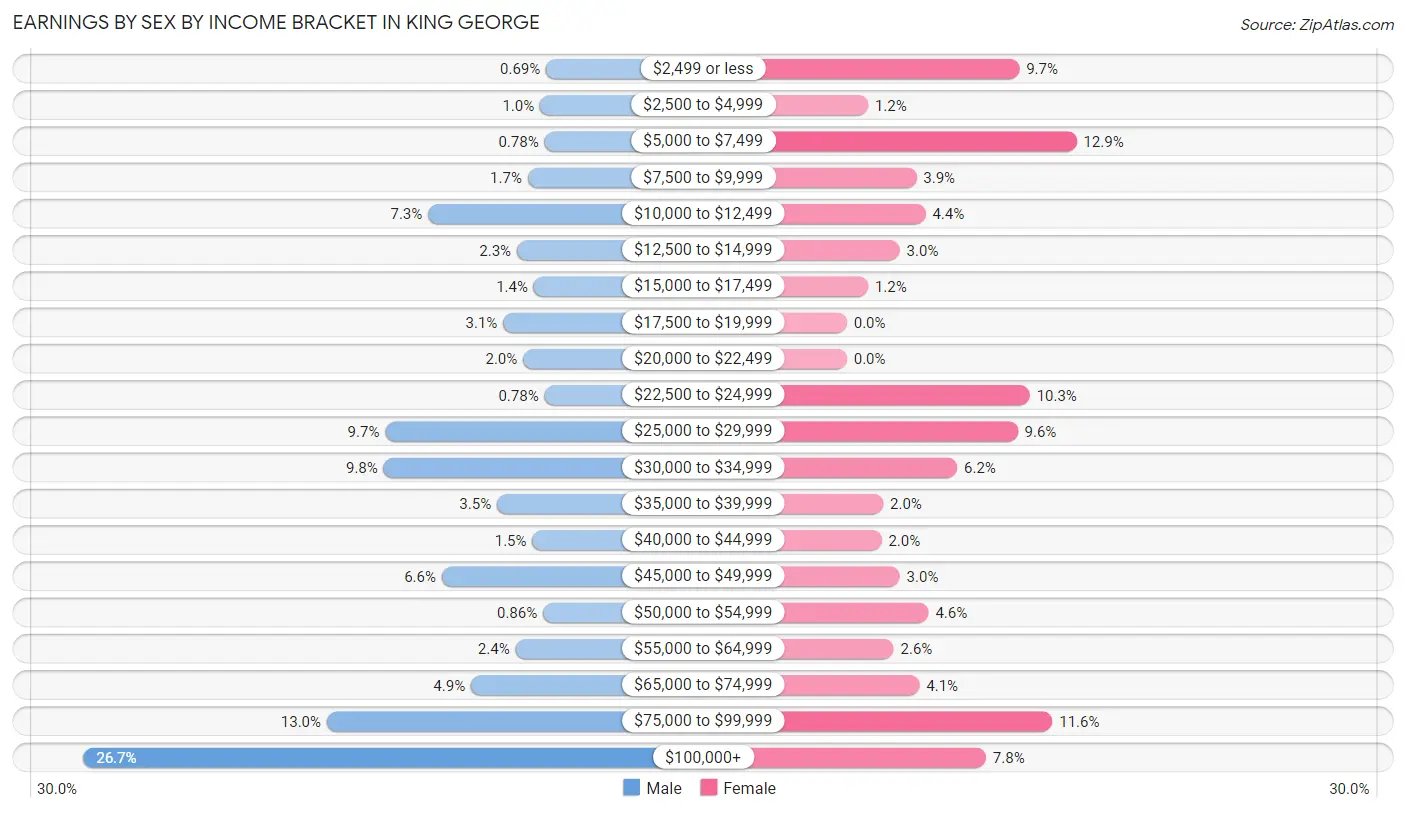
Earnings by Sex by Income Bracket in King George
The most common earnings brackets in King George are $100,000+ for men (310 | 26.7%) and $5,000 to $7,499 for women (152 | 12.9%).
| Income | Male | Female |
| $2,499 or less | 8 (0.7%) | 114 (9.7%) |
| $2,500 to $4,999 | 12 (1.0%) | 14 (1.2%) |
| $5,000 to $7,499 | 9 (0.8%) | 152 (12.9%) |
| $7,500 to $9,999 | 20 (1.7%) | 46 (3.9%) |
| $10,000 to $12,499 | 85 (7.3%) | 52 (4.4%) |
| $12,500 to $14,999 | 27 (2.3%) | 35 (3.0%) |
| $15,000 to $17,499 | 16 (1.4%) | 14 (1.2%) |
| $17,500 to $19,999 | 36 (3.1%) | 0 (0.0%) |
| $20,000 to $22,499 | 23 (2.0%) | 0 (0.0%) |
| $22,500 to $24,999 | 9 (0.8%) | 121 (10.3%) |
| $25,000 to $29,999 | 113 (9.7%) | 113 (9.6%) |
| $30,000 to $34,999 | 114 (9.8%) | 73 (6.2%) |
| $35,000 to $39,999 | 40 (3.5%) | 24 (2.0%) |
| $40,000 to $44,999 | 17 (1.5%) | 23 (1.9%) |
| $45,000 to $49,999 | 76 (6.6%) | 35 (3.0%) |
| $50,000 to $54,999 | 10 (0.9%) | 54 (4.6%) |
| $55,000 to $64,999 | 28 (2.4%) | 31 (2.6%) |
| $65,000 to $74,999 | 57 (4.9%) | 48 (4.1%) |
| $75,000 to $99,999 | 151 (13.0%) | 136 (11.6%) |
| $100,000+ | 310 (26.7%) | 92 (7.8%) |
| Total | 1,161 (100.0%) | 1,177 (100.0%) |
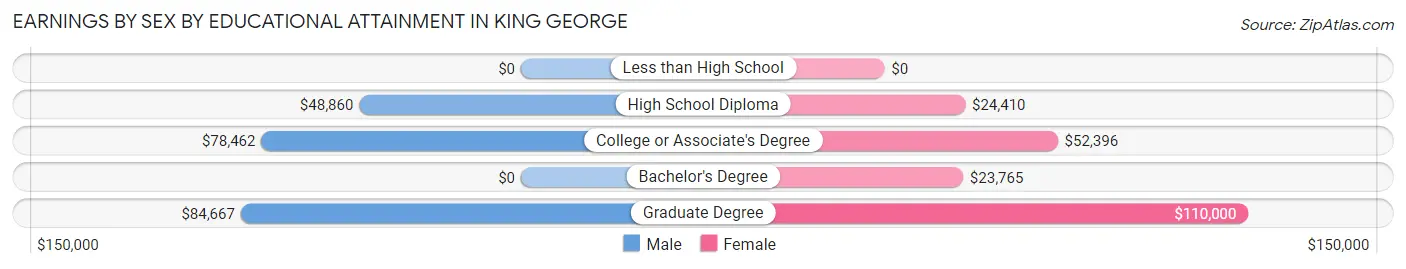
Earnings by Sex by Educational Attainment in King George
Average earnings in King George are $70,053 for men and $28,669 for women, a difference of 59.1%. Men with an educational attainment of graduate degree enjoy the highest average annual earnings of $84,667, while those with high school diploma education earn the least with $48,860. Women with an educational attainment of graduate degree earn the most with the average annual earnings of $110,000, while those with bachelor's degree education have the smallest earnings of $23,765.
| Educational Attainment | Male Income | Female Income |
| Less than High School | - | - |
| High School Diploma | $48,860 | $24,410 |
| College or Associate's Degree | $78,462 | $52,396 |
| Bachelor's Degree | - | - |
| Graduate Degree | $84,667 | $110,000 |
| Total | $70,053 | $28,669 |
Family Income in King George
Family Income Brackets in King George
According to the King George family income data, there are 267 families falling into the $100,000 to $149,999 income range, which is the most common income bracket and makes up 21.2% of all families. Conversely, the $15,000 to $24,999 income bracket is the least frequent group with only 20 families (1.6%) belonging to this category.
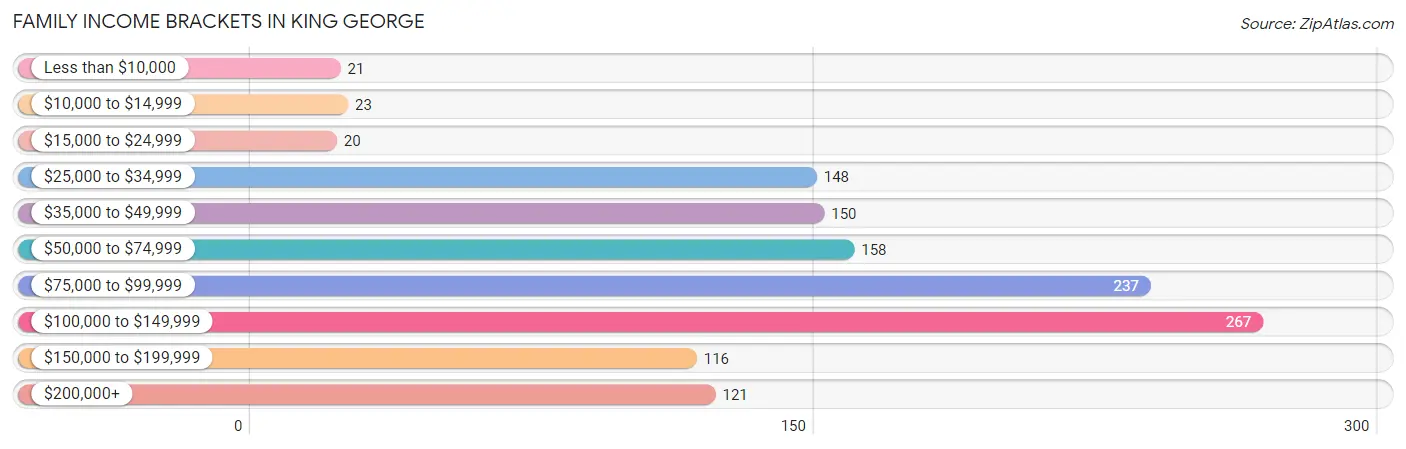
| Income Bracket | # Families | % Families |
| Less than $10,000 | 21 | 1.7% |
| $10,000 to $14,999 | 23 | 1.8% |
| $15,000 to $24,999 | 20 | 1.6% |
| $25,000 to $34,999 | 148 | 11.7% |
| $35,000 to $49,999 | 150 | 11.9% |
| $50,000 to $74,999 | 158 | 12.5% |
| $75,000 to $99,999 | 237 | 18.8% |
| $100,000 to $149,999 | 267 | 21.2% |
| $150,000 to $199,999 | 116 | 9.2% |
| $200,000+ | 121 | 9.6% |
Family Income by Famaliy Size in King George
6-person families (74 | 5.9%) account for the highest median family income in King George with $96,968 per family, while 2-person families (595 | 47.2%) have the highest median income of $31,451 per family member.
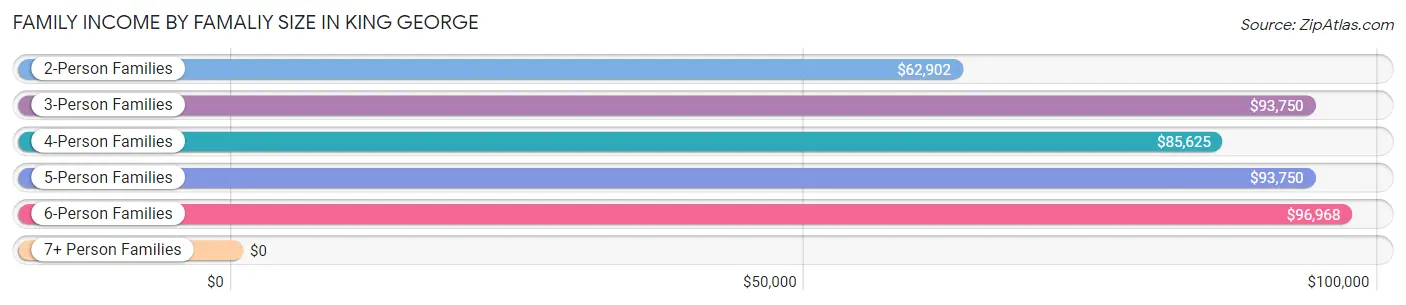
| Income Bracket | # Families | Median Income |
| 2-Person Families | 595 (47.2%) | $62,902 |
| 3-Person Families | 220 (17.4%) | $93,750 |
| 4-Person Families | 175 (13.9%) | $85,625 |
| 5-Person Families | 151 (12.0%) | $93,750 |
| 6-Person Families | 74 (5.9%) | $96,968 |
| 7+ Person Families | 46 (3.6%) | $0 |
| Total | 1,261 (100.0%) | $82,049 |
Family Income by Number of Earners in King George
The median family income in King George is $82,049, with families comprising 3+ earners (168) having the highest median family income of $112,750, while families with no earners (152) have the lowest median family income of $34,318, accounting for 13.3% and 12.0% of families, respectively.
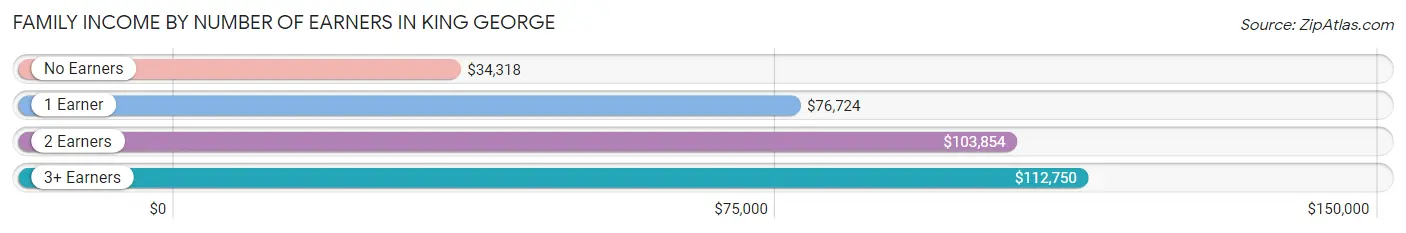
| Number of Earners | # Families | Median Income |
| No Earners | 152 (12.0%) | $34,318 |
| 1 Earner | 452 (35.8%) | $76,724 |
| 2 Earners | 489 (38.8%) | $103,854 |
| 3+ Earners | 168 (13.3%) | $112,750 |
| Total | 1,261 (100.0%) | $82,049 |
Household Income in King George
Household Income Brackets in King George
With 337 households falling in the category, the $100,000 to $149,999 income range is the most frequent in King George, accounting for 21.6% of all households. In contrast, only 20 households (1.3%) fall into the $15,000 to $24,999 income bracket, making it the least populous group.
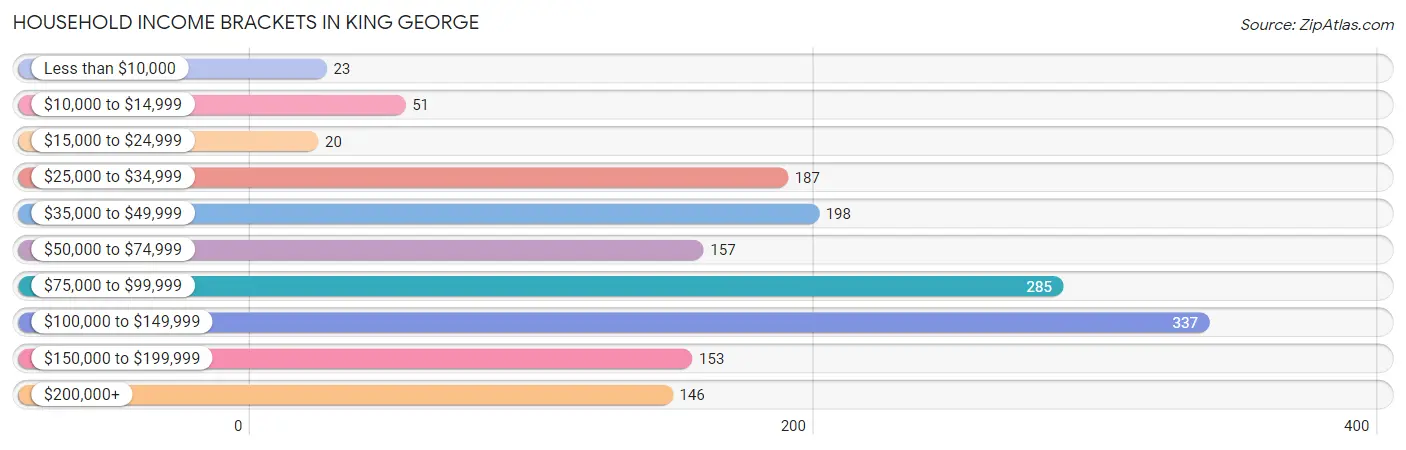
| Income Bracket | # Households | % Households |
| Less than $10,000 | 23 | 1.5% |
| $10,000 to $14,999 | 51 | 3.3% |
| $15,000 to $24,999 | 20 | 1.3% |
| $25,000 to $34,999 | 187 | 12.0% |
| $35,000 to $49,999 | 198 | 12.7% |
| $50,000 to $74,999 | 157 | 10.1% |
| $75,000 to $99,999 | 285 | 18.3% |
| $100,000 to $149,999 | 337 | 21.6% |
| $150,000 to $199,999 | 153 | 9.8% |
| $200,000+ | 146 | 9.4% |
Household Income by Householder Age in King George
The median household income in King George is $83,750, with the highest median household income of $97,181 found in the 45 to 64 years age bracket for the primary householder. A total of 566 households (36.3%) fall into this category. Meanwhile, the 15 to 24 years age bracket for the primary householder has the lowest median household income of $0, with 10 households (0.6%) in this group.
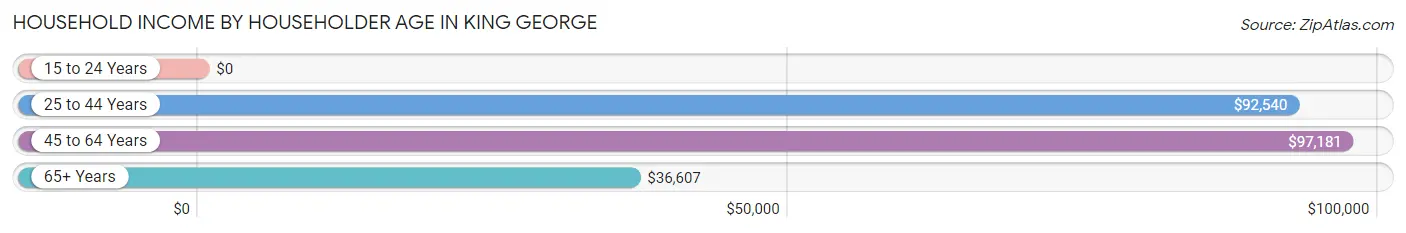
| Income Bracket | # Households | Median Income |
| 15 to 24 Years | 10 (0.6%) | $0 |
| 25 to 44 Years | 609 (39.1%) | $92,540 |
| 45 to 64 Years | 566 (36.3%) | $97,181 |
| 65+ Years | 373 (23.9%) | $36,607 |
| Total | 1,558 (100.0%) | $83,750 |
Poverty in King George
Income Below Poverty by Sex and Age in King George
With 4.9% poverty level for males and 7.1% for females among the residents of King George, 75 year old and over males and 5 year old females are the most vulnerable to poverty, with 17 males (27.9%) and 10 females (37.0%) in their respective age groups living below the poverty level.
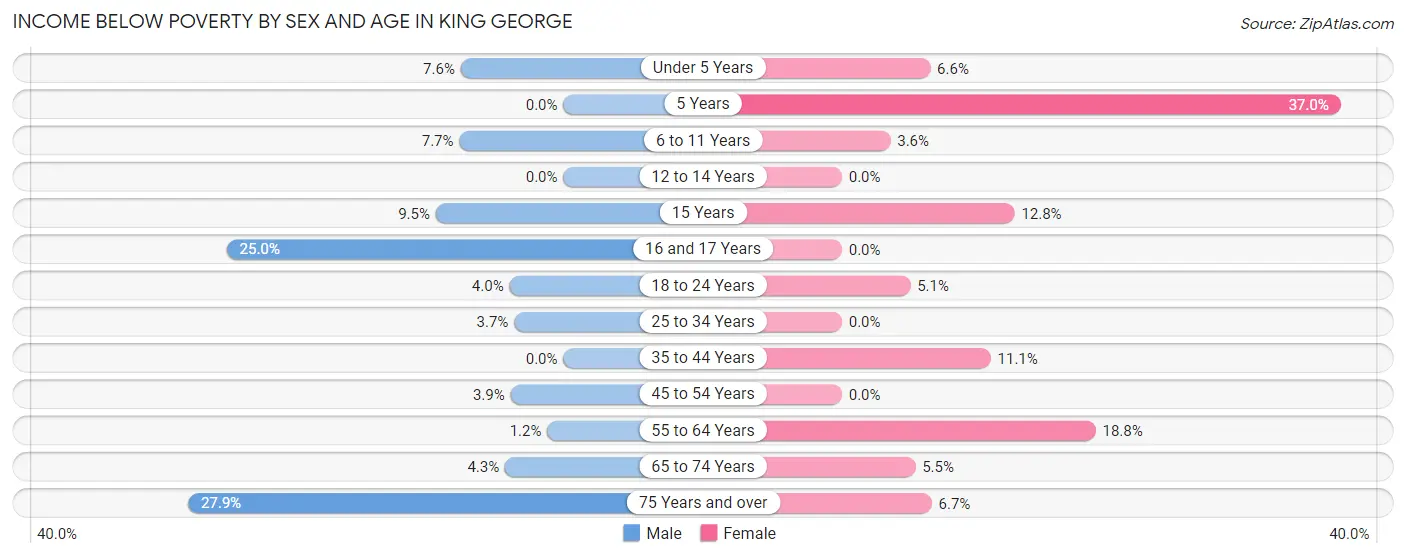
| Age Bracket | Male | Female |
| Under 5 Years | 16 (7.6%) | 12 (6.6%) |
| 5 Years | 0 (0.0%) | 10 (37.0%) |
| 6 to 11 Years | 19 (7.7%) | 10 (3.6%) |
| 12 to 14 Years | 0 (0.0%) | 0 (0.0%) |
| 15 Years | 9 (9.5%) | 10 (12.8%) |
| 16 and 17 Years | 10 (25.0%) | 0 (0.0%) |
| 18 to 24 Years | 8 (4.0%) | 10 (5.1%) |
| 25 to 34 Years | 11 (3.6%) | 0 (0.0%) |
| 35 to 44 Years | 0 (0.0%) | 41 (11.1%) |
| 45 to 54 Years | 10 (3.9%) | 0 (0.0%) |
| 55 to 64 Years | 3 (1.2%) | 55 (18.8%) |
| 65 to 74 Years | 12 (4.3%) | 11 (5.4%) |
| 75 Years and over | 17 (27.9%) | 8 (6.7%) |
| Total | 115 (4.9%) | 167 (7.1%) |
Income Above Poverty by Sex and Age in King George
According to the poverty statistics in King George, males aged 5 years and females aged 12 to 14 years are the age groups that are most secure financially, with 100.0% of males and 100.0% of females in these age groups living above the poverty line.
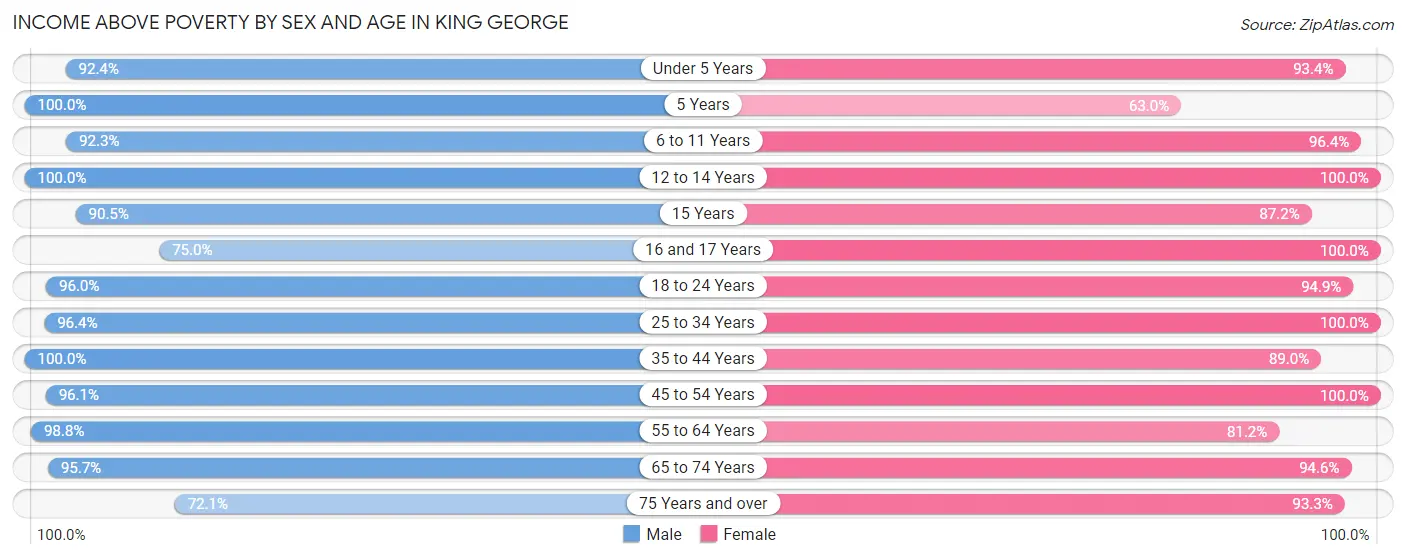
| Age Bracket | Male | Female |
| Under 5 Years | 194 (92.4%) | 171 (93.4%) |
| 5 Years | 62 (100.0%) | 17 (63.0%) |
| 6 to 11 Years | 227 (92.3%) | 268 (96.4%) |
| 12 to 14 Years | 116 (100.0%) | 49 (100.0%) |
| 15 Years | 86 (90.5%) | 68 (87.2%) |
| 16 and 17 Years | 30 (75.0%) | 35 (100.0%) |
| 18 to 24 Years | 192 (96.0%) | 187 (94.9%) |
| 25 to 34 Years | 290 (96.4%) | 290 (100.0%) |
| 35 to 44 Years | 244 (100.0%) | 330 (88.9%) |
| 45 to 54 Years | 245 (96.1%) | 231 (100.0%) |
| 55 to 64 Years | 249 (98.8%) | 237 (81.2%) |
| 65 to 74 Years | 265 (95.7%) | 191 (94.6%) |
| 75 Years and over | 44 (72.1%) | 112 (93.3%) |
| Total | 2,244 (95.1%) | 2,186 (92.9%) |
Income Below Poverty Among Married-Couple Families in King George
The poverty statistics for married-couple families in King George show that 3.5% or 33 of the total 942 families live below the poverty line. Families with 5 or more children have the highest poverty rate of 21.7%, comprising of 10 families. On the other hand, families with 1 or 2 children have the lowest poverty rate of 0.0%, which includes 0 families.
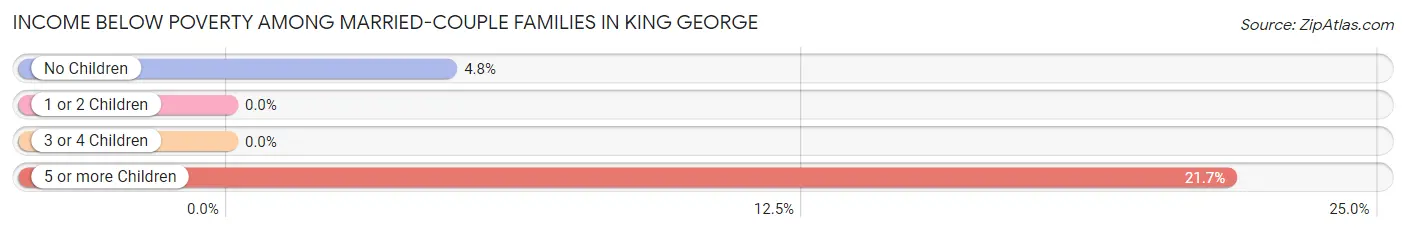
| Children | Above Poverty | Below Poverty |
| No Children | 459 (95.2%) | 23 (4.8%) |
| 1 or 2 Children | 299 (100.0%) | 0 (0.0%) |
| 3 or 4 Children | 115 (100.0%) | 0 (0.0%) |
| 5 or more Children | 36 (78.3%) | 10 (21.7%) |
| Total | 909 (96.5%) | 33 (3.5%) |
Income Below Poverty Among Single-Parent Households in King George
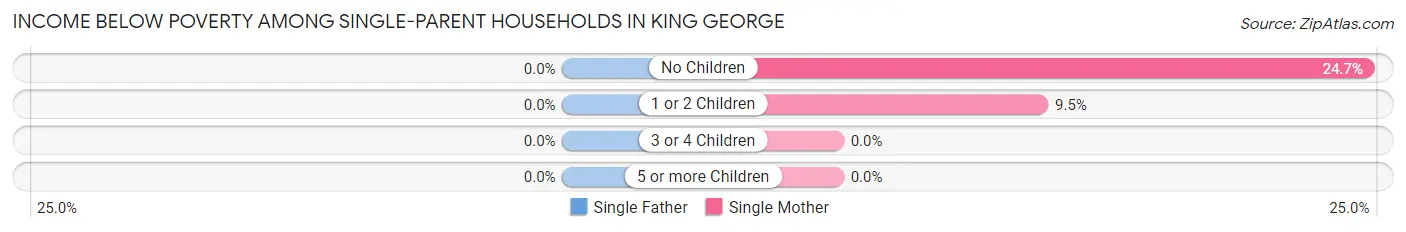
| Children | Single Father | Single Mother |
| No Children | 0 (0.0%) | 23 (24.7%) |
| 1 or 2 Children | 0 (0.0%) | 10 (9.5%) |
| 3 or 4 Children | 0 (0.0%) | 0 (0.0%) |
| 5 or more Children | 0 (0.0%) | 0 (0.0%) |
| Total | 0 (0.0%) | 33 (16.0%) |
Income Below Poverty Among Married-Couple vs Single-Parent Households in King George
The poverty data for King George shows that 33 of the married-couple family households (3.5%) and 33 of the single-parent households (10.3%) are living below the poverty level. Within the married-couple family households, those with 5 or more children have the highest poverty rate, with 10 households (21.7%) falling below the poverty line. Among the single-parent households, those with no children have the highest poverty rate, with 23 household (11.8%) living below poverty.
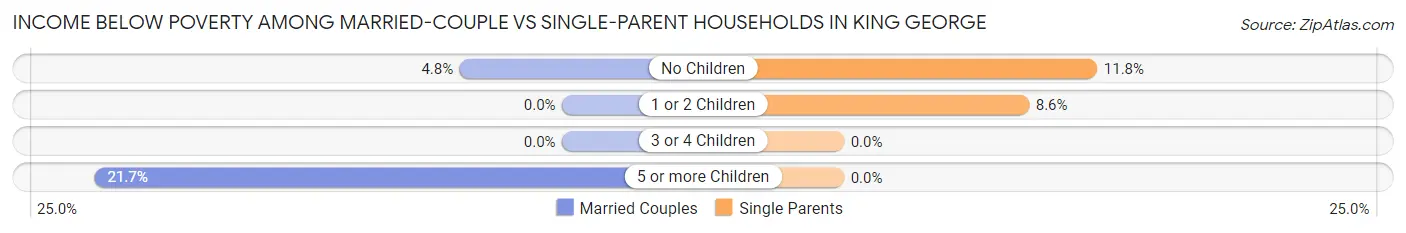
| Children | Married-Couple Families | Single-Parent Households |
| No Children | 23 (4.8%) | 23 (11.8%) |
| 1 or 2 Children | 0 (0.0%) | 10 (8.6%) |
| 3 or 4 Children | 0 (0.0%) | 0 (0.0%) |
| 5 or more Children | 10 (21.7%) | 0 (0.0%) |
| Total | 33 (3.5%) | 33 (10.3%) |
Race in King George
The most populous races in King George are White / Caucasian (3,166 | 65.6%), Black / African American (1,105 | 22.9%), and Some other Race (389 | 8.1%).
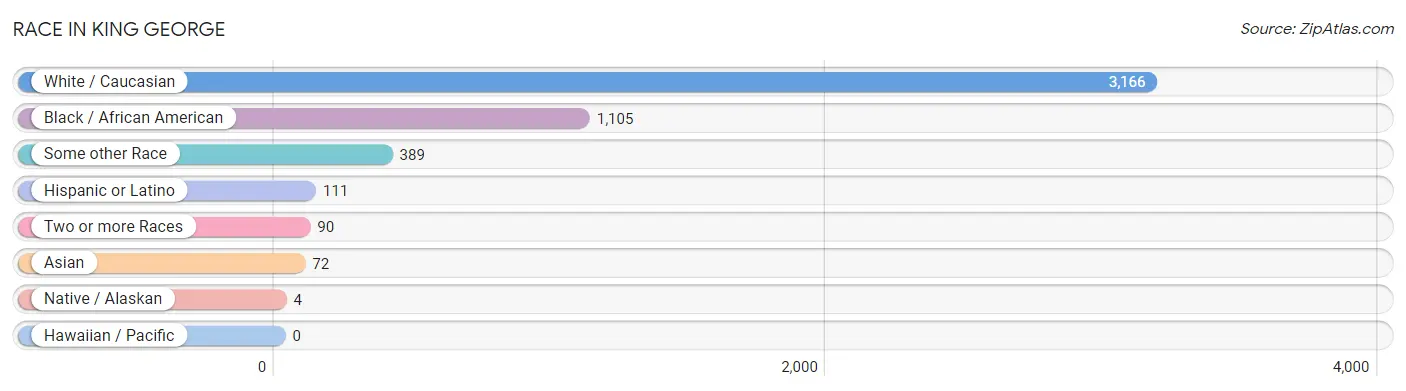
| Race | # Population | % Population |
| Asian | 72 | 1.5% |
| Black / African American | 1,105 | 22.9% |
| Hawaiian / Pacific | 0 | 0.0% |
| Hispanic or Latino | 111 | 2.3% |
| Native / Alaskan | 4 | 0.1% |
| White / Caucasian | 3,166 | 65.6% |
| Two or more Races | 90 | 1.9% |
| Some other Race | 389 | 8.1% |
| Total | 4,826 | 100.0% |
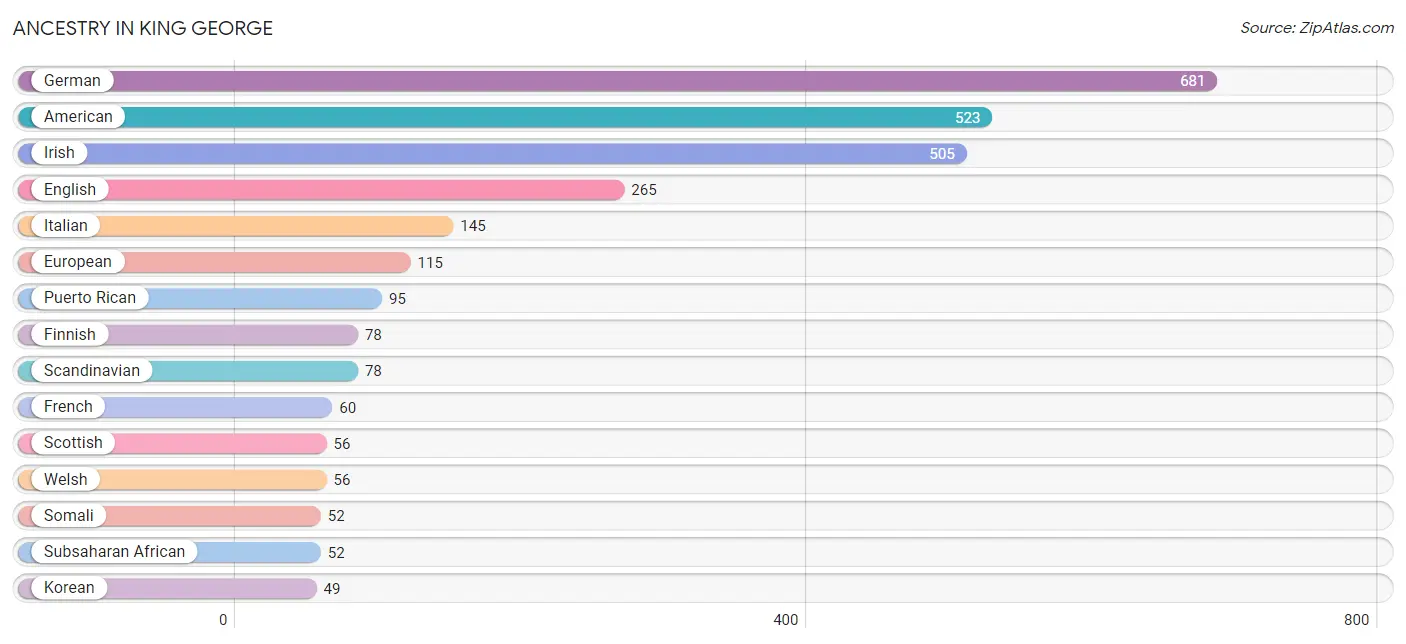
Ancestry in King George
The most populous ancestries reported in King George are German (681 | 14.1%), American (523 | 10.8%), Irish (505 | 10.5%), English (265 | 5.5%), and Italian (145 | 3.0%), together accounting for 43.9% of all King George residents.
| Ancestry | # Population | % Population |
| American | 523 | 10.8% |
| Austrian | 17 | 0.4% |
| British West Indian | 7 | 0.2% |
| Burmese | 22 | 0.5% |
| Cherokee | 7 | 0.2% |
| Danish | 23 | 0.5% |
| Dutch | 41 | 0.9% |
| Eastern European | 23 | 0.5% |
| English | 265 | 5.5% |
| European | 115 | 2.4% |
| Finnish | 78 | 1.6% |
| French | 60 | 1.2% |
| German | 681 | 14.1% |
| Greek | 27 | 0.6% |
| Hungarian | 20 | 0.4% |
| Irish | 505 | 10.5% |
| Italian | 145 | 3.0% |
| Korean | 49 | 1.0% |
| Mexican | 16 | 0.3% |
| Norwegian | 11 | 0.2% |
| Polish | 35 | 0.7% |
| Puerto Rican | 95 | 2.0% |
| Russian | 6 | 0.1% |
| Scandinavian | 78 | 1.6% |
| Scotch-Irish | 36 | 0.7% |
| Scottish | 56 | 1.2% |
| Sioux | 4 | 0.1% |
| Somali | 52 | 1.1% |
| Subsaharan African | 52 | 1.1% |
| Swedish | 18 | 0.4% |
| Thai | 12 | 0.3% |
| Ukrainian | 9 | 0.2% |
| Welsh | 56 | 1.2% |
| West Indian | 18 | 0.4% | View All 34 Rows |
Immigrants in King George
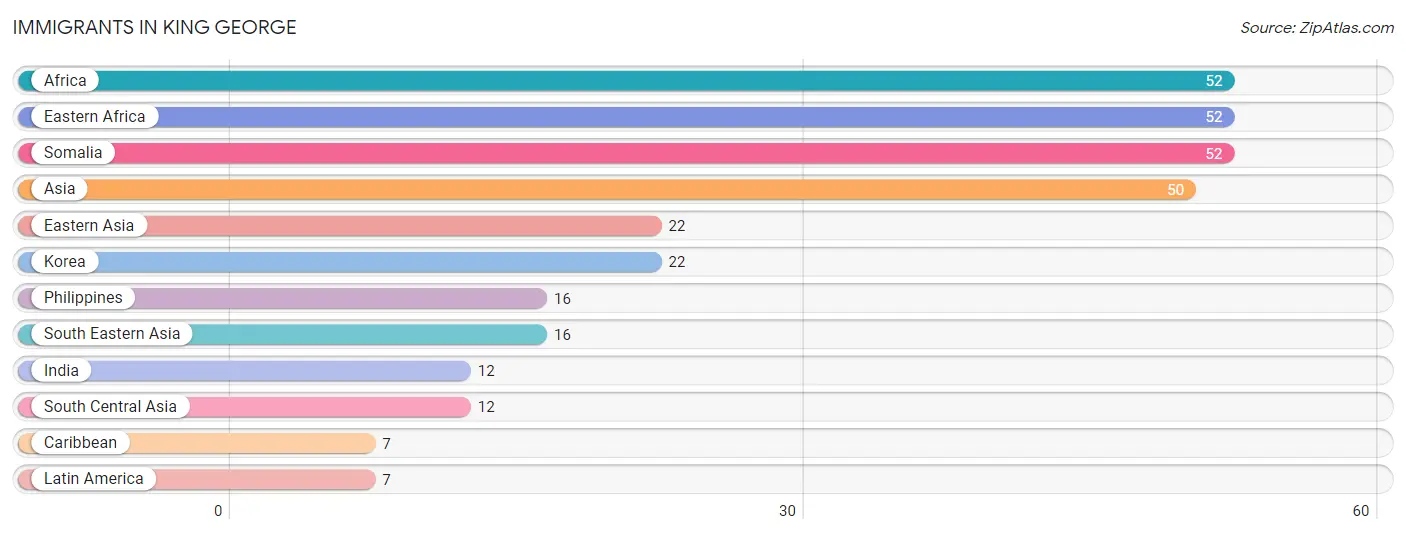
The most numerous immigrant groups reported in King George came from Africa (52 | 1.1%), Eastern Africa (52 | 1.1%), Somalia (52 | 1.1%), Asia (50 | 1.0%), and Eastern Asia (22 | 0.5%), together accounting for 4.7% of all King George residents.
| Immigration Origin | # Population | % Population |
| Africa | 52 | 1.1% |
| Asia | 50 | 1.0% |
| Caribbean | 7 | 0.2% |
| Eastern Africa | 52 | 1.1% |
| Eastern Asia | 22 | 0.5% |
| India | 12 | 0.3% |
| Korea | 22 | 0.5% |
| Latin America | 7 | 0.2% |
| Philippines | 16 | 0.3% |
| Somalia | 52 | 1.1% |
| South Central Asia | 12 | 0.3% |
| South Eastern Asia | 16 | 0.3% | View All 12 Rows |
Sex and Age in King George
Sex and Age in King George
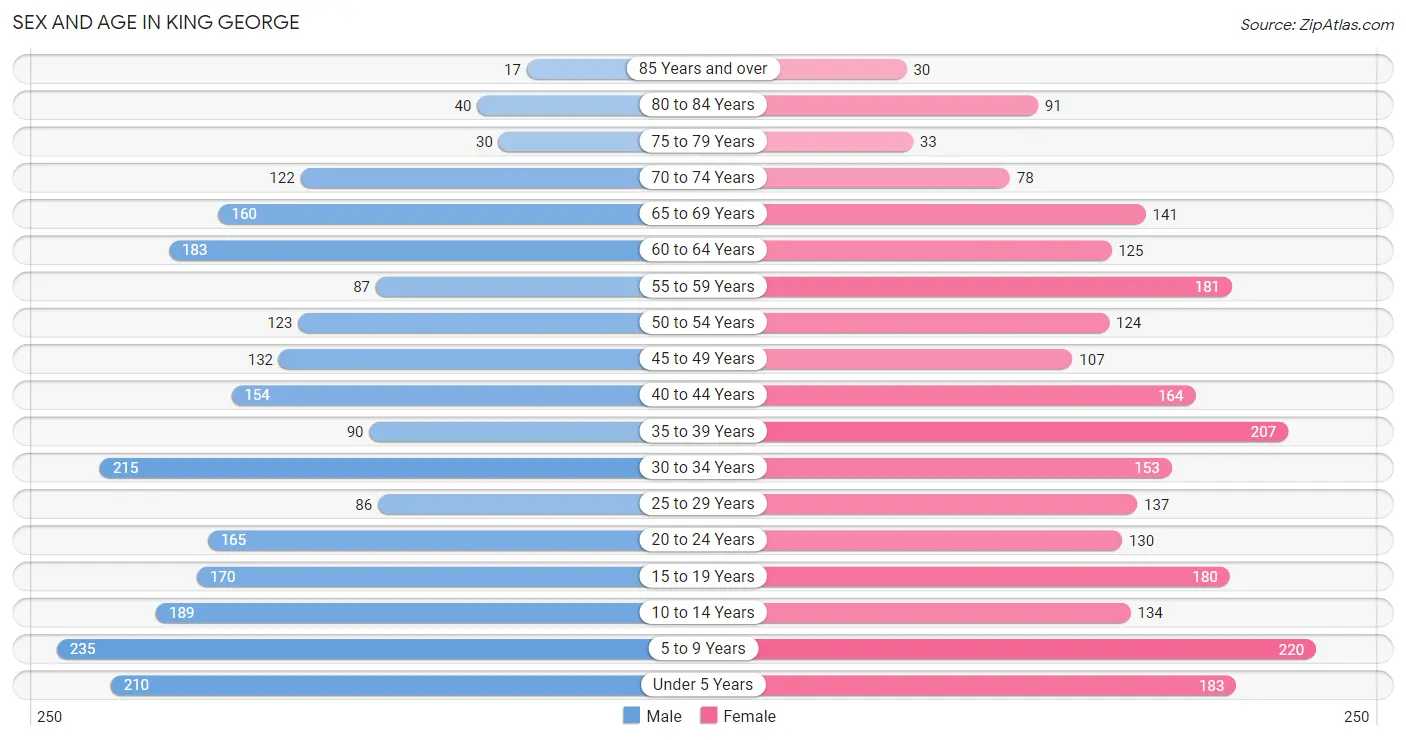
The most populous age groups in King George are 5 to 9 Years (235 | 9.8%) for men and 5 to 9 Years (220 | 9.1%) for women.
| Age Bracket | Male | Female |
| Under 5 Years | 210 (8.7%) | 183 (7.6%) |
| 5 to 9 Years | 235 (9.8%) | 220 (9.1%) |
| 10 to 14 Years | 189 (7.9%) | 134 (5.5%) |
| 15 to 19 Years | 170 (7.1%) | 180 (7.4%) |
| 20 to 24 Years | 165 (6.9%) | 130 (5.4%) |
| 25 to 29 Years | 86 (3.6%) | 137 (5.7%) |
| 30 to 34 Years | 215 (8.9%) | 153 (6.3%) |
| 35 to 39 Years | 90 (3.7%) | 207 (8.6%) |
| 40 to 44 Years | 154 (6.4%) | 164 (6.8%) |
| 45 to 49 Years | 132 (5.5%) | 107 (4.4%) |
| 50 to 54 Years | 123 (5.1%) | 124 (5.1%) |
| 55 to 59 Years | 87 (3.6%) | 181 (7.5%) |
| 60 to 64 Years | 183 (7.6%) | 125 (5.2%) |
| 65 to 69 Years | 160 (6.6%) | 141 (5.8%) |
| 70 to 74 Years | 122 (5.1%) | 78 (3.2%) |
| 75 to 79 Years | 30 (1.3%) | 33 (1.4%) |
| 80 to 84 Years | 40 (1.7%) | 91 (3.8%) |
| 85 Years and over | 17 (0.7%) | 30 (1.2%) |
| Total | 2,408 (100.0%) | 2,418 (100.0%) |
Families and Households in King George
Median Family Size in King George
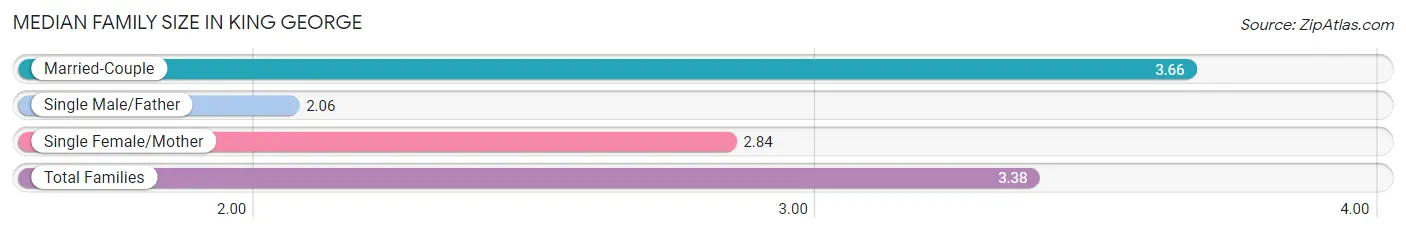
The median family size in King George is 3.38 persons per family, with married-couple families (942 | 74.7%) accounting for the largest median family size of 3.66 persons per family. On the other hand, single male/father families (113 | 9.0%) represent the smallest median family size with 2.06 persons per family.
| Family Type | # Families | Family Size |
| Married-Couple | 942 (74.7%) | 3.66 |
| Single Male/Father | 113 (9.0%) | 2.06 |
| Single Female/Mother | 206 (16.3%) | 2.84 |
| Total Families | 1,261 (100.0%) | 3.38 |
Median Household Size in King George
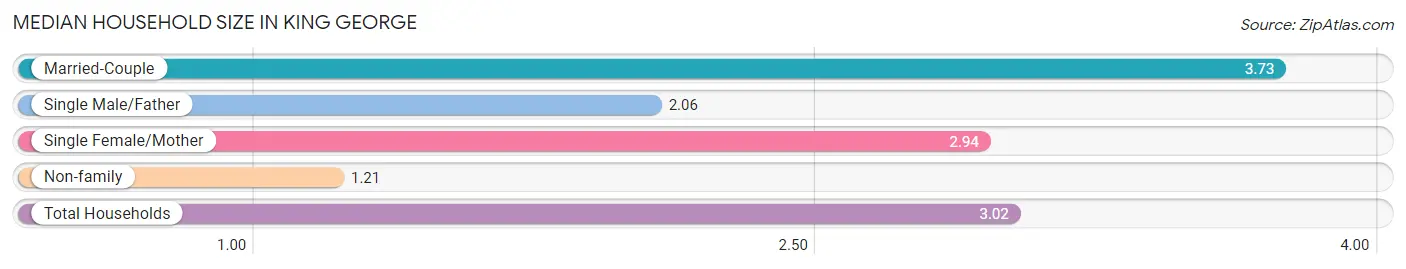
The median household size in King George is 3.02 persons per household, with married-couple households (942 | 60.5%) accounting for the largest median household size of 3.73 persons per household. non-family households (297 | 19.1%) represent the smallest median household size with 1.21 persons per household.
| Household Type | # Households | Household Size |
| Married-Couple | 942 (60.5%) | 3.73 |
| Single Male/Father | 113 (7.2%) | 2.06 |
| Single Female/Mother | 206 (13.2%) | 2.94 |
| Non-family | 297 (19.1%) | 1.21 |
| Total Households | 1,558 (100.0%) | 3.02 |
Household Size by Marriage Status in King George
Out of a total of 1,558 households in King George, 1,261 (80.9%) are family households, while 297 (19.1%) are nonfamily households. The most numerous type of family households are 2-person households, comprising 579, and the most common type of nonfamily households are 1-person households, comprising 244.
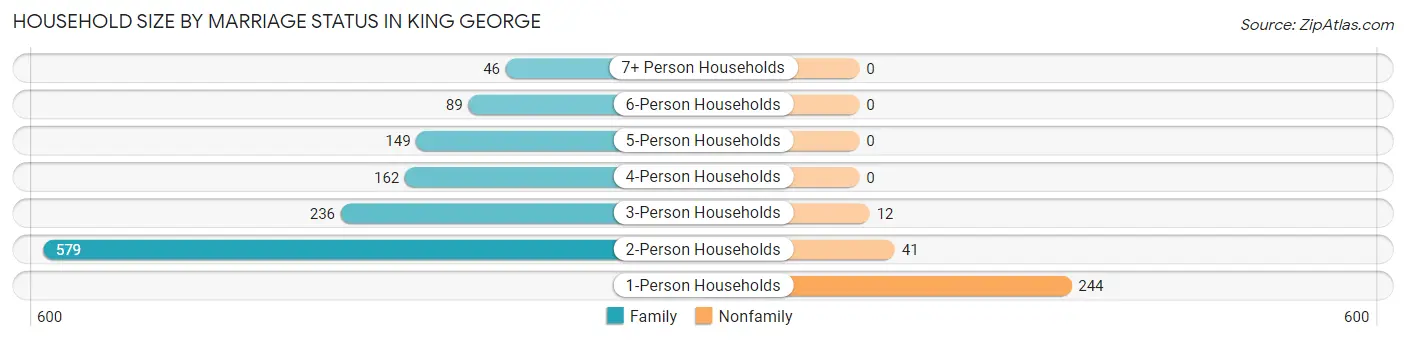
| Household Size | Family Households | Nonfamily Households |
| 1-Person Households | - | 244 (15.7%) |
| 2-Person Households | 579 (37.2%) | 41 (2.6%) |
| 3-Person Households | 236 (15.1%) | 12 (0.8%) |
| 4-Person Households | 162 (10.4%) | 0 (0.0%) |
| 5-Person Households | 149 (9.6%) | 0 (0.0%) |
| 6-Person Households | 89 (5.7%) | 0 (0.0%) |
| 7+ Person Households | 46 (2.9%) | 0 (0.0%) |
| Total | 1,261 (80.9%) | 297 (19.1%) |
Female Fertility in King George
Fertility by Age in King George
Average fertility rate in King George is 82.0 births per 1,000 women. Women in the age bracket of 20 to 34 years have the highest fertility rate with 219.0 births per 1,000 women. Women in the age bracket of 20 to 34 years acount for 100.0% of all women with births.
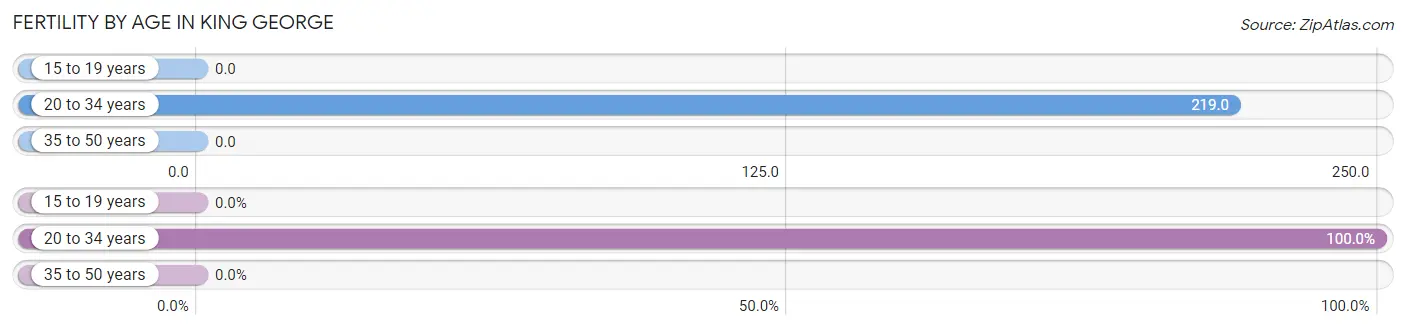
| Age Bracket | Women with Births | Births / 1,000 Women |
| 15 to 19 years | 0 (0.0%) | 0.0 |
| 20 to 34 years | 92 (100.0%) | 219.0 |
| 35 to 50 years | 0 (0.0%) | 0.0 |
| Total | 92 (100.0%) | 82.0 |
Fertility by Age by Marriage Status in King George
80.4% of women with births (92) in King George are married. The highest percentage of unmarried women with births falls into 20 to 34 years age bracket with 19.6% of them unmarried at the time of birth, while the lowest percentage of unmarried women with births belong to 20 to 34 years age bracket with 19.6% of them unmarried.
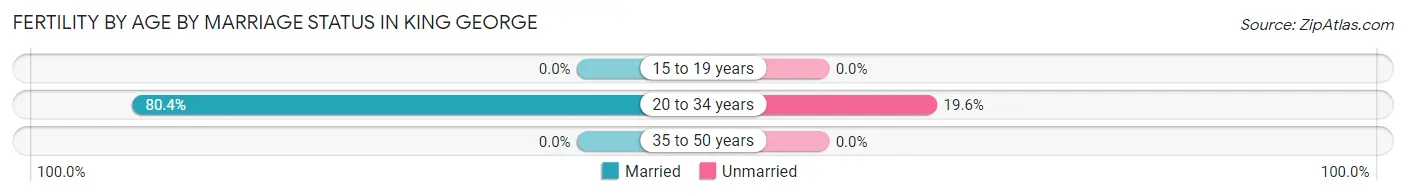
| Age Bracket | Married | Unmarried |
| 15 to 19 years | 0 (0.0%) | 0 (0.0%) |
| 20 to 34 years | 74 (80.4%) | 18 (19.6%) |
| 35 to 50 years | 0 (0.0%) | 0 (0.0%) |
| Total | 74 (80.4%) | 18 (19.6%) |
Fertility by Education in King George
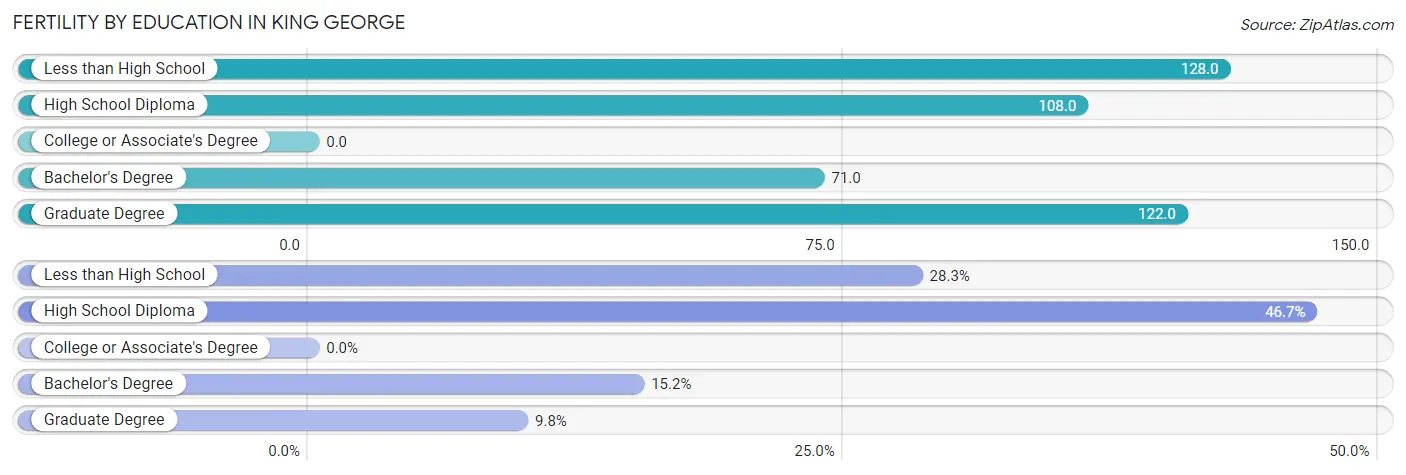
| Educational Attainment | Women with Births | Births / 1,000 Women |
| Less than High School | 26 (28.3%) | 128.0 |
| High School Diploma | 43 (46.7%) | 108.0 |
| College or Associate's Degree | 0 (0.0%) | 0.0 |
| Bachelor's Degree | 14 (15.2%) | 71.0 |
| Graduate Degree | 9 (9.8%) | 122.0 |
| Total | 92 (100.0%) | 82.0 |
Fertility by Education by Marriage Status in King George
19.6% of women with births in King George are unmarried. Women with the educational attainment of high school diploma are most likely to be married with 100.0% of them married at childbirth, while women with the educational attainment of less than high school are least likely to be married with 69.2% of them unmarried at childbirth.
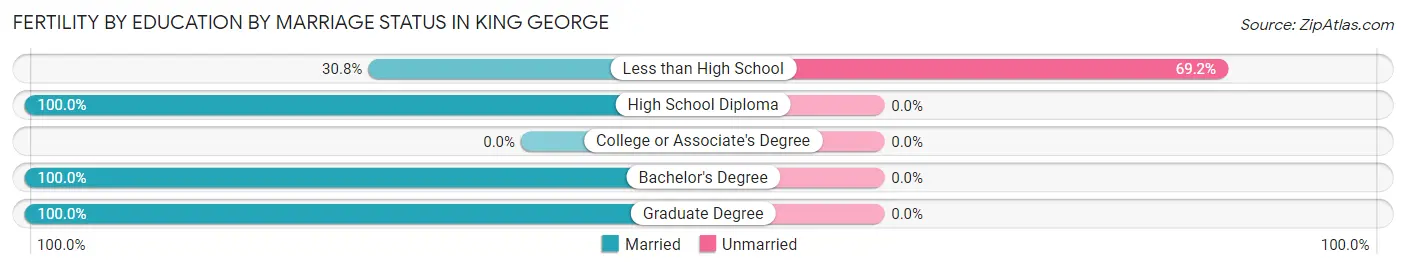
| Educational Attainment | Married | Unmarried |
| Less than High School | 8 (30.8%) | 18 (69.2%) |
| High School Diploma | 43 (100.0%) | 0 (0.0%) |
| College or Associate's Degree | 0 (0.0%) | 0 (0.0%) |
| Bachelor's Degree | 14 (100.0%) | 0 (0.0%) |
| Graduate Degree | 9 (100.0%) | 0 (0.0%) |
| Total | 74 (80.4%) | 18 (19.6%) |
Employment Characteristics in King George
Employment by Class of Employer in King George
Among the 1,985 employed individuals in King George, private company employees (1,063 | 53.5%), federal government employees (516 | 26.0%), and local government employees (212 | 10.7%) make up the most common classes of employment.
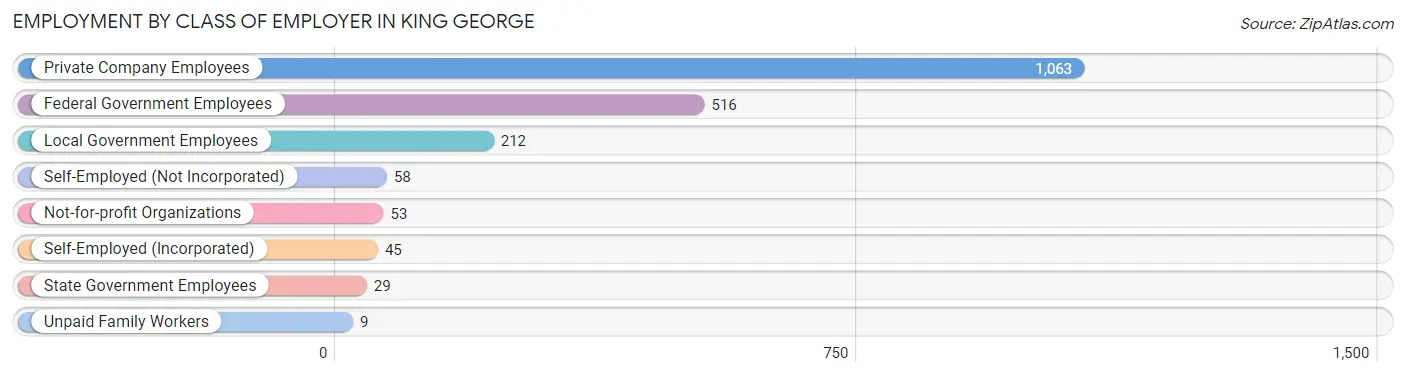
| Employer Class | # Employees | % Employees |
| Private Company Employees | 1,063 | 53.5% |
| Self-Employed (Incorporated) | 45 | 2.3% |
| Self-Employed (Not Incorporated) | 58 | 2.9% |
| Not-for-profit Organizations | 53 | 2.7% |
| Local Government Employees | 212 | 10.7% |
| State Government Employees | 29 | 1.5% |
| Federal Government Employees | 516 | 26.0% |
| Unpaid Family Workers | 9 | 0.4% |
| Total | 1,985 | 100.0% |
Employment Status by Age in King George
According to the labor force statistics for King George, out of the total population over 16 years of age (3,482), 61.1% or 2,128 individuals are in the labor force, with 3.5% or 74 of them unemployed. The age group with the highest labor force participation rate is 45 to 54 years, with 95.9% or 466 individuals in the labor force. Within the labor force, the 16 to 19 years age range has the highest percentage of unemployed individuals, with 48.2% or 27 of them being unemployed.
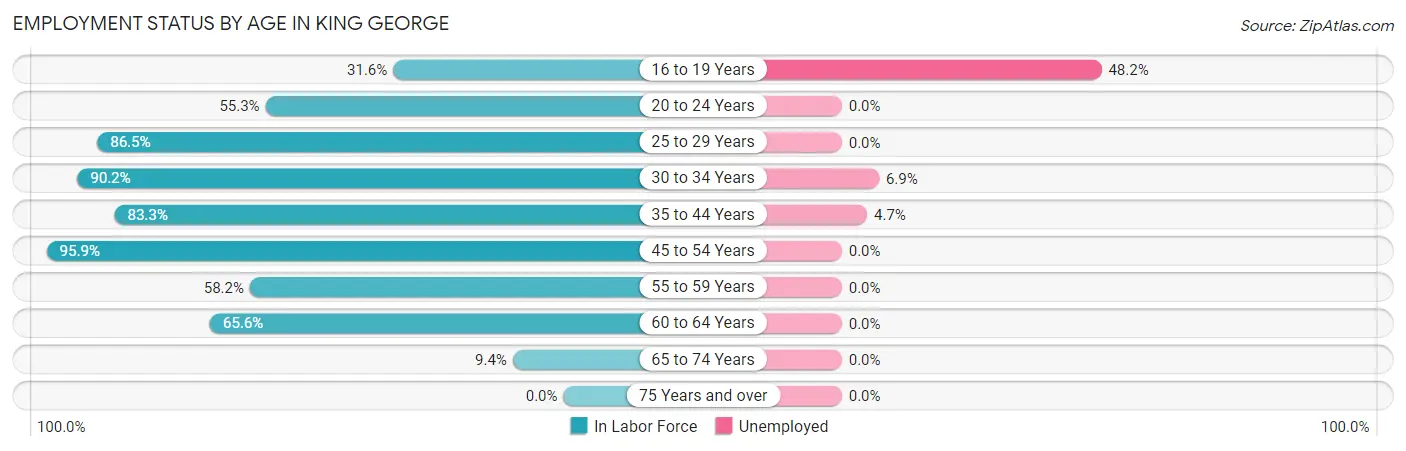
| Age Bracket | In Labor Force | Unemployed |
| 16 to 19 Years | 56 (31.6%) | 27 (48.2%) |
| 20 to 24 Years | 163 (55.3%) | 0 (0.0%) |
| 25 to 29 Years | 193 (86.5%) | 0 (0.0%) |
| 30 to 34 Years | 332 (90.2%) | 23 (6.9%) |
| 35 to 44 Years | 512 (83.3%) | 24 (4.7%) |
| 45 to 54 Years | 466 (95.9%) | 0 (0.0%) |
| 55 to 59 Years | 156 (58.2%) | 0 (0.0%) |
| 60 to 64 Years | 202 (65.6%) | 0 (0.0%) |
| 65 to 74 Years | 47 (9.4%) | 0 (0.0%) |
| 75 Years and over | 0 (0.0%) | 0 (0.0%) |
| Total | 2,128 (61.1%) | 74 (3.5%) |
Employment Status by Educational Attainment in King George
According to labor force statistics for King George, 82.1% of individuals (1,862) out of the total population between 25 and 64 years of age (2,268) are in the labor force, with 2.5% or 47 of them being unemployed. The group with the highest labor force participation rate are those with the educational attainment of college / associate degree, with 90.6% or 598 individuals in the labor force. Within the labor force, individuals with less than high school education have the highest percentage of unemployment, with 13.8% or 8 of them being unemployed.
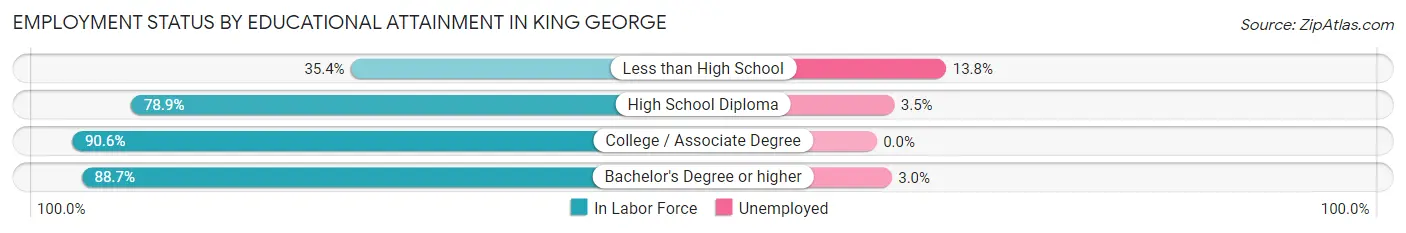
| Educational Attainment | In Labor Force | Unemployed |
| Less than High School | 58 (35.4%) | 23 (13.8%) |
| High School Diploma | 610 (78.9%) | 27 (3.5%) |
| College / Associate Degree | 598 (90.6%) | 0 (0.0%) |
| Bachelor's Degree or higher | 595 (88.7%) | 20 (3.0%) |
| Total | 1,862 (82.1%) | 57 (2.5%) |
Employment Occupations by Sex in King George
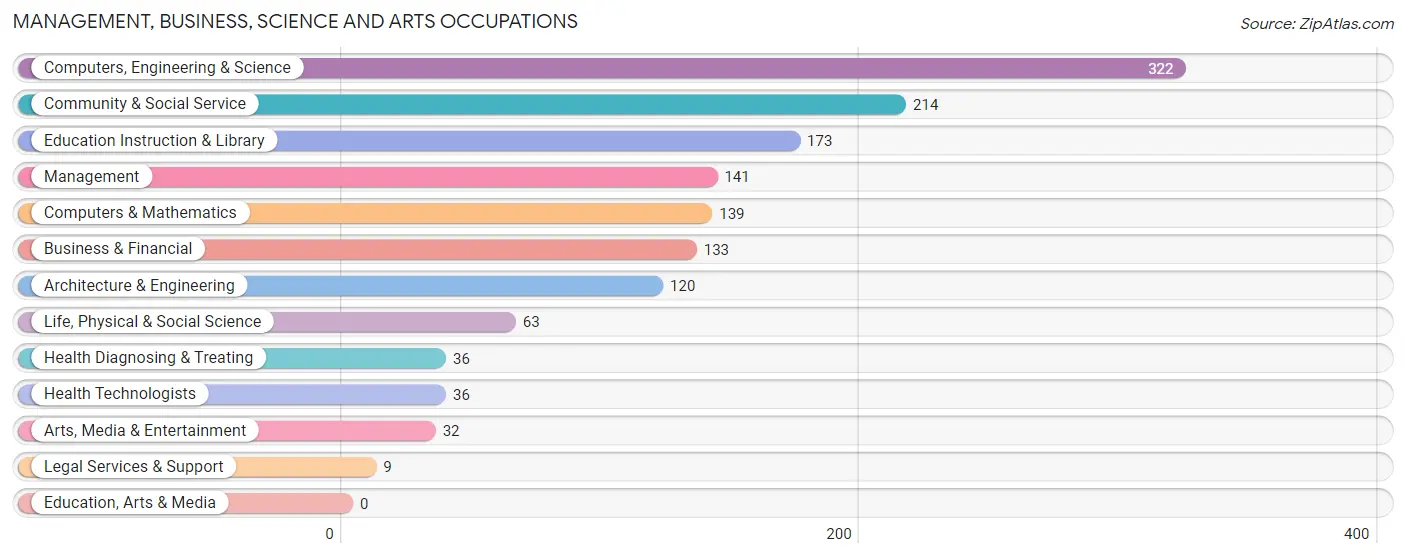
Management, Business, Science and Arts Occupations
The most common Management, Business, Science and Arts occupations in King George are Computers, Engineering & Science (322 | 16.1%), Community & Social Service (214 | 10.7%), Education Instruction & Library (173 | 8.6%), Management (141 | 7.0%), and Computers & Mathematics (139 | 6.9%).
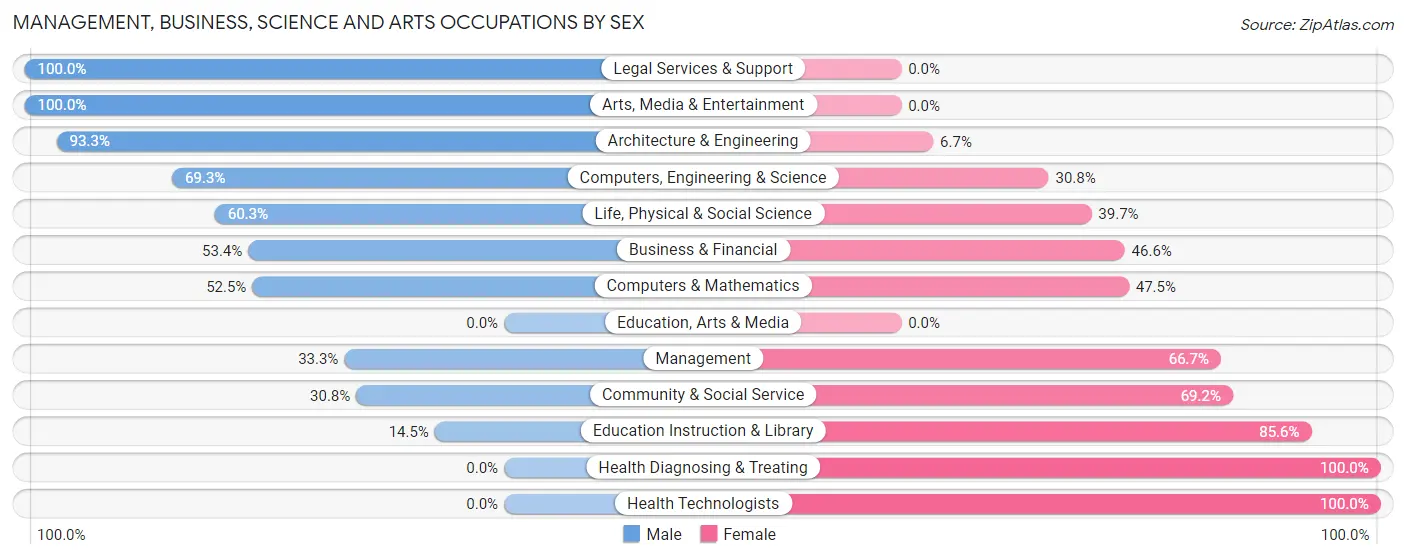
Management, Business, Science and Arts Occupations by Sex
Within the Management, Business, Science and Arts occupations in King George, the most male-oriented occupations are Legal Services & Support (100.0%), Arts, Media & Entertainment (100.0%), and Architecture & Engineering (93.3%), while the most female-oriented occupations are Health Diagnosing & Treating (100.0%), Health Technologists (100.0%), and Education Instruction & Library (85.6%).
| Occupation | Male | Female |
| Management | 47 (33.3%) | 94 (66.7%) |
| Business & Financial | 71 (53.4%) | 62 (46.6%) |
| Computers, Engineering & Science | 223 (69.3%) | 99 (30.7%) |
| Computers & Mathematics | 73 (52.5%) | 66 (47.5%) |
| Architecture & Engineering | 112 (93.3%) | 8 (6.7%) |
| Life, Physical & Social Science | 38 (60.3%) | 25 (39.7%) |
| Community & Social Service | 66 (30.8%) | 148 (69.2%) |
| Education, Arts & Media | 0 (0.0%) | 0 (0.0%) |
| Legal Services & Support | 9 (100.0%) | 0 (0.0%) |
| Education Instruction & Library | 25 (14.4%) | 148 (85.6%) |
| Arts, Media & Entertainment | 32 (100.0%) | 0 (0.0%) |
| Health Diagnosing & Treating | 0 (0.0%) | 36 (100.0%) |
| Health Technologists | 0 (0.0%) | 36 (100.0%) |
| Total (Category) | 407 (48.1%) | 439 (51.9%) |
| Total (Overall) | 1,068 (53.3%) | 937 (46.7%) |
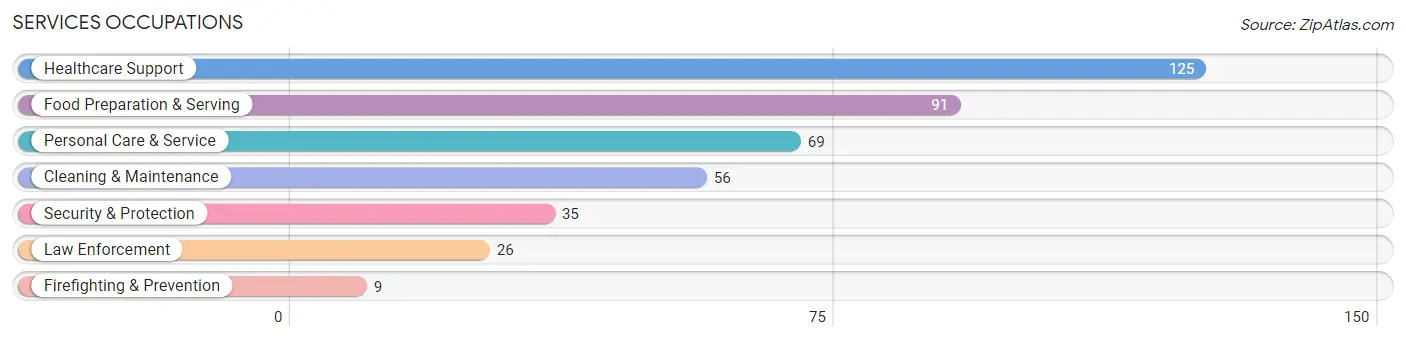
Services Occupations
The most common Services occupations in King George are Healthcare Support (125 | 6.2%), Food Preparation & Serving (91 | 4.5%), Personal Care & Service (69 | 3.4%), Cleaning & Maintenance (56 | 2.8%), and Security & Protection (35 | 1.8%).
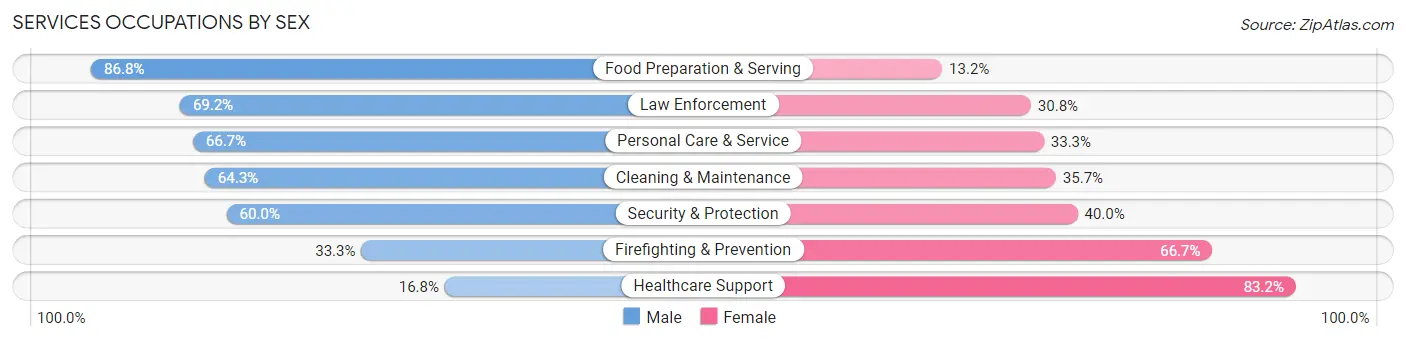
Services Occupations by Sex
Within the Services occupations in King George, the most male-oriented occupations are Food Preparation & Serving (86.8%), Law Enforcement (69.2%), and Personal Care & Service (66.7%), while the most female-oriented occupations are Healthcare Support (83.2%), Firefighting & Prevention (66.7%), and Security & Protection (40.0%).
| Occupation | Male | Female |
| Healthcare Support | 21 (16.8%) | 104 (83.2%) |
| Security & Protection | 21 (60.0%) | 14 (40.0%) |
| Firefighting & Prevention | 3 (33.3%) | 6 (66.7%) |
| Law Enforcement | 18 (69.2%) | 8 (30.8%) |
| Food Preparation & Serving | 79 (86.8%) | 12 (13.2%) |
| Cleaning & Maintenance | 36 (64.3%) | 20 (35.7%) |
| Personal Care & Service | 46 (66.7%) | 23 (33.3%) |
| Total (Category) | 203 (54.0%) | 173 (46.0%) |
| Total (Overall) | 1,068 (53.3%) | 937 (46.7%) |
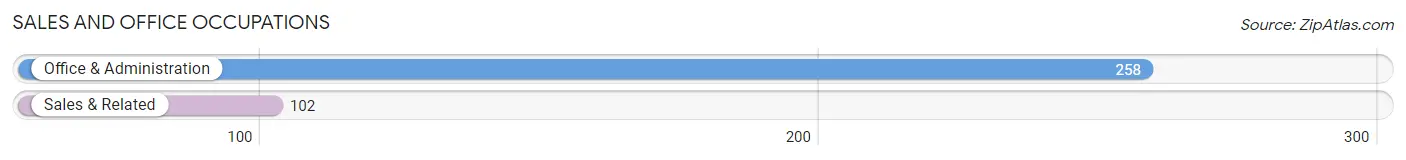
Sales and Office Occupations
The most common Sales and Office occupations in King George are Office & Administration (258 | 12.9%), and Sales & Related (102 | 5.1%).
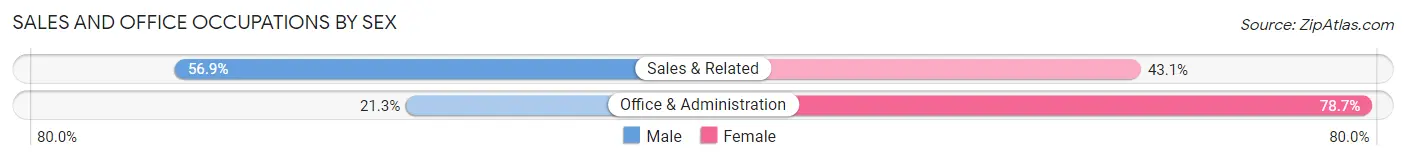
Sales and Office Occupations by Sex
| Occupation | Male | Female |
| Sales & Related | 58 (56.9%) | 44 (43.1%) |
| Office & Administration | 55 (21.3%) | 203 (78.7%) |
| Total (Category) | 113 (31.4%) | 247 (68.6%) |
| Total (Overall) | 1,068 (53.3%) | 937 (46.7%) |
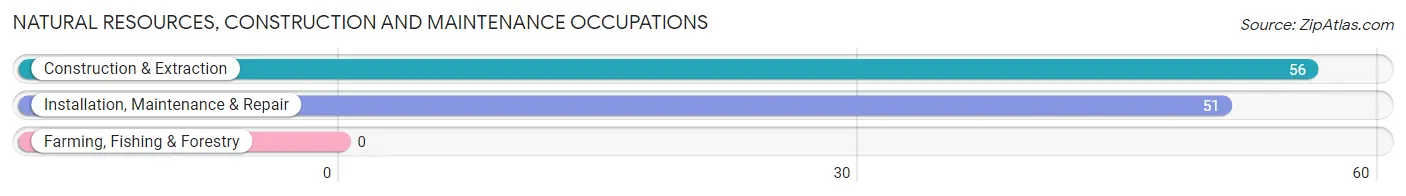
Natural Resources, Construction and Maintenance Occupations
The most common Natural Resources, Construction and Maintenance occupations in King George are Construction & Extraction (56 | 2.8%), and Installation, Maintenance & Repair (51 | 2.5%).
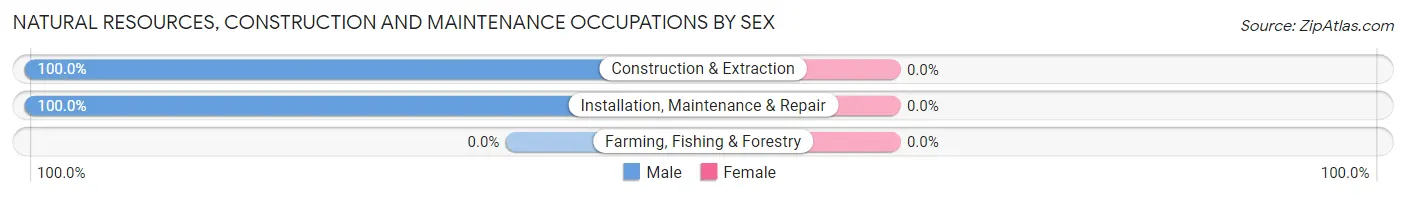
Natural Resources, Construction and Maintenance Occupations by Sex
| Occupation | Male | Female |
| Farming, Fishing & Forestry | 0 (0.0%) | 0 (0.0%) |
| Construction & Extraction | 56 (100.0%) | 0 (0.0%) |
| Installation, Maintenance & Repair | 51 (100.0%) | 0 (0.0%) |
| Total (Category) | 107 (100.0%) | 0 (0.0%) |
| Total (Overall) | 1,068 (53.3%) | 937 (46.7%) |
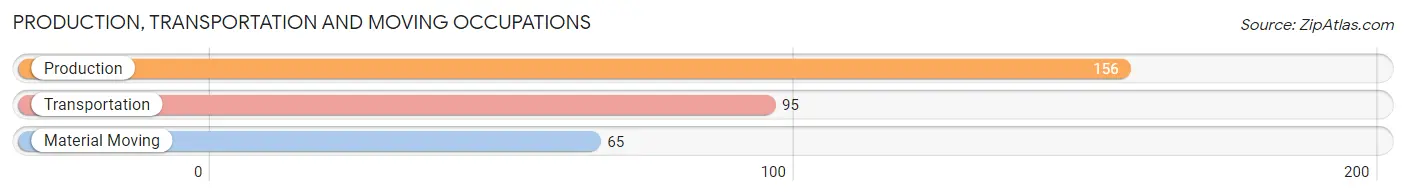
Production, Transportation and Moving Occupations
The most common Production, Transportation and Moving occupations in King George are Production (156 | 7.8%), Transportation (95 | 4.7%), and Material Moving (65 | 3.2%).
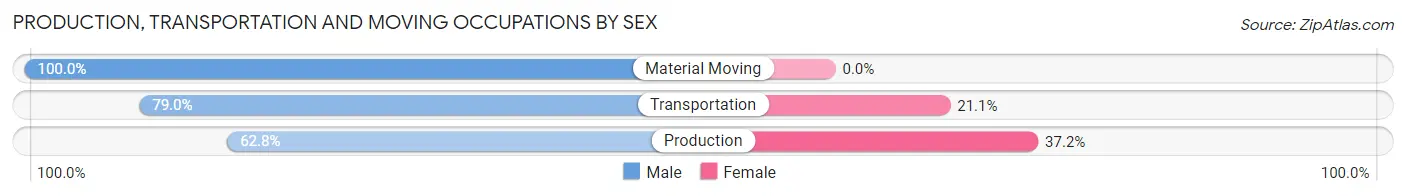
Production, Transportation and Moving Occupations by Sex
| Occupation | Male | Female |
| Production | 98 (62.8%) | 58 (37.2%) |
| Transportation | 75 (78.9%) | 20 (21.0%) |
| Material Moving | 65 (100.0%) | 0 (0.0%) |
| Total (Category) | 238 (75.3%) | 78 (24.7%) |
| Total (Overall) | 1,068 (53.3%) | 937 (46.7%) |
Employment Industries by Sex in King George
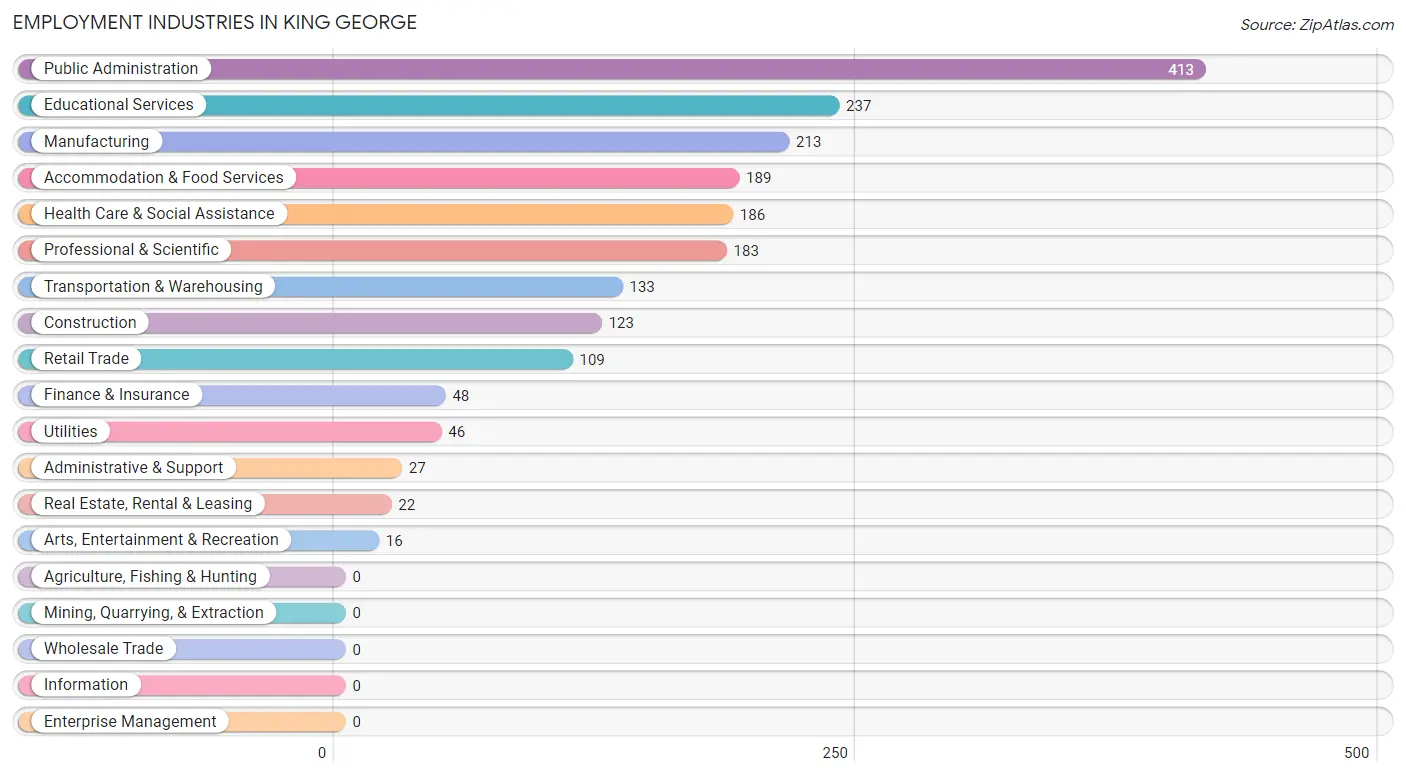
Employment Industries in King George
The major employment industries in King George include Public Administration (413 | 20.6%), Educational Services (237 | 11.8%), Manufacturing (213 | 10.6%), Accommodation & Food Services (189 | 9.4%), and Health Care & Social Assistance (186 | 9.3%).
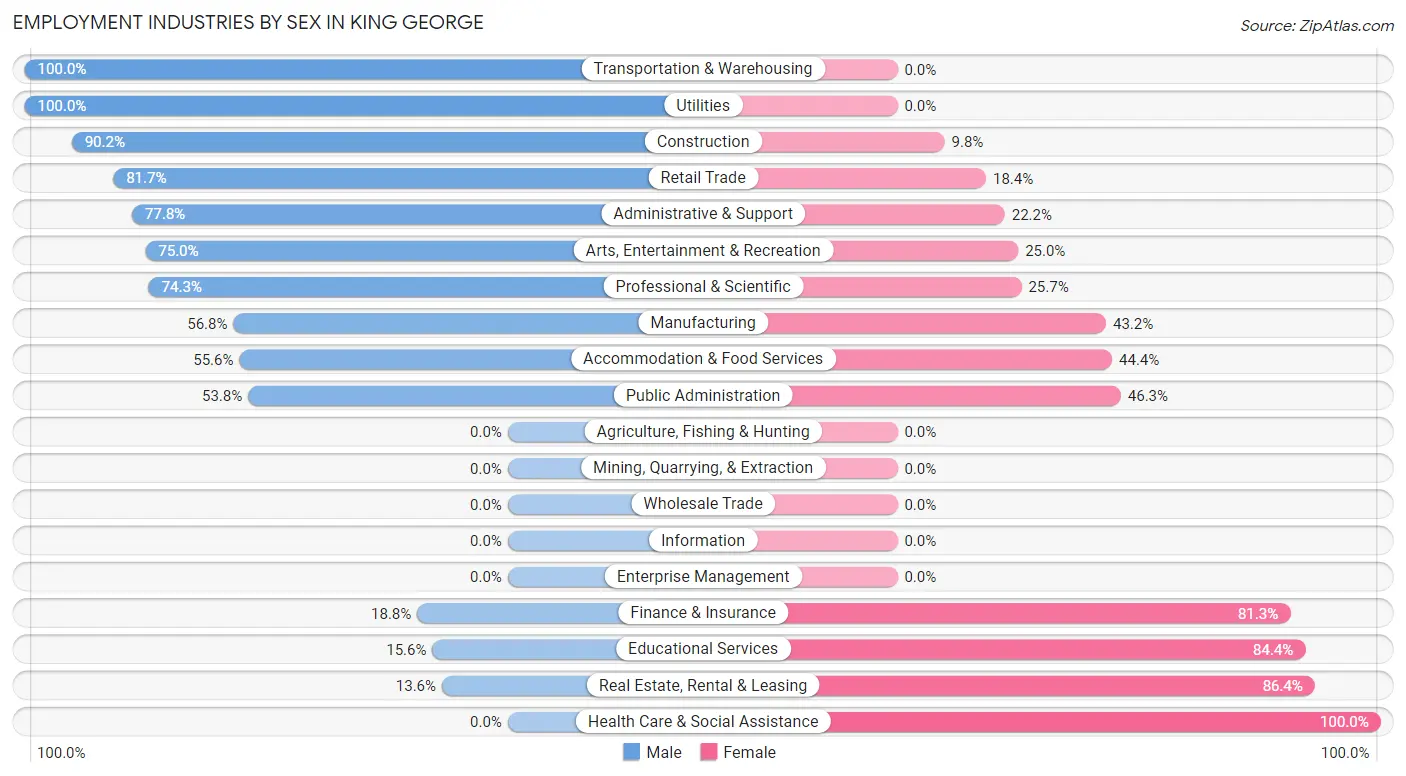
Employment Industries by Sex in King George
The King George industries that see more men than women are Transportation & Warehousing (100.0%), Utilities (100.0%), and Construction (90.2%), whereas the industries that tend to have a higher number of women are Health Care & Social Assistance (100.0%), Real Estate, Rental & Leasing (86.4%), and Educational Services (84.4%).
| Industry | Male | Female |
| Agriculture, Fishing & Hunting | 0 (0.0%) | 0 (0.0%) |
| Mining, Quarrying, & Extraction | 0 (0.0%) | 0 (0.0%) |
| Construction | 111 (90.2%) | 12 (9.8%) |
| Manufacturing | 121 (56.8%) | 92 (43.2%) |
| Wholesale Trade | 0 (0.0%) | 0 (0.0%) |
| Retail Trade | 89 (81.7%) | 20 (18.3%) |
| Transportation & Warehousing | 133 (100.0%) | 0 (0.0%) |
| Utilities | 46 (100.0%) | 0 (0.0%) |
| Information | 0 (0.0%) | 0 (0.0%) |
| Finance & Insurance | 9 (18.8%) | 39 (81.2%) |
| Real Estate, Rental & Leasing | 3 (13.6%) | 19 (86.4%) |
| Professional & Scientific | 136 (74.3%) | 47 (25.7%) |
| Enterprise Management | 0 (0.0%) | 0 (0.0%) |
| Administrative & Support | 21 (77.8%) | 6 (22.2%) |
| Educational Services | 37 (15.6%) | 200 (84.4%) |
| Health Care & Social Assistance | 0 (0.0%) | 186 (100.0%) |
| Arts, Entertainment & Recreation | 12 (75.0%) | 4 (25.0%) |
| Accommodation & Food Services | 105 (55.6%) | 84 (44.4%) |
| Public Administration | 222 (53.7%) | 191 (46.3%) |
| Total | 1,068 (53.3%) | 937 (46.7%) |
Education in King George
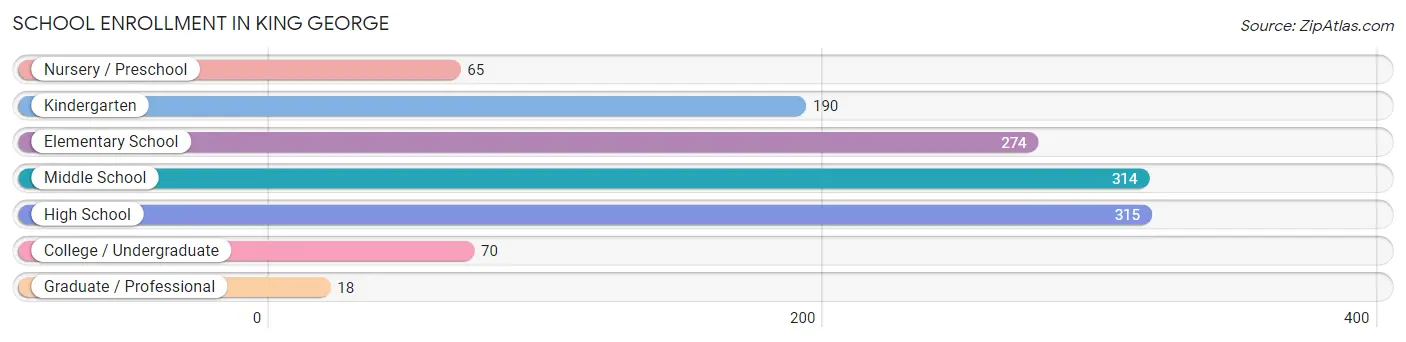
School Enrollment in King George
The most common levels of schooling among the 1,246 students in King George are high school (315 | 25.3%), middle school (314 | 25.2%), and elementary school (274 | 22.0%).
| School Level | # Students | % Students |
| Nursery / Preschool | 65 | 5.2% |
| Kindergarten | 190 | 15.2% |
| Elementary School | 274 | 22.0% |
| Middle School | 314 | 25.2% |
| High School | 315 | 25.3% |
| College / Undergraduate | 70 | 5.6% |
| Graduate / Professional | 18 | 1.4% |
| Total | 1,246 | 100.0% |
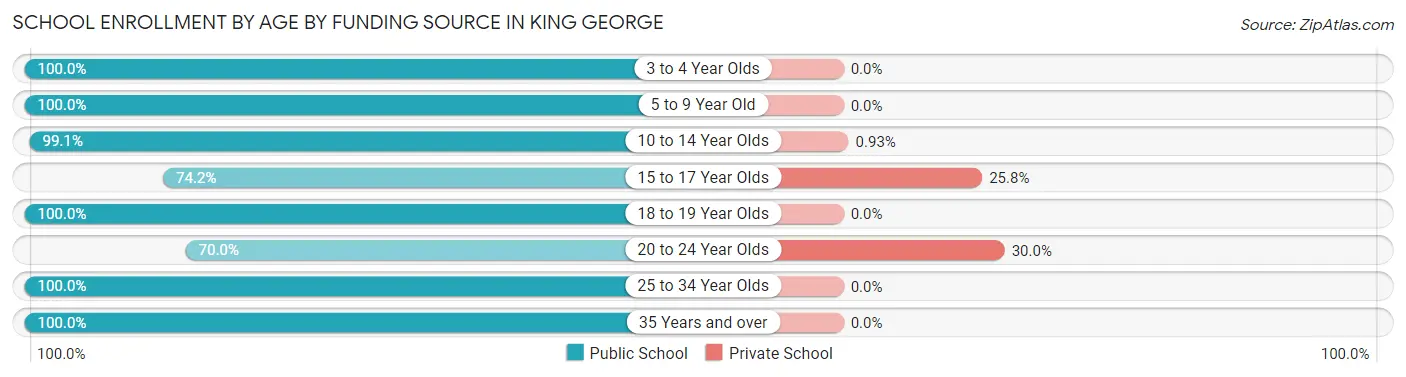
School Enrollment by Age by Funding Source in King George
Out of a total of 1,246 students who are enrolled in schools in King George, 76 (6.1%) attend a private institution, while the remaining 1,170 (93.9%) are enrolled in public schools. The age group of 20 to 24 year olds has the highest likelihood of being enrolled in private schools, with 9 (30.0% in the age bracket) enrolled. Conversely, the age group of 3 to 4 year olds has the lowest likelihood of being enrolled in a private school, with 65 (100.0% in the age bracket) attending a public institution.
| Age Bracket | Public School | Private School |
| 3 to 4 Year Olds | 65 (100.0%) | 0 (0.0%) |
| 5 to 9 Year Old | 455 (100.0%) | 0 (0.0%) |
| 10 to 14 Year Olds | 320 (99.1%) | 3 (0.9%) |
| 15 to 17 Year Olds | 184 (74.2%) | 64 (25.8%) |
| 18 to 19 Year Olds | 75 (100.0%) | 0 (0.0%) |
| 20 to 24 Year Olds | 21 (70.0%) | 9 (30.0%) |
| 25 to 34 Year Olds | 30 (100.0%) | 0 (0.0%) |
| 35 Years and over | 20 (100.0%) | 0 (0.0%) |
| Total | 1,170 (93.9%) | 76 (6.1%) |
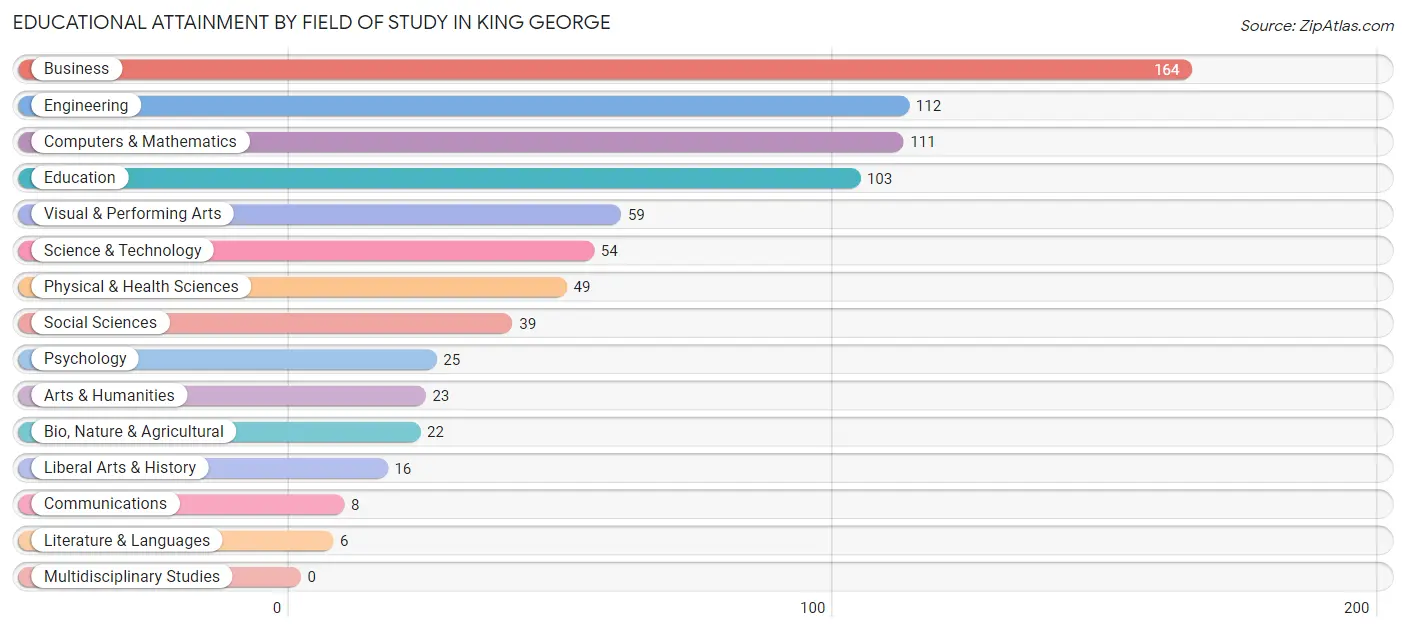
Educational Attainment by Field of Study in King George
Business (164 | 20.7%), engineering (112 | 14.2%), computers & mathematics (111 | 14.0%), education (103 | 13.0%), and visual & performing arts (59 | 7.5%) are the most common fields of study among 791 individuals in King George who have obtained a bachelor's degree or higher.
| Field of Study | # Graduates | % Graduates |
| Computers & Mathematics | 111 | 14.0% |
| Bio, Nature & Agricultural | 22 | 2.8% |
| Physical & Health Sciences | 49 | 6.2% |
| Psychology | 25 | 3.2% |
| Social Sciences | 39 | 4.9% |
| Engineering | 112 | 14.2% |
| Multidisciplinary Studies | 0 | 0.0% |
| Science & Technology | 54 | 6.8% |
| Business | 164 | 20.7% |
| Education | 103 | 13.0% |
| Literature & Languages | 6 | 0.8% |
| Liberal Arts & History | 16 | 2.0% |
| Visual & Performing Arts | 59 | 7.5% |
| Communications | 8 | 1.0% |
| Arts & Humanities | 23 | 2.9% |
| Total | 791 | 100.0% |
Transportation & Commute in King George
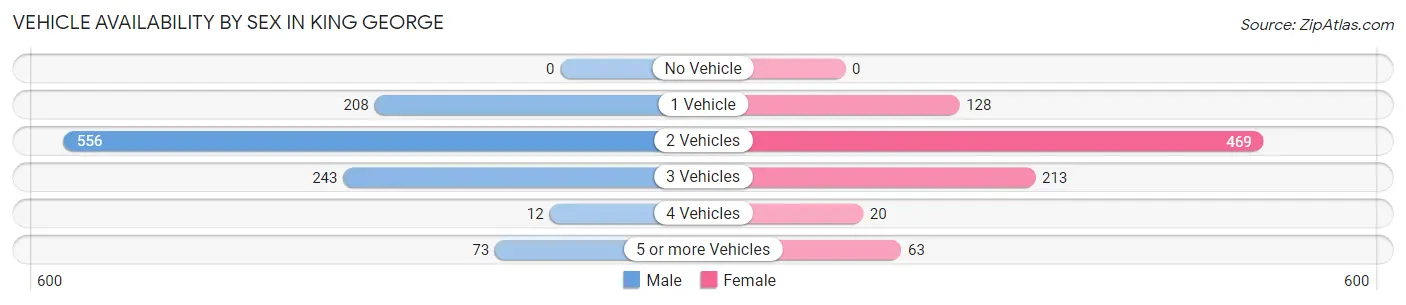
Vehicle Availability by Sex in King George
The most prevalent vehicle ownership categories in King George are males with 2 vehicles (556, accounting for 50.9%) and females with 2 vehicles (469, making up 62.3%).
| Vehicles Available | Male | Female |
| No Vehicle | 0 (0.0%) | 0 (0.0%) |
| 1 Vehicle | 208 (19.1%) | 128 (14.3%) |
| 2 Vehicles | 556 (50.9%) | 469 (52.5%) |
| 3 Vehicles | 243 (22.3%) | 213 (23.8%) |
| 4 Vehicles | 12 (1.1%) | 20 (2.2%) |
| 5 or more Vehicles | 73 (6.7%) | 63 (7.0%) |
| Total | 1,092 (100.0%) | 893 (100.0%) |
Commute Time in King George
The most frequently occuring commute durations in King George are 20 to 24 minutes (261 commuters, 15.0%), 60 to 89 minutes (224 commuters, 12.8%), and 10 to 14 minutes (218 commuters, 12.5%).
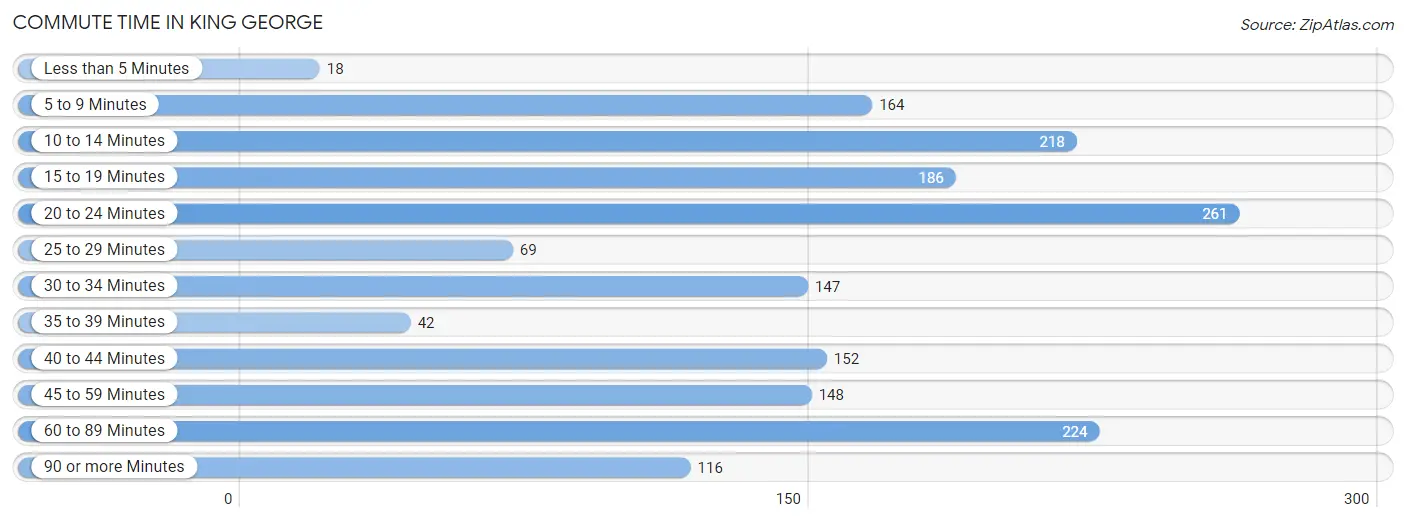
| Commute Time | # Commuters | % Commuters |
| Less than 5 Minutes | 18 | 1.0% |
| 5 to 9 Minutes | 164 | 9.4% |
| 10 to 14 Minutes | 218 | 12.5% |
| 15 to 19 Minutes | 186 | 10.7% |
| 20 to 24 Minutes | 261 | 15.0% |
| 25 to 29 Minutes | 69 | 4.0% |
| 30 to 34 Minutes | 147 | 8.4% |
| 35 to 39 Minutes | 42 | 2.4% |
| 40 to 44 Minutes | 152 | 8.7% |
| 45 to 59 Minutes | 148 | 8.5% |
| 60 to 89 Minutes | 224 | 12.8% |
| 90 or more Minutes | 116 | 6.7% |
Commute Time by Sex in King George
The most common commute times in King George are 60 to 89 minutes (151 commuters, 15.5%) for males and 10 to 14 minutes (133 commuters, 17.2%) for females.
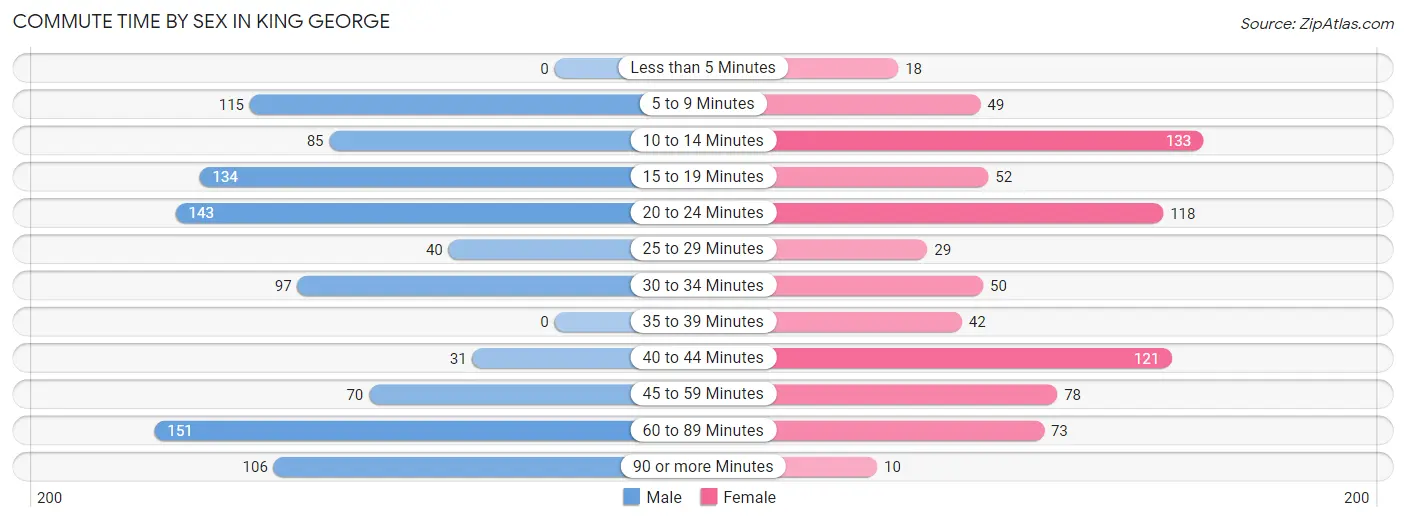
| Commute Time | Male | Female |
| Less than 5 Minutes | 0 (0.0%) | 18 (2.3%) |
| 5 to 9 Minutes | 115 (11.8%) | 49 (6.3%) |
| 10 to 14 Minutes | 85 (8.7%) | 133 (17.2%) |
| 15 to 19 Minutes | 134 (13.8%) | 52 (6.7%) |
| 20 to 24 Minutes | 143 (14.7%) | 118 (15.3%) |
| 25 to 29 Minutes | 40 (4.1%) | 29 (3.7%) |
| 30 to 34 Minutes | 97 (10.0%) | 50 (6.5%) |
| 35 to 39 Minutes | 0 (0.0%) | 42 (5.4%) |
| 40 to 44 Minutes | 31 (3.2%) | 121 (15.7%) |
| 45 to 59 Minutes | 70 (7.2%) | 78 (10.1%) |
| 60 to 89 Minutes | 151 (15.5%) | 73 (9.4%) |
| 90 or more Minutes | 106 (10.9%) | 10 (1.3%) |
Time of Departure to Work by Sex in King George
The most frequent times of departure to work in King George are 12:00 AM to 4:59 AM (155, 16.0%) for males and 8:00 AM to 8:29 AM (146, 18.9%) for females.
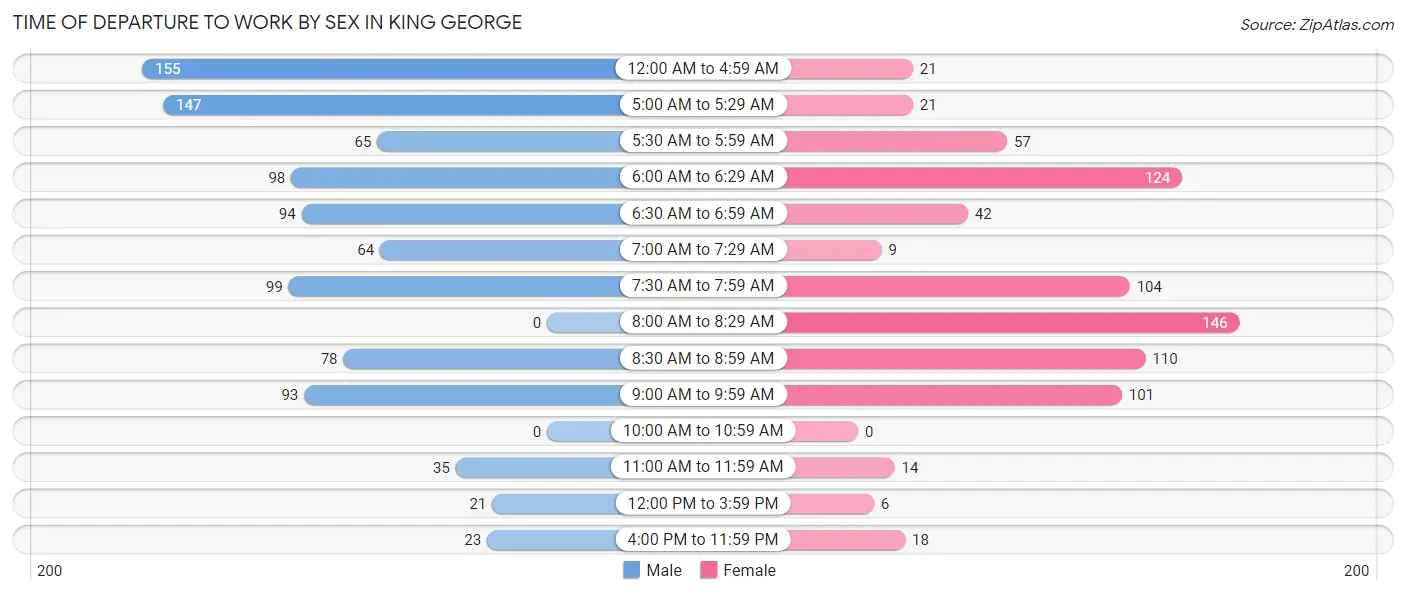
| Time of Departure | Male | Female |
| 12:00 AM to 4:59 AM | 155 (16.0%) | 21 (2.7%) |
| 5:00 AM to 5:29 AM | 147 (15.1%) | 21 (2.7%) |
| 5:30 AM to 5:59 AM | 65 (6.7%) | 57 (7.4%) |
| 6:00 AM to 6:29 AM | 98 (10.1%) | 124 (16.0%) |
| 6:30 AM to 6:59 AM | 94 (9.7%) | 42 (5.4%) |
| 7:00 AM to 7:29 AM | 64 (6.6%) | 9 (1.2%) |
| 7:30 AM to 7:59 AM | 99 (10.2%) | 104 (13.5%) |
| 8:00 AM to 8:29 AM | 0 (0.0%) | 146 (18.9%) |
| 8:30 AM to 8:59 AM | 78 (8.0%) | 110 (14.2%) |
| 9:00 AM to 9:59 AM | 93 (9.6%) | 101 (13.1%) |
| 10:00 AM to 10:59 AM | 0 (0.0%) | 0 (0.0%) |
| 11:00 AM to 11:59 AM | 35 (3.6%) | 14 (1.8%) |
| 12:00 PM to 3:59 PM | 21 (2.2%) | 6 (0.8%) |
| 4:00 PM to 11:59 PM | 23 (2.4%) | 18 (2.3%) |
| Total | 972 (100.0%) | 773 (100.0%) |
Housing Occupancy in King George
Occupancy by Ownership in King George
Of the total 1,558 dwellings in King George, owner-occupied units account for 1,102 (70.7%), while renter-occupied units make up 456 (29.3%).
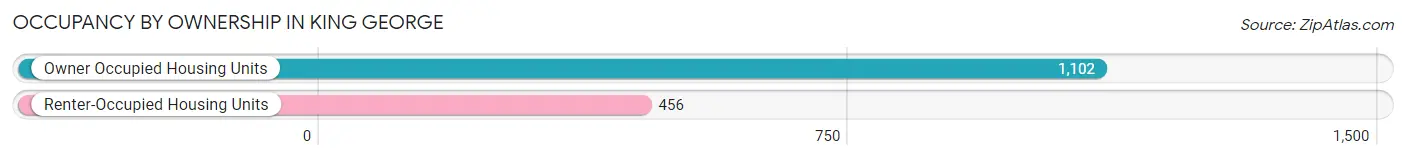
| Occupancy | # Housing Units | % Housing Units |
| Owner Occupied Housing Units | 1,102 | 70.7% |
| Renter-Occupied Housing Units | 456 | 29.3% |
| Total Occupied Housing Units | 1,558 | 100.0% |
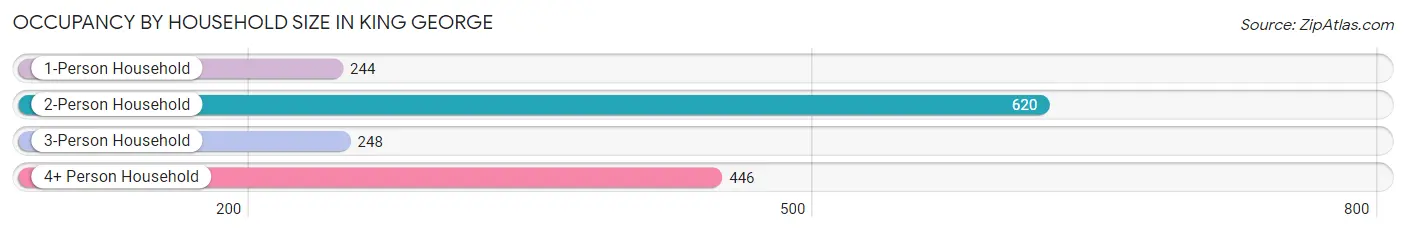
Occupancy by Household Size in King George
| Household Size | # Housing Units | % Housing Units |
| 1-Person Household | 244 | 15.7% |
| 2-Person Household | 620 | 39.8% |
| 3-Person Household | 248 | 15.9% |
| 4+ Person Household | 446 | 28.6% |
| Total Housing Units | 1,558 | 100.0% |
Occupancy by Ownership by Household Size in King George
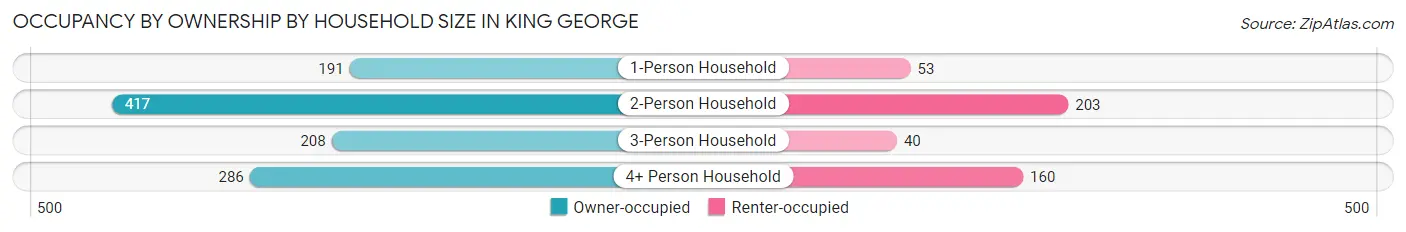
| Household Size | Owner-occupied | Renter-occupied |
| 1-Person Household | 191 (78.3%) | 53 (21.7%) |
| 2-Person Household | 417 (67.3%) | 203 (32.7%) |
| 3-Person Household | 208 (83.9%) | 40 (16.1%) |
| 4+ Person Household | 286 (64.1%) | 160 (35.9%) |
| Total Housing Units | 1,102 (70.7%) | 456 (29.3%) |
Occupancy by Educational Attainment in King George
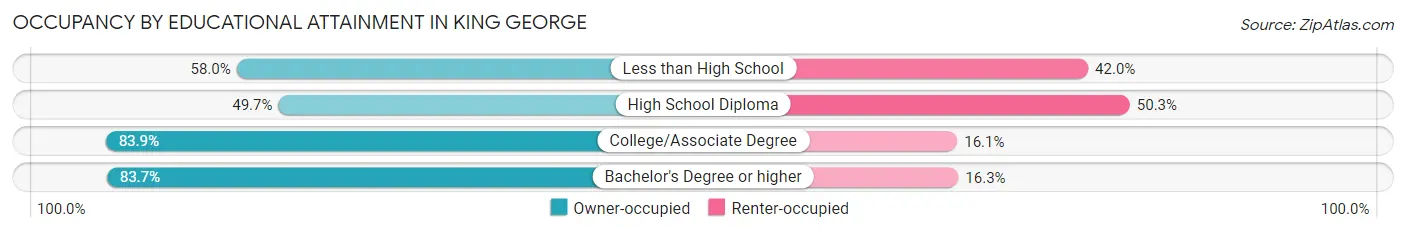
| Household Size | Owner-occupied | Renter-occupied |
| Less than High School | 80 (58.0%) | 58 (42.0%) |
| High School Diploma | 245 (49.7%) | 248 (50.3%) |
| College/Associate Degree | 433 (83.9%) | 83 (16.1%) |
| Bachelor's Degree or higher | 344 (83.7%) | 67 (16.3%) |
Occupancy by Age of Householder in King George
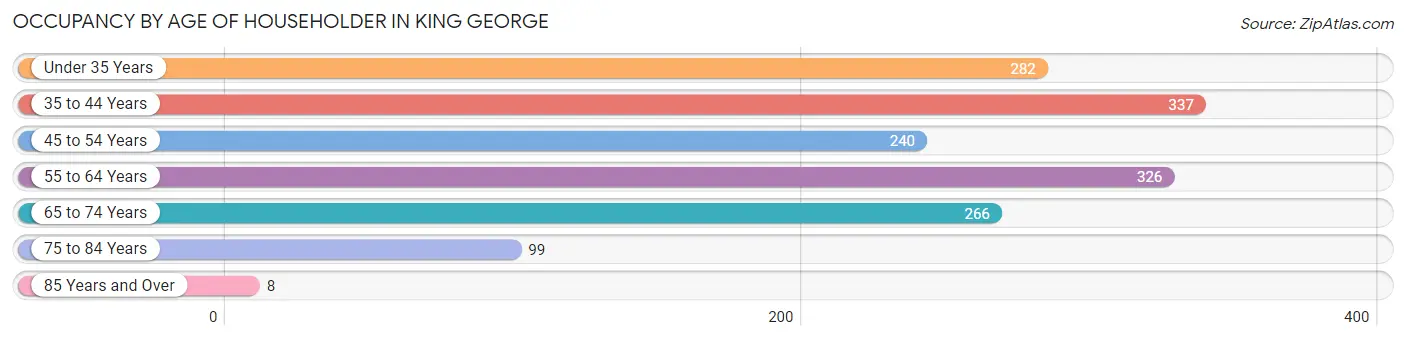
| Age Bracket | # Households | % Households |
| Under 35 Years | 282 | 18.1% |
| 35 to 44 Years | 337 | 21.6% |
| 45 to 54 Years | 240 | 15.4% |
| 55 to 64 Years | 326 | 20.9% |
| 65 to 74 Years | 266 | 17.1% |
| 75 to 84 Years | 99 | 6.4% |
| 85 Years and Over | 8 | 0.5% |
| Total | 1,558 | 100.0% |
Housing Finances in King George
Median Income by Occupancy in King George
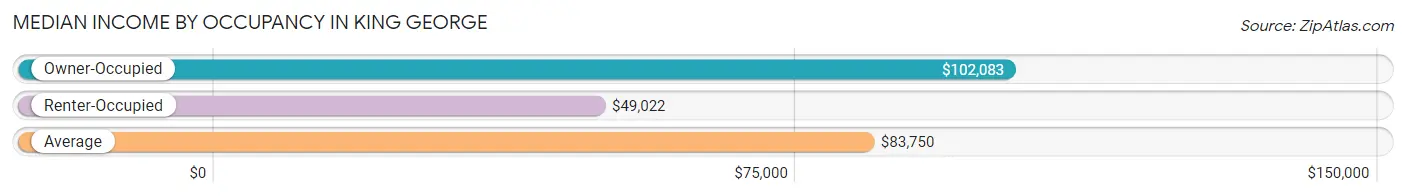
| Occupancy Type | # Households | Median Income |
| Owner-Occupied | 1,102 (70.7%) | $102,083 |
| Renter-Occupied | 456 (29.3%) | $49,022 |
| Average | 1,558 (100.0%) | $83,750 |
Occupancy by Householder Income Bracket in King George
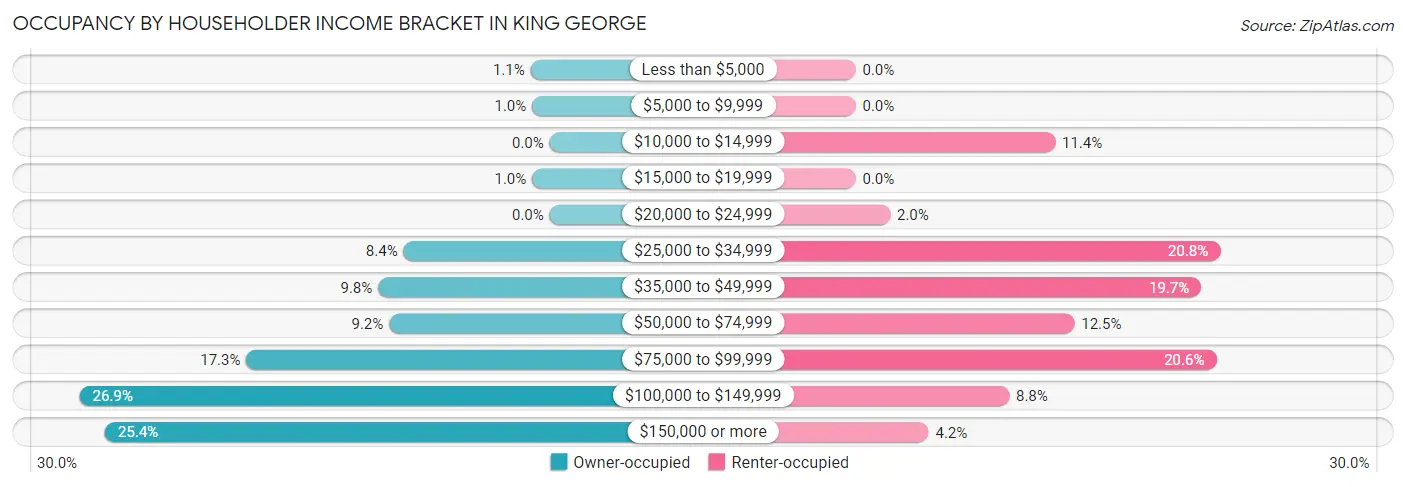
| Income Bracket | Owner-occupied | Renter-occupied |
| Less than $5,000 | 12 (1.1%) | 0 (0.0%) |
| $5,000 to $9,999 | 11 (1.0%) | 0 (0.0%) |
| $10,000 to $14,999 | 0 (0.0%) | 52 (11.4%) |
| $15,000 to $19,999 | 11 (1.0%) | 0 (0.0%) |
| $20,000 to $24,999 | 0 (0.0%) | 9 (2.0%) |
| $25,000 to $34,999 | 92 (8.4%) | 95 (20.8%) |
| $35,000 to $49,999 | 108 (9.8%) | 90 (19.7%) |
| $50,000 to $74,999 | 101 (9.2%) | 57 (12.5%) |
| $75,000 to $99,999 | 191 (17.3%) | 94 (20.6%) |
| $100,000 to $149,999 | 296 (26.9%) | 40 (8.8%) |
| $150,000 or more | 280 (25.4%) | 19 (4.2%) |
| Total | 1,102 (100.0%) | 456 (100.0%) |
Monthly Housing Cost Tiers in King George
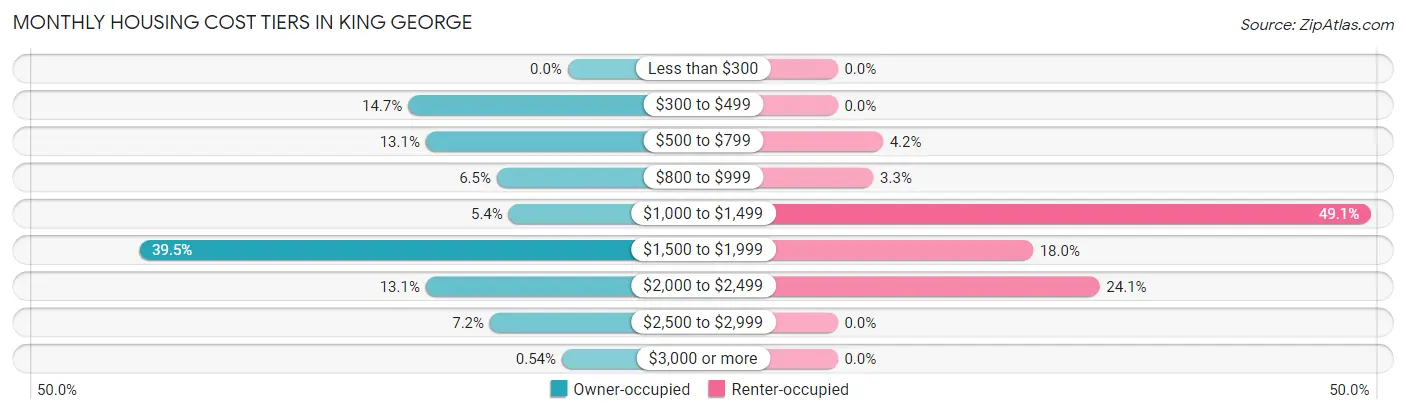
| Monthly Cost | Owner-occupied | Renter-occupied |
| Less than $300 | 0 (0.0%) | 0 (0.0%) |
| $300 to $499 | 162 (14.7%) | 0 (0.0%) |
| $500 to $799 | 144 (13.1%) | 19 (4.2%) |
| $800 to $999 | 72 (6.5%) | 15 (3.3%) |
| $1,000 to $1,499 | 60 (5.4%) | 224 (49.1%) |
| $1,500 to $1,999 | 435 (39.5%) | 82 (18.0%) |
| $2,000 to $2,499 | 144 (13.1%) | 110 (24.1%) |
| $2,500 to $2,999 | 79 (7.2%) | 0 (0.0%) |
| $3,000 or more | 6 (0.5%) | 0 (0.0%) |
| Total | 1,102 (100.0%) | 456 (100.0%) |
Physical Housing Characteristics in King George
Housing Structures in King George
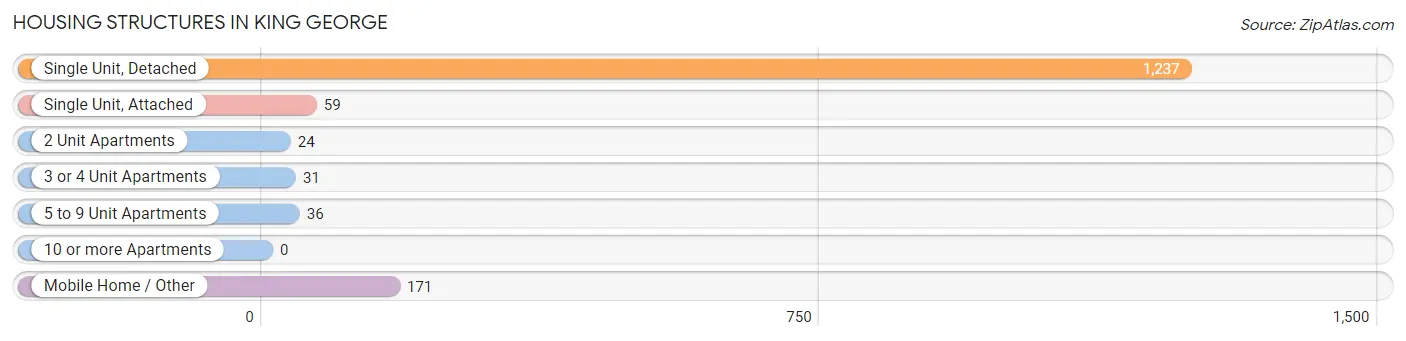
| Structure Type | # Housing Units | % Housing Units |
| Single Unit, Detached | 1,237 | 79.4% |
| Single Unit, Attached | 59 | 3.8% |
| 2 Unit Apartments | 24 | 1.5% |
| 3 or 4 Unit Apartments | 31 | 2.0% |
| 5 to 9 Unit Apartments | 36 | 2.3% |
| 10 or more Apartments | 0 | 0.0% |
| Mobile Home / Other | 171 | 11.0% |
| Total | 1,558 | 100.0% |
Housing Structures by Occupancy in King George
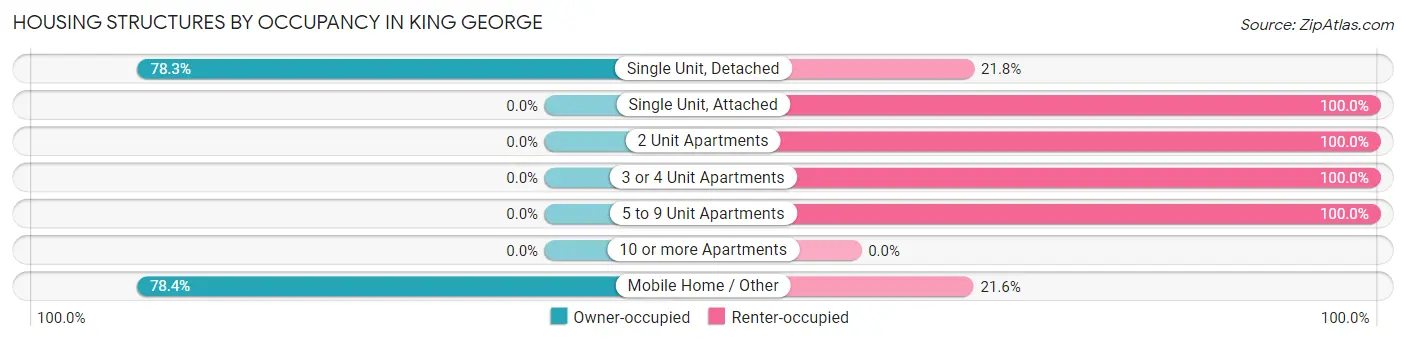
| Structure Type | Owner-occupied | Renter-occupied |
| Single Unit, Detached | 968 (78.2%) | 269 (21.7%) |
| Single Unit, Attached | 0 (0.0%) | 59 (100.0%) |
| 2 Unit Apartments | 0 (0.0%) | 24 (100.0%) |
| 3 or 4 Unit Apartments | 0 (0.0%) | 31 (100.0%) |
| 5 to 9 Unit Apartments | 0 (0.0%) | 36 (100.0%) |
| 10 or more Apartments | 0 (0.0%) | 0 (0.0%) |
| Mobile Home / Other | 134 (78.4%) | 37 (21.6%) |
| Total | 1,102 (70.7%) | 456 (29.3%) |
Housing Structures by Number of Rooms in King George
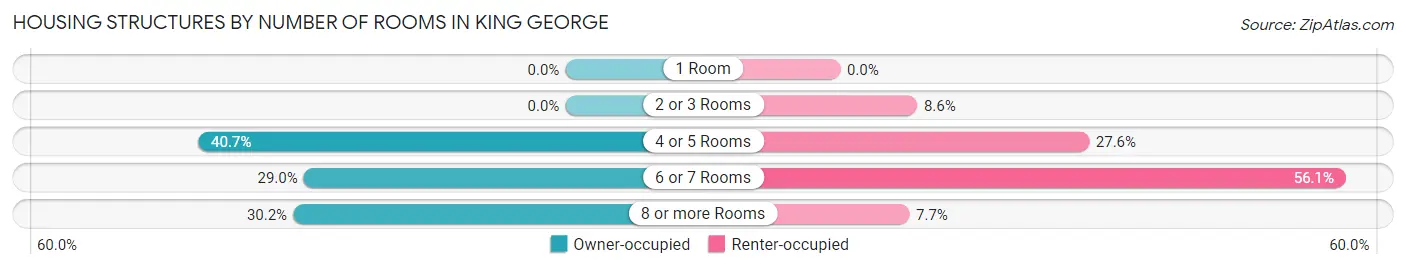
| Number of Rooms | Owner-occupied | Renter-occupied |
| 1 Room | 0 (0.0%) | 0 (0.0%) |
| 2 or 3 Rooms | 0 (0.0%) | 39 (8.6%) |
| 4 or 5 Rooms | 449 (40.7%) | 126 (27.6%) |
| 6 or 7 Rooms | 320 (29.0%) | 256 (56.1%) |
| 8 or more Rooms | 333 (30.2%) | 35 (7.7%) |
| Total | 1,102 (100.0%) | 456 (100.0%) |
Housing Structure by Heating Type in King George
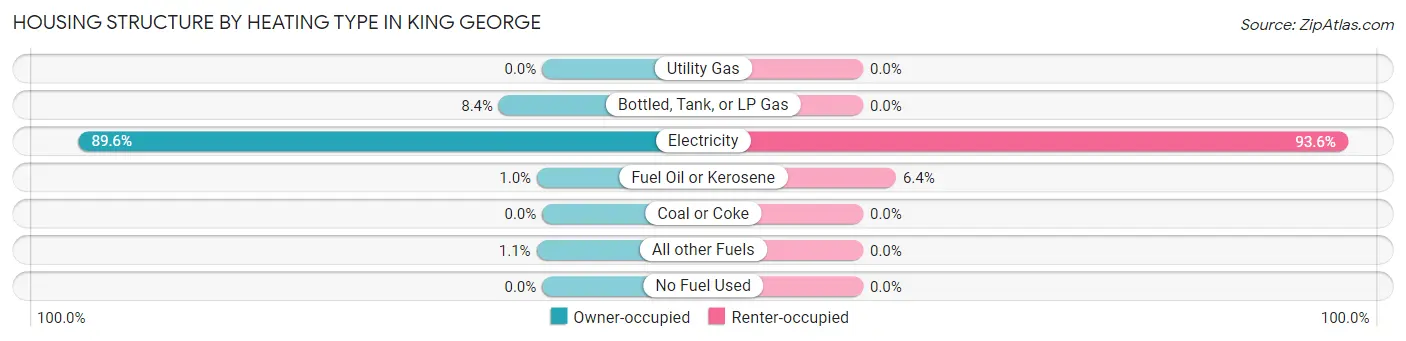
| Heating Type | Owner-occupied | Renter-occupied |
| Utility Gas | 0 (0.0%) | 0 (0.0%) |
| Bottled, Tank, or LP Gas | 92 (8.4%) | 0 (0.0%) |
| Electricity | 987 (89.6%) | 427 (93.6%) |
| Fuel Oil or Kerosene | 11 (1.0%) | 29 (6.4%) |
| Coal or Coke | 0 (0.0%) | 0 (0.0%) |
| All other Fuels | 12 (1.1%) | 0 (0.0%) |
| No Fuel Used | 0 (0.0%) | 0 (0.0%) |
| Total | 1,102 (100.0%) | 456 (100.0%) |
Household Vehicle Usage in King George
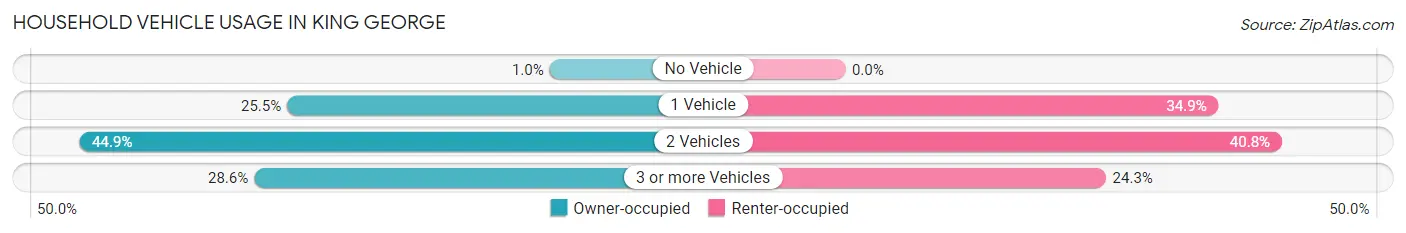
| Vehicles per Household | Owner-occupied | Renter-occupied |
| No Vehicle | 11 (1.0%) | 0 (0.0%) |
| 1 Vehicle | 281 (25.5%) | 159 (34.9%) |
| 2 Vehicles | 495 (44.9%) | 186 (40.8%) |
| 3 or more Vehicles | 315 (28.6%) | 111 (24.3%) |
| Total | 1,102 (100.0%) | 456 (100.0%) |
Real Estate & Mortgages in King George
Real Estate and Mortgage Overview in King George
| Characteristic | Without Mortgage | With Mortgage |
| Housing Units | 300 | 802 |
| Median Property Value | $184,500 | $336,300 |
| Median Household Income | $62,419 | $253 |
| Monthly Housing Costs | $483 | $6 |
| Real Estate Taxes | $1,013 | $37 |
Property Value by Mortgage Status in King George
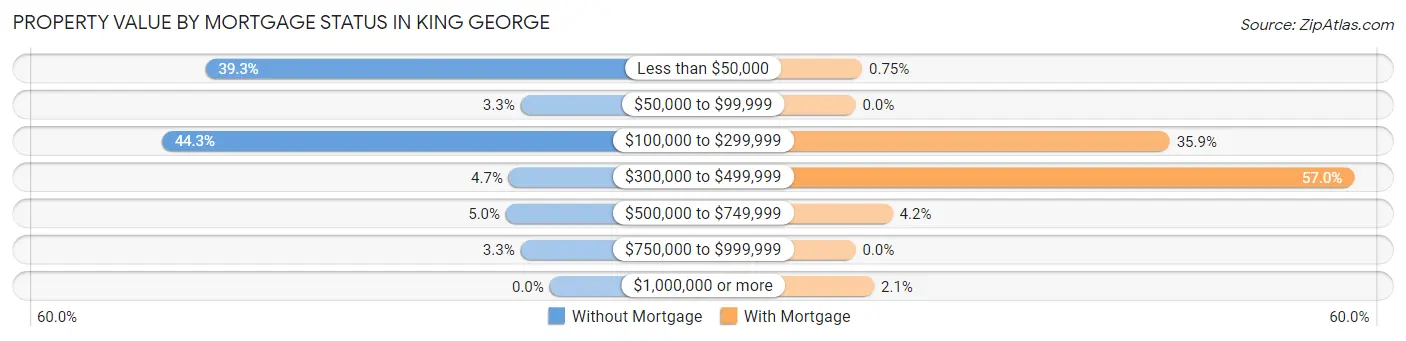
| Property Value | Without Mortgage | With Mortgage |
| Less than $50,000 | 118 (39.3%) | 6 (0.7%) |
| $50,000 to $99,999 | 10 (3.3%) | 0 (0.0%) |
| $100,000 to $299,999 | 133 (44.3%) | 288 (35.9%) |
| $300,000 to $499,999 | 14 (4.7%) | 457 (57.0%) |
| $500,000 to $749,999 | 15 (5.0%) | 34 (4.2%) |
| $750,000 to $999,999 | 10 (3.3%) | 0 (0.0%) |
| $1,000,000 or more | 0 (0.0%) | 17 (2.1%) |
| Total | 300 (100.0%) | 802 (100.0%) |
Household Income by Mortgage Status in King George
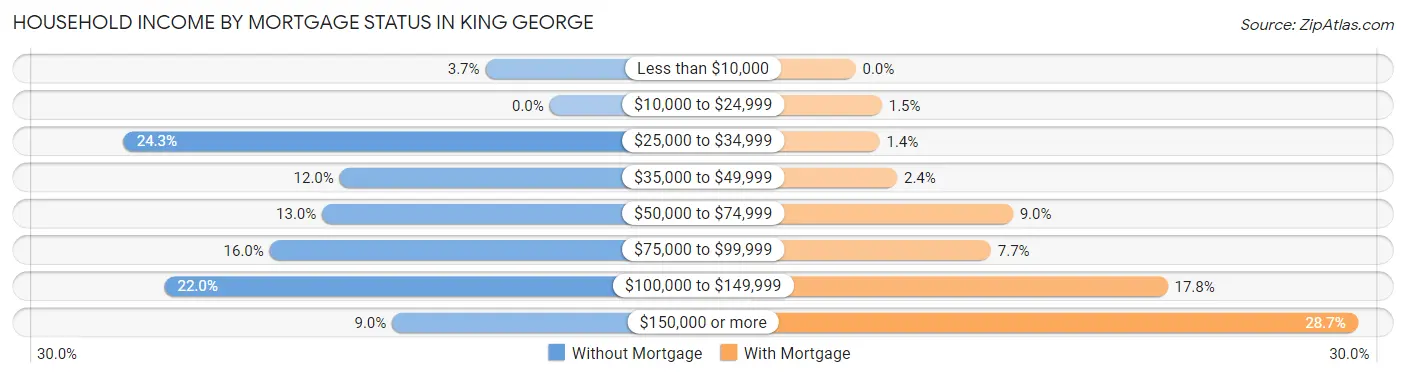
| Household Income | Without Mortgage | With Mortgage |
| Less than $10,000 | 11 (3.7%) | 0 (0.0%) |
| $10,000 to $24,999 | 0 (0.0%) | 12 (1.5%) |
| $25,000 to $34,999 | 73 (24.3%) | 11 (1.4%) |
| $35,000 to $49,999 | 36 (12.0%) | 19 (2.4%) |
| $50,000 to $74,999 | 39 (13.0%) | 72 (9.0%) |
| $75,000 to $99,999 | 48 (16.0%) | 62 (7.7%) |
| $100,000 to $149,999 | 66 (22.0%) | 143 (17.8%) |
| $150,000 or more | 27 (9.0%) | 230 (28.7%) |
| Total | 300 (100.0%) | 802 (100.0%) |
Property Value to Household Income Ratio in King George
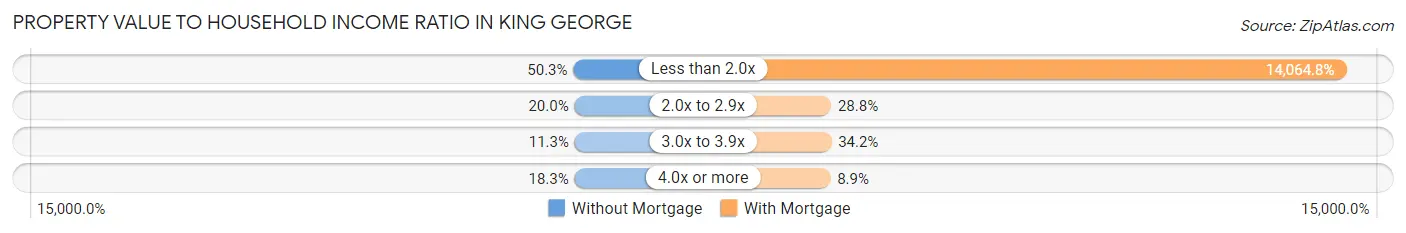
| Value-to-Income Ratio | Without Mortgage | With Mortgage |
| Less than 2.0x | 151 (50.3%) | 112,800 (14,064.8%) |
| 2.0x to 2.9x | 60 (20.0%) | 231 (28.8%) |
| 3.0x to 3.9x | 34 (11.3%) | 274 (34.2%) |
| 4.0x or more | 55 (18.3%) | 71 (8.8%) |
| Total | 300 (100.0%) | 802 (100.0%) |
Real Estate Taxes by Mortgage Status in King George
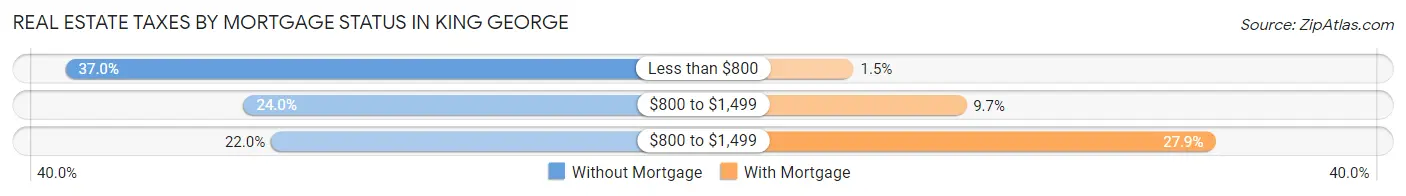
| Property Taxes | Without Mortgage | With Mortgage |
| Less than $800 | 111 (37.0%) | 12 (1.5%) |
| $800 to $1,499 | 72 (24.0%) | 78 (9.7%) |
| $800 to $1,499 | 66 (22.0%) | 224 (27.9%) |
| Total | 300 (100.0%) | 802 (100.0%) |
Health & Disability in King George
Health Insurance Coverage by Age in King George
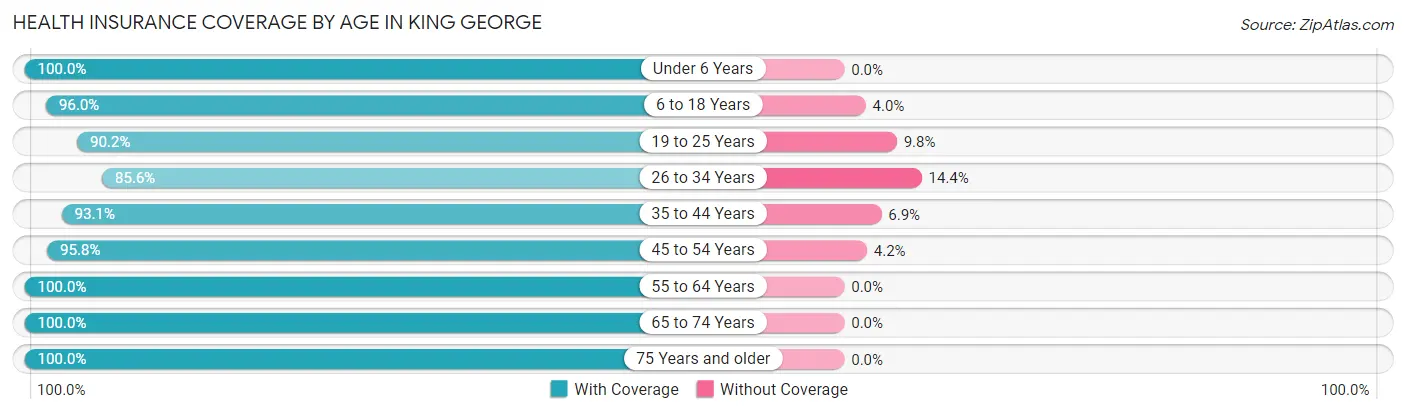
| Age Bracket | With Coverage | Without Coverage |
| Under 6 Years | 482 (100.0%) | 0 (0.0%) |
| 6 to 18 Years | 990 (96.0%) | 41 (4.0%) |
| 19 to 25 Years | 323 (90.2%) | 35 (9.8%) |
| 26 to 34 Years | 445 (85.6%) | 75 (14.4%) |
| 35 to 44 Years | 552 (93.1%) | 41 (6.9%) |
| 45 to 54 Years | 455 (95.8%) | 20 (4.2%) |
| 55 to 64 Years | 544 (100.0%) | 0 (0.0%) |
| 65 to 74 Years | 479 (100.0%) | 0 (0.0%) |
| 75 Years and older | 181 (100.0%) | 0 (0.0%) |
| Total | 4,451 (95.5%) | 212 (4.5%) |
Health Insurance Coverage by Citizenship Status in King George
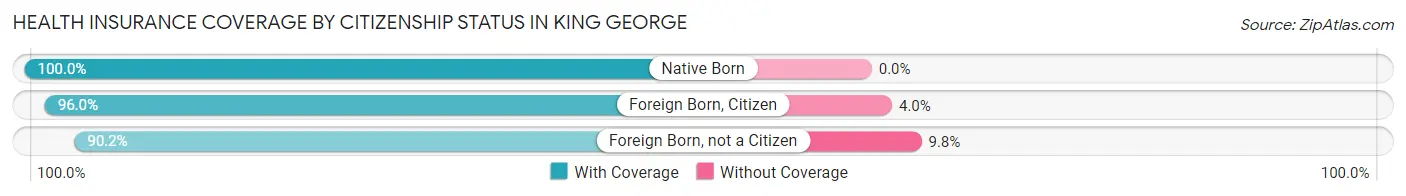
| Citizenship Status | With Coverage | Without Coverage |
| Native Born | 482 (100.0%) | 0 (0.0%) |
| Foreign Born, Citizen | 990 (96.0%) | 41 (4.0%) |
| Foreign Born, not a Citizen | 323 (90.2%) | 35 (9.8%) |
Health Insurance Coverage by Household Income in King George
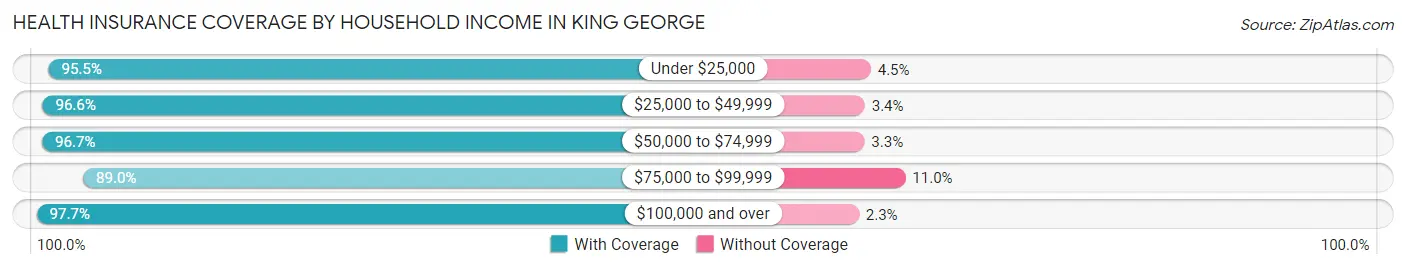
| Household Income | With Coverage | Without Coverage |
| Under $25,000 | 170 (95.5%) | 8 (4.5%) |
| $25,000 to $49,999 | 917 (96.6%) | 32 (3.4%) |
| $50,000 to $74,999 | 439 (96.7%) | 15 (3.3%) |
| $75,000 to $99,999 | 892 (89.0%) | 110 (11.0%) |
| $100,000 and over | 2,033 (97.7%) | 47 (2.3%) |
Public vs Private Health Insurance Coverage by Age in King George
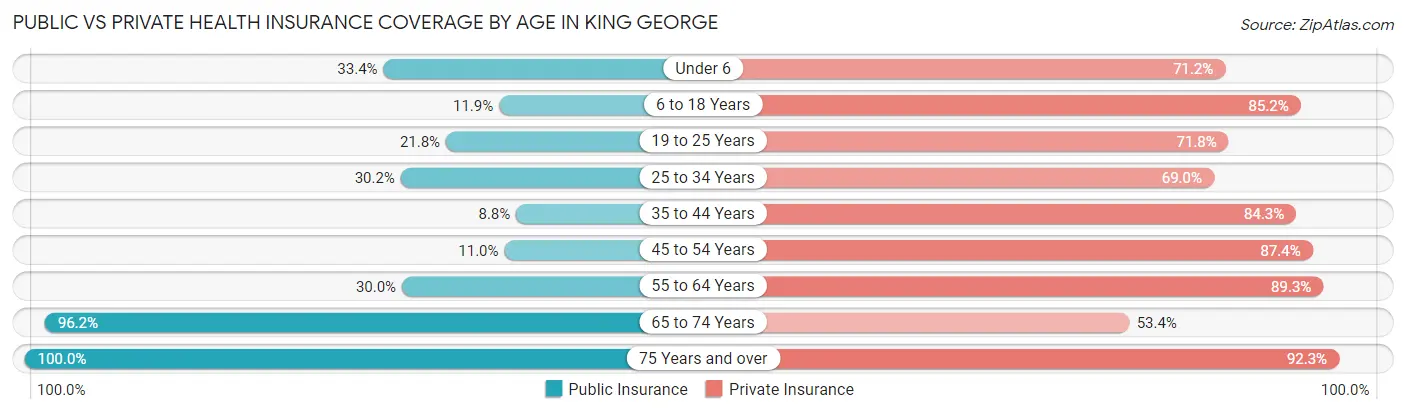
| Age Bracket | Public Insurance | Private Insurance |
| Under 6 | 161 (33.4%) | 343 (71.2%) |
| 6 to 18 Years | 123 (11.9%) | 878 (85.2%) |
| 19 to 25 Years | 78 (21.8%) | 257 (71.8%) |
| 25 to 34 Years | 157 (30.2%) | 359 (69.0%) |
| 35 to 44 Years | 52 (8.8%) | 500 (84.3%) |
| 45 to 54 Years | 52 (11.0%) | 415 (87.4%) |
| 55 to 64 Years | 163 (30.0%) | 486 (89.3%) |
| 65 to 74 Years | 461 (96.2%) | 256 (53.4%) |
| 75 Years and over | 181 (100.0%) | 167 (92.3%) |
| Total | 1,428 (30.6%) | 3,661 (78.5%) |
Disability Status by Sex by Age in King George
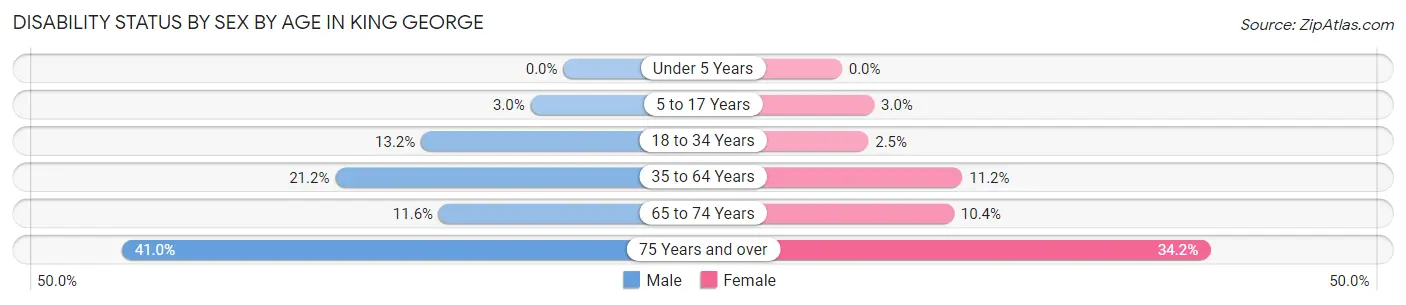
| Age Bracket | Male | Female |
| Under 5 Years | 0 (0.0%) | 0 (0.0%) |
| 5 to 17 Years | 17 (3.0%) | 14 (3.0%) |
| 18 to 34 Years | 64 (13.2%) | 12 (2.5%) |
| 35 to 64 Years | 152 (21.2%) | 100 (11.2%) |
| 65 to 74 Years | 32 (11.6%) | 21 (10.4%) |
| 75 Years and over | 25 (41.0%) | 41 (34.2%) |
Disability Class by Sex by Age in King George
Disability Class: Hearing Difficulty
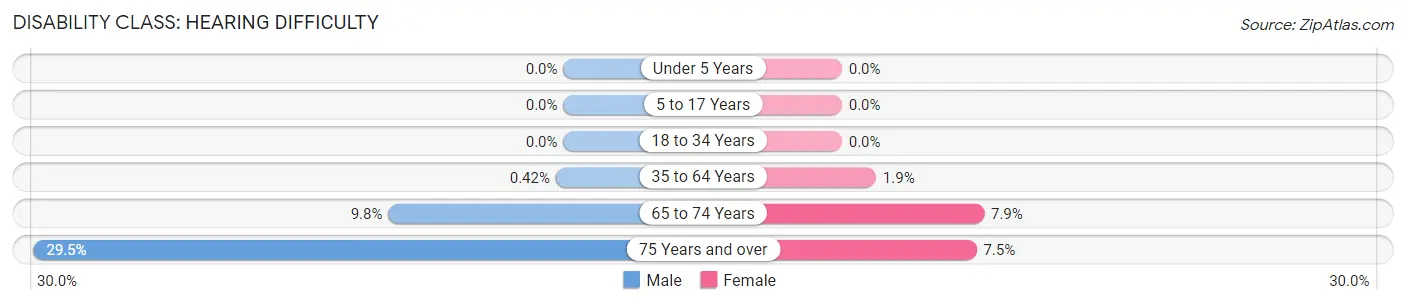
| Age Bracket | Male | Female |
| Under 5 Years | 0 (0.0%) | 0 (0.0%) |
| 5 to 17 Years | 0 (0.0%) | 0 (0.0%) |
| 18 to 34 Years | 0 (0.0%) | 0 (0.0%) |
| 35 to 64 Years | 3 (0.4%) | 17 (1.9%) |
| 65 to 74 Years | 27 (9.8%) | 16 (7.9%) |
| 75 Years and over | 18 (29.5%) | 9 (7.5%) |
Disability Class: Vision Difficulty
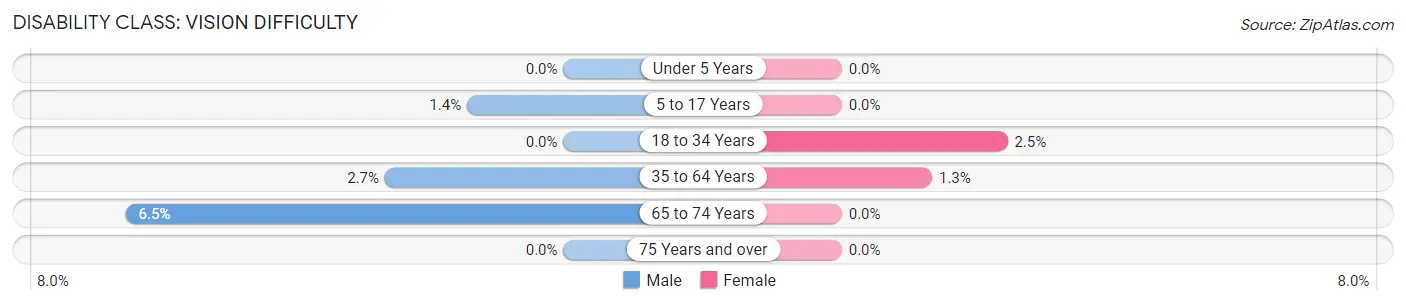
| Age Bracket | Male | Female |
| Under 5 Years | 0 (0.0%) | 0 (0.0%) |
| 5 to 17 Years | 8 (1.4%) | 0 (0.0%) |
| 18 to 34 Years | 0 (0.0%) | 12 (2.5%) |
| 35 to 64 Years | 19 (2.6%) | 12 (1.3%) |
| 65 to 74 Years | 18 (6.5%) | 0 (0.0%) |
| 75 Years and over | 0 (0.0%) | 0 (0.0%) |
Disability Class: Cognitive Difficulty
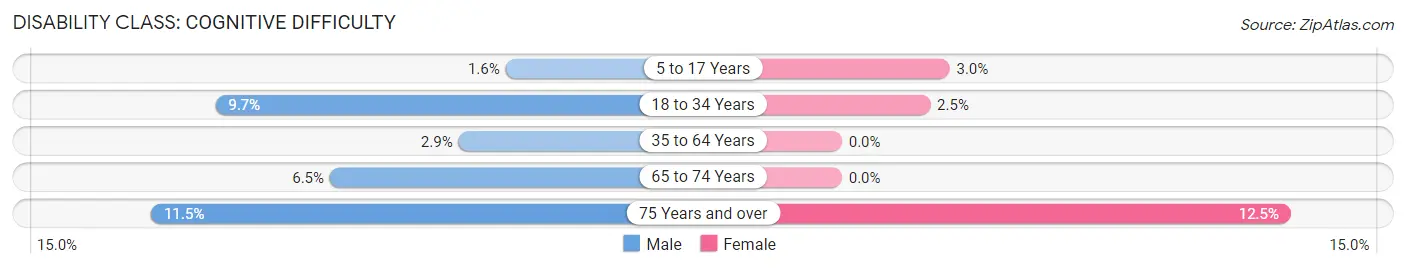
| Age Bracket | Male | Female |
| 5 to 17 Years | 9 (1.6%) | 14 (3.0%) |
| 18 to 34 Years | 47 (9.7%) | 12 (2.5%) |
| 35 to 64 Years | 21 (2.9%) | 0 (0.0%) |
| 65 to 74 Years | 18 (6.5%) | 0 (0.0%) |
| 75 Years and over | 7 (11.5%) | 15 (12.5%) |
Disability Class: Ambulatory Difficulty
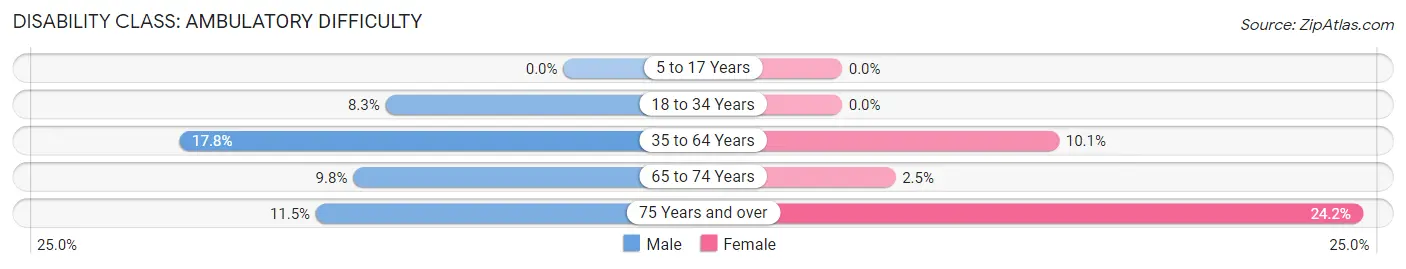
| Age Bracket | Male | Female |
| 5 to 17 Years | 0 (0.0%) | 0 (0.0%) |
| 18 to 34 Years | 40 (8.3%) | 0 (0.0%) |
| 35 to 64 Years | 128 (17.8%) | 90 (10.1%) |
| 65 to 74 Years | 27 (9.8%) | 5 (2.5%) |
| 75 Years and over | 7 (11.5%) | 29 (24.2%) |
Disability Class: Self-Care Difficulty
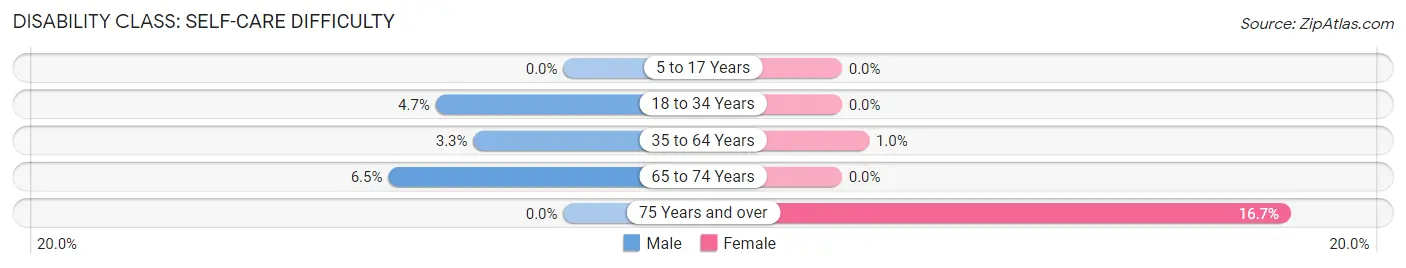
| Age Bracket | Male | Female |
| 5 to 17 Years | 0 (0.0%) | 0 (0.0%) |
| 18 to 34 Years | 23 (4.7%) | 0 (0.0%) |
| 35 to 64 Years | 24 (3.3%) | 9 (1.0%) |
| 65 to 74 Years | 18 (6.5%) | 0 (0.0%) |
| 75 Years and over | 0 (0.0%) | 20 (16.7%) |
Technology Access in King George
Computing Device Access in King George
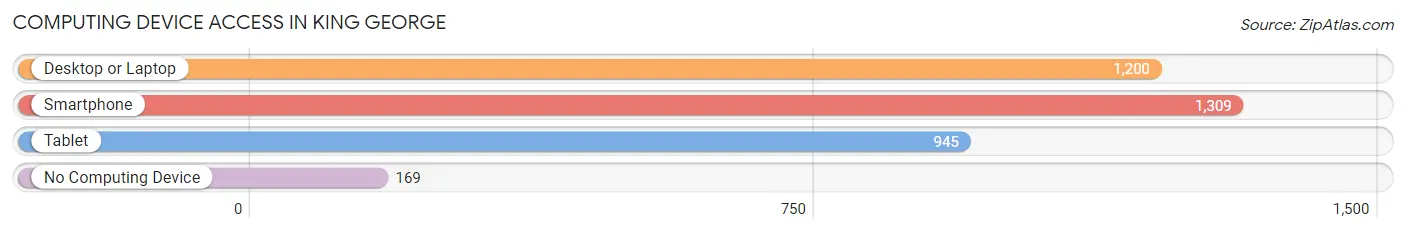
| Device Type | # Households | % Households |
| Desktop or Laptop | 1,200 | 77.0% |
| Smartphone | 1,309 | 84.0% |
| Tablet | 945 | 60.7% |
| No Computing Device | 169 | 10.8% |
| Total | 1,558 | 100.0% |
Internet Access in King George
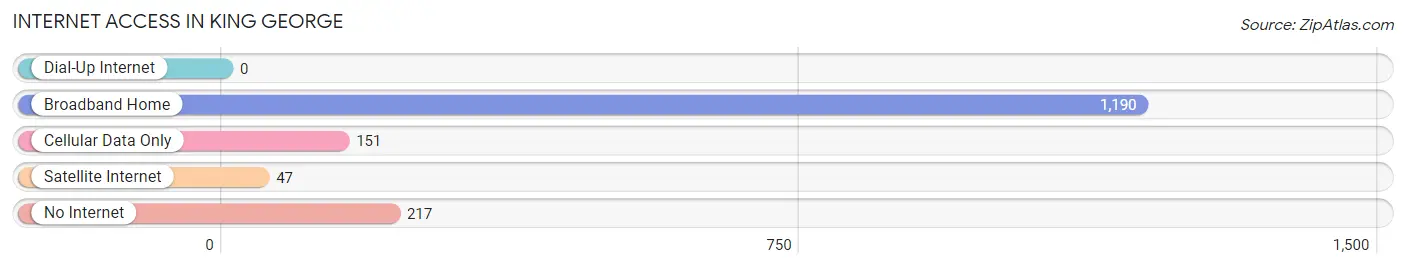
| Internet Type | # Households | % Households |
| Dial-Up Internet | 0 | 0.0% |
| Broadband Home | 1,190 | 76.4% |
| Cellular Data Only | 151 | 9.7% |
| Satellite Internet | 47 | 3.0% |
| No Internet | 217 | 13.9% |
| Total | 1,558 | 100.0% |
King George Summary
George, Virginia is a small town located in the Northern Neck region of the Commonwealth of Virginia. It is situated on the Rappahannock River, approximately 50 miles east of Fredericksburg and 70 miles south of Washington, D.C. The town is the county seat of King George County, which was established in 1720.
History
The area that is now King George was first settled by Europeans in the early 1700s. The town was originally known as “St. George’s Town” and was named after King George II of England. The town was officially established in 1720 and was the first county seat of King George County.
During the American Revolution, King George was a major supply center for the Continental Army. The town was also the site of several skirmishes between the British and American forces. After the war, the town continued to grow and prosper.
In the early 1800s, King George was a major port for the export of tobacco and other agricultural products. The town was also a popular destination for travelers, as it was located on the main road between Fredericksburg and Washington, D.C.
In the late 1800s, King George experienced a period of decline. The town’s economy was hurt by the decline of the tobacco industry and the rise of the railroad. The town’s population decreased and many of the businesses closed.
In the early 1900s, King George began to experience a period of revitalization. The town was connected to the national railroad system and the economy began to improve. The town also became a popular destination for tourists, as it was located on the main road between Washington, D.C. and the Northern Neck region.
Geography
King George is located in the Northern Neck region of Virginia. The town is situated on the Rappahannock River, approximately 50 miles east of Fredericksburg and 70 miles south of Washington, D.C. The town is surrounded by rolling hills and forests.
The climate in King George is humid subtropical, with hot, humid summers and mild winters. The average annual temperature is around 60 degrees Fahrenheit. The average annual precipitation is around 40 inches.
Economy
The economy of King George is largely based on agriculture and tourism. The town is home to several farms, which produce a variety of crops, including corn, soybeans, wheat, and hay. The town is also home to several wineries, which produce a variety of wines.
Tourism is also an important part of the economy. The town is home to several historic sites, including the King George Courthouse, which was built in 1720. The town is also home to several parks, including the Rappahannock Riverfront Park, which offers a variety of recreational activities.
Demographics
As of the 2010 census, the population of King George was 2,717. The racial makeup of the town was 87.3% White, 8.2% African American, 0.7% Native American, 0.7% Asian, 0.1% Pacific Islander, and 2.0% from other races. The median household income was $50,945.
King George is a small town with a rich history and a vibrant economy. The town is home to several historic sites, parks, and wineries, and is a popular destination for tourists. The town is also home to a diverse population, with a variety of racial and ethnic backgrounds.
Common Questions
What is Per Capita Income in King George?
Per Capita income in King George is $33,254.
What is the Median Family Income in King George?
Median Family Income in King George is $82,049.
What is the Median Household income in King George?
Median Household Income in King George is $83,750.
What is Income or Wage Gap in King George?
Income or Wage Gap in King George is 46.2%.
Women in King George earn 53.8 cents for every dollar earned by a man.
What is Inequality or Gini Index in King George?
Inequality or Gini Index in King George is 0.38.
What is the Total Population of King George?
Total Population of King George is 4,826.
What is the Total Male Population of King George?
Total Male Population of King George is 2,408.
What is the Total Female Population of King George?
Total Female Population of King George is 2,418.
What is the Ratio of Males per 100 Females in King George?
There are 99.59 Males per 100 Females in King George.
What is the Ratio of Females per 100 Males in King George?
There are 100.42 Females per 100 Males in King George.
What is the Median Population Age in King George?
Median Population Age in King George is 35.1 Years.
What is the Average Family Size in King George
Average Family Size in King George is 3.4 People.
What is the Average Household Size in King George
Average Household Size in King George is 3.0 People.
How Large is the Labor Force in King George?
There are 2,128 People in the Labor Forcein in King George.
What is the Percentage of People in the Labor Force in King George?
61.1% of People are in the Labor Force in King George.
What is the Unemployment Rate in King George?
Unemployment Rate in King George is 3.5%.