Chincoteague, VA Map & Demographics
Chincoteague Map
Chincoteague Overview
$40,973
PER CAPITA INCOME
$82,266
AVG FAMILY INCOME
$46,319
AVG HOUSEHOLD INCOME
56.8%
WAGE / INCOME GAP [ % ]
43.2¢/ $1
WAGE / INCOME GAP [ $ ]
0.51
INEQUALITY / GINI INDEX
3,303
TOTAL POPULATION
1,769
MALE POPULATION
1,534
FEMALE POPULATION
115.32
MALES / 100 FEMALES
86.72
FEMALES / 100 MALES
56.8
MEDIAN AGE
2.5
AVG FAMILY SIZE
1.8
AVG HOUSEHOLD SIZE
1,368
LABOR FORCE [ PEOPLE ]
47.3%
PERCENT IN LABOR FORCE
7.2%
UNEMPLOYMENT RATE
Chincoteague Area Codes
Income in Chincoteague
Income Overview in Chincoteague
Per Capita Income in Chincoteague is $40,973, while median incomes of families and households are $82,266 and $46,319 respectively.
| Characteristic | Number | Measure |
| Per Capita Income | 3,303 | $40,973 |
| Median Family Income | 955 | $82,266 |
| Mean Family Income | 955 | $106,214 |
| Median Household Income | 1,798 | $46,319 |
| Mean Household Income | 1,798 | $77,251 |
| Income Deficit | 955 | $0 |
| Wage / Income Gap (%) | 3,303 | 56.77% |
| Wage / Income Gap ($) | 3,303 | 43.23¢ per $1 |
| Gini / Inequality Index | 3,303 | 0.51 |
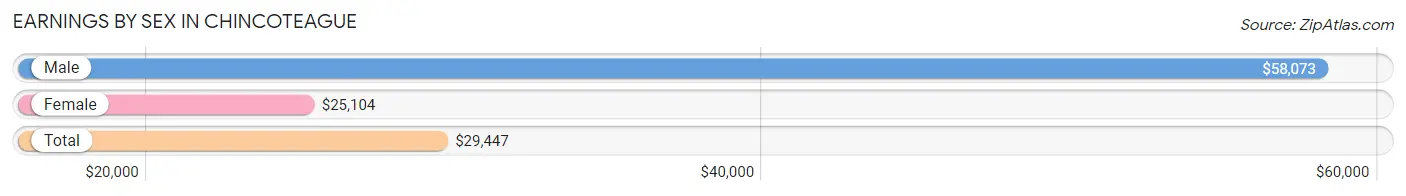
Earnings by Sex in Chincoteague
Average Earnings in Chincoteague are $29,447, $58,073 for men and $25,104 for women, a difference of 56.8%.
| Sex | Number | Average Earnings |
| Male | 901 (61.8%) | $58,073 |
| Female | 556 (38.2%) | $25,104 |
| Total | 1,457 (100.0%) | $29,447 |
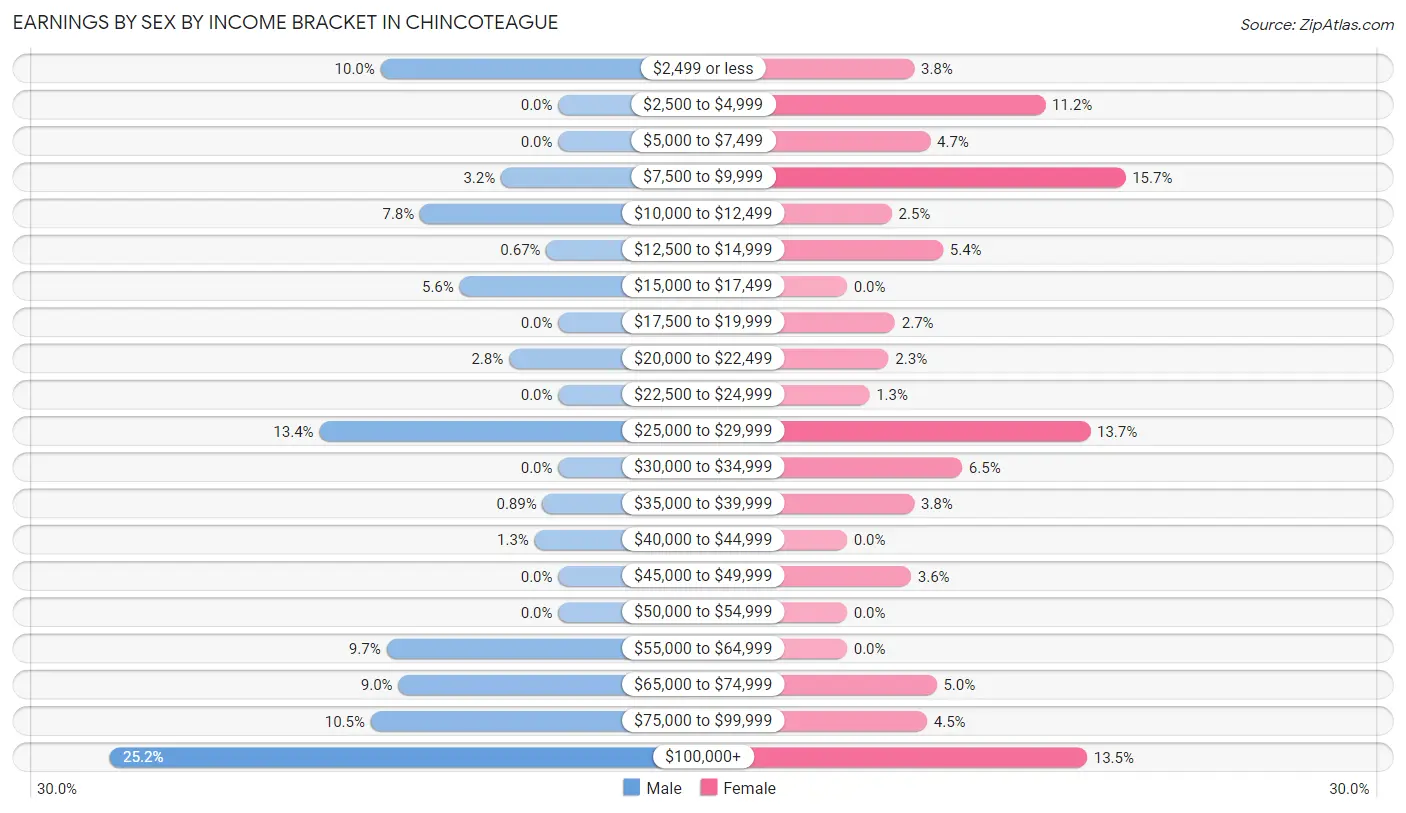
Earnings by Sex by Income Bracket in Chincoteague
The most common earnings brackets in Chincoteague are $100,000+ for men (227 | 25.2%) and $7,500 to $9,999 for women (87 | 15.7%).
| Income | Male | Female |
| $2,499 or less | 90 (10.0%) | 21 (3.8%) |
| $2,500 to $4,999 | 0 (0.0%) | 62 (11.2%) |
| $5,000 to $7,499 | 0 (0.0%) | 26 (4.7%) |
| $7,500 to $9,999 | 29 (3.2%) | 87 (15.7%) |
| $10,000 to $12,499 | 70 (7.8%) | 14 (2.5%) |
| $12,500 to $14,999 | 6 (0.7%) | 30 (5.4%) |
| $15,000 to $17,499 | 50 (5.6%) | 0 (0.0%) |
| $17,500 to $19,999 | 0 (0.0%) | 15 (2.7%) |
| $20,000 to $22,499 | 25 (2.8%) | 13 (2.3%) |
| $22,500 to $24,999 | 0 (0.0%) | 7 (1.3%) |
| $25,000 to $29,999 | 121 (13.4%) | 76 (13.7%) |
| $30,000 to $34,999 | 0 (0.0%) | 36 (6.5%) |
| $35,000 to $39,999 | 8 (0.9%) | 21 (3.8%) |
| $40,000 to $44,999 | 12 (1.3%) | 0 (0.0%) |
| $45,000 to $49,999 | 0 (0.0%) | 20 (3.6%) |
| $50,000 to $54,999 | 0 (0.0%) | 0 (0.0%) |
| $55,000 to $64,999 | 87 (9.7%) | 0 (0.0%) |
| $65,000 to $74,999 | 81 (9.0%) | 28 (5.0%) |
| $75,000 to $99,999 | 95 (10.5%) | 25 (4.5%) |
| $100,000+ | 227 (25.2%) | 75 (13.5%) |
| Total | 901 (100.0%) | 556 (100.0%) |
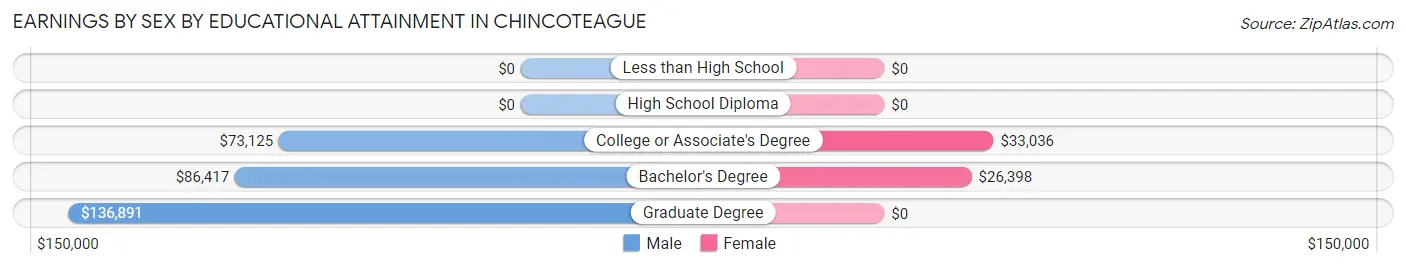
Earnings by Sex by Educational Attainment in Chincoteague
Average earnings in Chincoteague are $71,406 for men and $25,660 for women, a difference of 64.1%. Men with an educational attainment of graduate degree enjoy the highest average annual earnings of $136,891, while those with college or associate's degree education earn the least with $73,125. Women with an educational attainment of college or associate's degree earn the most with the average annual earnings of $33,036, while those with bachelor's degree education have the smallest earnings of $26,398.
| Educational Attainment | Male Income | Female Income |
| Less than High School | - | - |
| High School Diploma | - | - |
| College or Associate's Degree | $73,125 | $33,036 |
| Bachelor's Degree | $86,417 | $26,398 |
| Graduate Degree | $136,891 | $0 |
| Total | $71,406 | $25,660 |
Family Income in Chincoteague
Family Income Brackets in Chincoteague
According to the Chincoteague family income data, there are 200 families falling into the $35,000 to $49,999 income range, which is the most common income bracket and makes up 20.9% of all families. Conversely, the $10,000 to $14,999 income bracket is the least frequent group with only 16 families (1.7%) belonging to this category.
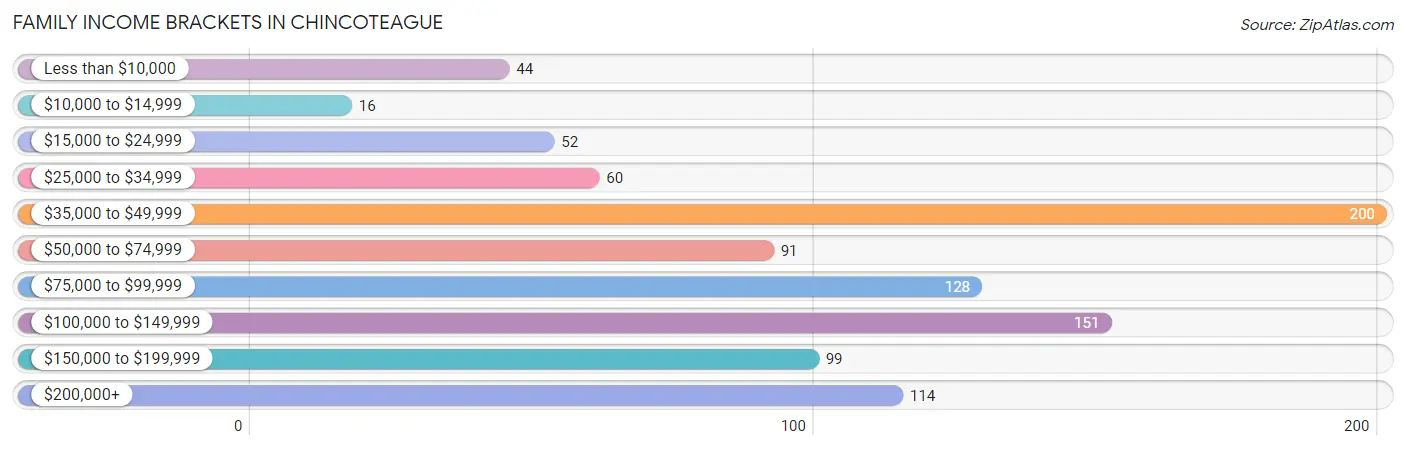
| Income Bracket | # Families | % Families |
| Less than $10,000 | 44 | 4.6% |
| $10,000 to $14,999 | 16 | 1.7% |
| $15,000 to $24,999 | 52 | 5.4% |
| $25,000 to $34,999 | 60 | 6.3% |
| $35,000 to $49,999 | 200 | 20.9% |
| $50,000 to $74,999 | 91 | 9.5% |
| $75,000 to $99,999 | 128 | 13.4% |
| $100,000 to $149,999 | 151 | 15.8% |
| $150,000 to $199,999 | 99 | 10.4% |
| $200,000+ | 114 | 11.9% |
Family Income by Famaliy Size in Chincoteague
4-person families (130 | 13.6%) account for the highest median family income in Chincoteague with $142,986 per family, while 4-person families (130 | 13.6%) have the highest median income of $35,746 per family member.
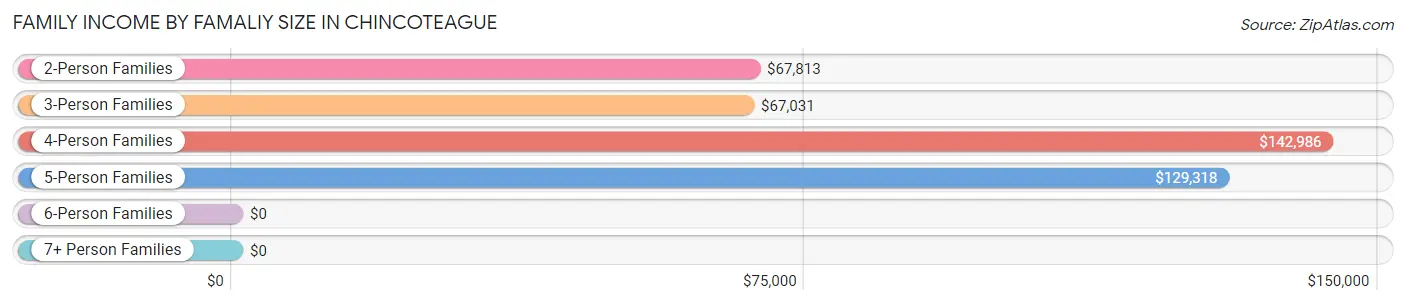
| Income Bracket | # Families | Median Income |
| 2-Person Families | 636 (66.6%) | $67,813 |
| 3-Person Families | 135 (14.1%) | $67,031 |
| 4-Person Families | 130 (13.6%) | $142,986 |
| 5-Person Families | 54 (5.7%) | $129,318 |
| 6-Person Families | 0 (0.0%) | $0 |
| 7+ Person Families | 0 (0.0%) | $0 |
| Total | 955 (100.0%) | $82,266 |
Family Income by Number of Earners in Chincoteague
The median family income in Chincoteague is $82,266, with families comprising 3+ earners (47) having the highest median family income of $175,052, while families with no earners (326) have the lowest median family income of $38,548, accounting for 4.9% and 34.1% of families, respectively.
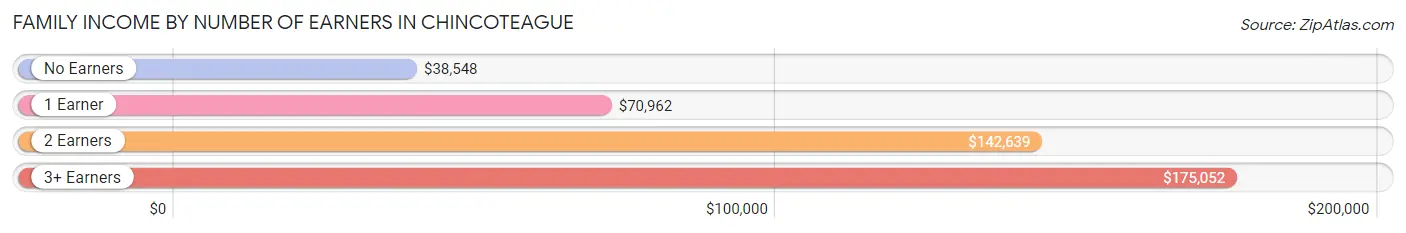
| Number of Earners | # Families | Median Income |
| No Earners | 326 (34.1%) | $38,548 |
| 1 Earner | 204 (21.4%) | $70,962 |
| 2 Earners | 378 (39.6%) | $142,639 |
| 3+ Earners | 47 (4.9%) | $175,052 |
| Total | 955 (100.0%) | $82,266 |
Household Income in Chincoteague
Household Income Brackets in Chincoteague
With 340 households falling in the category, the $35,000 to $49,999 income range is the most frequent in Chincoteague, accounting for 18.9% of all households. In contrast, only 22 households (1.2%) fall into the $10,000 to $14,999 income bracket, making it the least populous group.
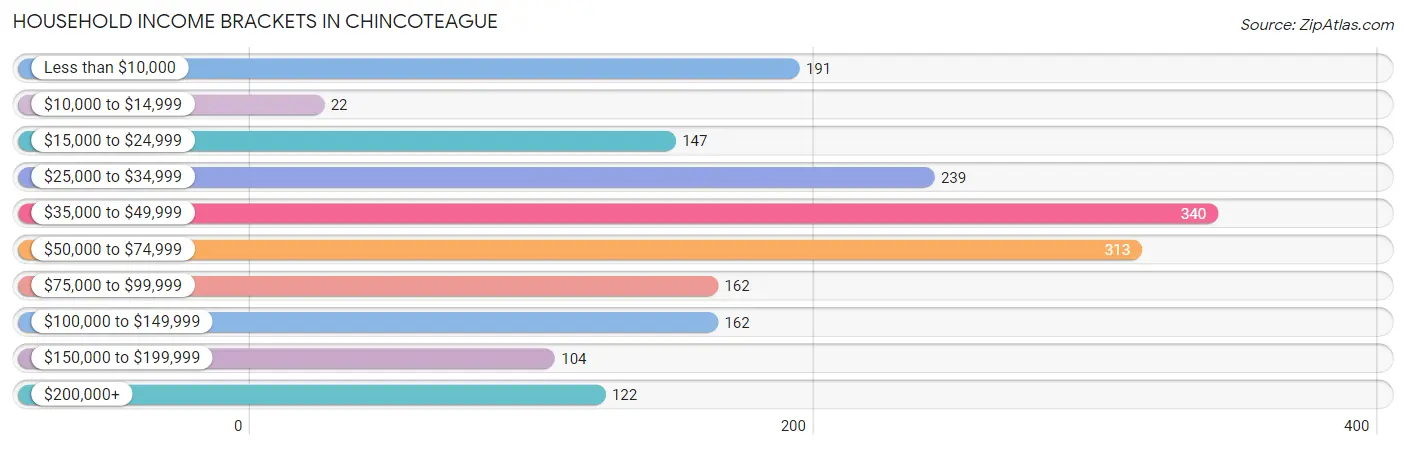
| Income Bracket | # Households | % Households |
| Less than $10,000 | 191 | 10.6% |
| $10,000 to $14,999 | 22 | 1.2% |
| $15,000 to $24,999 | 147 | 8.2% |
| $25,000 to $34,999 | 239 | 13.3% |
| $35,000 to $49,999 | 340 | 18.9% |
| $50,000 to $74,999 | 313 | 17.4% |
| $75,000 to $99,999 | 162 | 9.0% |
| $100,000 to $149,999 | 162 | 9.0% |
| $150,000 to $199,999 | 104 | 5.8% |
| $200,000+ | 122 | 6.8% |
Household Income by Householder Age in Chincoteague
The median household income in Chincoteague is $46,319, with the highest median household income of $70,719 found in the 25 to 44 years age bracket for the primary householder. A total of 285 households (15.9%) fall into this category. Meanwhile, the 15 to 24 years age bracket for the primary householder has the lowest median household income of $0, with 114 households (6.3%) in this group.
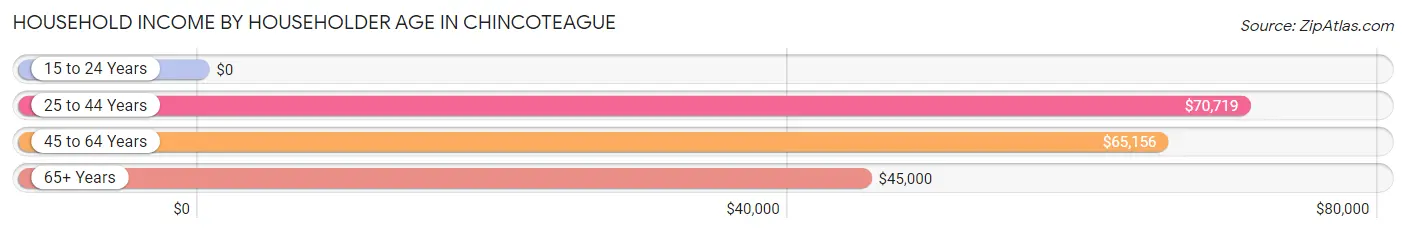
| Income Bracket | # Households | Median Income |
| 15 to 24 Years | 114 (6.3%) | $0 |
| 25 to 44 Years | 285 (15.9%) | $70,719 |
| 45 to 64 Years | 607 (33.8%) | $65,156 |
| 65+ Years | 792 (44.1%) | $45,000 |
| Total | 1,798 (100.0%) | $46,319 |
Poverty in Chincoteague
Income Below Poverty by Sex and Age in Chincoteague
With 10.7% poverty level for males and 12.3% for females among the residents of Chincoteague, 16 and 17 year old males and 65 to 74 year old females are the most vulnerable to poverty, with 57 males (60.6%) and 88 females (24.2%) in their respective age groups living below the poverty level.
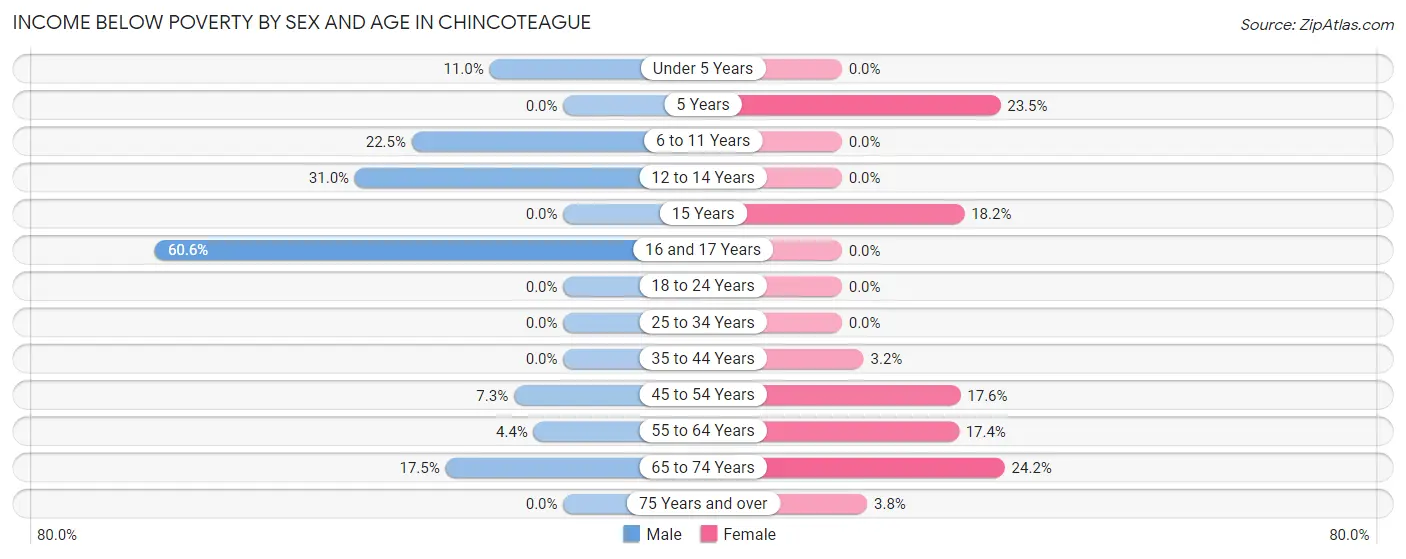
| Age Bracket | Male | Female |
| Under 5 Years | 8 (11.0%) | 0 (0.0%) |
| 5 Years | 0 (0.0%) | 8 (23.5%) |
| 6 to 11 Years | 9 (22.5%) | 0 (0.0%) |
| 12 to 14 Years | 13 (30.9%) | 0 (0.0%) |
| 15 Years | 0 (0.0%) | 4 (18.2%) |
| 16 and 17 Years | 57 (60.6%) | 0 (0.0%) |
| 18 to 24 Years | 0 (0.0%) | 0 (0.0%) |
| 25 to 34 Years | 0 (0.0%) | 0 (0.0%) |
| 35 to 44 Years | 0 (0.0%) | 6 (3.2%) |
| 45 to 54 Years | 11 (7.3%) | 28 (17.6%) |
| 55 to 64 Years | 12 (4.4%) | 46 (17.4%) |
| 65 to 74 Years | 78 (17.5%) | 88 (24.2%) |
| 75 Years and over | 0 (0.0%) | 8 (3.8%) |
| Total | 188 (10.7%) | 188 (12.3%) |
Income Above Poverty by Sex and Age in Chincoteague
According to the poverty statistics in Chincoteague, males aged 15 years and females aged under 5 years are the age groups that are most secure financially, with 100.0% of males and 100.0% of females in these age groups living above the poverty line.
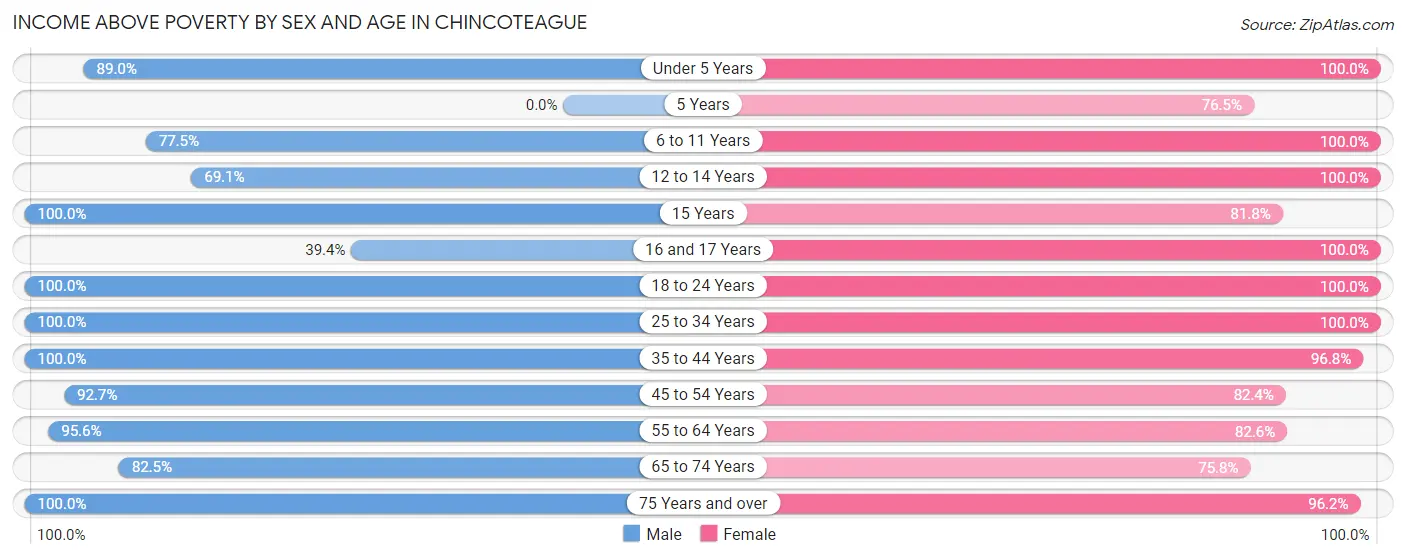
| Age Bracket | Male | Female |
| Under 5 Years | 65 (89.0%) | 94 (100.0%) |
| 5 Years | 0 (0.0%) | 26 (76.5%) |
| 6 to 11 Years | 31 (77.5%) | 39 (100.0%) |
| 12 to 14 Years | 29 (69.1%) | 23 (100.0%) |
| 15 Years | 39 (100.0%) | 18 (81.8%) |
| 16 and 17 Years | 37 (39.4%) | 6 (100.0%) |
| 18 to 24 Years | 119 (100.0%) | 26 (100.0%) |
| 25 to 34 Years | 101 (100.0%) | 104 (100.0%) |
| 35 to 44 Years | 200 (100.0%) | 179 (96.8%) |
| 45 to 54 Years | 139 (92.7%) | 131 (82.4%) |
| 55 to 64 Years | 260 (95.6%) | 219 (82.6%) |
| 65 to 74 Years | 368 (82.5%) | 276 (75.8%) |
| 75 Years and over | 188 (100.0%) | 205 (96.2%) |
| Total | 1,576 (89.3%) | 1,346 (87.7%) |
Income Below Poverty Among Married-Couple Families in Chincoteague
The poverty statistics for married-couple families in Chincoteague show that 6.5% or 57 of the total 874 families live below the poverty line. Families with no children have the highest poverty rate of 9.3%, comprising of 57 families. On the other hand, families with 1 or 2 children have the lowest poverty rate of 0.0%, which includes 0 families.
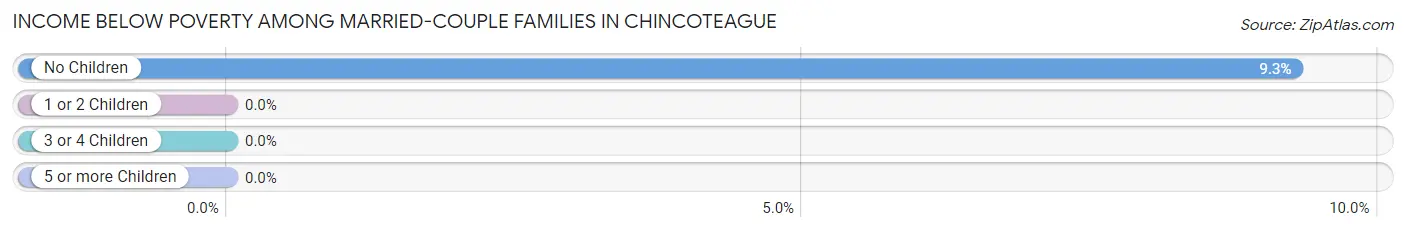
| Children | Above Poverty | Below Poverty |
| No Children | 558 (90.7%) | 57 (9.3%) |
| 1 or 2 Children | 245 (100.0%) | 0 (0.0%) |
| 3 or 4 Children | 14 (100.0%) | 0 (0.0%) |
| 5 or more Children | 0 (0.0%) | 0 (0.0%) |
| Total | 817 (93.5%) | 57 (6.5%) |
Income Below Poverty Among Single-Parent Households in Chincoteague
According to the poverty data in Chincoteague, 8.2% or 5 single-father households and 40.0% or 8 single-mother households are living below the poverty line. Among single-father households, those with 3 or 4 children have the highest poverty rate, with 5 households (100.0%) experiencing poverty. Likewise, among single-mother households, those with 1 or 2 children have the highest poverty rate, with 8 households (53.3%) falling below the poverty line.
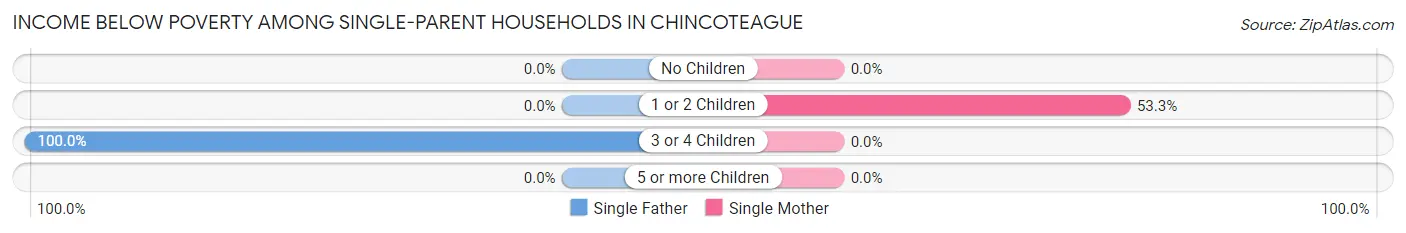
| Children | Single Father | Single Mother |
| No Children | 0 (0.0%) | 0 (0.0%) |
| 1 or 2 Children | 0 (0.0%) | 8 (53.3%) |
| 3 or 4 Children | 5 (100.0%) | 0 (0.0%) |
| 5 or more Children | 0 (0.0%) | 0 (0.0%) |
| Total | 5 (8.2%) | 8 (40.0%) |
Income Below Poverty Among Married-Couple vs Single-Parent Households in Chincoteague
The poverty data for Chincoteague shows that 57 of the married-couple family households (6.5%) and 13 of the single-parent households (16.1%) are living below the poverty level. Within the married-couple family households, those with no children have the highest poverty rate, with 57 households (9.3%) falling below the poverty line. Among the single-parent households, those with 3 or 4 children have the highest poverty rate, with 5 household (100.0%) living below poverty.
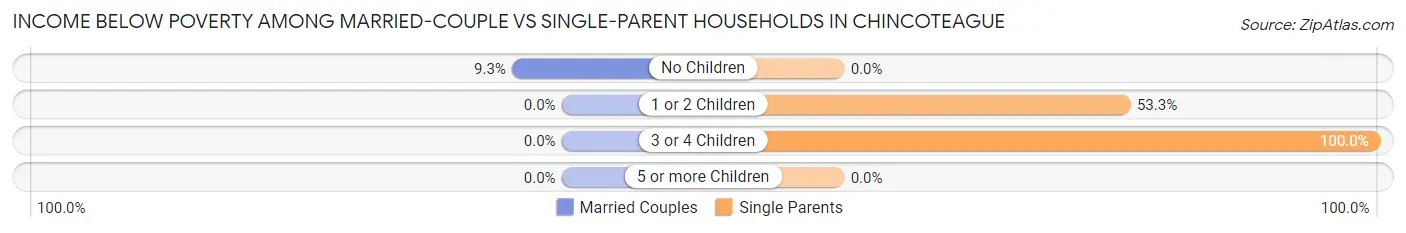
| Children | Married-Couple Families | Single-Parent Households |
| No Children | 57 (9.3%) | 0 (0.0%) |
| 1 or 2 Children | 0 (0.0%) | 8 (53.3%) |
| 3 or 4 Children | 0 (0.0%) | 5 (100.0%) |
| 5 or more Children | 0 (0.0%) | 0 (0.0%) |
| Total | 57 (6.5%) | 13 (16.1%) |
Race in Chincoteague
The most populous races in Chincoteague are White / Caucasian (3,177 | 96.2%), Two or more Races (126 | 3.8%), and Hispanic or Latino (76 | 2.3%).
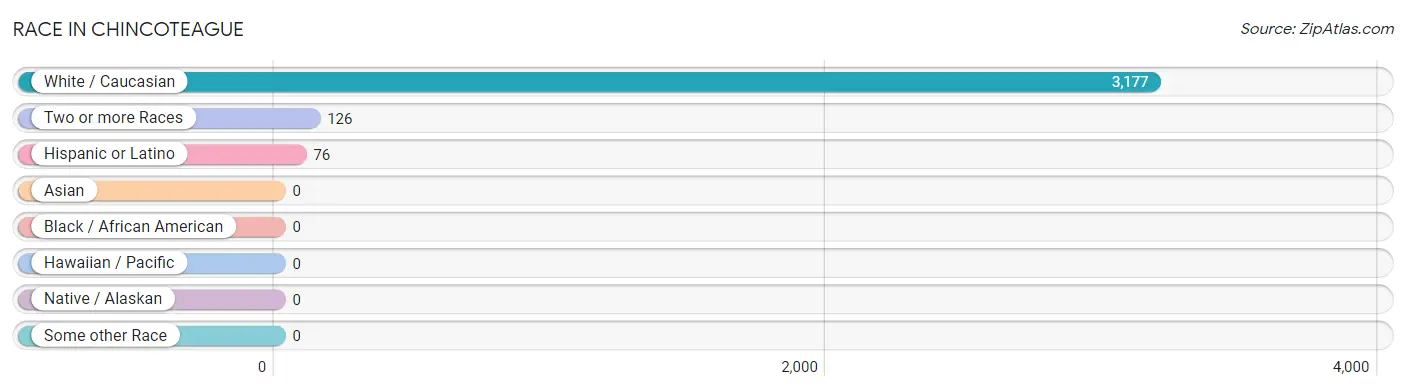
| Race | # Population | % Population |
| Asian | 0 | 0.0% |
| Black / African American | 0 | 0.0% |
| Hawaiian / Pacific | 0 | 0.0% |
| Hispanic or Latino | 76 | 2.3% |
| Native / Alaskan | 0 | 0.0% |
| White / Caucasian | 3,177 | 96.2% |
| Two or more Races | 126 | 3.8% |
| Some other Race | 0 | 0.0% |
| Total | 3,303 | 100.0% |
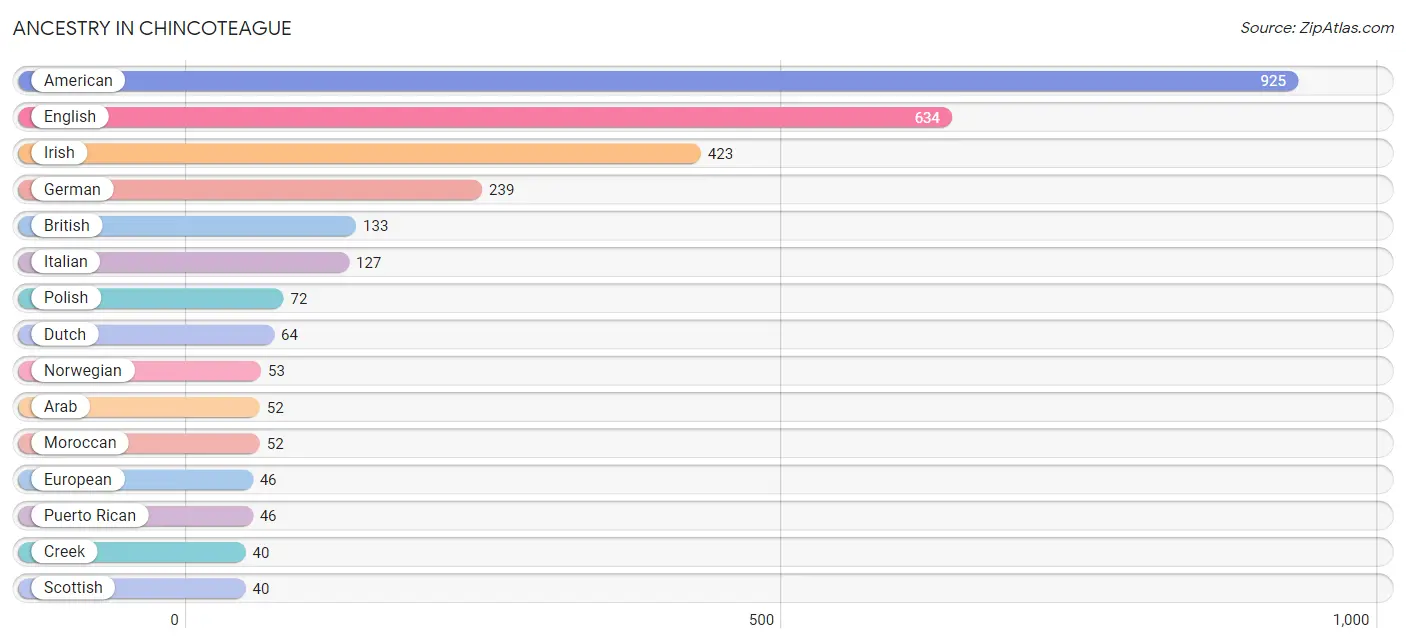
Ancestry in Chincoteague
The most populous ancestries reported in Chincoteague are American (925 | 28.0%), English (634 | 19.2%), Irish (423 | 12.8%), German (239 | 7.2%), and British (133 | 4.0%), together accounting for 71.3% of all Chincoteague residents.
| Ancestry | # Population | % Population |
| American | 925 | 28.0% |
| Arab | 52 | 1.6% |
| Austrian | 20 | 0.6% |
| British | 133 | 4.0% |
| Canadian | 27 | 0.8% |
| Cherokee | 5 | 0.2% |
| Creek | 40 | 1.2% |
| Danish | 20 | 0.6% |
| Dutch | 64 | 1.9% |
| English | 634 | 19.2% |
| European | 46 | 1.4% |
| Finnish | 7 | 0.2% |
| French | 20 | 0.6% |
| French Canadian | 34 | 1.0% |
| German | 239 | 7.2% |
| Hungarian | 15 | 0.4% |
| Irish | 423 | 12.8% |
| Italian | 127 | 3.8% |
| Lithuanian | 9 | 0.3% |
| Moroccan | 52 | 1.6% |
| Norwegian | 53 | 1.6% |
| Pennsylvania German | 8 | 0.2% |
| Polish | 72 | 2.2% |
| Puerto Rican | 46 | 1.4% |
| Russian | 8 | 0.2% |
| Scandinavian | 28 | 0.9% |
| Scotch-Irish | 28 | 0.9% |
| Scottish | 40 | 1.2% |
| Spaniard | 30 | 0.9% |
| Swedish | 8 | 0.2% |
| Swiss | 2 | 0.1% |
| Ukrainian | 29 | 0.9% |
| Welsh | 39 | 1.2% | View All 33 Rows |
Immigrants in Chincoteague
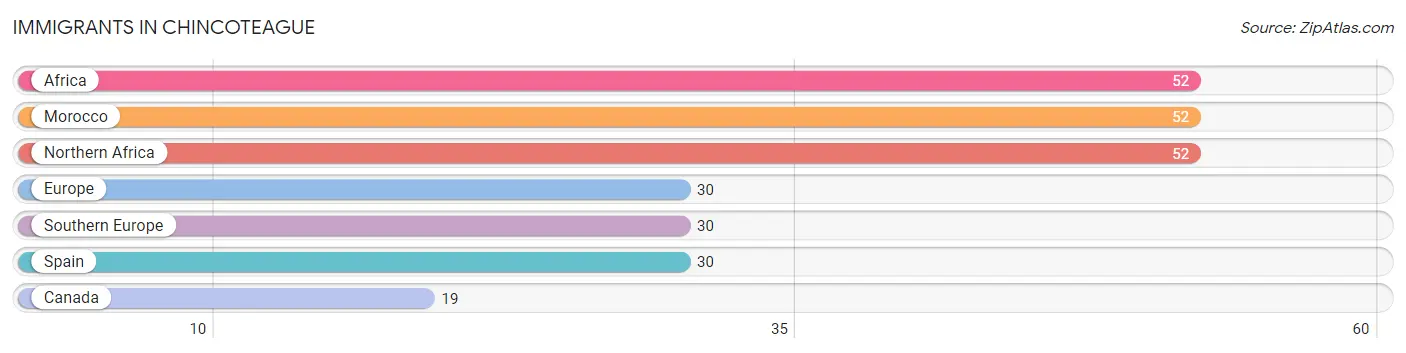
The most numerous immigrant groups reported in Chincoteague came from Africa (52 | 1.6%), Morocco (52 | 1.6%), Northern Africa (52 | 1.6%), Europe (30 | 0.9%), and Southern Europe (30 | 0.9%), together accounting for 6.5% of all Chincoteague residents.
| Immigration Origin | # Population | % Population |
| Africa | 52 | 1.6% |
| Canada | 19 | 0.6% |
| Europe | 30 | 0.9% |
| Morocco | 52 | 1.6% |
| Northern Africa | 52 | 1.6% |
| Southern Europe | 30 | 0.9% |
| Spain | 30 | 0.9% | View All 7 Rows |
Sex and Age in Chincoteague
Sex and Age in Chincoteague
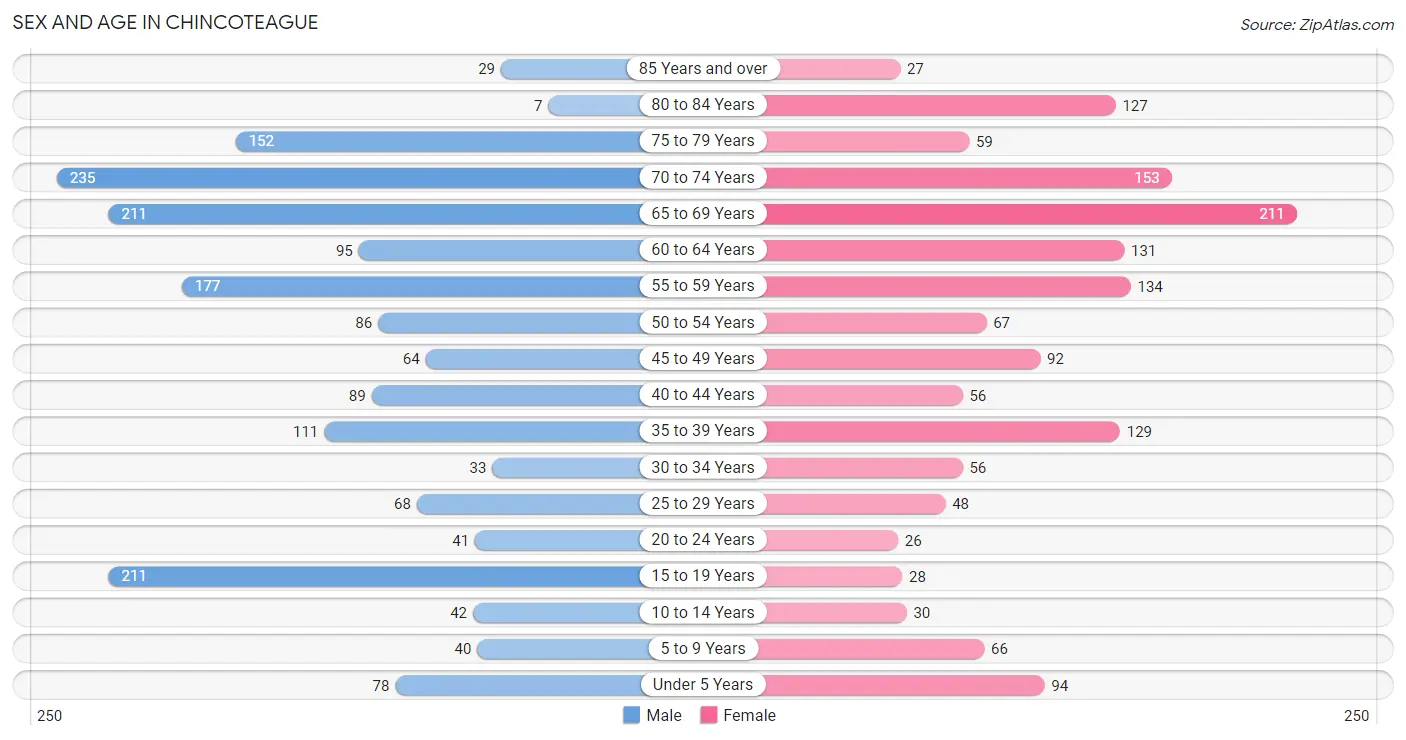
The most populous age groups in Chincoteague are 70 to 74 Years (235 | 13.3%) for men and 65 to 69 Years (211 | 13.8%) for women.
| Age Bracket | Male | Female |
| Under 5 Years | 78 (4.4%) | 94 (6.1%) |
| 5 to 9 Years | 40 (2.3%) | 66 (4.3%) |
| 10 to 14 Years | 42 (2.4%) | 30 (2.0%) |
| 15 to 19 Years | 211 (11.9%) | 28 (1.8%) |
| 20 to 24 Years | 41 (2.3%) | 26 (1.7%) |
| 25 to 29 Years | 68 (3.8%) | 48 (3.1%) |
| 30 to 34 Years | 33 (1.9%) | 56 (3.6%) |
| 35 to 39 Years | 111 (6.3%) | 129 (8.4%) |
| 40 to 44 Years | 89 (5.0%) | 56 (3.6%) |
| 45 to 49 Years | 64 (3.6%) | 92 (6.0%) |
| 50 to 54 Years | 86 (4.9%) | 67 (4.4%) |
| 55 to 59 Years | 177 (10.0%) | 134 (8.7%) |
| 60 to 64 Years | 95 (5.4%) | 131 (8.5%) |
| 65 to 69 Years | 211 (11.9%) | 211 (13.8%) |
| 70 to 74 Years | 235 (13.3%) | 153 (10.0%) |
| 75 to 79 Years | 152 (8.6%) | 59 (3.8%) |
| 80 to 84 Years | 7 (0.4%) | 127 (8.3%) |
| 85 Years and over | 29 (1.6%) | 27 (1.8%) |
| Total | 1,769 (100.0%) | 1,534 (100.0%) |
Families and Households in Chincoteague
Median Family Size in Chincoteague
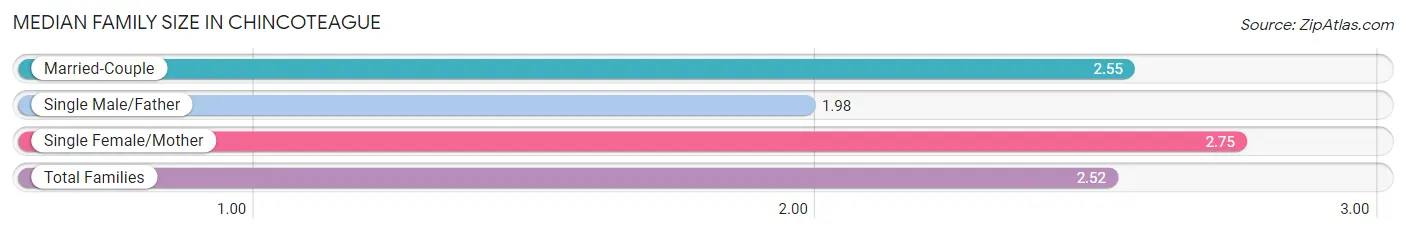
The median family size in Chincoteague is 2.52 persons per family, with single female/mother families (20 | 2.1%) accounting for the largest median family size of 2.75 persons per family. On the other hand, single male/father families (61 | 6.4%) represent the smallest median family size with 1.98 persons per family.
| Family Type | # Families | Family Size |
| Married-Couple | 874 (91.5%) | 2.55 |
| Single Male/Father | 61 (6.4%) | 1.98 |
| Single Female/Mother | 20 (2.1%) | 2.75 |
| Total Families | 955 (100.0%) | 2.52 |
Median Household Size in Chincoteague
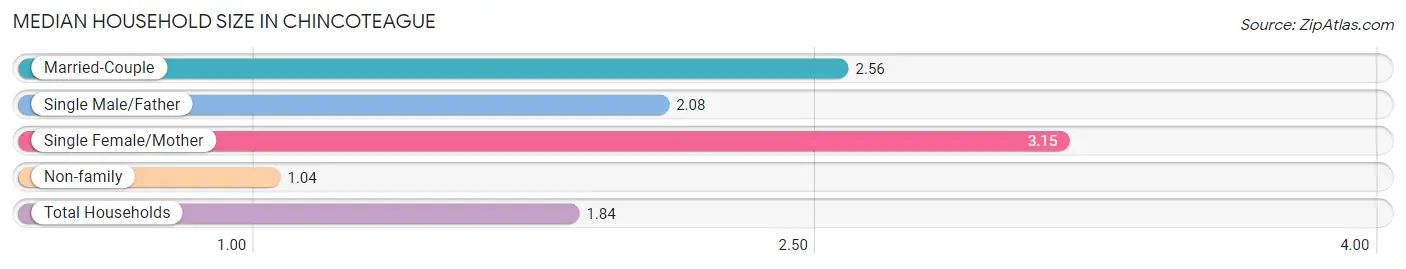
The median household size in Chincoteague is 1.84 persons per household, with single female/mother households (20 | 1.1%) accounting for the largest median household size of 3.15 persons per household. non-family households (843 | 46.9%) represent the smallest median household size with 1.04 persons per household.
| Household Type | # Households | Household Size |
| Married-Couple | 874 (48.6%) | 2.56 |
| Single Male/Father | 61 (3.4%) | 2.08 |
| Single Female/Mother | 20 (1.1%) | 3.15 |
| Non-family | 843 (46.9%) | 1.04 |
| Total Households | 1,798 (100.0%) | 1.84 |
Household Size by Marriage Status in Chincoteague
Out of a total of 1,798 households in Chincoteague, 955 (53.1%) are family households, while 843 (46.9%) are nonfamily households. The most numerous type of family households are 2-person households, comprising 622, and the most common type of nonfamily households are 1-person households, comprising 807.
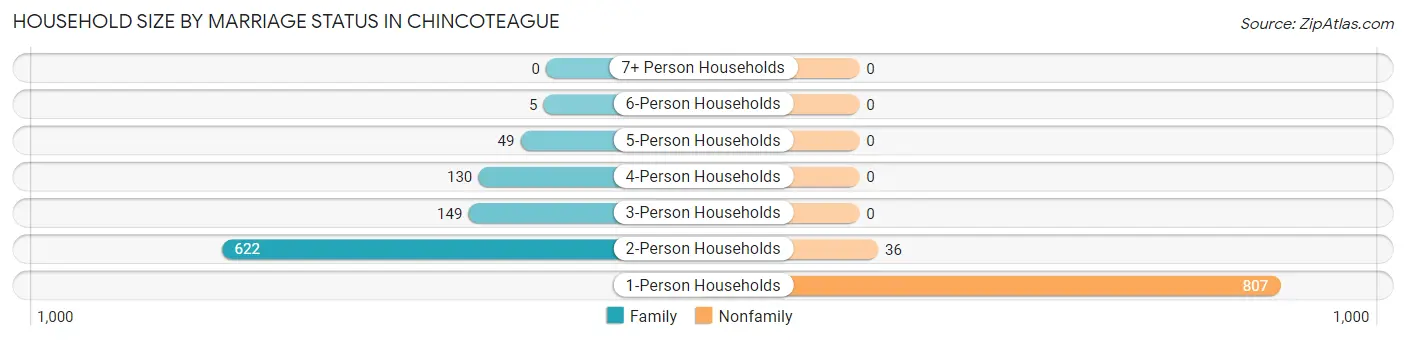
| Household Size | Family Households | Nonfamily Households |
| 1-Person Households | - | 807 (44.9%) |
| 2-Person Households | 622 (34.6%) | 36 (2.0%) |
| 3-Person Households | 149 (8.3%) | 0 (0.0%) |
| 4-Person Households | 130 (7.2%) | 0 (0.0%) |
| 5-Person Households | 49 (2.7%) | 0 (0.0%) |
| 6-Person Households | 5 (0.3%) | 0 (0.0%) |
| 7+ Person Households | 0 (0.0%) | 0 (0.0%) |
| Total | 955 (53.1%) | 843 (46.9%) |
Female Fertility in Chincoteague
Fertility by Age in Chincoteague
Average fertility rate in Chincoteague is 30.0 births per 1,000 women. Women in the age bracket of 20 to 34 years have the highest fertility rate with 100.0 births per 1,000 women. Women in the age bracket of 20 to 34 years acount for 100.0% of all women with births.
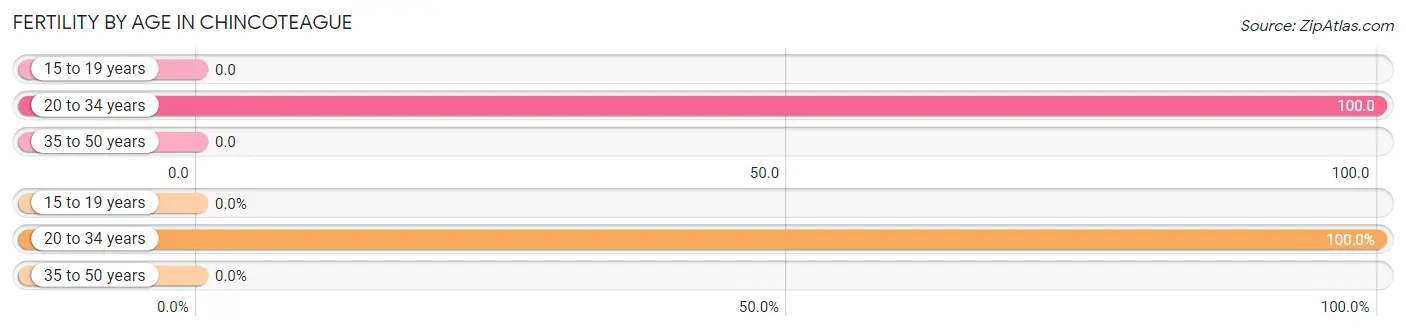
| Age Bracket | Women with Births | Births / 1,000 Women |
| 15 to 19 years | 0 (0.0%) | 0.0 |
| 20 to 34 years | 13 (100.0%) | 100.0 |
| 35 to 50 years | 0 (0.0%) | 0.0 |
| Total | 13 (100.0%) | 30.0 |
Fertility by Age by Marriage Status in Chincoteague
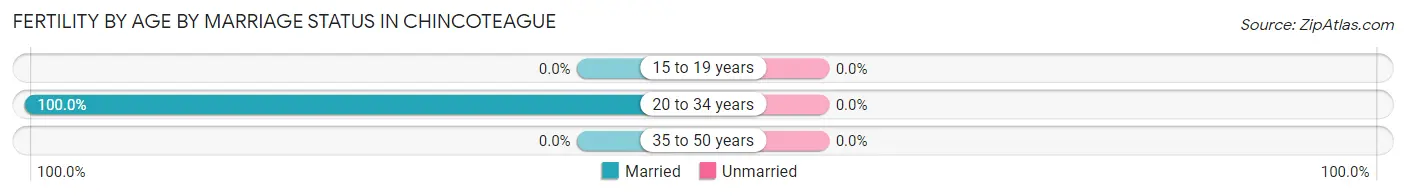
| Age Bracket | Married | Unmarried |
| 15 to 19 years | 0 (0.0%) | 0 (0.0%) |
| 20 to 34 years | 13 (100.0%) | 0 (0.0%) |
| 35 to 50 years | 0 (0.0%) | 0 (0.0%) |
| Total | 13 (100.0%) | 0 (0.0%) |
Fertility by Education in Chincoteague
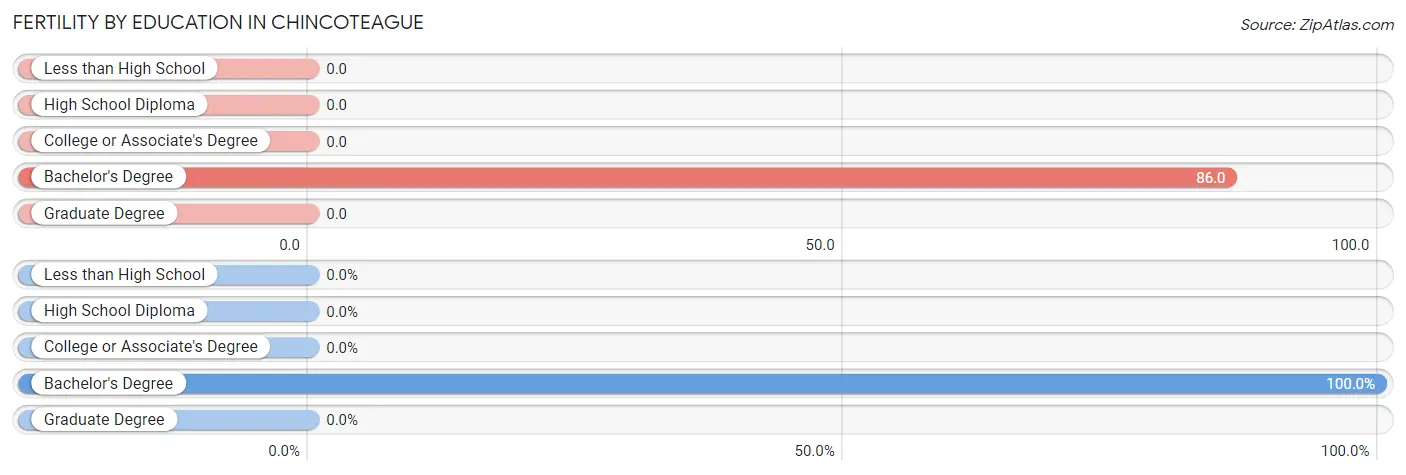
| Educational Attainment | Women with Births | Births / 1,000 Women |
| Less than High School | 0 (0.0%) | 0.0 |
| High School Diploma | 0 (0.0%) | 0.0 |
| College or Associate's Degree | 0 (0.0%) | 0.0 |
| Bachelor's Degree | 13 (100.0%) | 86.0 |
| Graduate Degree | 0 (0.0%) | 0.0 |
| Total | 13 (100.0%) | 30.0 |
Fertility by Education by Marriage Status in Chincoteague
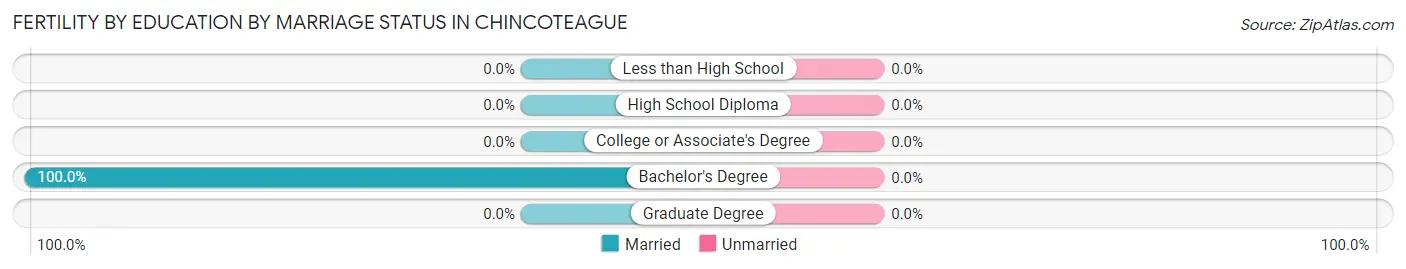
| Educational Attainment | Married | Unmarried |
| Less than High School | 0 (0.0%) | 0 (0.0%) |
| High School Diploma | 0 (0.0%) | 0 (0.0%) |
| College or Associate's Degree | 0 (0.0%) | 0 (0.0%) |
| Bachelor's Degree | 13 (100.0%) | 0 (0.0%) |
| Graduate Degree | 0 (0.0%) | 0 (0.0%) |
| Total | 13 (100.0%) | 0 (0.0%) |
Employment Characteristics in Chincoteague
Employment by Class of Employer in Chincoteague
Among the 1,256 employed individuals in Chincoteague, private company employees (597 | 47.5%), federal government employees (273 | 21.7%), and local government employees (153 | 12.2%) make up the most common classes of employment.
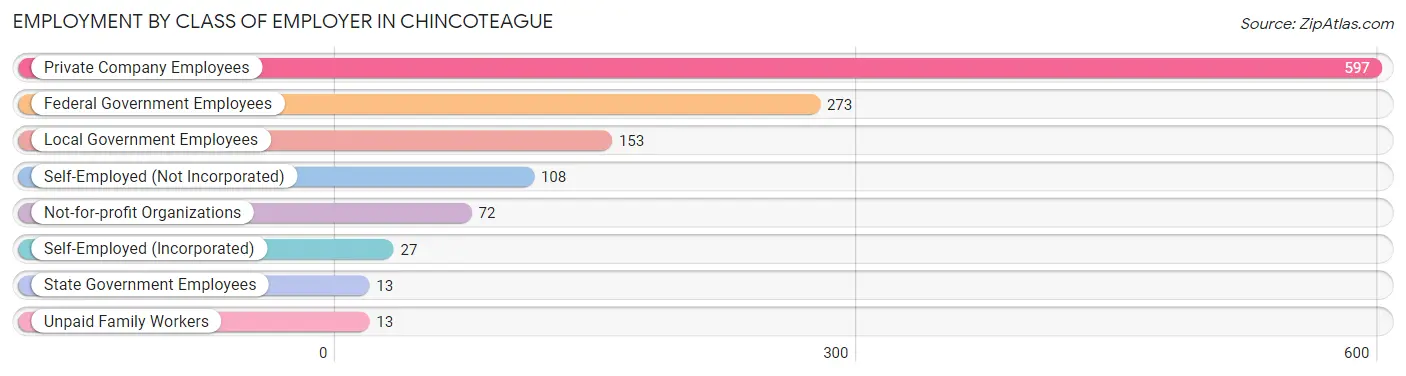
| Employer Class | # Employees | % Employees |
| Private Company Employees | 597 | 47.5% |
| Self-Employed (Incorporated) | 27 | 2.1% |
| Self-Employed (Not Incorporated) | 108 | 8.6% |
| Not-for-profit Organizations | 72 | 5.7% |
| Local Government Employees | 153 | 12.2% |
| State Government Employees | 13 | 1.0% |
| Federal Government Employees | 273 | 21.7% |
| Unpaid Family Workers | 13 | 1.0% |
| Total | 1,256 | 100.0% |
Employment Status by Age in Chincoteague
According to the labor force statistics for Chincoteague, out of the total population over 16 years of age (2,892), 47.3% or 1,368 individuals are in the labor force, with 7.2% or 98 of them unemployed. The age group with the highest labor force participation rate is 35 to 44 years, with 90.9% or 350 individuals in the labor force. Within the labor force, the 35 to 44 years age range has the highest percentage of unemployed individuals, with 14.9% or 52 of them being unemployed.
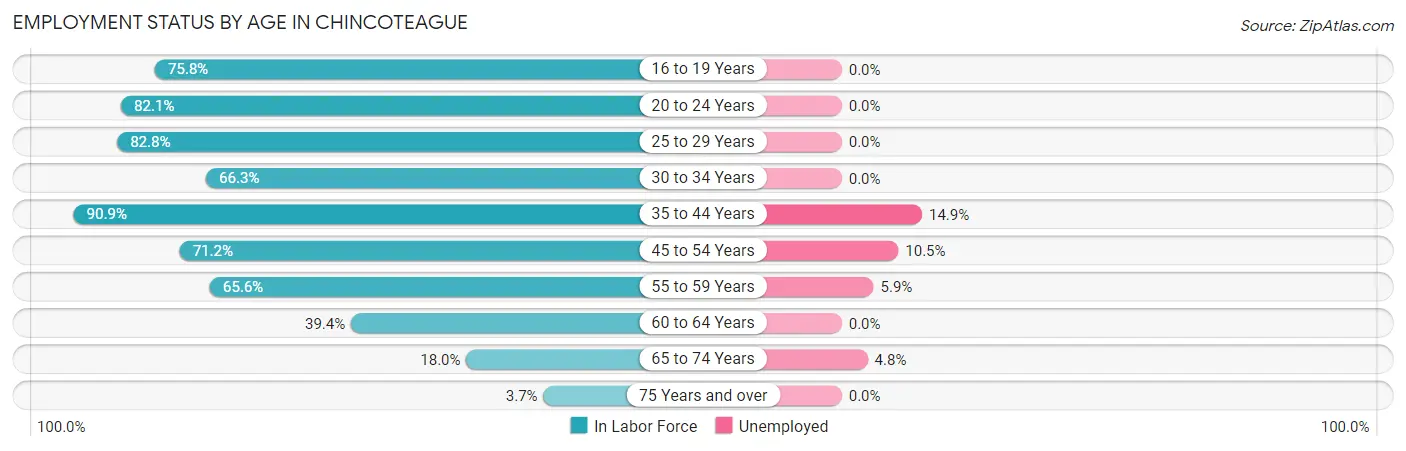
| Age Bracket | In Labor Force | Unemployed |
| 16 to 19 Years | 135 (75.8%) | 0 (0.0%) |
| 20 to 24 Years | 55 (82.1%) | 0 (0.0%) |
| 25 to 29 Years | 96 (82.8%) | 0 (0.0%) |
| 30 to 34 Years | 59 (66.3%) | 0 (0.0%) |
| 35 to 44 Years | 350 (90.9%) | 52 (14.9%) |
| 45 to 54 Years | 220 (71.2%) | 23 (10.5%) |
| 55 to 59 Years | 204 (65.6%) | 12 (5.9%) |
| 60 to 64 Years | 89 (39.4%) | 0 (0.0%) |
| 65 to 74 Years | 146 (18.0%) | 7 (4.8%) |
| 75 Years and over | 15 (3.7%) | 0 (0.0%) |
| Total | 1,368 (47.3%) | 98 (7.2%) |
Employment Status by Educational Attainment in Chincoteague
According to labor force statistics for Chincoteague, 70.9% of individuals (1,018) out of the total population between 25 and 64 years of age (1,436) are in the labor force, with 8.7% or 89 of them being unemployed. The group with the highest labor force participation rate are those with the educational attainment of bachelor's degree or higher, with 90.9% or 482 individuals in the labor force. Within the labor force, individuals with high school diploma education have the highest percentage of unemployment, with 37.6% or 62 of them being unemployed.
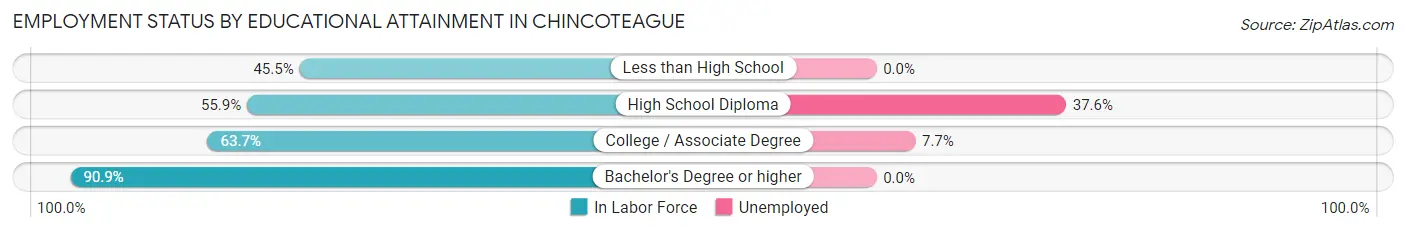
| Educational Attainment | In Labor Force | Unemployed |
| Less than High School | 46 (45.5%) | 0 (0.0%) |
| High School Diploma | 165 (55.9%) | 111 (37.6%) |
| College / Associate Degree | 325 (63.7%) | 39 (7.7%) |
| Bachelor's Degree or higher | 482 (90.9%) | 0 (0.0%) |
| Total | 1,018 (70.9%) | 125 (8.7%) |
Employment Occupations by Sex in Chincoteague
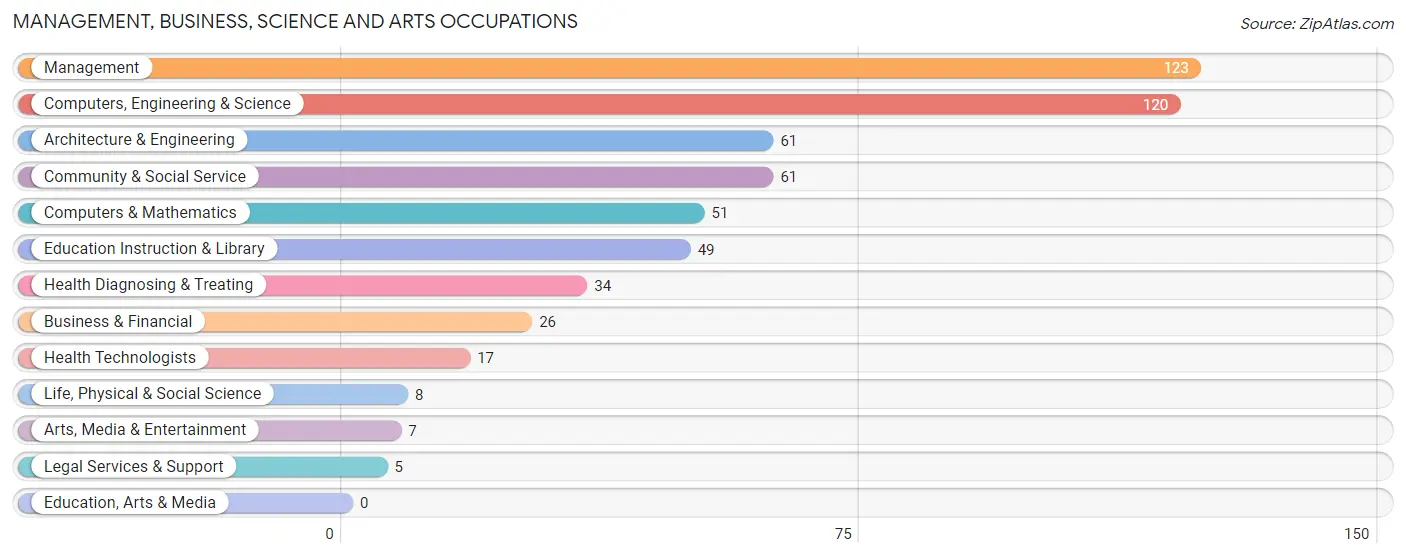
Management, Business, Science and Arts Occupations
The most common Management, Business, Science and Arts occupations in Chincoteague are Management (123 | 10.4%), Computers, Engineering & Science (120 | 10.2%), Architecture & Engineering (61 | 5.2%), Community & Social Service (61 | 5.2%), and Computers & Mathematics (51 | 4.3%).
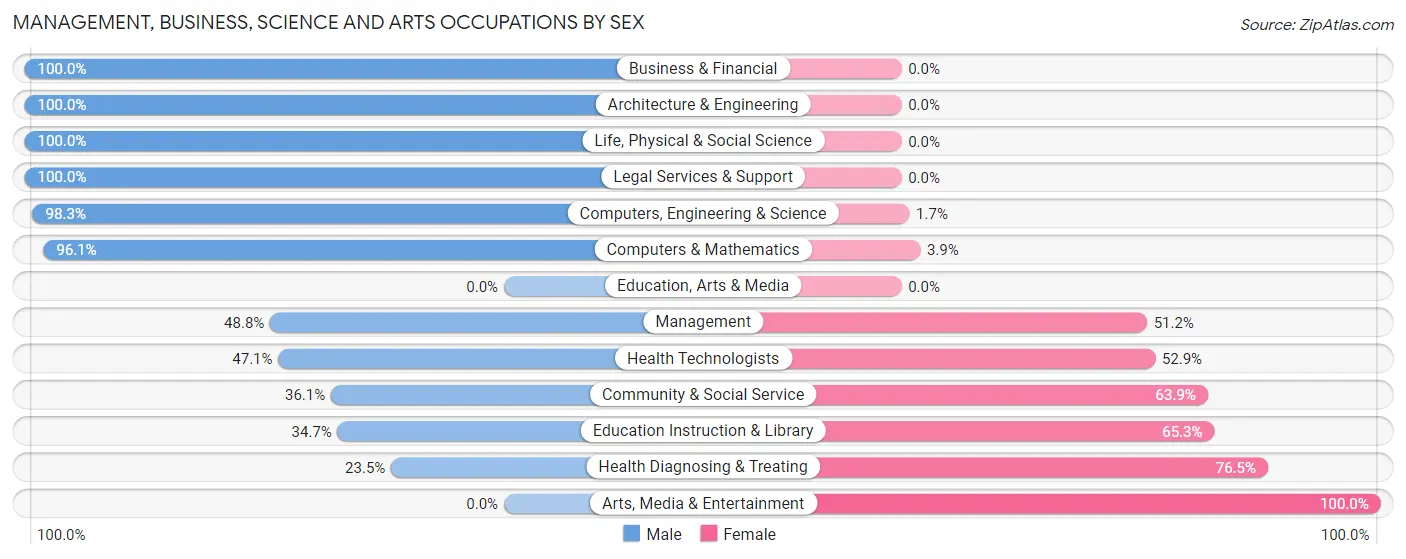
Management, Business, Science and Arts Occupations by Sex
Within the Management, Business, Science and Arts occupations in Chincoteague, the most male-oriented occupations are Business & Financial (100.0%), Architecture & Engineering (100.0%), and Life, Physical & Social Science (100.0%), while the most female-oriented occupations are Arts, Media & Entertainment (100.0%), Health Diagnosing & Treating (76.5%), and Education Instruction & Library (65.3%).
| Occupation | Male | Female |
| Management | 60 (48.8%) | 63 (51.2%) |
| Business & Financial | 26 (100.0%) | 0 (0.0%) |
| Computers, Engineering & Science | 118 (98.3%) | 2 (1.7%) |
| Computers & Mathematics | 49 (96.1%) | 2 (3.9%) |
| Architecture & Engineering | 61 (100.0%) | 0 (0.0%) |
| Life, Physical & Social Science | 8 (100.0%) | 0 (0.0%) |
| Community & Social Service | 22 (36.1%) | 39 (63.9%) |
| Education, Arts & Media | 0 (0.0%) | 0 (0.0%) |
| Legal Services & Support | 5 (100.0%) | 0 (0.0%) |
| Education Instruction & Library | 17 (34.7%) | 32 (65.3%) |
| Arts, Media & Entertainment | 0 (0.0%) | 7 (100.0%) |
| Health Diagnosing & Treating | 8 (23.5%) | 26 (76.5%) |
| Health Technologists | 8 (47.1%) | 9 (52.9%) |
| Total (Category) | 234 (64.3%) | 130 (35.7%) |
| Total (Overall) | 683 (57.9%) | 497 (42.1%) |
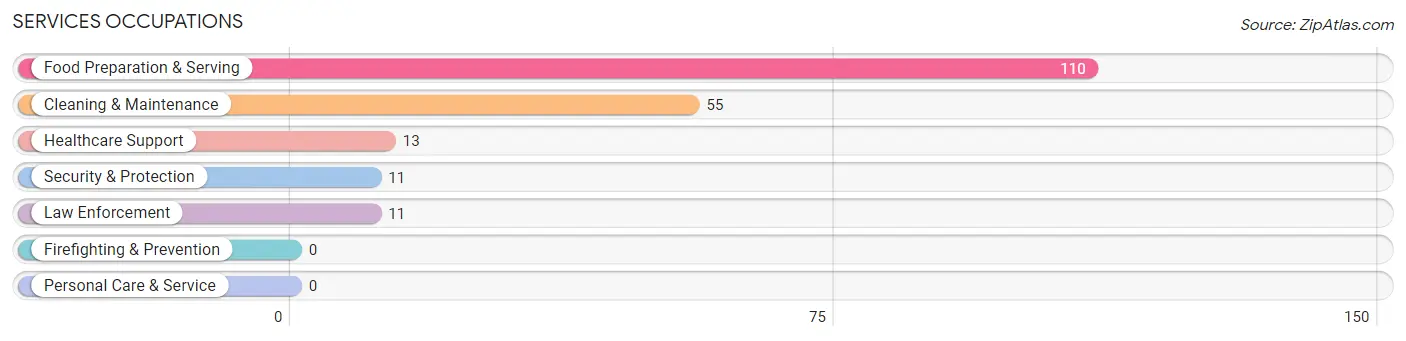
Services Occupations
The most common Services occupations in Chincoteague are Food Preparation & Serving (110 | 9.3%), Cleaning & Maintenance (55 | 4.7%), Healthcare Support (13 | 1.1%), Security & Protection (11 | 0.9%), and Law Enforcement (11 | 0.9%).
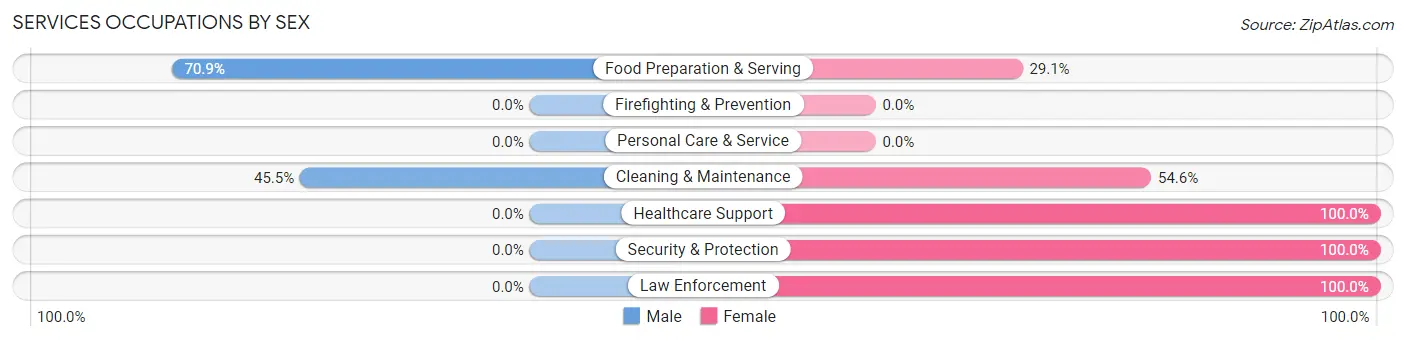
Services Occupations by Sex
Within the Services occupations in Chincoteague, the most male-oriented occupations are Food Preparation & Serving (70.9%), and Cleaning & Maintenance (45.5%), while the most female-oriented occupations are Healthcare Support (100.0%), Security & Protection (100.0%), and Law Enforcement (100.0%).
| Occupation | Male | Female |
| Healthcare Support | 0 (0.0%) | 13 (100.0%) |
| Security & Protection | 0 (0.0%) | 11 (100.0%) |
| Firefighting & Prevention | 0 (0.0%) | 0 (0.0%) |
| Law Enforcement | 0 (0.0%) | 11 (100.0%) |
| Food Preparation & Serving | 78 (70.9%) | 32 (29.1%) |
| Cleaning & Maintenance | 25 (45.5%) | 30 (54.5%) |
| Personal Care & Service | 0 (0.0%) | 0 (0.0%) |
| Total (Category) | 103 (54.5%) | 86 (45.5%) |
| Total (Overall) | 683 (57.9%) | 497 (42.1%) |
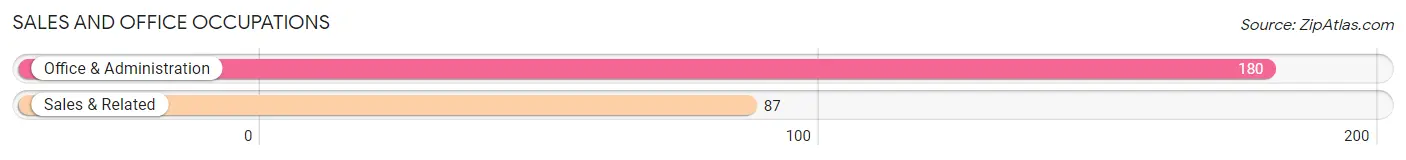
Sales and Office Occupations
The most common Sales and Office occupations in Chincoteague are Office & Administration (180 | 15.2%), and Sales & Related (87 | 7.4%).
Sales and Office Occupations by Sex
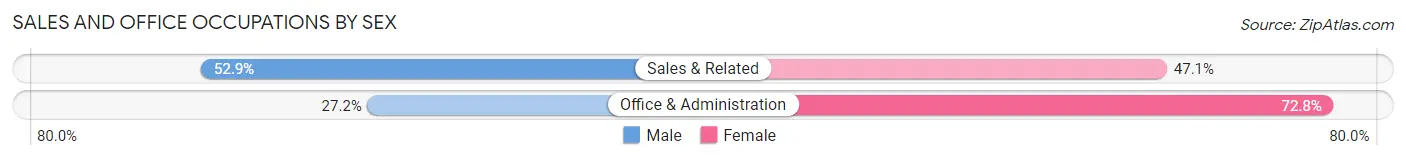
| Occupation | Male | Female |
| Sales & Related | 46 (52.9%) | 41 (47.1%) |
| Office & Administration | 49 (27.2%) | 131 (72.8%) |
| Total (Category) | 95 (35.6%) | 172 (64.4%) |
| Total (Overall) | 683 (57.9%) | 497 (42.1%) |
Natural Resources, Construction and Maintenance Occupations
The most common Natural Resources, Construction and Maintenance occupations in Chincoteague are Construction & Extraction (99 | 8.4%), and Installation, Maintenance & Repair (35 | 3.0%).

Natural Resources, Construction and Maintenance Occupations by Sex
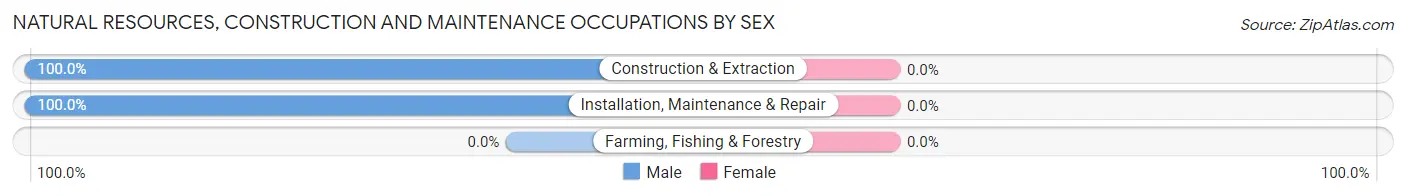
| Occupation | Male | Female |
| Farming, Fishing & Forestry | 0 (0.0%) | 0 (0.0%) |
| Construction & Extraction | 99 (100.0%) | 0 (0.0%) |
| Installation, Maintenance & Repair | 35 (100.0%) | 0 (0.0%) |
| Total (Category) | 134 (100.0%) | 0 (0.0%) |
| Total (Overall) | 683 (57.9%) | 497 (42.1%) |
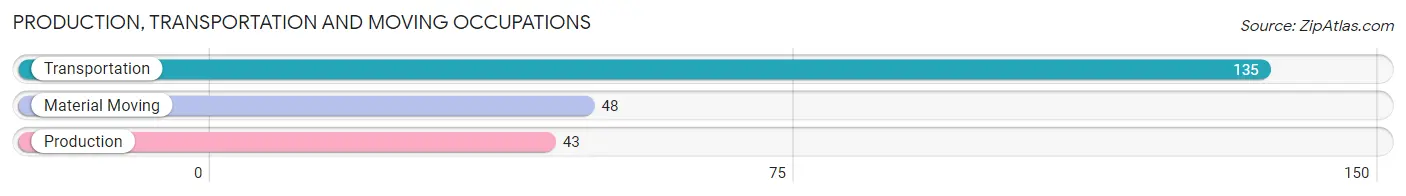
Production, Transportation and Moving Occupations
The most common Production, Transportation and Moving occupations in Chincoteague are Transportation (135 | 11.4%), Material Moving (48 | 4.1%), and Production (43 | 3.6%).
Production, Transportation and Moving Occupations by Sex
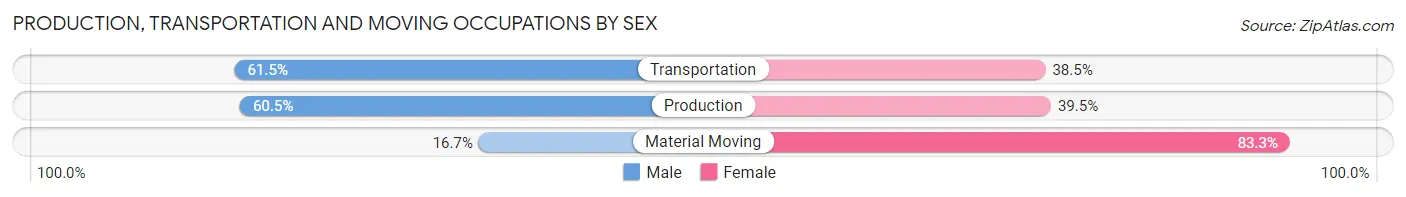
| Occupation | Male | Female |
| Production | 26 (60.5%) | 17 (39.5%) |
| Transportation | 83 (61.5%) | 52 (38.5%) |
| Material Moving | 8 (16.7%) | 40 (83.3%) |
| Total (Category) | 117 (51.8%) | 109 (48.2%) |
| Total (Overall) | 683 (57.9%) | 497 (42.1%) |
Employment Industries by Sex in Chincoteague
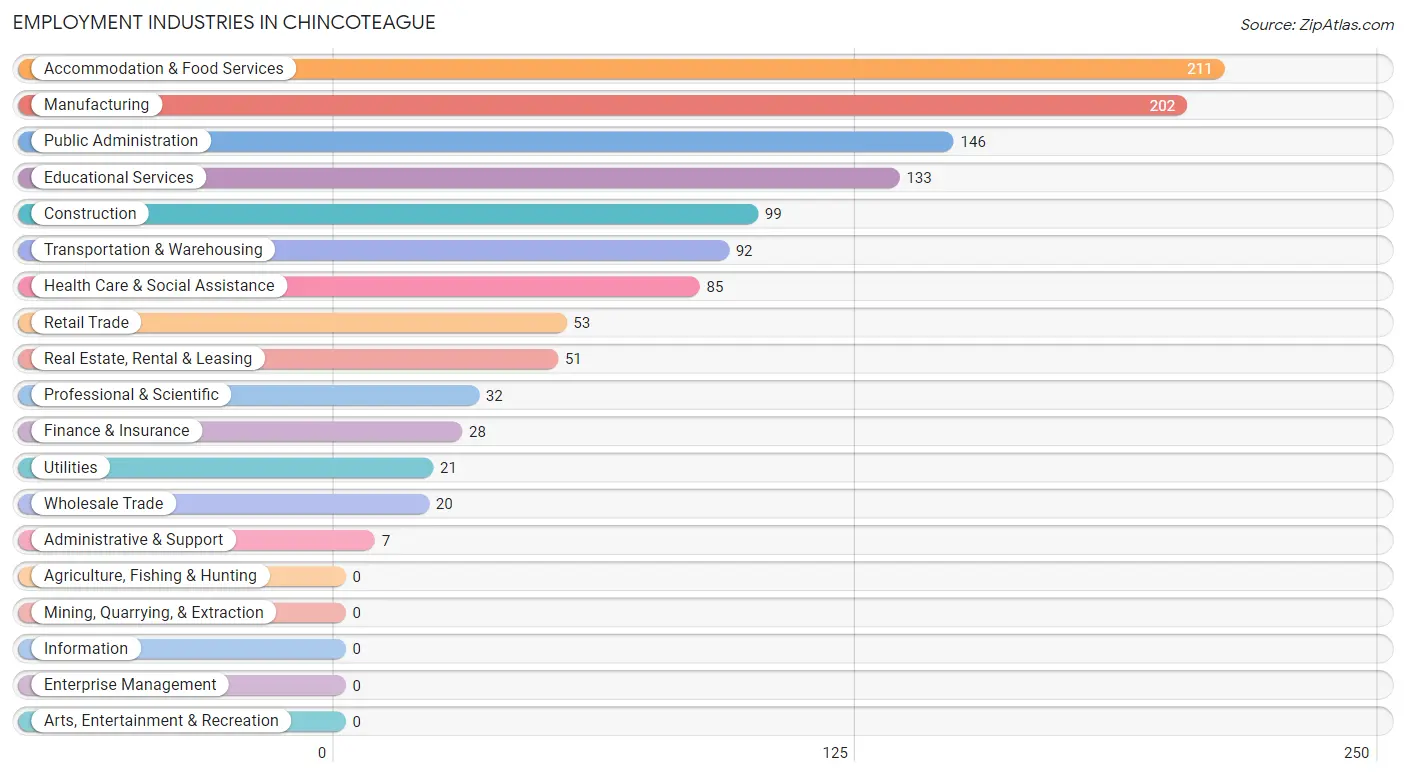
Employment Industries in Chincoteague
The major employment industries in Chincoteague include Accommodation & Food Services (211 | 17.9%), Manufacturing (202 | 17.1%), Public Administration (146 | 12.4%), Educational Services (133 | 11.3%), and Construction (99 | 8.4%).
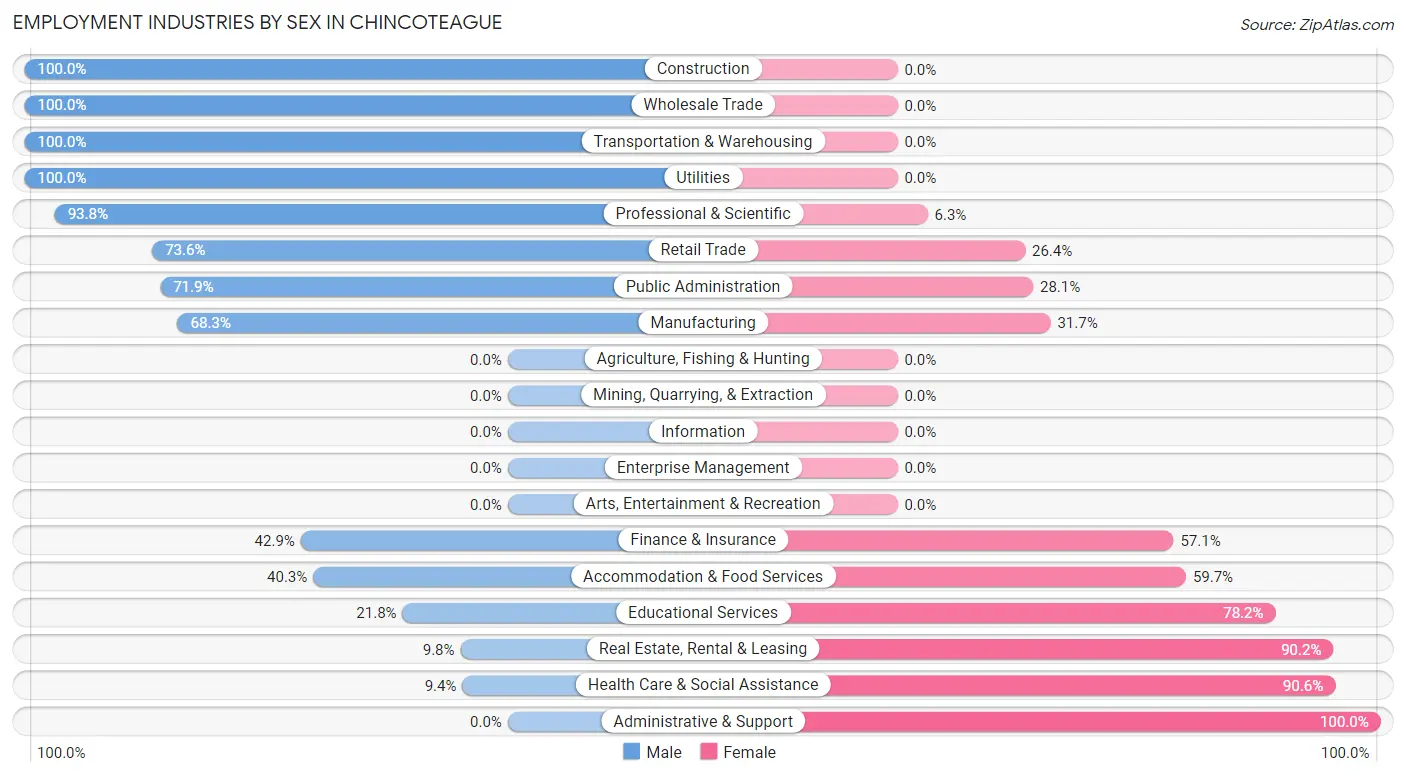
Employment Industries by Sex in Chincoteague
The Chincoteague industries that see more men than women are Construction (100.0%), Wholesale Trade (100.0%), and Transportation & Warehousing (100.0%), whereas the industries that tend to have a higher number of women are Administrative & Support (100.0%), Health Care & Social Assistance (90.6%), and Real Estate, Rental & Leasing (90.2%).
| Industry | Male | Female |
| Agriculture, Fishing & Hunting | 0 (0.0%) | 0 (0.0%) |
| Mining, Quarrying, & Extraction | 0 (0.0%) | 0 (0.0%) |
| Construction | 99 (100.0%) | 0 (0.0%) |
| Manufacturing | 138 (68.3%) | 64 (31.7%) |
| Wholesale Trade | 20 (100.0%) | 0 (0.0%) |
| Retail Trade | 39 (73.6%) | 14 (26.4%) |
| Transportation & Warehousing | 92 (100.0%) | 0 (0.0%) |
| Utilities | 21 (100.0%) | 0 (0.0%) |
| Information | 0 (0.0%) | 0 (0.0%) |
| Finance & Insurance | 12 (42.9%) | 16 (57.1%) |
| Real Estate, Rental & Leasing | 5 (9.8%) | 46 (90.2%) |
| Professional & Scientific | 30 (93.8%) | 2 (6.2%) |
| Enterprise Management | 0 (0.0%) | 0 (0.0%) |
| Administrative & Support | 0 (0.0%) | 7 (100.0%) |
| Educational Services | 29 (21.8%) | 104 (78.2%) |
| Health Care & Social Assistance | 8 (9.4%) | 77 (90.6%) |
| Arts, Entertainment & Recreation | 0 (0.0%) | 0 (0.0%) |
| Accommodation & Food Services | 85 (40.3%) | 126 (59.7%) |
| Public Administration | 105 (71.9%) | 41 (28.1%) |
| Total | 683 (57.9%) | 497 (42.1%) |
Education in Chincoteague
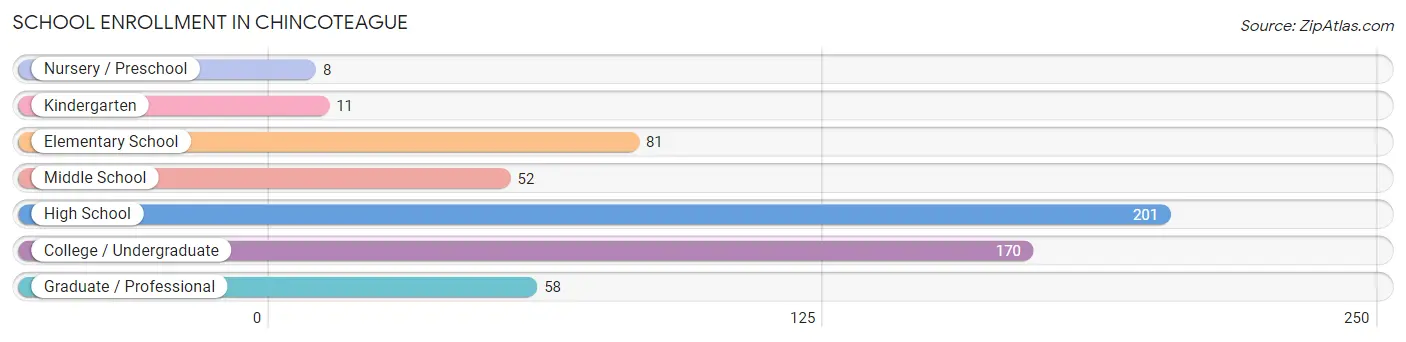
School Enrollment in Chincoteague
The most common levels of schooling among the 581 students in Chincoteague are high school (201 | 34.6%), college / undergraduate (170 | 29.3%), and elementary school (81 | 13.9%).
| School Level | # Students | % Students |
| Nursery / Preschool | 8 | 1.4% |
| Kindergarten | 11 | 1.9% |
| Elementary School | 81 | 13.9% |
| Middle School | 52 | 8.9% |
| High School | 201 | 34.6% |
| College / Undergraduate | 170 | 29.3% |
| Graduate / Professional | 58 | 10.0% |
| Total | 581 | 100.0% |
School Enrollment by Age by Funding Source in Chincoteague
Out of a total of 581 students who are enrolled in schools in Chincoteague, 44 (7.6%) attend a private institution, while the remaining 537 (92.4%) are enrolled in public schools. The age group of 25 to 34 year olds has the highest likelihood of being enrolled in private schools, with 12 (21.8% in the age bracket) enrolled. Conversely, the age group of 5 to 9 year old has the lowest likelihood of being enrolled in a private school, with 80 (100.0% in the age bracket) attending a public institution.
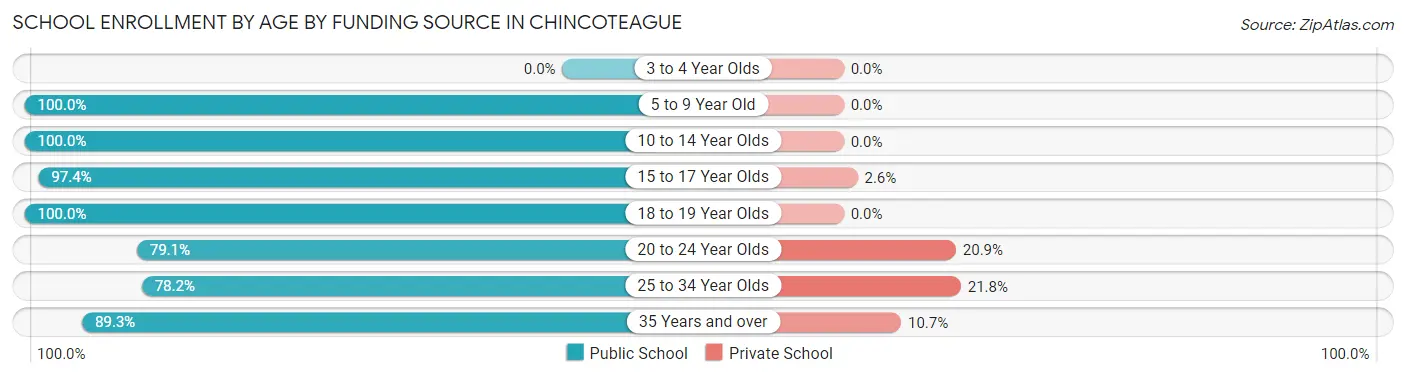
| Age Bracket | Public School | Private School |
| 3 to 4 Year Olds | 0 (0.0%) | 0 (0.0%) |
| 5 to 9 Year Old | 80 (100.0%) | 0 (0.0%) |
| 10 to 14 Year Olds | 72 (100.0%) | 0 (0.0%) |
| 15 to 17 Year Olds | 151 (97.4%) | 4 (2.6%) |
| 18 to 19 Year Olds | 21 (100.0%) | 0 (0.0%) |
| 20 to 24 Year Olds | 53 (79.1%) | 14 (20.9%) |
| 25 to 34 Year Olds | 43 (78.2%) | 12 (21.8%) |
| 35 Years and over | 117 (89.3%) | 14 (10.7%) |
| Total | 537 (92.4%) | 44 (7.6%) |
Educational Attainment by Field of Study in Chincoteague
Computers & mathematics (167 | 16.1%), business (152 | 14.7%), education (128 | 12.3%), engineering (116 | 11.2%), and social sciences (93 | 9.0%) are the most common fields of study among 1,037 individuals in Chincoteague who have obtained a bachelor's degree or higher.
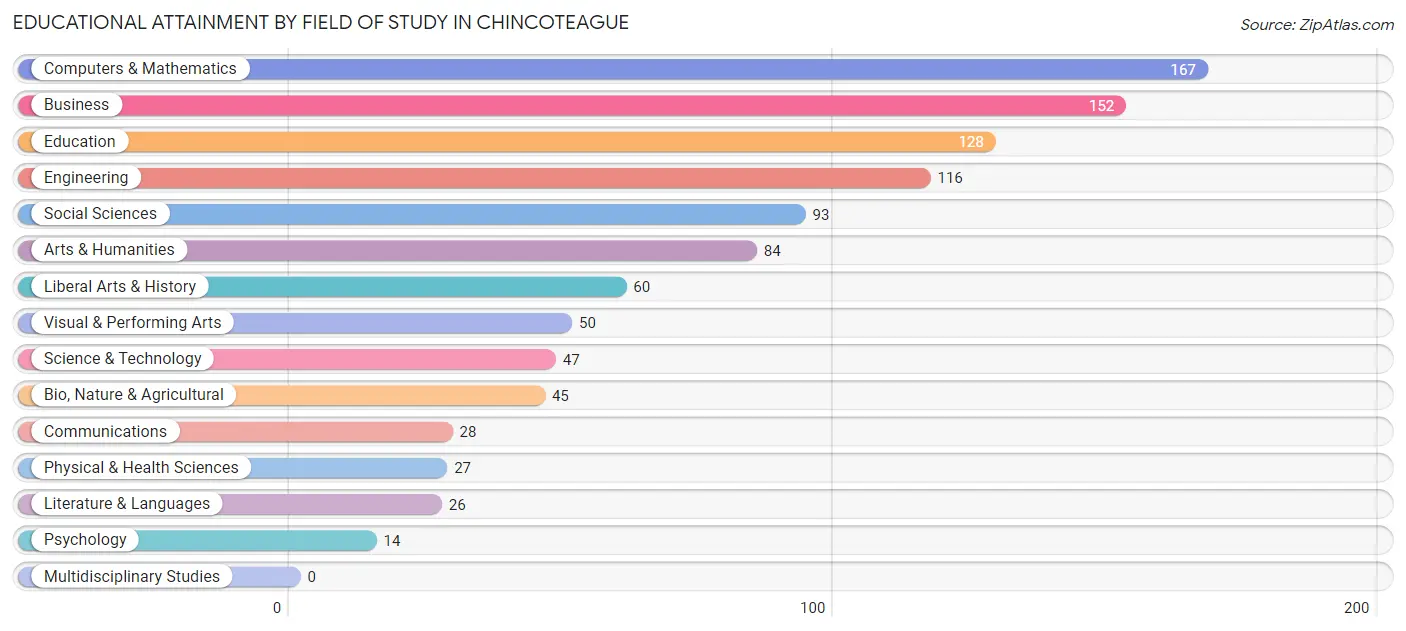
| Field of Study | # Graduates | % Graduates |
| Computers & Mathematics | 167 | 16.1% |
| Bio, Nature & Agricultural | 45 | 4.3% |
| Physical & Health Sciences | 27 | 2.6% |
| Psychology | 14 | 1.3% |
| Social Sciences | 93 | 9.0% |
| Engineering | 116 | 11.2% |
| Multidisciplinary Studies | 0 | 0.0% |
| Science & Technology | 47 | 4.5% |
| Business | 152 | 14.7% |
| Education | 128 | 12.3% |
| Literature & Languages | 26 | 2.5% |
| Liberal Arts & History | 60 | 5.8% |
| Visual & Performing Arts | 50 | 4.8% |
| Communications | 28 | 2.7% |
| Arts & Humanities | 84 | 8.1% |
| Total | 1,037 | 100.0% |
Transportation & Commute in Chincoteague
Vehicle Availability by Sex in Chincoteague
The most prevalent vehicle ownership categories in Chincoteague are males with 1 vehicle (253, accounting for 32.4%) and females with 1 vehicle (101, making up 53.1%).
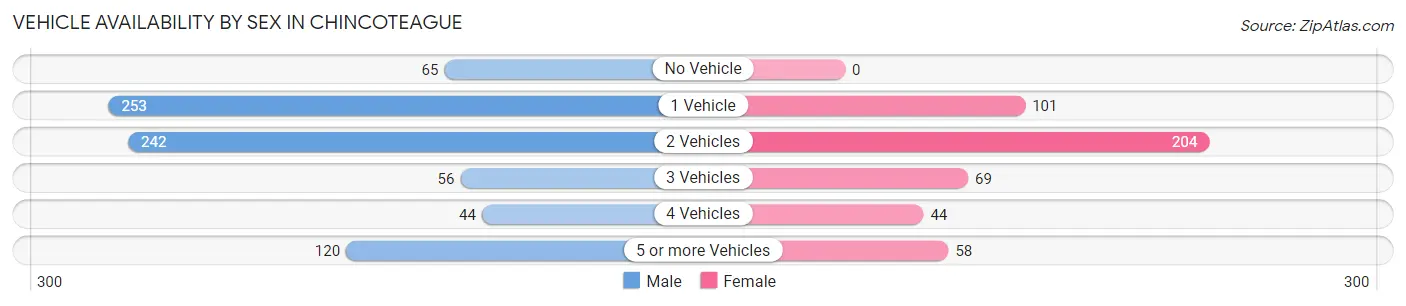
| Vehicles Available | Male | Female |
| No Vehicle | 65 (8.3%) | 0 (0.0%) |
| 1 Vehicle | 253 (32.4%) | 101 (21.2%) |
| 2 Vehicles | 242 (31.0%) | 204 (42.9%) |
| 3 Vehicles | 56 (7.2%) | 69 (14.5%) |
| 4 Vehicles | 44 (5.6%) | 44 (9.2%) |
| 5 or more Vehicles | 120 (15.4%) | 58 (12.2%) |
| Total | 780 (100.0%) | 476 (100.0%) |
Commute Time in Chincoteague
The most frequently occuring commute durations in Chincoteague are 5 to 9 minutes (325 commuters, 28.4%), 20 to 24 minutes (202 commuters, 17.7%), and 30 to 34 minutes (140 commuters, 12.2%).
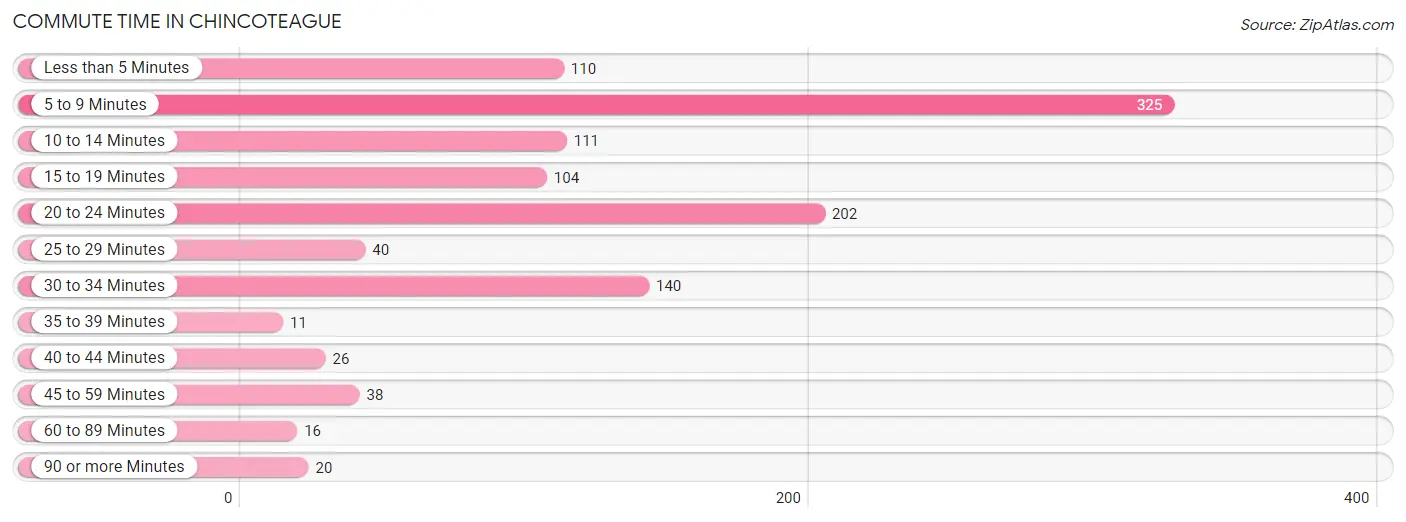
| Commute Time | # Commuters | % Commuters |
| Less than 5 Minutes | 110 | 9.6% |
| 5 to 9 Minutes | 325 | 28.4% |
| 10 to 14 Minutes | 111 | 9.7% |
| 15 to 19 Minutes | 104 | 9.1% |
| 20 to 24 Minutes | 202 | 17.7% |
| 25 to 29 Minutes | 40 | 3.5% |
| 30 to 34 Minutes | 140 | 12.2% |
| 35 to 39 Minutes | 11 | 1.0% |
| 40 to 44 Minutes | 26 | 2.3% |
| 45 to 59 Minutes | 38 | 3.3% |
| 60 to 89 Minutes | 16 | 1.4% |
| 90 or more Minutes | 20 | 1.8% |
Commute Time by Sex in Chincoteague
The most common commute times in Chincoteague are 20 to 24 minutes (152 commuters, 21.8%) for males and 5 to 9 minutes (203 commuters, 45.5%) for females.
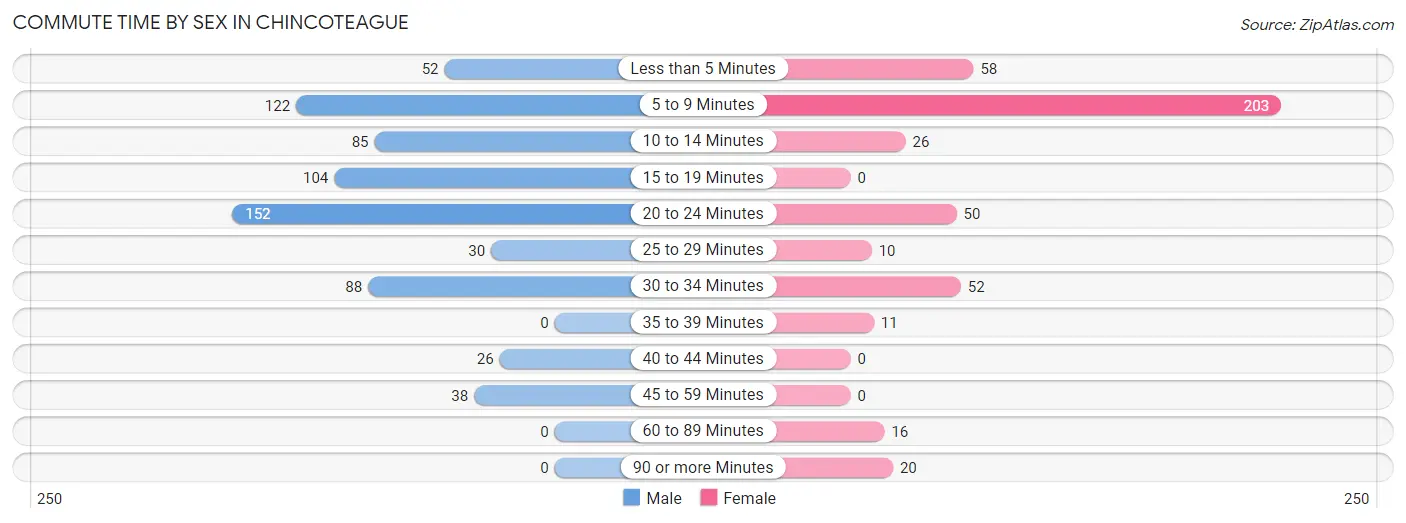
| Commute Time | Male | Female |
| Less than 5 Minutes | 52 (7.5%) | 58 (13.0%) |
| 5 to 9 Minutes | 122 (17.5%) | 203 (45.5%) |
| 10 to 14 Minutes | 85 (12.2%) | 26 (5.8%) |
| 15 to 19 Minutes | 104 (14.9%) | 0 (0.0%) |
| 20 to 24 Minutes | 152 (21.8%) | 50 (11.2%) |
| 25 to 29 Minutes | 30 (4.3%) | 10 (2.2%) |
| 30 to 34 Minutes | 88 (12.6%) | 52 (11.7%) |
| 35 to 39 Minutes | 0 (0.0%) | 11 (2.5%) |
| 40 to 44 Minutes | 26 (3.7%) | 0 (0.0%) |
| 45 to 59 Minutes | 38 (5.4%) | 0 (0.0%) |
| 60 to 89 Minutes | 0 (0.0%) | 16 (3.6%) |
| 90 or more Minutes | 0 (0.0%) | 20 (4.5%) |
Time of Departure to Work by Sex in Chincoteague
The most frequent times of departure to work in Chincoteague are 7:00 AM to 7:29 AM (147, 21.1%) for males and 7:30 AM to 7:59 AM (86, 19.3%) for females.
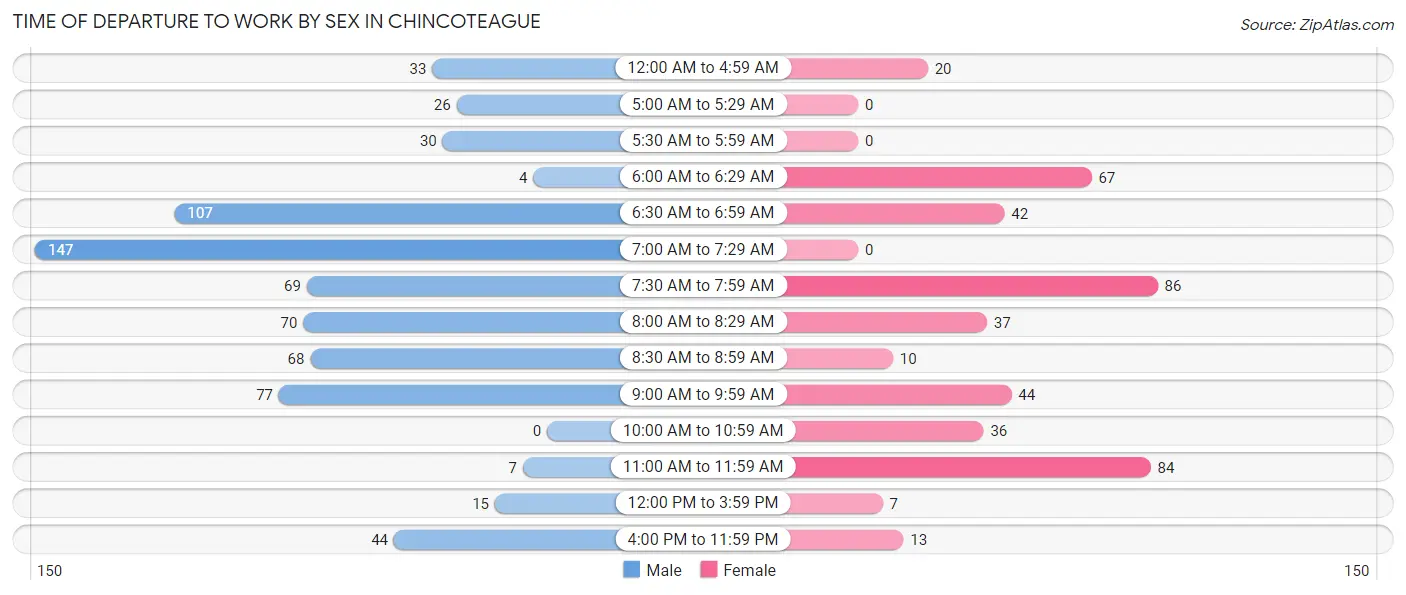
| Time of Departure | Male | Female |
| 12:00 AM to 4:59 AM | 33 (4.7%) | 20 (4.5%) |
| 5:00 AM to 5:29 AM | 26 (3.7%) | 0 (0.0%) |
| 5:30 AM to 5:59 AM | 30 (4.3%) | 0 (0.0%) |
| 6:00 AM to 6:29 AM | 4 (0.6%) | 67 (15.0%) |
| 6:30 AM to 6:59 AM | 107 (15.3%) | 42 (9.4%) |
| 7:00 AM to 7:29 AM | 147 (21.1%) | 0 (0.0%) |
| 7:30 AM to 7:59 AM | 69 (9.9%) | 86 (19.3%) |
| 8:00 AM to 8:29 AM | 70 (10.0%) | 37 (8.3%) |
| 8:30 AM to 8:59 AM | 68 (9.8%) | 10 (2.2%) |
| 9:00 AM to 9:59 AM | 77 (11.1%) | 44 (9.9%) |
| 10:00 AM to 10:59 AM | 0 (0.0%) | 36 (8.1%) |
| 11:00 AM to 11:59 AM | 7 (1.0%) | 84 (18.8%) |
| 12:00 PM to 3:59 PM | 15 (2.1%) | 7 (1.6%) |
| 4:00 PM to 11:59 PM | 44 (6.3%) | 13 (2.9%) |
| Total | 697 (100.0%) | 446 (100.0%) |
Housing Occupancy in Chincoteague
Occupancy by Ownership in Chincoteague
Of the total 1,798 dwellings in Chincoteague, owner-occupied units account for 1,199 (66.7%), while renter-occupied units make up 599 (33.3%).
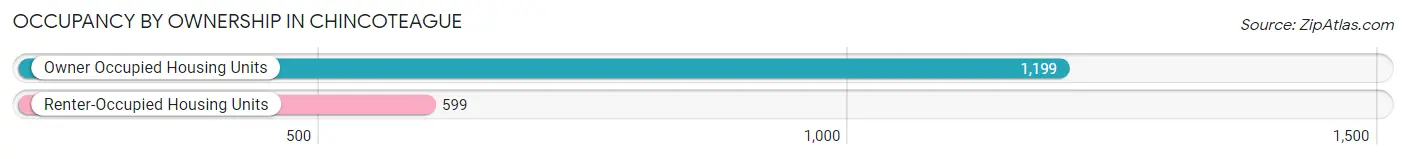
| Occupancy | # Housing Units | % Housing Units |
| Owner Occupied Housing Units | 1,199 | 66.7% |
| Renter-Occupied Housing Units | 599 | 33.3% |
| Total Occupied Housing Units | 1,798 | 100.0% |
Occupancy by Household Size in Chincoteague
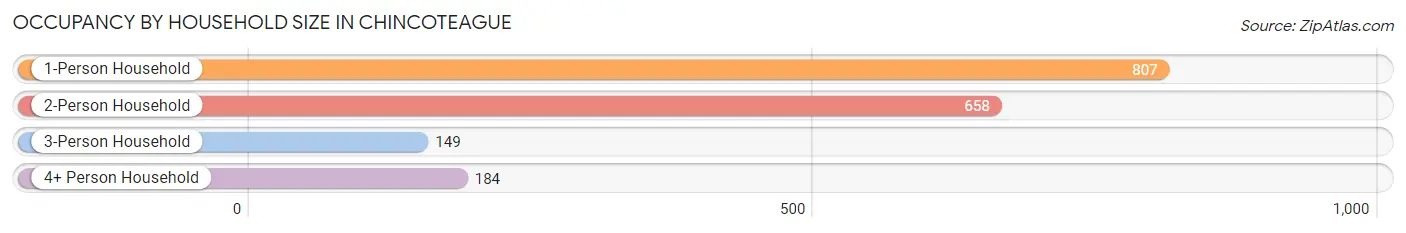
| Household Size | # Housing Units | % Housing Units |
| 1-Person Household | 807 | 44.9% |
| 2-Person Household | 658 | 36.6% |
| 3-Person Household | 149 | 8.3% |
| 4+ Person Household | 184 | 10.2% |
| Total Housing Units | 1,798 | 100.0% |
Occupancy by Ownership by Household Size in Chincoteague
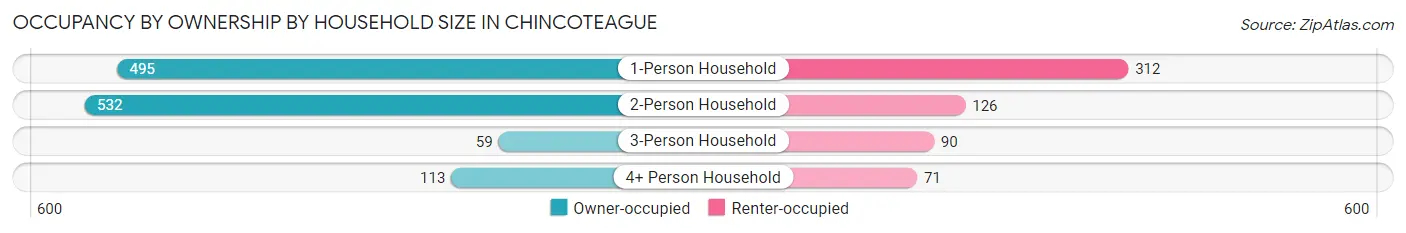
| Household Size | Owner-occupied | Renter-occupied |
| 1-Person Household | 495 (61.3%) | 312 (38.7%) |
| 2-Person Household | 532 (80.8%) | 126 (19.2%) |
| 3-Person Household | 59 (39.6%) | 90 (60.4%) |
| 4+ Person Household | 113 (61.4%) | 71 (38.6%) |
| Total Housing Units | 1,199 (66.7%) | 599 (33.3%) |
Occupancy by Educational Attainment in Chincoteague
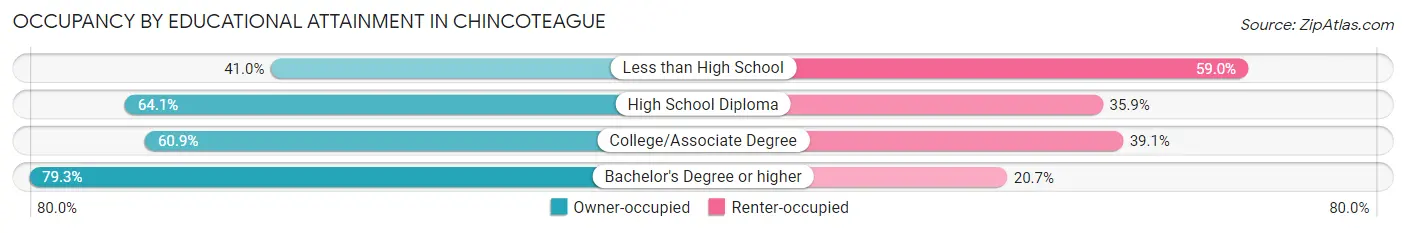
| Household Size | Owner-occupied | Renter-occupied |
| Less than High School | 55 (41.0%) | 79 (59.0%) |
| High School Diploma | 273 (64.1%) | 153 (35.9%) |
| College/Associate Degree | 366 (60.9%) | 235 (39.1%) |
| Bachelor's Degree or higher | 505 (79.3%) | 132 (20.7%) |
Occupancy by Age of Householder in Chincoteague
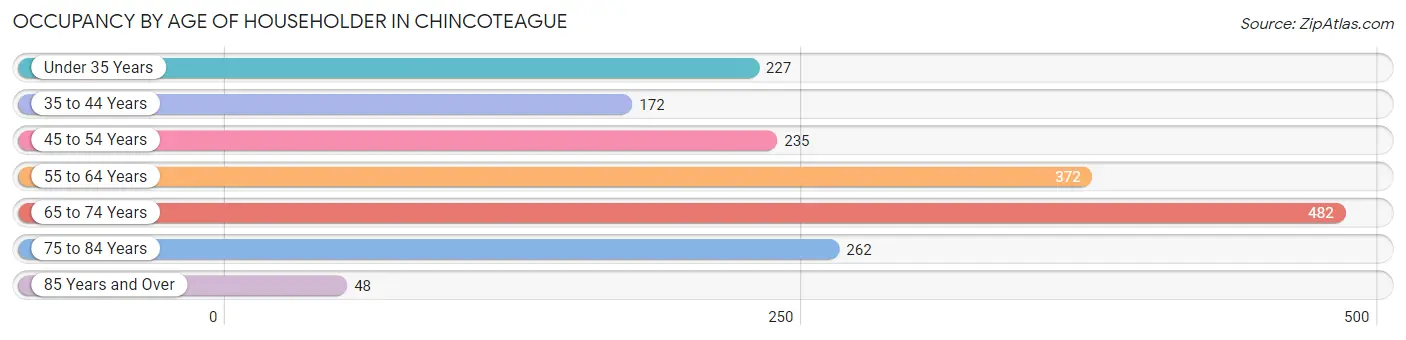
| Age Bracket | # Households | % Households |
| Under 35 Years | 227 | 12.6% |
| 35 to 44 Years | 172 | 9.6% |
| 45 to 54 Years | 235 | 13.1% |
| 55 to 64 Years | 372 | 20.7% |
| 65 to 74 Years | 482 | 26.8% |
| 75 to 84 Years | 262 | 14.6% |
| 85 Years and Over | 48 | 2.7% |
| Total | 1,798 | 100.0% |
Housing Finances in Chincoteague
Median Income by Occupancy in Chincoteague
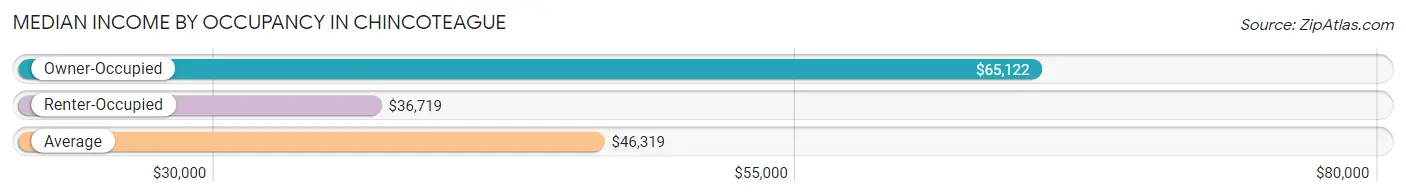
| Occupancy Type | # Households | Median Income |
| Owner-Occupied | 1,199 (66.7%) | $65,122 |
| Renter-Occupied | 599 (33.3%) | $36,719 |
| Average | 1,798 (100.0%) | $46,319 |
Occupancy by Householder Income Bracket in Chincoteague
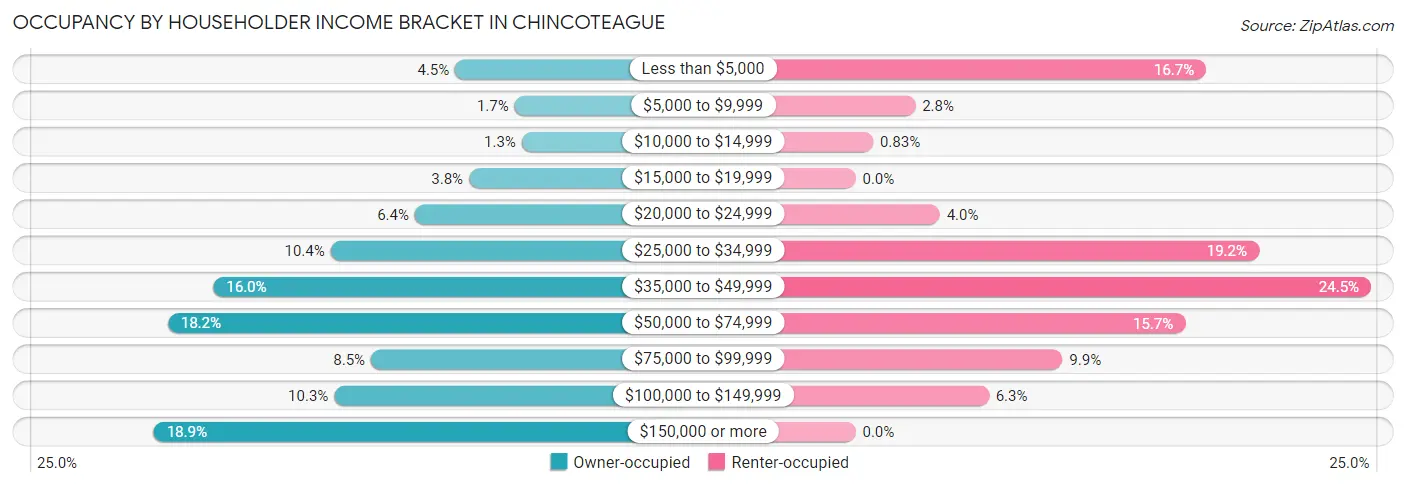
| Income Bracket | Owner-occupied | Renter-occupied |
| Less than $5,000 | 54 (4.5%) | 100 (16.7%) |
| $5,000 to $9,999 | 20 (1.7%) | 17 (2.8%) |
| $10,000 to $14,999 | 16 (1.3%) | 5 (0.8%) |
| $15,000 to $19,999 | 46 (3.8%) | 0 (0.0%) |
| $20,000 to $24,999 | 77 (6.4%) | 24 (4.0%) |
| $25,000 to $34,999 | 125 (10.4%) | 115 (19.2%) |
| $35,000 to $49,999 | 192 (16.0%) | 147 (24.5%) |
| $50,000 to $74,999 | 218 (18.2%) | 94 (15.7%) |
| $75,000 to $99,999 | 102 (8.5%) | 59 (9.9%) |
| $100,000 to $149,999 | 123 (10.3%) | 38 (6.3%) |
| $150,000 or more | 226 (18.9%) | 0 (0.0%) |
| Total | 1,199 (100.0%) | 599 (100.0%) |
Monthly Housing Cost Tiers in Chincoteague
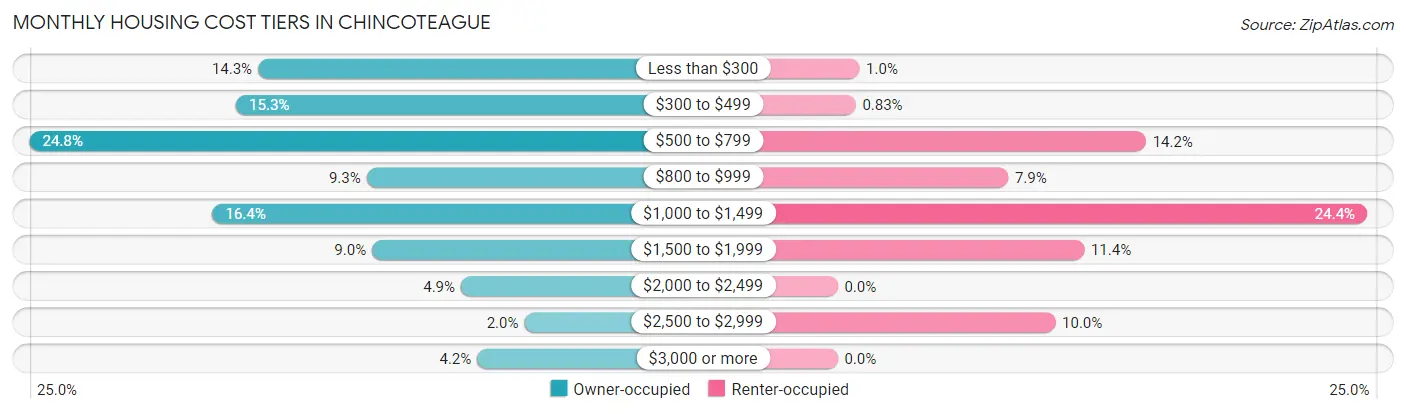
| Monthly Cost | Owner-occupied | Renter-occupied |
| Less than $300 | 171 (14.3%) | 6 (1.0%) |
| $300 to $499 | 183 (15.3%) | 5 (0.8%) |
| $500 to $799 | 297 (24.8%) | 85 (14.2%) |
| $800 to $999 | 111 (9.3%) | 47 (7.9%) |
| $1,000 to $1,499 | 196 (16.4%) | 146 (24.4%) |
| $1,500 to $1,999 | 108 (9.0%) | 68 (11.4%) |
| $2,000 to $2,499 | 59 (4.9%) | 0 (0.0%) |
| $2,500 to $2,999 | 24 (2.0%) | 60 (10.0%) |
| $3,000 or more | 50 (4.2%) | 0 (0.0%) |
| Total | 1,199 (100.0%) | 599 (100.0%) |
Physical Housing Characteristics in Chincoteague
Housing Structures in Chincoteague
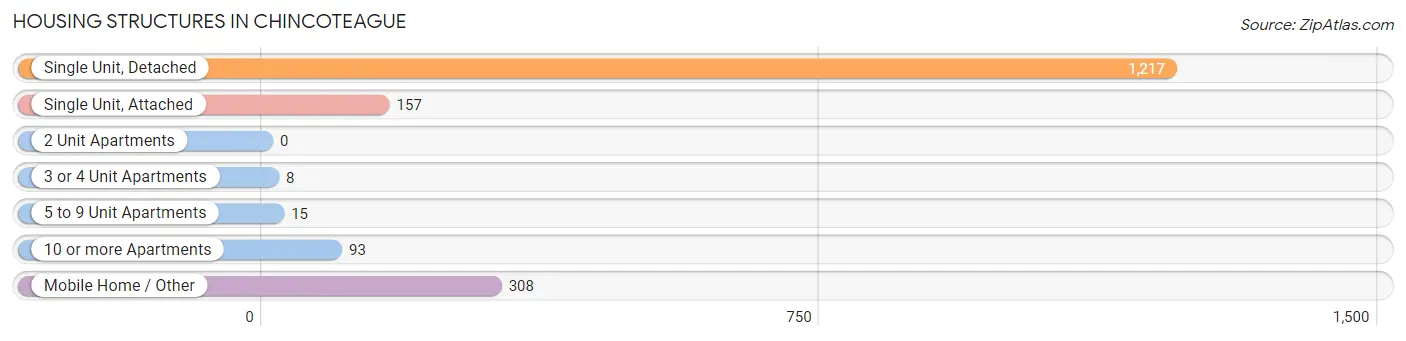
| Structure Type | # Housing Units | % Housing Units |
| Single Unit, Detached | 1,217 | 67.7% |
| Single Unit, Attached | 157 | 8.7% |
| 2 Unit Apartments | 0 | 0.0% |
| 3 or 4 Unit Apartments | 8 | 0.4% |
| 5 to 9 Unit Apartments | 15 | 0.8% |
| 10 or more Apartments | 93 | 5.2% |
| Mobile Home / Other | 308 | 17.1% |
| Total | 1,798 | 100.0% |
Housing Structures by Occupancy in Chincoteague
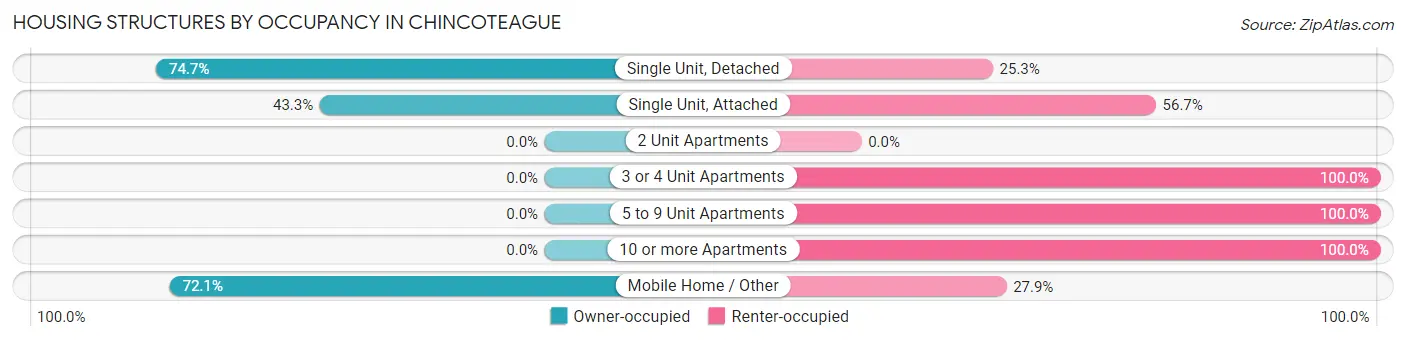
| Structure Type | Owner-occupied | Renter-occupied |
| Single Unit, Detached | 909 (74.7%) | 308 (25.3%) |
| Single Unit, Attached | 68 (43.3%) | 89 (56.7%) |
| 2 Unit Apartments | 0 (0.0%) | 0 (0.0%) |
| 3 or 4 Unit Apartments | 0 (0.0%) | 8 (100.0%) |
| 5 to 9 Unit Apartments | 0 (0.0%) | 15 (100.0%) |
| 10 or more Apartments | 0 (0.0%) | 93 (100.0%) |
| Mobile Home / Other | 222 (72.1%) | 86 (27.9%) |
| Total | 1,199 (66.7%) | 599 (33.3%) |
Housing Structures by Number of Rooms in Chincoteague
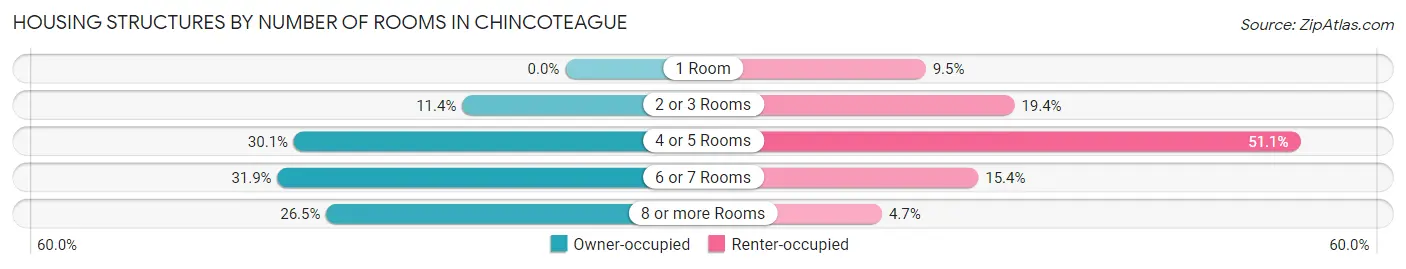
| Number of Rooms | Owner-occupied | Renter-occupied |
| 1 Room | 0 (0.0%) | 57 (9.5%) |
| 2 or 3 Rooms | 137 (11.4%) | 116 (19.4%) |
| 4 or 5 Rooms | 361 (30.1%) | 306 (51.1%) |
| 6 or 7 Rooms | 383 (31.9%) | 92 (15.4%) |
| 8 or more Rooms | 318 (26.5%) | 28 (4.7%) |
| Total | 1,199 (100.0%) | 599 (100.0%) |
Housing Structure by Heating Type in Chincoteague
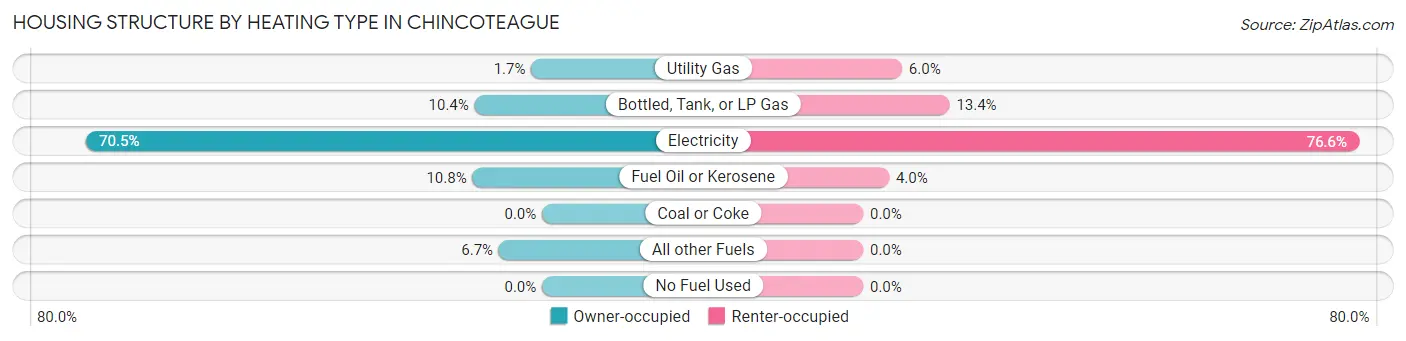
| Heating Type | Owner-occupied | Renter-occupied |
| Utility Gas | 20 (1.7%) | 36 (6.0%) |
| Bottled, Tank, or LP Gas | 125 (10.4%) | 80 (13.4%) |
| Electricity | 845 (70.5%) | 459 (76.6%) |
| Fuel Oil or Kerosene | 129 (10.8%) | 24 (4.0%) |
| Coal or Coke | 0 (0.0%) | 0 (0.0%) |
| All other Fuels | 80 (6.7%) | 0 (0.0%) |
| No Fuel Used | 0 (0.0%) | 0 (0.0%) |
| Total | 1,199 (100.0%) | 599 (100.0%) |
Household Vehicle Usage in Chincoteague
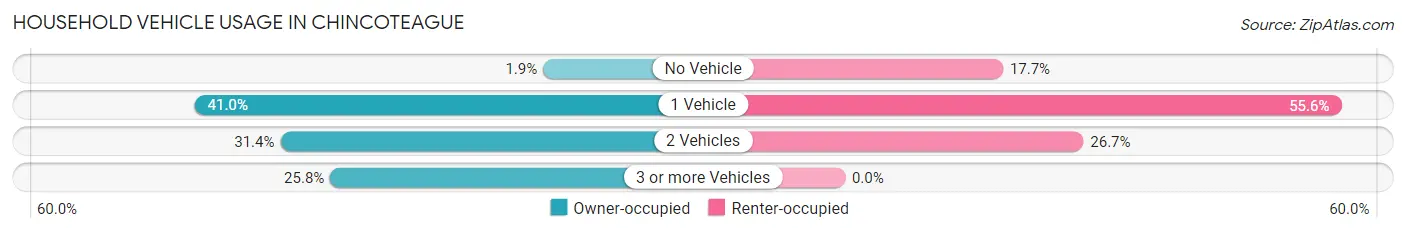
| Vehicles per Household | Owner-occupied | Renter-occupied |
| No Vehicle | 23 (1.9%) | 106 (17.7%) |
| 1 Vehicle | 491 (40.9%) | 333 (55.6%) |
| 2 Vehicles | 376 (31.4%) | 160 (26.7%) |
| 3 or more Vehicles | 309 (25.8%) | 0 (0.0%) |
| Total | 1,199 (100.0%) | 599 (100.0%) |
Real Estate & Mortgages in Chincoteague
Real Estate and Mortgage Overview in Chincoteague
| Characteristic | Without Mortgage | With Mortgage |
| Housing Units | 675 | 524 |
| Median Property Value | $290,300 | $346,000 |
| Median Household Income | $43,681 | $160 |
| Monthly Housing Costs | $478 | $50 |
| Real Estate Taxes | $914 | $0 |
Property Value by Mortgage Status in Chincoteague
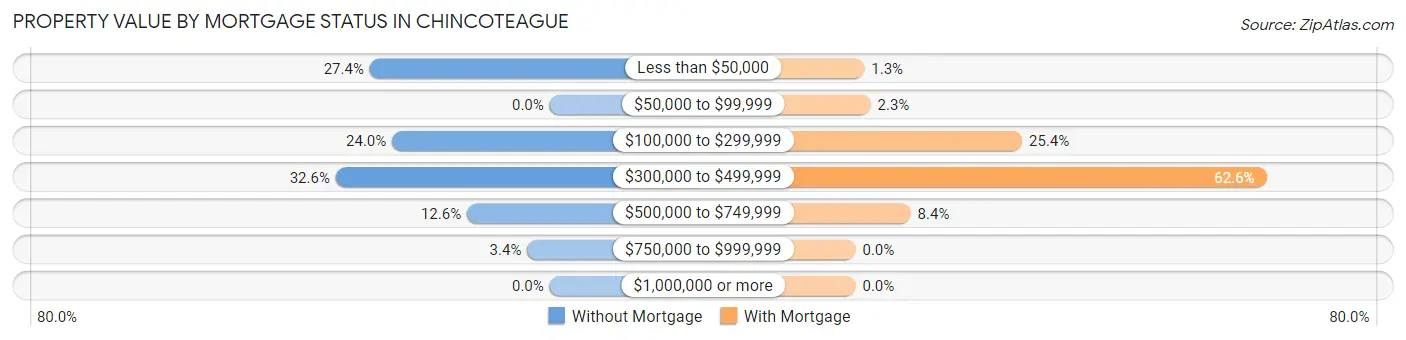
| Property Value | Without Mortgage | With Mortgage |
| Less than $50,000 | 185 (27.4%) | 7 (1.3%) |
| $50,000 to $99,999 | 0 (0.0%) | 12 (2.3%) |
| $100,000 to $299,999 | 162 (24.0%) | 133 (25.4%) |
| $300,000 to $499,999 | 220 (32.6%) | 328 (62.6%) |
| $500,000 to $749,999 | 85 (12.6%) | 44 (8.4%) |
| $750,000 to $999,999 | 23 (3.4%) | 0 (0.0%) |
| $1,000,000 or more | 0 (0.0%) | 0 (0.0%) |
| Total | 675 (100.0%) | 524 (100.0%) |
Household Income by Mortgage Status in Chincoteague
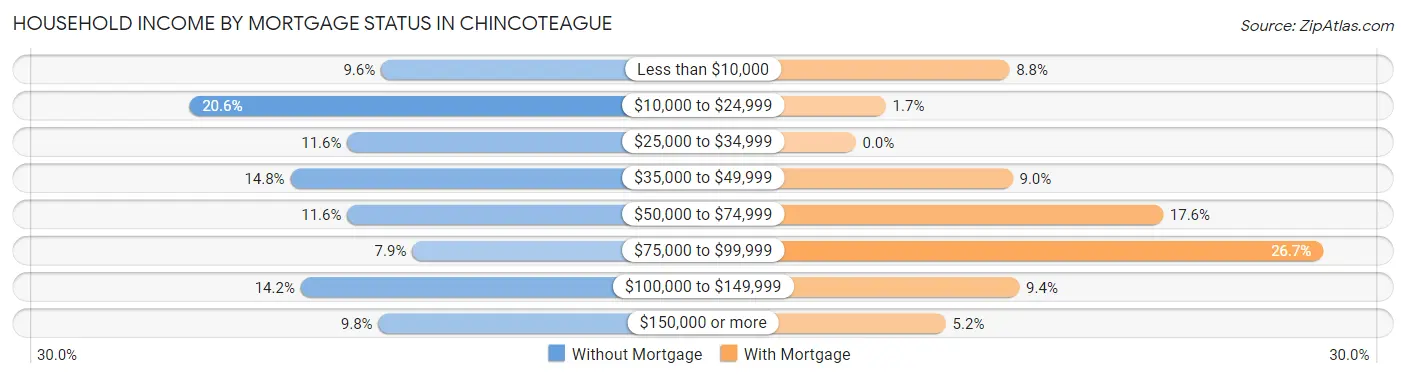
| Household Income | Without Mortgage | With Mortgage |
| Less than $10,000 | 65 (9.6%) | 46 (8.8%) |
| $10,000 to $24,999 | 139 (20.6%) | 9 (1.7%) |
| $25,000 to $34,999 | 78 (11.6%) | 0 (0.0%) |
| $35,000 to $49,999 | 100 (14.8%) | 47 (9.0%) |
| $50,000 to $74,999 | 78 (11.6%) | 92 (17.6%) |
| $75,000 to $99,999 | 53 (7.9%) | 140 (26.7%) |
| $100,000 to $149,999 | 96 (14.2%) | 49 (9.3%) |
| $150,000 or more | 66 (9.8%) | 27 (5.1%) |
| Total | 675 (100.0%) | 524 (100.0%) |
Property Value to Household Income Ratio in Chincoteague
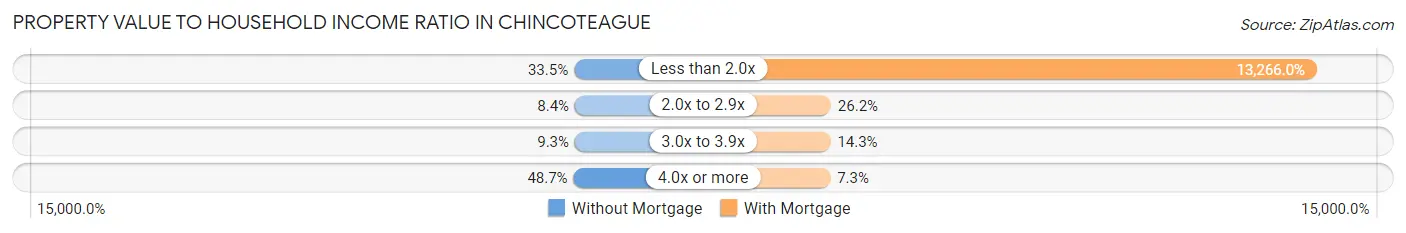
| Value-to-Income Ratio | Without Mortgage | With Mortgage |
| Less than 2.0x | 226 (33.5%) | 69,514 (13,266.0%) |
| 2.0x to 2.9x | 57 (8.4%) | 137 (26.2%) |
| 3.0x to 3.9x | 63 (9.3%) | 75 (14.3%) |
| 4.0x or more | 329 (48.7%) | 38 (7.2%) |
| Total | 675 (100.0%) | 524 (100.0%) |
Real Estate Taxes by Mortgage Status in Chincoteague
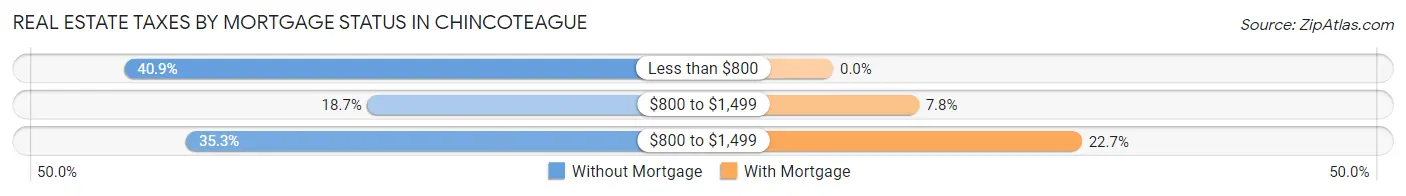
| Property Taxes | Without Mortgage | With Mortgage |
| Less than $800 | 276 (40.9%) | 0 (0.0%) |
| $800 to $1,499 | 126 (18.7%) | 41 (7.8%) |
| $800 to $1,499 | 238 (35.3%) | 119 (22.7%) |
| Total | 675 (100.0%) | 524 (100.0%) |
Health & Disability in Chincoteague
Health Insurance Coverage by Age in Chincoteague
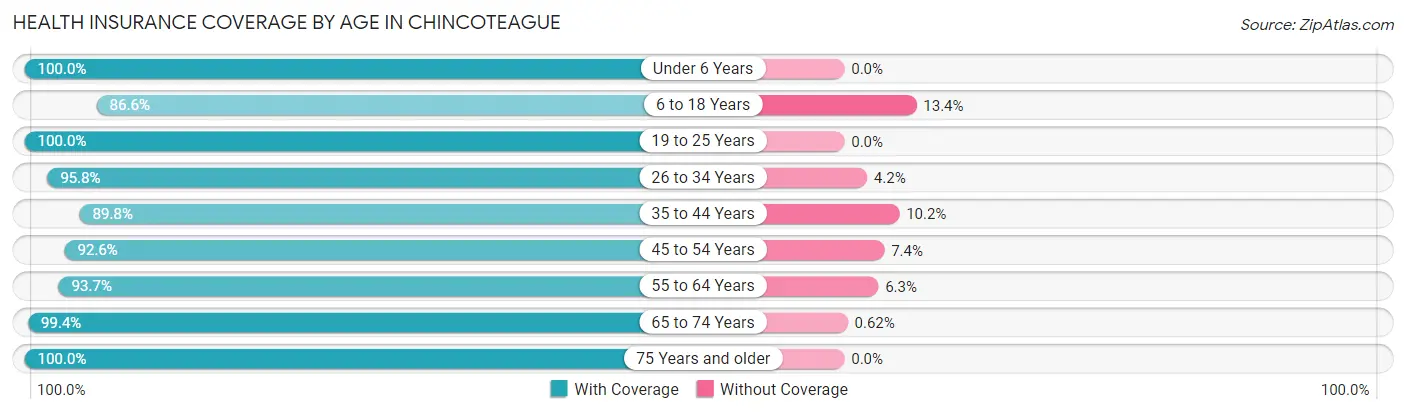
| Age Bracket | With Coverage | Without Coverage |
| Under 6 Years | 206 (100.0%) | 0 (0.0%) |
| 6 to 18 Years | 264 (86.6%) | 41 (13.4%) |
| 19 to 25 Years | 101 (100.0%) | 0 (0.0%) |
| 26 to 34 Years | 159 (95.8%) | 7 (4.2%) |
| 35 to 44 Years | 333 (89.8%) | 38 (10.2%) |
| 45 to 54 Years | 286 (92.6%) | 23 (7.4%) |
| 55 to 64 Years | 503 (93.7%) | 34 (6.3%) |
| 65 to 74 Years | 805 (99.4%) | 5 (0.6%) |
| 75 Years and older | 401 (100.0%) | 0 (0.0%) |
| Total | 3,058 (95.4%) | 148 (4.6%) |
Health Insurance Coverage by Citizenship Status in Chincoteague
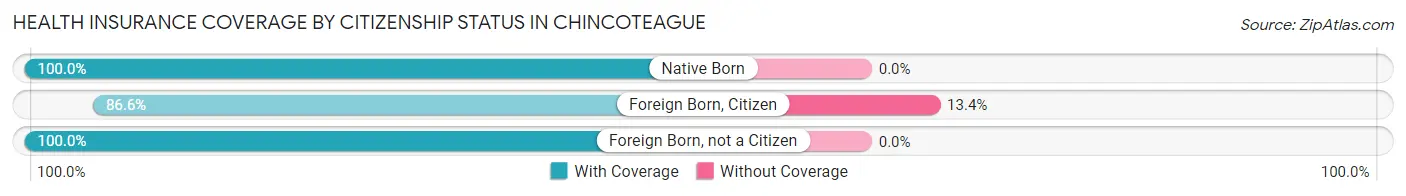
| Citizenship Status | With Coverage | Without Coverage |
| Native Born | 206 (100.0%) | 0 (0.0%) |
| Foreign Born, Citizen | 264 (86.6%) | 41 (13.4%) |
| Foreign Born, not a Citizen | 101 (100.0%) | 0 (0.0%) |
Health Insurance Coverage by Household Income in Chincoteague
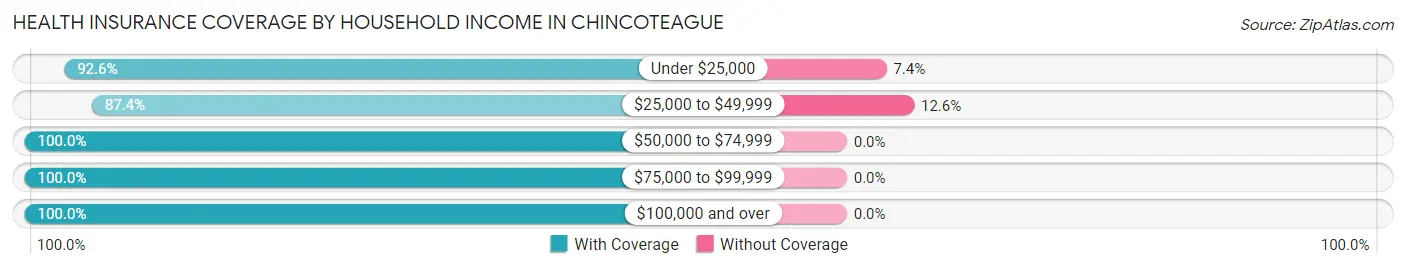
| Household Income | With Coverage | Without Coverage |
| Under $25,000 | 461 (92.6%) | 37 (7.4%) |
| $25,000 to $49,999 | 770 (87.4%) | 111 (12.6%) |
| $50,000 to $74,999 | 464 (100.0%) | 0 (0.0%) |
| $75,000 to $99,999 | 384 (100.0%) | 0 (0.0%) |
| $100,000 and over | 979 (100.0%) | 0 (0.0%) |
Public vs Private Health Insurance Coverage by Age in Chincoteague
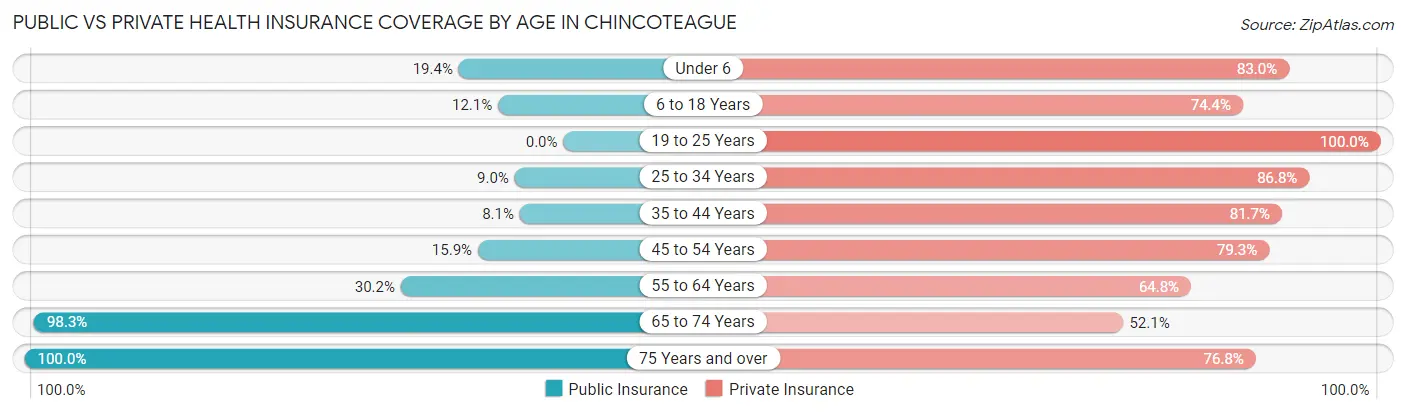
| Age Bracket | Public Insurance | Private Insurance |
| Under 6 | 40 (19.4%) | 171 (83.0%) |
| 6 to 18 Years | 37 (12.1%) | 227 (74.4%) |
| 19 to 25 Years | 0 (0.0%) | 101 (100.0%) |
| 25 to 34 Years | 15 (9.0%) | 144 (86.8%) |
| 35 to 44 Years | 30 (8.1%) | 303 (81.7%) |
| 45 to 54 Years | 49 (15.9%) | 245 (79.3%) |
| 55 to 64 Years | 162 (30.2%) | 348 (64.8%) |
| 65 to 74 Years | 796 (98.3%) | 422 (52.1%) |
| 75 Years and over | 401 (100.0%) | 308 (76.8%) |
| Total | 1,530 (47.7%) | 2,269 (70.8%) |
Disability Status by Sex by Age in Chincoteague
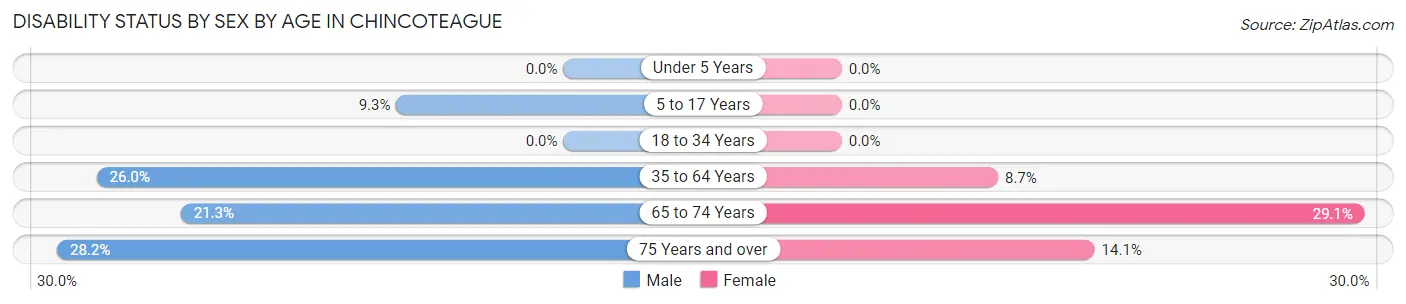
| Age Bracket | Male | Female |
| Under 5 Years | 0 (0.0%) | 0 (0.0%) |
| 5 to 17 Years | 20 (9.3%) | 0 (0.0%) |
| 18 to 34 Years | 0 (0.0%) | 0 (0.0%) |
| 35 to 64 Years | 158 (26.0%) | 53 (8.7%) |
| 65 to 74 Years | 95 (21.3%) | 106 (29.1%) |
| 75 Years and over | 53 (28.2%) | 30 (14.1%) |
Disability Class by Sex by Age in Chincoteague
Disability Class: Hearing Difficulty
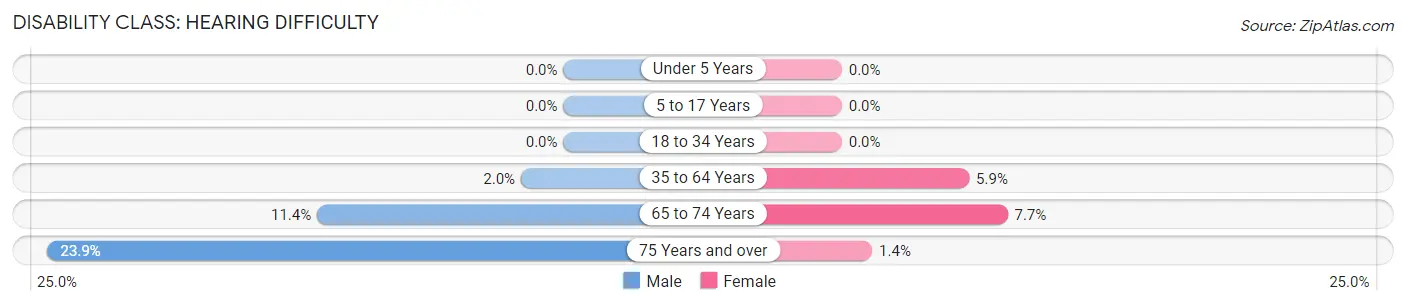
| Age Bracket | Male | Female |
| Under 5 Years | 0 (0.0%) | 0 (0.0%) |
| 5 to 17 Years | 0 (0.0%) | 0 (0.0%) |
| 18 to 34 Years | 0 (0.0%) | 0 (0.0%) |
| 35 to 64 Years | 12 (2.0%) | 36 (5.9%) |
| 65 to 74 Years | 51 (11.4%) | 28 (7.7%) |
| 75 Years and over | 45 (23.9%) | 3 (1.4%) |
Disability Class: Vision Difficulty
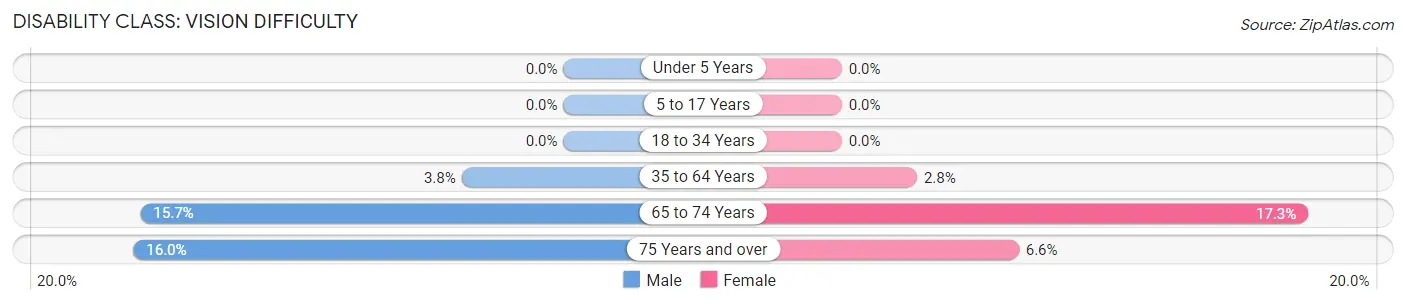
| Age Bracket | Male | Female |
| Under 5 Years | 0 (0.0%) | 0 (0.0%) |
| 5 to 17 Years | 0 (0.0%) | 0 (0.0%) |
| 18 to 34 Years | 0 (0.0%) | 0 (0.0%) |
| 35 to 64 Years | 23 (3.8%) | 17 (2.8%) |
| 65 to 74 Years | 70 (15.7%) | 63 (17.3%) |
| 75 Years and over | 30 (16.0%) | 14 (6.6%) |
Disability Class: Cognitive Difficulty
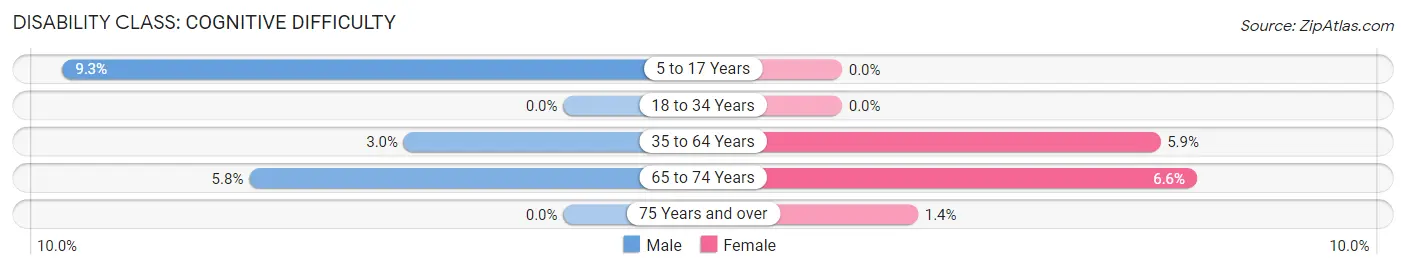
| Age Bracket | Male | Female |
| 5 to 17 Years | 20 (9.3%) | 0 (0.0%) |
| 18 to 34 Years | 0 (0.0%) | 0 (0.0%) |
| 35 to 64 Years | 18 (3.0%) | 36 (5.9%) |
| 65 to 74 Years | 26 (5.8%) | 24 (6.6%) |
| 75 Years and over | 0 (0.0%) | 3 (1.4%) |
Disability Class: Ambulatory Difficulty
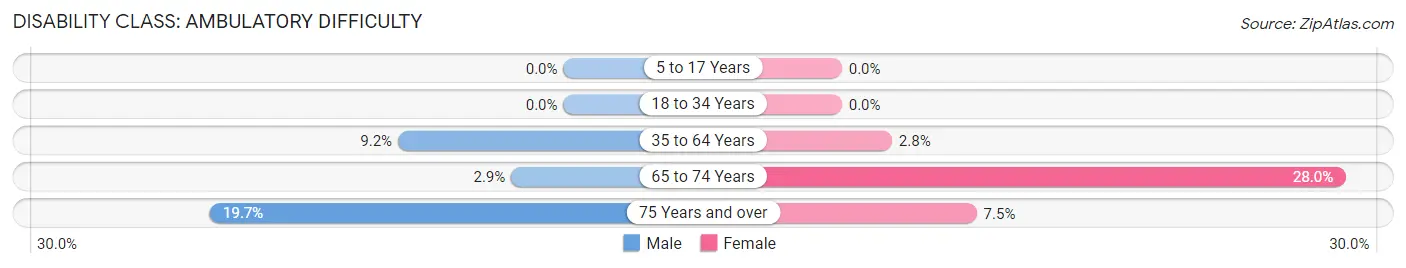
| Age Bracket | Male | Female |
| 5 to 17 Years | 0 (0.0%) | 0 (0.0%) |
| 18 to 34 Years | 0 (0.0%) | 0 (0.0%) |
| 35 to 64 Years | 56 (9.2%) | 17 (2.8%) |
| 65 to 74 Years | 13 (2.9%) | 102 (28.0%) |
| 75 Years and over | 37 (19.7%) | 16 (7.5%) |
Disability Class: Self-Care Difficulty
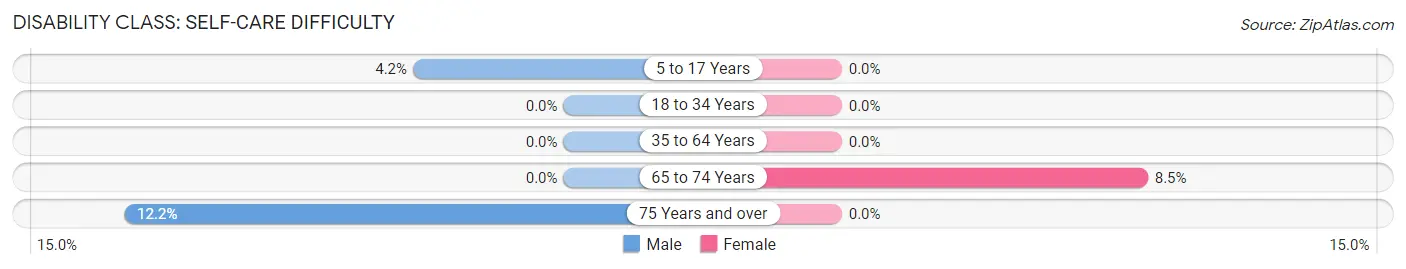
| Age Bracket | Male | Female |
| 5 to 17 Years | 9 (4.2%) | 0 (0.0%) |
| 18 to 34 Years | 0 (0.0%) | 0 (0.0%) |
| 35 to 64 Years | 0 (0.0%) | 0 (0.0%) |
| 65 to 74 Years | 0 (0.0%) | 31 (8.5%) |
| 75 Years and over | 23 (12.2%) | 0 (0.0%) |
Technology Access in Chincoteague
Computing Device Access in Chincoteague
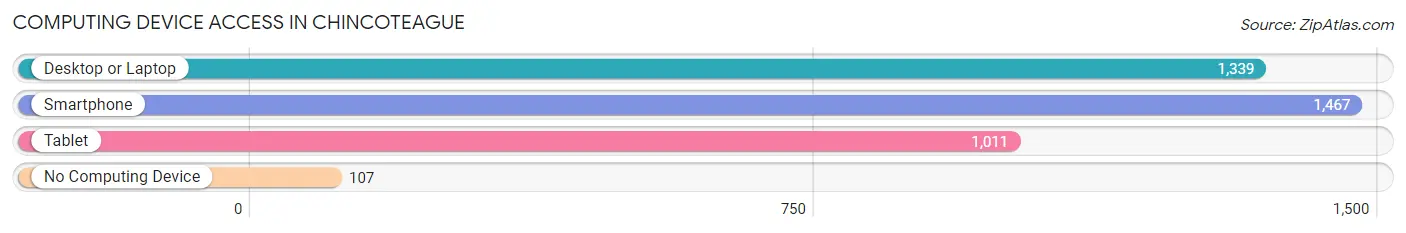
| Device Type | # Households | % Households |
| Desktop or Laptop | 1,339 | 74.5% |
| Smartphone | 1,467 | 81.6% |
| Tablet | 1,011 | 56.2% |
| No Computing Device | 107 | 5.9% |
| Total | 1,798 | 100.0% |
Internet Access in Chincoteague
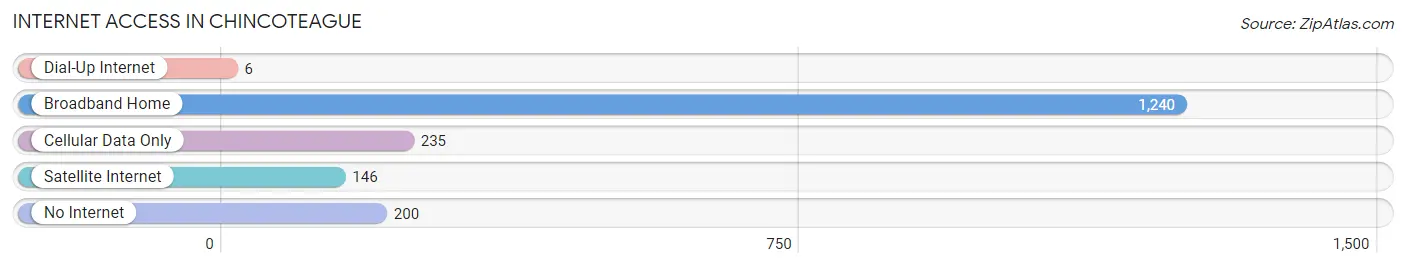
| Internet Type | # Households | % Households |
| Dial-Up Internet | 6 | 0.3% |
| Broadband Home | 1,240 | 69.0% |
| Cellular Data Only | 235 | 13.1% |
| Satellite Internet | 146 | 8.1% |
| No Internet | 200 | 11.1% |
| Total | 1,798 | 100.0% |
Chincoteague Summary
Chincoteague, Virginia is a small town located on the Eastern Shore of Virginia, on the Delmarva Peninsula. It is situated on the southern end of the Delmarva Peninsula, between the Atlantic Ocean and the Chesapeake Bay. The town is known for its beautiful beaches, wildlife, and seafood.
History
Chincoteague was first settled in the early 1600s by English colonists. The town was originally called “Chincoteague Island” and was part of the Accomack County. In 1785, the town was officially incorporated as “Chincoteague”. The town was named after the Chincoteague Indians, who were the original inhabitants of the area.
The town was a major fishing and oystering center in the 19th century. In 1835, the town was devastated by a major hurricane, which destroyed many of the buildings and homes. In the late 19th century, the town began to recover and the economy began to grow.
In the early 20th century, the town became a popular tourist destination. The town was featured in the book “Misty of Chincoteague”, which was written by Marguerite Henry in 1947. The book was later made into a movie in 1961.
Geography
Chincoteague is located on the Eastern Shore of Virginia, on the Delmarva Peninsula. The town is situated on the southern end of the Delmarva Peninsula, between the Atlantic Ocean and the Chesapeake Bay. The town is bordered by the towns of Wallops Island, Assateague Island, and Chincoteague Bay.
The town has a total area of 8.3 square miles, of which 7.9 square miles is land and 0.4 square miles is water. The town is located on a barrier island, which is separated from the mainland by a narrow channel. The town is located on the Chincoteague Bay, which is a shallow estuary.
Economy
The economy of Chincoteague is largely based on tourism. The town is a popular destination for beachgoers, birdwatchers, and nature lovers. The town is also known for its seafood, which includes oysters, clams, and crabs.
The town is also home to several businesses, including restaurants, hotels, and retail stores. The town is also home to a number of marinas, which provide boat rentals and fishing charters.
Demographics
As of the 2010 census, the population of Chincoteague was 2,941. The population is largely white (90.2%), with a small African American population (4.2%). The median household income is $45,938, and the median age is 44.
Conclusion
Chincoteague, Virginia is a small town located on the Eastern Shore of Virginia, on the Delmarva Peninsula. The town is known for its beautiful beaches, wildlife, and seafood. The economy of Chincoteague is largely based on tourism, and the town is a popular destination for beachgoers, birdwatchers, and nature lovers. The population of Chincoteague is largely white, with a small African American population.
Common Questions
What is Per Capita Income in Chincoteague?
Per Capita income in Chincoteague is $40,973.
What is the Median Family Income in Chincoteague?
Median Family Income in Chincoteague is $82,266.
What is the Median Household income in Chincoteague?
Median Household Income in Chincoteague is $46,319.
What is Income or Wage Gap in Chincoteague?
Income or Wage Gap in Chincoteague is 56.8%.
Women in Chincoteague earn 43.2 cents for every dollar earned by a man.
What is Inequality or Gini Index in Chincoteague?
Inequality or Gini Index in Chincoteague is 0.51.
What is the Total Population of Chincoteague?
Total Population of Chincoteague is 3,303.
What is the Total Male Population of Chincoteague?
Total Male Population of Chincoteague is 1,769.
What is the Total Female Population of Chincoteague?
Total Female Population of Chincoteague is 1,534.
What is the Ratio of Males per 100 Females in Chincoteague?
There are 115.32 Males per 100 Females in Chincoteague.
What is the Ratio of Females per 100 Males in Chincoteague?
There are 86.72 Females per 100 Males in Chincoteague.
What is the Median Population Age in Chincoteague?
Median Population Age in Chincoteague is 56.8 Years.
What is the Average Family Size in Chincoteague
Average Family Size in Chincoteague is 2.5 People.
What is the Average Household Size in Chincoteague
Average Household Size in Chincoteague is 1.8 People.
How Large is the Labor Force in Chincoteague?
There are 1,368 People in the Labor Forcein in Chincoteague.
What is the Percentage of People in the Labor Force in Chincoteague?
47.3% of People are in the Labor Force in Chincoteague.
What is the Unemployment Rate in Chincoteague?
Unemployment Rate in Chincoteague is 7.2%.