Glenvar, VA Map & Demographics
Glenvar Map
Glenvar Overview
$32,631
PER CAPITA INCOME
$134,118
AVG FAMILY INCOME
$30,234
AVG HOUSEHOLD INCOME
65.2%
WAGE / INCOME GAP [ % ]
34.8¢/ $1
WAGE / INCOME GAP [ $ ]
0.53
INEQUALITY / GINI INDEX
932
TOTAL POPULATION
253
MALE POPULATION
679
FEMALE POPULATION
37.26
MALES / 100 FEMALES
268.38
FEMALES / 100 MALES
74.7
MEDIAN AGE
2.3
AVG FAMILY SIZE
1.4
AVG HOUSEHOLD SIZE
221
LABOR FORCE [ PEOPLE ]
24.5%
PERCENT IN LABOR FORCE
6.3%
UNEMPLOYMENT RATE
Income in Glenvar
Income Overview in Glenvar
Per Capita Income in Glenvar is $32,631, while median incomes of families and households are $134,118 and $30,234 respectively.
| Characteristic | Number | Measure |
| Per Capita Income | 932 | $32,631 |
| Median Family Income | 160 | $134,118 |
| Mean Family Income | 160 | $113,027 |
| Median Household Income | 487 | $30,234 |
| Mean Household Income | 487 | $52,437 |
| Income Deficit | 160 | $0 |
| Wage / Income Gap (%) | 932 | 65.24% |
| Wage / Income Gap ($) | 932 | 34.76¢ per $1 |
| Gini / Inequality Index | 932 | 0.53 |
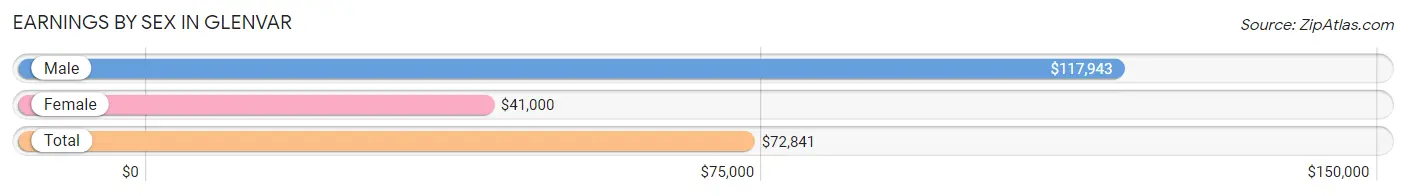
Earnings by Sex in Glenvar
Average Earnings in Glenvar are $72,841, $117,943 for men and $41,000 for women, a difference of 65.2%.
| Sex | Number | Average Earnings |
| Male | 115 (55.6%) | $117,943 |
| Female | 92 (44.4%) | $41,000 |
| Total | 207 (100.0%) | $72,841 |
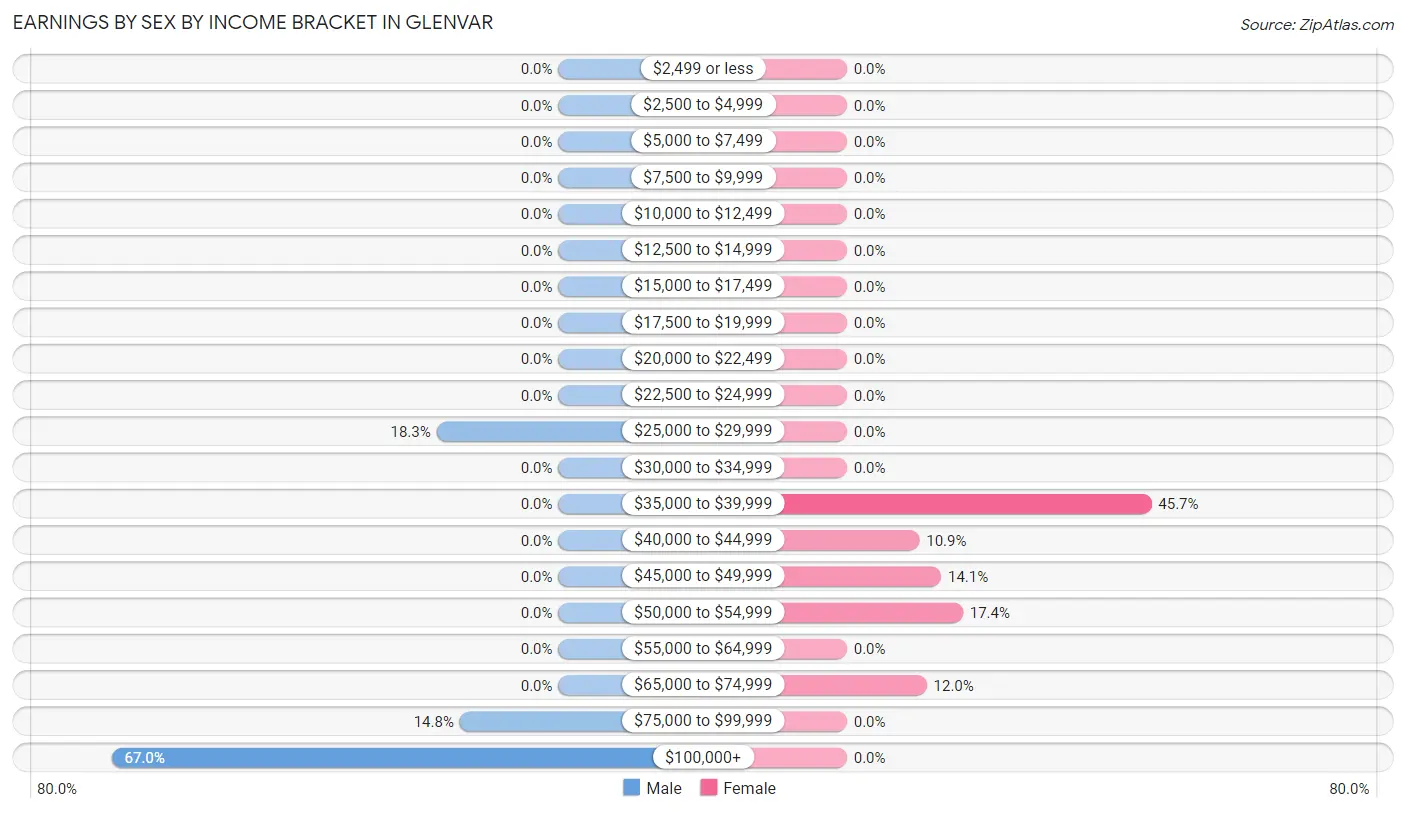
Earnings by Sex by Income Bracket in Glenvar
The most common earnings brackets in Glenvar are $100,000+ for men (77 | 67.0%) and $35,000 to $39,999 for women (42 | 45.7%).
| Income | Male | Female |
| $2,499 or less | 0 (0.0%) | 0 (0.0%) |
| $2,500 to $4,999 | 0 (0.0%) | 0 (0.0%) |
| $5,000 to $7,499 | 0 (0.0%) | 0 (0.0%) |
| $7,500 to $9,999 | 0 (0.0%) | 0 (0.0%) |
| $10,000 to $12,499 | 0 (0.0%) | 0 (0.0%) |
| $12,500 to $14,999 | 0 (0.0%) | 0 (0.0%) |
| $15,000 to $17,499 | 0 (0.0%) | 0 (0.0%) |
| $17,500 to $19,999 | 0 (0.0%) | 0 (0.0%) |
| $20,000 to $22,499 | 0 (0.0%) | 0 (0.0%) |
| $22,500 to $24,999 | 0 (0.0%) | 0 (0.0%) |
| $25,000 to $29,999 | 21 (18.3%) | 0 (0.0%) |
| $30,000 to $34,999 | 0 (0.0%) | 0 (0.0%) |
| $35,000 to $39,999 | 0 (0.0%) | 42 (45.7%) |
| $40,000 to $44,999 | 0 (0.0%) | 10 (10.9%) |
| $45,000 to $49,999 | 0 (0.0%) | 13 (14.1%) |
| $50,000 to $54,999 | 0 (0.0%) | 16 (17.4%) |
| $55,000 to $64,999 | 0 (0.0%) | 0 (0.0%) |
| $65,000 to $74,999 | 0 (0.0%) | 11 (12.0%) |
| $75,000 to $99,999 | 17 (14.8%) | 0 (0.0%) |
| $100,000+ | 77 (67.0%) | 0 (0.0%) |
| Total | 115 (100.0%) | 92 (100.0%) |
Earnings by Sex by Educational Attainment in Glenvar
| Educational Attainment | Male Income | Female Income |
| Less than High School | - | - |
| High School Diploma | - | - |
| College or Associate's Degree | - | - |
| Bachelor's Degree | - | - |
| Graduate Degree | - | - |
| Total | $117,943 | $41,000 |
Family Income in Glenvar
Family Income Brackets in Glenvar
According to the Glenvar family income data, there are 69 families falling into the $50,000 to $74,999 income range, which is the most common income bracket and makes up 43.1% of all families.
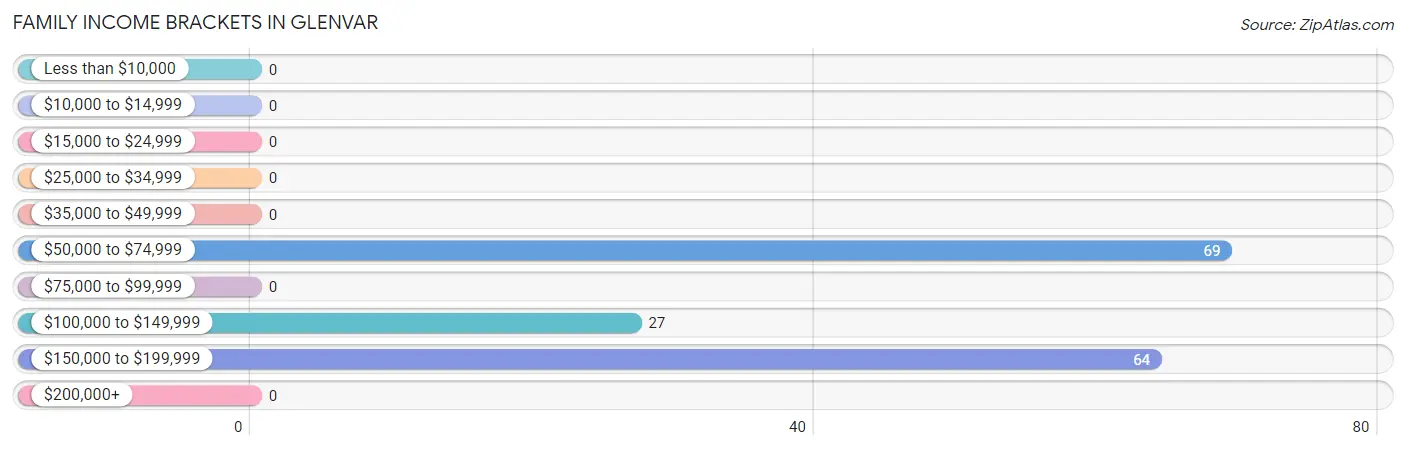
| Income Bracket | # Families | % Families |
| Less than $10,000 | 0 | 0.0% |
| $10,000 to $14,999 | 0 | 0.0% |
| $15,000 to $24,999 | 0 | 0.0% |
| $25,000 to $34,999 | 0 | 0.0% |
| $35,000 to $49,999 | 0 | 0.0% |
| $50,000 to $74,999 | 69 | 43.1% |
| $75,000 to $99,999 | 0 | 0.0% |
| $100,000 to $149,999 | 27 | 16.9% |
| $150,000 to $199,999 | 64 | 40.0% |
| $200,000+ | 0 | 0.0% |
Family Income by Famaliy Size in Glenvar
2-person families (96 | 60.0%) account for the highest median family income in Glenvar with $62,250 per family, while 2-person families (96 | 60.0%) have the highest median income of $31,125 per family member.
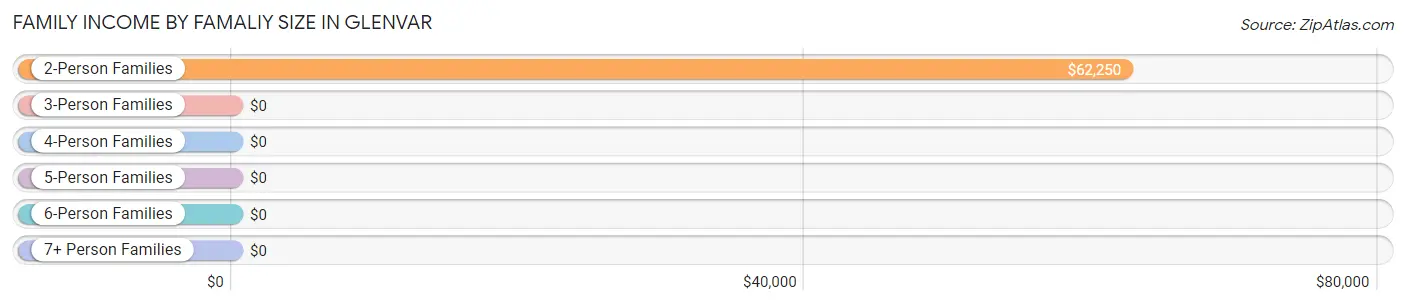
| Income Bracket | # Families | Median Income |
| 2-Person Families | 96 (60.0%) | $62,250 |
| 3-Person Families | 64 (40.0%) | $0 |
| 4-Person Families | 0 (0.0%) | $0 |
| 5-Person Families | 0 (0.0%) | $0 |
| 6-Person Families | 0 (0.0%) | $0 |
| 7+ Person Families | 0 (0.0%) | $0 |
| Total | 160 (100.0%) | $134,118 |
Family Income by Number of Earners in Glenvar
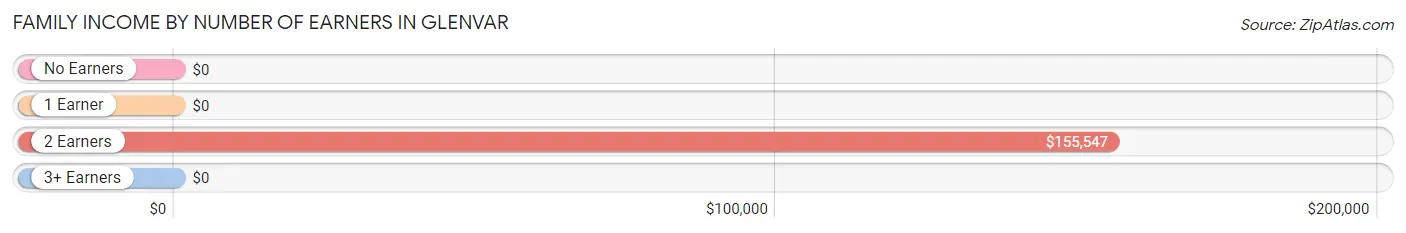
| Number of Earners | # Families | Median Income |
| No Earners | 49 (30.6%) | $0 |
| 1 Earner | 36 (22.5%) | $0 |
| 2 Earners | 75 (46.9%) | $155,547 |
| 3+ Earners | 0 (0.0%) | $0 |
| Total | 160 (100.0%) | $134,118 |
Household Income in Glenvar
Household Income Brackets in Glenvar
With 124 households falling in the category, the less than $10,000 income range is the most frequent in Glenvar, accounting for 25.5% of all households.
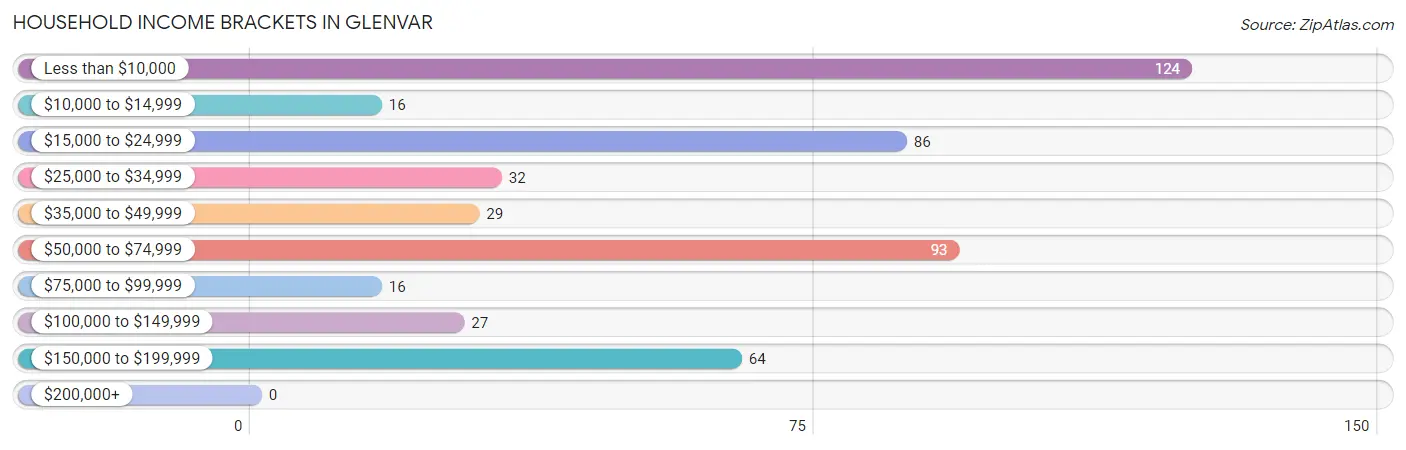
| Income Bracket | # Households | % Households |
| Less than $10,000 | 124 | 25.5% |
| $10,000 to $14,999 | 16 | 3.3% |
| $15,000 to $24,999 | 86 | 17.7% |
| $25,000 to $34,999 | 32 | 6.6% |
| $35,000 to $49,999 | 29 | 6.0% |
| $50,000 to $74,999 | 93 | 19.1% |
| $75,000 to $99,999 | 16 | 3.3% |
| $100,000 to $149,999 | 27 | 5.5% |
| $150,000 to $199,999 | 64 | 13.1% |
| $200,000+ | 0 | 0.0% |
Household Income by Householder Age in Glenvar
The median household income in Glenvar is $30,234, with the highest median household income of $155,703 found in the 45 to 64 years age bracket for the primary householder. A total of 69 households (14.2%) fall into this category.
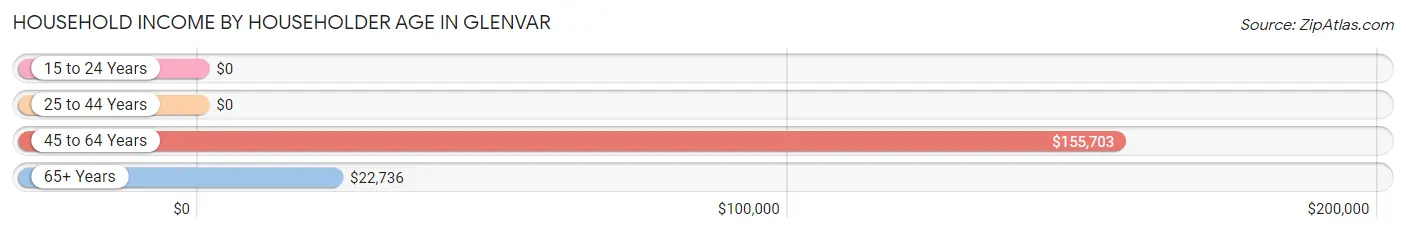
| Income Bracket | # Households | Median Income |
| 15 to 24 Years | 0 (0.0%) | $0 |
| 25 to 44 Years | 33 (6.8%) | $0 |
| 45 to 64 Years | 69 (14.2%) | $155,703 |
| 65+ Years | 385 (79.1%) | $22,736 |
| Total | 487 (100.0%) | $30,234 |
Poverty in Glenvar
Income Below Poverty by Sex and Age in Glenvar
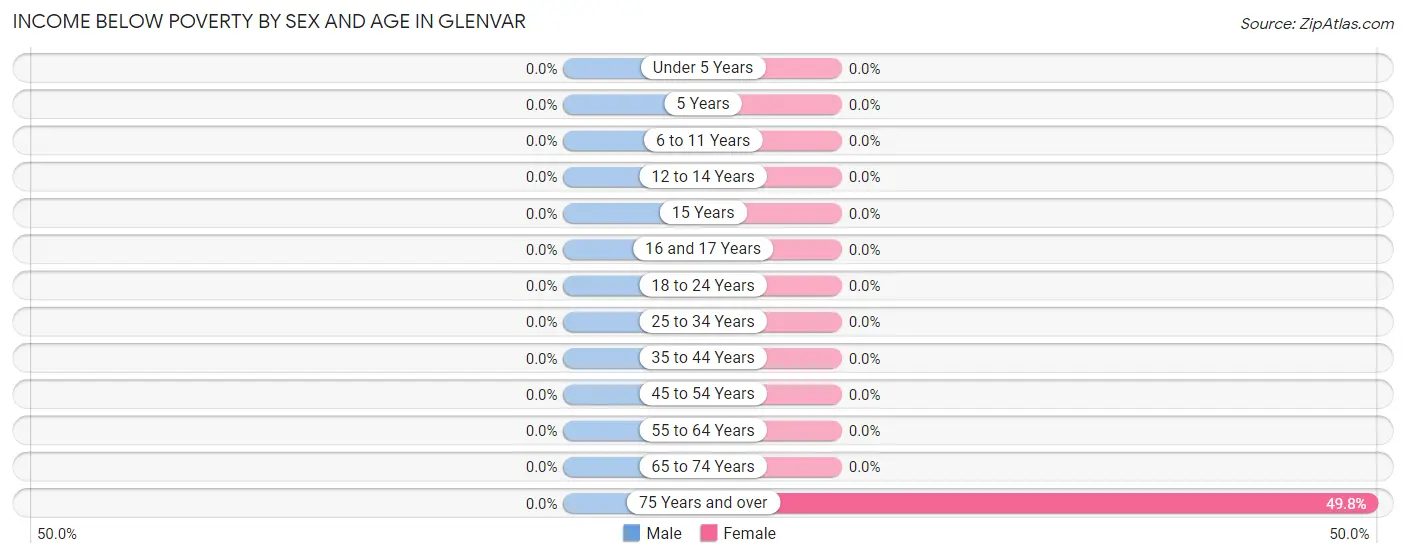
| Age Bracket | Male | Female |
| Under 5 Years | 0 (0.0%) | 0 (0.0%) |
| 5 Years | 0 (0.0%) | 0 (0.0%) |
| 6 to 11 Years | 0 (0.0%) | 0 (0.0%) |
| 12 to 14 Years | 0 (0.0%) | 0 (0.0%) |
| 15 Years | 0 (0.0%) | 0 (0.0%) |
| 16 and 17 Years | 0 (0.0%) | 0 (0.0%) |
| 18 to 24 Years | 0 (0.0%) | 0 (0.0%) |
| 25 to 34 Years | 0 (0.0%) | 0 (0.0%) |
| 35 to 44 Years | 0 (0.0%) | 0 (0.0%) |
| 45 to 54 Years | 0 (0.0%) | 0 (0.0%) |
| 55 to 64 Years | 0 (0.0%) | 0 (0.0%) |
| 65 to 74 Years | 0 (0.0%) | 0 (0.0%) |
| 75 Years and over | 0 (0.0%) | 124 (49.8%) |
| Total | 0 (0.0%) | 124 (24.6%) |
Income Above Poverty by Sex and Age in Glenvar
According to the poverty statistics in Glenvar, males aged 25 to 34 years and females aged 15 years are the age groups that are most secure financially, with 100.0% of males and 100.0% of females in these age groups living above the poverty line.
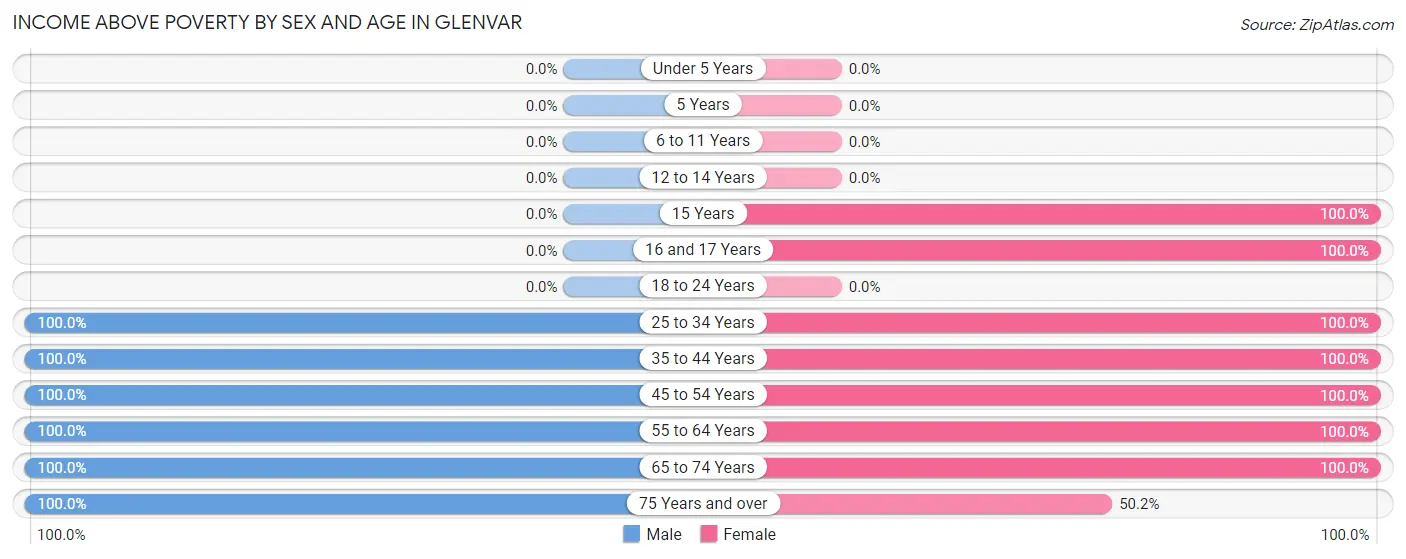
| Age Bracket | Male | Female |
| Under 5 Years | 0 (0.0%) | 0 (0.0%) |
| 5 Years | 0 (0.0%) | 0 (0.0%) |
| 6 to 11 Years | 0 (0.0%) | 0 (0.0%) |
| 12 to 14 Years | 0 (0.0%) | 0 (0.0%) |
| 15 Years | 0 (0.0%) | 29 (100.0%) |
| 16 and 17 Years | 0 (0.0%) | 15 (100.0%) |
| 18 to 24 Years | 0 (0.0%) | 0 (0.0%) |
| 25 to 34 Years | 17 (100.0%) | 13 (100.0%) |
| 35 to 44 Years | 18 (100.0%) | 16 (100.0%) |
| 45 to 54 Years | 48 (100.0%) | 42 (100.0%) |
| 55 to 64 Years | 11 (100.0%) | 21 (100.0%) |
| 65 to 74 Years | 40 (100.0%) | 119 (100.0%) |
| 75 Years and over | 60 (100.0%) | 125 (50.2%) |
| Total | 194 (100.0%) | 380 (75.4%) |
Income Below Poverty Among Married-Couple Families in Glenvar
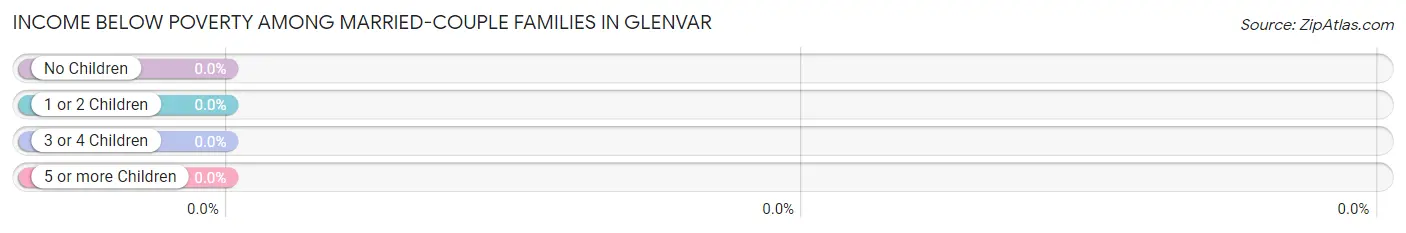
| Children | Above Poverty | Below Poverty |
| No Children | 96 (100.0%) | 0 (0.0%) |
| 1 or 2 Children | 64 (100.0%) | 0 (0.0%) |
| 3 or 4 Children | 0 (0.0%) | 0 (0.0%) |
| 5 or more Children | 0 (0.0%) | 0 (0.0%) |
| Total | 160 (100.0%) | 0 (0.0%) |
Income Below Poverty Among Single-Parent Households in Glenvar
| Children | Single Father | Single Mother |
| No Children | 0 (0.0%) | 0 (0.0%) |
| 1 or 2 Children | 0 (0.0%) | 0 (0.0%) |
| 3 or 4 Children | 0 (0.0%) | 0 (0.0%) |
| 5 or more Children | 0 (0.0%) | 0 (0.0%) |
| Total | 0 (0.0%) | 0 (0.0%) |
Income Below Poverty Among Married-Couple vs Single-Parent Households in Glenvar
| Children | Married-Couple Families | Single-Parent Households |
| No Children | 0 (0.0%) | 0 (0.0%) |
| 1 or 2 Children | 0 (0.0%) | 0 (0.0%) |
| 3 or 4 Children | 0 (0.0%) | 0 (0.0%) |
| 5 or more Children | 0 (0.0%) | 0 (0.0%) |
| Total | 0 (0.0%) | 0 (0.0%) |
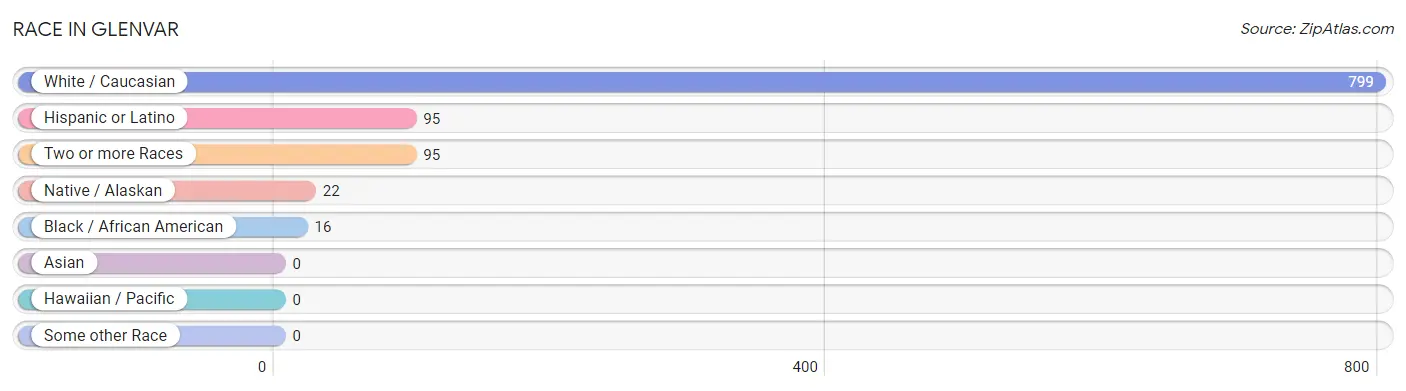
Race in Glenvar
The most populous races in Glenvar are White / Caucasian (799 | 85.7%), Hispanic or Latino (95 | 10.2%), and Two or more Races (95 | 10.2%).
| Race | # Population | % Population |
| Asian | 0 | 0.0% |
| Black / African American | 16 | 1.7% |
| Hawaiian / Pacific | 0 | 0.0% |
| Hispanic or Latino | 95 | 10.2% |
| Native / Alaskan | 22 | 2.4% |
| White / Caucasian | 799 | 85.7% |
| Two or more Races | 95 | 10.2% |
| Some other Race | 0 | 0.0% |
| Total | 932 | 100.0% |
Ancestry in Glenvar
The most populous ancestries reported in Glenvar are American (277 | 29.7%), Spaniard (95 | 10.2%), English (78 | 8.4%), German (49 | 5.3%), and Irish (45 | 4.8%), together accounting for 58.4% of all Glenvar residents.
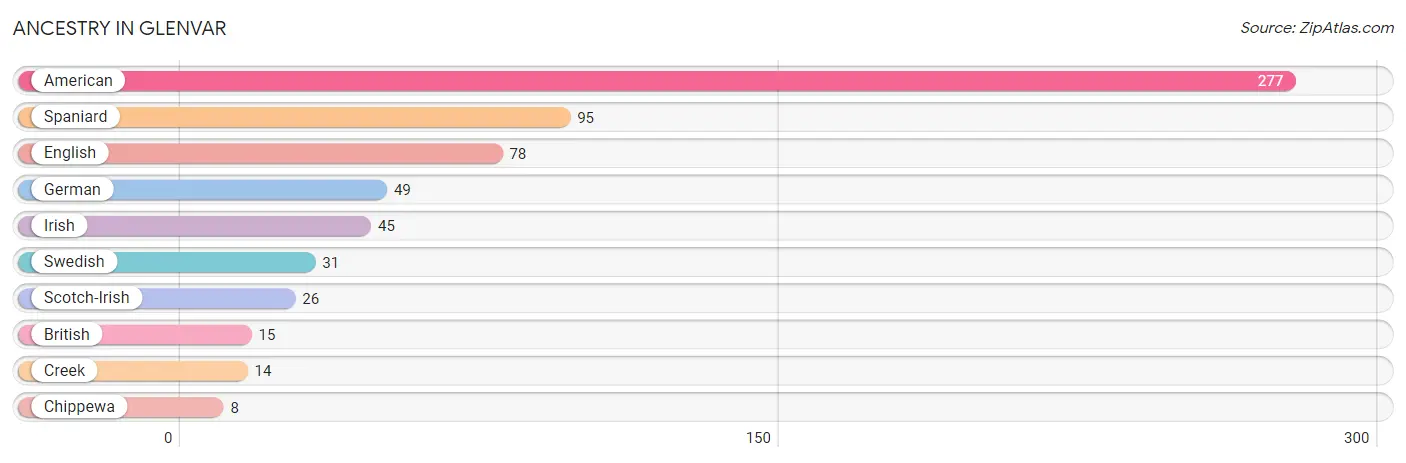
| Ancestry | # Population | % Population |
| American | 277 | 29.7% |
| British | 15 | 1.6% |
| Chippewa | 8 | 0.9% |
| Creek | 14 | 1.5% |
| English | 78 | 8.4% |
| German | 49 | 5.3% |
| Irish | 45 | 4.8% |
| Scotch-Irish | 26 | 2.8% |
| Spaniard | 95 | 10.2% |
| Swedish | 31 | 3.3% | View All 10 Rows |
Immigrants in Glenvar
The most numerous immigrant groups reported in Glenvar came from Europe (111 | 11.9%), Southern Europe (95 | 10.2%), Spain (95 | 10.2%), Germany (16 | 1.7%), and Western Europe (16 | 1.7%), together accounting for 35.7% of all Glenvar residents.
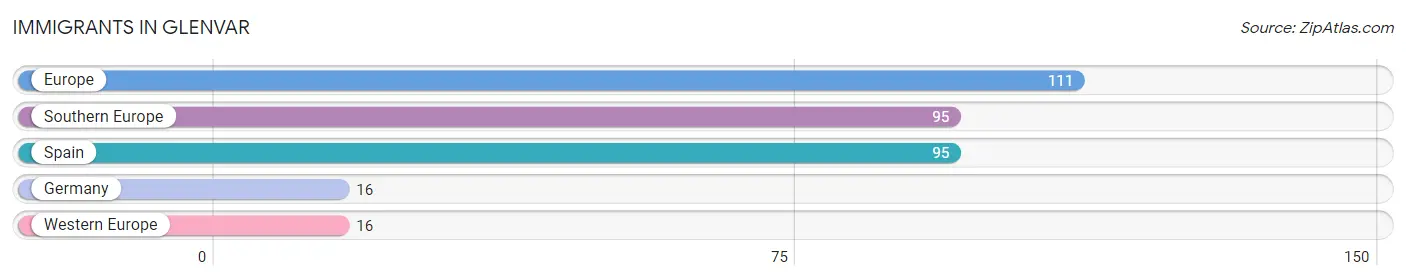
| Immigration Origin | # Population | % Population |
| Europe | 111 | 11.9% |
| Germany | 16 | 1.7% |
| Southern Europe | 95 | 10.2% |
| Spain | 95 | 10.2% |
| Western Europe | 16 | 1.7% | View All 5 Rows |
Sex and Age in Glenvar
Sex and Age in Glenvar
The most populous age groups in Glenvar are 45 to 49 Years (48 | 19.0%) for men and 85 Years and over (223 | 32.8%) for women.
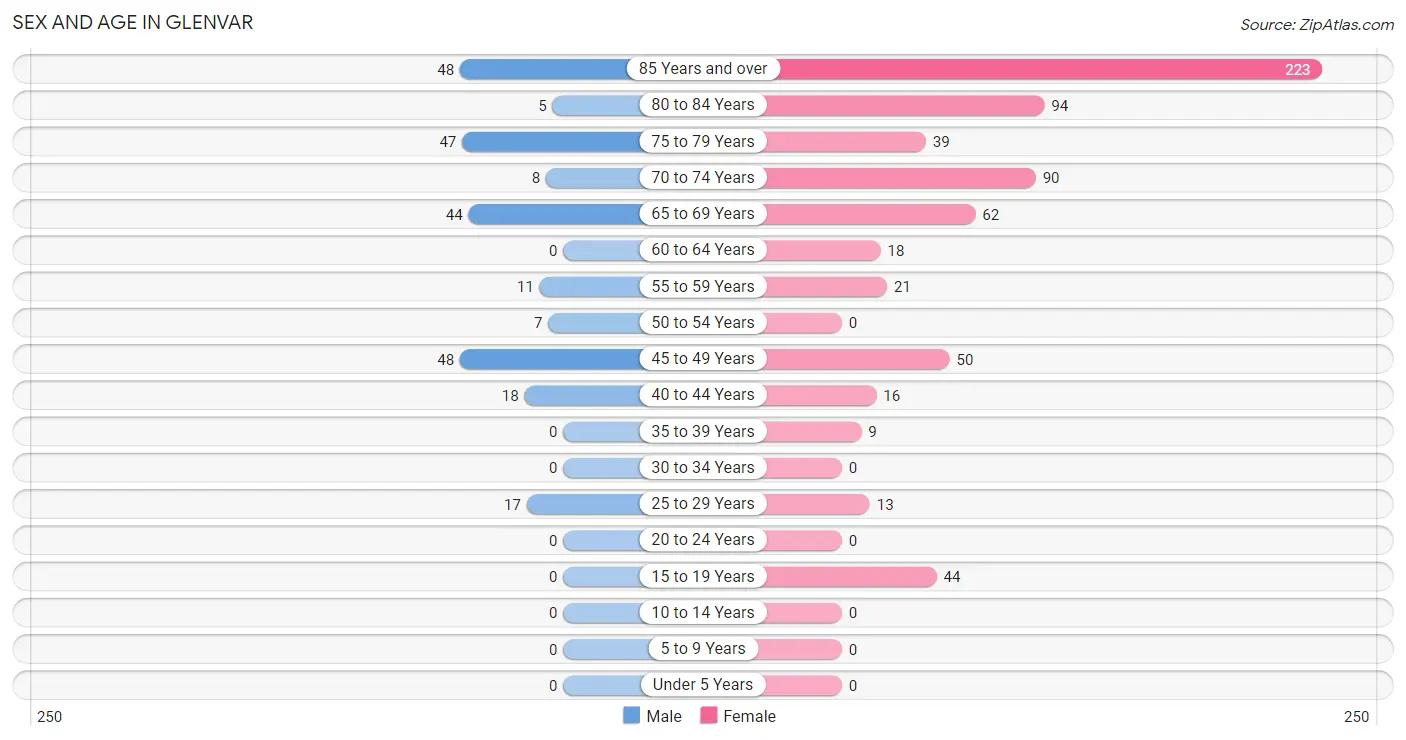
| Age Bracket | Male | Female |
| Under 5 Years | 0 (0.0%) | 0 (0.0%) |
| 5 to 9 Years | 0 (0.0%) | 0 (0.0%) |
| 10 to 14 Years | 0 (0.0%) | 0 (0.0%) |
| 15 to 19 Years | 0 (0.0%) | 44 (6.5%) |
| 20 to 24 Years | 0 (0.0%) | 0 (0.0%) |
| 25 to 29 Years | 17 (6.7%) | 13 (1.9%) |
| 30 to 34 Years | 0 (0.0%) | 0 (0.0%) |
| 35 to 39 Years | 0 (0.0%) | 9 (1.3%) |
| 40 to 44 Years | 18 (7.1%) | 16 (2.4%) |
| 45 to 49 Years | 48 (19.0%) | 50 (7.4%) |
| 50 to 54 Years | 7 (2.8%) | 0 (0.0%) |
| 55 to 59 Years | 11 (4.3%) | 21 (3.1%) |
| 60 to 64 Years | 0 (0.0%) | 18 (2.6%) |
| 65 to 69 Years | 44 (17.4%) | 62 (9.1%) |
| 70 to 74 Years | 8 (3.2%) | 90 (13.3%) |
| 75 to 79 Years | 47 (18.6%) | 39 (5.7%) |
| 80 to 84 Years | 5 (2.0%) | 94 (13.8%) |
| 85 Years and over | 48 (19.0%) | 223 (32.8%) |
| Total | 253 (100.0%) | 679 (100.0%) |
Families and Households in Glenvar
Median Family Size in Glenvar
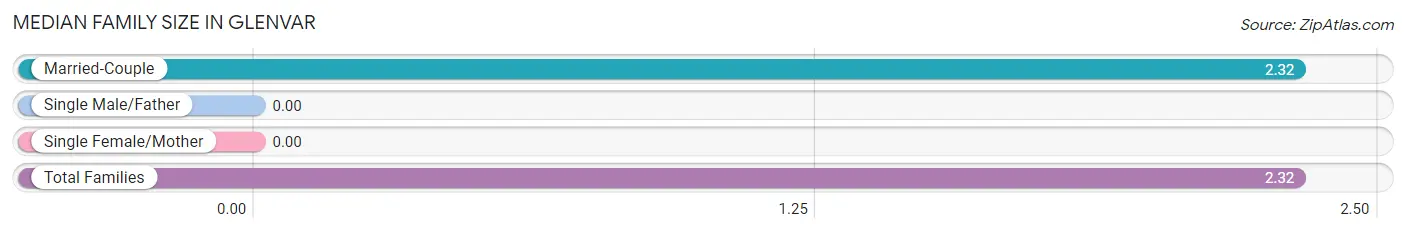
| Family Type | # Families | Family Size |
| Married-Couple | 160 (100.0%) | 2.32 |
| Single Male/Father | 0 (0.0%) | - |
| Single Female/Mother | 0 (0.0%) | - |
| Total Families | 160 (100.0%) | 2.32 |
Median Household Size in Glenvar
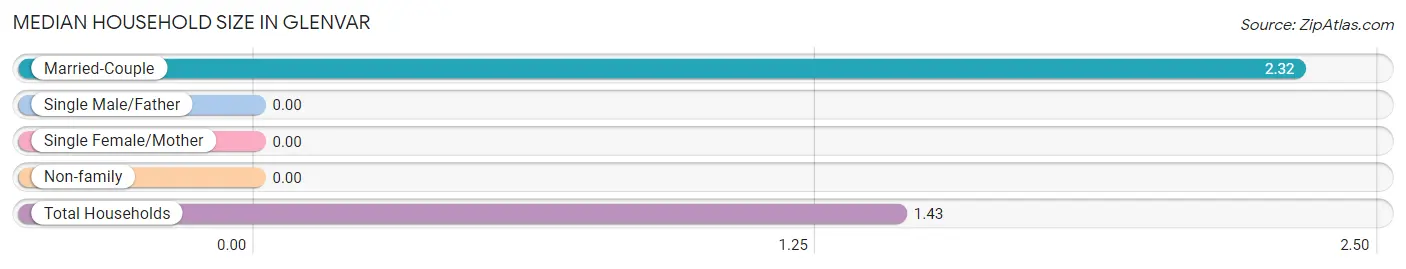
| Household Type | # Households | Household Size |
| Married-Couple | 160 (32.9%) | 2.32 |
| Single Male/Father | 0 (0.0%) | - |
| Single Female/Mother | 0 (0.0%) | - |
| Non-family | 327 (67.1%) | - |
| Total Households | 487 (100.0%) | 1.43 |
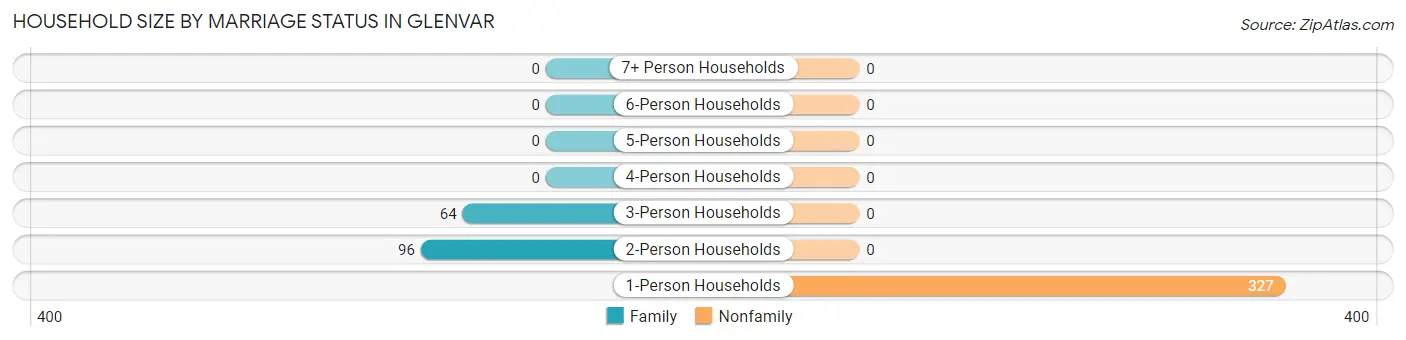
Household Size by Marriage Status in Glenvar
Out of a total of 487 households in Glenvar, 160 (32.9%) are family households, while 327 (67.1%) are nonfamily households. The most numerous type of family households are 2-person households, comprising 96, and the most common type of nonfamily households are 1-person households, comprising 327.
| Household Size | Family Households | Nonfamily Households |
| 1-Person Households | - | 327 (67.1%) |
| 2-Person Households | 96 (19.7%) | 0 (0.0%) |
| 3-Person Households | 64 (13.1%) | 0 (0.0%) |
| 4-Person Households | 0 (0.0%) | 0 (0.0%) |
| 5-Person Households | 0 (0.0%) | 0 (0.0%) |
| 6-Person Households | 0 (0.0%) | 0 (0.0%) |
| 7+ Person Households | 0 (0.0%) | 0 (0.0%) |
| Total | 160 (32.9%) | 327 (67.1%) |
Female Fertility in Glenvar
Fertility by Age in Glenvar
| Age Bracket | Women with Births | Births / 1,000 Women |
| 15 to 19 years | 0 (0.0%) | 0.0 |
| 20 to 34 years | 0 (0.0%) | 0.0 |
| 35 to 50 years | 0 (0.0%) | 0.0 |
| Total | 0 (0.0%) | 0.0 |
Fertility by Age by Marriage Status in Glenvar
| Age Bracket | Married | Unmarried |
| 15 to 19 years | 0 (0.0%) | 0 (0.0%) |
| 20 to 34 years | 0 (0.0%) | 0 (0.0%) |
| 35 to 50 years | 0 (0.0%) | 0 (0.0%) |
| Total | 0 (0.0%) | 0 (0.0%) |
Fertility by Education in Glenvar
| Educational Attainment | Women with Births | Births / 1,000 Women |
| Less than High School | 0 (0.0%) | 0.0 |
| High School Diploma | 0 (0.0%) | 0.0 |
| College or Associate's Degree | 0 (0.0%) | 0.0 |
| Bachelor's Degree | 0 (0.0%) | 0.0 |
| Graduate Degree | 0 (0.0%) | 0.0 |
| Total | 0 (0.0%) | 0.0 |
Fertility by Education by Marriage Status in Glenvar
| Educational Attainment | Married | Unmarried |
| Less than High School | 0 (0.0%) | 0 (0.0%) |
| High School Diploma | 0 (0.0%) | 0 (0.0%) |
| College or Associate's Degree | 0 (0.0%) | 0 (0.0%) |
| Bachelor's Degree | 0 (0.0%) | 0 (0.0%) |
| Graduate Degree | 0 (0.0%) | 0 (0.0%) |
| Total | 0 (0.0%) | 0 (0.0%) |
Employment Characteristics in Glenvar
Employment by Class of Employer in Glenvar
Among the 191 employed individuals in Glenvar, private company employees (157 | 82.2%), not-for-profit organizations (13 | 6.8%), and local government employees (11 | 5.8%) make up the most common classes of employment.
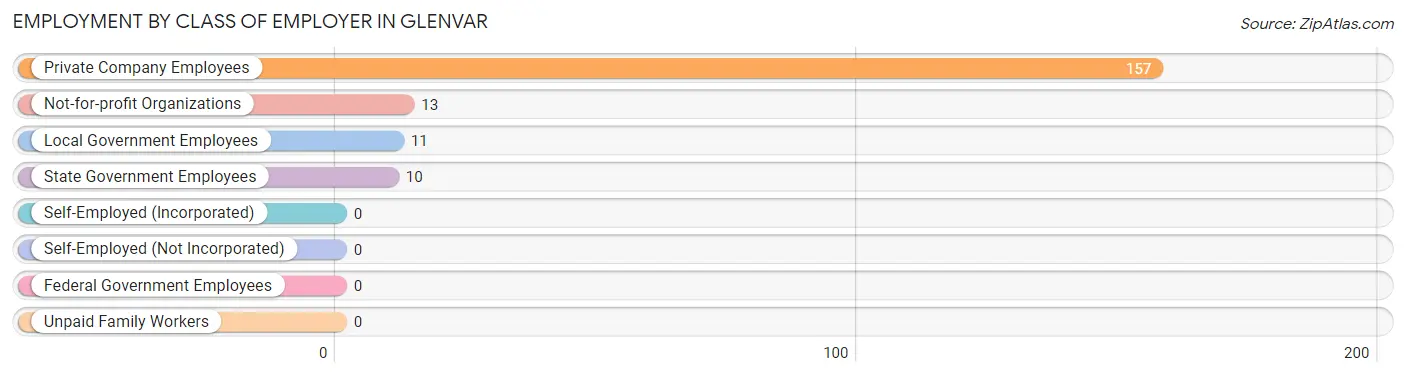
| Employer Class | # Employees | % Employees |
| Private Company Employees | 157 | 82.2% |
| Self-Employed (Incorporated) | 0 | 0.0% |
| Self-Employed (Not Incorporated) | 0 | 0.0% |
| Not-for-profit Organizations | 13 | 6.8% |
| Local Government Employees | 11 | 5.8% |
| State Government Employees | 10 | 5.2% |
| Federal Government Employees | 0 | 0.0% |
| Unpaid Family Workers | 0 | 0.0% |
| Total | 191 | 100.0% |
Employment Status by Age in Glenvar
According to the labor force statistics for Glenvar, out of the total population over 16 years of age (903), 24.5% or 221 individuals are in the labor force, with 6.3% or 14 of them unemployed. The age group with the highest labor force participation rate is 25 to 29 years, with 100.0% or 30 individuals in the labor force. Within the labor force, the 75 years and over age range has the highest percentage of unemployed individuals, with 46.7% or 14 of them being unemployed.
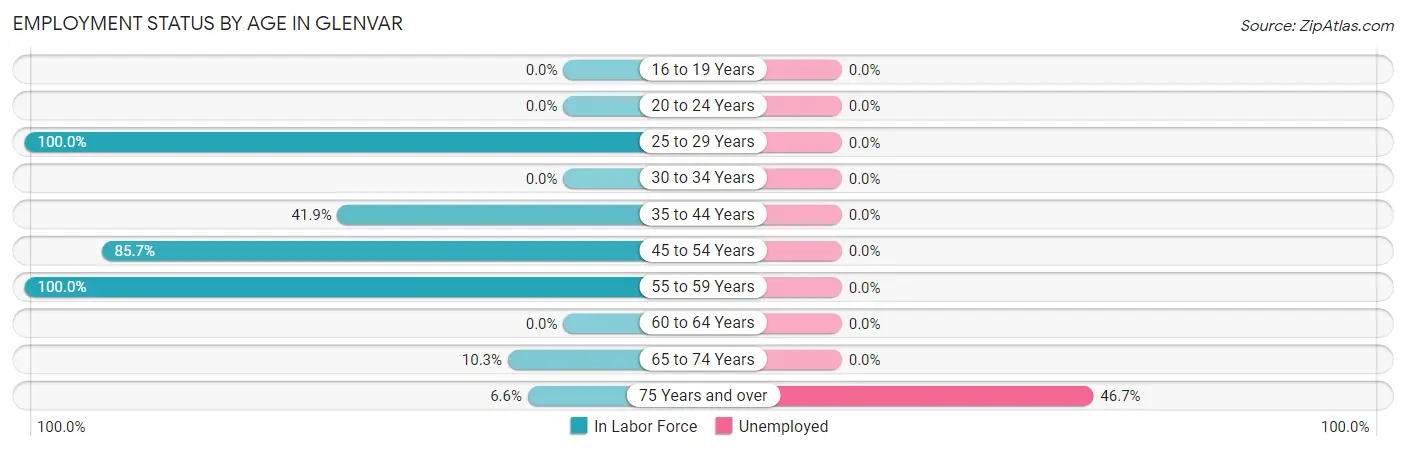
| Age Bracket | In Labor Force | Unemployed |
| 16 to 19 Years | 0 (0.0%) | 0 (0.0%) |
| 20 to 24 Years | 0 (0.0%) | 0 (0.0%) |
| 25 to 29 Years | 30 (100.0%) | 0 (0.0%) |
| 30 to 34 Years | 0 (0.0%) | 0 (0.0%) |
| 35 to 44 Years | 18 (41.9%) | 0 (0.0%) |
| 45 to 54 Years | 90 (85.7%) | 0 (0.0%) |
| 55 to 59 Years | 32 (100.0%) | 0 (0.0%) |
| 60 to 64 Years | 0 (0.0%) | 0 (0.0%) |
| 65 to 74 Years | 21 (10.3%) | 0 (0.0%) |
| 75 Years and over | 30 (6.6%) | 14 (46.7%) |
| Total | 221 (24.5%) | 14 (6.3%) |
Employment Status by Educational Attainment in Glenvar
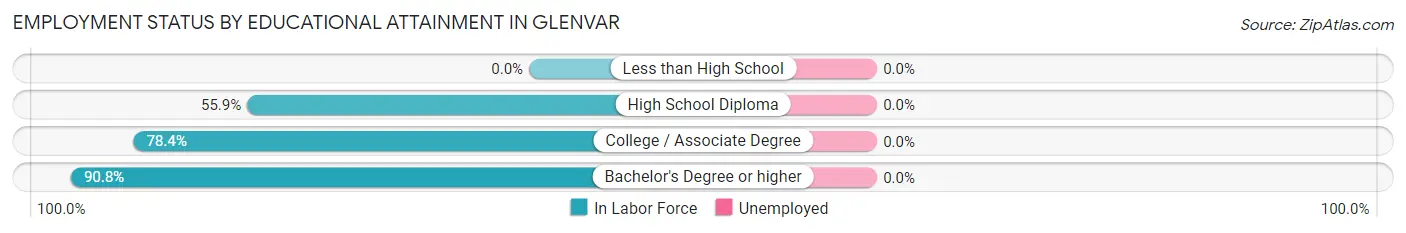
| Educational Attainment | In Labor Force | Unemployed |
| Less than High School | 0 (0.0%) | 0 (0.0%) |
| High School Diploma | 52 (55.9%) | 0 (0.0%) |
| College / Associate Degree | 29 (78.4%) | 0 (0.0%) |
| Bachelor's Degree or higher | 89 (90.8%) | 0 (0.0%) |
| Total | 170 (74.6%) | 0 (0.0%) |
Employment Occupations by Sex in Glenvar
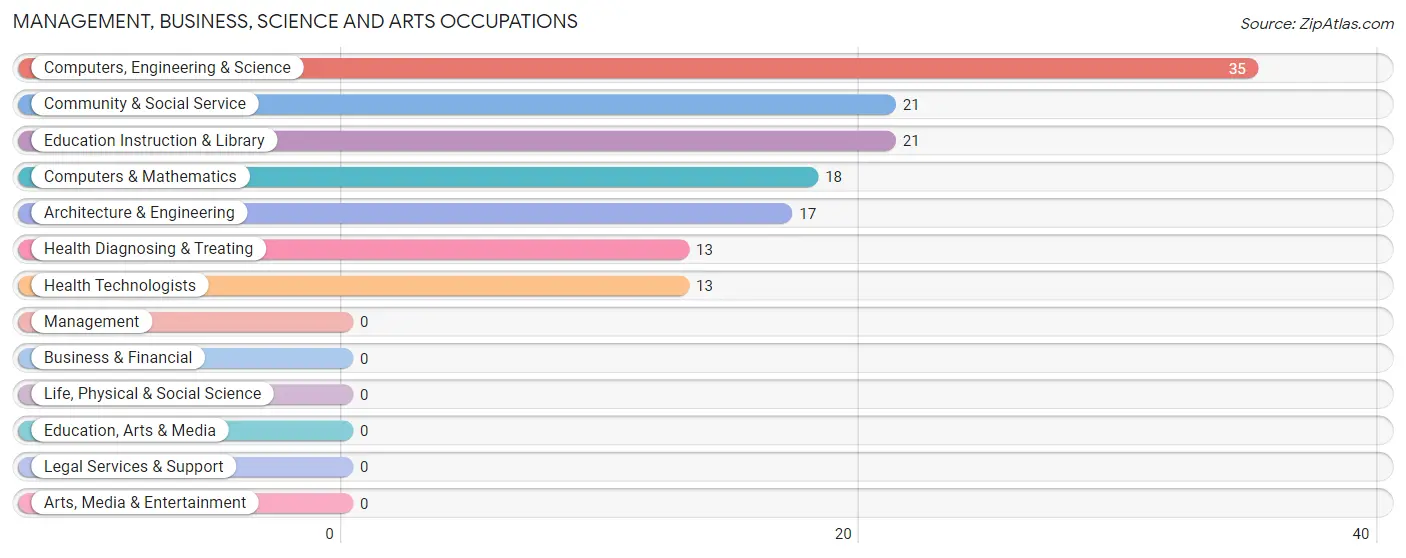
Management, Business, Science and Arts Occupations
The most common Management, Business, Science and Arts occupations in Glenvar are Computers, Engineering & Science (35 | 16.9%), Community & Social Service (21 | 10.1%), Education Instruction & Library (21 | 10.1%), Computers & Mathematics (18 | 8.7%), and Architecture & Engineering (17 | 8.2%).
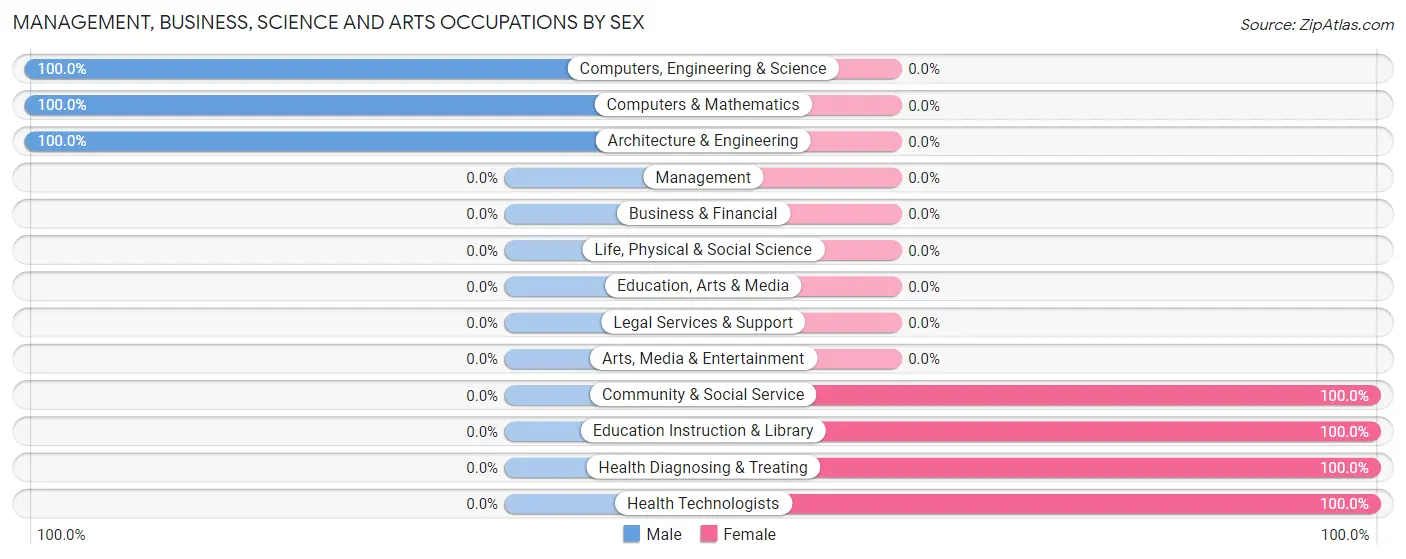
Management, Business, Science and Arts Occupations by Sex
Within the Management, Business, Science and Arts occupations in Glenvar, the most male-oriented occupations are Computers, Engineering & Science (100.0%), Computers & Mathematics (100.0%), and Architecture & Engineering (100.0%), while the most female-oriented occupations are Community & Social Service (100.0%), Education Instruction & Library (100.0%), and Health Diagnosing & Treating (100.0%).
| Occupation | Male | Female |
| Management | 0 (0.0%) | 0 (0.0%) |
| Business & Financial | 0 (0.0%) | 0 (0.0%) |
| Computers, Engineering & Science | 35 (100.0%) | 0 (0.0%) |
| Computers & Mathematics | 18 (100.0%) | 0 (0.0%) |
| Architecture & Engineering | 17 (100.0%) | 0 (0.0%) |
| Life, Physical & Social Science | 0 (0.0%) | 0 (0.0%) |
| Community & Social Service | 0 (0.0%) | 21 (100.0%) |
| Education, Arts & Media | 0 (0.0%) | 0 (0.0%) |
| Legal Services & Support | 0 (0.0%) | 0 (0.0%) |
| Education Instruction & Library | 0 (0.0%) | 21 (100.0%) |
| Arts, Media & Entertainment | 0 (0.0%) | 0 (0.0%) |
| Health Diagnosing & Treating | 0 (0.0%) | 13 (100.0%) |
| Health Technologists | 0 (0.0%) | 13 (100.0%) |
| Total (Category) | 35 (50.7%) | 34 (49.3%) |
| Total (Overall) | 115 (55.6%) | 92 (44.4%) |
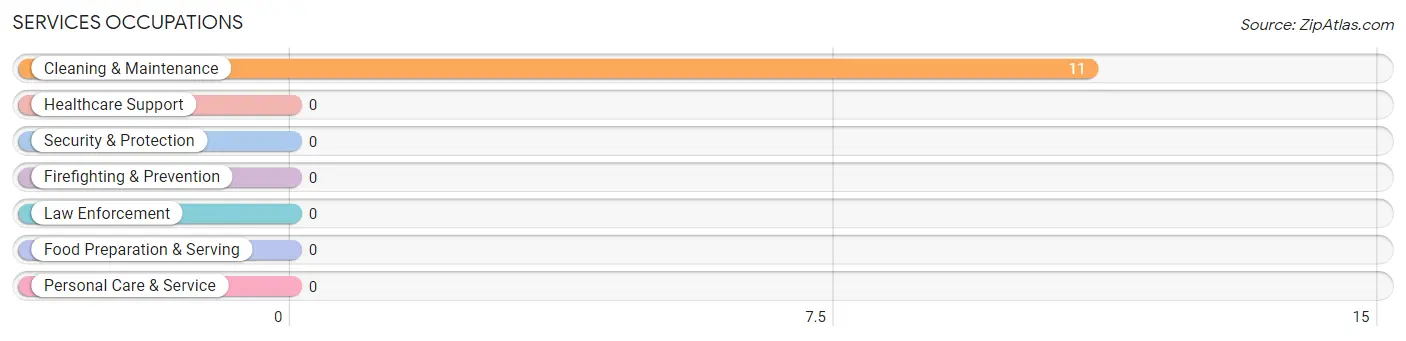
Services Occupations
The most common Services occupations in Glenvar are , and Cleaning & Maintenance (11 | 5.3%).
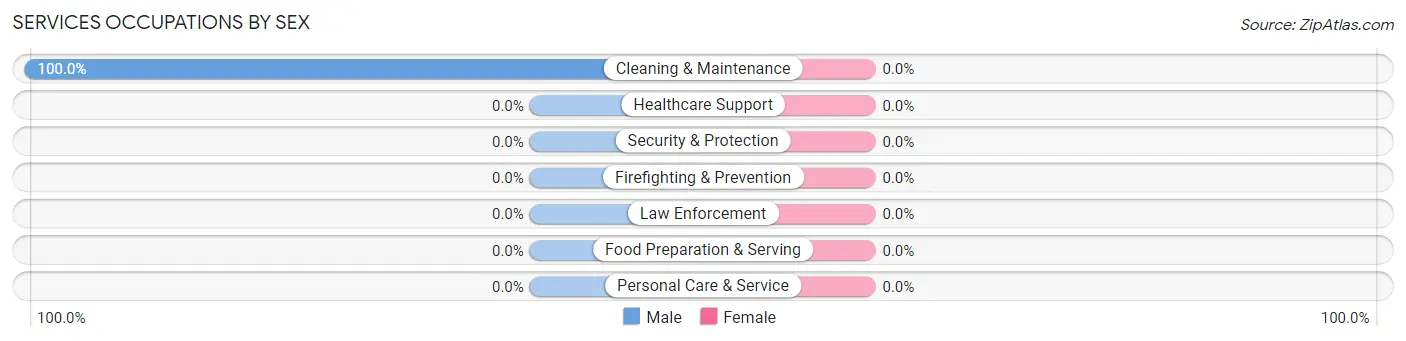
Services Occupations by Sex
| Occupation | Male | Female |
| Healthcare Support | 0 (0.0%) | 0 (0.0%) |
| Security & Protection | 0 (0.0%) | 0 (0.0%) |
| Firefighting & Prevention | 0 (0.0%) | 0 (0.0%) |
| Law Enforcement | 0 (0.0%) | 0 (0.0%) |
| Food Preparation & Serving | 0 (0.0%) | 0 (0.0%) |
| Cleaning & Maintenance | 11 (100.0%) | 0 (0.0%) |
| Personal Care & Service | 0 (0.0%) | 0 (0.0%) |
| Total (Category) | 11 (100.0%) | 0 (0.0%) |
| Total (Overall) | 115 (55.6%) | 92 (44.4%) |
Sales and Office Occupations
The most common Sales and Office occupations in Glenvar are , and Sales & Related (127 | 61.4%).
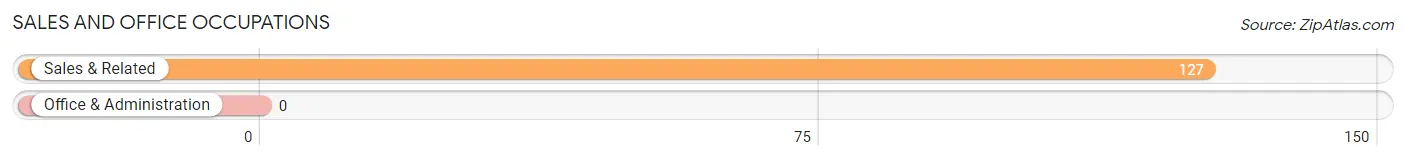
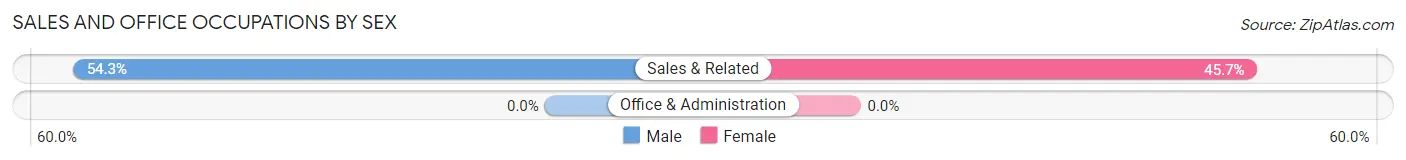
Sales and Office Occupations by Sex
| Occupation | Male | Female |
| Sales & Related | 69 (54.3%) | 58 (45.7%) |
| Office & Administration | 0 (0.0%) | 0 (0.0%) |
| Total (Category) | 69 (54.3%) | 58 (45.7%) |
| Total (Overall) | 115 (55.6%) | 92 (44.4%) |
Natural Resources, Construction and Maintenance Occupations
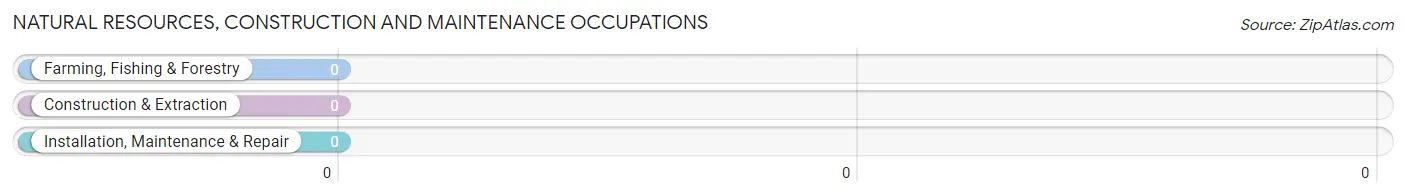
Natural Resources, Construction and Maintenance Occupations by Sex
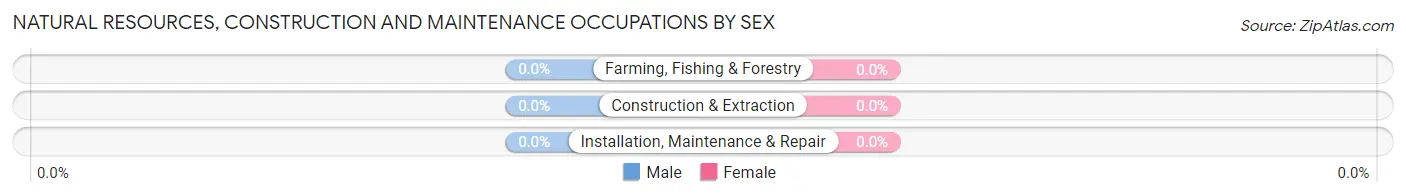
| Occupation | Male | Female |
| Farming, Fishing & Forestry | 0 (0.0%) | 0 (0.0%) |
| Construction & Extraction | 0 (0.0%) | 0 (0.0%) |
| Installation, Maintenance & Repair | 0 (0.0%) | 0 (0.0%) |
| Total (Category) | 0 (0.0%) | 0 (0.0%) |
| Total (Overall) | 115 (55.6%) | 92 (44.4%) |
Production, Transportation and Moving Occupations
Production, Transportation and Moving Occupations by Sex
| Occupation | Male | Female |
| Production | 0 (0.0%) | 0 (0.0%) |
| Transportation | 0 (0.0%) | 0 (0.0%) |
| Material Moving | 0 (0.0%) | 0 (0.0%) |
| Total (Category) | 0 (0.0%) | 0 (0.0%) |
| Total (Overall) | 115 (55.6%) | 92 (44.4%) |
Employment Industries by Sex in Glenvar
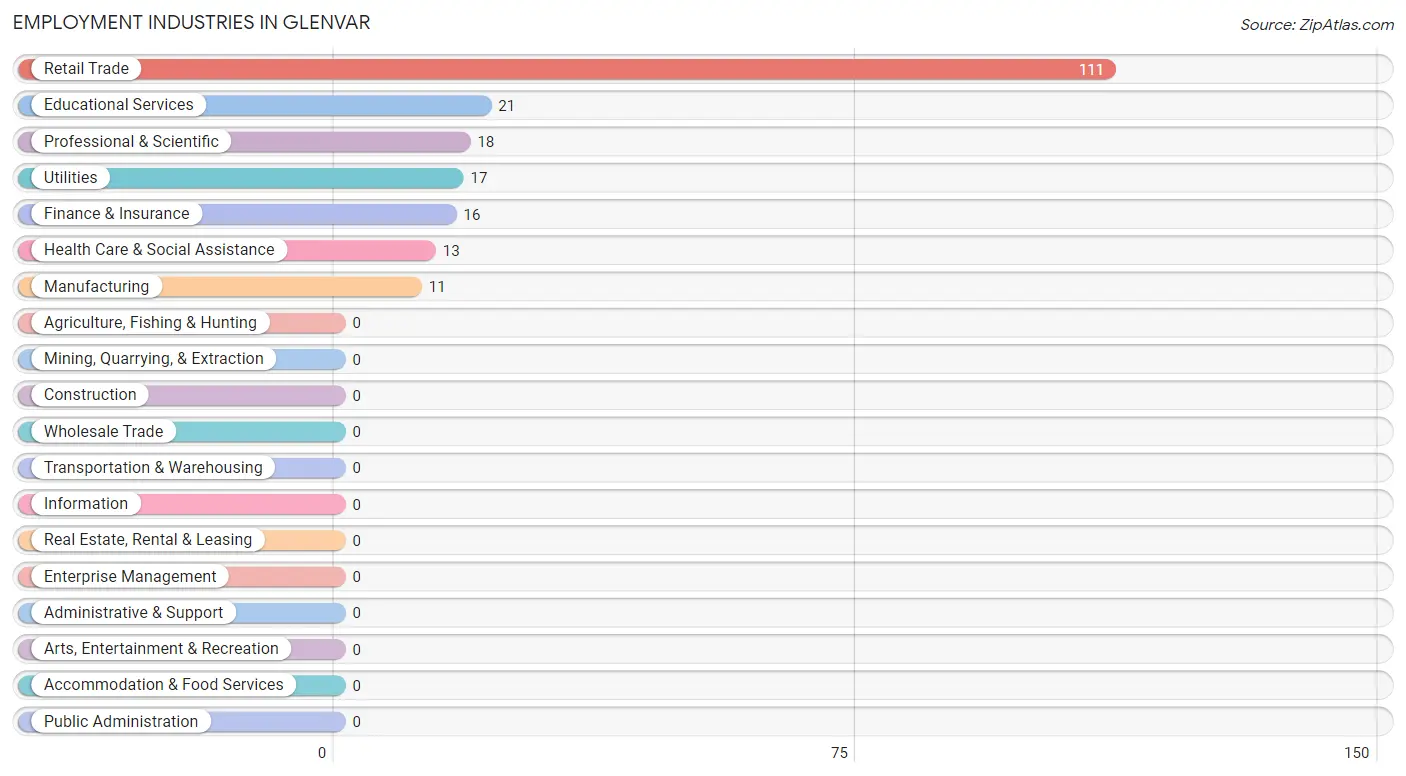
Employment Industries in Glenvar
The major employment industries in Glenvar include Retail Trade (111 | 53.6%), Educational Services (21 | 10.1%), Professional & Scientific (18 | 8.7%), Utilities (17 | 8.2%), and Finance & Insurance (16 | 7.7%).
Employment Industries by Sex in Glenvar
The Glenvar industries that see more men than women are Manufacturing (100.0%), Utilities (100.0%), and Professional & Scientific (100.0%), whereas the industries that tend to have a higher number of women are Finance & Insurance (100.0%), Educational Services (100.0%), and Health Care & Social Assistance (100.0%).
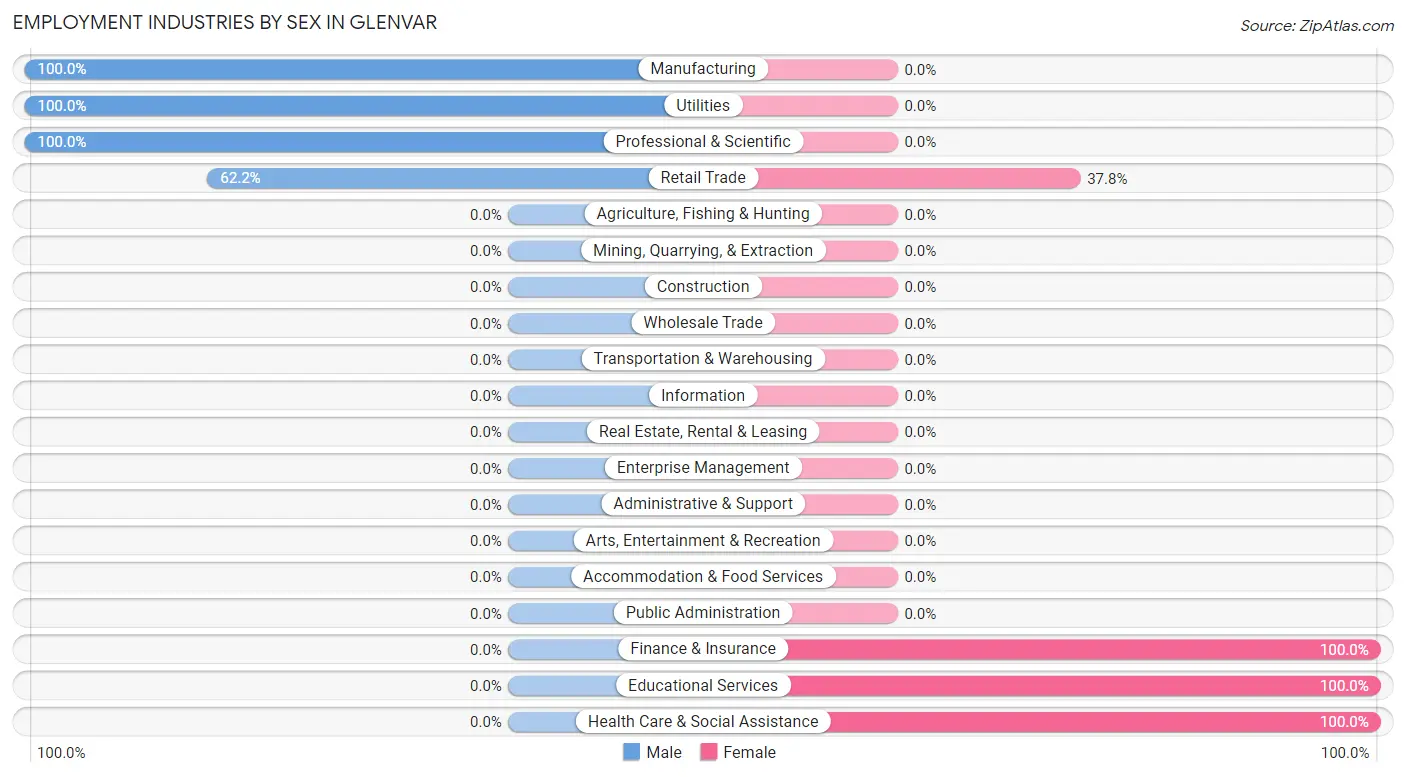
| Industry | Male | Female |
| Agriculture, Fishing & Hunting | 0 (0.0%) | 0 (0.0%) |
| Mining, Quarrying, & Extraction | 0 (0.0%) | 0 (0.0%) |
| Construction | 0 (0.0%) | 0 (0.0%) |
| Manufacturing | 11 (100.0%) | 0 (0.0%) |
| Wholesale Trade | 0 (0.0%) | 0 (0.0%) |
| Retail Trade | 69 (62.2%) | 42 (37.8%) |
| Transportation & Warehousing | 0 (0.0%) | 0 (0.0%) |
| Utilities | 17 (100.0%) | 0 (0.0%) |
| Information | 0 (0.0%) | 0 (0.0%) |
| Finance & Insurance | 0 (0.0%) | 16 (100.0%) |
| Real Estate, Rental & Leasing | 0 (0.0%) | 0 (0.0%) |
| Professional & Scientific | 18 (100.0%) | 0 (0.0%) |
| Enterprise Management | 0 (0.0%) | 0 (0.0%) |
| Administrative & Support | 0 (0.0%) | 0 (0.0%) |
| Educational Services | 0 (0.0%) | 21 (100.0%) |
| Health Care & Social Assistance | 0 (0.0%) | 13 (100.0%) |
| Arts, Entertainment & Recreation | 0 (0.0%) | 0 (0.0%) |
| Accommodation & Food Services | 0 (0.0%) | 0 (0.0%) |
| Public Administration | 0 (0.0%) | 0 (0.0%) |
| Total | 115 (55.6%) | 92 (44.4%) |
Education in Glenvar
School Enrollment in Glenvar
The most common levels of schooling among the 134 students in Glenvar are high school (86 | 64.2%), and graduate / professional (48 | 35.8%).
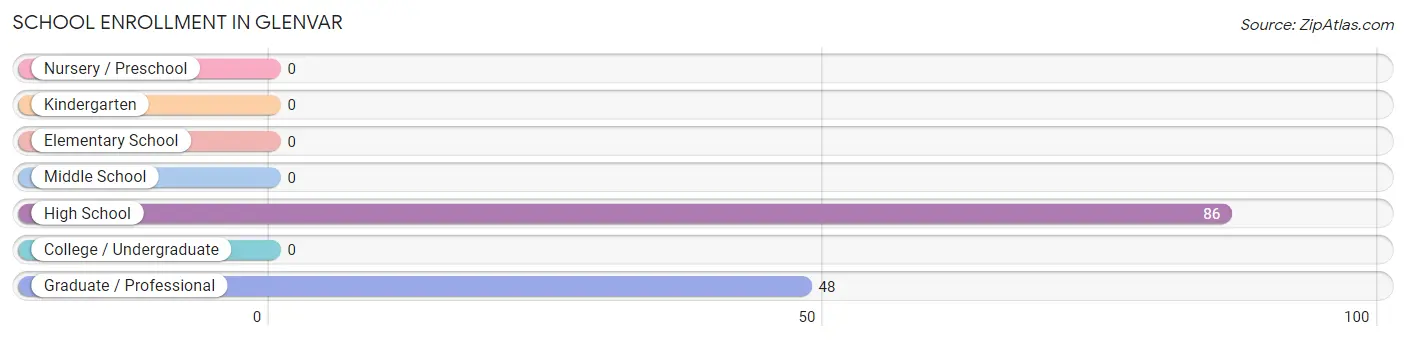
| School Level | # Students | % Students |
| Nursery / Preschool | 0 | 0.0% |
| Kindergarten | 0 | 0.0% |
| Elementary School | 0 | 0.0% |
| Middle School | 0 | 0.0% |
| High School | 86 | 64.2% |
| College / Undergraduate | 0 | 0.0% |
| Graduate / Professional | 48 | 35.8% |
| Total | 134 | 100.0% |
School Enrollment by Age by Funding Source in Glenvar
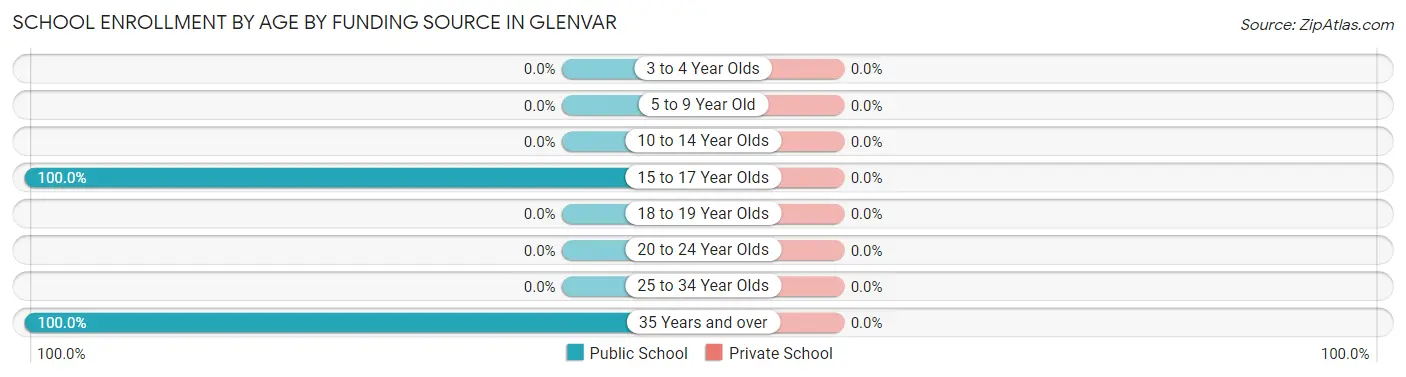
| Age Bracket | Public School | Private School |
| 3 to 4 Year Olds | 0 (0.0%) | 0 (0.0%) |
| 5 to 9 Year Old | 0 (0.0%) | 0 (0.0%) |
| 10 to 14 Year Olds | 0 (0.0%) | 0 (0.0%) |
| 15 to 17 Year Olds | 44 (100.0%) | 0 (0.0%) |
| 18 to 19 Year Olds | 0 (0.0%) | 0 (0.0%) |
| 20 to 24 Year Olds | 0 (0.0%) | 0 (0.0%) |
| 25 to 34 Year Olds | 0 (0.0%) | 0 (0.0%) |
| 35 Years and over | 90 (100.0%) | 0 (0.0%) |
| Total | 134 (100.0%) | 0 (0.0%) |
Educational Attainment by Field of Study in Glenvar
Computers & mathematics (48 | 35.0%), education (28 | 20.4%), engineering (26 | 19.0%), social sciences (14 | 10.2%), and science & technology (13 | 9.5%) are the most common fields of study among 137 individuals in Glenvar who have obtained a bachelor's degree or higher.
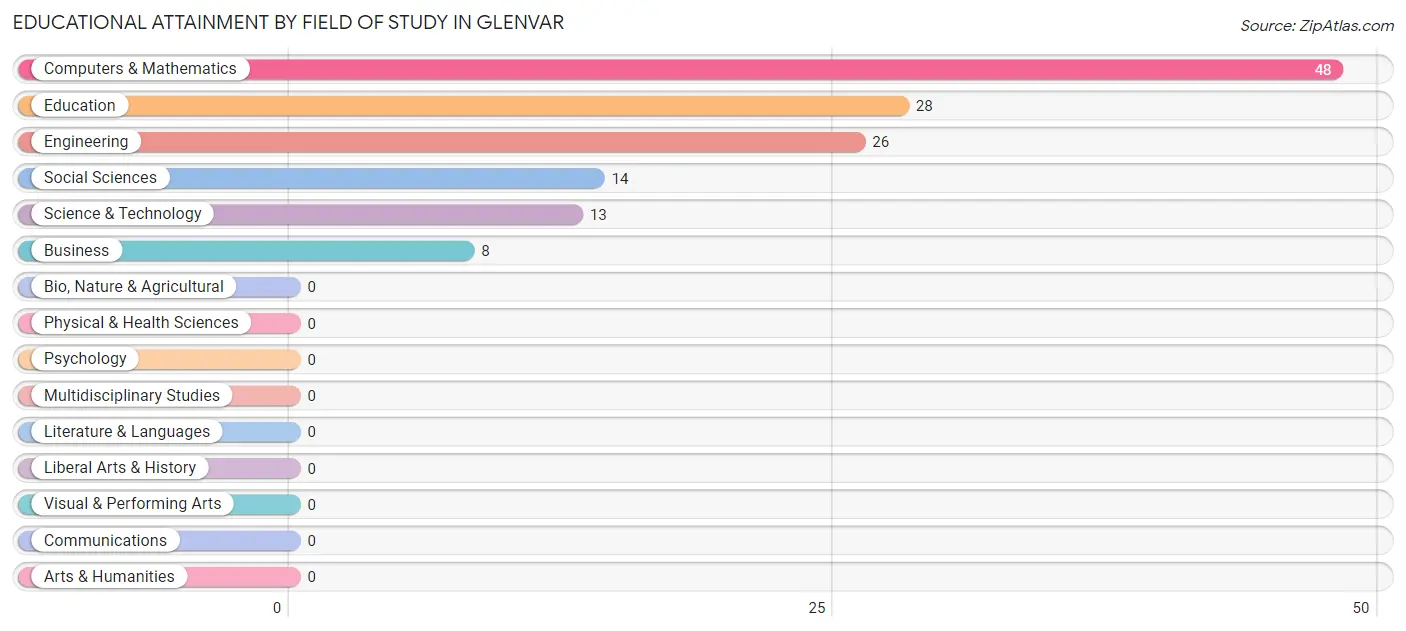
| Field of Study | # Graduates | % Graduates |
| Computers & Mathematics | 48 | 35.0% |
| Bio, Nature & Agricultural | 0 | 0.0% |
| Physical & Health Sciences | 0 | 0.0% |
| Psychology | 0 | 0.0% |
| Social Sciences | 14 | 10.2% |
| Engineering | 26 | 19.0% |
| Multidisciplinary Studies | 0 | 0.0% |
| Science & Technology | 13 | 9.5% |
| Business | 8 | 5.8% |
| Education | 28 | 20.4% |
| Literature & Languages | 0 | 0.0% |
| Liberal Arts & History | 0 | 0.0% |
| Visual & Performing Arts | 0 | 0.0% |
| Communications | 0 | 0.0% |
| Arts & Humanities | 0 | 0.0% |
| Total | 137 | 100.0% |
Transportation & Commute in Glenvar
Vehicle Availability by Sex in Glenvar
The most prevalent vehicle ownership categories in Glenvar are males with 2 vehicles (76, accounting for 66.1%) and females with 2 vehicles (76, making up 100.0%).
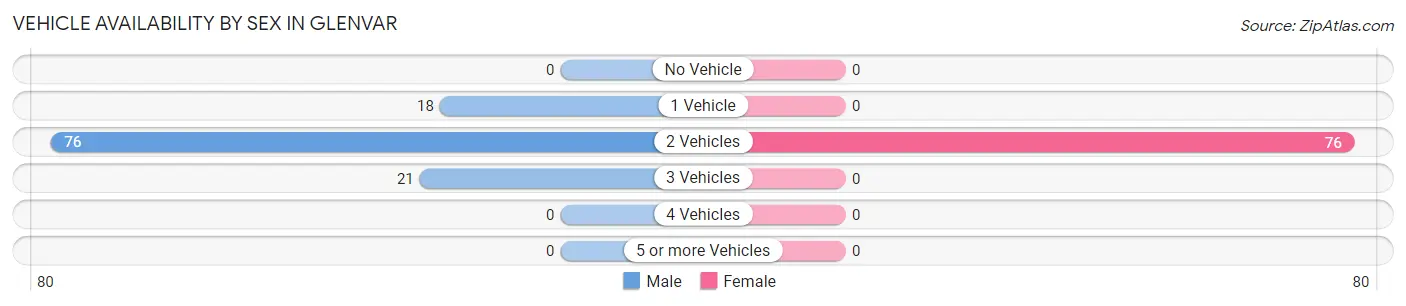
| Vehicles Available | Male | Female |
| No Vehicle | 0 (0.0%) | 0 (0.0%) |
| 1 Vehicle | 18 (15.7%) | 0 (0.0%) |
| 2 Vehicles | 76 (66.1%) | 76 (100.0%) |
| 3 Vehicles | 21 (18.3%) | 0 (0.0%) |
| 4 Vehicles | 0 (0.0%) | 0 (0.0%) |
| 5 or more Vehicles | 0 (0.0%) | 0 (0.0%) |
| Total | 115 (100.0%) | 76 (100.0%) |
Commute Time in Glenvar
The most frequently occuring commute durations in Glenvar are 20 to 24 minutes (76 commuters, 46.9%), 15 to 19 minutes (69 commuters, 42.6%), and 10 to 14 minutes (17 commuters, 10.5%).
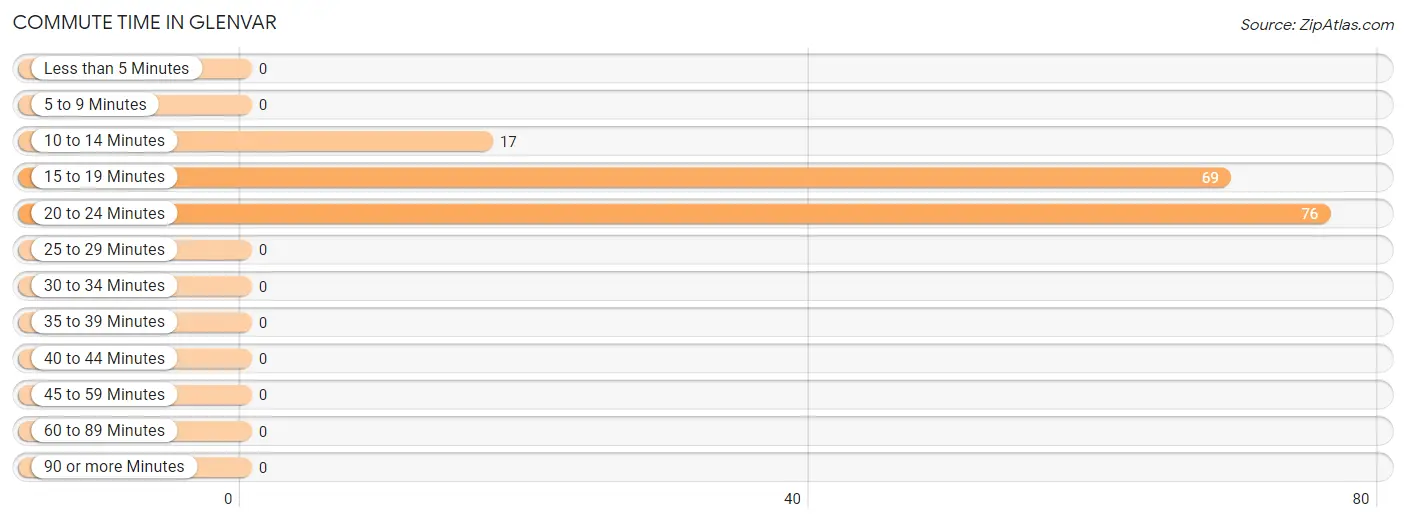
| Commute Time | # Commuters | % Commuters |
| Less than 5 Minutes | 0 | 0.0% |
| 5 to 9 Minutes | 0 | 0.0% |
| 10 to 14 Minutes | 17 | 10.5% |
| 15 to 19 Minutes | 69 | 42.6% |
| 20 to 24 Minutes | 76 | 46.9% |
| 25 to 29 Minutes | 0 | 0.0% |
| 30 to 34 Minutes | 0 | 0.0% |
| 35 to 39 Minutes | 0 | 0.0% |
| 40 to 44 Minutes | 0 | 0.0% |
| 45 to 59 Minutes | 0 | 0.0% |
| 60 to 89 Minutes | 0 | 0.0% |
| 90 or more Minutes | 0 | 0.0% |
Commute Time by Sex in Glenvar
The most common commute times in Glenvar are 15 to 19 minutes (59 commuters, 60.8%) for males and 20 to 24 minutes (55 commuters, 84.6%) for females.
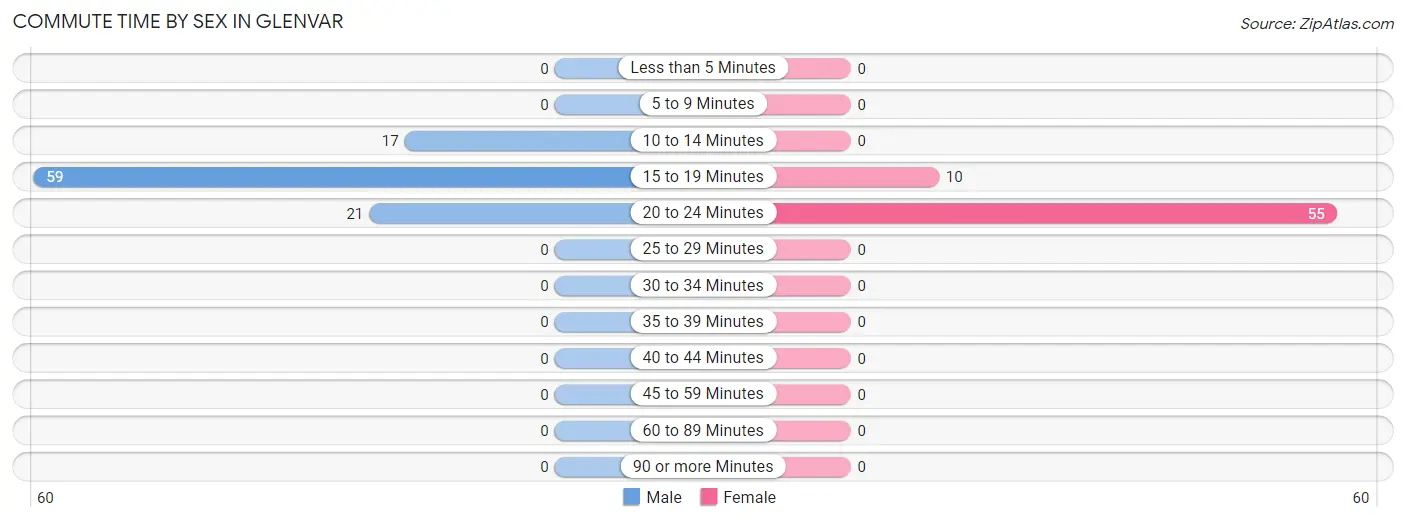
| Commute Time | Male | Female |
| Less than 5 Minutes | 0 (0.0%) | 0 (0.0%) |
| 5 to 9 Minutes | 0 (0.0%) | 0 (0.0%) |
| 10 to 14 Minutes | 17 (17.5%) | 0 (0.0%) |
| 15 to 19 Minutes | 59 (60.8%) | 10 (15.4%) |
| 20 to 24 Minutes | 21 (21.6%) | 55 (84.6%) |
| 25 to 29 Minutes | 0 (0.0%) | 0 (0.0%) |
| 30 to 34 Minutes | 0 (0.0%) | 0 (0.0%) |
| 35 to 39 Minutes | 0 (0.0%) | 0 (0.0%) |
| 40 to 44 Minutes | 0 (0.0%) | 0 (0.0%) |
| 45 to 59 Minutes | 0 (0.0%) | 0 (0.0%) |
| 60 to 89 Minutes | 0 (0.0%) | 0 (0.0%) |
| 90 or more Minutes | 0 (0.0%) | 0 (0.0%) |
Time of Departure to Work by Sex in Glenvar
The most frequent times of departure to work in Glenvar are 6:30 AM to 6:59 AM (65, 67.0%) for males and 8:00 AM to 8:29 AM (42, 64.6%) for females.
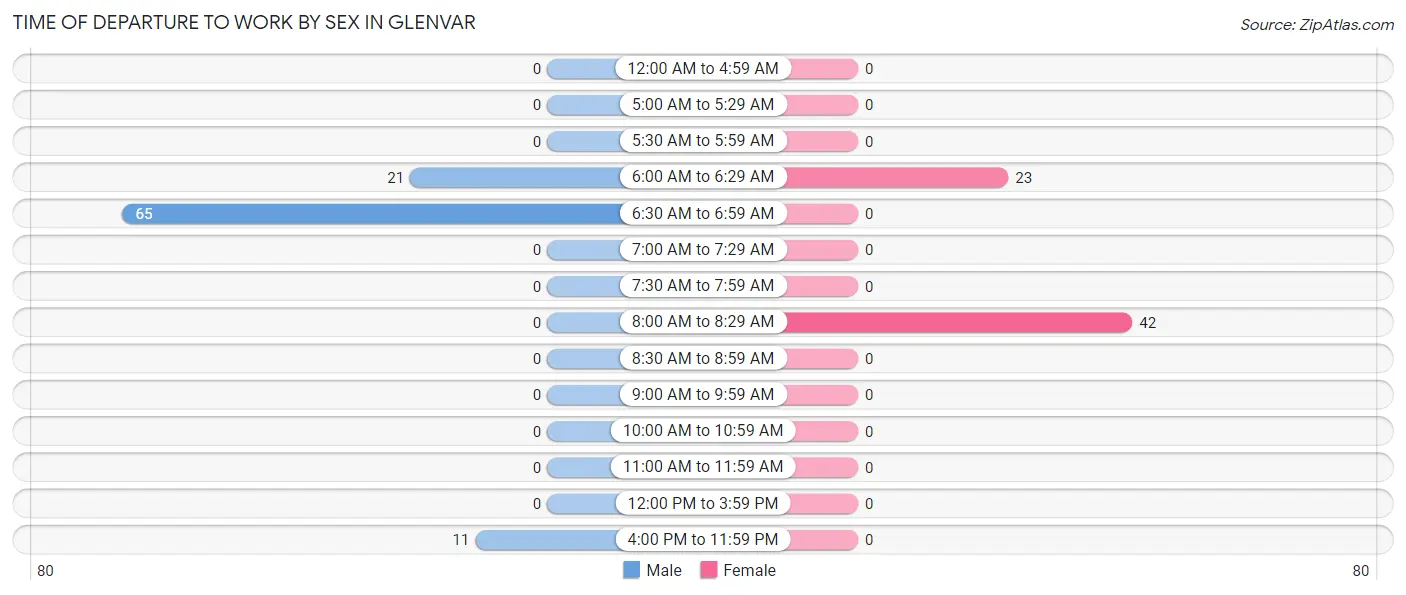
| Time of Departure | Male | Female |
| 12:00 AM to 4:59 AM | 0 (0.0%) | 0 (0.0%) |
| 5:00 AM to 5:29 AM | 0 (0.0%) | 0 (0.0%) |
| 5:30 AM to 5:59 AM | 0 (0.0%) | 0 (0.0%) |
| 6:00 AM to 6:29 AM | 21 (21.6%) | 23 (35.4%) |
| 6:30 AM to 6:59 AM | 65 (67.0%) | 0 (0.0%) |
| 7:00 AM to 7:29 AM | 0 (0.0%) | 0 (0.0%) |
| 7:30 AM to 7:59 AM | 0 (0.0%) | 0 (0.0%) |
| 8:00 AM to 8:29 AM | 0 (0.0%) | 42 (64.6%) |
| 8:30 AM to 8:59 AM | 0 (0.0%) | 0 (0.0%) |
| 9:00 AM to 9:59 AM | 0 (0.0%) | 0 (0.0%) |
| 10:00 AM to 10:59 AM | 0 (0.0%) | 0 (0.0%) |
| 11:00 AM to 11:59 AM | 0 (0.0%) | 0 (0.0%) |
| 12:00 PM to 3:59 PM | 0 (0.0%) | 0 (0.0%) |
| 4:00 PM to 11:59 PM | 11 (11.3%) | 0 (0.0%) |
| Total | 97 (100.0%) | 65 (100.0%) |
Housing Occupancy in Glenvar
Occupancy by Ownership in Glenvar
Of the total 487 dwellings in Glenvar, owner-occupied units account for 212 (43.5%), while renter-occupied units make up 275 (56.5%).
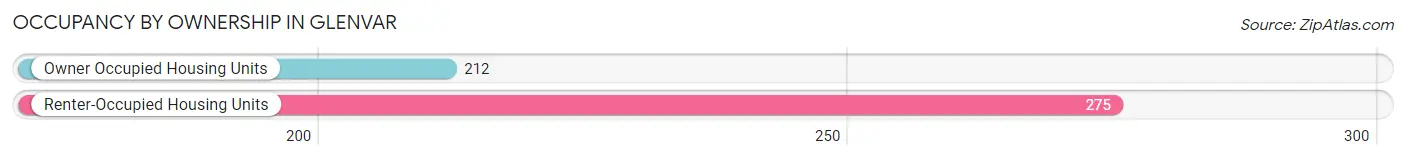
| Occupancy | # Housing Units | % Housing Units |
| Owner Occupied Housing Units | 212 | 43.5% |
| Renter-Occupied Housing Units | 275 | 56.5% |
| Total Occupied Housing Units | 487 | 100.0% |
Occupancy by Household Size in Glenvar
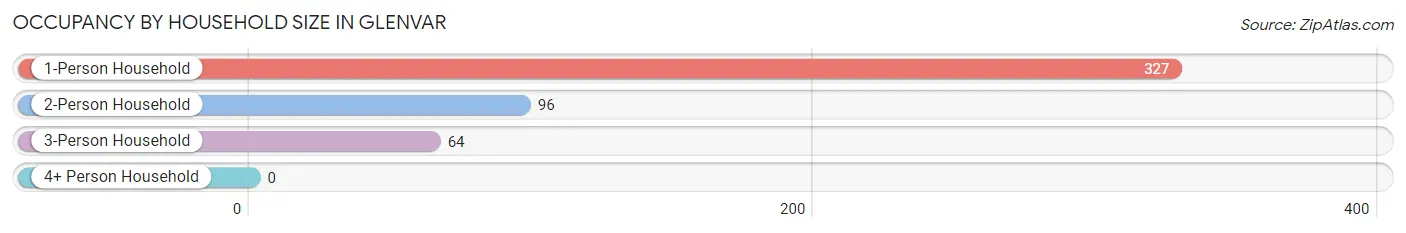
| Household Size | # Housing Units | % Housing Units |
| 1-Person Household | 327 | 67.1% |
| 2-Person Household | 96 | 19.7% |
| 3-Person Household | 64 | 13.1% |
| 4+ Person Household | 0 | 0.0% |
| Total Housing Units | 487 | 100.0% |
Occupancy by Ownership by Household Size in Glenvar
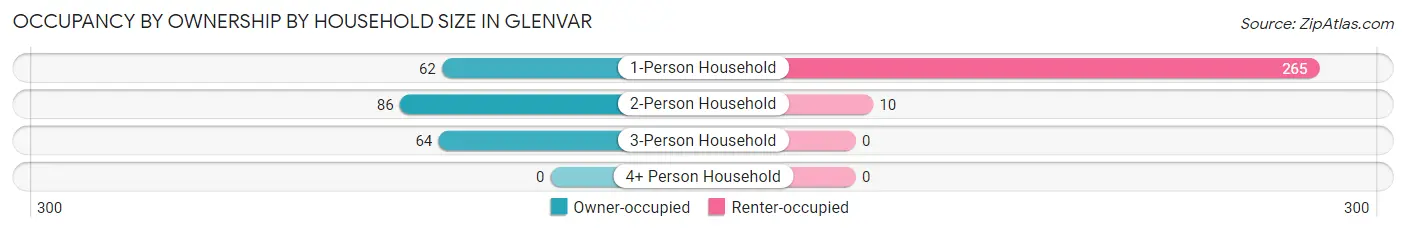
| Household Size | Owner-occupied | Renter-occupied |
| 1-Person Household | 62 (19.0%) | 265 (81.0%) |
| 2-Person Household | 86 (89.6%) | 10 (10.4%) |
| 3-Person Household | 64 (100.0%) | 0 (0.0%) |
| 4+ Person Household | 0 (0.0%) | 0 (0.0%) |
| Total Housing Units | 212 (43.5%) | 275 (56.5%) |
Occupancy by Educational Attainment in Glenvar
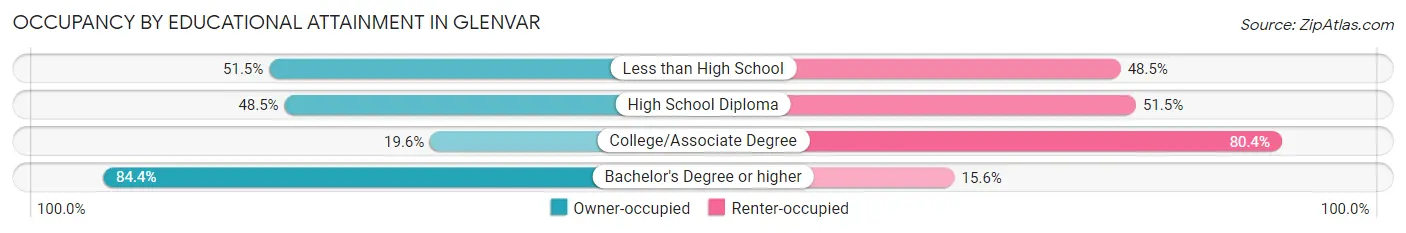
| Household Size | Owner-occupied | Renter-occupied |
| Less than High School | 17 (51.5%) | 16 (48.5%) |
| High School Diploma | 80 (48.5%) | 85 (51.5%) |
| College/Associate Degree | 39 (19.6%) | 160 (80.4%) |
| Bachelor's Degree or higher | 76 (84.4%) | 14 (15.6%) |
Occupancy by Age of Householder in Glenvar
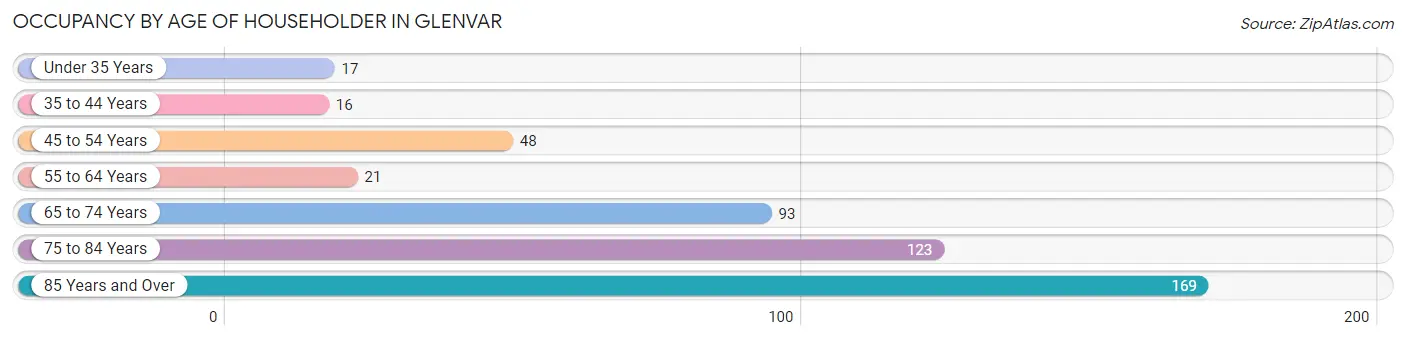
| Age Bracket | # Households | % Households |
| Under 35 Years | 17 | 3.5% |
| 35 to 44 Years | 16 | 3.3% |
| 45 to 54 Years | 48 | 9.9% |
| 55 to 64 Years | 21 | 4.3% |
| 65 to 74 Years | 93 | 19.1% |
| 75 to 84 Years | 123 | 25.3% |
| 85 Years and Over | 169 | 34.7% |
| Total | 487 | 100.0% |
Housing Finances in Glenvar
Median Income by Occupancy in Glenvar
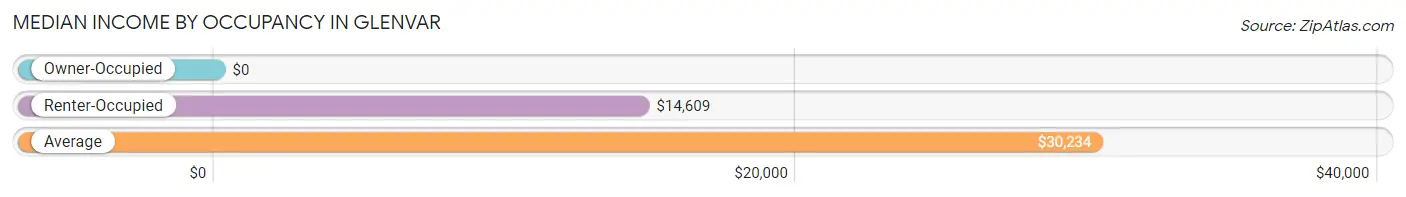
| Occupancy Type | # Households | Median Income |
| Owner-Occupied | 212 (43.5%) | $0 |
| Renter-Occupied | 275 (56.5%) | $14,609 |
| Average | 487 (100.0%) | $30,234 |
Occupancy by Householder Income Bracket in Glenvar
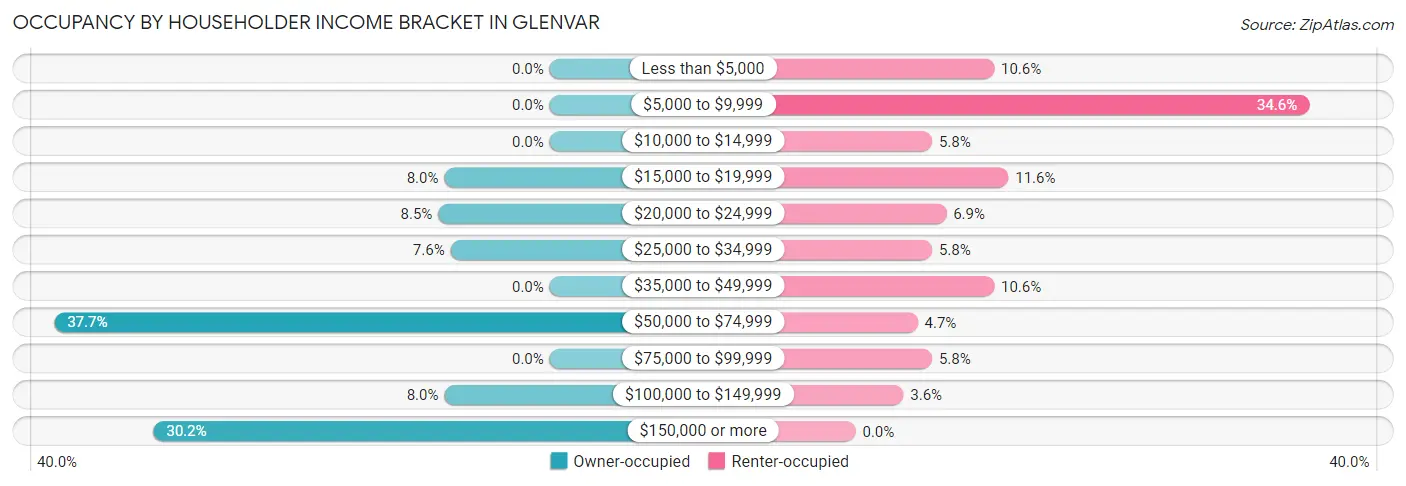
| Income Bracket | Owner-occupied | Renter-occupied |
| Less than $5,000 | 0 (0.0%) | 29 (10.5%) |
| $5,000 to $9,999 | 0 (0.0%) | 95 (34.5%) |
| $10,000 to $14,999 | 0 (0.0%) | 16 (5.8%) |
| $15,000 to $19,999 | 17 (8.0%) | 32 (11.6%) |
| $20,000 to $24,999 | 18 (8.5%) | 19 (6.9%) |
| $25,000 to $34,999 | 16 (7.5%) | 16 (5.8%) |
| $35,000 to $49,999 | 0 (0.0%) | 29 (10.5%) |
| $50,000 to $74,999 | 80 (37.7%) | 13 (4.7%) |
| $75,000 to $99,999 | 0 (0.0%) | 16 (5.8%) |
| $100,000 to $149,999 | 17 (8.0%) | 10 (3.6%) |
| $150,000 or more | 64 (30.2%) | 0 (0.0%) |
| Total | 212 (100.0%) | 275 (100.0%) |
Monthly Housing Cost Tiers in Glenvar
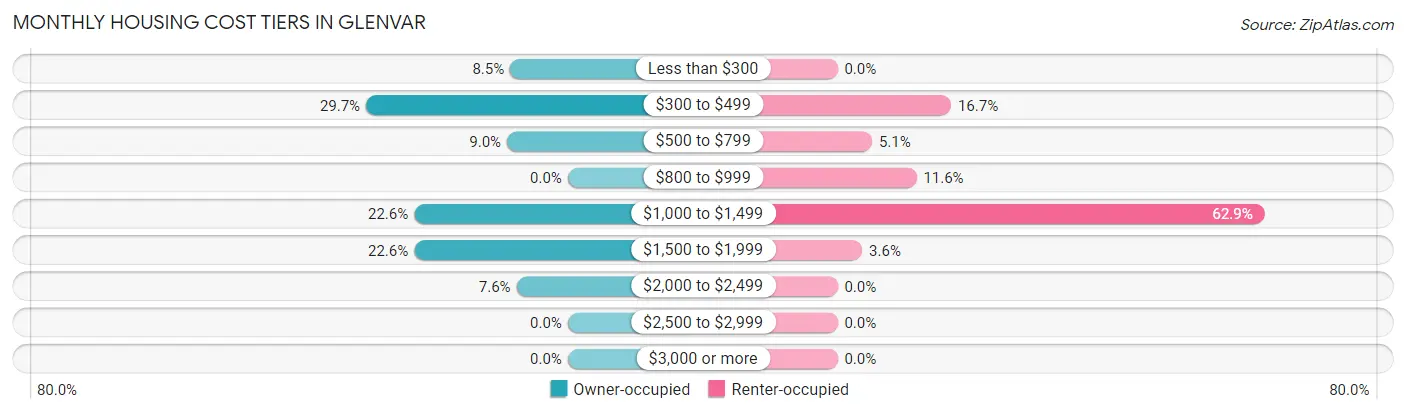
| Monthly Cost | Owner-occupied | Renter-occupied |
| Less than $300 | 18 (8.5%) | 0 (0.0%) |
| $300 to $499 | 63 (29.7%) | 46 (16.7%) |
| $500 to $799 | 19 (9.0%) | 14 (5.1%) |
| $800 to $999 | 0 (0.0%) | 32 (11.6%) |
| $1,000 to $1,499 | 48 (22.6%) | 173 (62.9%) |
| $1,500 to $1,999 | 48 (22.6%) | 10 (3.6%) |
| $2,000 to $2,499 | 16 (7.5%) | 0 (0.0%) |
| $2,500 to $2,999 | 0 (0.0%) | 0 (0.0%) |
| $3,000 or more | 0 (0.0%) | 0 (0.0%) |
| Total | 212 (100.0%) | 275 (100.0%) |
Physical Housing Characteristics in Glenvar
Housing Structures in Glenvar
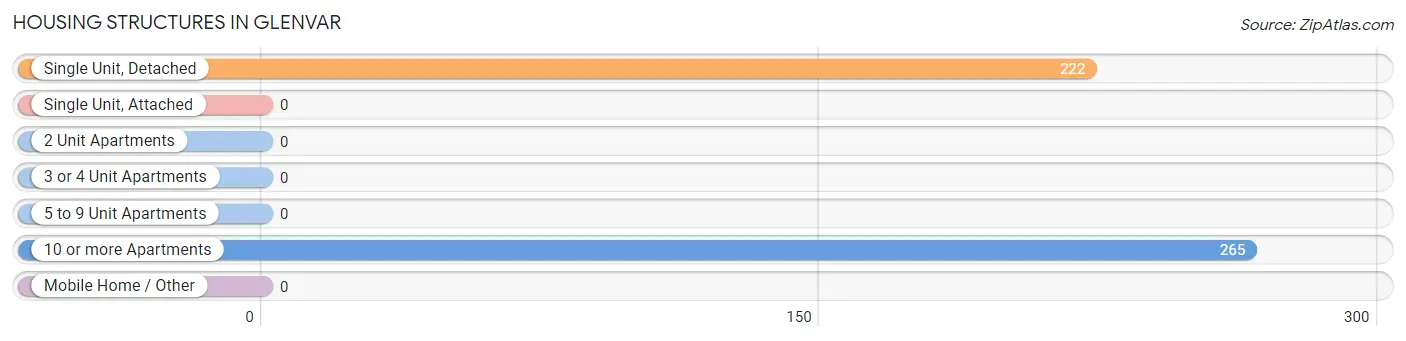
| Structure Type | # Housing Units | % Housing Units |
| Single Unit, Detached | 222 | 45.6% |
| Single Unit, Attached | 0 | 0.0% |
| 2 Unit Apartments | 0 | 0.0% |
| 3 or 4 Unit Apartments | 0 | 0.0% |
| 5 to 9 Unit Apartments | 0 | 0.0% |
| 10 or more Apartments | 265 | 54.4% |
| Mobile Home / Other | 0 | 0.0% |
| Total | 487 | 100.0% |
Housing Structures by Occupancy in Glenvar
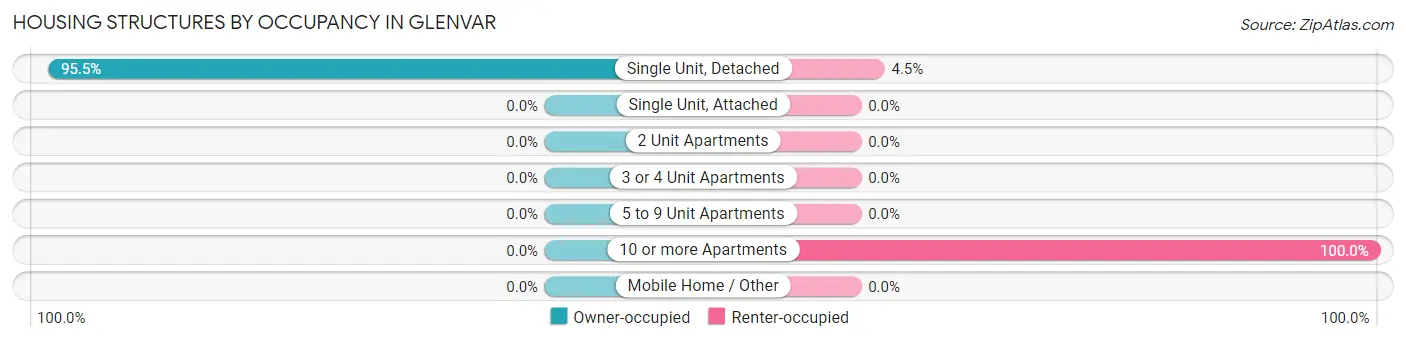
| Structure Type | Owner-occupied | Renter-occupied |
| Single Unit, Detached | 212 (95.5%) | 10 (4.5%) |
| Single Unit, Attached | 0 (0.0%) | 0 (0.0%) |
| 2 Unit Apartments | 0 (0.0%) | 0 (0.0%) |
| 3 or 4 Unit Apartments | 0 (0.0%) | 0 (0.0%) |
| 5 to 9 Unit Apartments | 0 (0.0%) | 0 (0.0%) |
| 10 or more Apartments | 0 (0.0%) | 265 (100.0%) |
| Mobile Home / Other | 0 (0.0%) | 0 (0.0%) |
| Total | 212 (43.5%) | 275 (56.5%) |
Housing Structures by Number of Rooms in Glenvar
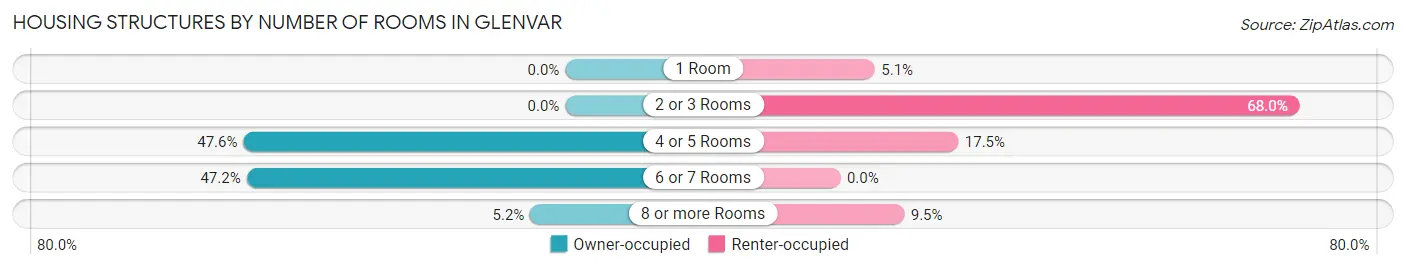
| Number of Rooms | Owner-occupied | Renter-occupied |
| 1 Room | 0 (0.0%) | 14 (5.1%) |
| 2 or 3 Rooms | 0 (0.0%) | 187 (68.0%) |
| 4 or 5 Rooms | 101 (47.6%) | 48 (17.4%) |
| 6 or 7 Rooms | 100 (47.2%) | 0 (0.0%) |
| 8 or more Rooms | 11 (5.2%) | 26 (9.5%) |
| Total | 212 (100.0%) | 275 (100.0%) |
Housing Structure by Heating Type in Glenvar
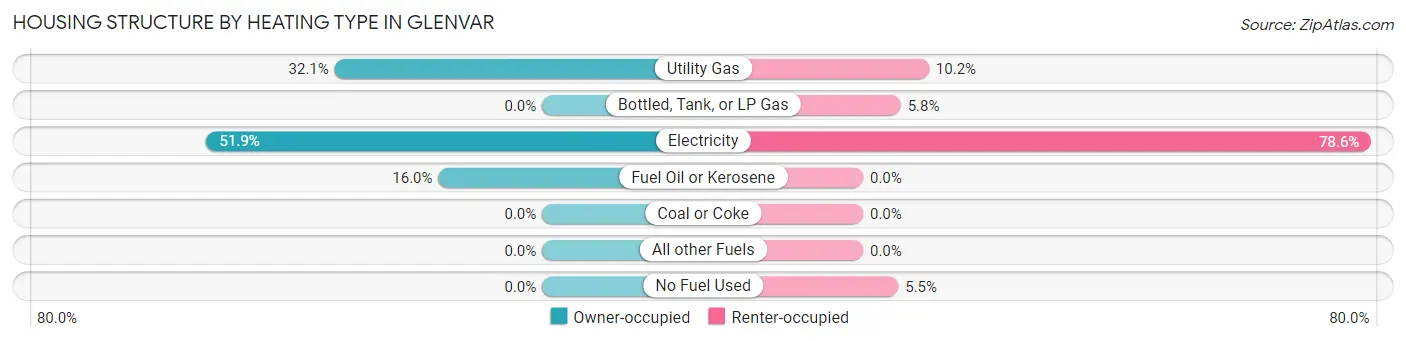
| Heating Type | Owner-occupied | Renter-occupied |
| Utility Gas | 68 (32.1%) | 28 (10.2%) |
| Bottled, Tank, or LP Gas | 0 (0.0%) | 16 (5.8%) |
| Electricity | 110 (51.9%) | 216 (78.5%) |
| Fuel Oil or Kerosene | 34 (16.0%) | 0 (0.0%) |
| Coal or Coke | 0 (0.0%) | 0 (0.0%) |
| All other Fuels | 0 (0.0%) | 0 (0.0%) |
| No Fuel Used | 0 (0.0%) | 15 (5.4%) |
| Total | 212 (100.0%) | 275 (100.0%) |
Household Vehicle Usage in Glenvar
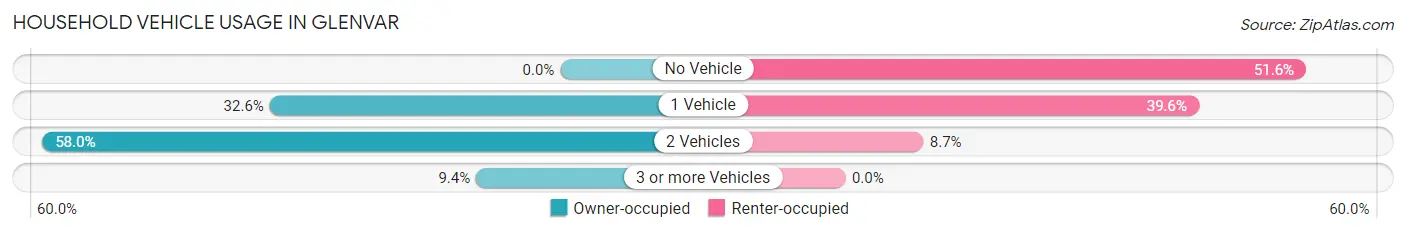
| Vehicles per Household | Owner-occupied | Renter-occupied |
| No Vehicle | 0 (0.0%) | 142 (51.6%) |
| 1 Vehicle | 69 (32.6%) | 109 (39.6%) |
| 2 Vehicles | 123 (58.0%) | 24 (8.7%) |
| 3 or more Vehicles | 20 (9.4%) | 0 (0.0%) |
| Total | 212 (100.0%) | 275 (100.0%) |
Real Estate & Mortgages in Glenvar
Real Estate and Mortgage Overview in Glenvar
| Characteristic | Without Mortgage | With Mortgage |
| Housing Units | 100 | 112 |
| Median Property Value | $248,500 | $237,100 |
| Median Household Income | - | - |
| Monthly Housing Costs | $406 | $0 |
| Real Estate Taxes | $1,563 | $0 |
Property Value by Mortgage Status in Glenvar
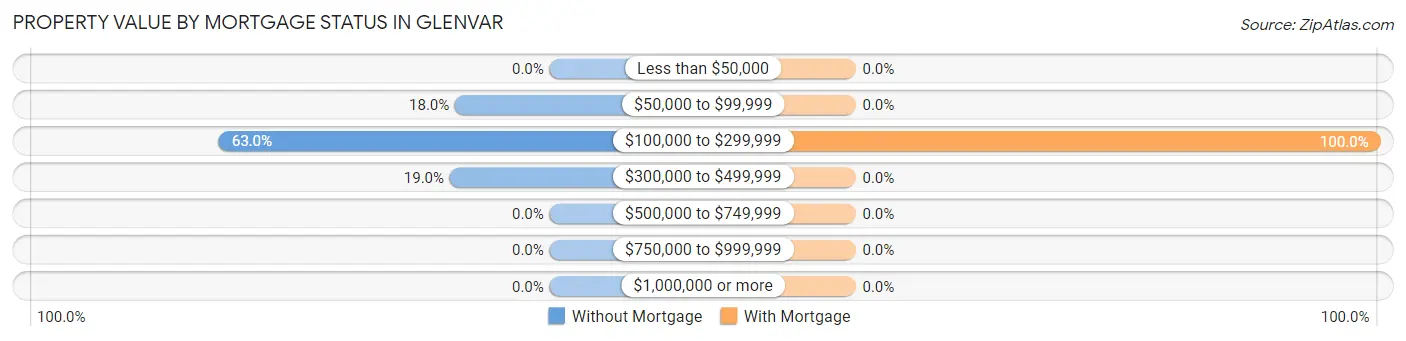
| Property Value | Without Mortgage | With Mortgage |
| Less than $50,000 | 0 (0.0%) | 0 (0.0%) |
| $50,000 to $99,999 | 18 (18.0%) | 0 (0.0%) |
| $100,000 to $299,999 | 63 (63.0%) | 112 (100.0%) |
| $300,000 to $499,999 | 19 (19.0%) | 0 (0.0%) |
| $500,000 to $749,999 | 0 (0.0%) | 0 (0.0%) |
| $750,000 to $999,999 | 0 (0.0%) | 0 (0.0%) |
| $1,000,000 or more | 0 (0.0%) | 0 (0.0%) |
| Total | 100 (100.0%) | 112 (100.0%) |
Household Income by Mortgage Status in Glenvar
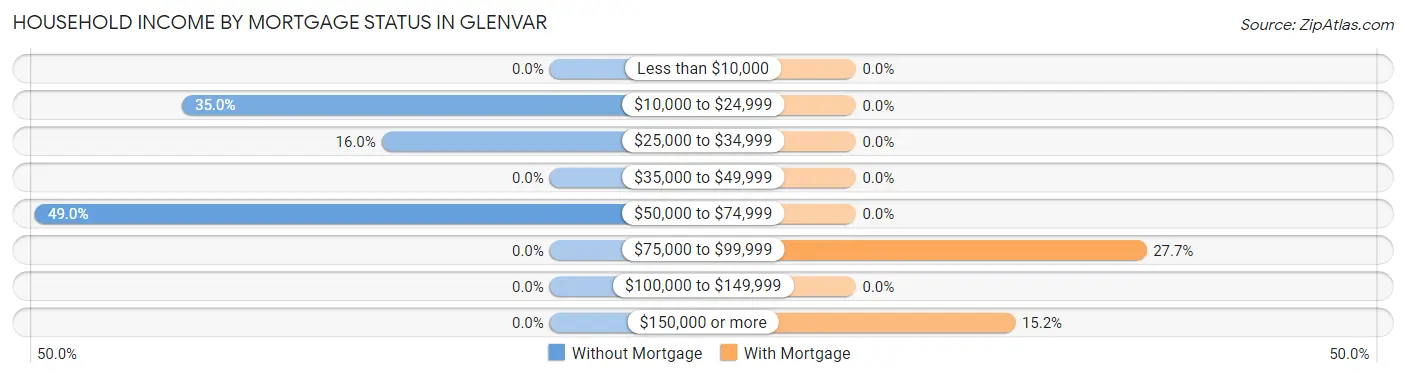
| Household Income | Without Mortgage | With Mortgage |
| Less than $10,000 | 0 (0.0%) | 0 (0.0%) |
| $10,000 to $24,999 | 35 (35.0%) | 0 (0.0%) |
| $25,000 to $34,999 | 16 (16.0%) | 0 (0.0%) |
| $35,000 to $49,999 | 0 (0.0%) | 0 (0.0%) |
| $50,000 to $74,999 | 49 (49.0%) | 0 (0.0%) |
| $75,000 to $99,999 | 0 (0.0%) | 31 (27.7%) |
| $100,000 to $149,999 | 0 (0.0%) | 0 (0.0%) |
| $150,000 or more | 0 (0.0%) | 17 (15.2%) |
| Total | 100 (100.0%) | 112 (100.0%) |
Property Value to Household Income Ratio in Glenvar
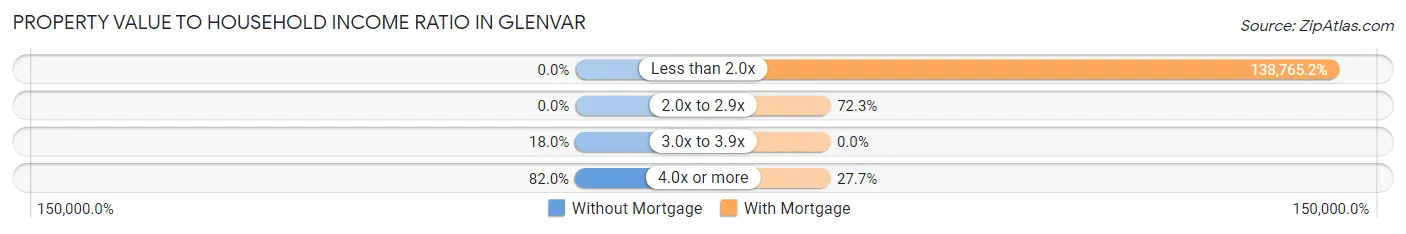
| Value-to-Income Ratio | Without Mortgage | With Mortgage |
| Less than 2.0x | 0 (0.0%) | 155,417 (138,765.2%) |
| 2.0x to 2.9x | 0 (0.0%) | 81 (72.3%) |
| 3.0x to 3.9x | 18 (18.0%) | 0 (0.0%) |
| 4.0x or more | 82 (82.0%) | 31 (27.7%) |
| Total | 100 (100.0%) | 112 (100.0%) |
Real Estate Taxes by Mortgage Status in Glenvar
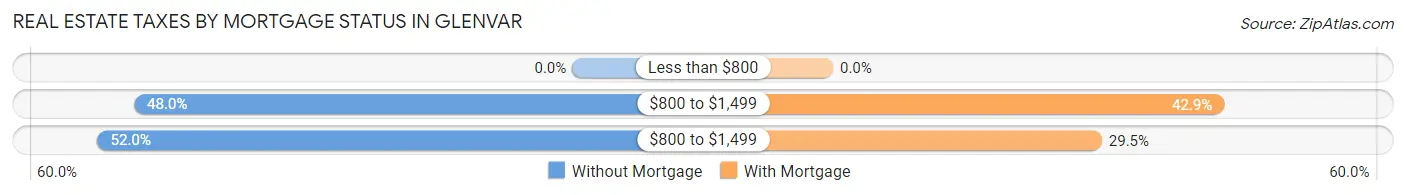
| Property Taxes | Without Mortgage | With Mortgage |
| Less than $800 | 0 (0.0%) | 0 (0.0%) |
| $800 to $1,499 | 48 (48.0%) | 48 (42.9%) |
| $800 to $1,499 | 52 (52.0%) | 33 (29.5%) |
| Total | 100 (100.0%) | 112 (100.0%) |
Health & Disability in Glenvar
Health Insurance Coverage by Age in Glenvar
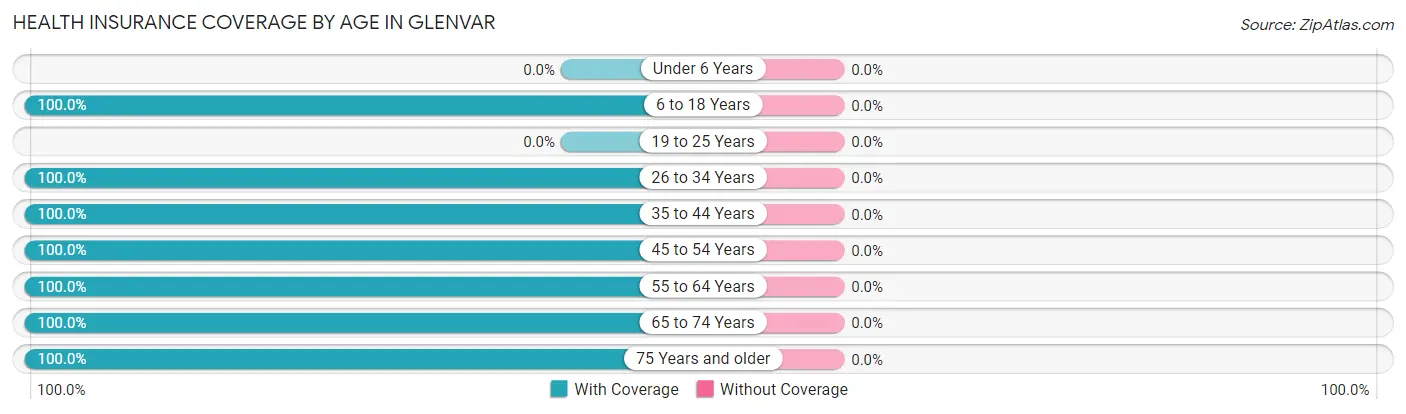
| Age Bracket | With Coverage | Without Coverage |
| Under 6 Years | 0 (0.0%) | 0 (0.0%) |
| 6 to 18 Years | 44 (100.0%) | 0 (0.0%) |
| 19 to 25 Years | 0 (0.0%) | 0 (0.0%) |
| 26 to 34 Years | 30 (100.0%) | 0 (0.0%) |
| 35 to 44 Years | 34 (100.0%) | 0 (0.0%) |
| 45 to 54 Years | 90 (100.0%) | 0 (0.0%) |
| 55 to 64 Years | 32 (100.0%) | 0 (0.0%) |
| 65 to 74 Years | 159 (100.0%) | 0 (0.0%) |
| 75 Years and older | 309 (100.0%) | 0 (0.0%) |
| Total | 698 (100.0%) | 0 (0.0%) |
Health Insurance Coverage by Citizenship Status in Glenvar
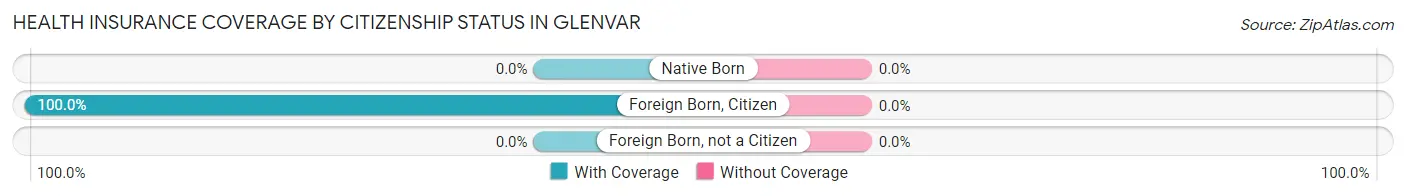
| Citizenship Status | With Coverage | Without Coverage |
| Native Born | 0 (0.0%) | 0 (0.0%) |
| Foreign Born, Citizen | 44 (100.0%) | 0 (0.0%) |
| Foreign Born, not a Citizen | 0 (0.0%) | 0 (0.0%) |
Health Insurance Coverage by Household Income in Glenvar
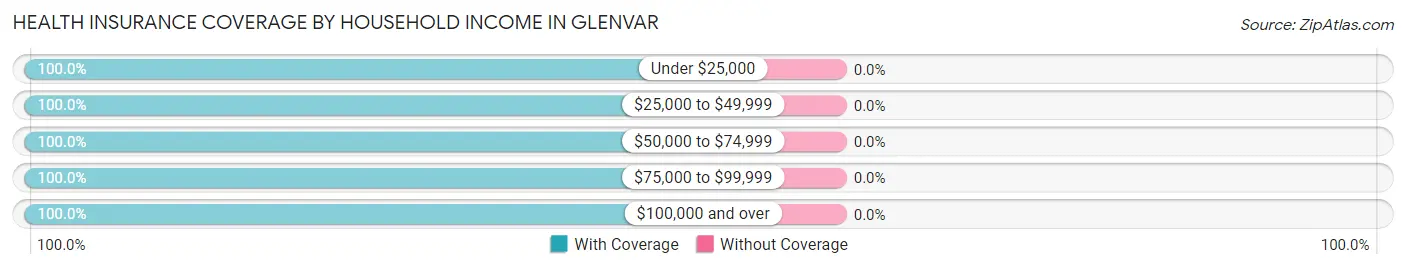
| Household Income | With Coverage | Without Coverage |
| Under $25,000 | 226 (100.0%) | 0 (0.0%) |
| $25,000 to $49,999 | 61 (100.0%) | 0 (0.0%) |
| $50,000 to $74,999 | 176 (100.0%) | 0 (0.0%) |
| $75,000 to $99,999 | 16 (100.0%) | 0 (0.0%) |
| $100,000 and over | 219 (100.0%) | 0 (0.0%) |
Public vs Private Health Insurance Coverage by Age in Glenvar
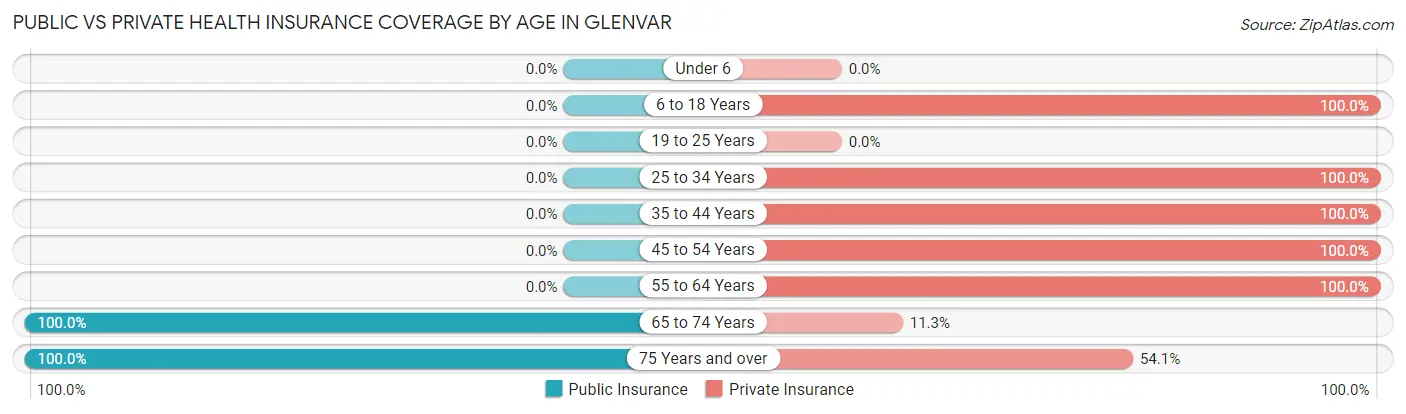
| Age Bracket | Public Insurance | Private Insurance |
| Under 6 | 0 (0.0%) | 0 (0.0%) |
| 6 to 18 Years | 0 (0.0%) | 44 (100.0%) |
| 19 to 25 Years | 0 (0.0%) | 0 (0.0%) |
| 25 to 34 Years | 0 (0.0%) | 30 (100.0%) |
| 35 to 44 Years | 0 (0.0%) | 34 (100.0%) |
| 45 to 54 Years | 0 (0.0%) | 90 (100.0%) |
| 55 to 64 Years | 0 (0.0%) | 32 (100.0%) |
| 65 to 74 Years | 159 (100.0%) | 18 (11.3%) |
| 75 Years and over | 309 (100.0%) | 167 (54.0%) |
| Total | 468 (67.0%) | 415 (59.5%) |
Disability Status by Sex by Age in Glenvar
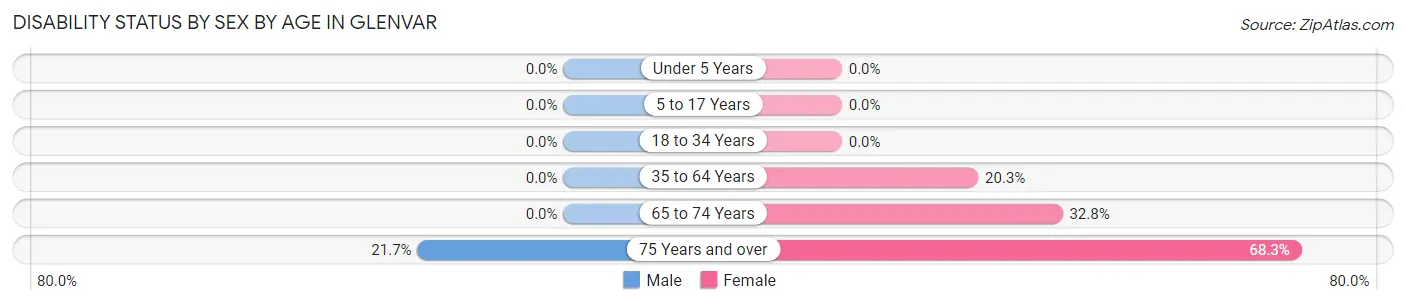
| Age Bracket | Male | Female |
| Under 5 Years | 0 (0.0%) | 0 (0.0%) |
| 5 to 17 Years | 0 (0.0%) | 0 (0.0%) |
| 18 to 34 Years | 0 (0.0%) | 0 (0.0%) |
| 35 to 64 Years | 0 (0.0%) | 16 (20.3%) |
| 65 to 74 Years | 0 (0.0%) | 39 (32.8%) |
| 75 Years and over | 13 (21.7%) | 170 (68.3%) |
Disability Class by Sex by Age in Glenvar
Disability Class: Hearing Difficulty
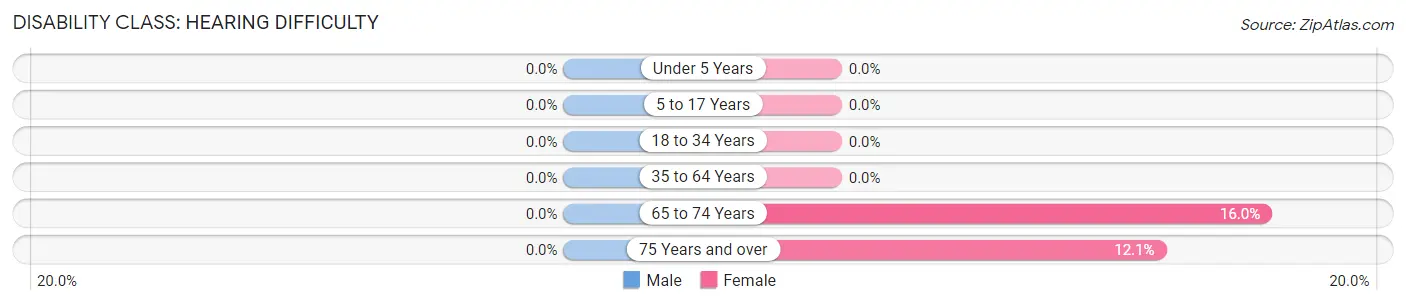
| Age Bracket | Male | Female |
| Under 5 Years | 0 (0.0%) | 0 (0.0%) |
| 5 to 17 Years | 0 (0.0%) | 0 (0.0%) |
| 18 to 34 Years | 0 (0.0%) | 0 (0.0%) |
| 35 to 64 Years | 0 (0.0%) | 0 (0.0%) |
| 65 to 74 Years | 0 (0.0%) | 19 (16.0%) |
| 75 Years and over | 0 (0.0%) | 30 (12.0%) |
Disability Class: Vision Difficulty
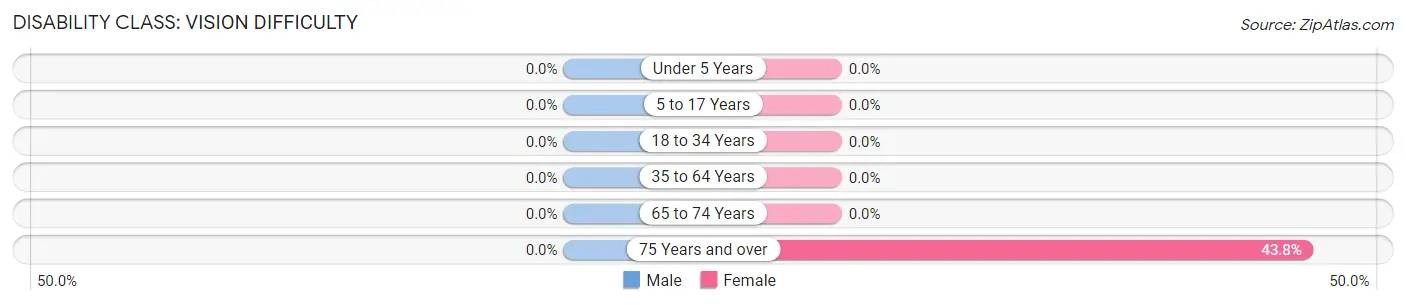
| Age Bracket | Male | Female |
| Under 5 Years | 0 (0.0%) | 0 (0.0%) |
| 5 to 17 Years | 0 (0.0%) | 0 (0.0%) |
| 18 to 34 Years | 0 (0.0%) | 0 (0.0%) |
| 35 to 64 Years | 0 (0.0%) | 0 (0.0%) |
| 65 to 74 Years | 0 (0.0%) | 0 (0.0%) |
| 75 Years and over | 0 (0.0%) | 109 (43.8%) |
Disability Class: Cognitive Difficulty
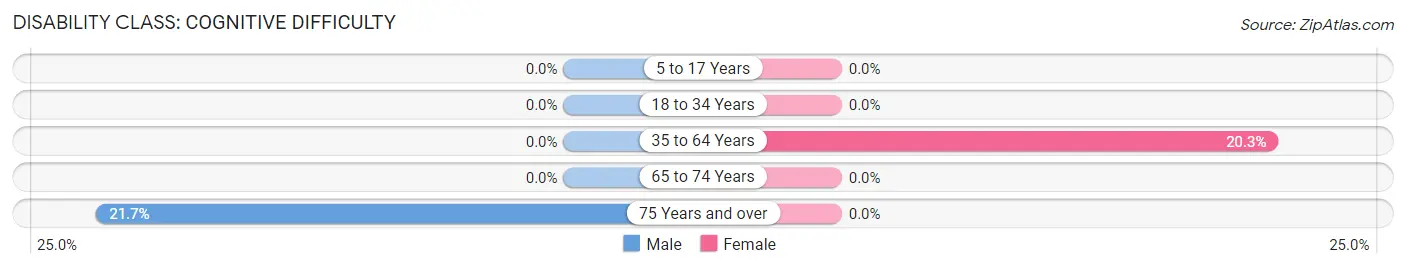
| Age Bracket | Male | Female |
| 5 to 17 Years | 0 (0.0%) | 0 (0.0%) |
| 18 to 34 Years | 0 (0.0%) | 0 (0.0%) |
| 35 to 64 Years | 0 (0.0%) | 16 (20.3%) |
| 65 to 74 Years | 0 (0.0%) | 0 (0.0%) |
| 75 Years and over | 13 (21.7%) | 0 (0.0%) |
Disability Class: Ambulatory Difficulty
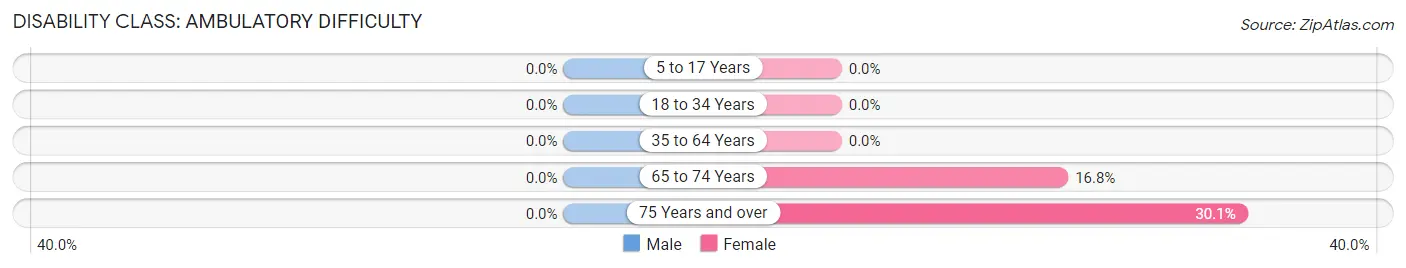
| Age Bracket | Male | Female |
| 5 to 17 Years | 0 (0.0%) | 0 (0.0%) |
| 18 to 34 Years | 0 (0.0%) | 0 (0.0%) |
| 35 to 64 Years | 0 (0.0%) | 0 (0.0%) |
| 65 to 74 Years | 0 (0.0%) | 20 (16.8%) |
| 75 Years and over | 0 (0.0%) | 75 (30.1%) |
Disability Class: Self-Care Difficulty
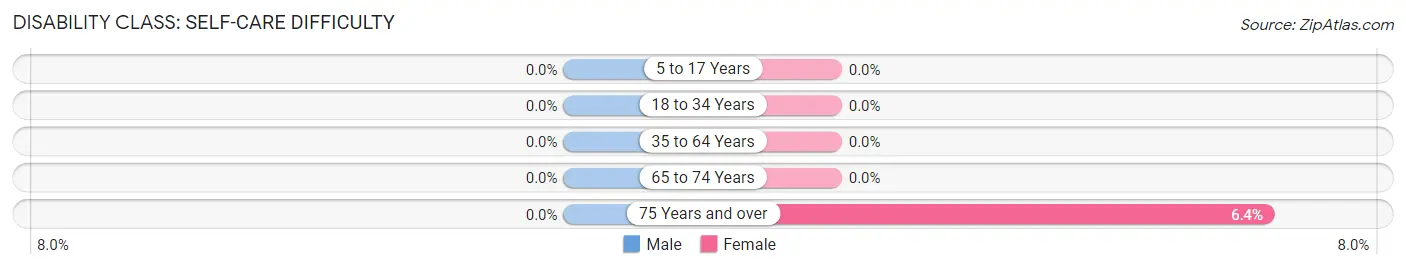
| Age Bracket | Male | Female |
| 5 to 17 Years | 0 (0.0%) | 0 (0.0%) |
| 18 to 34 Years | 0 (0.0%) | 0 (0.0%) |
| 35 to 64 Years | 0 (0.0%) | 0 (0.0%) |
| 65 to 74 Years | 0 (0.0%) | 0 (0.0%) |
| 75 Years and over | 0 (0.0%) | 16 (6.4%) |
Technology Access in Glenvar
Computing Device Access in Glenvar
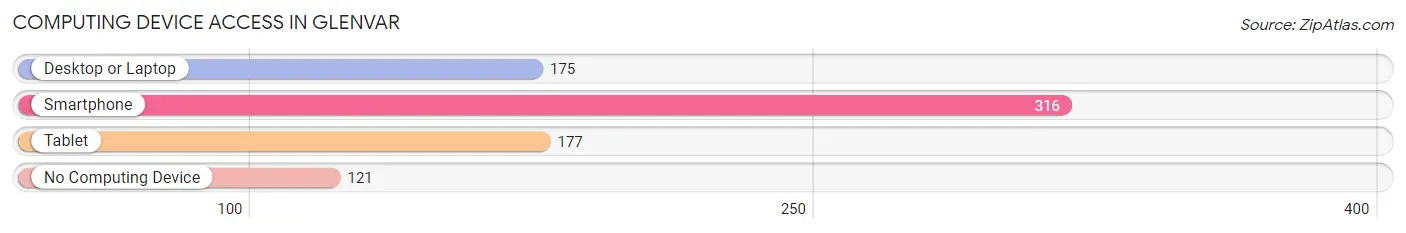
| Device Type | # Households | % Households |
| Desktop or Laptop | 175 | 35.9% |
| Smartphone | 316 | 64.9% |
| Tablet | 177 | 36.3% |
| No Computing Device | 121 | 24.8% |
| Total | 487 | 100.0% |
Internet Access in Glenvar
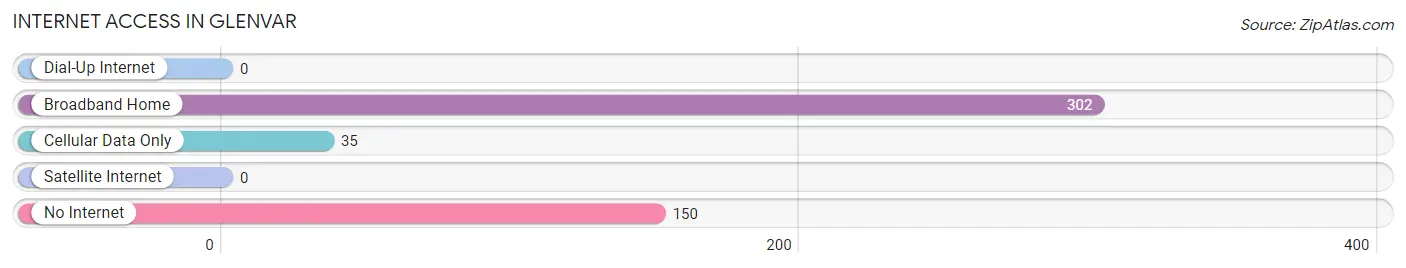
| Internet Type | # Households | % Households |
| Dial-Up Internet | 0 | 0.0% |
| Broadband Home | 302 | 62.0% |
| Cellular Data Only | 35 | 7.2% |
| Satellite Internet | 0 | 0.0% |
| No Internet | 150 | 30.8% |
| Total | 487 | 100.0% |
Glenvar Summary
Glenvar is a small unincorporated community located in Roanoke County, Virginia. It is situated in the Roanoke Valley, approximately 10 miles south of the city of Roanoke. The community is bordered by the Blue Ridge Mountains to the east and the Appalachian Mountains to the west. The population of Glenvar was estimated to be 1,845 in 2019.
History
Glenvar was first settled in the late 1700s by a group of Scots-Irish immigrants. The community was originally known as “Glenvar Station” and was a stop on the Virginia and Tennessee Railroad. The railroad was built in 1854 and ran from Lynchburg to Bristol, Tennessee. The railroad was a major factor in the development of the area and helped to bring in new settlers and businesses.
In 1891, the town was officially incorporated as “Glenvar” and the first post office was established. The town was named after the nearby Glenvar Creek, which was named after a Scottish immigrant who settled in the area in the late 1700s.
Geography
Glenvar is located in the Roanoke Valley in southwestern Virginia. The town is situated at the base of the Blue Ridge Mountains and is bordered by the Appalachian Mountains to the west. The town is located approximately 10 miles south of the city of Roanoke and is situated along the Roanoke River.
The town has a total area of 1.3 square miles, all of which is land. The terrain is mostly hilly and the elevation is 1,845 feet above sea level. The climate is humid subtropical, with hot, humid summers and mild winters.
Economy
The economy of Glenvar is largely based on agriculture and tourism. The town is home to several farms, including a dairy farm, a beef farm, and a vegetable farm. The town is also home to several wineries and vineyards, which attract tourists from all over the region.
The town is also home to several small businesses, including a hardware store, a grocery store, and a few restaurants. The town is also home to a few small manufacturing companies, which produce a variety of products, including furniture, clothing, and electronics.
Demographics
As of 2019, the population of Glenvar was estimated to be 1,845. The racial makeup of the town was 94.3% White, 2.2% African American, 0.7% Asian, 0.3% Native American, and 2.5% from other races. The median household income was $50,945 and the median age was 44.7 years.
Conclusion
Glenvar is a small unincorporated community located in Roanoke County, Virginia. It is situated in the Roanoke Valley, approximately 10 miles south of the city of Roanoke. The community was first settled in the late 1700s by a group of Scots-Irish immigrants and was officially incorporated in 1891. The economy of Glenvar is largely based on agriculture and tourism, and the population was estimated to be 1,845 in 2019.
Common Questions
What is Per Capita Income in Glenvar?
Per Capita income in Glenvar is $32,631.
What is the Median Family Income in Glenvar?
Median Family Income in Glenvar is $134,118.
What is the Median Household income in Glenvar?
Median Household Income in Glenvar is $30,234.
What is Income or Wage Gap in Glenvar?
Income or Wage Gap in Glenvar is 65.2%.
Women in Glenvar earn 34.8 cents for every dollar earned by a man.
What is Inequality or Gini Index in Glenvar?
Inequality or Gini Index in Glenvar is 0.53.
What is the Total Population of Glenvar?
Total Population of Glenvar is 932.
What is the Total Male Population of Glenvar?
Total Male Population of Glenvar is 253.
What is the Total Female Population of Glenvar?
Total Female Population of Glenvar is 679.
What is the Ratio of Males per 100 Females in Glenvar?
There are 37.26 Males per 100 Females in Glenvar.
What is the Ratio of Females per 100 Males in Glenvar?
There are 268.38 Females per 100 Males in Glenvar.
What is the Median Population Age in Glenvar?
Median Population Age in Glenvar is 74.7 Years.
What is the Average Family Size in Glenvar
Average Family Size in Glenvar is 2.3 People.
What is the Average Household Size in Glenvar
Average Household Size in Glenvar is 1.4 People.
How Large is the Labor Force in Glenvar?
There are 221 People in the Labor Forcein in Glenvar.
What is the Percentage of People in the Labor Force in Glenvar?
24.5% of People are in the Labor Force in Glenvar.
What is the Unemployment Rate in Glenvar?
Unemployment Rate in Glenvar is 6.3%.