Sedley, VA Map & Demographics
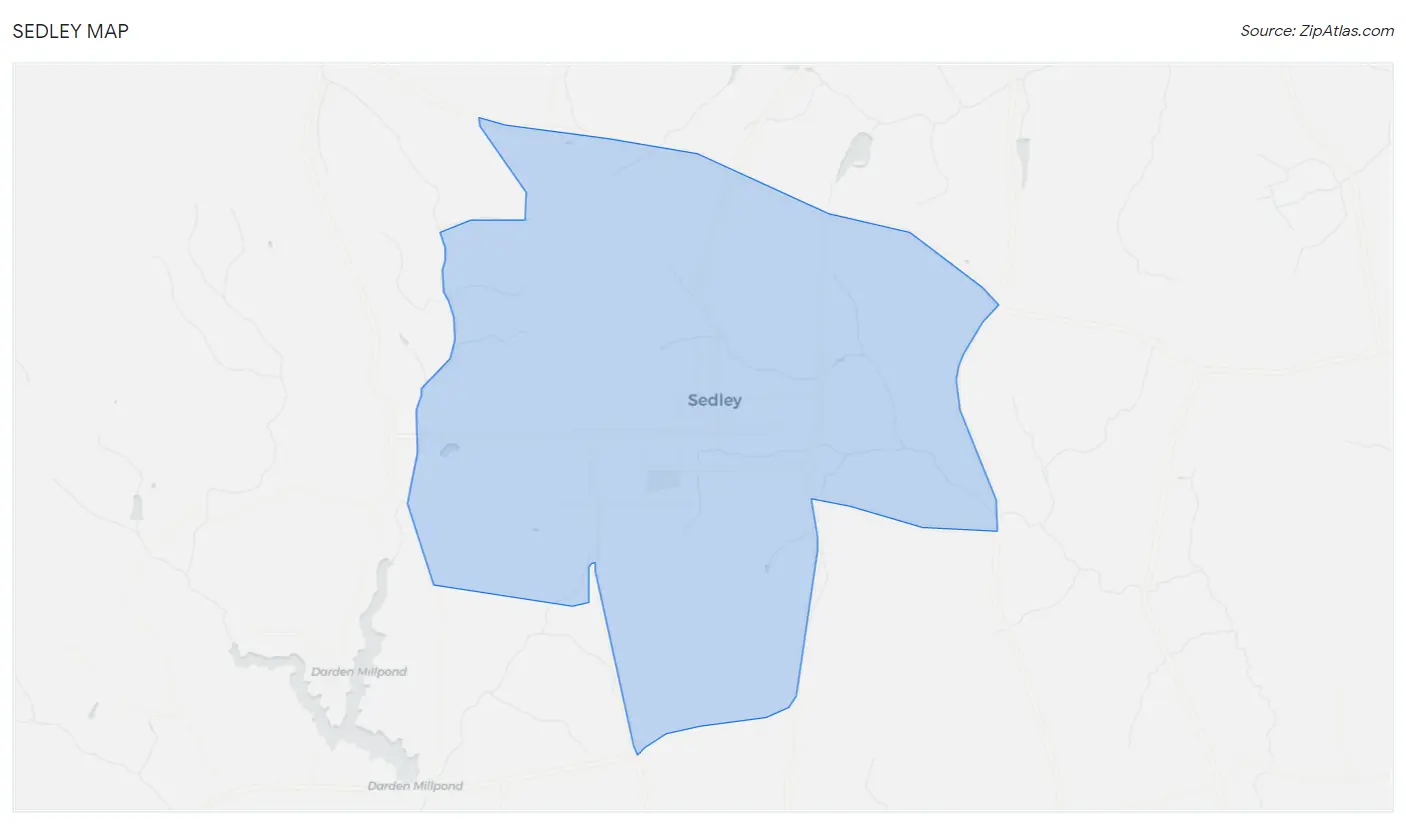
Sedley Map
Sedley Overview
$32,435
PER CAPITA INCOME
$88,574
AVG FAMILY INCOME
$87,250
AVG HOUSEHOLD INCOME
0.27
INEQUALITY / GINI INDEX
687
TOTAL POPULATION
415
MALE POPULATION
272
FEMALE POPULATION
152.57
MALES / 100 FEMALES
65.54
FEMALES / 100 MALES
35.4
MEDIAN AGE
2.8
AVG FAMILY SIZE
2.4
AVG HOUSEHOLD SIZE
388
LABOR FORCE [ PEOPLE ]
71.3%
PERCENT IN LABOR FORCE
8.0%
UNEMPLOYMENT RATE
Sedley Zip Codes
Income in Sedley
Income Overview in Sedley
Per Capita Income in Sedley is $32,435, while median incomes of families and households are $88,574 and $87,250 respectively.
| Characteristic | Number | Measure |
| Per Capita Income | 687 | $32,435 |
| Median Family Income | 223 | $88,574 |
| Mean Family Income | 223 | $89,370 |
| Median Household Income | 289 | $87,250 |
| Mean Household Income | 289 | $77,128 |
| Income Deficit | 223 | $0 |
| Wage / Income Gap (%) | 687 | 0.00% |
| Wage / Income Gap ($) | 687 | 100.00¢ per $1 |
| Gini / Inequality Index | 687 | 0.27 |
Earnings by Sex in Sedley
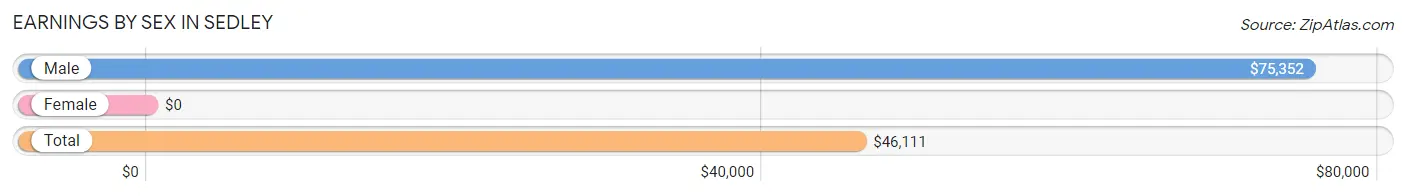
| Sex | Number | Average Earnings |
| Male | 240 (59.4%) | $75,352 |
| Female | 164 (40.6%) | $0 |
| Total | 404 (100.0%) | $46,111 |
Earnings by Sex by Income Bracket in Sedley
The most common earnings brackets in Sedley are $75,000 to $99,999 for men (107 | 44.6%) and $10,000 to $12,499 for women (62 | 37.8%).
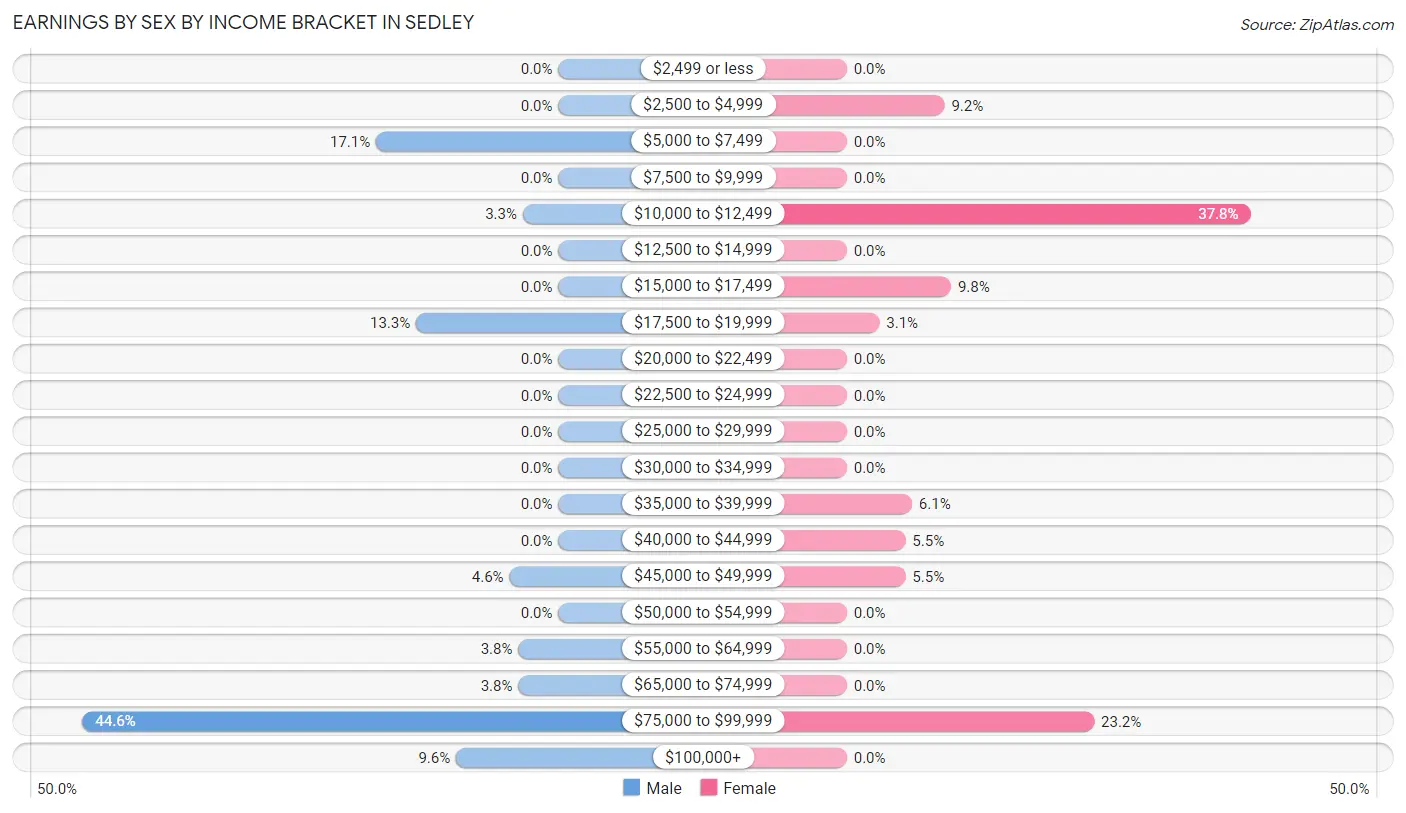
| Income | Male | Female |
| $2,499 or less | 0 (0.0%) | 0 (0.0%) |
| $2,500 to $4,999 | 0 (0.0%) | 15 (9.1%) |
| $5,000 to $7,499 | 41 (17.1%) | 0 (0.0%) |
| $7,500 to $9,999 | 0 (0.0%) | 0 (0.0%) |
| $10,000 to $12,499 | 8 (3.3%) | 62 (37.8%) |
| $12,500 to $14,999 | 0 (0.0%) | 0 (0.0%) |
| $15,000 to $17,499 | 0 (0.0%) | 16 (9.8%) |
| $17,500 to $19,999 | 32 (13.3%) | 5 (3.0%) |
| $20,000 to $22,499 | 0 (0.0%) | 0 (0.0%) |
| $22,500 to $24,999 | 0 (0.0%) | 0 (0.0%) |
| $25,000 to $29,999 | 0 (0.0%) | 0 (0.0%) |
| $30,000 to $34,999 | 0 (0.0%) | 0 (0.0%) |
| $35,000 to $39,999 | 0 (0.0%) | 10 (6.1%) |
| $40,000 to $44,999 | 0 (0.0%) | 9 (5.5%) |
| $45,000 to $49,999 | 11 (4.6%) | 9 (5.5%) |
| $50,000 to $54,999 | 0 (0.0%) | 0 (0.0%) |
| $55,000 to $64,999 | 9 (3.7%) | 0 (0.0%) |
| $65,000 to $74,999 | 9 (3.7%) | 0 (0.0%) |
| $75,000 to $99,999 | 107 (44.6%) | 38 (23.2%) |
| $100,000+ | 23 (9.6%) | 0 (0.0%) |
| Total | 240 (100.0%) | 164 (100.0%) |
Earnings by Sex by Educational Attainment in Sedley
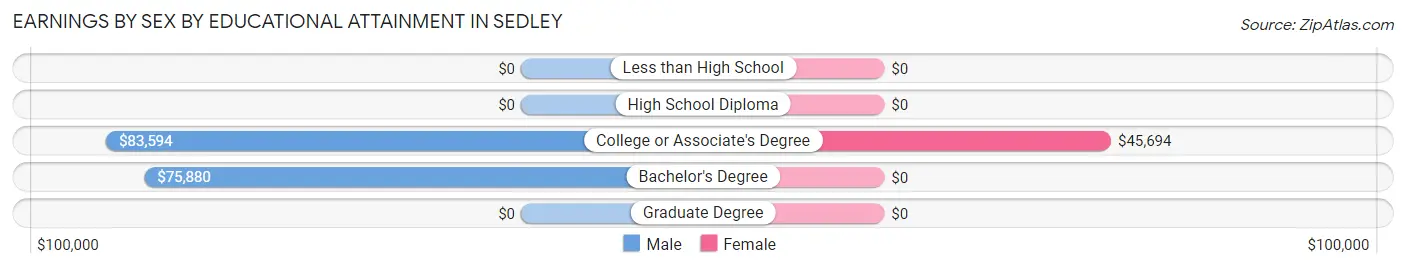
| Educational Attainment | Male Income | Female Income |
| Less than High School | - | - |
| High School Diploma | - | - |
| College or Associate's Degree | $83,594 | $45,694 |
| Bachelor's Degree | $75,880 | $0 |
| Graduate Degree | - | - |
| Total | $75,352 | $0 |
Family Income in Sedley
Family Income Brackets in Sedley
According to the Sedley family income data, there are 125 families falling into the $75,000 to $99,999 income range, which is the most common income bracket and makes up 56.0% of all families.
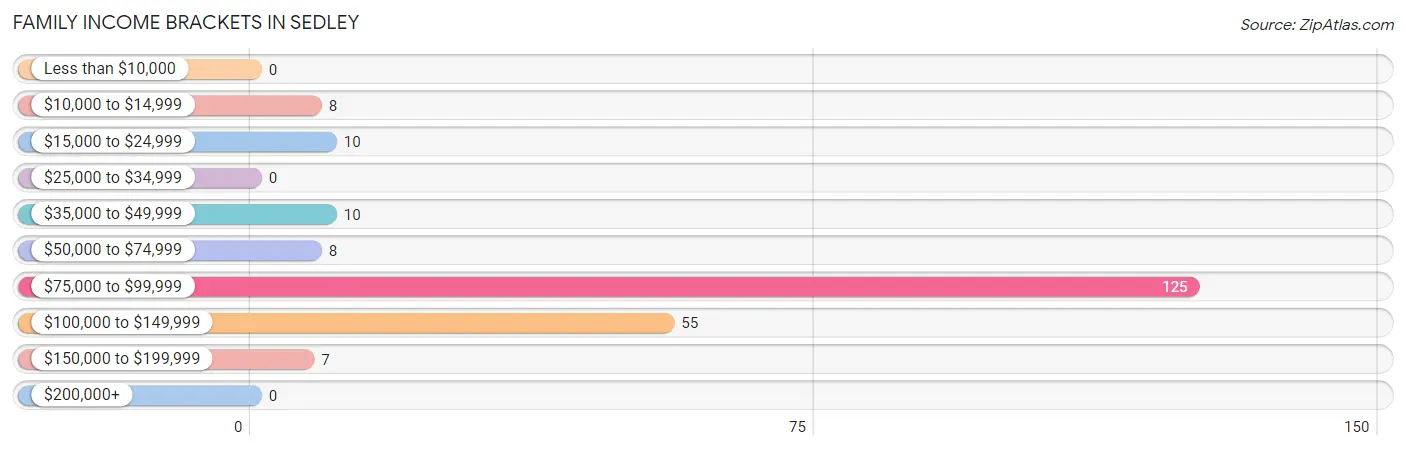
| Income Bracket | # Families | % Families |
| Less than $10,000 | 0 | 0.0% |
| $10,000 to $14,999 | 8 | 3.6% |
| $15,000 to $24,999 | 10 | 4.5% |
| $25,000 to $34,999 | 0 | 0.0% |
| $35,000 to $49,999 | 10 | 4.5% |
| $50,000 to $74,999 | 8 | 3.6% |
| $75,000 to $99,999 | 125 | 56.1% |
| $100,000 to $149,999 | 55 | 24.7% |
| $150,000 to $199,999 | 7 | 3.1% |
| $200,000+ | 0 | 0.0% |
Family Income by Famaliy Size in Sedley
2-person families (106 | 47.5%) account for the highest median family income in Sedley with $82,125 per family, while 2-person families (106 | 47.5%) have the highest median income of $41,062 per family member.
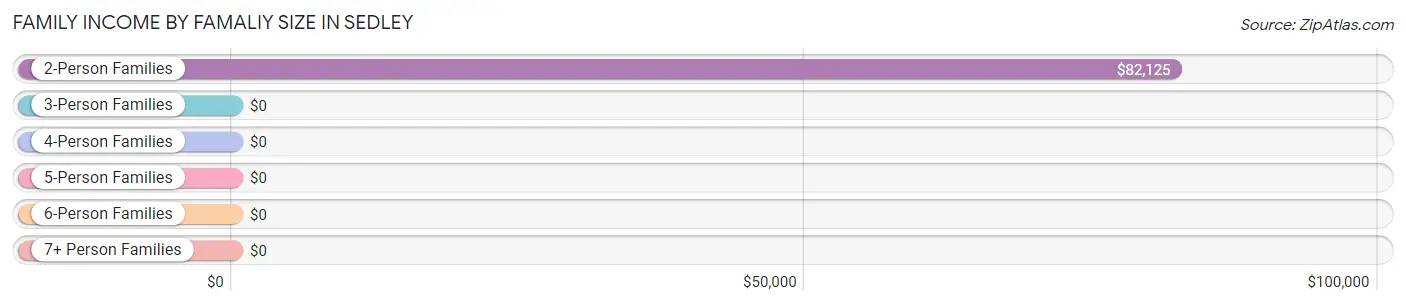
| Income Bracket | # Families | Median Income |
| 2-Person Families | 106 (47.5%) | $82,125 |
| 3-Person Families | 37 (16.6%) | $0 |
| 4-Person Families | 80 (35.9%) | $0 |
| 5-Person Families | 0 (0.0%) | $0 |
| 6-Person Families | 0 (0.0%) | $0 |
| 7+ Person Families | 0 (0.0%) | $0 |
| Total | 223 (100.0%) | $88,574 |
Family Income by Number of Earners in Sedley
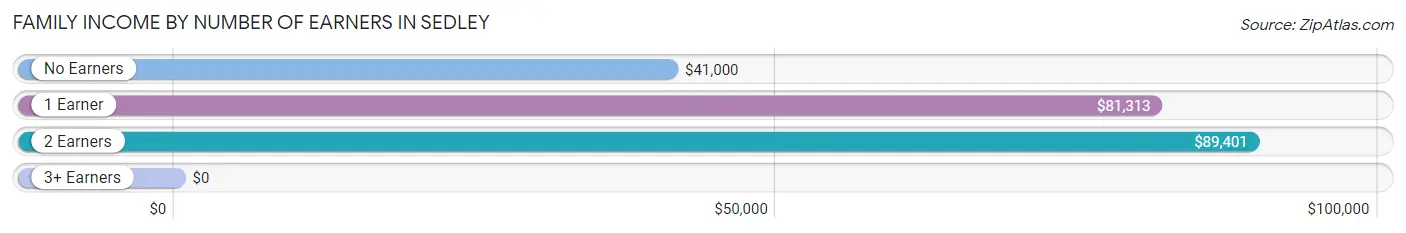
| Number of Earners | # Families | Median Income |
| No Earners | 28 (12.6%) | $41,000 |
| 1 Earner | 37 (16.6%) | $81,313 |
| 2 Earners | 158 (70.9%) | $89,401 |
| 3+ Earners | 0 (0.0%) | $0 |
| Total | 223 (100.0%) | $88,574 |
Household Income in Sedley
Household Income Brackets in Sedley
With 136 households falling in the category, the $75,000 to $99,999 income range is the most frequent in Sedley, accounting for 47.1% of all households.
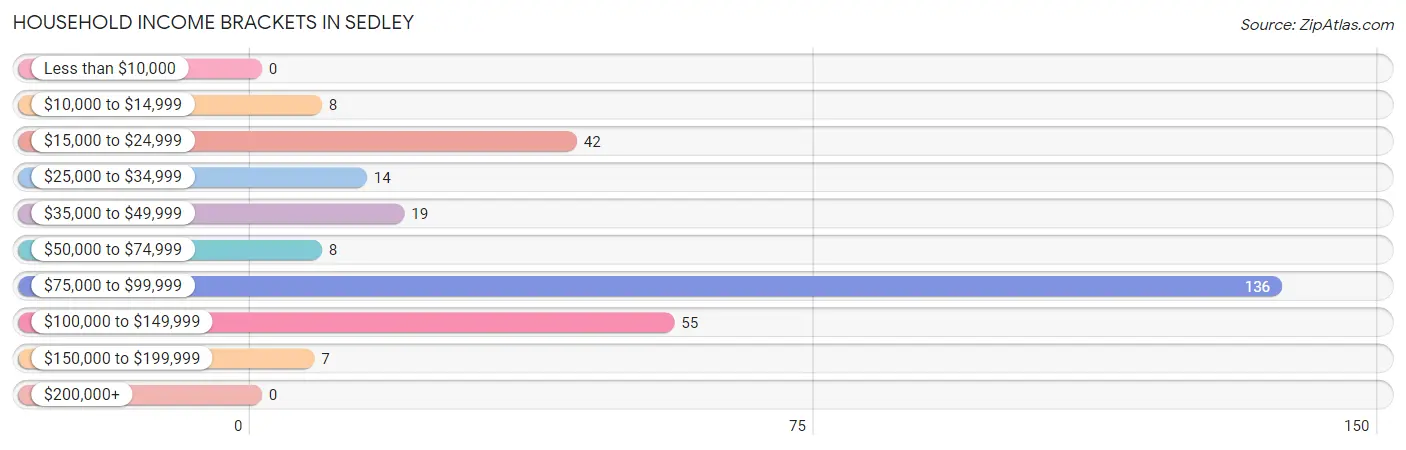
| Income Bracket | # Households | % Households |
| Less than $10,000 | 0 | 0.0% |
| $10,000 to $14,999 | 8 | 2.8% |
| $15,000 to $24,999 | 42 | 14.5% |
| $25,000 to $34,999 | 14 | 4.8% |
| $35,000 to $49,999 | 19 | 6.6% |
| $50,000 to $74,999 | 8 | 2.8% |
| $75,000 to $99,999 | 136 | 47.1% |
| $100,000 to $149,999 | 55 | 19.0% |
| $150,000 to $199,999 | 7 | 2.4% |
| $200,000+ | 0 | 0.0% |
Household Income by Householder Age in Sedley
The median household income in Sedley is $87,250, with the highest median household income of $88,820 found in the 25 to 44 years age bracket for the primary householder. A total of 131 households (45.3%) fall into this category.
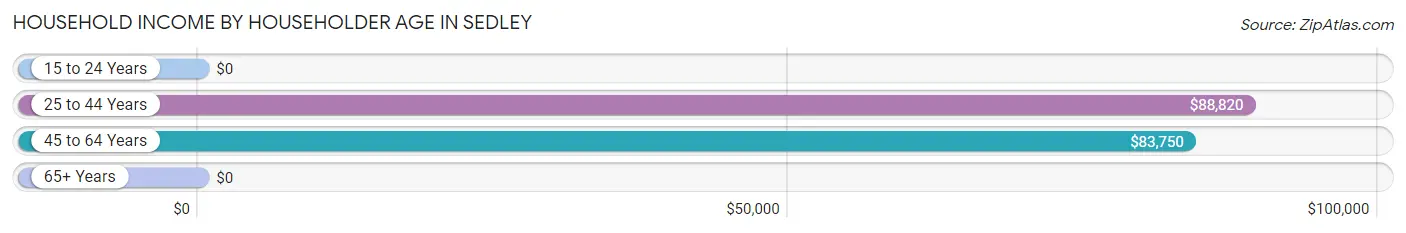
| Income Bracket | # Households | Median Income |
| 15 to 24 Years | 0 (0.0%) | $0 |
| 25 to 44 Years | 131 (45.3%) | $88,820 |
| 45 to 64 Years | 68 (23.5%) | $83,750 |
| 65+ Years | 90 (31.1%) | $0 |
| Total | 289 (100.0%) | $87,250 |
Poverty in Sedley
Income Below Poverty by Sex and Age in Sedley
With 1.9% poverty level for males and 2.9% for females among the residents of Sedley, 25 to 34 year old males and 6 to 11 year old females are the most vulnerable to poverty, with 8 males (7.5%) and 8 females (11.6%) in their respective age groups living below the poverty level.
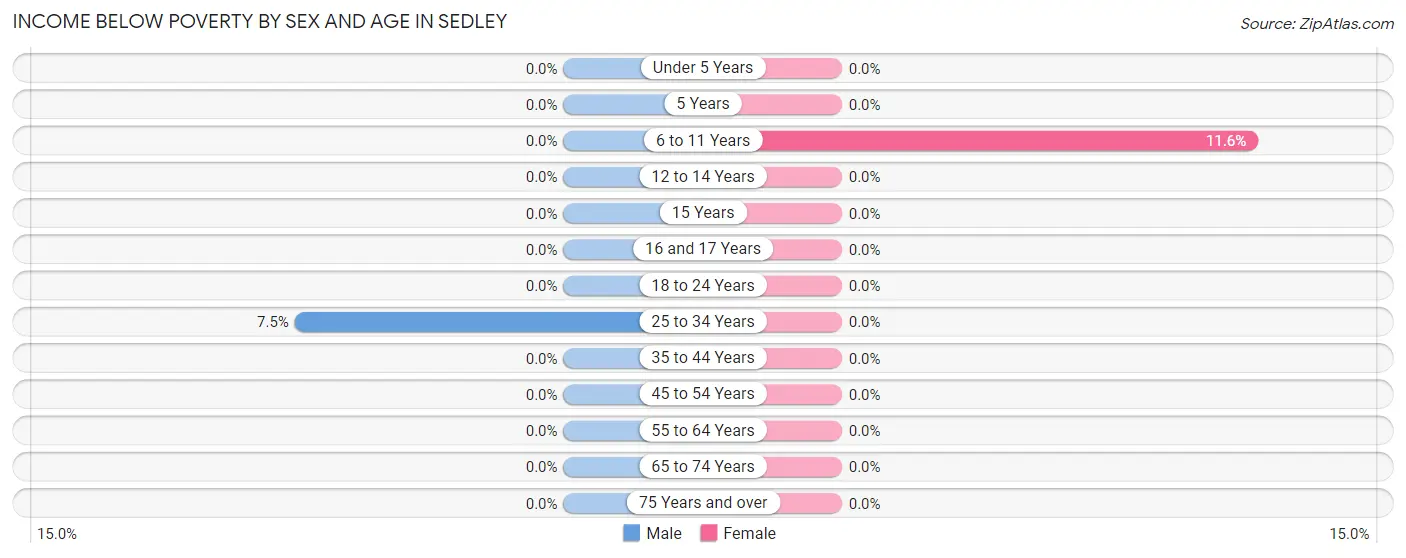
| Age Bracket | Male | Female |
| Under 5 Years | 0 (0.0%) | 0 (0.0%) |
| 5 Years | 0 (0.0%) | 0 (0.0%) |
| 6 to 11 Years | 0 (0.0%) | 8 (11.6%) |
| 12 to 14 Years | 0 (0.0%) | 0 (0.0%) |
| 15 Years | 0 (0.0%) | 0 (0.0%) |
| 16 and 17 Years | 0 (0.0%) | 0 (0.0%) |
| 18 to 24 Years | 0 (0.0%) | 0 (0.0%) |
| 25 to 34 Years | 8 (7.5%) | 0 (0.0%) |
| 35 to 44 Years | 0 (0.0%) | 0 (0.0%) |
| 45 to 54 Years | 0 (0.0%) | 0 (0.0%) |
| 55 to 64 Years | 0 (0.0%) | 0 (0.0%) |
| 65 to 74 Years | 0 (0.0%) | 0 (0.0%) |
| 75 Years and over | 0 (0.0%) | 0 (0.0%) |
| Total | 8 (1.9%) | 8 (2.9%) |
Income Above Poverty by Sex and Age in Sedley
According to the poverty statistics in Sedley, males aged under 5 years and females aged 18 to 24 years are the age groups that are most secure financially, with 100.0% of males and 100.0% of females in these age groups living above the poverty line.
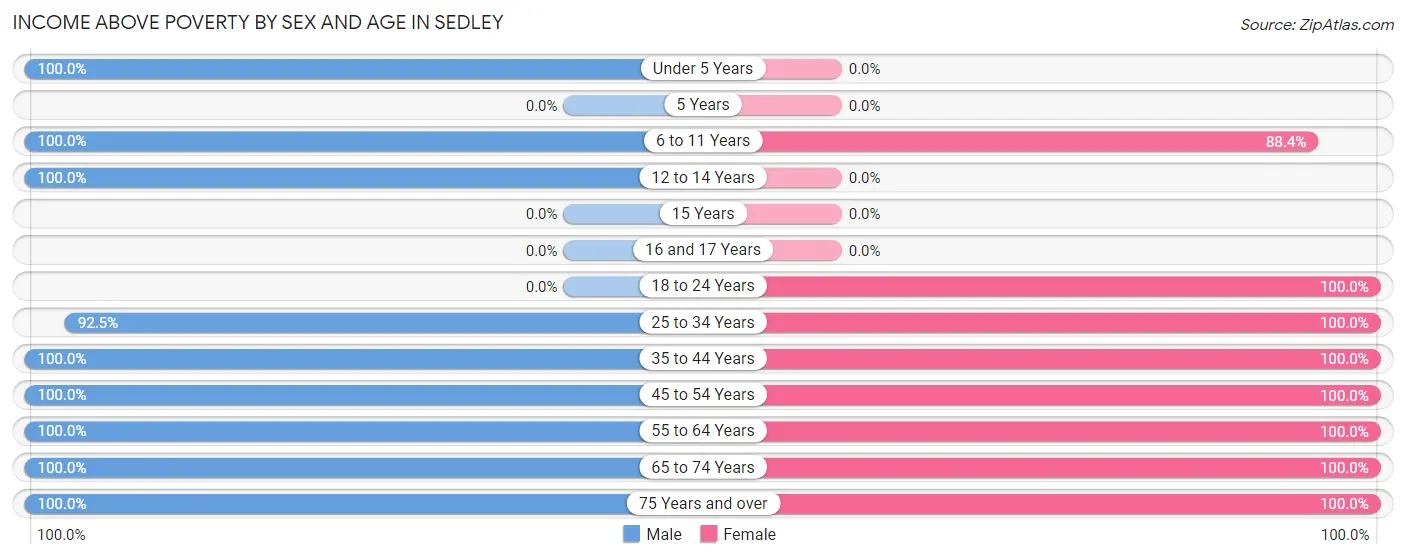
| Age Bracket | Male | Female |
| Under 5 Years | 9 (100.0%) | 0 (0.0%) |
| 5 Years | 0 (0.0%) | 0 (0.0%) |
| 6 to 11 Years | 60 (100.0%) | 61 (88.4%) |
| 12 to 14 Years | 5 (100.0%) | 0 (0.0%) |
| 15 Years | 0 (0.0%) | 0 (0.0%) |
| 16 and 17 Years | 0 (0.0%) | 0 (0.0%) |
| 18 to 24 Years | 0 (0.0%) | 16 (100.0%) |
| 25 to 34 Years | 99 (92.5%) | 19 (100.0%) |
| 35 to 44 Years | 96 (100.0%) | 62 (100.0%) |
| 45 to 54 Years | 9 (100.0%) | 20 (100.0%) |
| 55 to 64 Years | 30 (100.0%) | 56 (100.0%) |
| 65 to 74 Years | 81 (100.0%) | 10 (100.0%) |
| 75 Years and over | 18 (100.0%) | 20 (100.0%) |
| Total | 407 (98.1%) | 264 (97.1%) |
Income Below Poverty Among Married-Couple Families in Sedley
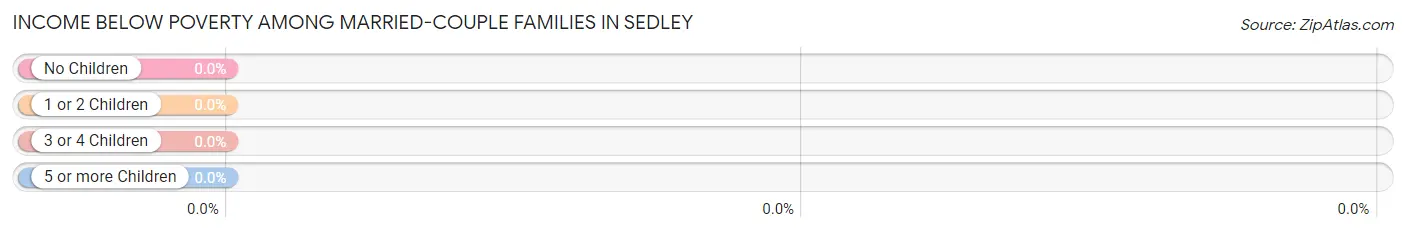
| Children | Above Poverty | Below Poverty |
| No Children | 83 (100.0%) | 0 (0.0%) |
| 1 or 2 Children | 87 (100.0%) | 0 (0.0%) |
| 3 or 4 Children | 0 (0.0%) | 0 (0.0%) |
| 5 or more Children | 0 (0.0%) | 0 (0.0%) |
| Total | 170 (100.0%) | 0 (0.0%) |
Income Below Poverty Among Single-Parent Households in Sedley
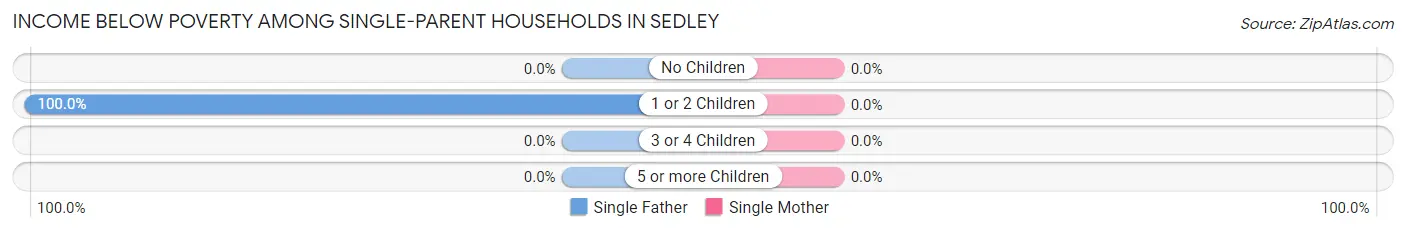
| Children | Single Father | Single Mother |
| No Children | 0 (0.0%) | 0 (0.0%) |
| 1 or 2 Children | 8 (100.0%) | 0 (0.0%) |
| 3 or 4 Children | 0 (0.0%) | 0 (0.0%) |
| 5 or more Children | 0 (0.0%) | 0 (0.0%) |
| Total | 8 (18.2%) | 0 (0.0%) |
Income Below Poverty Among Married-Couple vs Single-Parent Households in Sedley
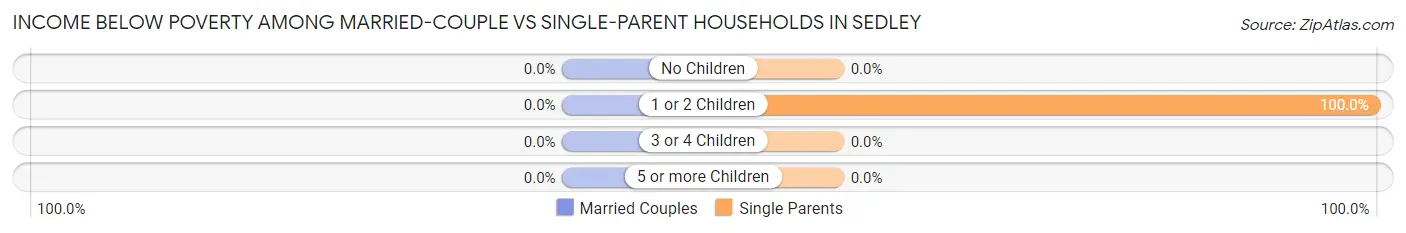
| Children | Married-Couple Families | Single-Parent Households |
| No Children | 0 (0.0%) | 0 (0.0%) |
| 1 or 2 Children | 0 (0.0%) | 8 (100.0%) |
| 3 or 4 Children | 0 (0.0%) | 0 (0.0%) |
| 5 or more Children | 0 (0.0%) | 0 (0.0%) |
| Total | 0 (0.0%) | 8 (15.1%) |
Race in Sedley
The most populous races in Sedley are , and White / Caucasian (687 | 100.0%).
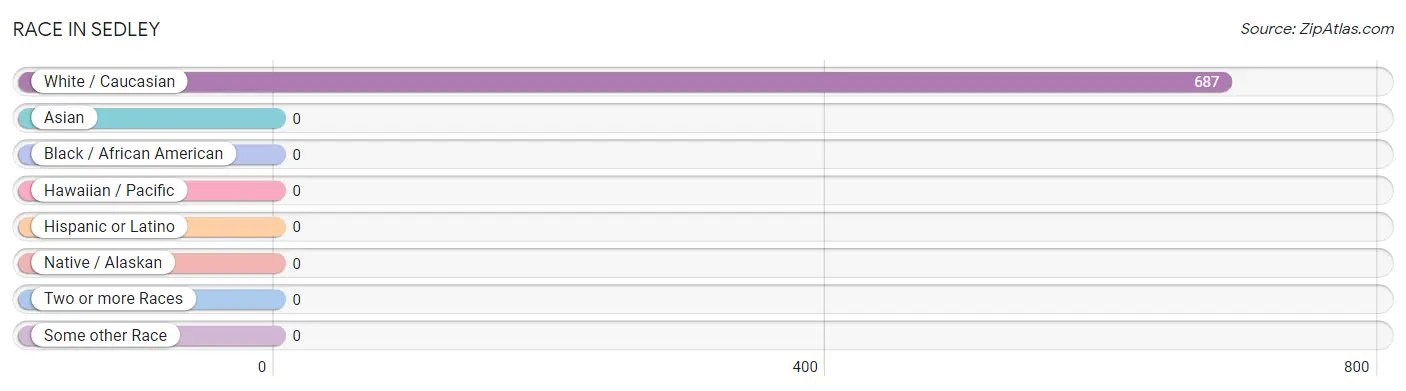
| Race | # Population | % Population |
| Asian | 0 | 0.0% |
| Black / African American | 0 | 0.0% |
| Hawaiian / Pacific | 0 | 0.0% |
| Hispanic or Latino | 0 | 0.0% |
| Native / Alaskan | 0 | 0.0% |
| White / Caucasian | 687 | 100.0% |
| Two or more Races | 0 | 0.0% |
| Some other Race | 0 | 0.0% |
| Total | 687 | 100.0% |
Ancestry in Sedley
The most populous ancestries reported in Sedley are English (193 | 28.1%), German (98 | 14.3%), Irish (87 | 12.7%), American (82 | 11.9%), and Dutch (71 | 10.3%), together accounting for 77.3% of all Sedley residents.
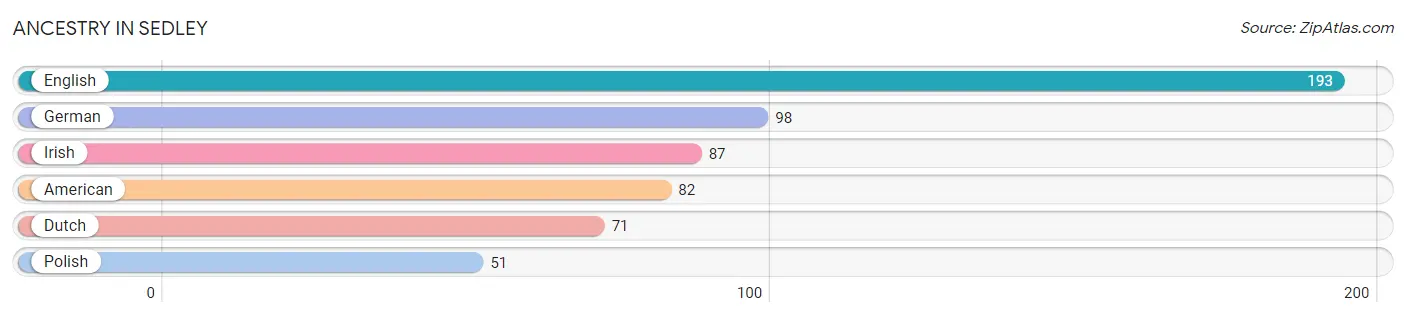
| Ancestry | # Population | % Population |
| American | 82 | 11.9% |
| Dutch | 71 | 10.3% |
| English | 193 | 28.1% |
| German | 98 | 14.3% |
| Irish | 87 | 12.7% |
| Polish | 51 | 7.4% | View All 6 Rows |
Immigrants in Sedley

| Immigration Origin | # Population | % Population | View All 0 Rows |
Sex and Age in Sedley
Sex and Age in Sedley
The most populous age groups in Sedley are 35 to 39 Years (80 | 19.3%) for men and 5 to 9 Years (64 | 23.5%) for women.
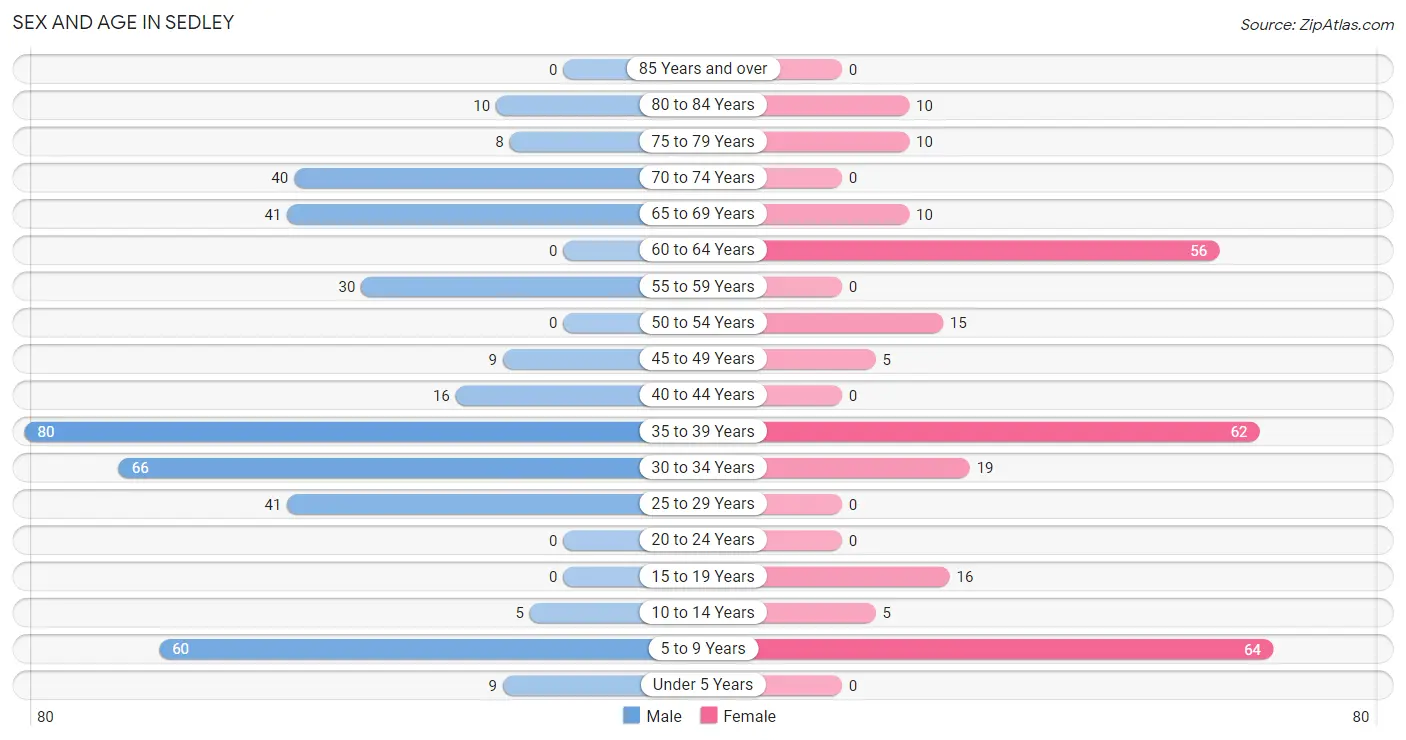
| Age Bracket | Male | Female |
| Under 5 Years | 9 (2.2%) | 0 (0.0%) |
| 5 to 9 Years | 60 (14.5%) | 64 (23.5%) |
| 10 to 14 Years | 5 (1.2%) | 5 (1.8%) |
| 15 to 19 Years | 0 (0.0%) | 16 (5.9%) |
| 20 to 24 Years | 0 (0.0%) | 0 (0.0%) |
| 25 to 29 Years | 41 (9.9%) | 0 (0.0%) |
| 30 to 34 Years | 66 (15.9%) | 19 (7.0%) |
| 35 to 39 Years | 80 (19.3%) | 62 (22.8%) |
| 40 to 44 Years | 16 (3.9%) | 0 (0.0%) |
| 45 to 49 Years | 9 (2.2%) | 5 (1.8%) |
| 50 to 54 Years | 0 (0.0%) | 15 (5.5%) |
| 55 to 59 Years | 30 (7.2%) | 0 (0.0%) |
| 60 to 64 Years | 0 (0.0%) | 56 (20.6%) |
| 65 to 69 Years | 41 (9.9%) | 10 (3.7%) |
| 70 to 74 Years | 40 (9.6%) | 0 (0.0%) |
| 75 to 79 Years | 8 (1.9%) | 10 (3.7%) |
| 80 to 84 Years | 10 (2.4%) | 10 (3.7%) |
| 85 Years and over | 0 (0.0%) | 0 (0.0%) |
| Total | 415 (100.0%) | 272 (100.0%) |
Families and Households in Sedley
Median Family Size in Sedley
The median family size in Sedley is 2.78 persons per family, with married-couple families (170 | 76.2%) accounting for the largest median family size of 2.95 persons per family. On the other hand, single female/mother families (9 | 4.0%) represent the smallest median family size with 2.22 persons per family.
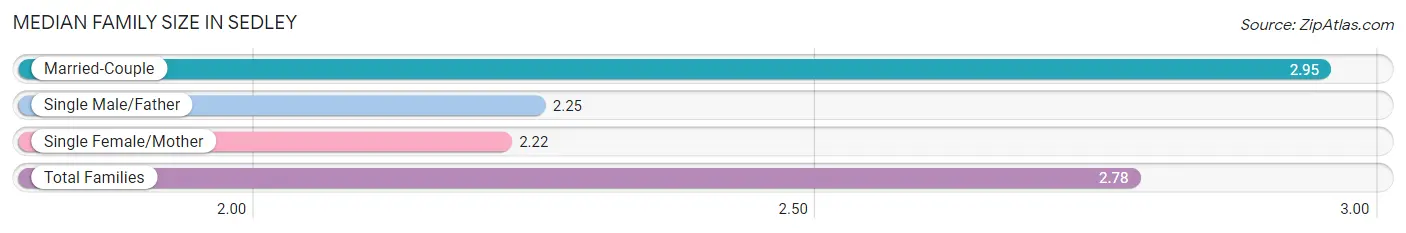
| Family Type | # Families | Family Size |
| Married-Couple | 170 (76.2%) | 2.95 |
| Single Male/Father | 44 (19.7%) | 2.25 |
| Single Female/Mother | 9 (4.0%) | 2.22 |
| Total Families | 223 (100.0%) | 2.78 |
Median Household Size in Sedley
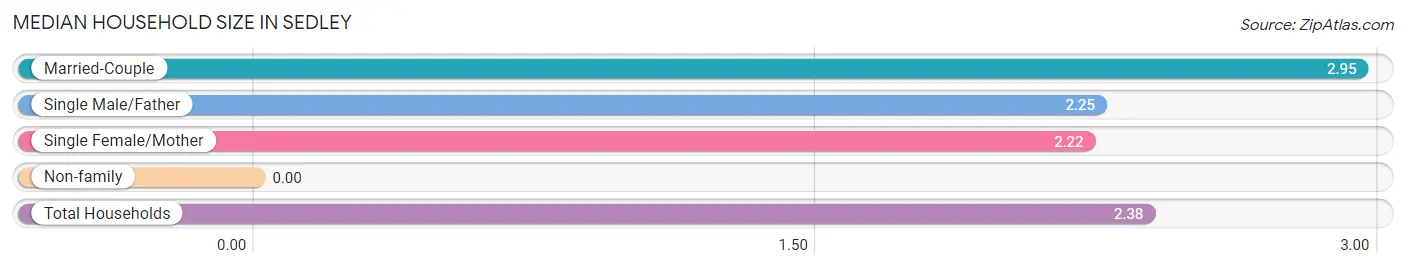
| Household Type | # Households | Household Size |
| Married-Couple | 170 (58.8%) | 2.95 |
| Single Male/Father | 44 (15.2%) | 2.25 |
| Single Female/Mother | 9 (3.1%) | 2.22 |
| Non-family | 66 (22.8%) | - |
| Total Households | 289 (100.0%) | 2.38 |
Household Size by Marriage Status in Sedley
Out of a total of 289 households in Sedley, 223 (77.2%) are family households, while 66 (22.8%) are nonfamily households. The most numerous type of family households are 2-person households, comprising 106, and the most common type of nonfamily households are 1-person households, comprising 66.
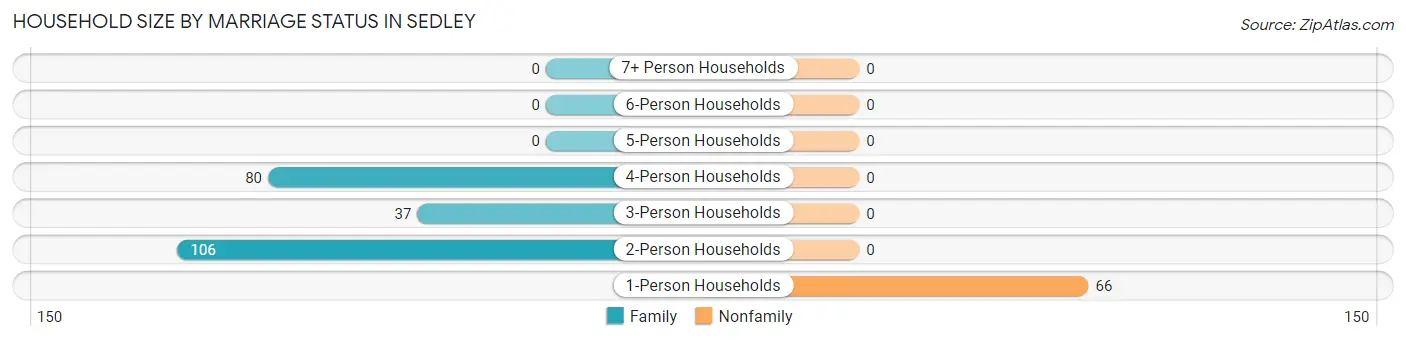
| Household Size | Family Households | Nonfamily Households |
| 1-Person Households | - | 66 (22.8%) |
| 2-Person Households | 106 (36.7%) | 0 (0.0%) |
| 3-Person Households | 37 (12.8%) | 0 (0.0%) |
| 4-Person Households | 80 (27.7%) | 0 (0.0%) |
| 5-Person Households | 0 (0.0%) | 0 (0.0%) |
| 6-Person Households | 0 (0.0%) | 0 (0.0%) |
| 7+ Person Households | 0 (0.0%) | 0 (0.0%) |
| Total | 223 (77.2%) | 66 (22.8%) |
Female Fertility in Sedley
Fertility by Age in Sedley
| Age Bracket | Women with Births | Births / 1,000 Women |
| 15 to 19 years | 0 (0.0%) | 0.0 |
| 20 to 34 years | 0 (0.0%) | 0.0 |
| 35 to 50 years | 0 (0.0%) | 0.0 |
| Total | 0 (0.0%) | 0.0 |
Fertility by Age by Marriage Status in Sedley
| Age Bracket | Married | Unmarried |
| 15 to 19 years | 0 (0.0%) | 0 (0.0%) |
| 20 to 34 years | 0 (0.0%) | 0 (0.0%) |
| 35 to 50 years | 0 (0.0%) | 0 (0.0%) |
| Total | 0 (0.0%) | 0 (0.0%) |
Fertility by Education in Sedley
| Educational Attainment | Women with Births | Births / 1,000 Women |
| Less than High School | 0 (0.0%) | 0.0 |
| High School Diploma | 0 (0.0%) | 0.0 |
| College or Associate's Degree | 0 (0.0%) | 0.0 |
| Bachelor's Degree | 0 (0.0%) | 0.0 |
| Graduate Degree | 0 (0.0%) | 0.0 |
| Total | 0 (0.0%) | 0.0 |
Fertility by Education by Marriage Status in Sedley
| Educational Attainment | Married | Unmarried |
| Less than High School | 0 (0.0%) | 0 (0.0%) |
| High School Diploma | 0 (0.0%) | 0 (0.0%) |
| College or Associate's Degree | 0 (0.0%) | 0 (0.0%) |
| Bachelor's Degree | 0 (0.0%) | 0 (0.0%) |
| Graduate Degree | 0 (0.0%) | 0 (0.0%) |
| Total | 0 (0.0%) | 0 (0.0%) |
Employment Characteristics in Sedley
Employment by Class of Employer in Sedley
Among the 357 employed individuals in Sedley, private company employees (213 | 59.7%), not-for-profit organizations (62 | 17.4%), and local government employees (50 | 14.0%) make up the most common classes of employment.
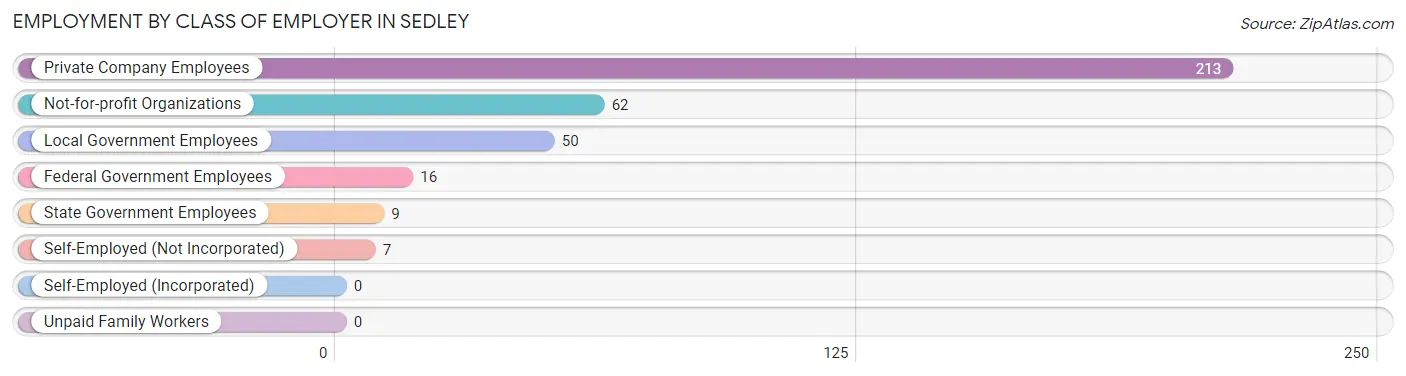
| Employer Class | # Employees | % Employees |
| Private Company Employees | 213 | 59.7% |
| Self-Employed (Incorporated) | 0 | 0.0% |
| Self-Employed (Not Incorporated) | 7 | 2.0% |
| Not-for-profit Organizations | 62 | 17.4% |
| Local Government Employees | 50 | 14.0% |
| State Government Employees | 9 | 2.5% |
| Federal Government Employees | 16 | 4.5% |
| Unpaid Family Workers | 0 | 0.0% |
| Total | 357 | 100.0% |
Employment Status by Age in Sedley
According to the labor force statistics for Sedley, out of the total population over 16 years of age (544), 71.3% or 388 individuals are in the labor force, with 8.0% or 31 of them unemployed. The age group with the highest labor force participation rate is 16 to 19 years, with 100.0% or 16 individuals in the labor force. Within the labor force, the 30 to 34 years age range has the highest percentage of unemployed individuals, with 36.5% or 31 of them being unemployed.
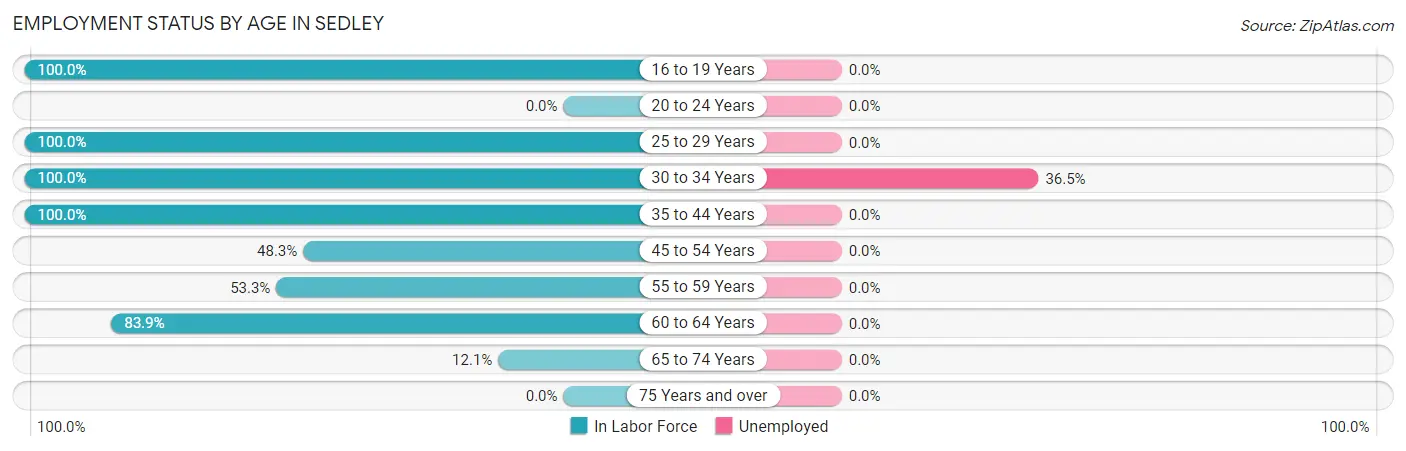
| Age Bracket | In Labor Force | Unemployed |
| 16 to 19 Years | 16 (100.0%) | 0 (0.0%) |
| 20 to 24 Years | 0 (0.0%) | 0 (0.0%) |
| 25 to 29 Years | 41 (100.0%) | 0 (0.0%) |
| 30 to 34 Years | 85 (100.0%) | 31 (36.5%) |
| 35 to 44 Years | 158 (100.0%) | 0 (0.0%) |
| 45 to 54 Years | 14 (48.3%) | 0 (0.0%) |
| 55 to 59 Years | 16 (53.3%) | 0 (0.0%) |
| 60 to 64 Years | 47 (83.9%) | 0 (0.0%) |
| 65 to 74 Years | 11 (12.1%) | 0 (0.0%) |
| 75 Years and over | 0 (0.0%) | 0 (0.0%) |
| Total | 388 (71.3%) | 31 (8.0%) |
Employment Status by Educational Attainment in Sedley
According to labor force statistics for Sedley, 90.5% of individuals (361) out of the total population between 25 and 64 years of age (399) are in the labor force, with 8.6% or 31 of them being unemployed. The group with the highest labor force participation rate are those with the educational attainment of college / associate degree, with 100.0% or 98 individuals in the labor force. Within the labor force, individuals with college / associate degree education have the highest percentage of unemployment, with 31.6% or 31 of them being unemployed.
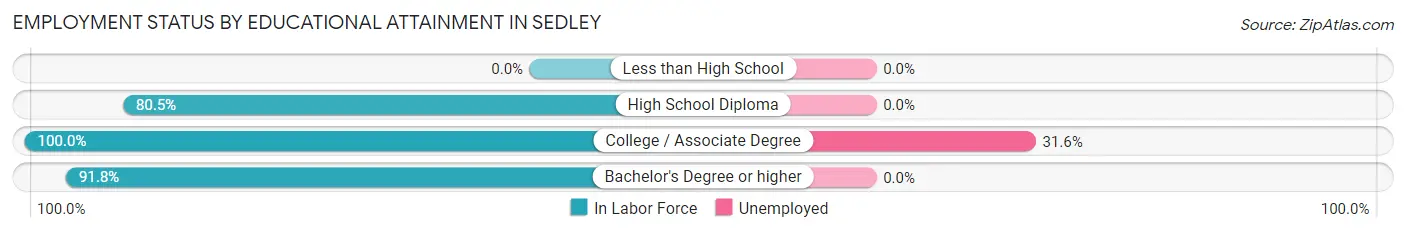
| Educational Attainment | In Labor Force | Unemployed |
| Less than High School | 0 (0.0%) | 0 (0.0%) |
| High School Diploma | 95 (80.5%) | 0 (0.0%) |
| College / Associate Degree | 98 (100.0%) | 31 (31.6%) |
| Bachelor's Degree or higher | 168 (91.8%) | 0 (0.0%) |
| Total | 361 (90.5%) | 34 (8.6%) |
Employment Occupations by Sex in Sedley
Management, Business, Science and Arts Occupations
The most common Management, Business, Science and Arts occupations in Sedley are Community & Social Service (107 | 30.0%), Education Instruction & Library (98 | 27.5%), Computers, Engineering & Science (77 | 21.6%), Business & Financial (71 | 19.9%), and Computers & Mathematics (41 | 11.5%).
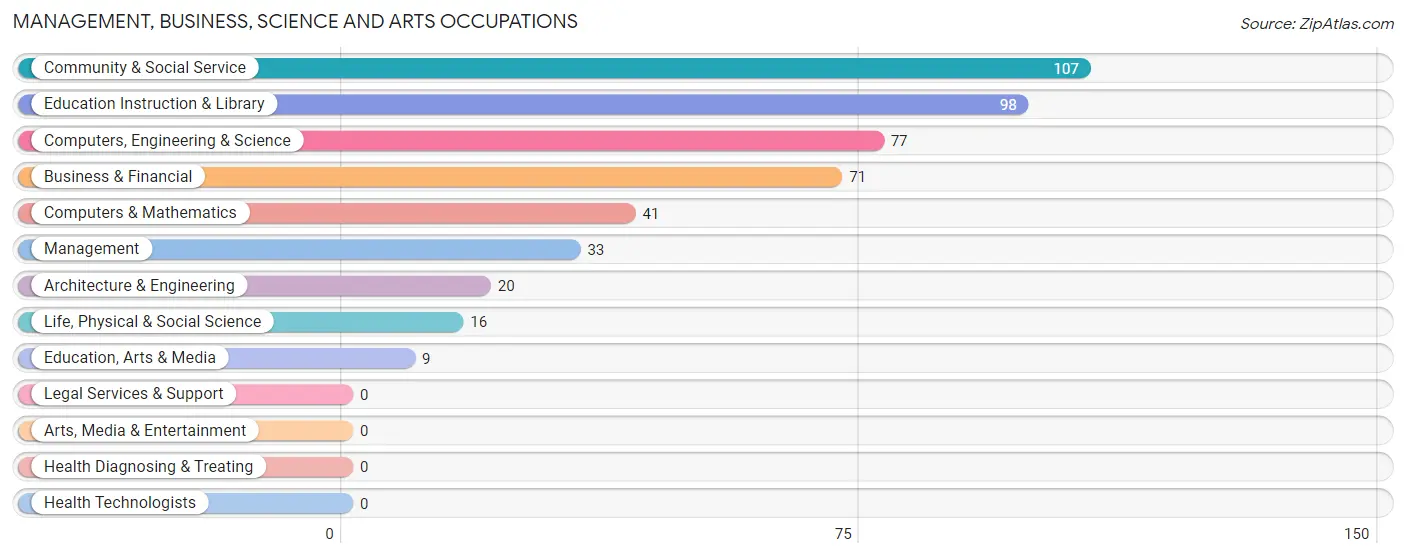
Management, Business, Science and Arts Occupations by Sex
Within the Management, Business, Science and Arts occupations in Sedley, the most male-oriented occupations are Business & Financial (100.0%), Computers, Engineering & Science (100.0%), and Computers & Mathematics (100.0%), while the most female-oriented occupations are Community & Social Service (100.0%), Education, Arts & Media (100.0%), and Education Instruction & Library (100.0%).
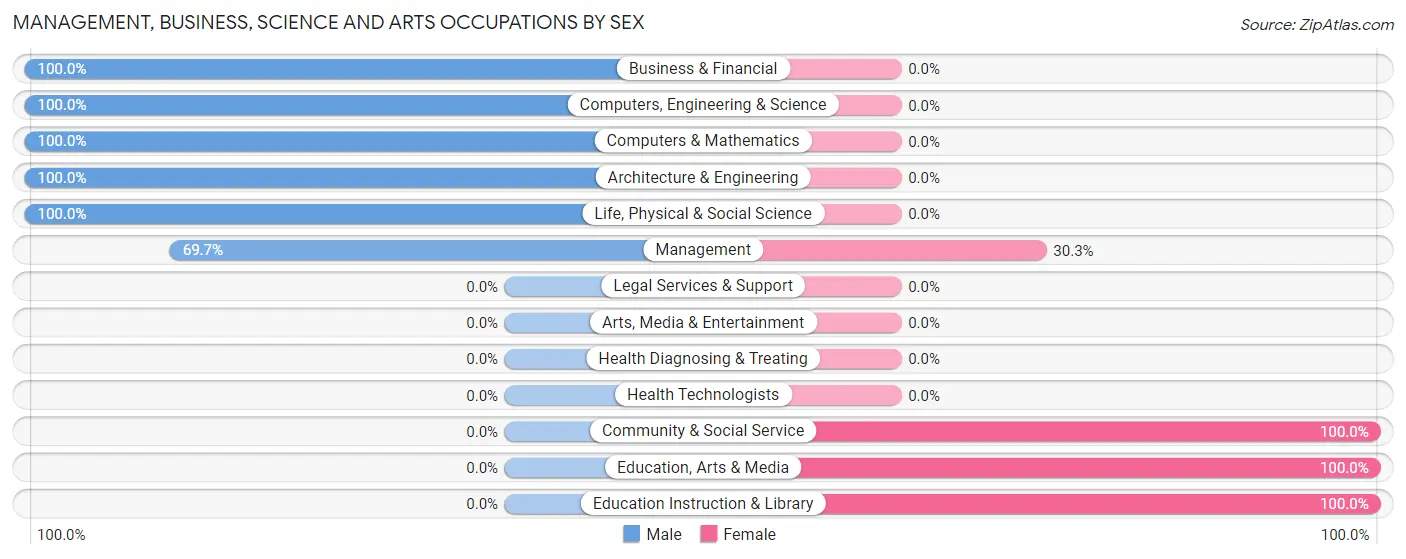
| Occupation | Male | Female |
| Management | 23 (69.7%) | 10 (30.3%) |
| Business & Financial | 71 (100.0%) | 0 (0.0%) |
| Computers, Engineering & Science | 77 (100.0%) | 0 (0.0%) |
| Computers & Mathematics | 41 (100.0%) | 0 (0.0%) |
| Architecture & Engineering | 20 (100.0%) | 0 (0.0%) |
| Life, Physical & Social Science | 16 (100.0%) | 0 (0.0%) |
| Community & Social Service | 0 (0.0%) | 107 (100.0%) |
| Education, Arts & Media | 0 (0.0%) | 9 (100.0%) |
| Legal Services & Support | 0 (0.0%) | 0 (0.0%) |
| Education Instruction & Library | 0 (0.0%) | 98 (100.0%) |
| Arts, Media & Entertainment | 0 (0.0%) | 0 (0.0%) |
| Health Diagnosing & Treating | 0 (0.0%) | 0 (0.0%) |
| Health Technologists | 0 (0.0%) | 0 (0.0%) |
| Total (Category) | 171 (59.4%) | 117 (40.6%) |
| Total (Overall) | 208 (58.3%) | 149 (41.7%) |
Services Occupations
The most common Services occupations in Sedley are Security & Protection (9 | 2.5%), and Firefighting & Prevention (9 | 2.5%).
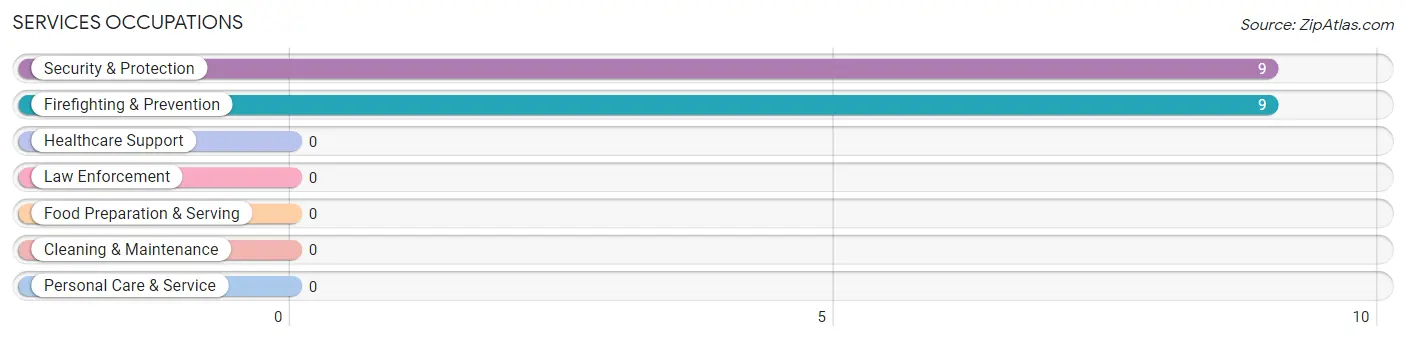
Services Occupations by Sex
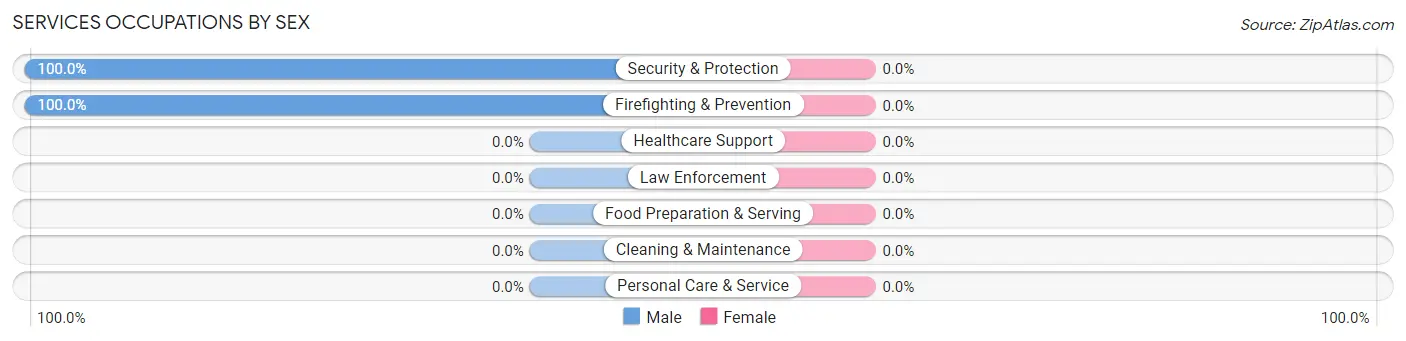
| Occupation | Male | Female |
| Healthcare Support | 0 (0.0%) | 0 (0.0%) |
| Security & Protection | 9 (100.0%) | 0 (0.0%) |
| Firefighting & Prevention | 9 (100.0%) | 0 (0.0%) |
| Law Enforcement | 0 (0.0%) | 0 (0.0%) |
| Food Preparation & Serving | 0 (0.0%) | 0 (0.0%) |
| Cleaning & Maintenance | 0 (0.0%) | 0 (0.0%) |
| Personal Care & Service | 0 (0.0%) | 0 (0.0%) |
| Total (Category) | 9 (100.0%) | 0 (0.0%) |
| Total (Overall) | 208 (58.3%) | 149 (41.7%) |
Sales and Office Occupations
The most common Sales and Office occupations in Sedley are Office & Administration (19 | 5.3%), and Sales & Related (16 | 4.5%).
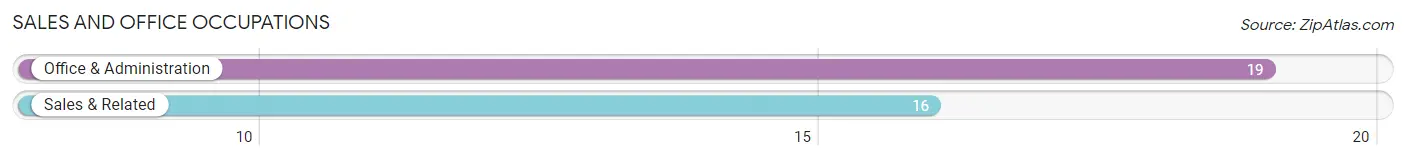
Sales and Office Occupations by Sex
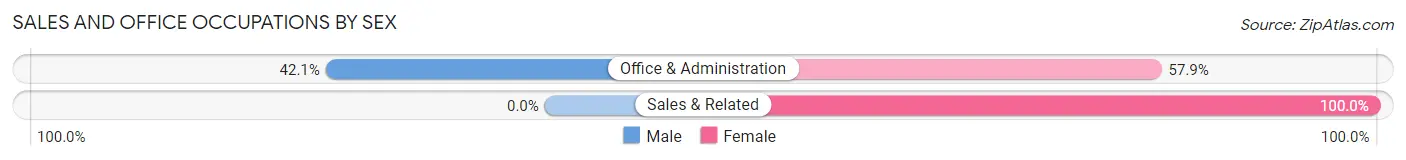
| Occupation | Male | Female |
| Sales & Related | 0 (0.0%) | 16 (100.0%) |
| Office & Administration | 8 (42.1%) | 11 (57.9%) |
| Total (Category) | 8 (22.9%) | 27 (77.1%) |
| Total (Overall) | 208 (58.3%) | 149 (41.7%) |
Natural Resources, Construction and Maintenance Occupations
The most common Natural Resources, Construction and Maintenance occupations in Sedley are , and Installation, Maintenance & Repair (9 | 2.5%).
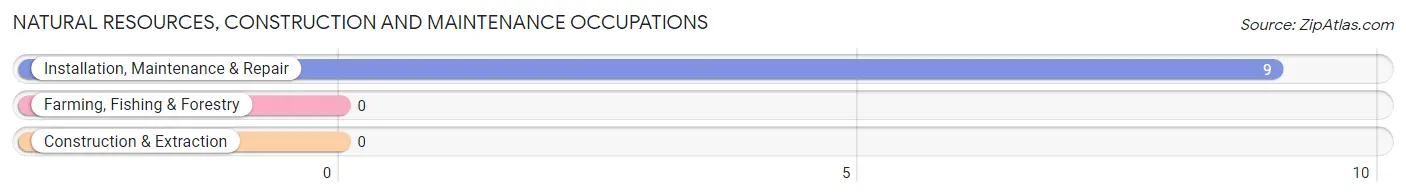
Natural Resources, Construction and Maintenance Occupations by Sex
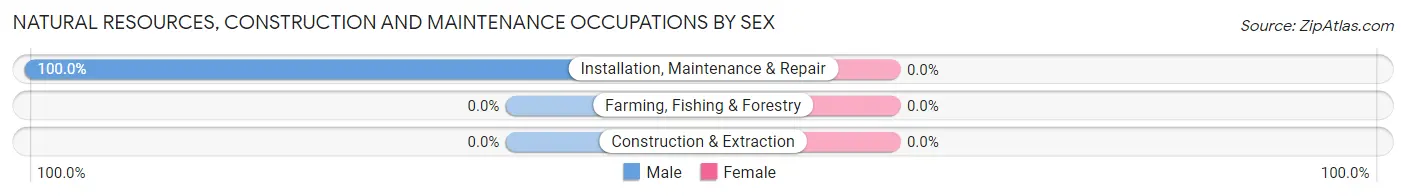
| Occupation | Male | Female |
| Farming, Fishing & Forestry | 0 (0.0%) | 0 (0.0%) |
| Construction & Extraction | 0 (0.0%) | 0 (0.0%) |
| Installation, Maintenance & Repair | 9 (100.0%) | 0 (0.0%) |
| Total (Category) | 9 (100.0%) | 0 (0.0%) |
| Total (Overall) | 208 (58.3%) | 149 (41.7%) |
Production, Transportation and Moving Occupations
The most common Production, Transportation and Moving occupations in Sedley are , and Transportation (16 | 4.5%).
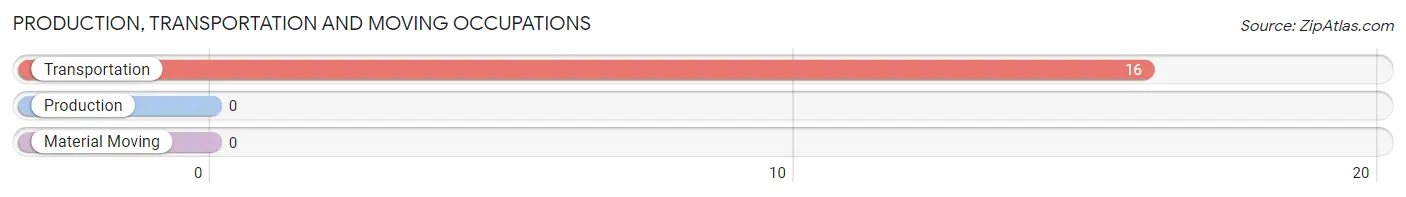
Production, Transportation and Moving Occupations by Sex
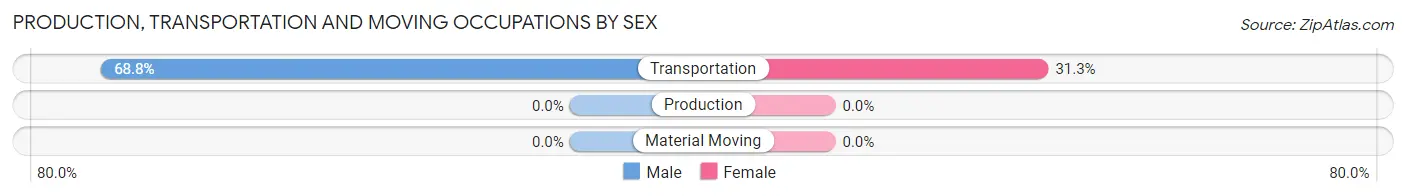
| Occupation | Male | Female |
| Production | 0 (0.0%) | 0 (0.0%) |
| Transportation | 11 (68.8%) | 5 (31.2%) |
| Material Moving | 0 (0.0%) | 0 (0.0%) |
| Total (Category) | 11 (68.8%) | 5 (31.2%) |
| Total (Overall) | 208 (58.3%) | 149 (41.7%) |
Employment Industries by Sex in Sedley
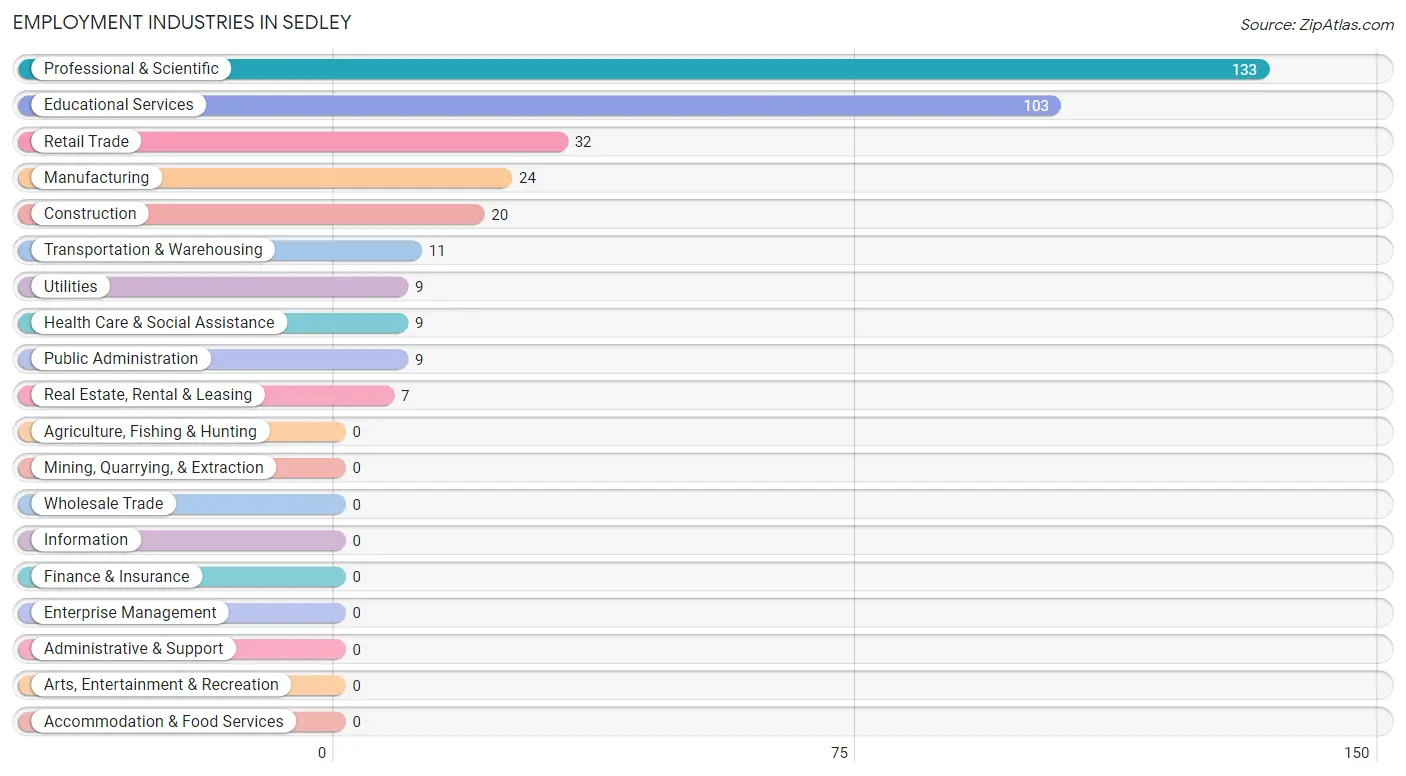
Employment Industries in Sedley
The major employment industries in Sedley include Professional & Scientific (133 | 37.2%), Educational Services (103 | 28.8%), Retail Trade (32 | 9.0%), Manufacturing (24 | 6.7%), and Construction (20 | 5.6%).
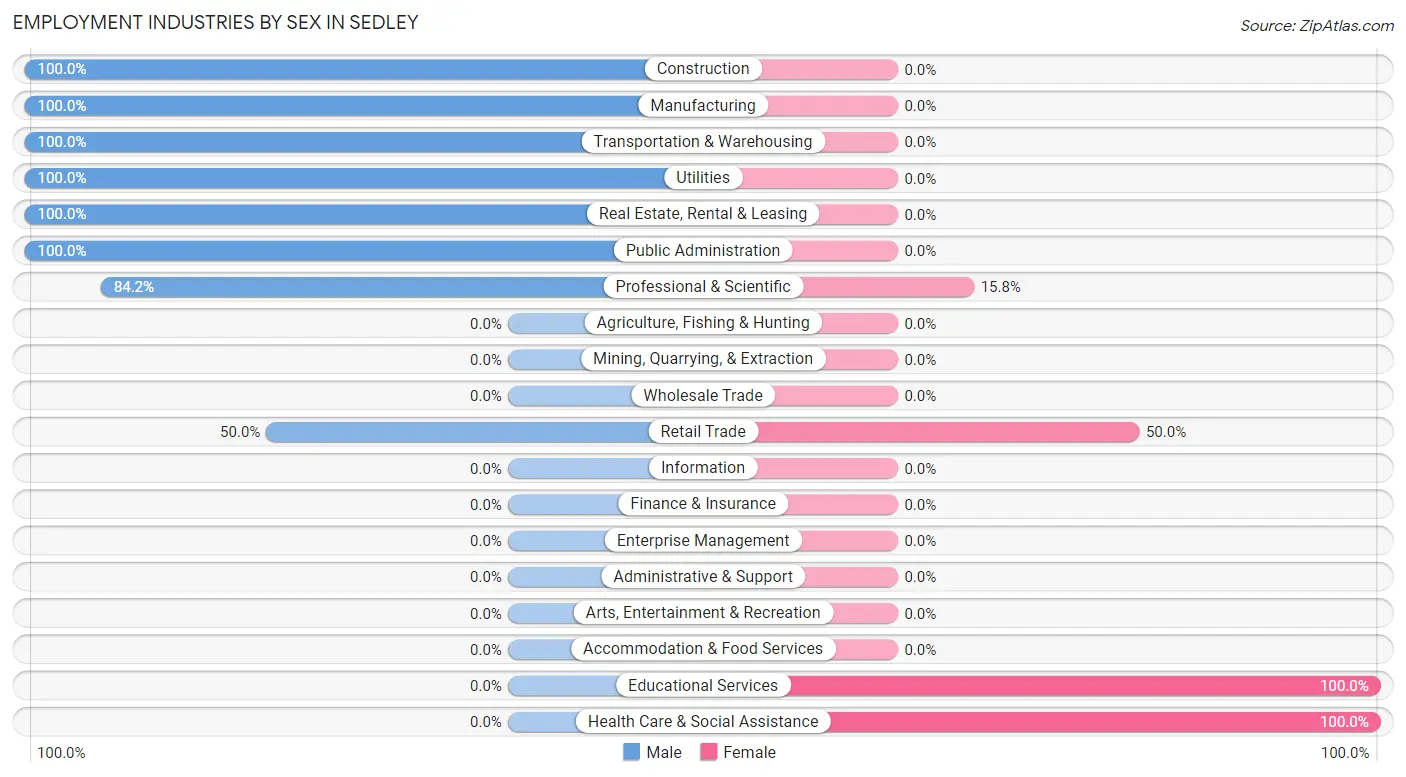
Employment Industries by Sex in Sedley
The Sedley industries that see more men than women are Construction (100.0%), Manufacturing (100.0%), and Transportation & Warehousing (100.0%), whereas the industries that tend to have a higher number of women are Educational Services (100.0%), Health Care & Social Assistance (100.0%), and Retail Trade (50.0%).
| Industry | Male | Female |
| Agriculture, Fishing & Hunting | 0 (0.0%) | 0 (0.0%) |
| Mining, Quarrying, & Extraction | 0 (0.0%) | 0 (0.0%) |
| Construction | 20 (100.0%) | 0 (0.0%) |
| Manufacturing | 24 (100.0%) | 0 (0.0%) |
| Wholesale Trade | 0 (0.0%) | 0 (0.0%) |
| Retail Trade | 16 (50.0%) | 16 (50.0%) |
| Transportation & Warehousing | 11 (100.0%) | 0 (0.0%) |
| Utilities | 9 (100.0%) | 0 (0.0%) |
| Information | 0 (0.0%) | 0 (0.0%) |
| Finance & Insurance | 0 (0.0%) | 0 (0.0%) |
| Real Estate, Rental & Leasing | 7 (100.0%) | 0 (0.0%) |
| Professional & Scientific | 112 (84.2%) | 21 (15.8%) |
| Enterprise Management | 0 (0.0%) | 0 (0.0%) |
| Administrative & Support | 0 (0.0%) | 0 (0.0%) |
| Educational Services | 0 (0.0%) | 103 (100.0%) |
| Health Care & Social Assistance | 0 (0.0%) | 9 (100.0%) |
| Arts, Entertainment & Recreation | 0 (0.0%) | 0 (0.0%) |
| Accommodation & Food Services | 0 (0.0%) | 0 (0.0%) |
| Public Administration | 9 (100.0%) | 0 (0.0%) |
| Total | 208 (58.3%) | 149 (41.7%) |
Education in Sedley
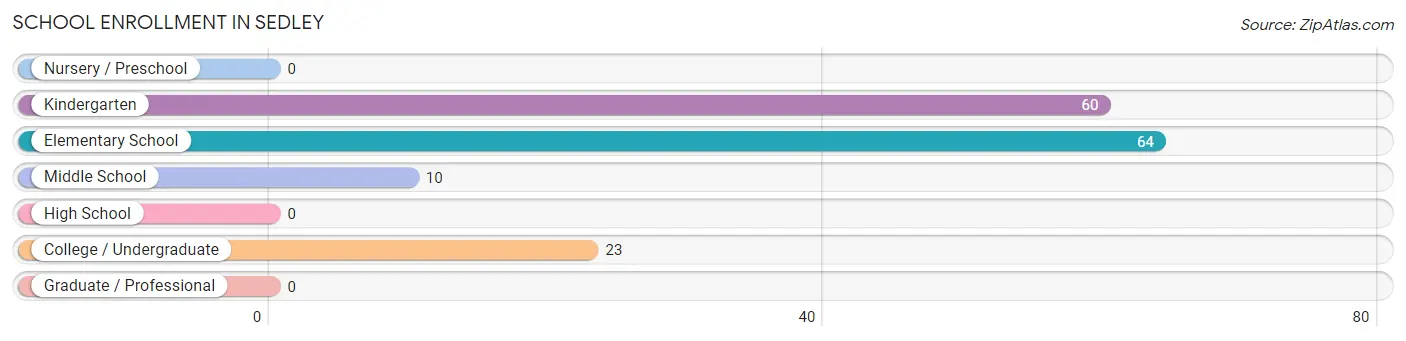
School Enrollment in Sedley
The most common levels of schooling among the 157 students in Sedley are elementary school (64 | 40.8%), kindergarten (60 | 38.2%), and college / undergraduate (23 | 14.6%).
| School Level | # Students | % Students |
| Nursery / Preschool | 0 | 0.0% |
| Kindergarten | 60 | 38.2% |
| Elementary School | 64 | 40.8% |
| Middle School | 10 | 6.4% |
| High School | 0 | 0.0% |
| College / Undergraduate | 23 | 14.6% |
| Graduate / Professional | 0 | 0.0% |
| Total | 157 | 100.0% |
School Enrollment by Age by Funding Source in Sedley
Out of a total of 157 students who are enrolled in schools in Sedley, 56 (35.7%) attend a private institution, while the remaining 101 (64.3%) are enrolled in public schools. The age group of 5 to 9 year old has the highest likelihood of being enrolled in private schools, with 56 (45.2% in the age bracket) enrolled. Conversely, the age group of 10 to 14 year olds has the lowest likelihood of being enrolled in a private school, with 10 (100.0% in the age bracket) attending a public institution.
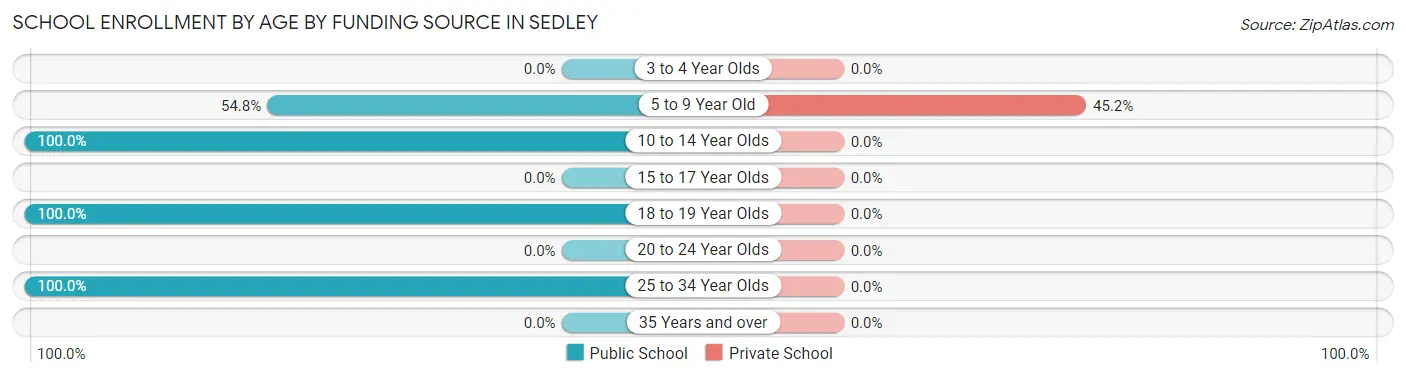
| Age Bracket | Public School | Private School |
| 3 to 4 Year Olds | 0 (0.0%) | 0 (0.0%) |
| 5 to 9 Year Old | 68 (54.8%) | 56 (45.2%) |
| 10 to 14 Year Olds | 10 (100.0%) | 0 (0.0%) |
| 15 to 17 Year Olds | 0 (0.0%) | 0 (0.0%) |
| 18 to 19 Year Olds | 16 (100.0%) | 0 (0.0%) |
| 20 to 24 Year Olds | 0 (0.0%) | 0 (0.0%) |
| 25 to 34 Year Olds | 7 (100.0%) | 0 (0.0%) |
| 35 Years and over | 0 (0.0%) | 0 (0.0%) |
| Total | 101 (64.3%) | 56 (35.7%) |
Educational Attainment by Field of Study in Sedley
Visual & performing arts (79 | 41.4%), science & technology (41 | 21.5%), education (36 | 18.9%), arts & humanities (20 | 10.5%), and business (15 | 7.9%) are the most common fields of study among 191 individuals in Sedley who have obtained a bachelor's degree or higher.
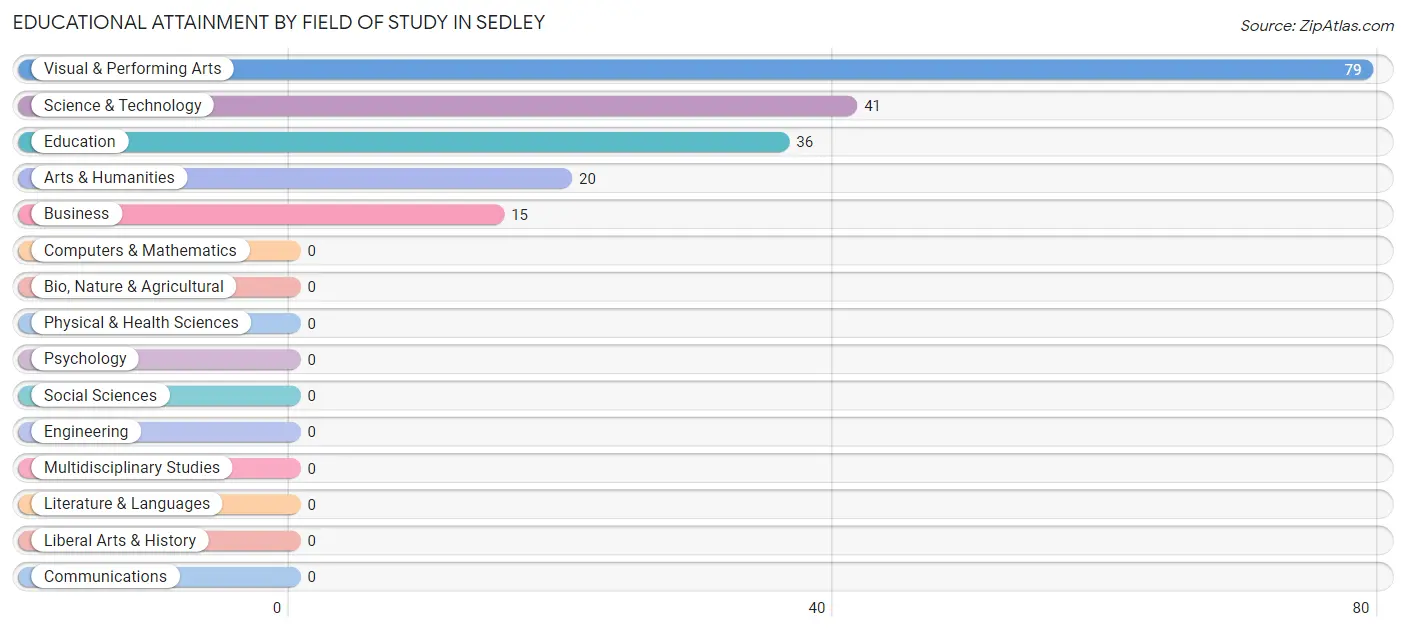
| Field of Study | # Graduates | % Graduates |
| Computers & Mathematics | 0 | 0.0% |
| Bio, Nature & Agricultural | 0 | 0.0% |
| Physical & Health Sciences | 0 | 0.0% |
| Psychology | 0 | 0.0% |
| Social Sciences | 0 | 0.0% |
| Engineering | 0 | 0.0% |
| Multidisciplinary Studies | 0 | 0.0% |
| Science & Technology | 41 | 21.5% |
| Business | 15 | 7.9% |
| Education | 36 | 18.9% |
| Literature & Languages | 0 | 0.0% |
| Liberal Arts & History | 0 | 0.0% |
| Visual & Performing Arts | 79 | 41.4% |
| Communications | 0 | 0.0% |
| Arts & Humanities | 20 | 10.5% |
| Total | 191 | 100.0% |
Transportation & Commute in Sedley
Vehicle Availability by Sex in Sedley
The most prevalent vehicle ownership categories in Sedley are males with 2 vehicles (119, accounting for 57.2%) and females with 2 vehicles (97, making up 79.9%).
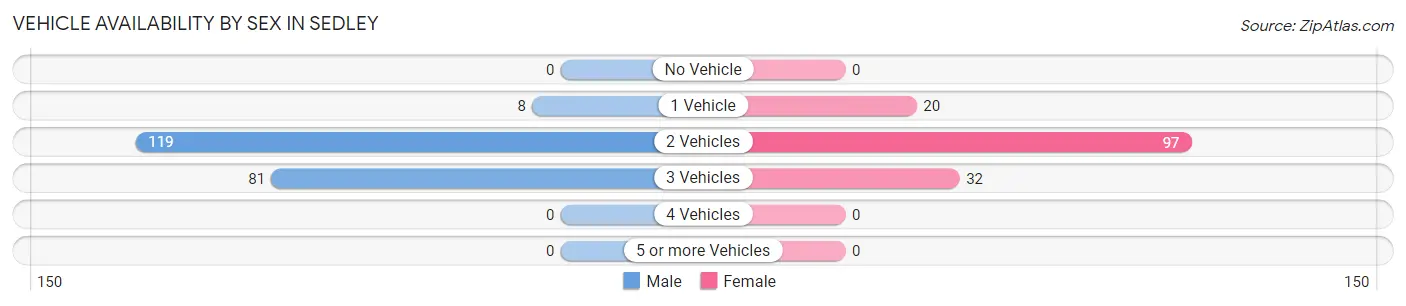
| Vehicles Available | Male | Female |
| No Vehicle | 0 (0.0%) | 0 (0.0%) |
| 1 Vehicle | 8 (3.8%) | 20 (13.4%) |
| 2 Vehicles | 119 (57.2%) | 97 (65.1%) |
| 3 Vehicles | 81 (38.9%) | 32 (21.5%) |
| 4 Vehicles | 0 (0.0%) | 0 (0.0%) |
| 5 or more Vehicles | 0 (0.0%) | 0 (0.0%) |
| Total | 208 (100.0%) | 149 (100.0%) |
Commute Time in Sedley
The most frequently occuring commute durations in Sedley are 10 to 14 minutes (79 commuters, 22.6%), 45 to 59 minutes (71 commuters, 20.3%), and 15 to 19 minutes (52 commuters, 14.9%).
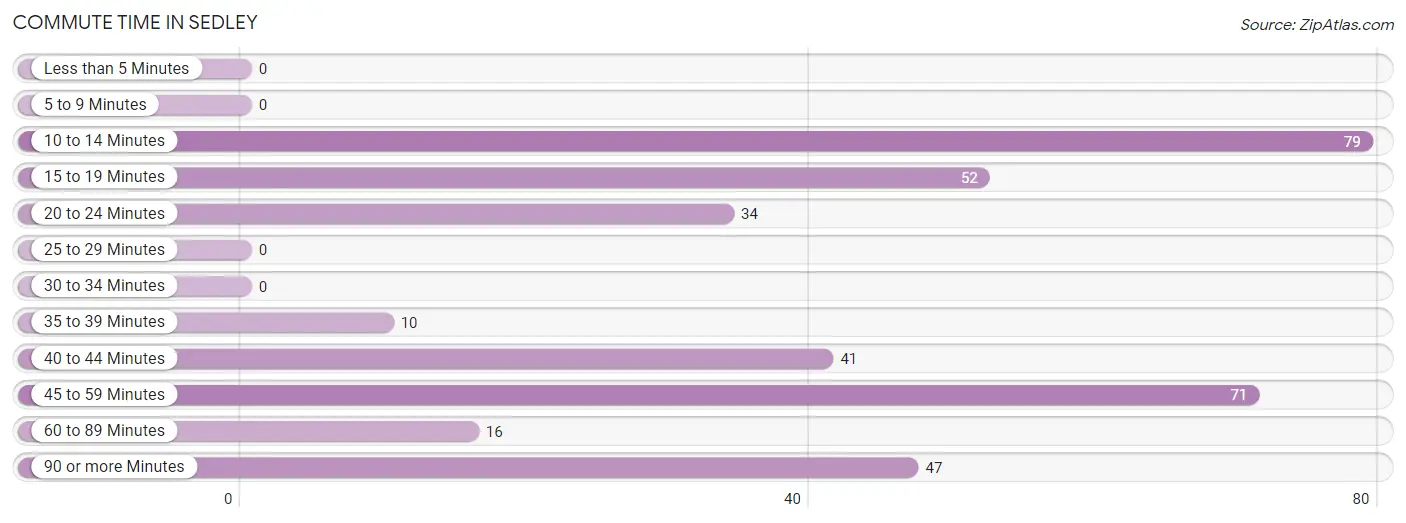
| Commute Time | # Commuters | % Commuters |
| Less than 5 Minutes | 0 | 0.0% |
| 5 to 9 Minutes | 0 | 0.0% |
| 10 to 14 Minutes | 79 | 22.6% |
| 15 to 19 Minutes | 52 | 14.9% |
| 20 to 24 Minutes | 34 | 9.7% |
| 25 to 29 Minutes | 0 | 0.0% |
| 30 to 34 Minutes | 0 | 0.0% |
| 35 to 39 Minutes | 10 | 2.9% |
| 40 to 44 Minutes | 41 | 11.7% |
| 45 to 59 Minutes | 71 | 20.3% |
| 60 to 89 Minutes | 16 | 4.6% |
| 90 or more Minutes | 47 | 13.4% |
Commute Time by Sex in Sedley
The most common commute times in Sedley are 45 to 59 minutes (71 commuters, 35.3%) for males and 10 to 14 minutes (71 commuters, 47.6%) for females.
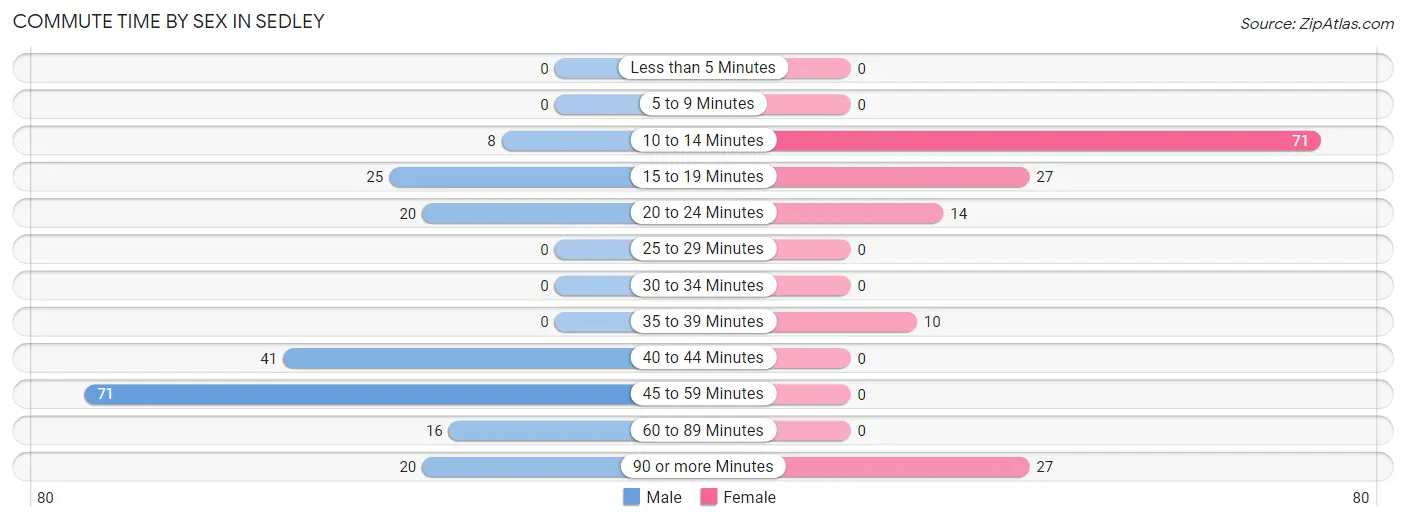
| Commute Time | Male | Female |
| Less than 5 Minutes | 0 (0.0%) | 0 (0.0%) |
| 5 to 9 Minutes | 0 (0.0%) | 0 (0.0%) |
| 10 to 14 Minutes | 8 (4.0%) | 71 (47.6%) |
| 15 to 19 Minutes | 25 (12.4%) | 27 (18.1%) |
| 20 to 24 Minutes | 20 (10.0%) | 14 (9.4%) |
| 25 to 29 Minutes | 0 (0.0%) | 0 (0.0%) |
| 30 to 34 Minutes | 0 (0.0%) | 0 (0.0%) |
| 35 to 39 Minutes | 0 (0.0%) | 10 (6.7%) |
| 40 to 44 Minutes | 41 (20.4%) | 0 (0.0%) |
| 45 to 59 Minutes | 71 (35.3%) | 0 (0.0%) |
| 60 to 89 Minutes | 16 (8.0%) | 0 (0.0%) |
| 90 or more Minutes | 20 (10.0%) | 27 (18.1%) |
Time of Departure to Work by Sex in Sedley
The most frequent times of departure to work in Sedley are 6:30 AM to 6:59 AM (88, 43.8%) for males and 8:00 AM to 8:29 AM (71, 47.6%) for females.
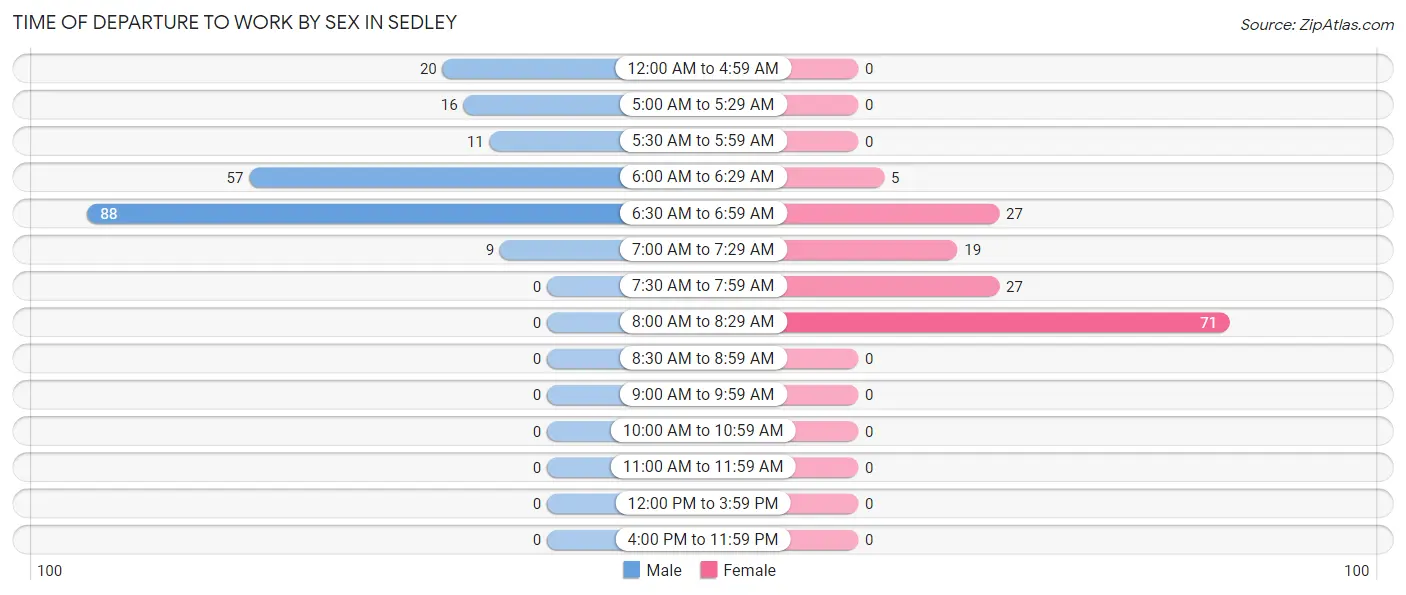
| Time of Departure | Male | Female |
| 12:00 AM to 4:59 AM | 20 (10.0%) | 0 (0.0%) |
| 5:00 AM to 5:29 AM | 16 (8.0%) | 0 (0.0%) |
| 5:30 AM to 5:59 AM | 11 (5.5%) | 0 (0.0%) |
| 6:00 AM to 6:29 AM | 57 (28.4%) | 5 (3.4%) |
| 6:30 AM to 6:59 AM | 88 (43.8%) | 27 (18.1%) |
| 7:00 AM to 7:29 AM | 9 (4.5%) | 19 (12.8%) |
| 7:30 AM to 7:59 AM | 0 (0.0%) | 27 (18.1%) |
| 8:00 AM to 8:29 AM | 0 (0.0%) | 71 (47.6%) |
| 8:30 AM to 8:59 AM | 0 (0.0%) | 0 (0.0%) |
| 9:00 AM to 9:59 AM | 0 (0.0%) | 0 (0.0%) |
| 10:00 AM to 10:59 AM | 0 (0.0%) | 0 (0.0%) |
| 11:00 AM to 11:59 AM | 0 (0.0%) | 0 (0.0%) |
| 12:00 PM to 3:59 PM | 0 (0.0%) | 0 (0.0%) |
| 4:00 PM to 11:59 PM | 0 (0.0%) | 0 (0.0%) |
| Total | 201 (100.0%) | 149 (100.0%) |
Housing Occupancy in Sedley
Occupancy by Ownership in Sedley
Of the total 289 dwellings in Sedley, owner-occupied units account for 280 (96.9%), while renter-occupied units make up 9 (3.1%).
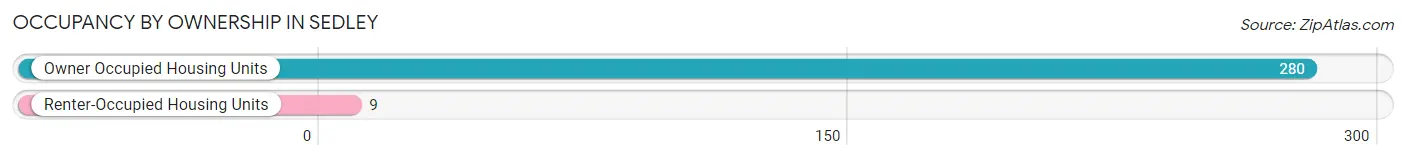
| Occupancy | # Housing Units | % Housing Units |
| Owner Occupied Housing Units | 280 | 96.9% |
| Renter-Occupied Housing Units | 9 | 3.1% |
| Total Occupied Housing Units | 289 | 100.0% |
Occupancy by Household Size in Sedley
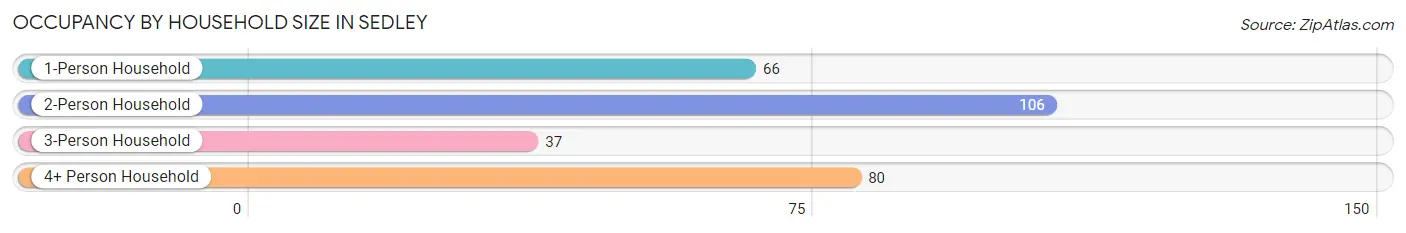
| Household Size | # Housing Units | % Housing Units |
| 1-Person Household | 66 | 22.8% |
| 2-Person Household | 106 | 36.7% |
| 3-Person Household | 37 | 12.8% |
| 4+ Person Household | 80 | 27.7% |
| Total Housing Units | 289 | 100.0% |
Occupancy by Ownership by Household Size in Sedley
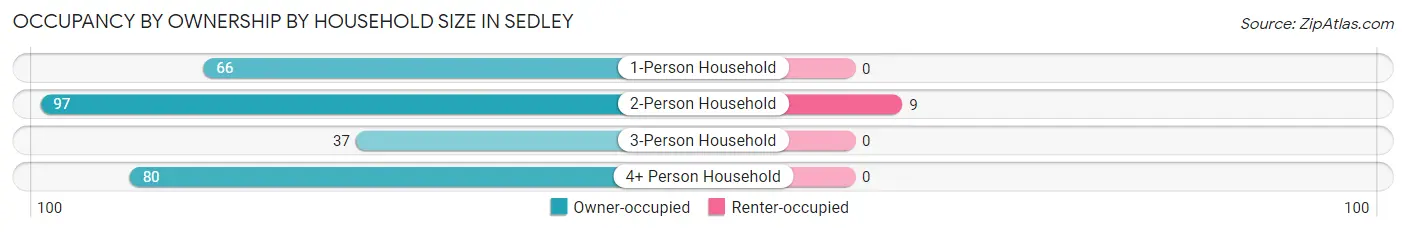
| Household Size | Owner-occupied | Renter-occupied |
| 1-Person Household | 66 (100.0%) | 0 (0.0%) |
| 2-Person Household | 97 (91.5%) | 9 (8.5%) |
| 3-Person Household | 37 (100.0%) | 0 (0.0%) |
| 4+ Person Household | 80 (100.0%) | 0 (0.0%) |
| Total Housing Units | 280 (96.9%) | 9 (3.1%) |
Occupancy by Educational Attainment in Sedley
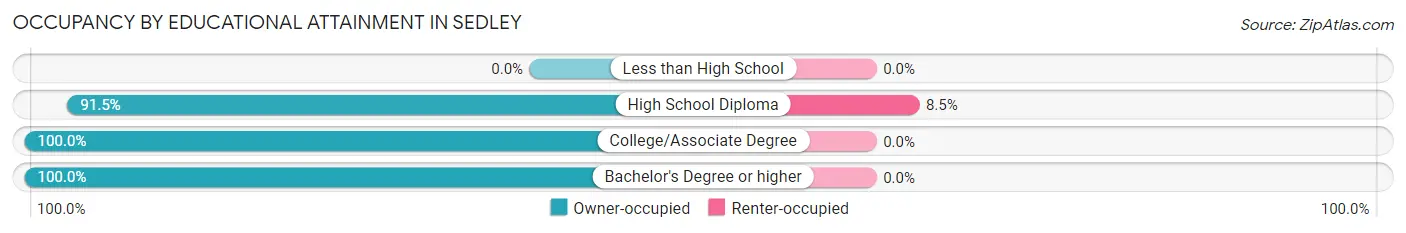
| Household Size | Owner-occupied | Renter-occupied |
| Less than High School | 0 (0.0%) | 0 (0.0%) |
| High School Diploma | 97 (91.5%) | 9 (8.5%) |
| College/Associate Degree | 92 (100.0%) | 0 (0.0%) |
| Bachelor's Degree or higher | 91 (100.0%) | 0 (0.0%) |
Occupancy by Age of Householder in Sedley
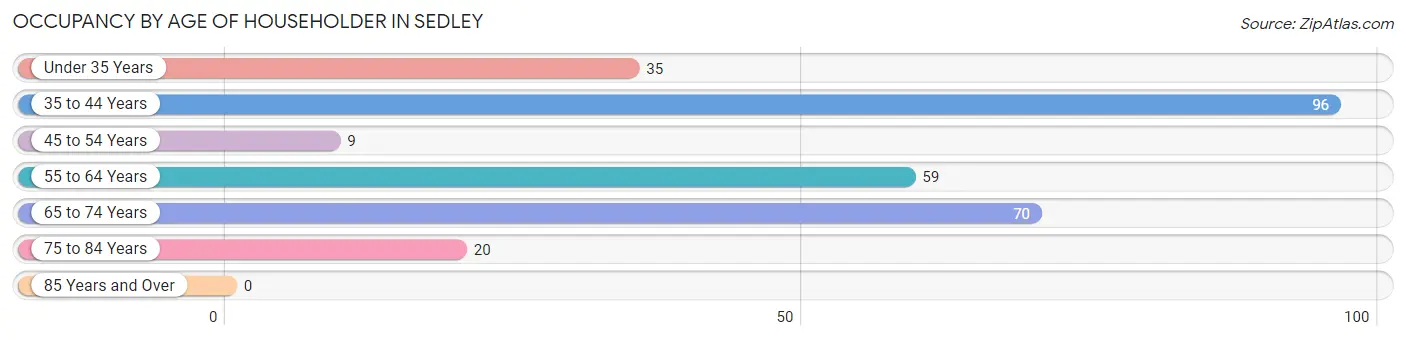
| Age Bracket | # Households | % Households |
| Under 35 Years | 35 | 12.1% |
| 35 to 44 Years | 96 | 33.2% |
| 45 to 54 Years | 9 | 3.1% |
| 55 to 64 Years | 59 | 20.4% |
| 65 to 74 Years | 70 | 24.2% |
| 75 to 84 Years | 20 | 6.9% |
| 85 Years and Over | 0 | 0.0% |
| Total | 289 | 100.0% |
Housing Finances in Sedley
Median Income by Occupancy in Sedley
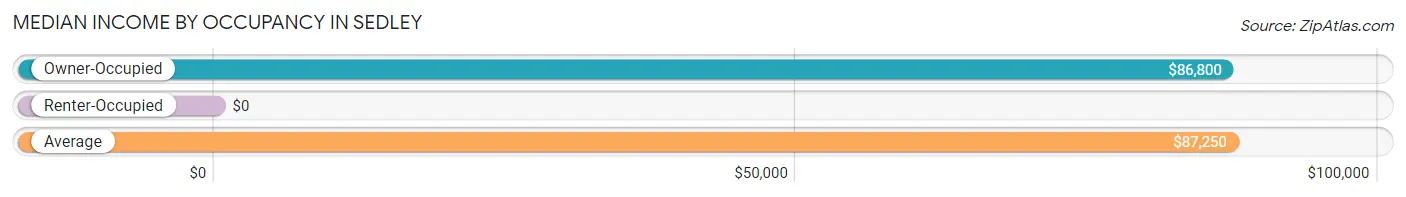
| Occupancy Type | # Households | Median Income |
| Owner-Occupied | 280 (96.9%) | $86,800 |
| Renter-Occupied | 9 (3.1%) | $0 |
| Average | 289 (100.0%) | $87,250 |
Occupancy by Householder Income Bracket in Sedley
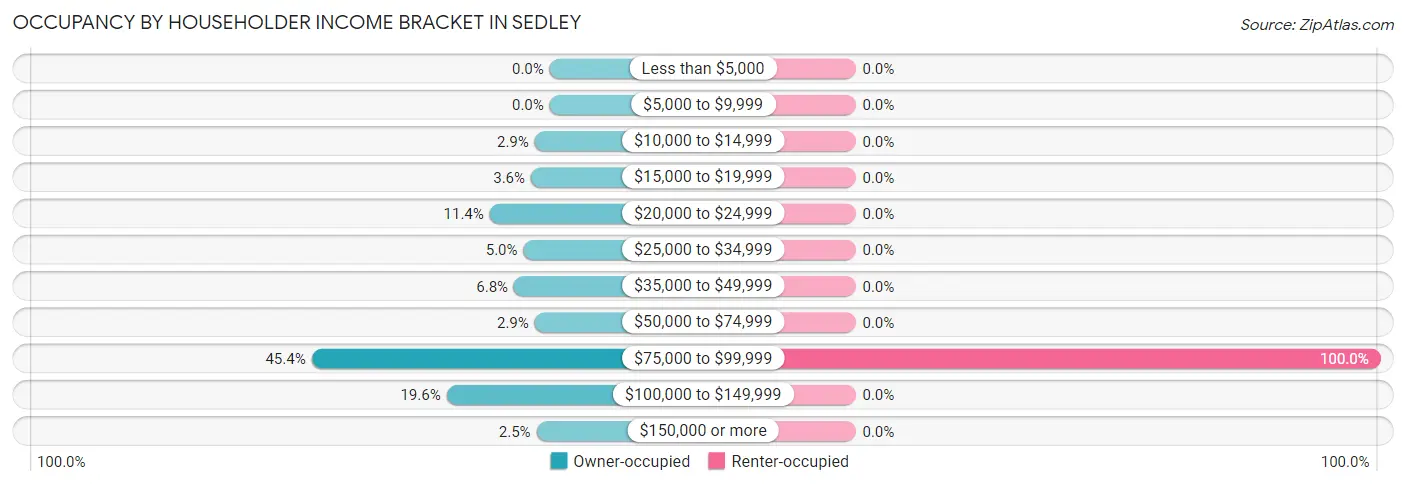
| Income Bracket | Owner-occupied | Renter-occupied |
| Less than $5,000 | 0 (0.0%) | 0 (0.0%) |
| $5,000 to $9,999 | 0 (0.0%) | 0 (0.0%) |
| $10,000 to $14,999 | 8 (2.9%) | 0 (0.0%) |
| $15,000 to $19,999 | 10 (3.6%) | 0 (0.0%) |
| $20,000 to $24,999 | 32 (11.4%) | 0 (0.0%) |
| $25,000 to $34,999 | 14 (5.0%) | 0 (0.0%) |
| $35,000 to $49,999 | 19 (6.8%) | 0 (0.0%) |
| $50,000 to $74,999 | 8 (2.9%) | 0 (0.0%) |
| $75,000 to $99,999 | 127 (45.4%) | 9 (100.0%) |
| $100,000 to $149,999 | 55 (19.6%) | 0 (0.0%) |
| $150,000 or more | 7 (2.5%) | 0 (0.0%) |
| Total | 280 (100.0%) | 9 (100.0%) |
Monthly Housing Cost Tiers in Sedley
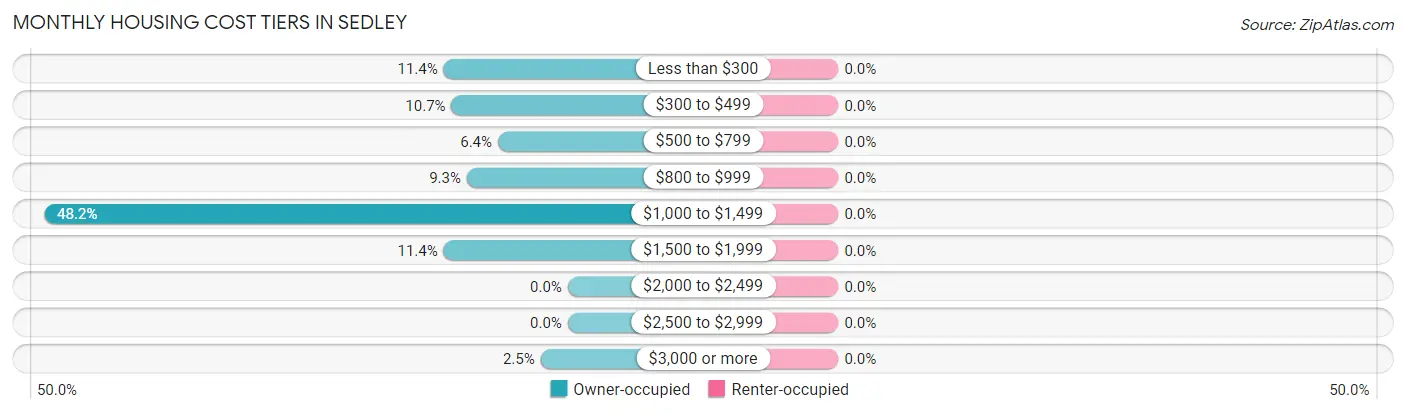
| Monthly Cost | Owner-occupied | Renter-occupied |
| Less than $300 | 32 (11.4%) | 0 (0.0%) |
| $300 to $499 | 30 (10.7%) | 0 (0.0%) |
| $500 to $799 | 18 (6.4%) | 0 (0.0%) |
| $800 to $999 | 26 (9.3%) | 0 (0.0%) |
| $1,000 to $1,499 | 135 (48.2%) | 0 (0.0%) |
| $1,500 to $1,999 | 32 (11.4%) | 0 (0.0%) |
| $2,000 to $2,499 | 0 (0.0%) | 0 (0.0%) |
| $2,500 to $2,999 | 0 (0.0%) | 0 (0.0%) |
| $3,000 or more | 7 (2.5%) | 0 (0.0%) |
| Total | 280 (100.0%) | 9 (100.0%) |
Physical Housing Characteristics in Sedley
Housing Structures in Sedley
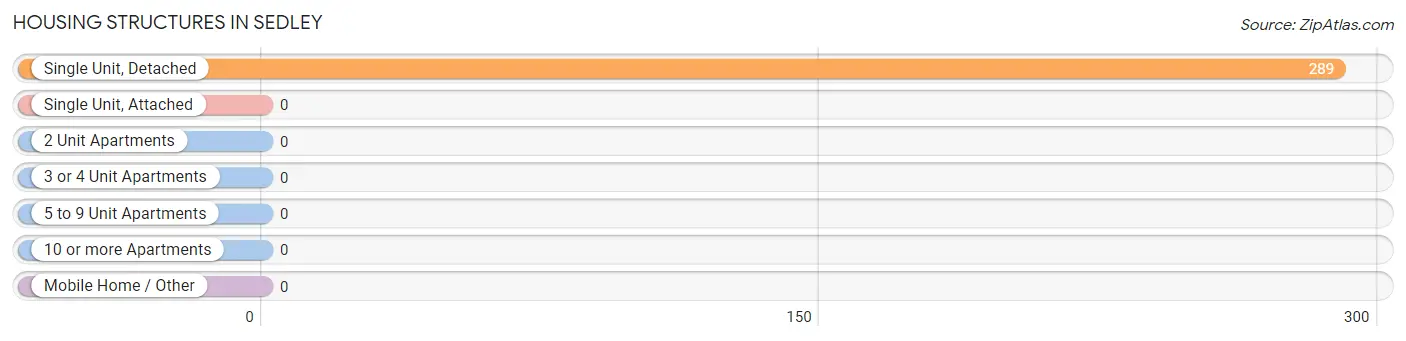
| Structure Type | # Housing Units | % Housing Units |
| Single Unit, Detached | 289 | 100.0% |
| Single Unit, Attached | 0 | 0.0% |
| 2 Unit Apartments | 0 | 0.0% |
| 3 or 4 Unit Apartments | 0 | 0.0% |
| 5 to 9 Unit Apartments | 0 | 0.0% |
| 10 or more Apartments | 0 | 0.0% |
| Mobile Home / Other | 0 | 0.0% |
| Total | 289 | 100.0% |
Housing Structures by Occupancy in Sedley
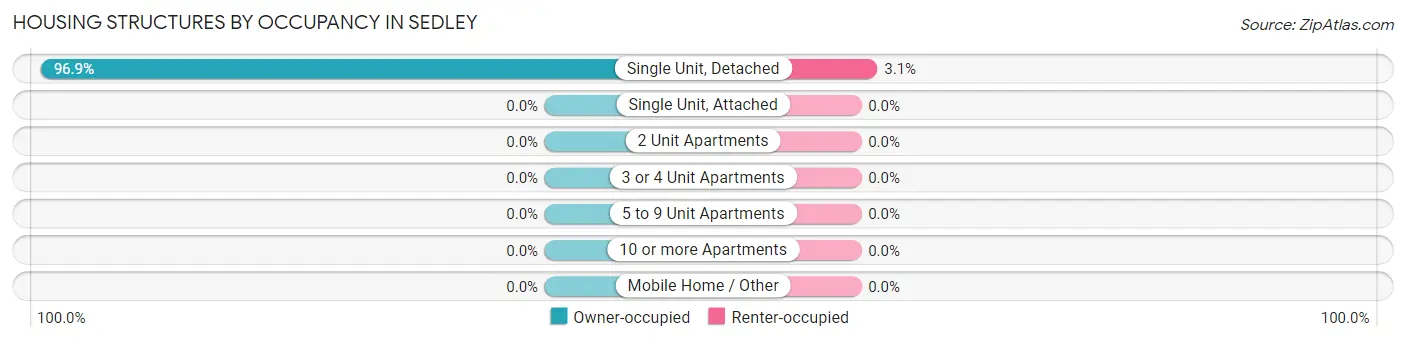
| Structure Type | Owner-occupied | Renter-occupied |
| Single Unit, Detached | 280 (96.9%) | 9 (3.1%) |
| Single Unit, Attached | 0 (0.0%) | 0 (0.0%) |
| 2 Unit Apartments | 0 (0.0%) | 0 (0.0%) |
| 3 or 4 Unit Apartments | 0 (0.0%) | 0 (0.0%) |
| 5 to 9 Unit Apartments | 0 (0.0%) | 0 (0.0%) |
| 10 or more Apartments | 0 (0.0%) | 0 (0.0%) |
| Mobile Home / Other | 0 (0.0%) | 0 (0.0%) |
| Total | 280 (96.9%) | 9 (3.1%) |
Housing Structures by Number of Rooms in Sedley
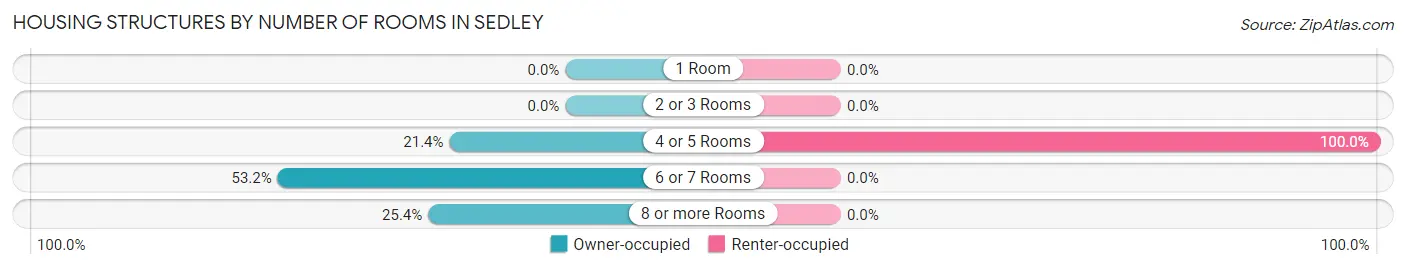
| Number of Rooms | Owner-occupied | Renter-occupied |
| 1 Room | 0 (0.0%) | 0 (0.0%) |
| 2 or 3 Rooms | 0 (0.0%) | 0 (0.0%) |
| 4 or 5 Rooms | 60 (21.4%) | 9 (100.0%) |
| 6 or 7 Rooms | 149 (53.2%) | 0 (0.0%) |
| 8 or more Rooms | 71 (25.4%) | 0 (0.0%) |
| Total | 280 (100.0%) | 9 (100.0%) |
Housing Structure by Heating Type in Sedley
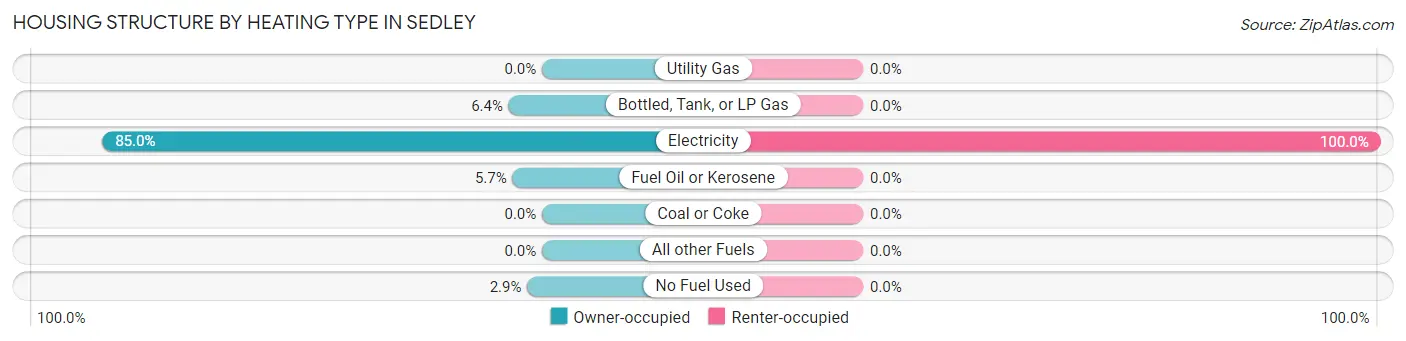
| Heating Type | Owner-occupied | Renter-occupied |
| Utility Gas | 0 (0.0%) | 0 (0.0%) |
| Bottled, Tank, or LP Gas | 18 (6.4%) | 0 (0.0%) |
| Electricity | 238 (85.0%) | 9 (100.0%) |
| Fuel Oil or Kerosene | 16 (5.7%) | 0 (0.0%) |
| Coal or Coke | 0 (0.0%) | 0 (0.0%) |
| All other Fuels | 0 (0.0%) | 0 (0.0%) |
| No Fuel Used | 8 (2.9%) | 0 (0.0%) |
| Total | 280 (100.0%) | 9 (100.0%) |
Household Vehicle Usage in Sedley
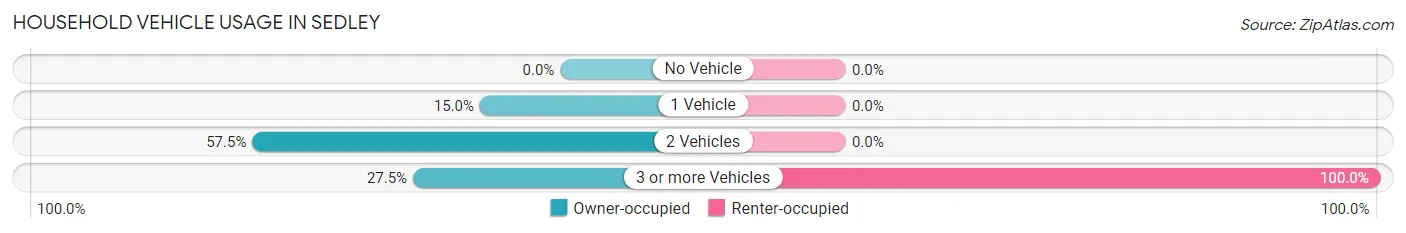
| Vehicles per Household | Owner-occupied | Renter-occupied |
| No Vehicle | 0 (0.0%) | 0 (0.0%) |
| 1 Vehicle | 42 (15.0%) | 0 (0.0%) |
| 2 Vehicles | 161 (57.5%) | 0 (0.0%) |
| 3 or more Vehicles | 77 (27.5%) | 9 (100.0%) |
| Total | 280 (100.0%) | 9 (100.0%) |
Real Estate & Mortgages in Sedley
Real Estate and Mortgage Overview in Sedley
| Characteristic | Without Mortgage | With Mortgage |
| Housing Units | 81 | 199 |
| Median Property Value | - | - |
| Median Household Income | - | - |
| Monthly Housing Costs | $314 | $7 |
| Real Estate Taxes | $857 | $0 |
Property Value by Mortgage Status in Sedley
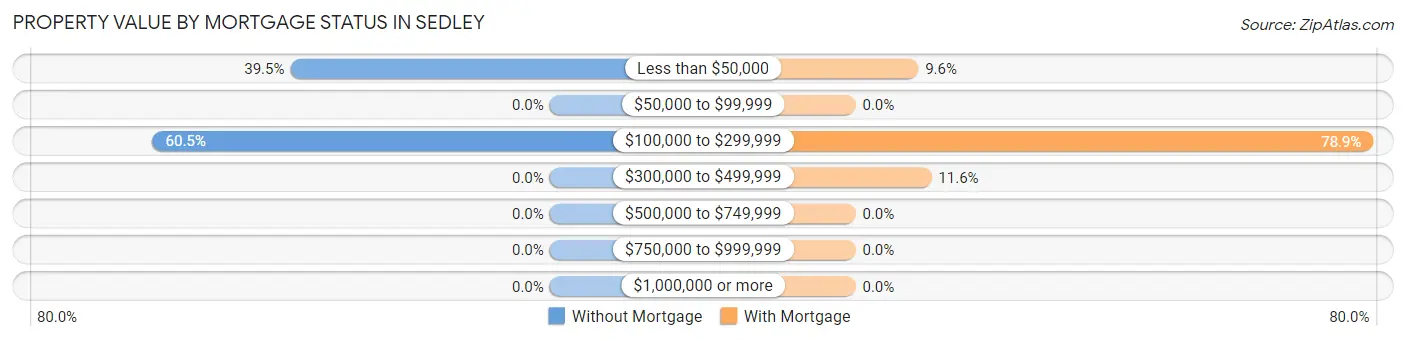
| Property Value | Without Mortgage | With Mortgage |
| Less than $50,000 | 32 (39.5%) | 19 (9.6%) |
| $50,000 to $99,999 | 0 (0.0%) | 0 (0.0%) |
| $100,000 to $299,999 | 49 (60.5%) | 157 (78.9%) |
| $300,000 to $499,999 | 0 (0.0%) | 23 (11.6%) |
| $500,000 to $749,999 | 0 (0.0%) | 0 (0.0%) |
| $750,000 to $999,999 | 0 (0.0%) | 0 (0.0%) |
| $1,000,000 or more | 0 (0.0%) | 0 (0.0%) |
| Total | 81 (100.0%) | 199 (100.0%) |
Household Income by Mortgage Status in Sedley
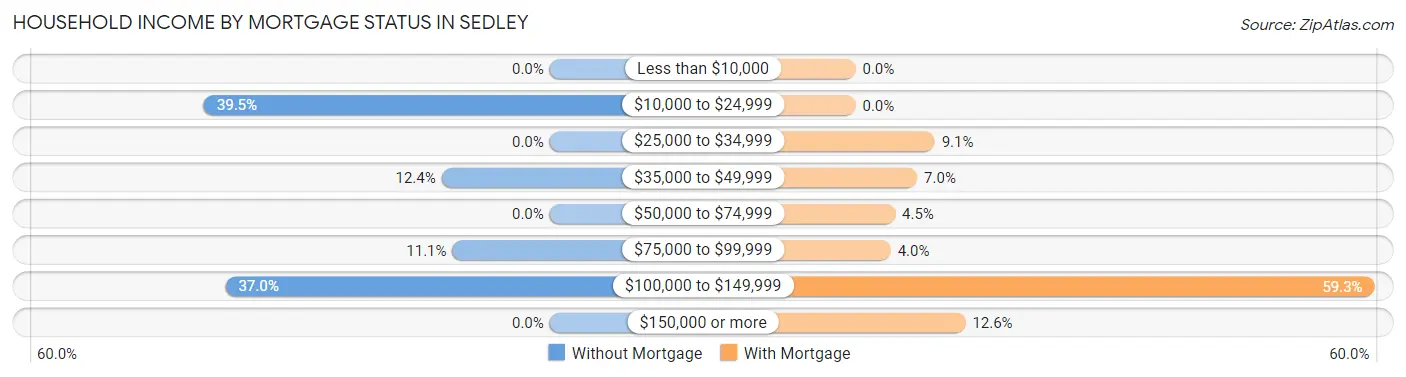
| Household Income | Without Mortgage | With Mortgage |
| Less than $10,000 | 0 (0.0%) | 0 (0.0%) |
| $10,000 to $24,999 | 32 (39.5%) | 0 (0.0%) |
| $25,000 to $34,999 | 0 (0.0%) | 18 (9.0%) |
| $35,000 to $49,999 | 10 (12.3%) | 14 (7.0%) |
| $50,000 to $74,999 | 0 (0.0%) | 9 (4.5%) |
| $75,000 to $99,999 | 9 (11.1%) | 8 (4.0%) |
| $100,000 to $149,999 | 30 (37.0%) | 118 (59.3%) |
| $150,000 or more | 0 (0.0%) | 25 (12.6%) |
| Total | 81 (100.0%) | 199 (100.0%) |
Property Value to Household Income Ratio in Sedley
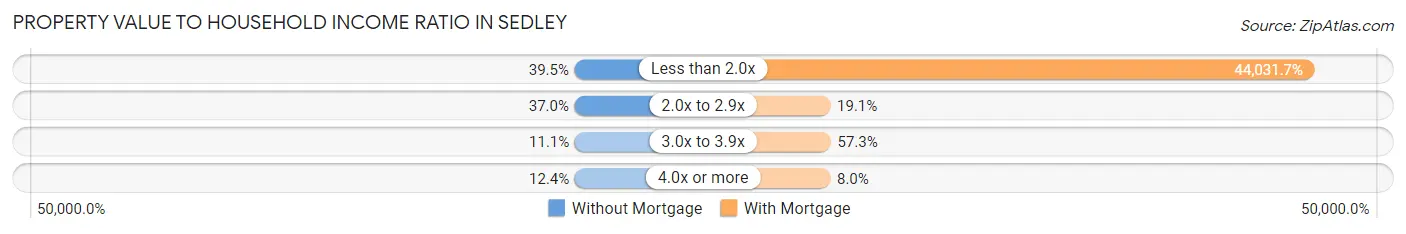
| Value-to-Income Ratio | Without Mortgage | With Mortgage |
| Less than 2.0x | 32 (39.5%) | 87,623 (44,031.7%) |
| 2.0x to 2.9x | 30 (37.0%) | 38 (19.1%) |
| 3.0x to 3.9x | 9 (11.1%) | 114 (57.3%) |
| 4.0x or more | 10 (12.3%) | 16 (8.0%) |
| Total | 81 (100.0%) | 199 (100.0%) |
Real Estate Taxes by Mortgage Status in Sedley
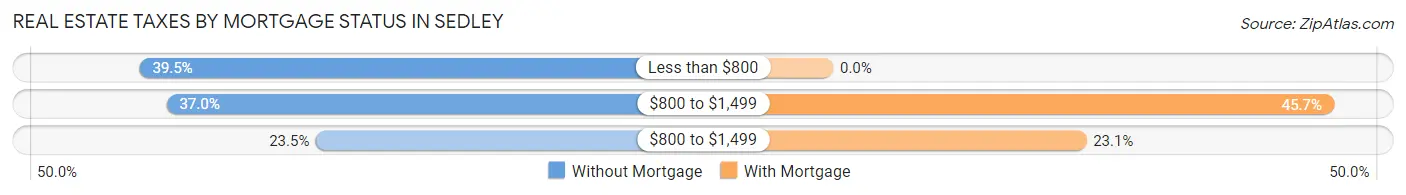
| Property Taxes | Without Mortgage | With Mortgage |
| Less than $800 | 32 (39.5%) | 0 (0.0%) |
| $800 to $1,499 | 30 (37.0%) | 91 (45.7%) |
| $800 to $1,499 | 19 (23.5%) | 46 (23.1%) |
| Total | 81 (100.0%) | 199 (100.0%) |
Health & Disability in Sedley
Health Insurance Coverage by Age in Sedley
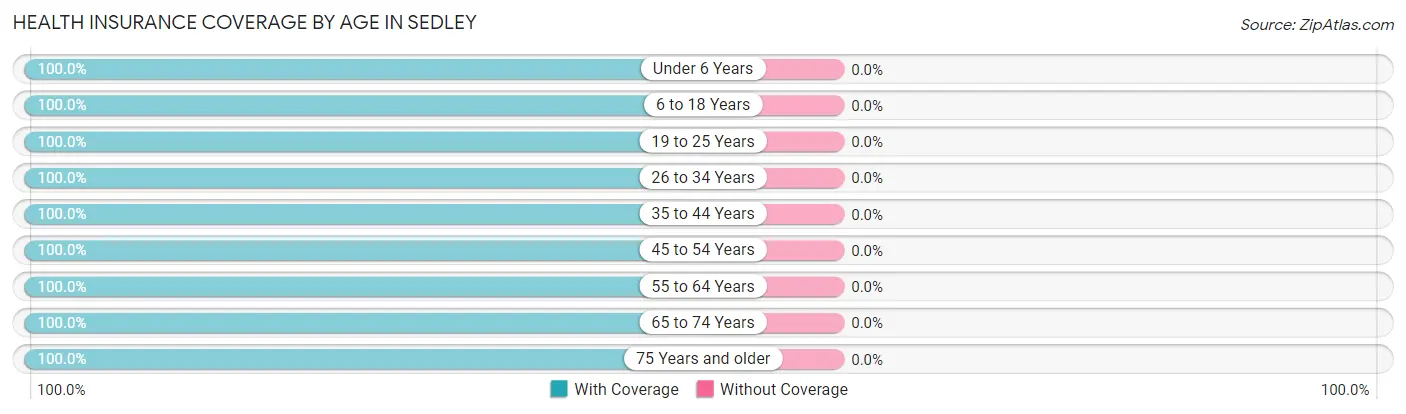
| Age Bracket | With Coverage | Without Coverage |
| Under 6 Years | 9 (100.0%) | 0 (0.0%) |
| 6 to 18 Years | 134 (100.0%) | 0 (0.0%) |
| 19 to 25 Years | 16 (100.0%) | 0 (0.0%) |
| 26 to 34 Years | 126 (100.0%) | 0 (0.0%) |
| 35 to 44 Years | 158 (100.0%) | 0 (0.0%) |
| 45 to 54 Years | 29 (100.0%) | 0 (0.0%) |
| 55 to 64 Years | 86 (100.0%) | 0 (0.0%) |
| 65 to 74 Years | 91 (100.0%) | 0 (0.0%) |
| 75 Years and older | 38 (100.0%) | 0 (0.0%) |
| Total | 687 (100.0%) | 0 (0.0%) |
Health Insurance Coverage by Citizenship Status in Sedley
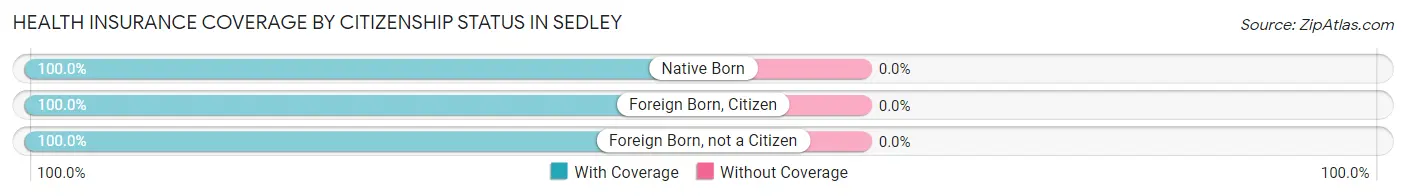
| Citizenship Status | With Coverage | Without Coverage |
| Native Born | 9 (100.0%) | 0 (0.0%) |
| Foreign Born, Citizen | 134 (100.0%) | 0 (0.0%) |
| Foreign Born, not a Citizen | 16 (100.0%) | 0 (0.0%) |
Health Insurance Coverage by Household Income in Sedley
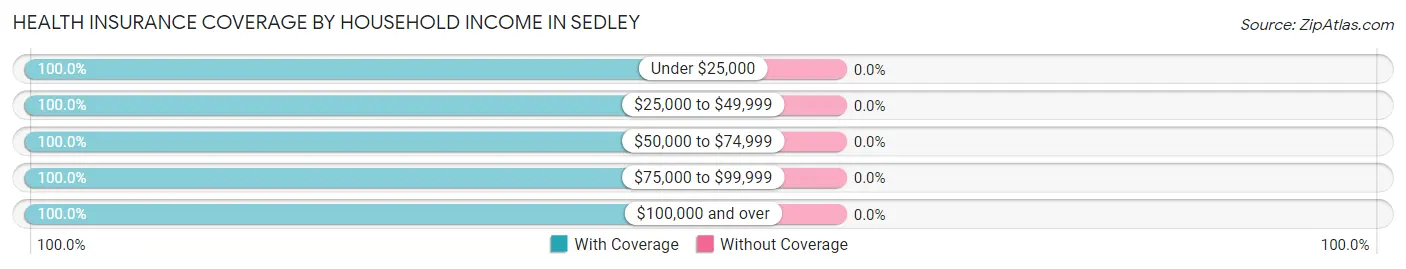
| Household Income | With Coverage | Without Coverage |
| Under $25,000 | 68 (100.0%) | 0 (0.0%) |
| $25,000 to $49,999 | 41 (100.0%) | 0 (0.0%) |
| $50,000 to $74,999 | 18 (100.0%) | 0 (0.0%) |
| $75,000 to $99,999 | 386 (100.0%) | 0 (0.0%) |
| $100,000 and over | 174 (100.0%) | 0 (0.0%) |
Public vs Private Health Insurance Coverage by Age in Sedley
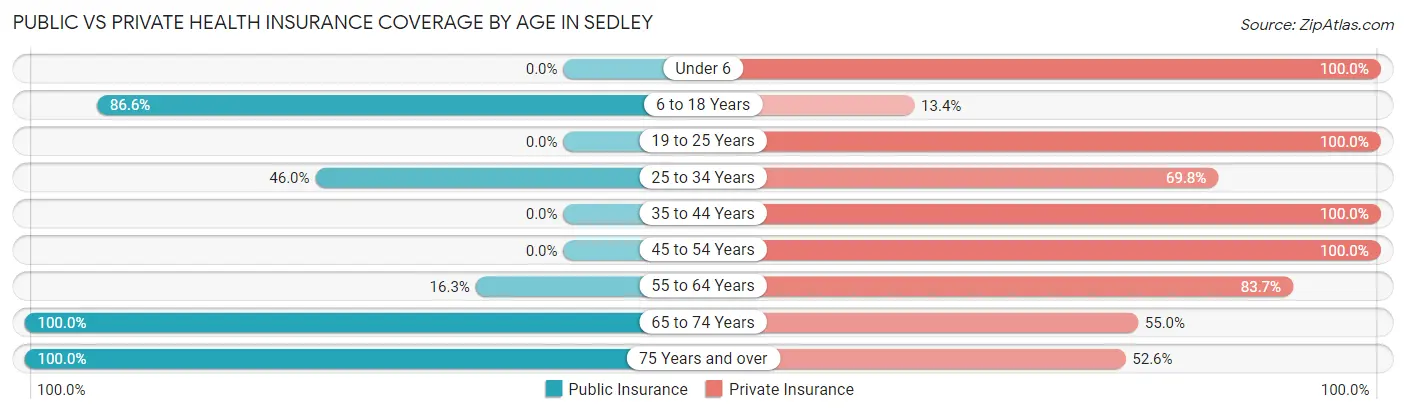
| Age Bracket | Public Insurance | Private Insurance |
| Under 6 | 0 (0.0%) | 9 (100.0%) |
| 6 to 18 Years | 116 (86.6%) | 18 (13.4%) |
| 19 to 25 Years | 0 (0.0%) | 16 (100.0%) |
| 25 to 34 Years | 58 (46.0%) | 88 (69.8%) |
| 35 to 44 Years | 0 (0.0%) | 158 (100.0%) |
| 45 to 54 Years | 0 (0.0%) | 29 (100.0%) |
| 55 to 64 Years | 14 (16.3%) | 72 (83.7%) |
| 65 to 74 Years | 91 (100.0%) | 50 (54.9%) |
| 75 Years and over | 38 (100.0%) | 20 (52.6%) |
| Total | 317 (46.1%) | 460 (67.0%) |
Disability Status by Sex by Age in Sedley
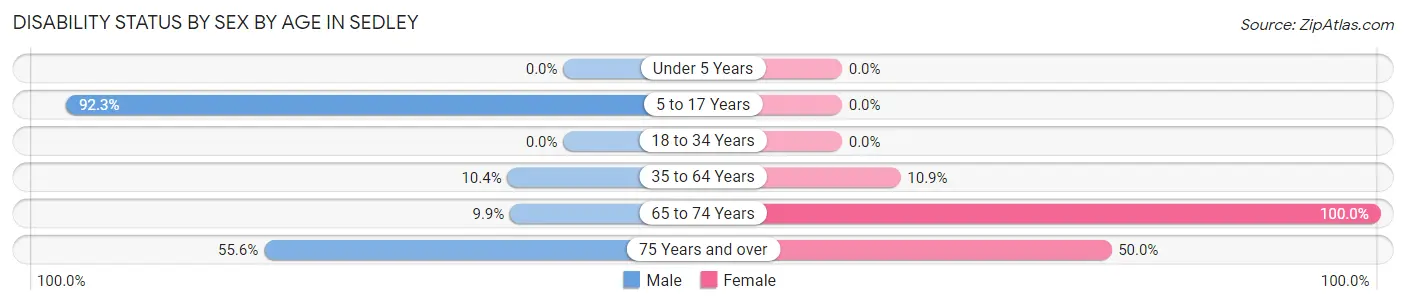
| Age Bracket | Male | Female |
| Under 5 Years | 0 (0.0%) | 0 (0.0%) |
| 5 to 17 Years | 60 (92.3%) | 0 (0.0%) |
| 18 to 34 Years | 0 (0.0%) | 0 (0.0%) |
| 35 to 64 Years | 14 (10.4%) | 15 (10.9%) |
| 65 to 74 Years | 8 (9.9%) | 10 (100.0%) |
| 75 Years and over | 10 (55.6%) | 10 (50.0%) |
Disability Class by Sex by Age in Sedley
Disability Class: Hearing Difficulty
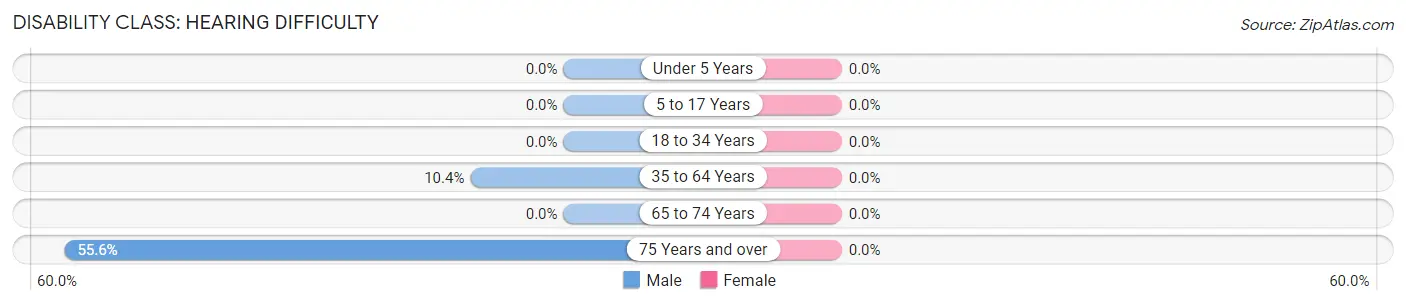
| Age Bracket | Male | Female |
| Under 5 Years | 0 (0.0%) | 0 (0.0%) |
| 5 to 17 Years | 0 (0.0%) | 0 (0.0%) |
| 18 to 34 Years | 0 (0.0%) | 0 (0.0%) |
| 35 to 64 Years | 14 (10.4%) | 0 (0.0%) |
| 65 to 74 Years | 0 (0.0%) | 0 (0.0%) |
| 75 Years and over | 10 (55.6%) | 0 (0.0%) |
Disability Class: Vision Difficulty
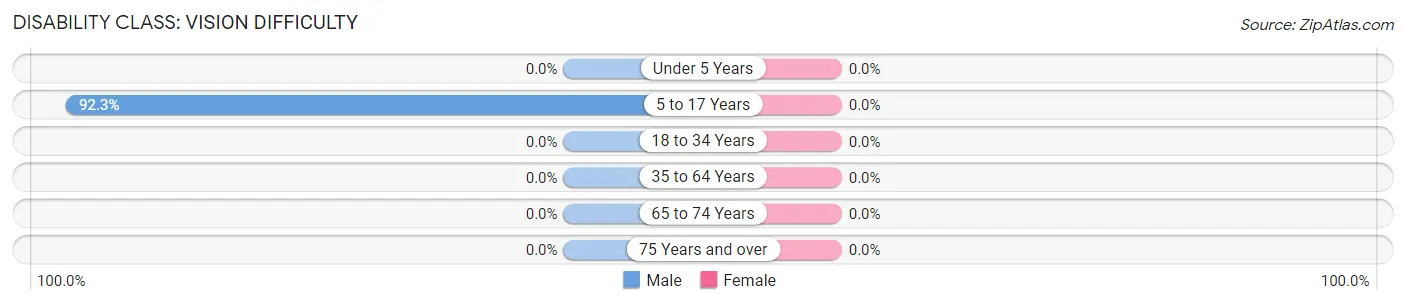
| Age Bracket | Male | Female |
| Under 5 Years | 0 (0.0%) | 0 (0.0%) |
| 5 to 17 Years | 60 (92.3%) | 0 (0.0%) |
| 18 to 34 Years | 0 (0.0%) | 0 (0.0%) |
| 35 to 64 Years | 0 (0.0%) | 0 (0.0%) |
| 65 to 74 Years | 0 (0.0%) | 0 (0.0%) |
| 75 Years and over | 0 (0.0%) | 0 (0.0%) |
Disability Class: Cognitive Difficulty
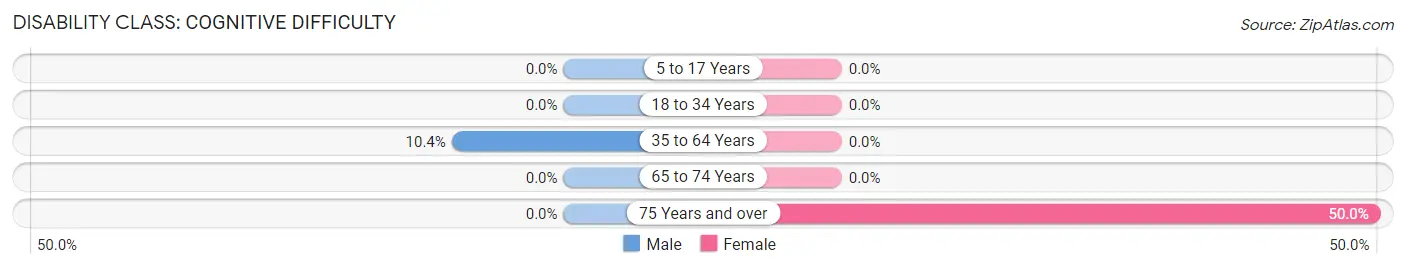
| Age Bracket | Male | Female |
| 5 to 17 Years | 0 (0.0%) | 0 (0.0%) |
| 18 to 34 Years | 0 (0.0%) | 0 (0.0%) |
| 35 to 64 Years | 14 (10.4%) | 0 (0.0%) |
| 65 to 74 Years | 0 (0.0%) | 0 (0.0%) |
| 75 Years and over | 0 (0.0%) | 10 (50.0%) |
Disability Class: Ambulatory Difficulty
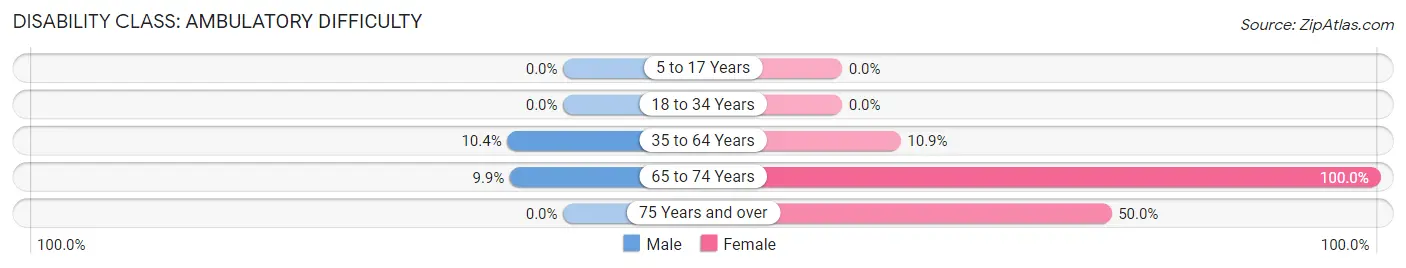
| Age Bracket | Male | Female |
| 5 to 17 Years | 0 (0.0%) | 0 (0.0%) |
| 18 to 34 Years | 0 (0.0%) | 0 (0.0%) |
| 35 to 64 Years | 14 (10.4%) | 15 (10.9%) |
| 65 to 74 Years | 8 (9.9%) | 10 (100.0%) |
| 75 Years and over | 0 (0.0%) | 10 (50.0%) |
Disability Class: Self-Care Difficulty
| Age Bracket | Male | Female |
| 5 to 17 Years | 0 (0.0%) | 0 (0.0%) |
| 18 to 34 Years | 0 (0.0%) | 0 (0.0%) |
| 35 to 64 Years | 0 (0.0%) | 0 (0.0%) |
| 65 to 74 Years | 0 (0.0%) | 0 (0.0%) |
| 75 Years and over | 0 (0.0%) | 0 (0.0%) |
Technology Access in Sedley
Computing Device Access in Sedley
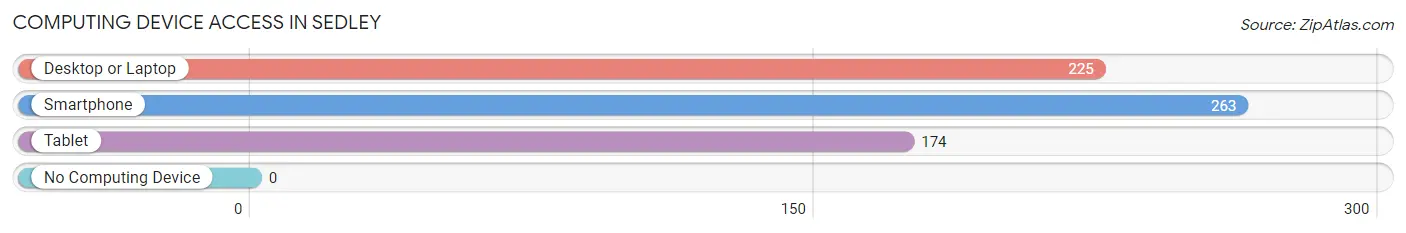
| Device Type | # Households | % Households |
| Desktop or Laptop | 225 | 77.8% |
| Smartphone | 263 | 91.0% |
| Tablet | 174 | 60.2% |
| No Computing Device | 0 | 0.0% |
| Total | 289 | 100.0% |
Internet Access in Sedley
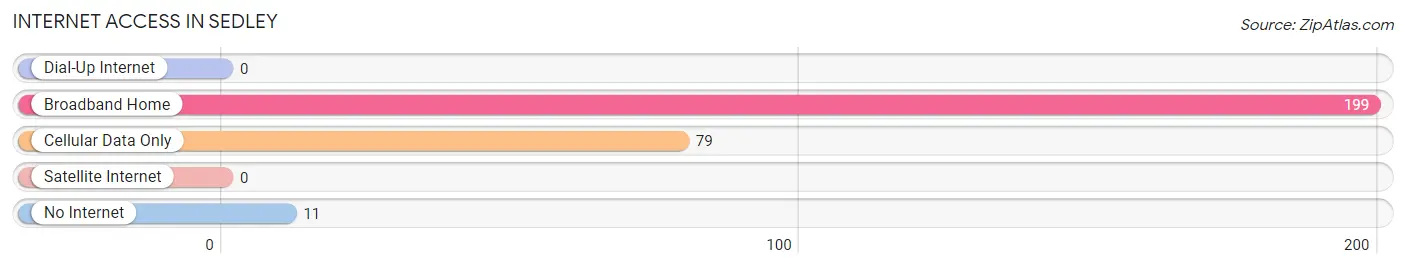
| Internet Type | # Households | % Households |
| Dial-Up Internet | 0 | 0.0% |
| Broadband Home | 199 | 68.9% |
| Cellular Data Only | 79 | 27.3% |
| Satellite Internet | 0 | 0.0% |
| No Internet | 11 | 3.8% |
| Total | 289 | 100.0% |
Sedley Summary
Sedley is a small unincorporated community located in Southampton County, Virginia. It is situated on the banks of the Nottoway River, approximately 20 miles south of the city of Franklin. The population of Sedley was estimated to be around 500 people in 2000.
History
Sedley was first settled in the early 1700s by English settlers. The town was named after the Sedley family, who were among the first settlers in the area. The town was officially established in 1790 and was incorporated in 1810.
The town was an important stop on the stagecoach route between Petersburg and Norfolk. It was also a major shipping port for tobacco and other goods. During the Civil War, Sedley was the site of a major battle between Confederate and Union forces.
Geography
Sedley is located in the southeastern part of Southampton County, Virginia. It is situated on the banks of the Nottoway River, approximately 20 miles south of the city of Franklin. The town is surrounded by farmland and is located near the Great Dismal Swamp National Wildlife Refuge.
The climate in Sedley is humid subtropical, with hot, humid summers and mild winters. The average annual temperature is around 68 degrees Fahrenheit. The average annual precipitation is around 45 inches.
Economy
The economy of Sedley is largely based on agriculture. The town is home to several farms, which produce a variety of crops, including corn, soybeans, wheat, and tobacco. The town is also home to several small businesses, including a grocery store, a hardware store, and a gas station.
Demographics
As of the 2000 census, the population of Sedley was estimated to be around 500 people. The racial makeup of the town was 95.2% White, 3.2% African American, 0.2% Native American, and 1.4% from other races. The median household income was $30,000, and the median family income was $35,000.
Conclusion
Sedley is a small unincorporated community located in Southampton County, Virginia. It is situated on the banks of the Nottoway River, approximately 20 miles south of the city of Franklin. The population of Sedley was estimated to be around 500 people in 2000. The economy of Sedley is largely based on agriculture, and the town is home to several small businesses. The racial makeup of the town was 95.2% White, 3.2% African American, 0.2% Native American, and 1.4% from other races. The median household income was $30,000, and the median family income was $35,000.
Common Questions
What is Per Capita Income in Sedley?
Per Capita income in Sedley is $32,435.
What is the Median Family Income in Sedley?
Median Family Income in Sedley is $88,574.
What is the Median Household income in Sedley?
Median Household Income in Sedley is $87,250.
What is Inequality or Gini Index in Sedley?
Inequality or Gini Index in Sedley is 0.27.
What is the Total Population of Sedley?
Total Population of Sedley is 687.
What is the Total Male Population of Sedley?
Total Male Population of Sedley is 415.
What is the Total Female Population of Sedley?
Total Female Population of Sedley is 272.
What is the Ratio of Males per 100 Females in Sedley?
There are 152.57 Males per 100 Females in Sedley.
What is the Ratio of Females per 100 Males in Sedley?
There are 65.54 Females per 100 Males in Sedley.
What is the Median Population Age in Sedley?
Median Population Age in Sedley is 35.4 Years.
What is the Average Family Size in Sedley
Average Family Size in Sedley is 2.8 People.
What is the Average Household Size in Sedley
Average Household Size in Sedley is 2.4 People.
How Large is the Labor Force in Sedley?
There are 388 People in the Labor Forcein in Sedley.
What is the Percentage of People in the Labor Force in Sedley?
71.3% of People are in the Labor Force in Sedley.
What is the Unemployment Rate in Sedley?
Unemployment Rate in Sedley is 8.0%.