Ashburn, VA Map & Demographics
Ashburn Map
Ashburn Overview
$64,916
PER CAPITA INCOME
$179,114
AVG FAMILY INCOME
$147,192
AVG HOUSEHOLD INCOME
37.2%
WAGE / INCOME GAP [ % ]
62.8¢/ $1
WAGE / INCOME GAP [ $ ]
0.38
INEQUALITY / GINI INDEX
45,479
TOTAL POPULATION
21,966
MALE POPULATION
23,513
FEMALE POPULATION
93.42
MALES / 100 FEMALES
107.04
FEMALES / 100 MALES
40.9
MEDIAN AGE
3.3
AVG FAMILY SIZE
2.7
AVG HOUSEHOLD SIZE
24,971
LABOR FORCE [ PEOPLE ]
68.8%
PERCENT IN LABOR FORCE
2.7%
UNEMPLOYMENT RATE
Income in Ashburn
Income Overview in Ashburn
Per Capita Income in Ashburn is $64,916, while median incomes of families and households are $179,114 and $147,192 respectively.
| Characteristic | Number | Measure |
| Per Capita Income | 45,479 | $64,916 |
| Median Family Income | 11,711 | $179,114 |
| Mean Family Income | 11,711 | $200,257 |
| Median Household Income | 17,026 | $147,192 |
| Mean Household Income | 17,026 | $170,321 |
| Income Deficit | 11,711 | $0 |
| Wage / Income Gap (%) | 45,479 | 37.21% |
| Wage / Income Gap ($) | 45,479 | 62.79¢ per $1 |
| Gini / Inequality Index | 45,479 | 0.38 |
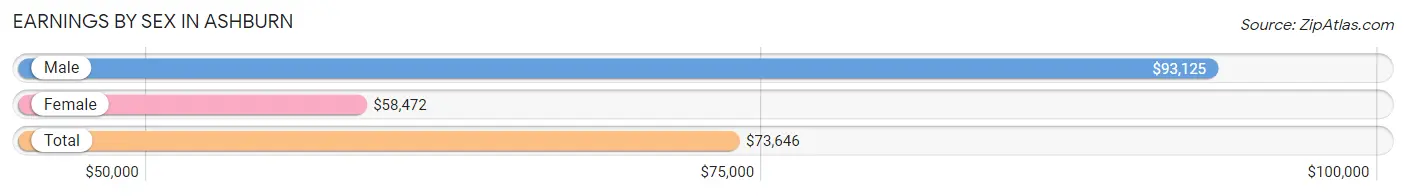
Earnings by Sex in Ashburn
Average Earnings in Ashburn are $73,646, $93,125 for men and $58,472 for women, a difference of 37.2%.
| Sex | Number | Average Earnings |
| Male | 13,535 (52.6%) | $93,125 |
| Female | 12,178 (47.4%) | $58,472 |
| Total | 25,713 (100.0%) | $73,646 |
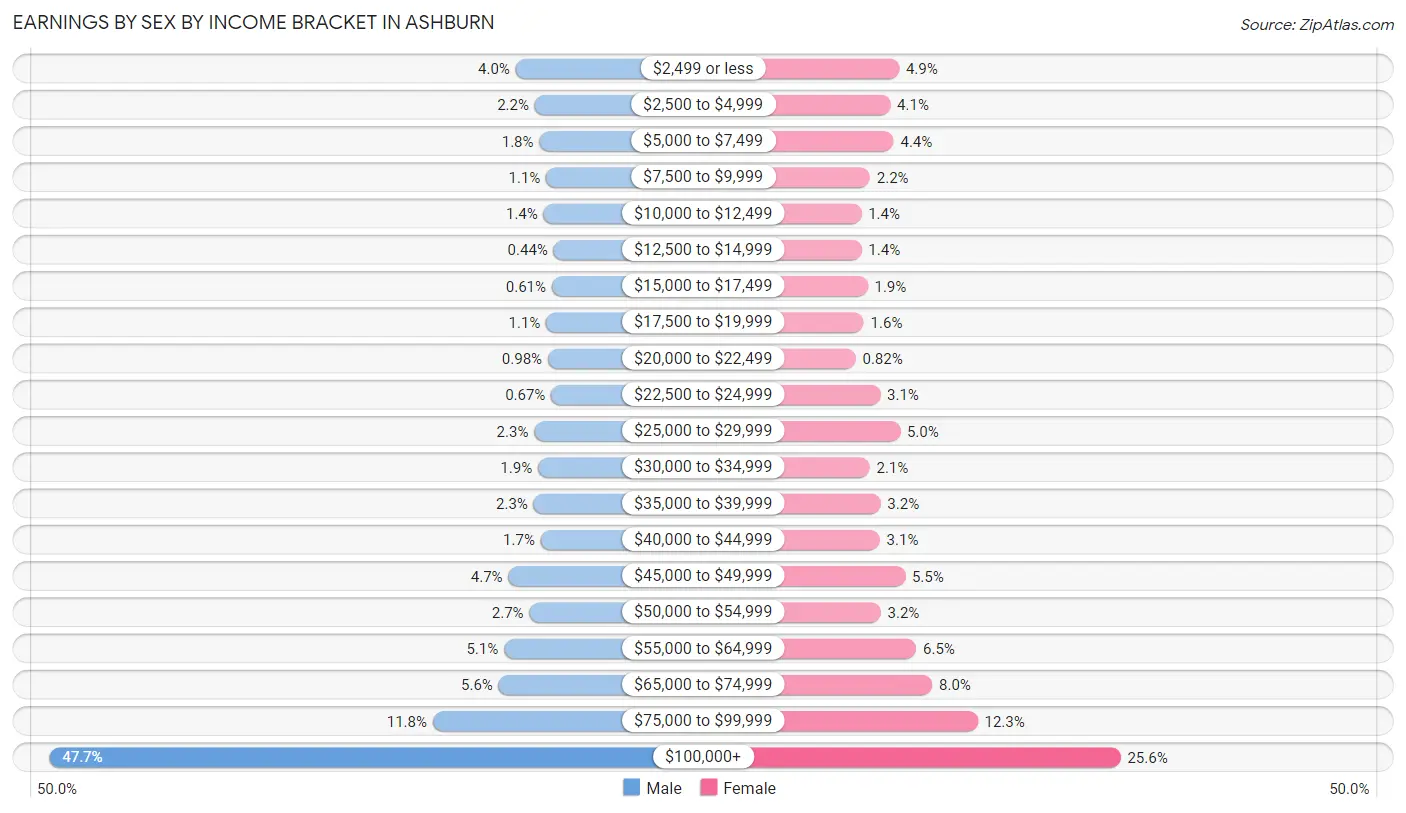
Earnings by Sex by Income Bracket in Ashburn
The most common earnings brackets in Ashburn are $100,000+ for men (6,454 | 47.7%) and $100,000+ for women (3,123 | 25.6%).
| Income | Male | Female |
| $2,499 or less | 541 (4.0%) | 595 (4.9%) |
| $2,500 to $4,999 | 299 (2.2%) | 494 (4.1%) |
| $5,000 to $7,499 | 241 (1.8%) | 534 (4.4%) |
| $7,500 to $9,999 | 154 (1.1%) | 263 (2.2%) |
| $10,000 to $12,499 | 187 (1.4%) | 164 (1.3%) |
| $12,500 to $14,999 | 60 (0.4%) | 167 (1.4%) |
| $15,000 to $17,499 | 83 (0.6%) | 236 (1.9%) |
| $17,500 to $19,999 | 154 (1.1%) | 193 (1.6%) |
| $20,000 to $22,499 | 133 (1.0%) | 100 (0.8%) |
| $22,500 to $24,999 | 91 (0.7%) | 380 (3.1%) |
| $25,000 to $29,999 | 306 (2.3%) | 606 (5.0%) |
| $30,000 to $34,999 | 258 (1.9%) | 260 (2.1%) |
| $35,000 to $39,999 | 312 (2.3%) | 383 (3.2%) |
| $40,000 to $44,999 | 224 (1.7%) | 375 (3.1%) |
| $45,000 to $49,999 | 634 (4.7%) | 664 (5.4%) |
| $50,000 to $54,999 | 367 (2.7%) | 386 (3.2%) |
| $55,000 to $64,999 | 689 (5.1%) | 790 (6.5%) |
| $65,000 to $74,999 | 756 (5.6%) | 973 (8.0%) |
| $75,000 to $99,999 | 1,592 (11.8%) | 1,492 (12.2%) |
| $100,000+ | 6,454 (47.7%) | 3,123 (25.6%) |
| Total | 13,535 (100.0%) | 12,178 (100.0%) |
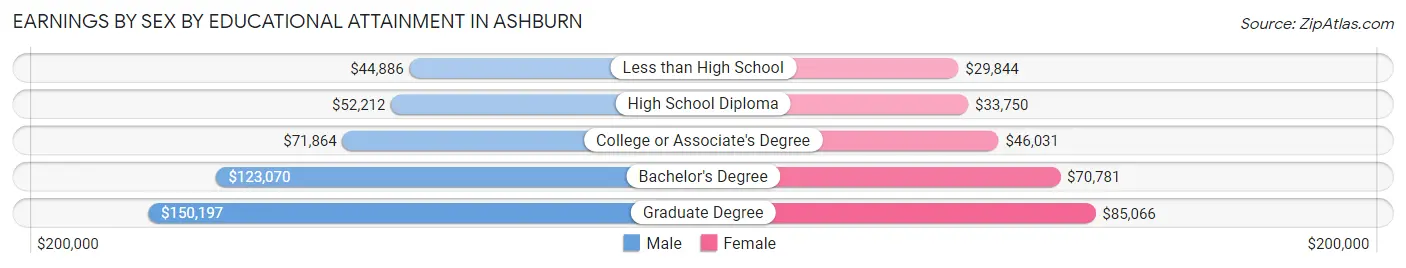
Earnings by Sex by Educational Attainment in Ashburn
Average earnings in Ashburn are $105,996 for men and $68,106 for women, a difference of 35.7%. Men with an educational attainment of graduate degree enjoy the highest average annual earnings of $150,197, while those with less than high school education earn the least with $44,886. Women with an educational attainment of graduate degree earn the most with the average annual earnings of $85,066, while those with less than high school education have the smallest earnings of $29,844.
| Educational Attainment | Male Income | Female Income |
| Less than High School | $44,886 | $29,844 |
| High School Diploma | $52,212 | $33,750 |
| College or Associate's Degree | $71,864 | $46,031 |
| Bachelor's Degree | $123,070 | $70,781 |
| Graduate Degree | $150,197 | $85,066 |
| Total | $105,996 | $68,106 |
Family Income in Ashburn
Family Income Brackets in Ashburn
According to the Ashburn family income data, there are 5,071 families falling into the $200,000+ income range, which is the most common income bracket and makes up 43.3% of all families. Conversely, the $10,000 to $14,999 income bracket is the least frequent group with only 35 families (0.3%) belonging to this category.
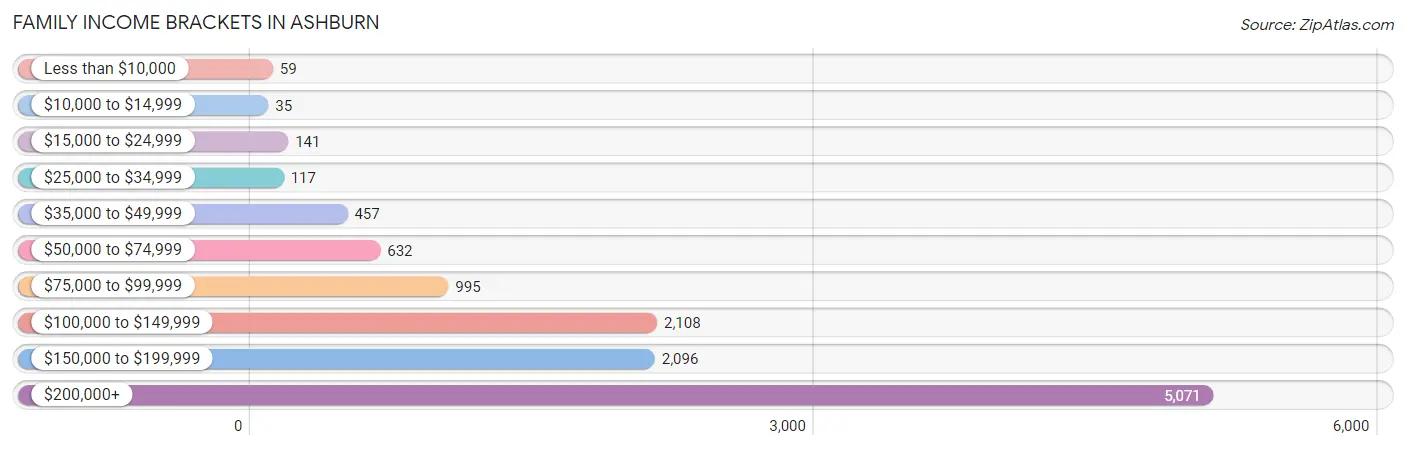
| Income Bracket | # Families | % Families |
| Less than $10,000 | 59 | 0.5% |
| $10,000 to $14,999 | 35 | 0.3% |
| $15,000 to $24,999 | 141 | 1.2% |
| $25,000 to $34,999 | 117 | 1.0% |
| $35,000 to $49,999 | 457 | 3.9% |
| $50,000 to $74,999 | 632 | 5.4% |
| $75,000 to $99,999 | 995 | 8.5% |
| $100,000 to $149,999 | 2,108 | 18.0% |
| $150,000 to $199,999 | 2,096 | 17.9% |
| $200,000+ | 5,071 | 43.3% |
Family Income by Famaliy Size in Ashburn
4-person families (2,882 | 24.6%) account for the highest median family income in Ashburn with $210,021 per family, while 2-person families (4,694 | 40.1%) have the highest median income of $75,171 per family member.
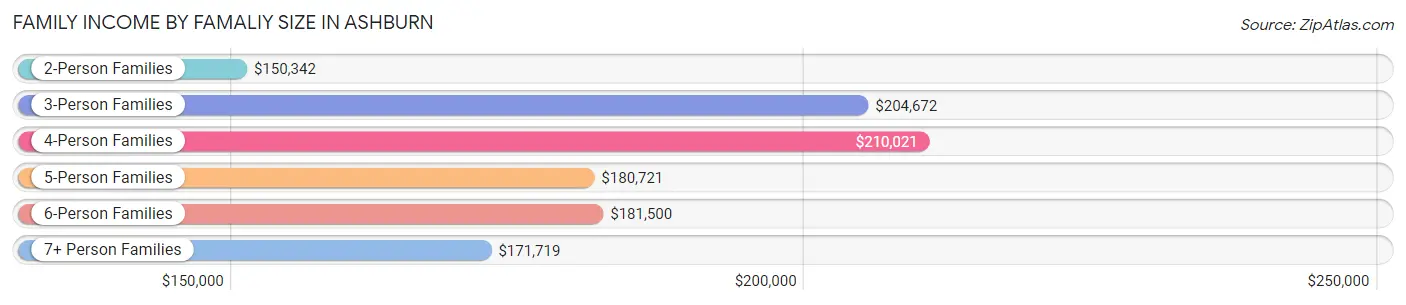
| Income Bracket | # Families | Median Income |
| 2-Person Families | 4,694 (40.1%) | $150,342 |
| 3-Person Families | 2,648 (22.6%) | $204,672 |
| 4-Person Families | 2,882 (24.6%) | $210,021 |
| 5-Person Families | 835 (7.1%) | $180,721 |
| 6-Person Families | 470 (4.0%) | $181,500 |
| 7+ Person Families | 182 (1.5%) | $171,719 |
| Total | 11,711 (100.0%) | $179,114 |
Family Income by Number of Earners in Ashburn
The median family income in Ashburn is $179,114, with families comprising 3+ earners (1,930) having the highest median family income of $204,724, while families with no earners (1,370) have the lowest median family income of $118,906, accounting for 16.5% and 11.7% of families, respectively.
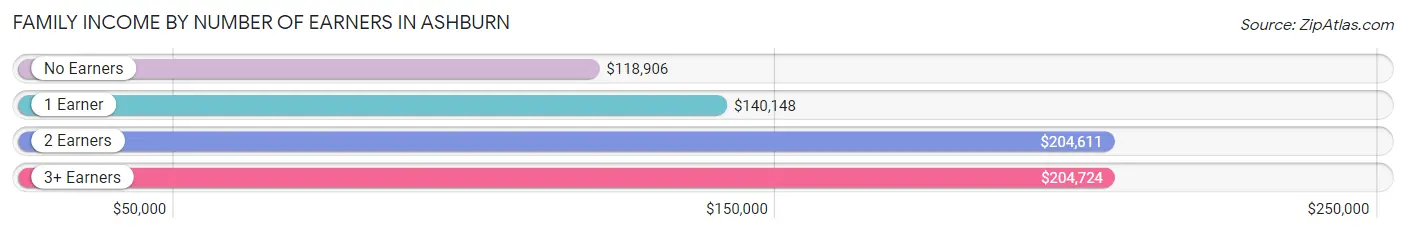
| Number of Earners | # Families | Median Income |
| No Earners | 1,370 (11.7%) | $118,906 |
| 1 Earner | 2,895 (24.7%) | $140,148 |
| 2 Earners | 5,516 (47.1%) | $204,611 |
| 3+ Earners | 1,930 (16.5%) | $204,724 |
| Total | 11,711 (100.0%) | $179,114 |
Household Income in Ashburn
Household Income Brackets in Ashburn
With 5,670 households falling in the category, the $200,000+ income range is the most frequent in Ashburn, accounting for 33.3% of all households. In contrast, only 170 households (1.0%) fall into the $10,000 to $14,999 income bracket, making it the least populous group.
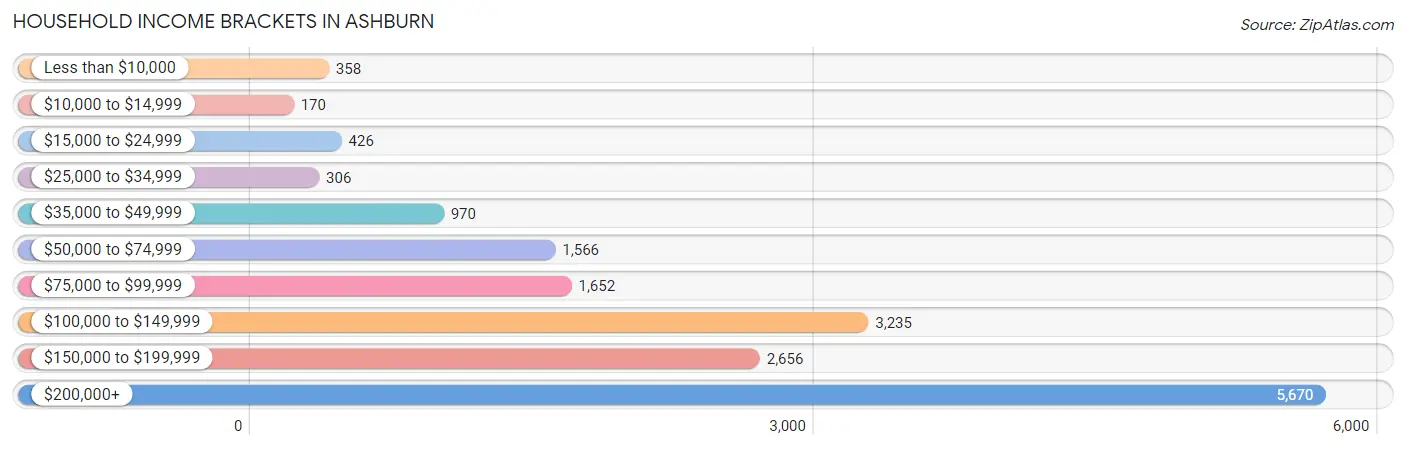
| Income Bracket | # Households | % Households |
| Less than $10,000 | 358 | 2.1% |
| $10,000 to $14,999 | 170 | 1.0% |
| $15,000 to $24,999 | 426 | 2.5% |
| $25,000 to $34,999 | 306 | 1.8% |
| $35,000 to $49,999 | 970 | 5.7% |
| $50,000 to $74,999 | 1,566 | 9.2% |
| $75,000 to $99,999 | 1,652 | 9.7% |
| $100,000 to $149,999 | 3,235 | 19.0% |
| $150,000 to $199,999 | 2,656 | 15.6% |
| $200,000+ | 5,670 | 33.3% |
Household Income by Householder Age in Ashburn
The median household income in Ashburn is $147,192, with the highest median household income of $193,139 found in the 45 to 64 years age bracket for the primary householder. A total of 7,003 households (41.1%) fall into this category. Meanwhile, the 15 to 24 years age bracket for the primary householder has the lowest median household income of $71,180, with 245 households (1.4%) in this group.
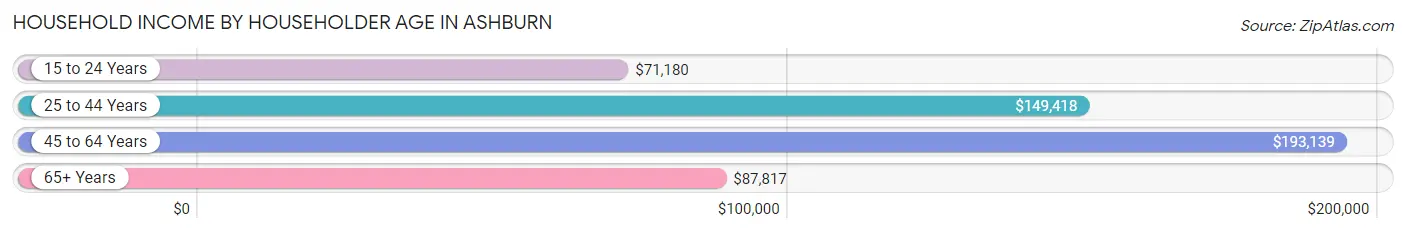
| Income Bracket | # Households | Median Income |
| 15 to 24 Years | 245 (1.4%) | $71,180 |
| 25 to 44 Years | 5,220 (30.7%) | $149,418 |
| 45 to 64 Years | 7,003 (41.1%) | $193,139 |
| 65+ Years | 4,558 (26.8%) | $87,817 |
| Total | 17,026 (100.0%) | $147,192 |
Poverty in Ashburn
Income Below Poverty by Sex and Age in Ashburn
With 2.2% poverty level for males and 4.0% for females among the residents of Ashburn, 6 to 11 year old males and under 5 year old females are the most vulnerable to poverty, with 114 males (6.2%) and 99 females (9.8%) in their respective age groups living below the poverty level.
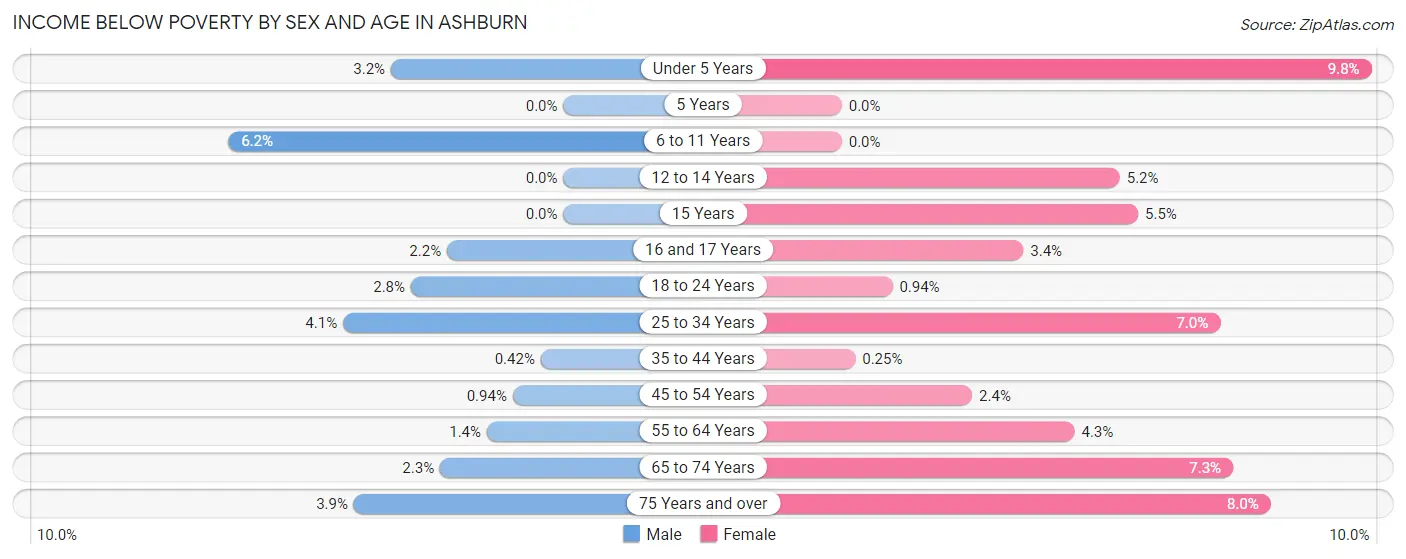
| Age Bracket | Male | Female |
| Under 5 Years | 41 (3.2%) | 99 (9.8%) |
| 5 Years | 0 (0.0%) | 0 (0.0%) |
| 6 to 11 Years | 114 (6.2%) | 0 (0.0%) |
| 12 to 14 Years | 0 (0.0%) | 48 (5.2%) |
| 15 Years | 0 (0.0%) | 11 (5.5%) |
| 16 and 17 Years | 16 (2.2%) | 21 (3.4%) |
| 18 to 24 Years | 50 (2.8%) | 18 (0.9%) |
| 25 to 34 Years | 89 (4.1%) | 192 (7.0%) |
| 35 to 44 Years | 13 (0.4%) | 8 (0.3%) |
| 45 to 54 Years | 33 (0.9%) | 83 (2.4%) |
| 55 to 64 Years | 43 (1.4%) | 112 (4.3%) |
| 65 to 74 Years | 29 (2.3%) | 139 (7.3%) |
| 75 Years and over | 64 (3.9%) | 201 (8.0%) |
| Total | 492 (2.2%) | 932 (4.0%) |
Income Above Poverty by Sex and Age in Ashburn
According to the poverty statistics in Ashburn, males aged 5 years and females aged 5 years are the age groups that are most secure financially, with 100.0% of males and 100.0% of females in these age groups living above the poverty line.
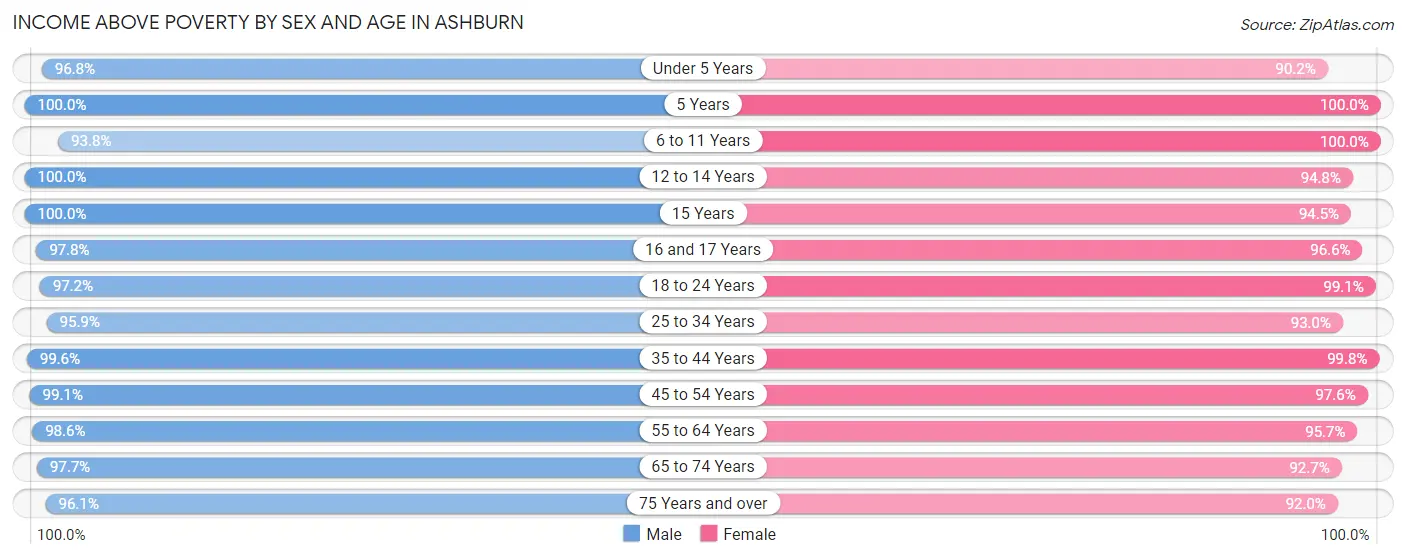
| Age Bracket | Male | Female |
| Under 5 Years | 1,242 (96.8%) | 908 (90.2%) |
| 5 Years | 148 (100.0%) | 218 (100.0%) |
| 6 to 11 Years | 1,720 (93.8%) | 2,088 (100.0%) |
| 12 to 14 Years | 1,071 (100.0%) | 883 (94.8%) |
| 15 Years | 307 (100.0%) | 189 (94.5%) |
| 16 and 17 Years | 724 (97.8%) | 602 (96.6%) |
| 18 to 24 Years | 1,719 (97.2%) | 1,899 (99.1%) |
| 25 to 34 Years | 2,087 (95.9%) | 2,544 (93.0%) |
| 35 to 44 Years | 3,084 (99.6%) | 3,210 (99.8%) |
| 45 to 54 Years | 3,493 (99.1%) | 3,351 (97.6%) |
| 55 to 64 Years | 2,984 (98.6%) | 2,479 (95.7%) |
| 65 to 74 Years | 1,238 (97.7%) | 1,775 (92.7%) |
| 75 Years and over | 1,582 (96.1%) | 2,325 (92.0%) |
| Total | 21,399 (97.8%) | 22,471 (96.0%) |
Income Below Poverty Among Married-Couple Families in Ashburn
The poverty statistics for married-couple families in Ashburn show that 1.5% or 153 of the total 10,229 families live below the poverty line. Families with no children have the highest poverty rate of 2.4%, comprising of 126 families. On the other hand, families with 3 or 4 children have the lowest poverty rate of 0.0%, which includes 0 families.
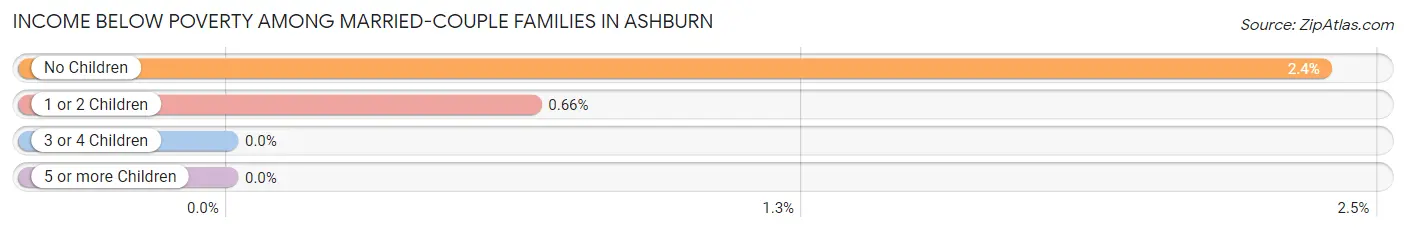
| Children | Above Poverty | Below Poverty |
| No Children | 5,164 (97.6%) | 126 (2.4%) |
| 1 or 2 Children | 4,044 (99.3%) | 27 (0.7%) |
| 3 or 4 Children | 831 (100.0%) | 0 (0.0%) |
| 5 or more Children | 37 (100.0%) | 0 (0.0%) |
| Total | 10,076 (98.5%) | 153 (1.5%) |
Income Below Poverty Among Single-Parent Households in Ashburn
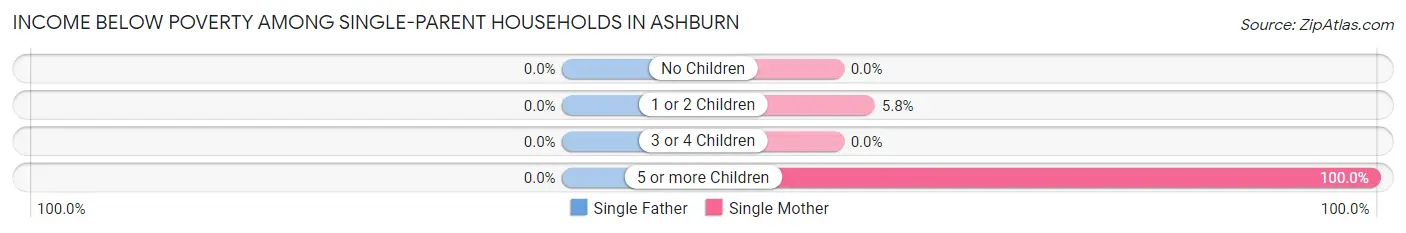
| Children | Single Father | Single Mother |
| No Children | 0 (0.0%) | 0 (0.0%) |
| 1 or 2 Children | 0 (0.0%) | 30 (5.8%) |
| 3 or 4 Children | 0 (0.0%) | 0 (0.0%) |
| 5 or more Children | 0 (0.0%) | 30 (100.0%) |
| Total | 0 (0.0%) | 60 (5.2%) |
Income Below Poverty Among Married-Couple vs Single-Parent Households in Ashburn
The poverty data for Ashburn shows that 153 of the married-couple family households (1.5%) and 60 of the single-parent households (4.1%) are living below the poverty level. Within the married-couple family households, those with no children have the highest poverty rate, with 126 households (2.4%) falling below the poverty line. Among the single-parent households, those with 5 or more children have the highest poverty rate, with 30 household (100.0%) living below poverty.
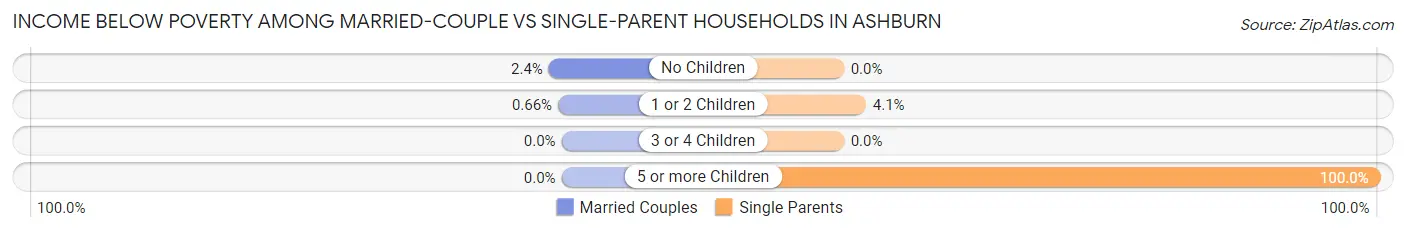
| Children | Married-Couple Families | Single-Parent Households |
| No Children | 126 (2.4%) | 0 (0.0%) |
| 1 or 2 Children | 27 (0.7%) | 30 (4.1%) |
| 3 or 4 Children | 0 (0.0%) | 0 (0.0%) |
| 5 or more Children | 0 (0.0%) | 30 (100.0%) |
| Total | 153 (1.5%) | 60 (4.1%) |
Race in Ashburn
The most populous races in Ashburn are White / Caucasian (27,553 | 60.6%), Asian (9,571 | 21.0%), and Hispanic or Latino (4,709 | 10.3%).
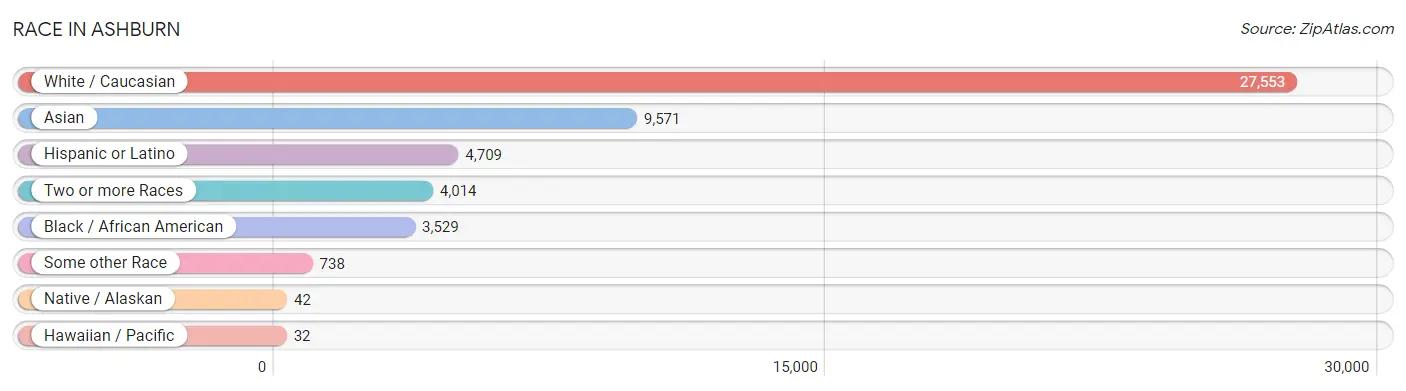
| Race | # Population | % Population |
| Asian | 9,571 | 21.0% |
| Black / African American | 3,529 | 7.8% |
| Hawaiian / Pacific | 32 | 0.1% |
| Hispanic or Latino | 4,709 | 10.3% |
| Native / Alaskan | 42 | 0.1% |
| White / Caucasian | 27,553 | 60.6% |
| Two or more Races | 4,014 | 8.8% |
| Some other Race | 738 | 1.6% |
| Total | 45,479 | 100.0% |
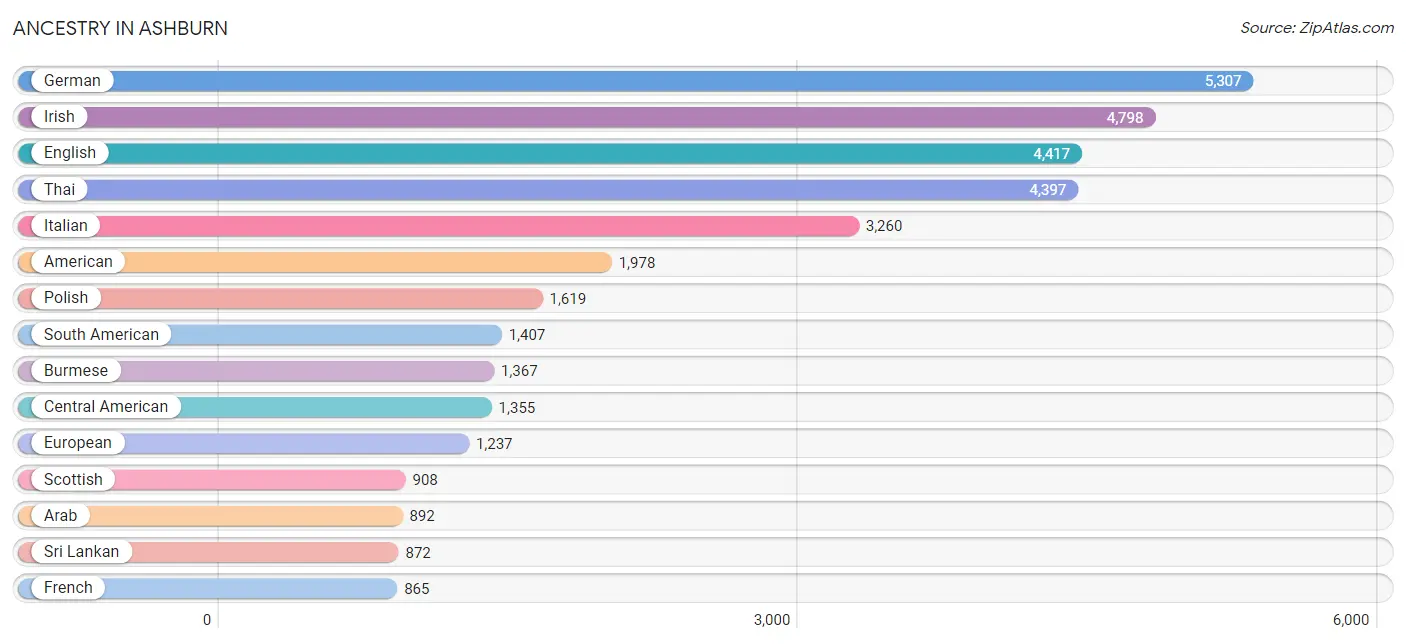
Ancestry in Ashburn
The most populous ancestries reported in Ashburn are German (5,307 | 11.7%), Irish (4,798 | 10.5%), English (4,417 | 9.7%), Thai (4,397 | 9.7%), and Italian (3,260 | 7.2%), together accounting for 48.8% of all Ashburn residents.
| Ancestry | # Population | % Population |
| Afghan | 19 | 0.0% |
| African | 264 | 0.6% |
| Albanian | 15 | 0.0% |
| American | 1,978 | 4.3% |
| Arab | 892 | 2.0% |
| Argentinean | 67 | 0.2% |
| Armenian | 115 | 0.3% |
| Australian | 8 | 0.0% |
| Austrian | 227 | 0.5% |
| Belgian | 51 | 0.1% |
| Bhutanese | 497 | 1.1% |
| Bolivian | 251 | 0.5% |
| Brazilian | 101 | 0.2% |
| British | 480 | 1.1% |
| Burmese | 1,367 | 3.0% |
| Canadian | 129 | 0.3% |
| Central American | 1,355 | 3.0% |
| Central American Indian | 87 | 0.2% |
| Cherokee | 48 | 0.1% |
| Chickasaw | 7 | 0.0% |
| Colombian | 253 | 0.6% |
| Comanche | 12 | 0.0% |
| Creek | 10 | 0.0% |
| Croatian | 41 | 0.1% |
| Cuban | 260 | 0.6% |
| Czech | 350 | 0.8% |
| Czechoslovakian | 23 | 0.1% |
| Danish | 111 | 0.2% |
| Delaware | 2 | 0.0% |
| Dominican | 80 | 0.2% |
| Dutch | 508 | 1.1% |
| Eastern European | 259 | 0.6% |
| Ecuadorian | 120 | 0.3% |
| Egyptian | 46 | 0.1% |
| English | 4,417 | 9.7% |
| Ethiopian | 110 | 0.2% |
| European | 1,237 | 2.7% |
| Filipino | 48 | 0.1% |
| Finnish | 38 | 0.1% |
| French | 865 | 1.9% |
| French Canadian | 139 | 0.3% |
| German | 5,307 | 11.7% |
| Ghanaian | 64 | 0.1% |
| Greek | 194 | 0.4% |
| Guamanian / Chamorro | 14 | 0.0% |
| Guatemalan | 47 | 0.1% |
| Guyanese | 82 | 0.2% |
| Honduran | 256 | 0.6% |
| Hungarian | 270 | 0.6% |
| Indian (Asian) | 815 | 1.8% |
| Indonesian | 72 | 0.2% |
| Iranian | 532 | 1.2% |
| Irish | 4,798 | 10.5% |
| Iroquois | 47 | 0.1% |
| Israeli | 10 | 0.0% |
| Italian | 3,260 | 7.2% |
| Jamaican | 231 | 0.5% |
| Japanese | 78 | 0.2% |
| Jordanian | 351 | 0.8% |
| Korean | 711 | 1.6% |
| Laotian | 74 | 0.2% |
| Lebanese | 167 | 0.4% |
| Liberian | 26 | 0.1% |
| Lithuanian | 79 | 0.2% |
| Malaysian | 8 | 0.0% |
| Mexican | 712 | 1.6% |
| Mexican American Indian | 9 | 0.0% |
| Mongolian | 127 | 0.3% |
| Moroccan | 94 | 0.2% |
| Native Hawaiian | 9 | 0.0% |
| Nicaraguan | 44 | 0.1% |
| Nigerian | 144 | 0.3% |
| Northern European | 113 | 0.3% |
| Norwegian | 416 | 0.9% |
| Pakistani | 37 | 0.1% |
| Palestinian | 46 | 0.1% |
| Panamanian | 359 | 0.8% |
| Pennsylvania German | 10 | 0.0% |
| Peruvian | 658 | 1.5% |
| Polish | 1,619 | 3.6% |
| Portuguese | 83 | 0.2% |
| Puerto Rican | 585 | 1.3% |
| Romanian | 62 | 0.1% |
| Russian | 535 | 1.2% |
| Salvadoran | 649 | 1.4% |
| Samoan | 7 | 0.0% |
| Scandinavian | 142 | 0.3% |
| Scotch-Irish | 356 | 0.8% |
| Scottish | 908 | 2.0% |
| Serbian | 32 | 0.1% |
| Slavic | 10 | 0.0% |
| Slovak | 87 | 0.2% |
| Slovene | 12 | 0.0% |
| South American | 1,407 | 3.1% |
| Spaniard | 69 | 0.2% |
| Spanish | 158 | 0.4% |
| Spanish American | 73 | 0.2% |
| Sri Lankan | 872 | 1.9% |
| Subsaharan African | 765 | 1.7% |
| Sudanese | 95 | 0.2% |
| Swedish | 338 | 0.7% |
| Swiss | 95 | 0.2% |
| Syrian | 76 | 0.2% |
| Thai | 4,397 | 9.7% |
| Tongan | 31 | 0.1% |
| Trinidadian and Tobagonian | 30 | 0.1% |
| Turkish | 42 | 0.1% |
| U.S. Virgin Islander | 7 | 0.0% |
| Ukrainian | 609 | 1.3% |
| Uruguayan | 14 | 0.0% |
| Venezuelan | 44 | 0.1% |
| Vietnamese | 73 | 0.2% |
| Welsh | 234 | 0.5% |
| West Indian | 10 | 0.0% | View All 114 Rows |
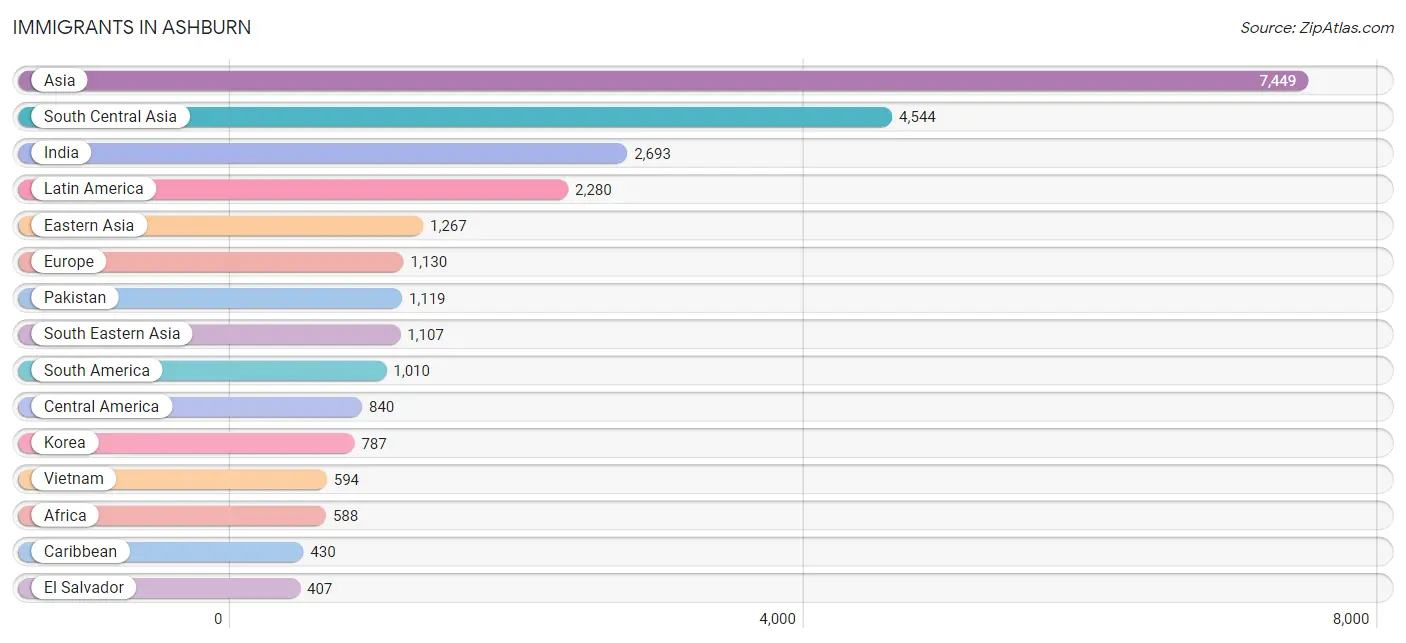
Immigrants in Ashburn
The most numerous immigrant groups reported in Ashburn came from Asia (7,449 | 16.4%), South Central Asia (4,544 | 10.0%), India (2,693 | 5.9%), Latin America (2,280 | 5.0%), and Eastern Asia (1,267 | 2.8%), together accounting for 40.1% of all Ashburn residents.
| Immigration Origin | # Population | % Population |
| Afghanistan | 157 | 0.4% |
| Africa | 588 | 1.3% |
| Albania | 33 | 0.1% |
| Argentina | 21 | 0.1% |
| Asia | 7,449 | 16.4% |
| Azores | 6 | 0.0% |
| Bangladesh | 92 | 0.2% |
| Bolivia | 87 | 0.2% |
| Brazil | 176 | 0.4% |
| Cambodia | 60 | 0.1% |
| Cameroon | 22 | 0.1% |
| Canada | 172 | 0.4% |
| Caribbean | 430 | 0.9% |
| Central America | 840 | 1.8% |
| Chile | 10 | 0.0% |
| China | 327 | 0.7% |
| Colombia | 113 | 0.3% |
| Cuba | 136 | 0.3% |
| Denmark | 9 | 0.0% |
| Dominican Republic | 62 | 0.1% |
| Eastern Africa | 123 | 0.3% |
| Eastern Asia | 1,267 | 2.8% |
| Eastern Europe | 296 | 0.6% |
| Ecuador | 103 | 0.2% |
| Egypt | 109 | 0.2% |
| El Salvador | 407 | 0.9% |
| England | 182 | 0.4% |
| Ethiopia | 66 | 0.2% |
| Europe | 1,130 | 2.5% |
| France | 93 | 0.2% |
| Germany | 172 | 0.4% |
| Ghana | 78 | 0.2% |
| Greece | 15 | 0.0% |
| Guatemala | 35 | 0.1% |
| Guyana | 82 | 0.2% |
| Honduras | 105 | 0.2% |
| Hong Kong | 45 | 0.1% |
| Hungary | 5 | 0.0% |
| India | 2,693 | 5.9% |
| Indonesia | 36 | 0.1% |
| Iran | 313 | 0.7% |
| Iraq | 64 | 0.1% |
| Ireland | 8 | 0.0% |
| Italy | 177 | 0.4% |
| Jamaica | 141 | 0.3% |
| Japan | 153 | 0.3% |
| Jordan | 168 | 0.4% |
| Korea | 787 | 1.7% |
| Kuwait | 16 | 0.0% |
| Laos | 35 | 0.1% |
| Latin America | 2,280 | 5.0% |
| Lebanon | 27 | 0.1% |
| Liberia | 50 | 0.1% |
| Malaysia | 65 | 0.1% |
| Mexico | 183 | 0.4% |
| Middle Africa | 22 | 0.1% |
| Morocco | 68 | 0.2% |
| Nepal | 170 | 0.4% |
| Netherlands | 21 | 0.1% |
| Nicaragua | 44 | 0.1% |
| Northern Africa | 226 | 0.5% |
| Northern Europe | 282 | 0.6% |
| Oceania | 18 | 0.0% |
| Pakistan | 1,119 | 2.5% |
| Panama | 61 | 0.1% |
| Peru | 374 | 0.8% |
| Philippines | 224 | 0.5% |
| Poland | 11 | 0.0% |
| Portugal | 6 | 0.0% |
| Romania | 4 | 0.0% |
| Russia | 106 | 0.2% |
| Saudi Arabia | 12 | 0.0% |
| Scotland | 15 | 0.0% |
| Sierra Leone | 27 | 0.1% |
| Somalia | 48 | 0.1% |
| South Africa | 11 | 0.0% |
| South America | 1,010 | 2.2% |
| South Central Asia | 4,544 | 10.0% |
| South Eastern Asia | 1,107 | 2.4% |
| Southern Europe | 220 | 0.5% |
| Spain | 22 | 0.1% |
| Sudan | 35 | 0.1% |
| Sweden | 9 | 0.0% |
| Switzerland | 46 | 0.1% |
| Syria | 67 | 0.2% |
| Taiwan | 33 | 0.1% |
| Thailand | 37 | 0.1% |
| Trinidad and Tobago | 9 | 0.0% |
| Ukraine | 137 | 0.3% |
| Venezuela | 44 | 0.1% |
| Vietnam | 594 | 1.3% |
| West Indies | 82 | 0.2% |
| Western Africa | 206 | 0.4% |
| Western Asia | 368 | 0.8% |
| Western Europe | 332 | 0.7% | View All 95 Rows |
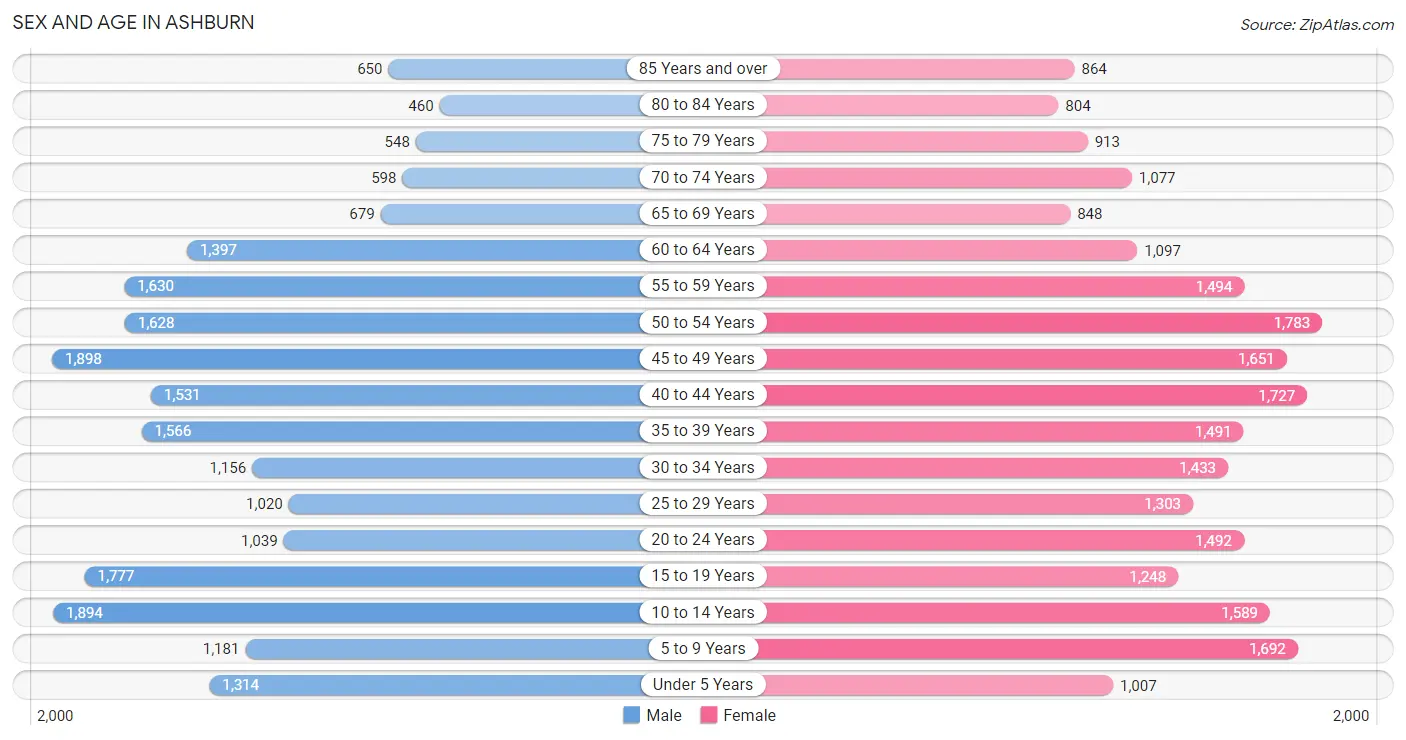
Sex and Age in Ashburn
Sex and Age in Ashburn
The most populous age groups in Ashburn are 45 to 49 Years (1,898 | 8.6%) for men and 50 to 54 Years (1,783 | 7.6%) for women.
| Age Bracket | Male | Female |
| Under 5 Years | 1,314 (6.0%) | 1,007 (4.3%) |
| 5 to 9 Years | 1,181 (5.4%) | 1,692 (7.2%) |
| 10 to 14 Years | 1,894 (8.6%) | 1,589 (6.8%) |
| 15 to 19 Years | 1,777 (8.1%) | 1,248 (5.3%) |
| 20 to 24 Years | 1,039 (4.7%) | 1,492 (6.4%) |
| 25 to 29 Years | 1,020 (4.6%) | 1,303 (5.5%) |
| 30 to 34 Years | 1,156 (5.3%) | 1,433 (6.1%) |
| 35 to 39 Years | 1,566 (7.1%) | 1,491 (6.3%) |
| 40 to 44 Years | 1,531 (7.0%) | 1,727 (7.3%) |
| 45 to 49 Years | 1,898 (8.6%) | 1,651 (7.0%) |
| 50 to 54 Years | 1,628 (7.4%) | 1,783 (7.6%) |
| 55 to 59 Years | 1,630 (7.4%) | 1,494 (6.4%) |
| 60 to 64 Years | 1,397 (6.4%) | 1,097 (4.7%) |
| 65 to 69 Years | 679 (3.1%) | 848 (3.6%) |
| 70 to 74 Years | 598 (2.7%) | 1,077 (4.6%) |
| 75 to 79 Years | 548 (2.5%) | 913 (3.9%) |
| 80 to 84 Years | 460 (2.1%) | 804 (3.4%) |
| 85 Years and over | 650 (3.0%) | 864 (3.7%) |
| Total | 21,966 (100.0%) | 23,513 (100.0%) |
Families and Households in Ashburn
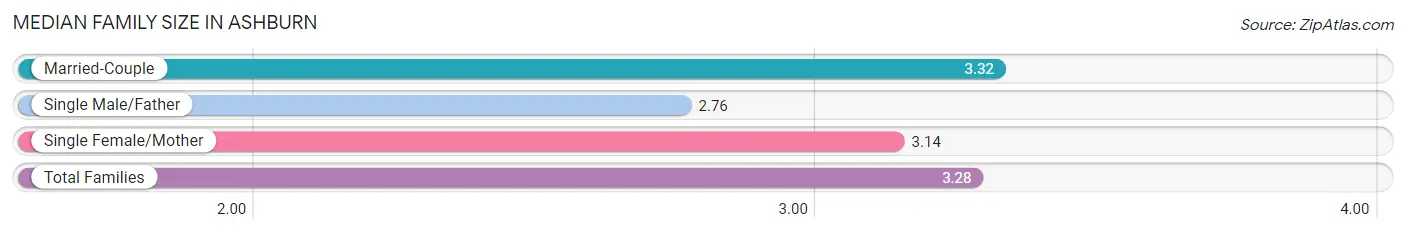
Median Family Size in Ashburn
The median family size in Ashburn is 3.28 persons per family, with married-couple families (10,229 | 87.4%) accounting for the largest median family size of 3.32 persons per family. On the other hand, single male/father families (332 | 2.8%) represent the smallest median family size with 2.76 persons per family.
| Family Type | # Families | Family Size |
| Married-Couple | 10,229 (87.4%) | 3.32 |
| Single Male/Father | 332 (2.8%) | 2.76 |
| Single Female/Mother | 1,150 (9.8%) | 3.14 |
| Total Families | 11,711 (100.0%) | 3.28 |
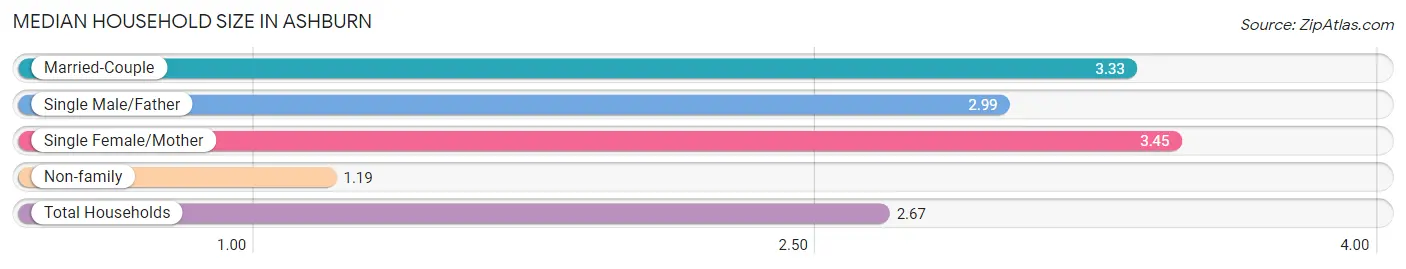
Median Household Size in Ashburn
The median household size in Ashburn is 2.67 persons per household, with single female/mother households (1,150 | 6.8%) accounting for the largest median household size of 3.45 persons per household. non-family households (5,315 | 31.2%) represent the smallest median household size with 1.19 persons per household.
| Household Type | # Households | Household Size |
| Married-Couple | 10,229 (60.1%) | 3.33 |
| Single Male/Father | 332 (1.9%) | 2.99 |
| Single Female/Mother | 1,150 (6.8%) | 3.45 |
| Non-family | 5,315 (31.2%) | 1.19 |
| Total Households | 17,026 (100.0%) | 2.67 |
Household Size by Marriage Status in Ashburn
Out of a total of 17,026 households in Ashburn, 11,711 (68.8%) are family households, while 5,315 (31.2%) are nonfamily households. The most numerous type of family households are 2-person households, comprising 4,587, and the most common type of nonfamily households are 1-person households, comprising 4,582.
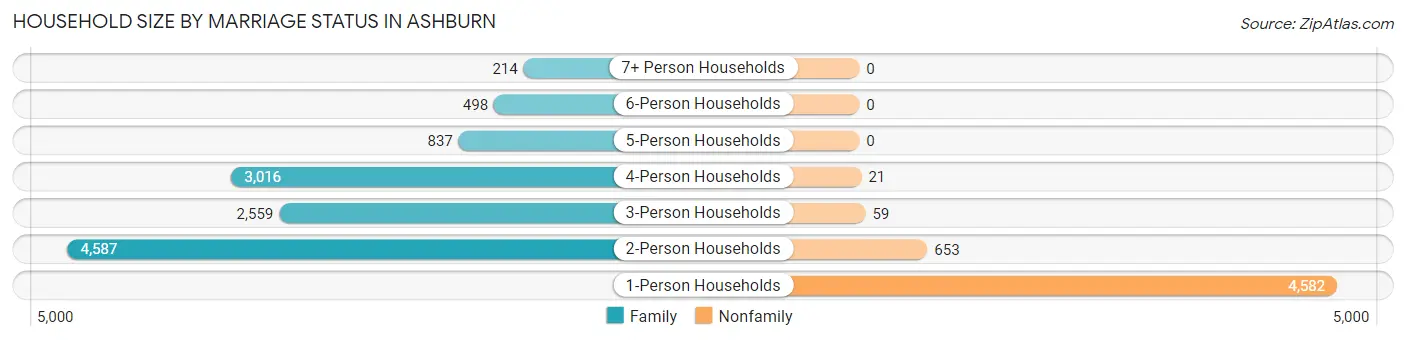
| Household Size | Family Households | Nonfamily Households |
| 1-Person Households | - | 4,582 (26.9%) |
| 2-Person Households | 4,587 (26.9%) | 653 (3.8%) |
| 3-Person Households | 2,559 (15.0%) | 59 (0.4%) |
| 4-Person Households | 3,016 (17.7%) | 21 (0.1%) |
| 5-Person Households | 837 (4.9%) | 0 (0.0%) |
| 6-Person Households | 498 (2.9%) | 0 (0.0%) |
| 7+ Person Households | 214 (1.3%) | 0 (0.0%) |
| Total | 11,711 (68.8%) | 5,315 (31.2%) |
Female Fertility in Ashburn
Fertility by Age in Ashburn
Average fertility rate in Ashburn is 31.0 births per 1,000 women. Women in the age bracket of 20 to 34 years have the highest fertility rate with 52.0 births per 1,000 women. Women in the age bracket of 20 to 34 years acount for 67.4% of all women with births.
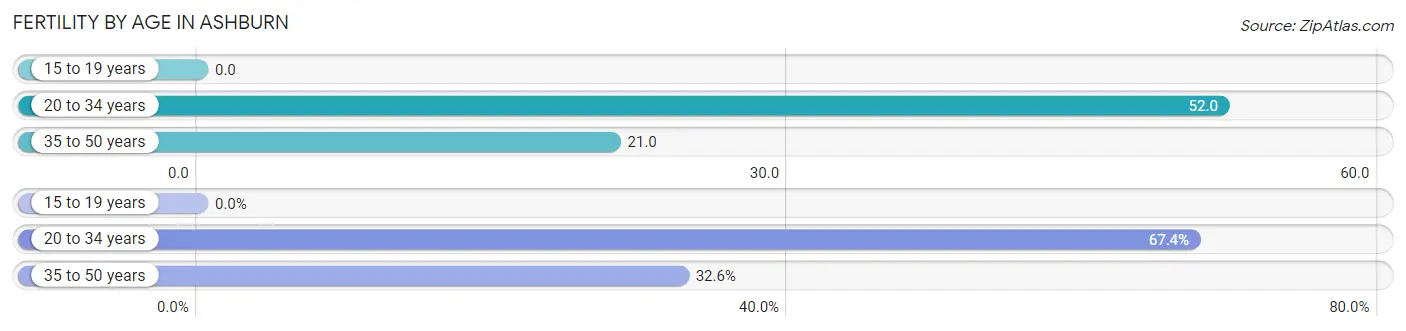
| Age Bracket | Women with Births | Births / 1,000 Women |
| 15 to 19 years | 0 (0.0%) | 0.0 |
| 20 to 34 years | 221 (67.4%) | 52.0 |
| 35 to 50 years | 107 (32.6%) | 21.0 |
| Total | 328 (100.0%) | 31.0 |
Fertility by Age by Marriage Status in Ashburn
84.5% of women with births (328) in Ashburn are married. The highest percentage of unmarried women with births falls into 20 to 34 years age bracket with 16.3% of them unmarried at the time of birth, while the lowest percentage of unmarried women with births belong to 35 to 50 years age bracket with 14.0% of them unmarried.
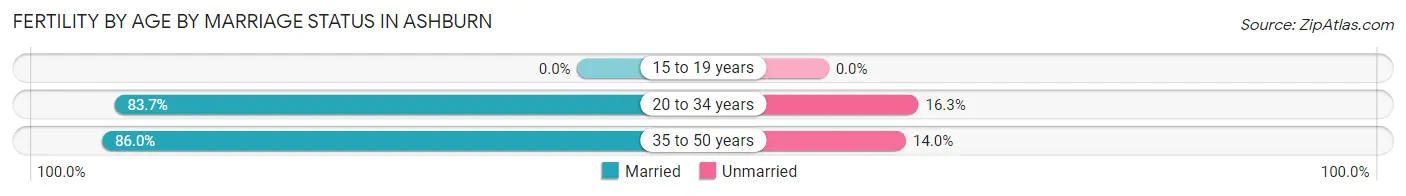
| Age Bracket | Married | Unmarried |
| 15 to 19 years | 0 (0.0%) | 0 (0.0%) |
| 20 to 34 years | 185 (83.7%) | 36 (16.3%) |
| 35 to 50 years | 92 (86.0%) | 15 (14.0%) |
| Total | 277 (84.5%) | 51 (15.5%) |
Fertility by Education in Ashburn
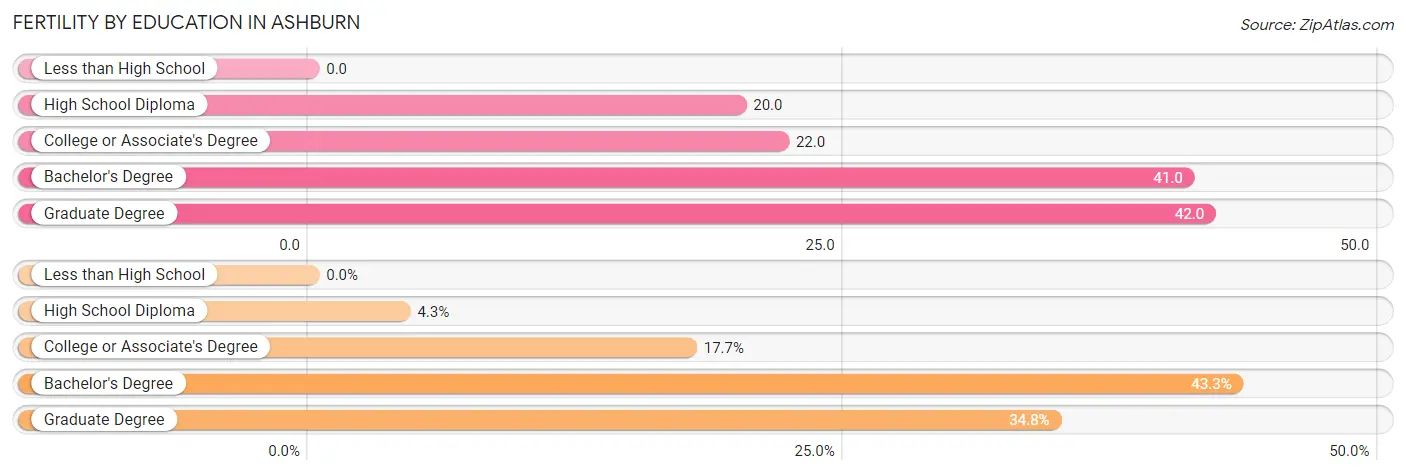
| Educational Attainment | Women with Births | Births / 1,000 Women |
| Less than High School | 0 (0.0%) | 0.0 |
| High School Diploma | 14 (4.3%) | 20.0 |
| College or Associate's Degree | 58 (17.7%) | 22.0 |
| Bachelor's Degree | 142 (43.3%) | 41.0 |
| Graduate Degree | 114 (34.8%) | 42.0 |
| Total | 328 (100.0%) | 31.0 |
Fertility by Education by Marriage Status in Ashburn
15.5% of women with births in Ashburn are unmarried. Women with the educational attainment of high school diploma are most likely to be married with 100.0% of them married at childbirth, while women with the educational attainment of college or associate's degree are least likely to be married with 44.8% of them unmarried at childbirth.
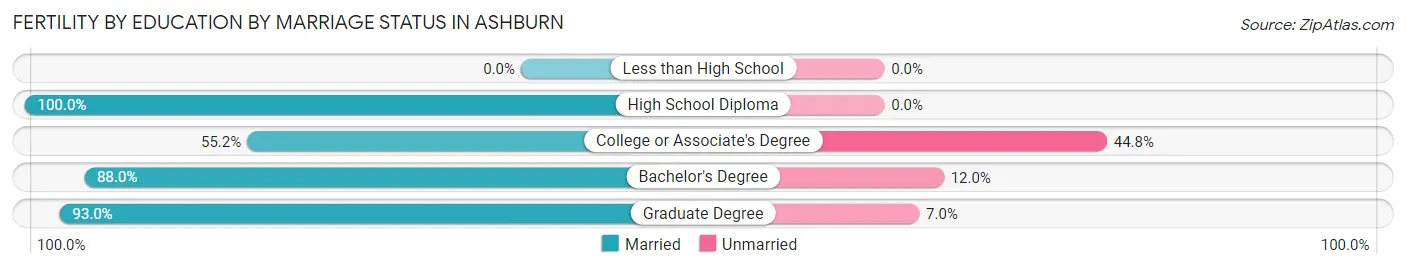
| Educational Attainment | Married | Unmarried |
| Less than High School | 0 (0.0%) | 0 (0.0%) |
| High School Diploma | 14 (100.0%) | 0 (0.0%) |
| College or Associate's Degree | 32 (55.2%) | 26 (44.8%) |
| Bachelor's Degree | 125 (88.0%) | 17 (12.0%) |
| Graduate Degree | 106 (93.0%) | 8 (7.0%) |
| Total | 277 (84.5%) | 51 (15.5%) |
Employment Characteristics in Ashburn
Employment by Class of Employer in Ashburn
Among the 23,991 employed individuals in Ashburn, private company employees (16,457 | 68.6%), federal government employees (2,029 | 8.5%), and not-for-profit organizations (1,888 | 7.9%) make up the most common classes of employment.
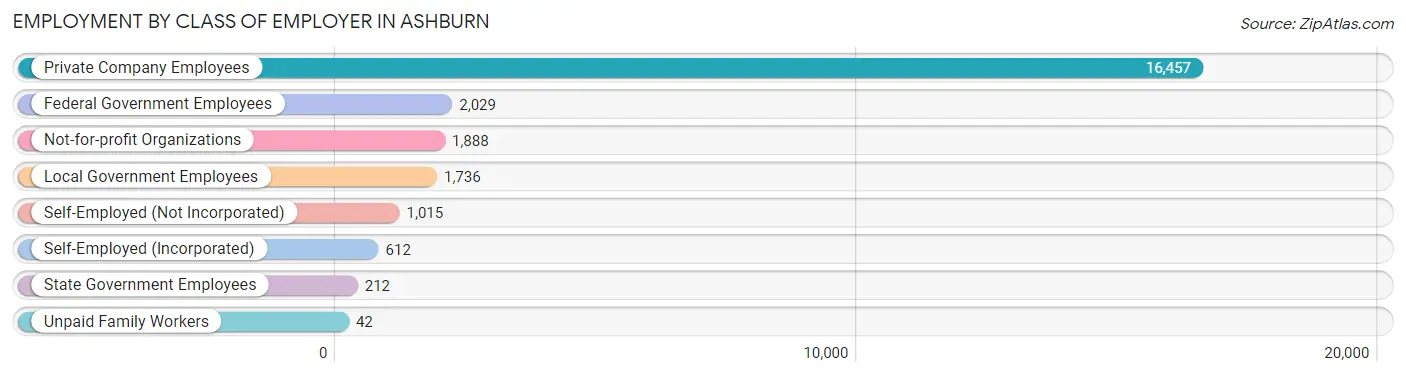
| Employer Class | # Employees | % Employees |
| Private Company Employees | 16,457 | 68.6% |
| Self-Employed (Incorporated) | 612 | 2.5% |
| Self-Employed (Not Incorporated) | 1,015 | 4.2% |
| Not-for-profit Organizations | 1,888 | 7.9% |
| Local Government Employees | 1,736 | 7.2% |
| State Government Employees | 212 | 0.9% |
| Federal Government Employees | 2,029 | 8.5% |
| Unpaid Family Workers | 42 | 0.2% |
| Total | 23,991 | 100.0% |
Employment Status by Age in Ashburn
According to the labor force statistics for Ashburn, out of the total population over 16 years of age (36,295), 68.8% or 24,971 individuals are in the labor force, with 2.7% or 674 of them unemployed. The age group with the highest labor force participation rate is 35 to 44 years, with 89.9% or 5,677 individuals in the labor force. Within the labor force, the 16 to 19 years age range has the highest percentage of unemployed individuals, with 8.5% or 78 of them being unemployed.
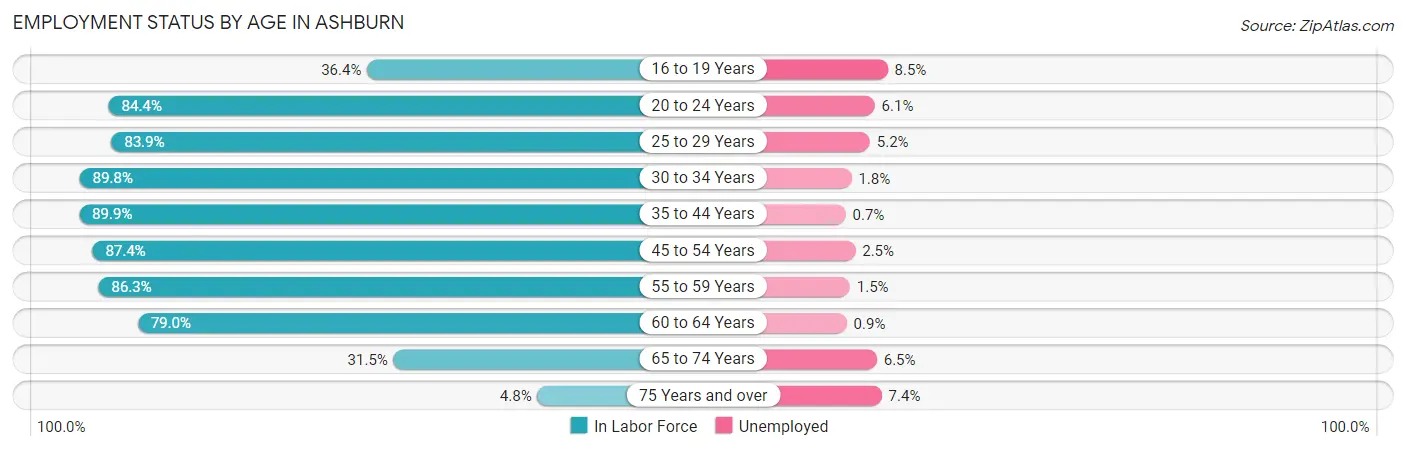
| Age Bracket | In Labor Force | Unemployed |
| 16 to 19 Years | 917 (36.4%) | 78 (8.5%) |
| 20 to 24 Years | 2,136 (84.4%) | 130 (6.1%) |
| 25 to 29 Years | 1,949 (83.9%) | 101 (5.2%) |
| 30 to 34 Years | 2,325 (89.8%) | 42 (1.8%) |
| 35 to 44 Years | 5,677 (89.9%) | 40 (0.7%) |
| 45 to 54 Years | 6,083 (87.4%) | 152 (2.5%) |
| 55 to 59 Years | 2,696 (86.3%) | 40 (1.5%) |
| 60 to 64 Years | 1,970 (79.0%) | 18 (0.9%) |
| 65 to 74 Years | 1,009 (31.5%) | 66 (6.5%) |
| 75 Years and over | 203 (4.8%) | 15 (7.4%) |
| Total | 24,971 (68.8%) | 674 (2.7%) |
Employment Status by Educational Attainment in Ashburn
According to labor force statistics for Ashburn, 87.0% of individuals (20,710) out of the total population between 25 and 64 years of age (23,805) are in the labor force, with 1.9% or 393 of them being unemployed. The group with the highest labor force participation rate are those with the educational attainment of bachelor's degree or higher, with 90.9% or 14,739 individuals in the labor force. Within the labor force, individuals with less than high school education have the highest percentage of unemployment, with 3.3% or 20 of them being unemployed.
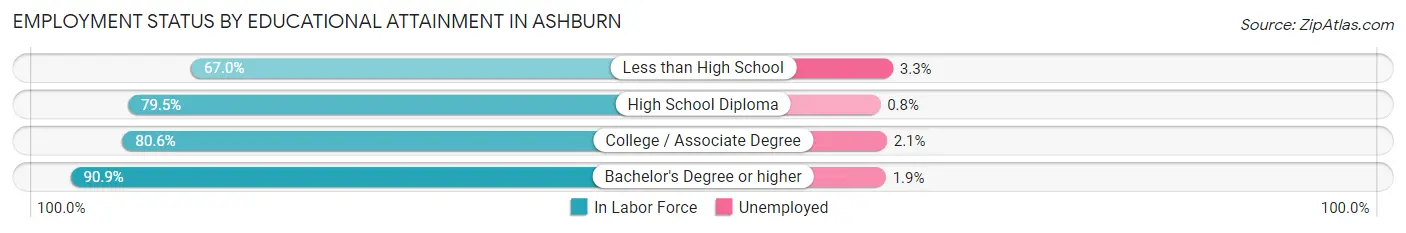
| Educational Attainment | In Labor Force | Unemployed |
| Less than High School | 609 (67.0%) | 30 (3.3%) |
| High School Diploma | 1,429 (79.5%) | 14 (0.8%) |
| College / Associate Degree | 3,937 (80.6%) | 103 (2.1%) |
| Bachelor's Degree or higher | 14,739 (90.9%) | 308 (1.9%) |
| Total | 20,710 (87.0%) | 452 (1.9%) |
Employment Occupations by Sex in Ashburn
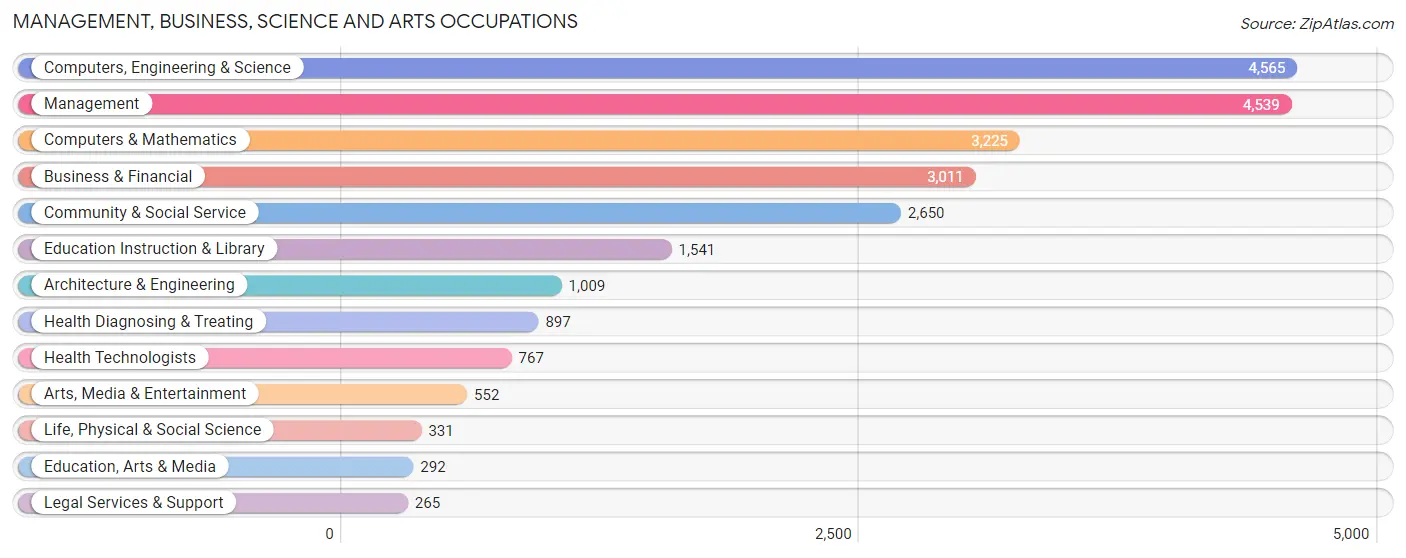
Management, Business, Science and Arts Occupations
The most common Management, Business, Science and Arts occupations in Ashburn are Computers, Engineering & Science (4,565 | 18.8%), Management (4,539 | 18.7%), Computers & Mathematics (3,225 | 13.3%), Business & Financial (3,011 | 12.4%), and Community & Social Service (2,650 | 10.9%).
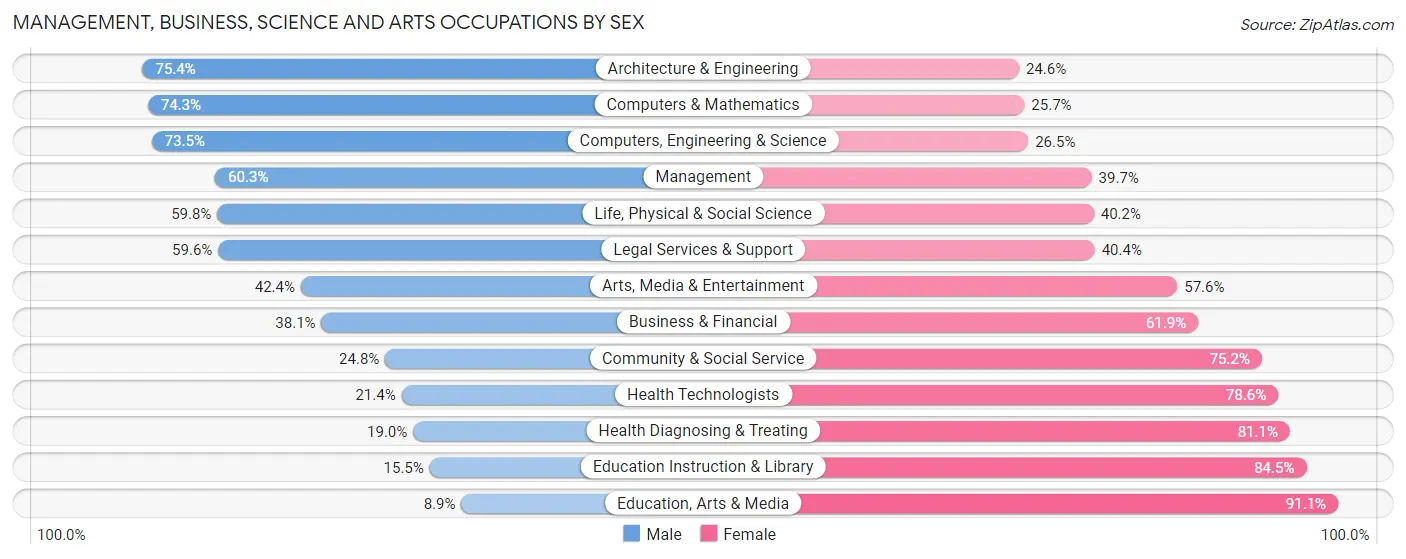
Management, Business, Science and Arts Occupations by Sex
Within the Management, Business, Science and Arts occupations in Ashburn, the most male-oriented occupations are Architecture & Engineering (75.4%), Computers & Mathematics (74.3%), and Computers, Engineering & Science (73.5%), while the most female-oriented occupations are Education, Arts & Media (91.1%), Education Instruction & Library (84.5%), and Health Diagnosing & Treating (81.0%).
| Occupation | Male | Female |
| Management | 2,735 (60.3%) | 1,804 (39.7%) |
| Business & Financial | 1,147 (38.1%) | 1,864 (61.9%) |
| Computers, Engineering & Science | 3,355 (73.5%) | 1,210 (26.5%) |
| Computers & Mathematics | 2,396 (74.3%) | 829 (25.7%) |
| Architecture & Engineering | 761 (75.4%) | 248 (24.6%) |
| Life, Physical & Social Science | 198 (59.8%) | 133 (40.2%) |
| Community & Social Service | 657 (24.8%) | 1,993 (75.2%) |
| Education, Arts & Media | 26 (8.9%) | 266 (91.1%) |
| Legal Services & Support | 158 (59.6%) | 107 (40.4%) |
| Education Instruction & Library | 239 (15.5%) | 1,302 (84.5%) |
| Arts, Media & Entertainment | 234 (42.4%) | 318 (57.6%) |
| Health Diagnosing & Treating | 170 (19.0%) | 727 (81.0%) |
| Health Technologists | 164 (21.4%) | 603 (78.6%) |
| Total (Category) | 8,064 (51.5%) | 7,598 (48.5%) |
| Total (Overall) | 12,940 (53.4%) | 11,294 (46.6%) |
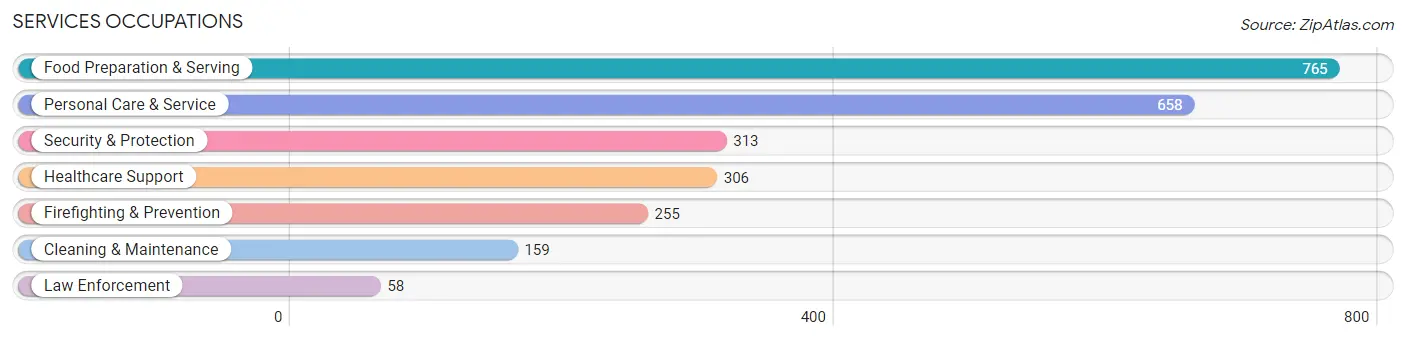
Services Occupations
The most common Services occupations in Ashburn are Food Preparation & Serving (765 | 3.2%), Personal Care & Service (658 | 2.7%), Security & Protection (313 | 1.3%), Healthcare Support (306 | 1.3%), and Firefighting & Prevention (255 | 1.1%).
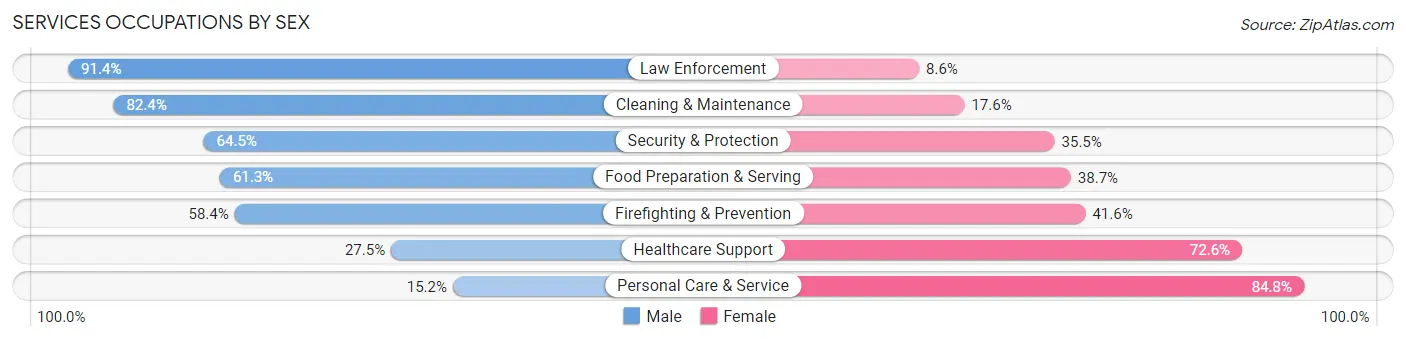
Services Occupations by Sex
Within the Services occupations in Ashburn, the most male-oriented occupations are Law Enforcement (91.4%), Cleaning & Maintenance (82.4%), and Security & Protection (64.5%), while the most female-oriented occupations are Personal Care & Service (84.8%), Healthcare Support (72.6%), and Firefighting & Prevention (41.6%).
| Occupation | Male | Female |
| Healthcare Support | 84 (27.5%) | 222 (72.6%) |
| Security & Protection | 202 (64.5%) | 111 (35.5%) |
| Firefighting & Prevention | 149 (58.4%) | 106 (41.6%) |
| Law Enforcement | 53 (91.4%) | 5 (8.6%) |
| Food Preparation & Serving | 469 (61.3%) | 296 (38.7%) |
| Cleaning & Maintenance | 131 (82.4%) | 28 (17.6%) |
| Personal Care & Service | 100 (15.2%) | 558 (84.8%) |
| Total (Category) | 986 (44.8%) | 1,215 (55.2%) |
| Total (Overall) | 12,940 (53.4%) | 11,294 (46.6%) |
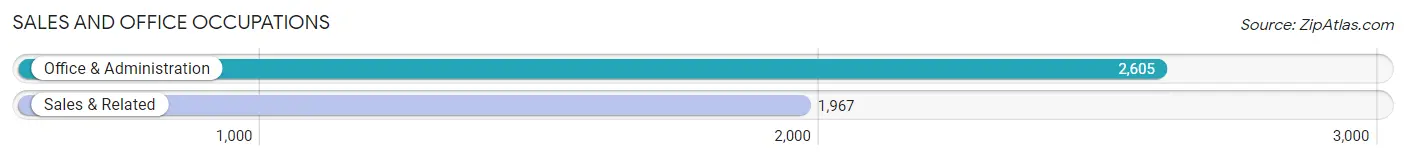
Sales and Office Occupations
The most common Sales and Office occupations in Ashburn are Office & Administration (2,605 | 10.7%), and Sales & Related (1,967 | 8.1%).
Sales and Office Occupations by Sex
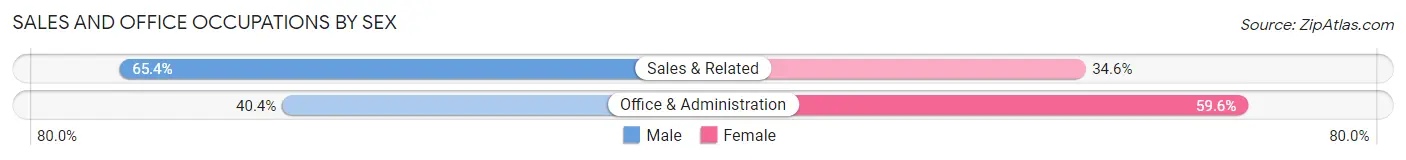
| Occupation | Male | Female |
| Sales & Related | 1,287 (65.4%) | 680 (34.6%) |
| Office & Administration | 1,052 (40.4%) | 1,553 (59.6%) |
| Total (Category) | 2,339 (51.2%) | 2,233 (48.8%) |
| Total (Overall) | 12,940 (53.4%) | 11,294 (46.6%) |
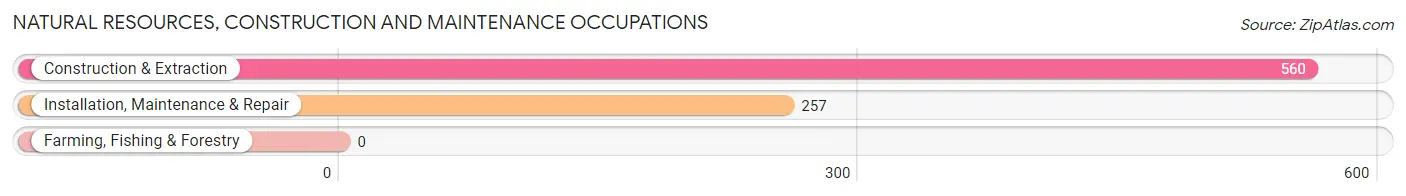
Natural Resources, Construction and Maintenance Occupations
The most common Natural Resources, Construction and Maintenance occupations in Ashburn are Construction & Extraction (560 | 2.3%), and Installation, Maintenance & Repair (257 | 1.1%).
Natural Resources, Construction and Maintenance Occupations by Sex
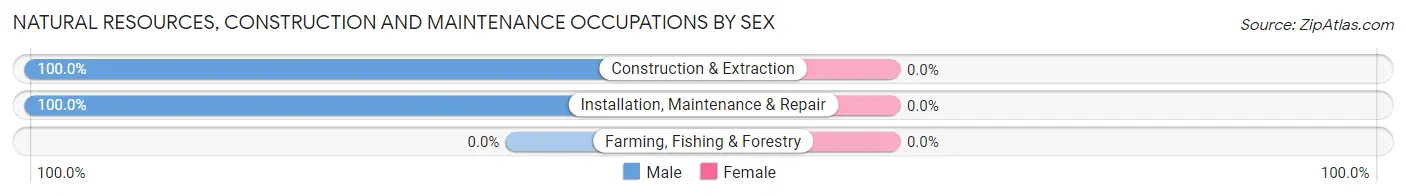
| Occupation | Male | Female |
| Farming, Fishing & Forestry | 0 (0.0%) | 0 (0.0%) |
| Construction & Extraction | 560 (100.0%) | 0 (0.0%) |
| Installation, Maintenance & Repair | 257 (100.0%) | 0 (0.0%) |
| Total (Category) | 817 (100.0%) | 0 (0.0%) |
| Total (Overall) | 12,940 (53.4%) | 11,294 (46.6%) |
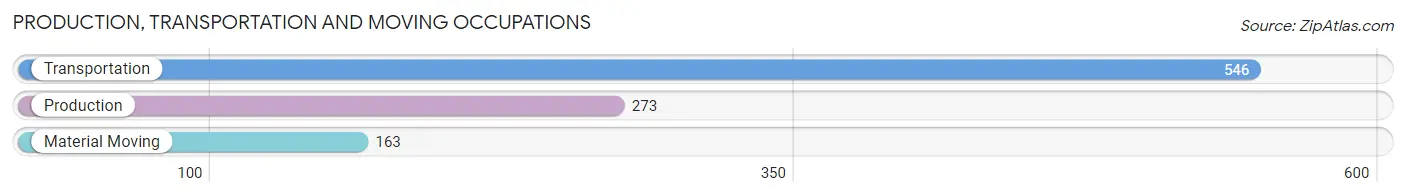
Production, Transportation and Moving Occupations
The most common Production, Transportation and Moving occupations in Ashburn are Transportation (546 | 2.2%), Production (273 | 1.1%), and Material Moving (163 | 0.7%).
Production, Transportation and Moving Occupations by Sex
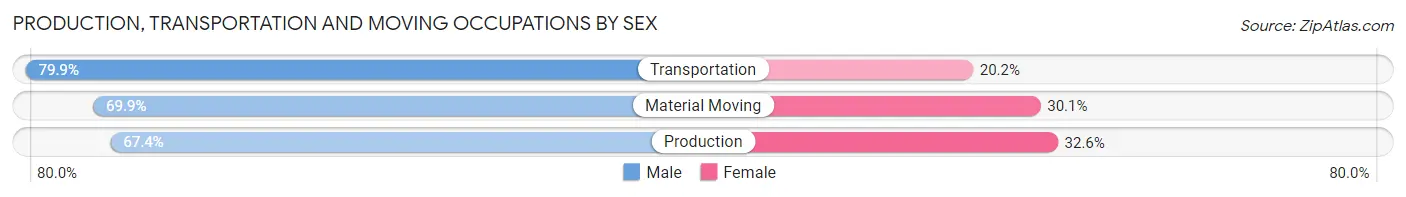
| Occupation | Male | Female |
| Production | 184 (67.4%) | 89 (32.6%) |
| Transportation | 436 (79.8%) | 110 (20.2%) |
| Material Moving | 114 (69.9%) | 49 (30.1%) |
| Total (Category) | 734 (74.8%) | 248 (25.3%) |
| Total (Overall) | 12,940 (53.4%) | 11,294 (46.6%) |
Employment Industries by Sex in Ashburn
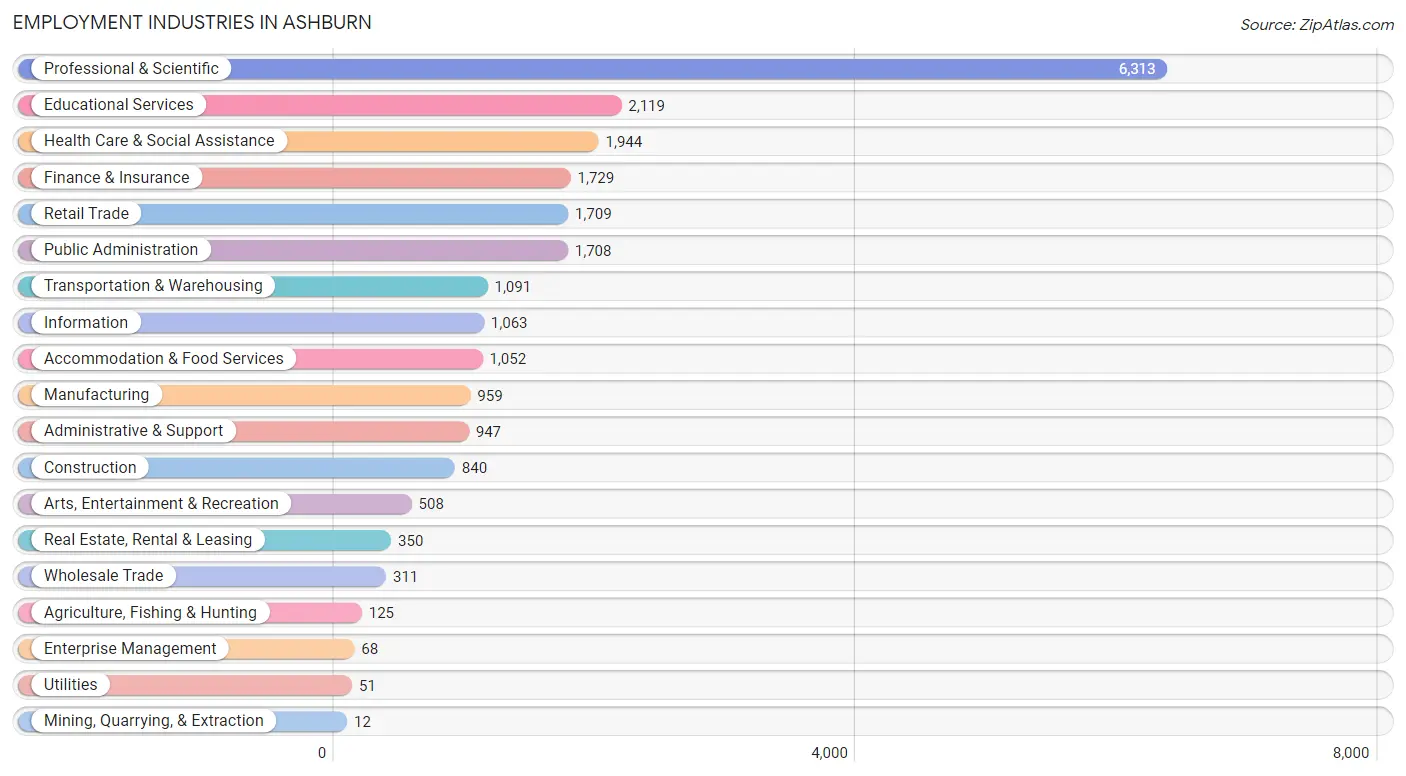
Employment Industries in Ashburn
The major employment industries in Ashburn include Professional & Scientific (6,313 | 26.1%), Educational Services (2,119 | 8.7%), Health Care & Social Assistance (1,944 | 8.0%), Finance & Insurance (1,729 | 7.1%), and Retail Trade (1,709 | 7.0%).
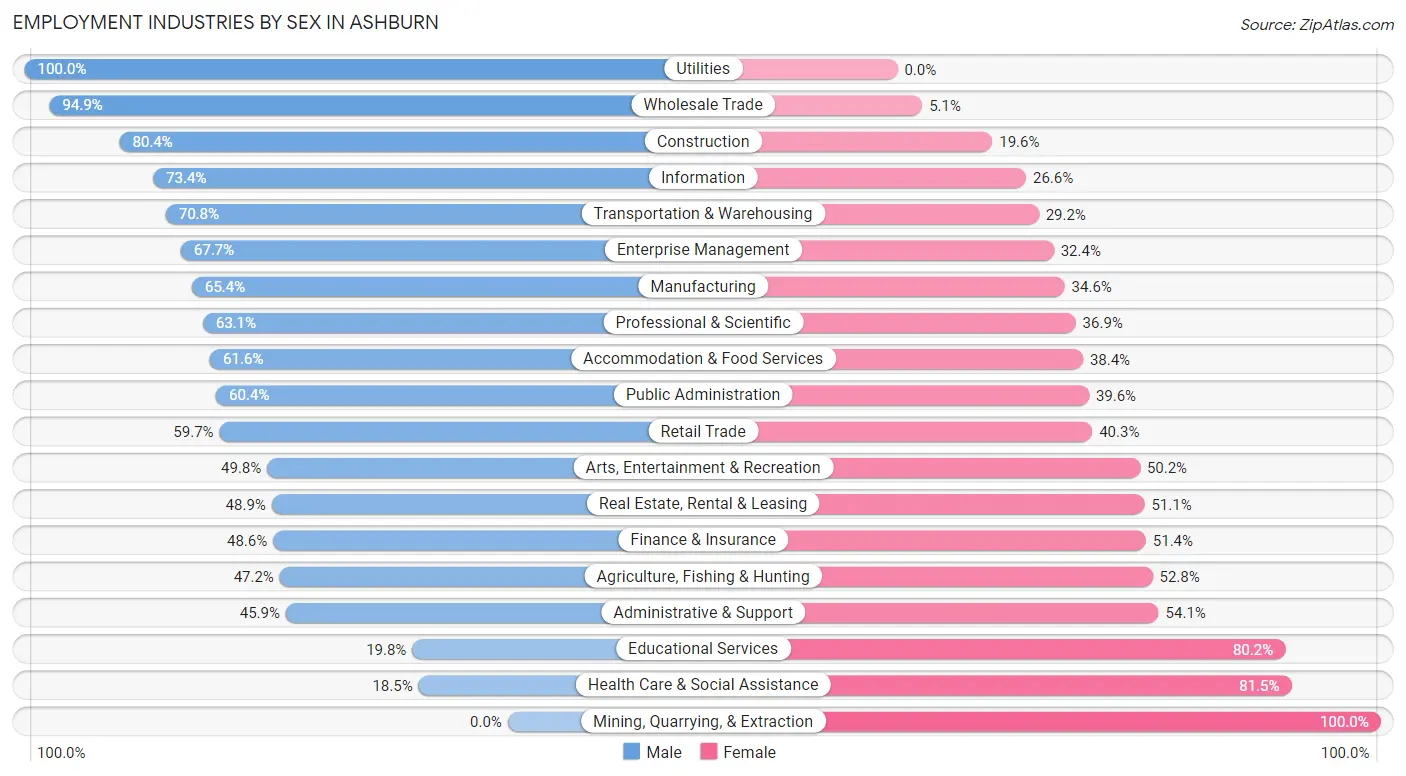
Employment Industries by Sex in Ashburn
The Ashburn industries that see more men than women are Utilities (100.0%), Wholesale Trade (94.9%), and Construction (80.4%), whereas the industries that tend to have a higher number of women are Mining, Quarrying, & Extraction (100.0%), Health Care & Social Assistance (81.5%), and Educational Services (80.2%).
| Industry | Male | Female |
| Agriculture, Fishing & Hunting | 59 (47.2%) | 66 (52.8%) |
| Mining, Quarrying, & Extraction | 0 (0.0%) | 12 (100.0%) |
| Construction | 675 (80.4%) | 165 (19.6%) |
| Manufacturing | 627 (65.4%) | 332 (34.6%) |
| Wholesale Trade | 295 (94.9%) | 16 (5.1%) |
| Retail Trade | 1,020 (59.7%) | 689 (40.3%) |
| Transportation & Warehousing | 772 (70.8%) | 319 (29.2%) |
| Utilities | 51 (100.0%) | 0 (0.0%) |
| Information | 780 (73.4%) | 283 (26.6%) |
| Finance & Insurance | 840 (48.6%) | 889 (51.4%) |
| Real Estate, Rental & Leasing | 171 (48.9%) | 179 (51.1%) |
| Professional & Scientific | 3,984 (63.1%) | 2,329 (36.9%) |
| Enterprise Management | 46 (67.6%) | 22 (32.4%) |
| Administrative & Support | 435 (45.9%) | 512 (54.1%) |
| Educational Services | 419 (19.8%) | 1,700 (80.2%) |
| Health Care & Social Assistance | 359 (18.5%) | 1,585 (81.5%) |
| Arts, Entertainment & Recreation | 253 (49.8%) | 255 (50.2%) |
| Accommodation & Food Services | 648 (61.6%) | 404 (38.4%) |
| Public Administration | 1,031 (60.4%) | 677 (39.6%) |
| Total | 12,940 (53.4%) | 11,294 (46.6%) |
Education in Ashburn
School Enrollment in Ashburn
The most common levels of schooling among the 11,941 students in Ashburn are high school (2,804 | 23.5%), middle school (2,632 | 22.0%), and college / undergraduate (2,422 | 20.3%).
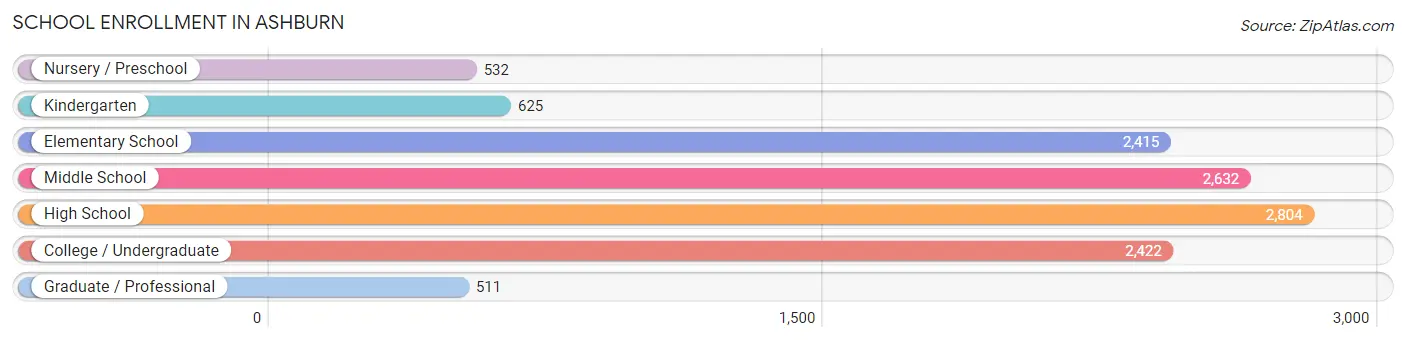
| School Level | # Students | % Students |
| Nursery / Preschool | 532 | 4.5% |
| Kindergarten | 625 | 5.2% |
| Elementary School | 2,415 | 20.2% |
| Middle School | 2,632 | 22.0% |
| High School | 2,804 | 23.5% |
| College / Undergraduate | 2,422 | 20.3% |
| Graduate / Professional | 511 | 4.3% |
| Total | 11,941 | 100.0% |
School Enrollment by Age by Funding Source in Ashburn
Out of a total of 11,941 students who are enrolled in schools in Ashburn, 1,672 (14.0%) attend a private institution, while the remaining 10,269 (86.0%) are enrolled in public schools. The age group of 3 to 4 year olds has the highest likelihood of being enrolled in private schools, with 305 (77.4% in the age bracket) enrolled. Conversely, the age group of 15 to 17 year olds has the lowest likelihood of being enrolled in a private school, with 1,821 (97.6% in the age bracket) attending a public institution.
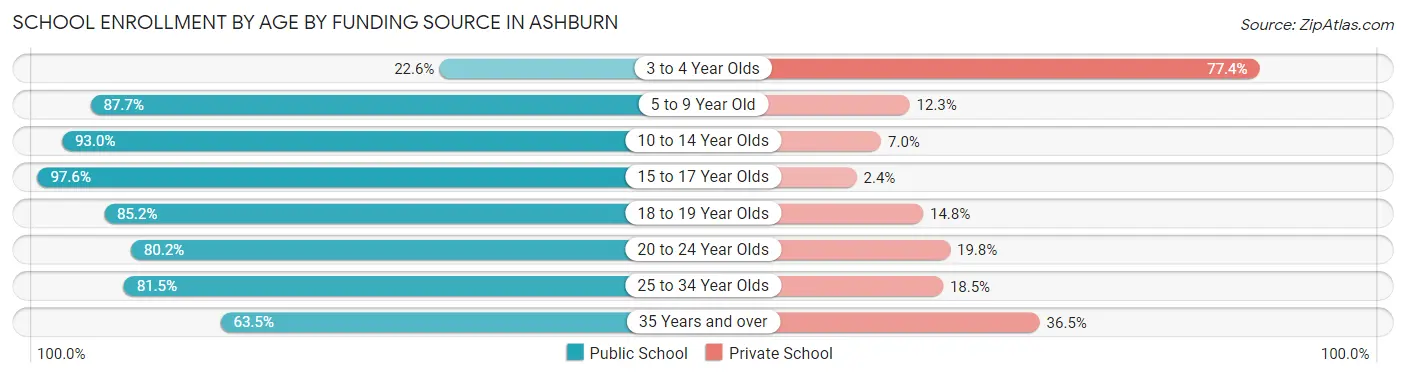
| Age Bracket | Public School | Private School |
| 3 to 4 Year Olds | 89 (22.6%) | 305 (77.4%) |
| 5 to 9 Year Old | 2,429 (87.7%) | 340 (12.3%) |
| 10 to 14 Year Olds | 3,188 (93.0%) | 239 (7.0%) |
| 15 to 17 Year Olds | 1,821 (97.6%) | 45 (2.4%) |
| 18 to 19 Year Olds | 922 (85.2%) | 160 (14.8%) |
| 20 to 24 Year Olds | 927 (80.2%) | 229 (19.8%) |
| 25 to 34 Year Olds | 476 (81.5%) | 108 (18.5%) |
| 35 Years and over | 421 (63.5%) | 242 (36.5%) |
| Total | 10,269 (86.0%) | 1,672 (14.0%) |
Educational Attainment by Field of Study in Ashburn
Business (4,363 | 20.1%), engineering (2,837 | 13.1%), social sciences (2,359 | 10.9%), computers & mathematics (2,273 | 10.5%), and education (1,680 | 7.7%) are the most common fields of study among 21,700 individuals in Ashburn who have obtained a bachelor's degree or higher.
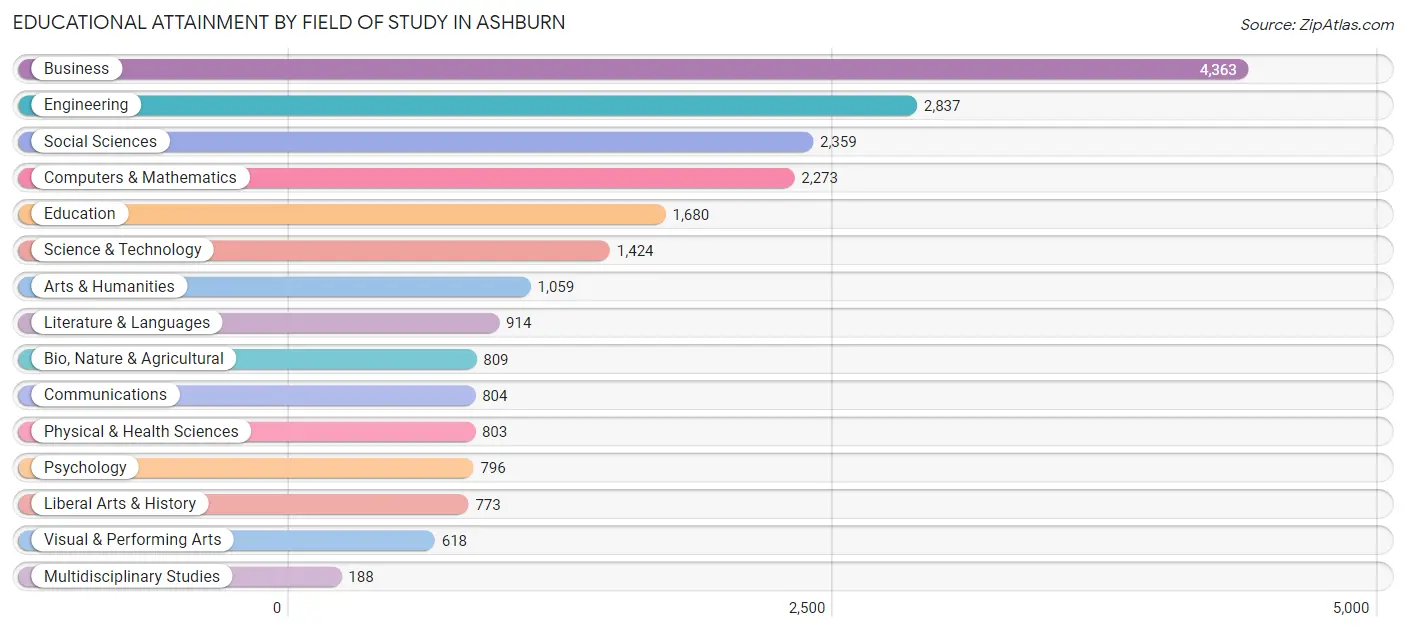
| Field of Study | # Graduates | % Graduates |
| Computers & Mathematics | 2,273 | 10.5% |
| Bio, Nature & Agricultural | 809 | 3.7% |
| Physical & Health Sciences | 803 | 3.7% |
| Psychology | 796 | 3.7% |
| Social Sciences | 2,359 | 10.9% |
| Engineering | 2,837 | 13.1% |
| Multidisciplinary Studies | 188 | 0.9% |
| Science & Technology | 1,424 | 6.6% |
| Business | 4,363 | 20.1% |
| Education | 1,680 | 7.7% |
| Literature & Languages | 914 | 4.2% |
| Liberal Arts & History | 773 | 3.6% |
| Visual & Performing Arts | 618 | 2.9% |
| Communications | 804 | 3.7% |
| Arts & Humanities | 1,059 | 4.9% |
| Total | 21,700 | 100.0% |
Transportation & Commute in Ashburn
Vehicle Availability by Sex in Ashburn
The most prevalent vehicle ownership categories in Ashburn are males with 2 vehicles (6,009, accounting for 46.7%) and females with 2 vehicles (5,078, making up 54.0%).
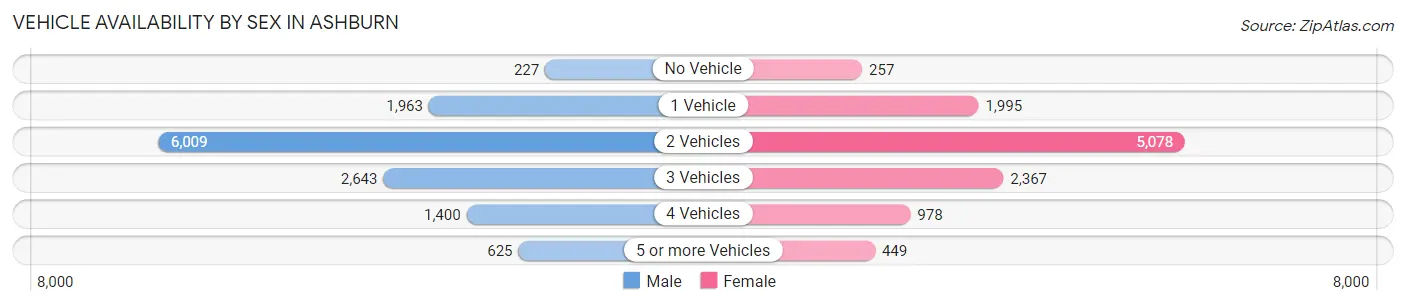
| Vehicles Available | Male | Female |
| No Vehicle | 227 (1.8%) | 257 (2.3%) |
| 1 Vehicle | 1,963 (15.3%) | 1,995 (17.9%) |
| 2 Vehicles | 6,009 (46.7%) | 5,078 (45.7%) |
| 3 Vehicles | 2,643 (20.5%) | 2,367 (21.3%) |
| 4 Vehicles | 1,400 (10.9%) | 978 (8.8%) |
| 5 or more Vehicles | 625 (4.9%) | 449 (4.0%) |
| Total | 12,867 (100.0%) | 11,124 (100.0%) |
Commute Time in Ashburn
The most frequently occuring commute durations in Ashburn are 15 to 19 minutes (3,072 commuters, 16.5%), 20 to 24 minutes (2,932 commuters, 15.8%), and 30 to 34 minutes (2,169 commuters, 11.7%).
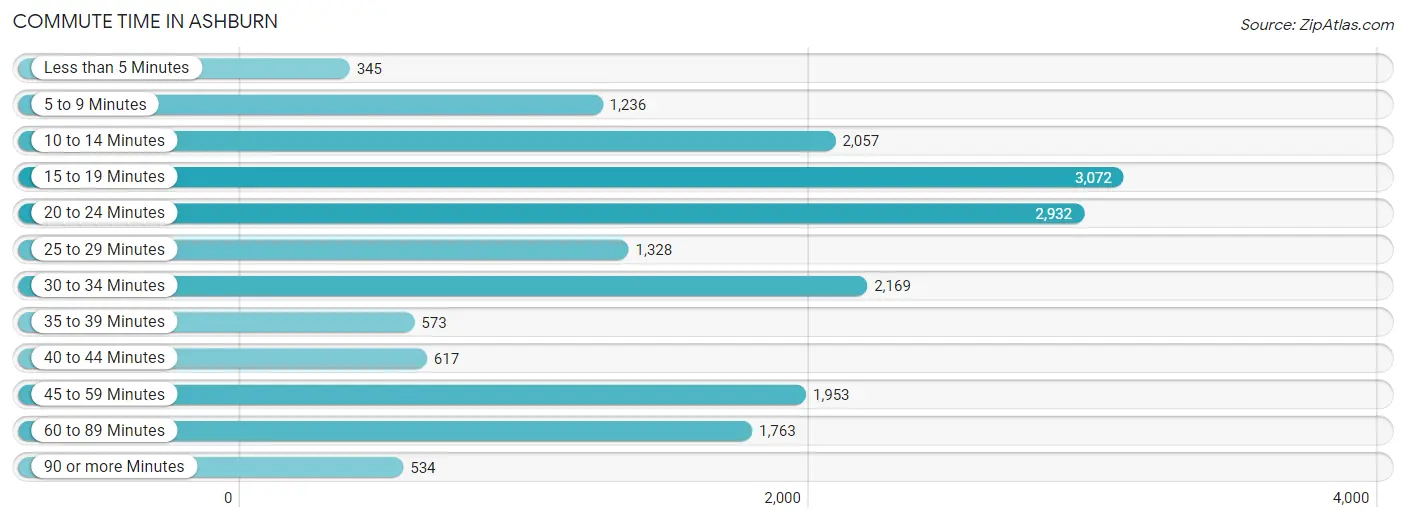
| Commute Time | # Commuters | % Commuters |
| Less than 5 Minutes | 345 | 1.9% |
| 5 to 9 Minutes | 1,236 | 6.7% |
| 10 to 14 Minutes | 2,057 | 11.1% |
| 15 to 19 Minutes | 3,072 | 16.5% |
| 20 to 24 Minutes | 2,932 | 15.8% |
| 25 to 29 Minutes | 1,328 | 7.1% |
| 30 to 34 Minutes | 2,169 | 11.7% |
| 35 to 39 Minutes | 573 | 3.1% |
| 40 to 44 Minutes | 617 | 3.3% |
| 45 to 59 Minutes | 1,953 | 10.5% |
| 60 to 89 Minutes | 1,763 | 9.5% |
| 90 or more Minutes | 534 | 2.9% |
Commute Time by Sex in Ashburn
The most common commute times in Ashburn are 15 to 19 minutes (1,685 commuters, 17.0%) for males and 20 to 24 minutes (1,561 commuters, 18.0%) for females.
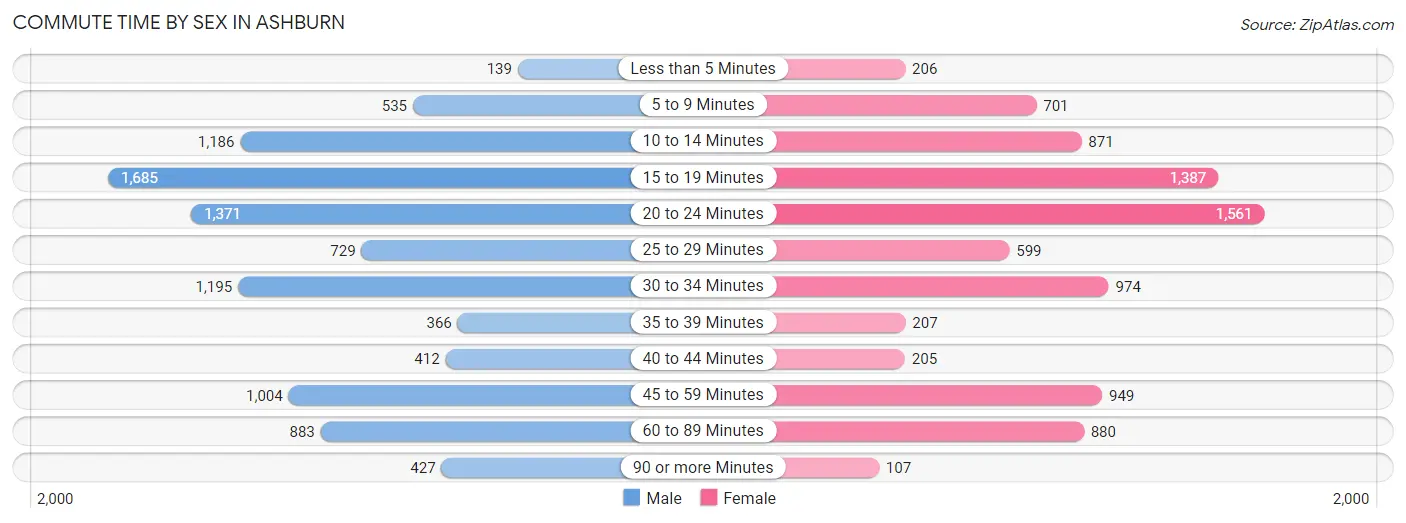
| Commute Time | Male | Female |
| Less than 5 Minutes | 139 (1.4%) | 206 (2.4%) |
| 5 to 9 Minutes | 535 (5.4%) | 701 (8.1%) |
| 10 to 14 Minutes | 1,186 (11.9%) | 871 (10.1%) |
| 15 to 19 Minutes | 1,685 (17.0%) | 1,387 (16.0%) |
| 20 to 24 Minutes | 1,371 (13.8%) | 1,561 (18.0%) |
| 25 to 29 Minutes | 729 (7.3%) | 599 (6.9%) |
| 30 to 34 Minutes | 1,195 (12.0%) | 974 (11.3%) |
| 35 to 39 Minutes | 366 (3.7%) | 207 (2.4%) |
| 40 to 44 Minutes | 412 (4.2%) | 205 (2.4%) |
| 45 to 59 Minutes | 1,004 (10.1%) | 949 (11.0%) |
| 60 to 89 Minutes | 883 (8.9%) | 880 (10.2%) |
| 90 or more Minutes | 427 (4.3%) | 107 (1.2%) |
Time of Departure to Work by Sex in Ashburn
The most frequent times of departure to work in Ashburn are 8:00 AM to 8:29 AM (1,539, 15.5%) for males and 8:00 AM to 8:29 AM (1,860, 21.5%) for females.
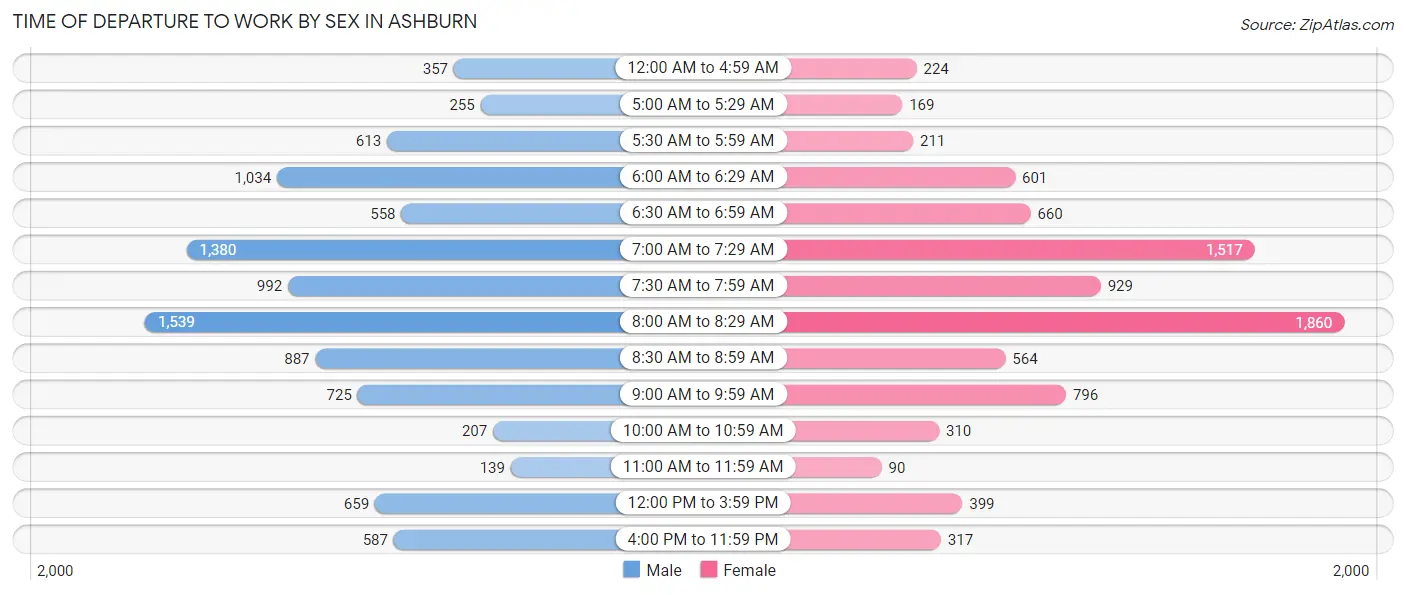
| Time of Departure | Male | Female |
| 12:00 AM to 4:59 AM | 357 (3.6%) | 224 (2.6%) |
| 5:00 AM to 5:29 AM | 255 (2.6%) | 169 (1.9%) |
| 5:30 AM to 5:59 AM | 613 (6.2%) | 211 (2.4%) |
| 6:00 AM to 6:29 AM | 1,034 (10.4%) | 601 (7.0%) |
| 6:30 AM to 6:59 AM | 558 (5.6%) | 660 (7.6%) |
| 7:00 AM to 7:29 AM | 1,380 (13.9%) | 1,517 (17.5%) |
| 7:30 AM to 7:59 AM | 992 (10.0%) | 929 (10.7%) |
| 8:00 AM to 8:29 AM | 1,539 (15.5%) | 1,860 (21.5%) |
| 8:30 AM to 8:59 AM | 887 (8.9%) | 564 (6.5%) |
| 9:00 AM to 9:59 AM | 725 (7.3%) | 796 (9.2%) |
| 10:00 AM to 10:59 AM | 207 (2.1%) | 310 (3.6%) |
| 11:00 AM to 11:59 AM | 139 (1.4%) | 90 (1.0%) |
| 12:00 PM to 3:59 PM | 659 (6.6%) | 399 (4.6%) |
| 4:00 PM to 11:59 PM | 587 (5.9%) | 317 (3.7%) |
| Total | 9,932 (100.0%) | 8,647 (100.0%) |
Housing Occupancy in Ashburn
Occupancy by Ownership in Ashburn
Of the total 17,026 dwellings in Ashburn, owner-occupied units account for 11,769 (69.1%), while renter-occupied units make up 5,257 (30.9%).
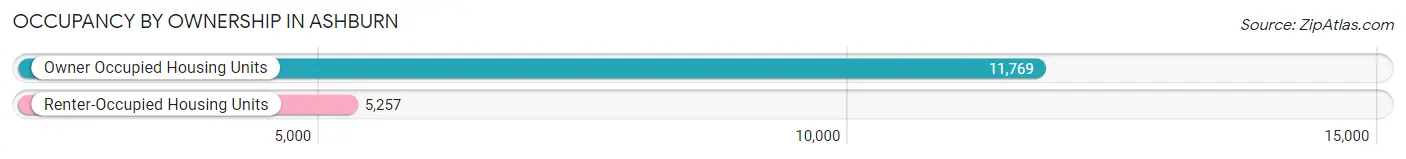
| Occupancy | # Housing Units | % Housing Units |
| Owner Occupied Housing Units | 11,769 | 69.1% |
| Renter-Occupied Housing Units | 5,257 | 30.9% |
| Total Occupied Housing Units | 17,026 | 100.0% |
Occupancy by Household Size in Ashburn
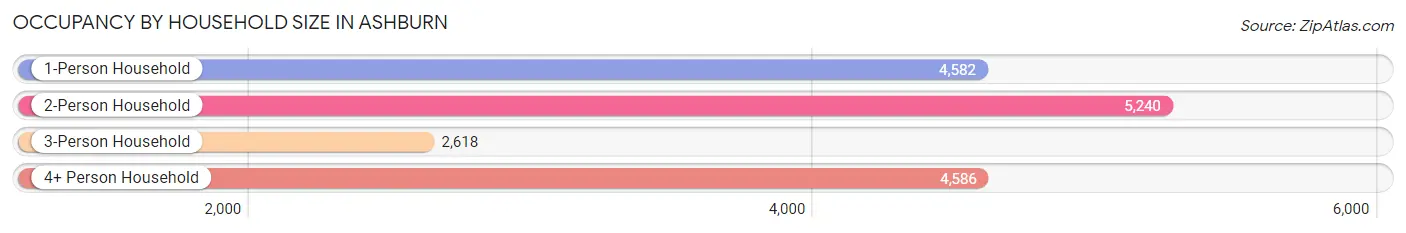
| Household Size | # Housing Units | % Housing Units |
| 1-Person Household | 4,582 | 26.9% |
| 2-Person Household | 5,240 | 30.8% |
| 3-Person Household | 2,618 | 15.4% |
| 4+ Person Household | 4,586 | 26.9% |
| Total Housing Units | 17,026 | 100.0% |
Occupancy by Ownership by Household Size in Ashburn
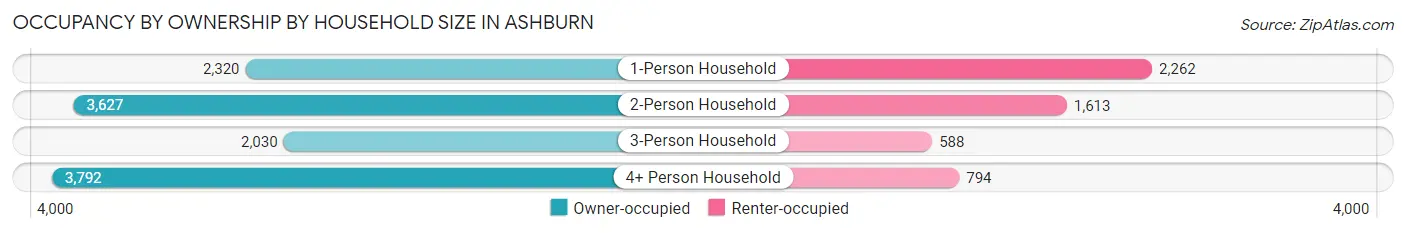
| Household Size | Owner-occupied | Renter-occupied |
| 1-Person Household | 2,320 (50.6%) | 2,262 (49.4%) |
| 2-Person Household | 3,627 (69.2%) | 1,613 (30.8%) |
| 3-Person Household | 2,030 (77.5%) | 588 (22.5%) |
| 4+ Person Household | 3,792 (82.7%) | 794 (17.3%) |
| Total Housing Units | 11,769 (69.1%) | 5,257 (30.9%) |
Occupancy by Educational Attainment in Ashburn
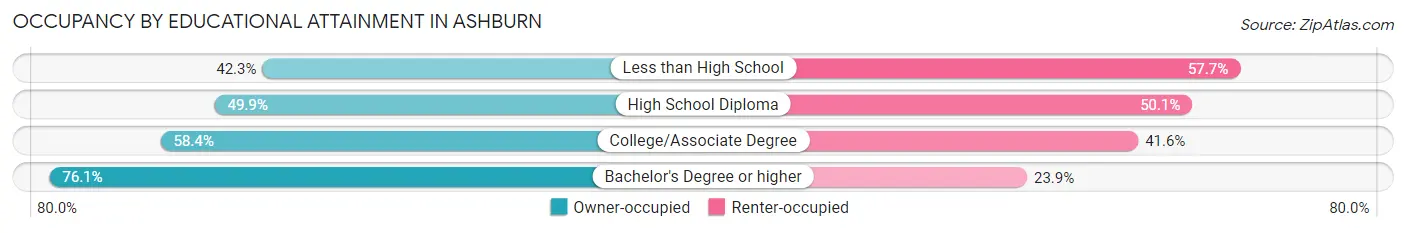
| Household Size | Owner-occupied | Renter-occupied |
| Less than High School | 195 (42.3%) | 266 (57.7%) |
| High School Diploma | 787 (49.9%) | 791 (50.1%) |
| College/Associate Degree | 2,035 (58.4%) | 1,447 (41.6%) |
| Bachelor's Degree or higher | 8,752 (76.1%) | 2,753 (23.9%) |
Occupancy by Age of Householder in Ashburn
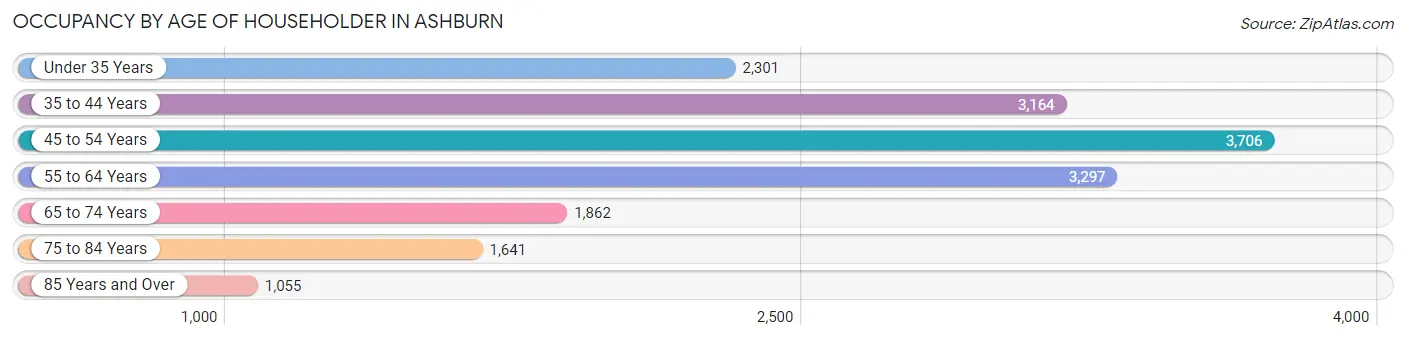
| Age Bracket | # Households | % Households |
| Under 35 Years | 2,301 | 13.5% |
| 35 to 44 Years | 3,164 | 18.6% |
| 45 to 54 Years | 3,706 | 21.8% |
| 55 to 64 Years | 3,297 | 19.4% |
| 65 to 74 Years | 1,862 | 10.9% |
| 75 to 84 Years | 1,641 | 9.6% |
| 85 Years and Over | 1,055 | 6.2% |
| Total | 17,026 | 100.0% |
Housing Finances in Ashburn
Median Income by Occupancy in Ashburn
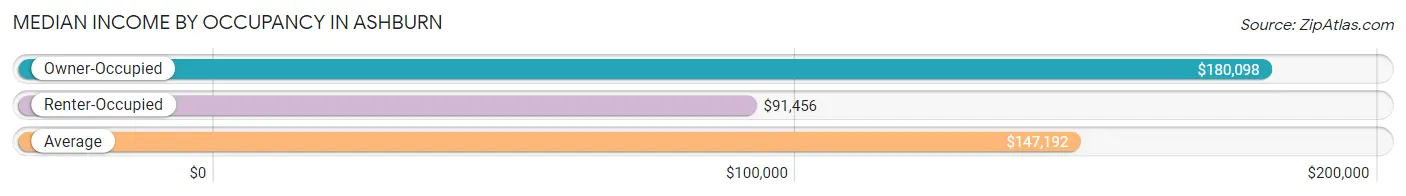
| Occupancy Type | # Households | Median Income |
| Owner-Occupied | 11,769 (69.1%) | $180,098 |
| Renter-Occupied | 5,257 (30.9%) | $91,456 |
| Average | 17,026 (100.0%) | $147,192 |
Occupancy by Householder Income Bracket in Ashburn
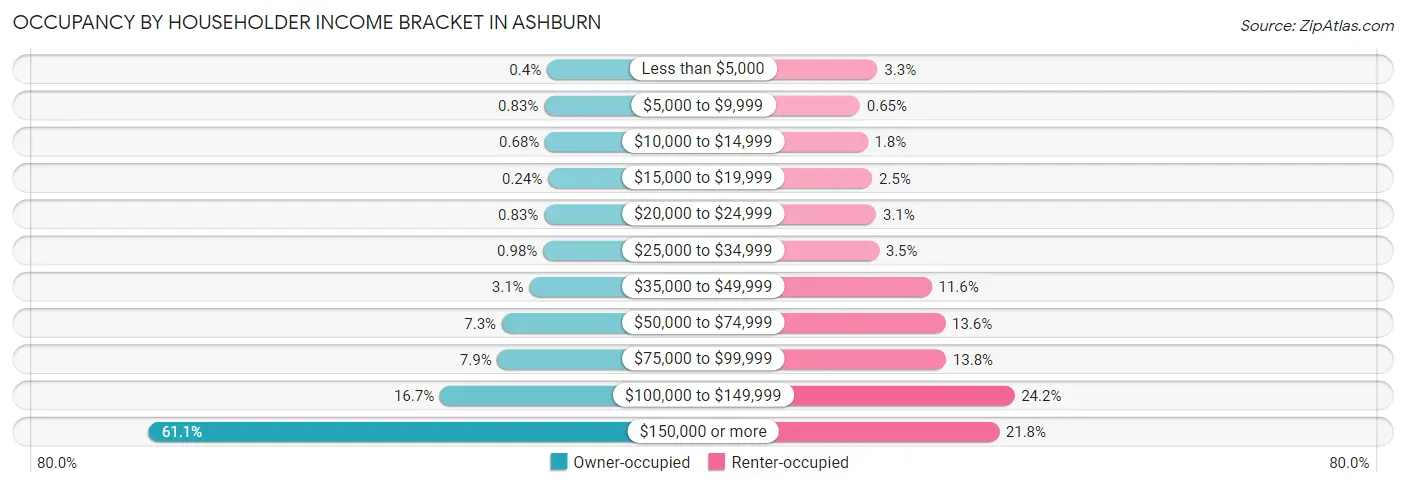
| Income Bracket | Owner-occupied | Renter-occupied |
| Less than $5,000 | 47 (0.4%) | 175 (3.3%) |
| $5,000 to $9,999 | 98 (0.8%) | 34 (0.6%) |
| $10,000 to $14,999 | 80 (0.7%) | 96 (1.8%) |
| $15,000 to $19,999 | 28 (0.2%) | 133 (2.5%) |
| $20,000 to $24,999 | 98 (0.8%) | 164 (3.1%) |
| $25,000 to $34,999 | 115 (1.0%) | 186 (3.5%) |
| $35,000 to $49,999 | 362 (3.1%) | 609 (11.6%) |
| $50,000 to $74,999 | 854 (7.3%) | 717 (13.6%) |
| $75,000 to $99,999 | 935 (7.9%) | 724 (13.8%) |
| $100,000 to $149,999 | 1,966 (16.7%) | 1,271 (24.2%) |
| $150,000 or more | 7,186 (61.1%) | 1,148 (21.8%) |
| Total | 11,769 (100.0%) | 5,257 (100.0%) |
Monthly Housing Cost Tiers in Ashburn
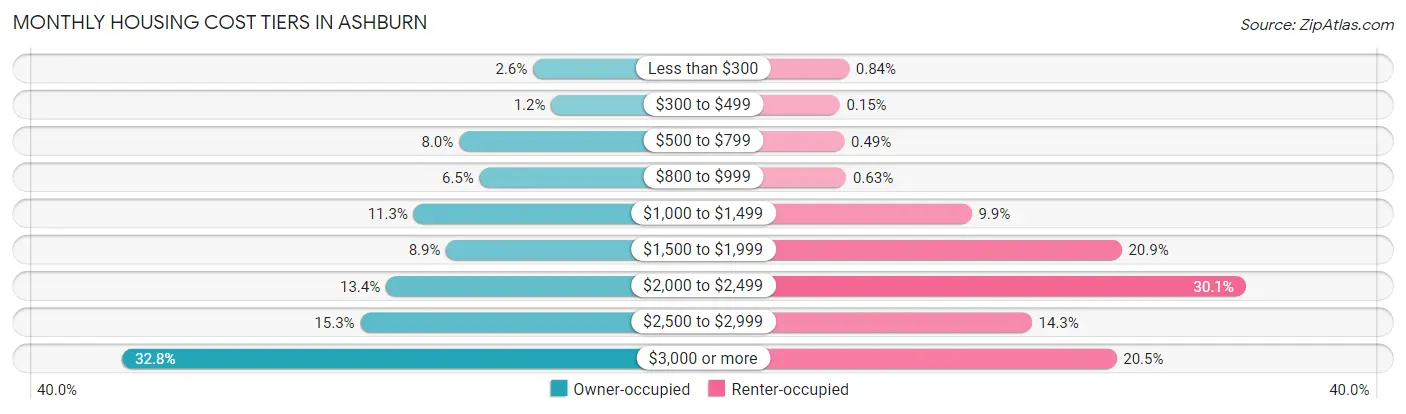
| Monthly Cost | Owner-occupied | Renter-occupied |
| Less than $300 | 300 (2.5%) | 44 (0.8%) |
| $300 to $499 | 142 (1.2%) | 8 (0.2%) |
| $500 to $799 | 942 (8.0%) | 26 (0.5%) |
| $800 to $999 | 764 (6.5%) | 33 (0.6%) |
| $1,000 to $1,499 | 1,335 (11.3%) | 519 (9.9%) |
| $1,500 to $1,999 | 1,052 (8.9%) | 1,100 (20.9%) |
| $2,000 to $2,499 | 1,575 (13.4%) | 1,580 (30.1%) |
| $2,500 to $2,999 | 1,797 (15.3%) | 752 (14.3%) |
| $3,000 or more | 3,862 (32.8%) | 1,080 (20.5%) |
| Total | 11,769 (100.0%) | 5,257 (100.0%) |
Physical Housing Characteristics in Ashburn
Housing Structures in Ashburn
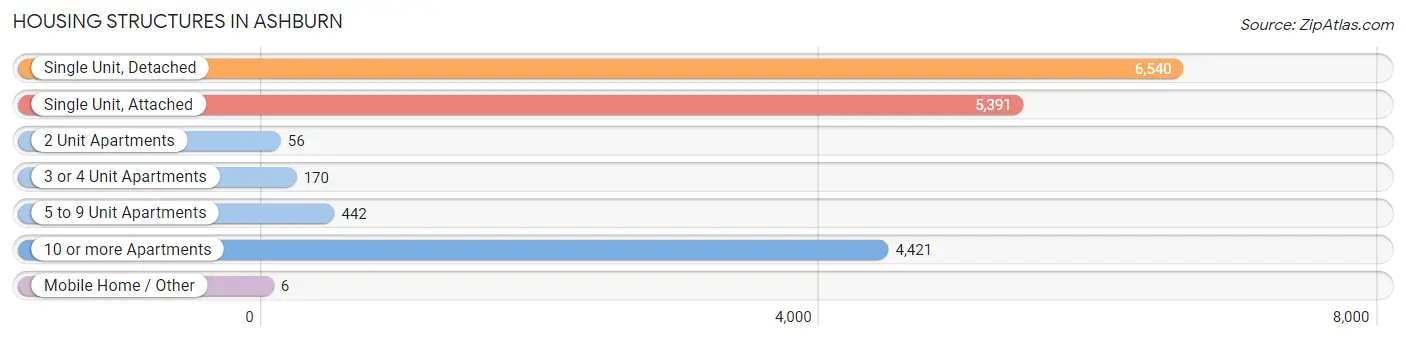
| Structure Type | # Housing Units | % Housing Units |
| Single Unit, Detached | 6,540 | 38.4% |
| Single Unit, Attached | 5,391 | 31.7% |
| 2 Unit Apartments | 56 | 0.3% |
| 3 or 4 Unit Apartments | 170 | 1.0% |
| 5 to 9 Unit Apartments | 442 | 2.6% |
| 10 or more Apartments | 4,421 | 26.0% |
| Mobile Home / Other | 6 | 0.0% |
| Total | 17,026 | 100.0% |
Housing Structures by Occupancy in Ashburn
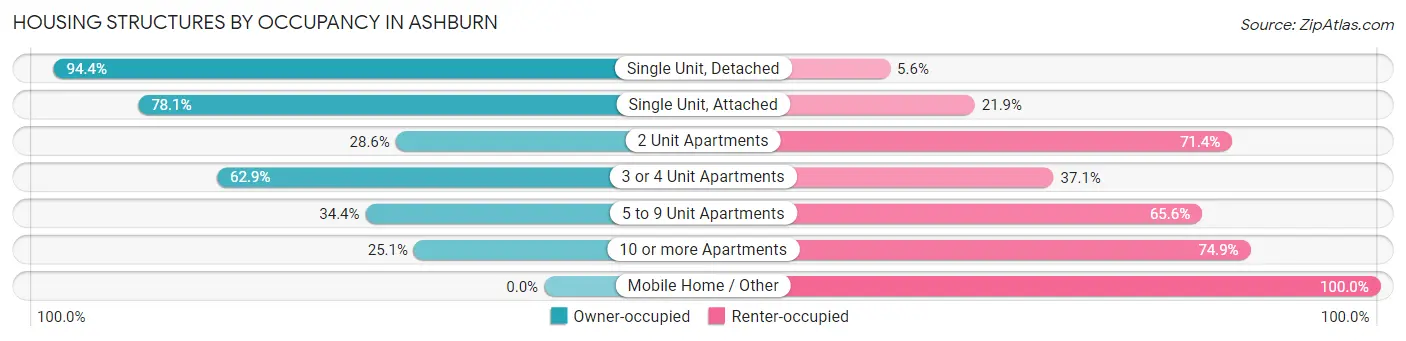
| Structure Type | Owner-occupied | Renter-occupied |
| Single Unit, Detached | 6,175 (94.4%) | 365 (5.6%) |
| Single Unit, Attached | 4,211 (78.1%) | 1,180 (21.9%) |
| 2 Unit Apartments | 16 (28.6%) | 40 (71.4%) |
| 3 or 4 Unit Apartments | 107 (62.9%) | 63 (37.1%) |
| 5 to 9 Unit Apartments | 152 (34.4%) | 290 (65.6%) |
| 10 or more Apartments | 1,108 (25.1%) | 3,313 (74.9%) |
| Mobile Home / Other | 0 (0.0%) | 6 (100.0%) |
| Total | 11,769 (69.1%) | 5,257 (30.9%) |
Housing Structures by Number of Rooms in Ashburn
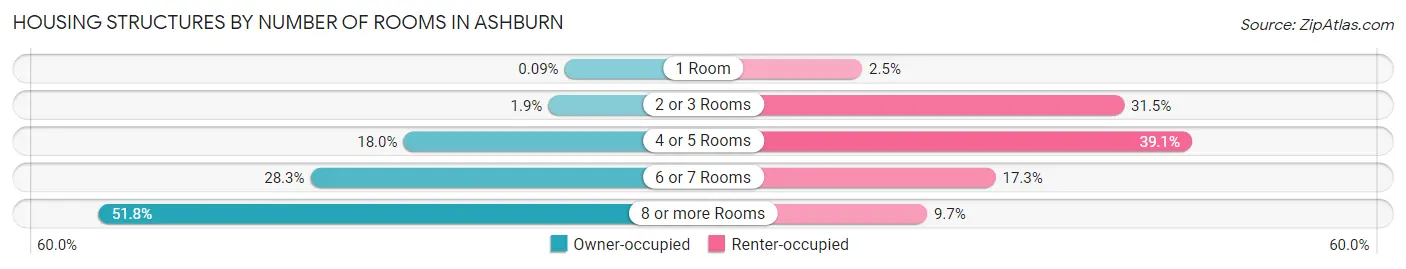
| Number of Rooms | Owner-occupied | Renter-occupied |
| 1 Room | 11 (0.1%) | 130 (2.5%) |
| 2 or 3 Rooms | 222 (1.9%) | 1,658 (31.5%) |
| 4 or 5 Rooms | 2,115 (18.0%) | 2,053 (39.1%) |
| 6 or 7 Rooms | 3,329 (28.3%) | 908 (17.3%) |
| 8 or more Rooms | 6,092 (51.8%) | 508 (9.7%) |
| Total | 11,769 (100.0%) | 5,257 (100.0%) |
Housing Structure by Heating Type in Ashburn
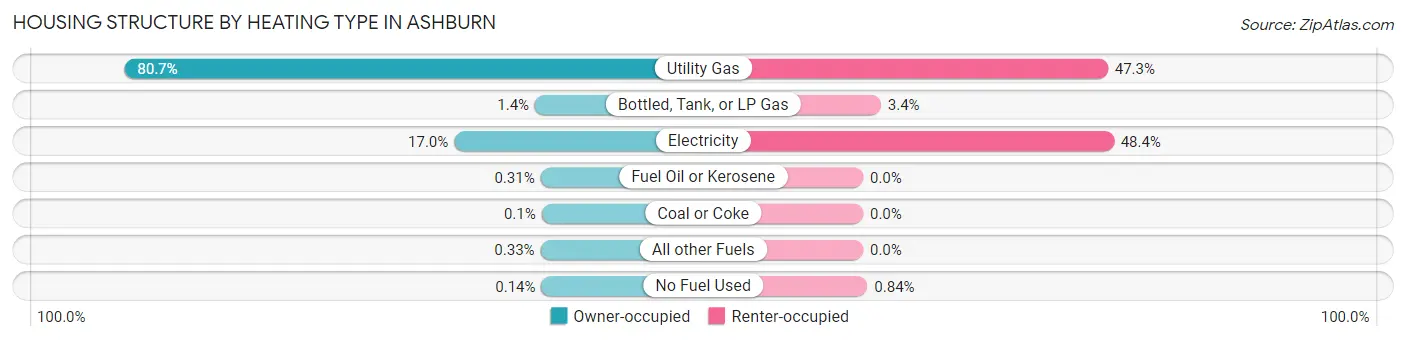
| Heating Type | Owner-occupied | Renter-occupied |
| Utility Gas | 9,500 (80.7%) | 2,486 (47.3%) |
| Bottled, Tank, or LP Gas | 164 (1.4%) | 181 (3.4%) |
| Electricity | 2,001 (17.0%) | 2,546 (48.4%) |
| Fuel Oil or Kerosene | 37 (0.3%) | 0 (0.0%) |
| Coal or Coke | 12 (0.1%) | 0 (0.0%) |
| All other Fuels | 39 (0.3%) | 0 (0.0%) |
| No Fuel Used | 16 (0.1%) | 44 (0.8%) |
| Total | 11,769 (100.0%) | 5,257 (100.0%) |
Household Vehicle Usage in Ashburn
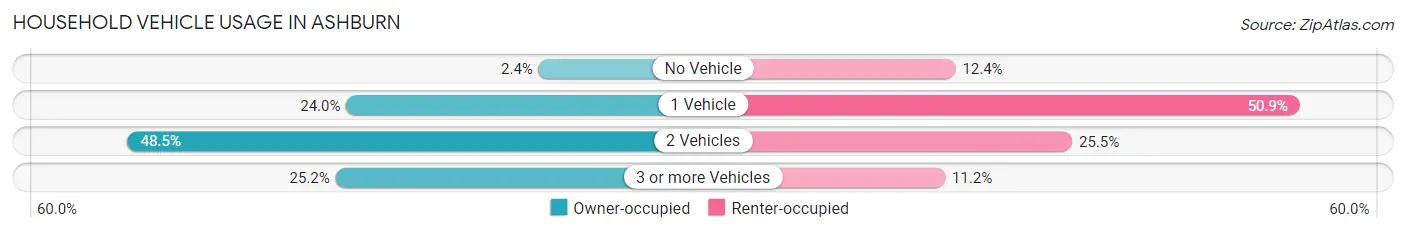
| Vehicles per Household | Owner-occupied | Renter-occupied |
| No Vehicle | 284 (2.4%) | 651 (12.4%) |
| 1 Vehicle | 2,820 (24.0%) | 2,678 (50.9%) |
| 2 Vehicles | 5,703 (48.5%) | 1,338 (25.5%) |
| 3 or more Vehicles | 2,962 (25.2%) | 590 (11.2%) |
| Total | 11,769 (100.0%) | 5,257 (100.0%) |
Real Estate & Mortgages in Ashburn
Real Estate and Mortgage Overview in Ashburn
| Characteristic | Without Mortgage | With Mortgage |
| Housing Units | 2,953 | 8,816 |
| Median Property Value | $585,700 | $629,400 |
| Median Household Income | $127,939 | $5,901 |
| Monthly Housing Costs | $842 | $3,793 |
| Real Estate Taxes | $5,151 | $124 |
Property Value by Mortgage Status in Ashburn
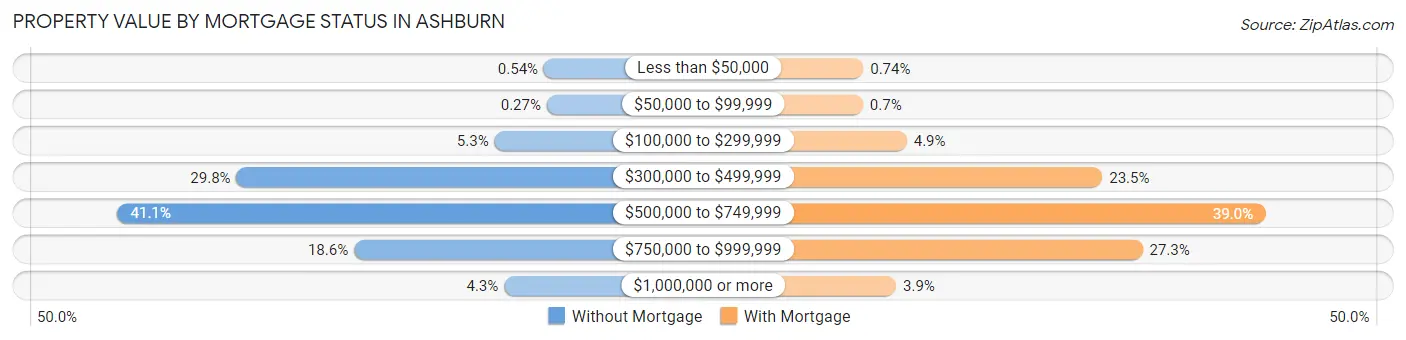
| Property Value | Without Mortgage | With Mortgage |
| Less than $50,000 | 16 (0.5%) | 65 (0.7%) |
| $50,000 to $99,999 | 8 (0.3%) | 62 (0.7%) |
| $100,000 to $299,999 | 155 (5.2%) | 430 (4.9%) |
| $300,000 to $499,999 | 881 (29.8%) | 2,072 (23.5%) |
| $500,000 to $749,999 | 1,215 (41.1%) | 3,438 (39.0%) |
| $750,000 to $999,999 | 550 (18.6%) | 2,409 (27.3%) |
| $1,000,000 or more | 128 (4.3%) | 340 (3.9%) |
| Total | 2,953 (100.0%) | 8,816 (100.0%) |
Household Income by Mortgage Status in Ashburn
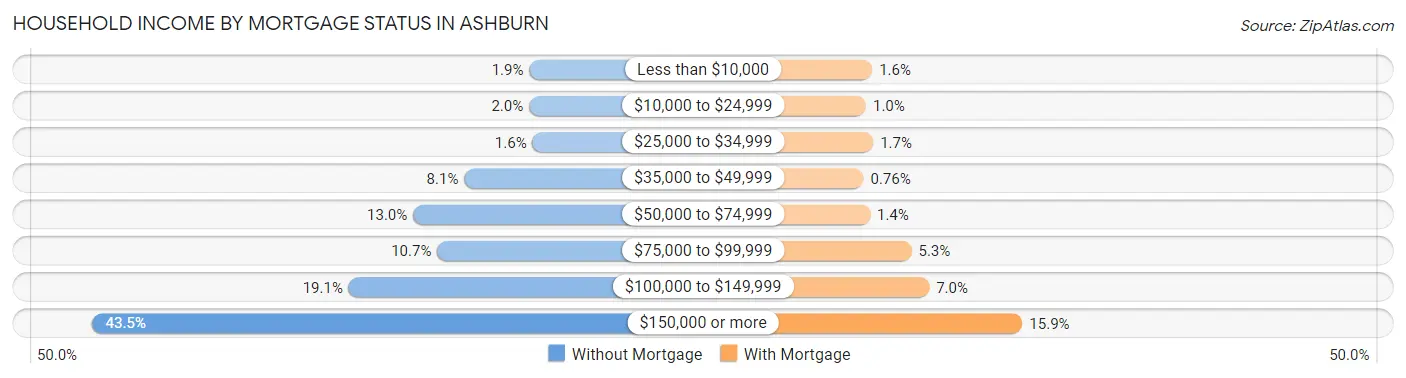
| Household Income | Without Mortgage | With Mortgage |
| Less than $10,000 | 57 (1.9%) | 140 (1.6%) |
| $10,000 to $24,999 | 58 (2.0%) | 88 (1.0%) |
| $25,000 to $34,999 | 48 (1.6%) | 148 (1.7%) |
| $35,000 to $49,999 | 240 (8.1%) | 67 (0.8%) |
| $50,000 to $74,999 | 384 (13.0%) | 122 (1.4%) |
| $75,000 to $99,999 | 316 (10.7%) | 470 (5.3%) |
| $100,000 to $149,999 | 565 (19.1%) | 619 (7.0%) |
| $150,000 or more | 1,285 (43.5%) | 1,401 (15.9%) |
| Total | 2,953 (100.0%) | 8,816 (100.0%) |
Property Value to Household Income Ratio in Ashburn
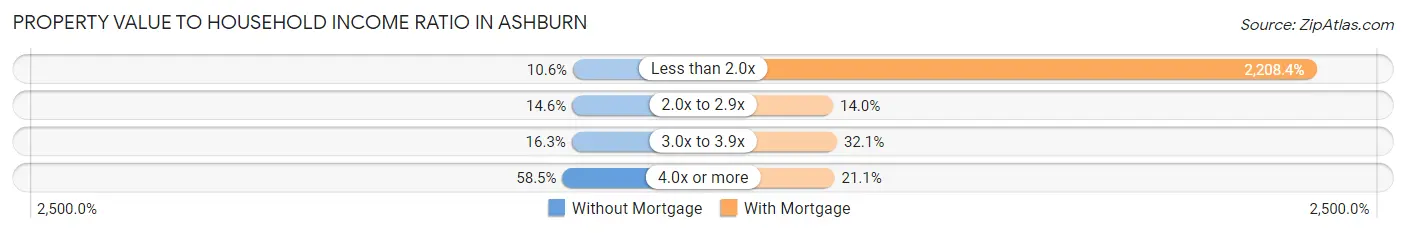
| Value-to-Income Ratio | Without Mortgage | With Mortgage |
| Less than 2.0x | 314 (10.6%) | 194,695 (2,208.4%) |
| 2.0x to 2.9x | 431 (14.6%) | 1,237 (14.0%) |
| 3.0x to 3.9x | 481 (16.3%) | 2,832 (32.1%) |
| 4.0x or more | 1,727 (58.5%) | 1,862 (21.1%) |
| Total | 2,953 (100.0%) | 8,816 (100.0%) |
Real Estate Taxes by Mortgage Status in Ashburn
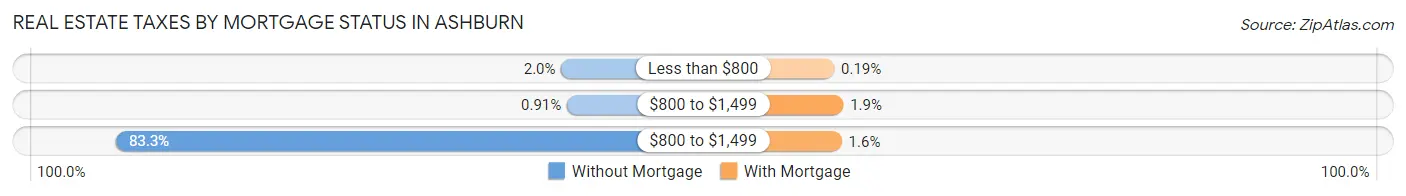
| Property Taxes | Without Mortgage | With Mortgage |
| Less than $800 | 58 (2.0%) | 17 (0.2%) |
| $800 to $1,499 | 27 (0.9%) | 164 (1.9%) |
| $800 to $1,499 | 2,460 (83.3%) | 138 (1.6%) |
| Total | 2,953 (100.0%) | 8,816 (100.0%) |
Health & Disability in Ashburn
Health Insurance Coverage by Age in Ashburn
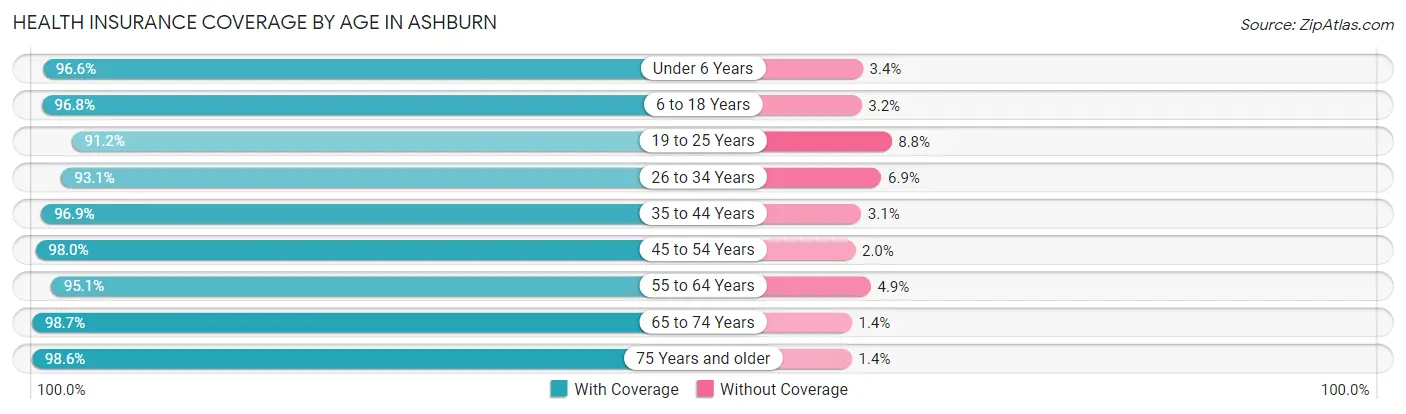
| Age Bracket | With Coverage | Without Coverage |
| Under 6 Years | 2,603 (96.6%) | 92 (3.4%) |
| 6 to 18 Years | 8,317 (96.8%) | 273 (3.2%) |
| 19 to 25 Years | 3,021 (91.2%) | 290 (8.8%) |
| 26 to 34 Years | 4,237 (93.1%) | 312 (6.9%) |
| 35 to 44 Years | 6,097 (96.9%) | 195 (3.1%) |
| 45 to 54 Years | 6,802 (98.0%) | 139 (2.0%) |
| 55 to 64 Years | 5,333 (95.1%) | 274 (4.9%) |
| 65 to 74 Years | 3,138 (98.7%) | 43 (1.3%) |
| 75 Years and older | 4,115 (98.6%) | 57 (1.4%) |
| Total | 43,663 (96.3%) | 1,675 (3.7%) |
Health Insurance Coverage by Citizenship Status in Ashburn
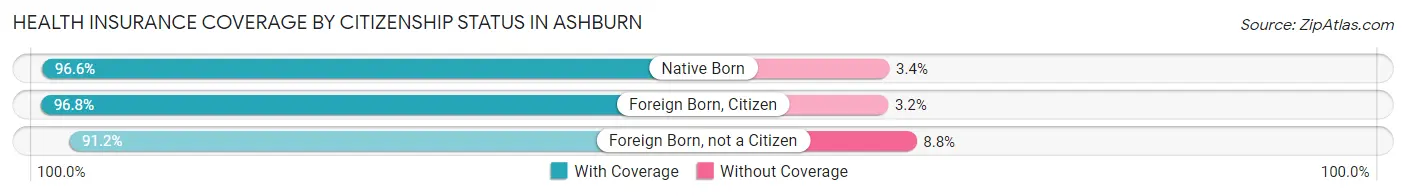
| Citizenship Status | With Coverage | Without Coverage |
| Native Born | 2,603 (96.6%) | 92 (3.4%) |
| Foreign Born, Citizen | 8,317 (96.8%) | 273 (3.2%) |
| Foreign Born, not a Citizen | 3,021 (91.2%) | 290 (8.8%) |
Health Insurance Coverage by Household Income in Ashburn
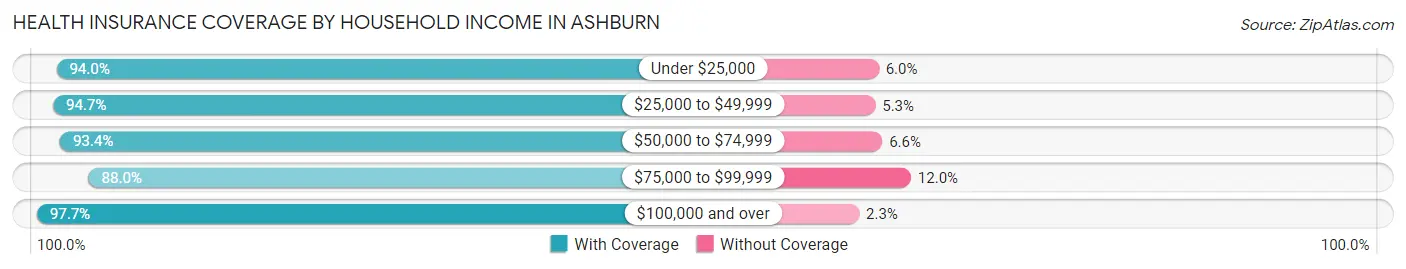
| Household Income | With Coverage | Without Coverage |
| Under $25,000 | 1,179 (94.0%) | 75 (6.0%) |
| $25,000 to $49,999 | 2,074 (94.7%) | 117 (5.3%) |
| $50,000 to $74,999 | 2,939 (93.4%) | 209 (6.6%) |
| $75,000 to $99,999 | 3,450 (88.0%) | 471 (12.0%) |
| $100,000 and over | 34,021 (97.7%) | 803 (2.3%) |
Public vs Private Health Insurance Coverage by Age in Ashburn
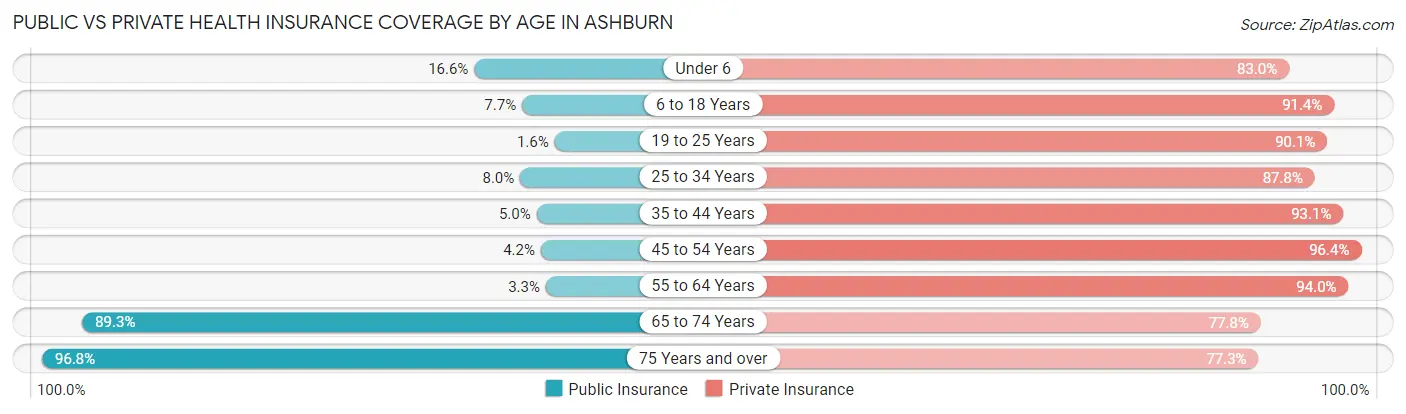
| Age Bracket | Public Insurance | Private Insurance |
| Under 6 | 446 (16.6%) | 2,237 (83.0%) |
| 6 to 18 Years | 660 (7.7%) | 7,850 (91.4%) |
| 19 to 25 Years | 54 (1.6%) | 2,983 (90.1%) |
| 25 to 34 Years | 365 (8.0%) | 3,993 (87.8%) |
| 35 to 44 Years | 313 (5.0%) | 5,856 (93.1%) |
| 45 to 54 Years | 290 (4.2%) | 6,692 (96.4%) |
| 55 to 64 Years | 183 (3.3%) | 5,272 (94.0%) |
| 65 to 74 Years | 2,842 (89.3%) | 2,474 (77.8%) |
| 75 Years and over | 4,038 (96.8%) | 3,226 (77.3%) |
| Total | 9,191 (20.3%) | 40,583 (89.5%) |
Disability Status by Sex by Age in Ashburn
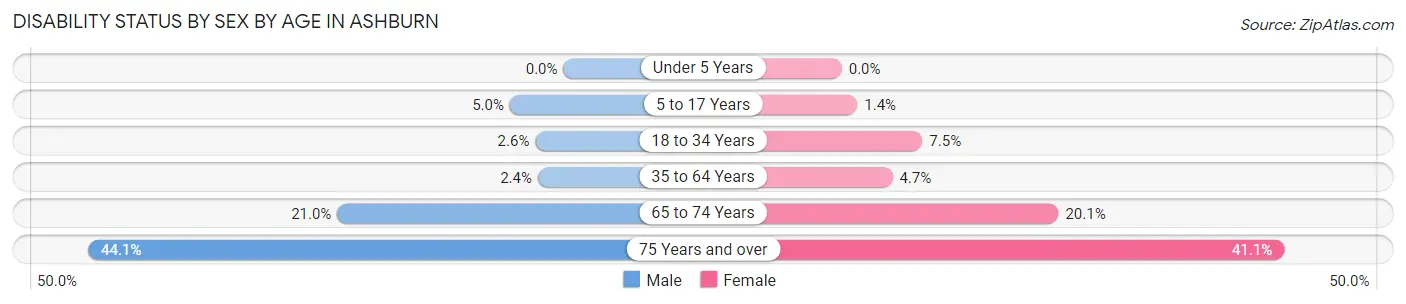
| Age Bracket | Male | Female |
| Under 5 Years | 0 (0.0%) | 0 (0.0%) |
| 5 to 17 Years | 205 (5.0%) | 59 (1.4%) |
| 18 to 34 Years | 103 (2.6%) | 348 (7.5%) |
| 35 to 64 Years | 227 (2.4%) | 434 (4.7%) |
| 65 to 74 Years | 266 (21.0%) | 385 (20.1%) |
| 75 Years and over | 726 (44.1%) | 1,037 (41.0%) |
Disability Class by Sex by Age in Ashburn
Disability Class: Hearing Difficulty
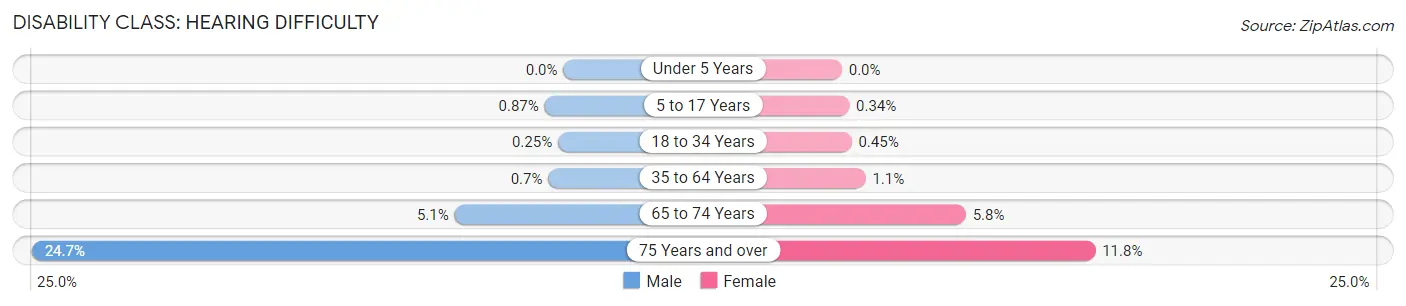
| Age Bracket | Male | Female |
| Under 5 Years | 0 (0.0%) | 0 (0.0%) |
| 5 to 17 Years | 36 (0.9%) | 14 (0.3%) |
| 18 to 34 Years | 10 (0.3%) | 21 (0.4%) |
| 35 to 64 Years | 67 (0.7%) | 102 (1.1%) |
| 65 to 74 Years | 64 (5.1%) | 110 (5.8%) |
| 75 Years and over | 406 (24.7%) | 297 (11.8%) |
Disability Class: Vision Difficulty
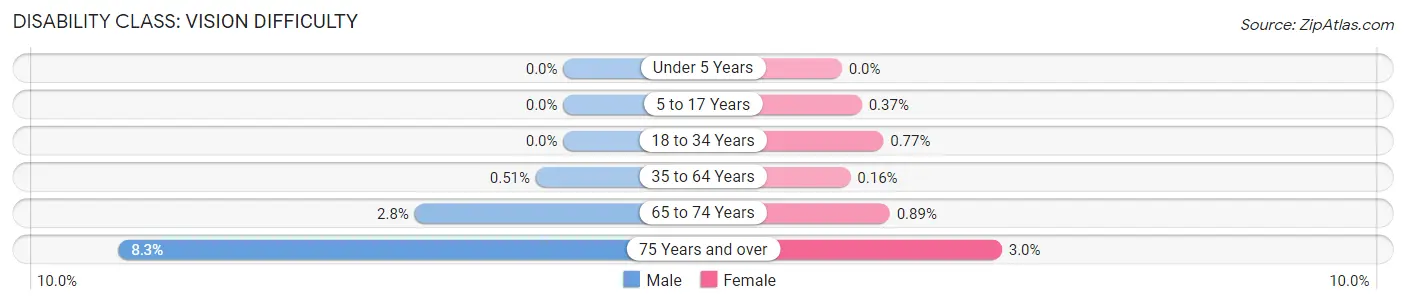
| Age Bracket | Male | Female |
| Under 5 Years | 0 (0.0%) | 0 (0.0%) |
| 5 to 17 Years | 0 (0.0%) | 15 (0.4%) |
| 18 to 34 Years | 0 (0.0%) | 36 (0.8%) |
| 35 to 64 Years | 49 (0.5%) | 15 (0.2%) |
| 65 to 74 Years | 35 (2.8%) | 17 (0.9%) |
| 75 Years and over | 136 (8.3%) | 75 (3.0%) |
Disability Class: Cognitive Difficulty
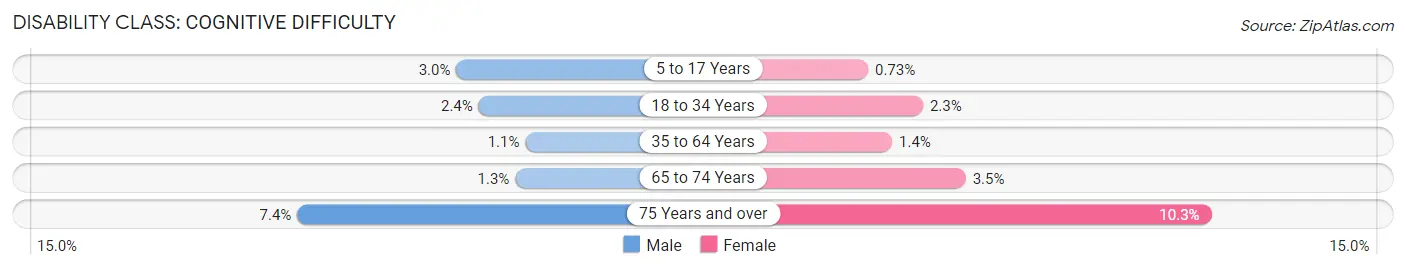
| Age Bracket | Male | Female |
| 5 to 17 Years | 123 (3.0%) | 30 (0.7%) |
| 18 to 34 Years | 93 (2.4%) | 105 (2.3%) |
| 35 to 64 Years | 102 (1.1%) | 129 (1.4%) |
| 65 to 74 Years | 17 (1.3%) | 66 (3.5%) |
| 75 Years and over | 122 (7.4%) | 260 (10.3%) |
Disability Class: Ambulatory Difficulty
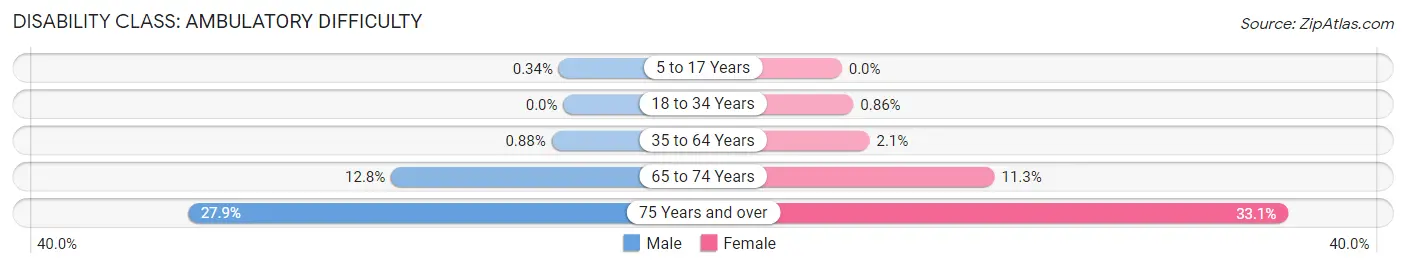
| Age Bracket | Male | Female |
| 5 to 17 Years | 14 (0.3%) | 0 (0.0%) |
| 18 to 34 Years | 0 (0.0%) | 40 (0.9%) |
| 35 to 64 Years | 84 (0.9%) | 190 (2.1%) |
| 65 to 74 Years | 162 (12.8%) | 217 (11.3%) |
| 75 Years and over | 459 (27.9%) | 837 (33.1%) |
Disability Class: Self-Care Difficulty
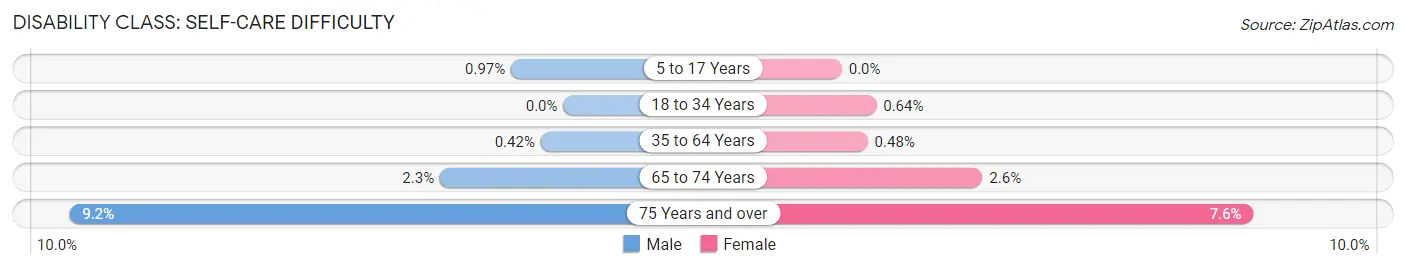
| Age Bracket | Male | Female |
| 5 to 17 Years | 40 (1.0%) | 0 (0.0%) |
| 18 to 34 Years | 0 (0.0%) | 30 (0.6%) |
| 35 to 64 Years | 40 (0.4%) | 44 (0.5%) |
| 65 to 74 Years | 29 (2.3%) | 50 (2.6%) |
| 75 Years and over | 151 (9.2%) | 193 (7.6%) |
Technology Access in Ashburn
Computing Device Access in Ashburn
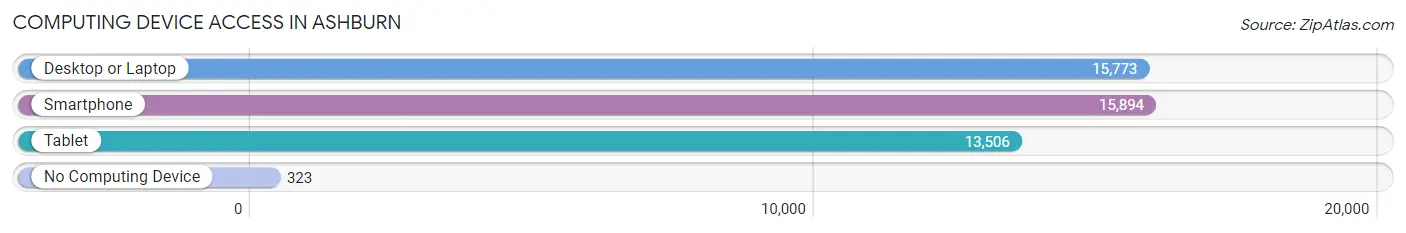
| Device Type | # Households | % Households |
| Desktop or Laptop | 15,773 | 92.6% |
| Smartphone | 15,894 | 93.3% |
| Tablet | 13,506 | 79.3% |
| No Computing Device | 323 | 1.9% |
| Total | 17,026 | 100.0% |
Internet Access in Ashburn
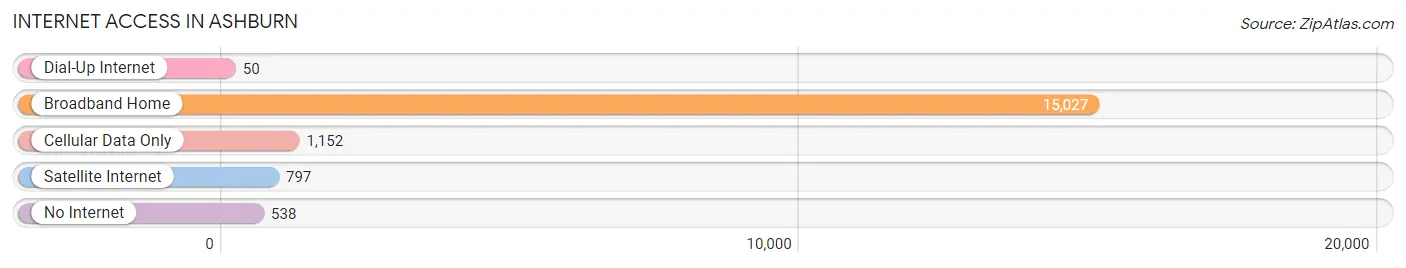
| Internet Type | # Households | % Households |
| Dial-Up Internet | 50 | 0.3% |
| Broadband Home | 15,027 | 88.3% |
| Cellular Data Only | 1,152 | 6.8% |
| Satellite Internet | 797 | 4.7% |
| No Internet | 538 | 3.2% |
| Total | 17,026 | 100.0% |
Ashburn Summary
History
The history of Ashburn, Virginia dates back to the early 19th century. The area was first settled by Quakers in the late 1700s, and the town was officially established in 1835. The town was named after a local landowner, John Ashburn. The town was a small farming community until the late 19th century, when the railroad arrived and the town began to grow.
In the early 20th century, Ashburn was a small rural town with a population of just over 500 people. The town was largely agricultural, with a few small businesses. In the 1950s, the town began to experience rapid growth as the Washington, D.C. metropolitan area expanded. The population of Ashburn grew to over 10,000 by the 1970s.
In the 1980s, Ashburn began to experience a boom in population and development. The town was incorporated in 1983, and the population grew to over 20,000 by the 1990s. The town has continued to grow since then, and the population is now over 50,000.
Geography
Ashburn is located in Loudoun County, Virginia, about 30 miles northwest of Washington, D.C. The town is situated in the foothills of the Blue Ridge Mountains, and is part of the Washington metropolitan area. The town is bordered by the Potomac River to the east and the Catoctin Mountains to the west.
The town covers an area of about 10 square miles, and is divided into several neighborhoods. The neighborhoods include Ashburn Village, Broadlands, Brambleton, and Belmont Country Club. The town is home to several parks, including Ashburn Park, Brambleton Park, and Belmont Country Club Park.
Economy
The economy of Ashburn is largely driven by the technology industry. The town is home to several data centers, including the world’s largest data center, the National Security Agency’s data center. The town is also home to several technology companies, including Verizon, AOL, and Amazon.
The town is also home to several retail and dining establishments, including the Dulles Town Center Mall and the Brambleton Town Center. The town is also home to several hotels, including the Hilton Garden Inn and the Hyatt Place.
Demographics
As of the 2010 census, the population of Ashburn was 43,511. The population is largely white (77.3%), with a small African American population (7.2%) and a small Asian population (7.1%). The median household income is $117,837, and the median home value is $450,000.
The town is home to several educational institutions, including the University of Virginia’s Loudoun Campus, George Mason University’s Loudoun Campus, and the Northern Virginia Community College’s Loudoun Campus. The town is also home to several private schools, including the Loudoun Country Day School and the Loudoun School of the Arts.
Common Questions
What is Per Capita Income in Ashburn?
Per Capita income in Ashburn is $64,916.
What is the Median Family Income in Ashburn?
Median Family Income in Ashburn is $179,114.
What is the Median Household income in Ashburn?
Median Household Income in Ashburn is $147,192.
What is Income or Wage Gap in Ashburn?
Income or Wage Gap in Ashburn is 37.2%.
Women in Ashburn earn 62.8 cents for every dollar earned by a man.
What is Inequality or Gini Index in Ashburn?
Inequality or Gini Index in Ashburn is 0.38.
What is the Total Population of Ashburn?
Total Population of Ashburn is 45,479.
What is the Total Male Population of Ashburn?
Total Male Population of Ashburn is 21,966.
What is the Total Female Population of Ashburn?
Total Female Population of Ashburn is 23,513.
What is the Ratio of Males per 100 Females in Ashburn?
There are 93.42 Males per 100 Females in Ashburn.
What is the Ratio of Females per 100 Males in Ashburn?
There are 107.04 Females per 100 Males in Ashburn.
What is the Median Population Age in Ashburn?
Median Population Age in Ashburn is 40.9 Years.
What is the Average Family Size in Ashburn
Average Family Size in Ashburn is 3.3 People.
What is the Average Household Size in Ashburn
Average Household Size in Ashburn is 2.7 People.
How Large is the Labor Force in Ashburn?
There are 24,971 People in the Labor Forcein in Ashburn.
What is the Percentage of People in the Labor Force in Ashburn?
68.8% of People are in the Labor Force in Ashburn.
What is the Unemployment Rate in Ashburn?
Unemployment Rate in Ashburn is 2.7%.