Chantilly, VA Map & Demographics
Chantilly Map
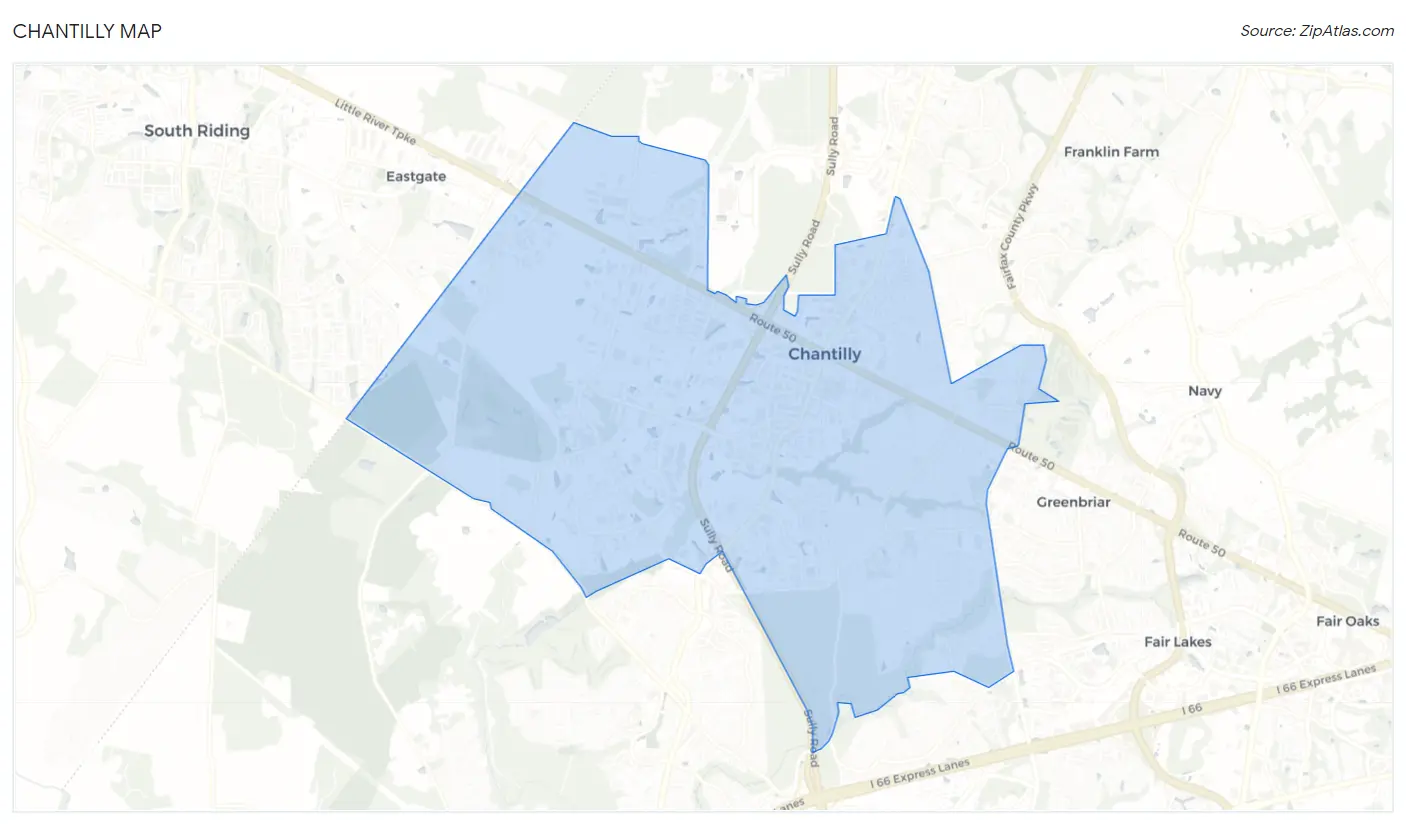
Chantilly Overview
$56,116
PER CAPITA INCOME
$155,000
AVG FAMILY INCOME
$137,722
AVG HOUSEHOLD INCOME
44.2%
WAGE / INCOME GAP [ % ]
55.8¢/ $1
WAGE / INCOME GAP [ $ ]
$16,302
FAMILY INCOME DEFICIT
0.40
INEQUALITY / GINI INDEX
23,107
TOTAL POPULATION
11,539
MALE POPULATION
11,568
FEMALE POPULATION
99.75
MALES / 100 FEMALES
100.25
FEMALES / 100 MALES
40.4
MEDIAN AGE
3.6
AVG FAMILY SIZE
3.2
AVG HOUSEHOLD SIZE
13,171
LABOR FORCE [ PEOPLE ]
71.6%
PERCENT IN LABOR FORCE
2.9%
UNEMPLOYMENT RATE
Income in Chantilly
Income Overview in Chantilly
Per Capita Income in Chantilly is $56,116, while median incomes of families and households are $155,000 and $137,722 respectively.
| Characteristic | Number | Measure |
| Per Capita Income | 23,107 | $56,116 |
| Median Family Income | 5,802 | $155,000 |
| Mean Family Income | 5,802 | $188,791 |
| Median Household Income | 7,187 | $137,722 |
| Mean Household Income | 7,187 | $177,410 |
| Income Deficit | 5,802 | $16,302 |
| Wage / Income Gap (%) | 23,107 | 44.17% |
| Wage / Income Gap ($) | 23,107 | 55.83¢ per $1 |
| Gini / Inequality Index | 23,107 | 0.40 |
Earnings by Sex in Chantilly
Average Earnings in Chantilly are $56,506, $73,071 for men and $40,799 for women, a difference of 44.2%.
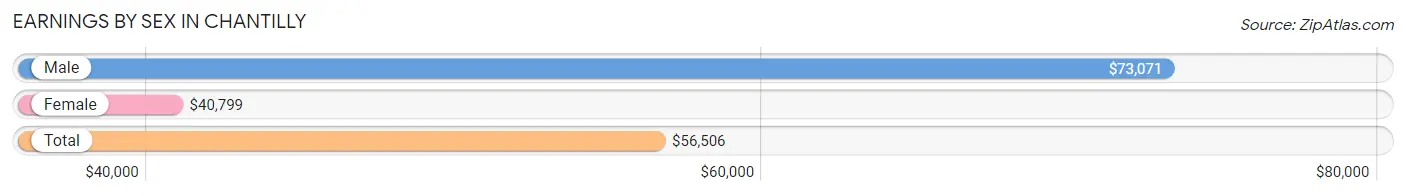
| Sex | Number | Average Earnings |
| Male | 7,505 (54.9%) | $73,071 |
| Female | 6,156 (45.1%) | $40,799 |
| Total | 13,661 (100.0%) | $56,506 |
Earnings by Sex by Income Bracket in Chantilly
The most common earnings brackets in Chantilly are $100,000+ for men (2,664 | 35.5%) and $100,000+ for women (1,288 | 20.9%).
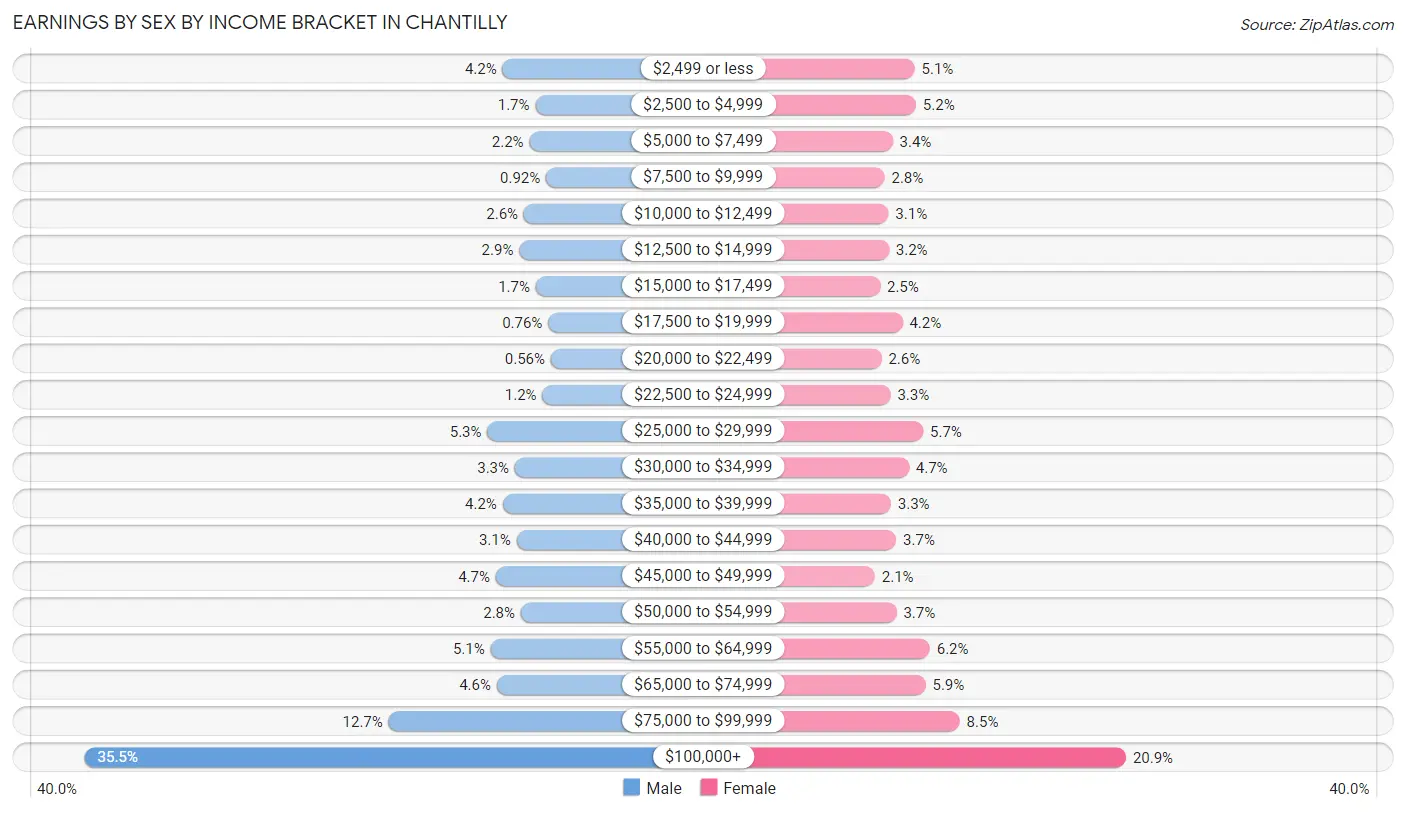
| Income | Male | Female |
| $2,499 or less | 314 (4.2%) | 313 (5.1%) |
| $2,500 to $4,999 | 129 (1.7%) | 319 (5.2%) |
| $5,000 to $7,499 | 163 (2.2%) | 211 (3.4%) |
| $7,500 to $9,999 | 69 (0.9%) | 174 (2.8%) |
| $10,000 to $12,499 | 194 (2.6%) | 192 (3.1%) |
| $12,500 to $14,999 | 220 (2.9%) | 194 (3.2%) |
| $15,000 to $17,499 | 127 (1.7%) | 153 (2.5%) |
| $17,500 to $19,999 | 57 (0.8%) | 257 (4.2%) |
| $20,000 to $22,499 | 42 (0.6%) | 160 (2.6%) |
| $22,500 to $24,999 | 89 (1.2%) | 201 (3.3%) |
| $25,000 to $29,999 | 399 (5.3%) | 352 (5.7%) |
| $30,000 to $34,999 | 245 (3.3%) | 286 (4.6%) |
| $35,000 to $39,999 | 313 (4.2%) | 203 (3.3%) |
| $40,000 to $44,999 | 235 (3.1%) | 228 (3.7%) |
| $45,000 to $49,999 | 352 (4.7%) | 129 (2.1%) |
| $50,000 to $54,999 | 211 (2.8%) | 229 (3.7%) |
| $55,000 to $64,999 | 381 (5.1%) | 383 (6.2%) |
| $65,000 to $74,999 | 346 (4.6%) | 363 (5.9%) |
| $75,000 to $99,999 | 955 (12.7%) | 521 (8.5%) |
| $100,000+ | 2,664 (35.5%) | 1,288 (20.9%) |
| Total | 7,505 (100.0%) | 6,156 (100.0%) |
Earnings by Sex by Educational Attainment in Chantilly
Average earnings in Chantilly are $83,177 for men and $51,628 for women, a difference of 37.9%. Men with an educational attainment of graduate degree enjoy the highest average annual earnings of $144,840, while those with less than high school education earn the least with $32,500. Women with an educational attainment of graduate degree earn the most with the average annual earnings of $93,773, while those with less than high school education have the smallest earnings of $19,762.
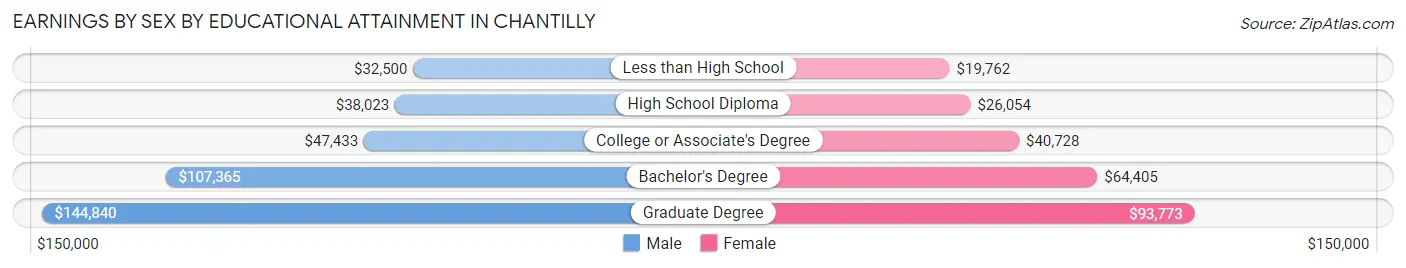
| Educational Attainment | Male Income | Female Income |
| Less than High School | $32,500 | $19,762 |
| High School Diploma | $38,023 | $26,054 |
| College or Associate's Degree | $47,433 | $40,728 |
| Bachelor's Degree | $107,365 | $64,405 |
| Graduate Degree | $144,840 | $93,773 |
| Total | $83,177 | $51,628 |
Family Income in Chantilly
Family Income Brackets in Chantilly
According to the Chantilly family income data, there are 2,106 families falling into the $200,000+ income range, which is the most common income bracket and makes up 36.3% of all families. Conversely, the less than $10,000 income bracket is the least frequent group with only 52 families (0.9%) belonging to this category.
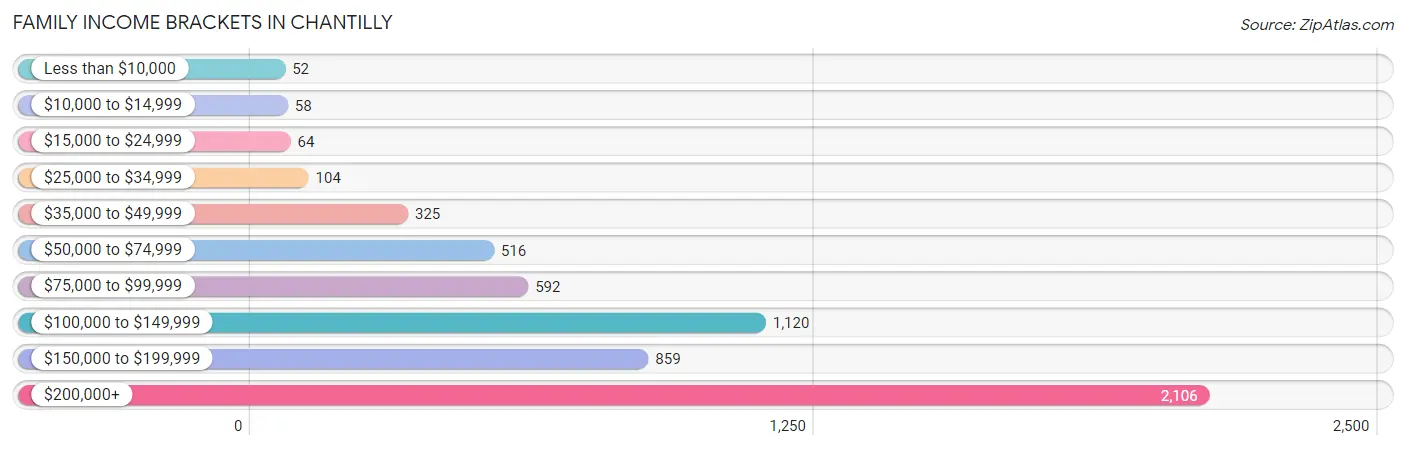
| Income Bracket | # Families | % Families |
| Less than $10,000 | 52 | 0.9% |
| $10,000 to $14,999 | 58 | 1.0% |
| $15,000 to $24,999 | 64 | 1.1% |
| $25,000 to $34,999 | 104 | 1.8% |
| $35,000 to $49,999 | 325 | 5.6% |
| $50,000 to $74,999 | 516 | 8.9% |
| $75,000 to $99,999 | 592 | 10.2% |
| $100,000 to $149,999 | 1,120 | 19.3% |
| $150,000 to $199,999 | 859 | 14.8% |
| $200,000+ | 2,106 | 36.3% |
Family Income by Famaliy Size in Chantilly
3-person families (1,252 | 21.6%) account for the highest median family income in Chantilly with $182,353 per family, while 2-person families (1,953 | 33.7%) have the highest median income of $70,504 per family member.
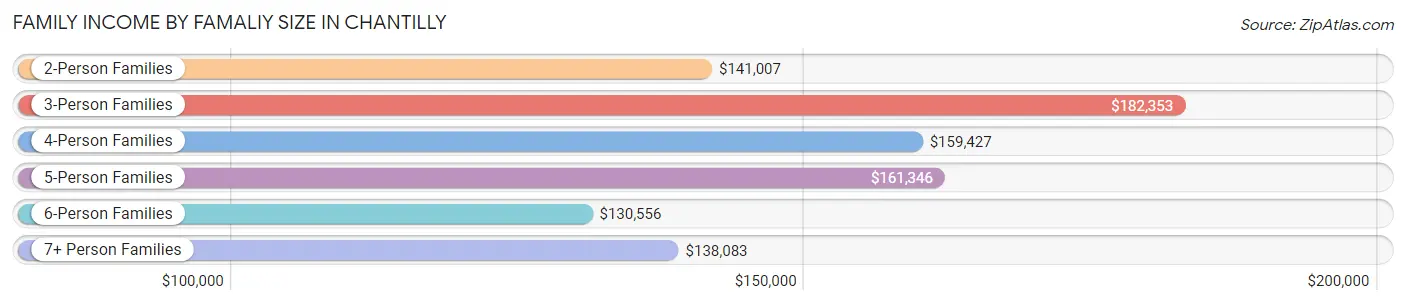
| Income Bracket | # Families | Median Income |
| 2-Person Families | 1,953 (33.7%) | $141,007 |
| 3-Person Families | 1,252 (21.6%) | $182,353 |
| 4-Person Families | 1,566 (27.0%) | $159,427 |
| 5-Person Families | 684 (11.8%) | $161,346 |
| 6-Person Families | 152 (2.6%) | $130,556 |
| 7+ Person Families | 195 (3.4%) | $138,083 |
| Total | 5,802 (100.0%) | $155,000 |
Family Income by Number of Earners in Chantilly
The median family income in Chantilly is $155,000, with families comprising 3+ earners (1,326) having the highest median family income of $188,864, while families with no earners (359) have the lowest median family income of $102,031, accounting for 22.9% and 6.2% of families, respectively.
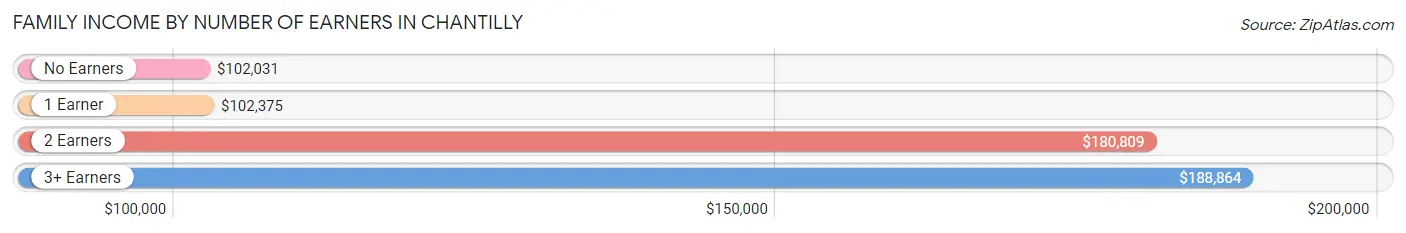
| Number of Earners | # Families | Median Income |
| No Earners | 359 (6.2%) | $102,031 |
| 1 Earner | 1,240 (21.4%) | $102,375 |
| 2 Earners | 2,877 (49.6%) | $180,809 |
| 3+ Earners | 1,326 (22.9%) | $188,864 |
| Total | 5,802 (100.0%) | $155,000 |
Household Income in Chantilly
Household Income Brackets in Chantilly
With 2,400 households falling in the category, the $200,000+ income range is the most frequent in Chantilly, accounting for 33.4% of all households. In contrast, only 50 households (0.7%) fall into the $10,000 to $14,999 income bracket, making it the least populous group.
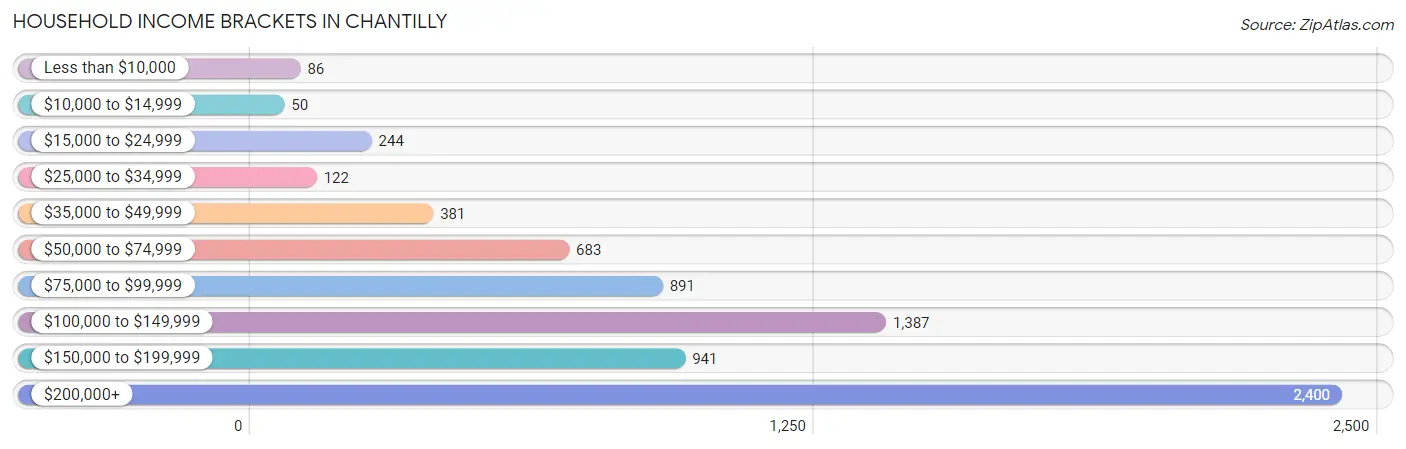
| Income Bracket | # Households | % Households |
| Less than $10,000 | 86 | 1.2% |
| $10,000 to $14,999 | 50 | 0.7% |
| $15,000 to $24,999 | 244 | 3.4% |
| $25,000 to $34,999 | 122 | 1.7% |
| $35,000 to $49,999 | 381 | 5.3% |
| $50,000 to $74,999 | 683 | 9.5% |
| $75,000 to $99,999 | 891 | 12.4% |
| $100,000 to $149,999 | 1,387 | 19.3% |
| $150,000 to $199,999 | 941 | 13.1% |
| $200,000+ | 2,400 | 33.4% |
Household Income by Householder Age in Chantilly
The median household income in Chantilly is $137,722, with the highest median household income of $187,400 found in the 45 to 64 years age bracket for the primary householder. A total of 3,558 households (49.5%) fall into this category. Meanwhile, the 15 to 24 years age bracket for the primary householder has the lowest median household income of $89,423, with 78 households (1.1%) in this group.
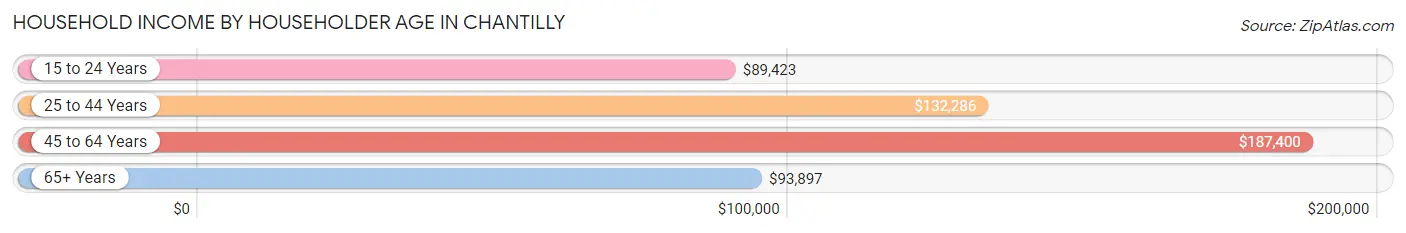
| Income Bracket | # Households | Median Income |
| 15 to 24 Years | 78 (1.1%) | $89,423 |
| 25 to 44 Years | 2,022 (28.1%) | $132,286 |
| 45 to 64 Years | 3,558 (49.5%) | $187,400 |
| 65+ Years | 1,529 (21.3%) | $93,897 |
| Total | 7,187 (100.0%) | $137,722 |
Poverty in Chantilly
Income Below Poverty by Sex and Age in Chantilly
With 2.7% poverty level for males and 4.9% for females among the residents of Chantilly, under 5 year old males and under 5 year old females are the most vulnerable to poverty, with 42 males (7.2%) and 134 females (27.0%) in their respective age groups living below the poverty level.
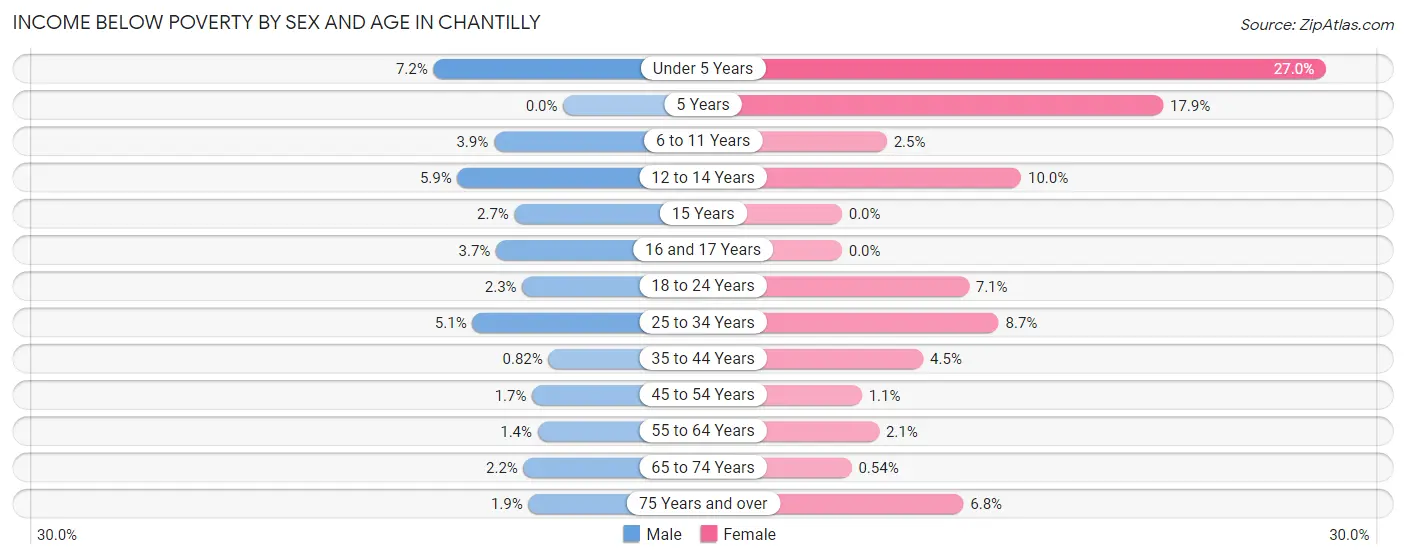
| Age Bracket | Male | Female |
| Under 5 Years | 42 (7.2%) | 134 (27.0%) |
| 5 Years | 0 (0.0%) | 17 (17.9%) |
| 6 to 11 Years | 37 (3.9%) | 23 (2.5%) |
| 12 to 14 Years | 32 (5.9%) | 55 (10.0%) |
| 15 Years | 6 (2.7%) | 0 (0.0%) |
| 16 and 17 Years | 14 (3.7%) | 0 (0.0%) |
| 18 to 24 Years | 26 (2.3%) | 75 (7.1%) |
| 25 to 34 Years | 63 (5.1%) | 90 (8.7%) |
| 35 to 44 Years | 13 (0.8%) | 78 (4.5%) |
| 45 to 54 Years | 32 (1.7%) | 22 (1.1%) |
| 55 to 64 Years | 22 (1.4%) | 29 (2.1%) |
| 65 to 74 Years | 20 (2.2%) | 6 (0.5%) |
| 75 Years and over | 9 (1.9%) | 31 (6.8%) |
| Total | 316 (2.7%) | 560 (4.9%) |
Income Above Poverty by Sex and Age in Chantilly
According to the poverty statistics in Chantilly, males aged 5 years and females aged 15 years are the age groups that are most secure financially, with 100.0% of males and 100.0% of females in these age groups living above the poverty line.
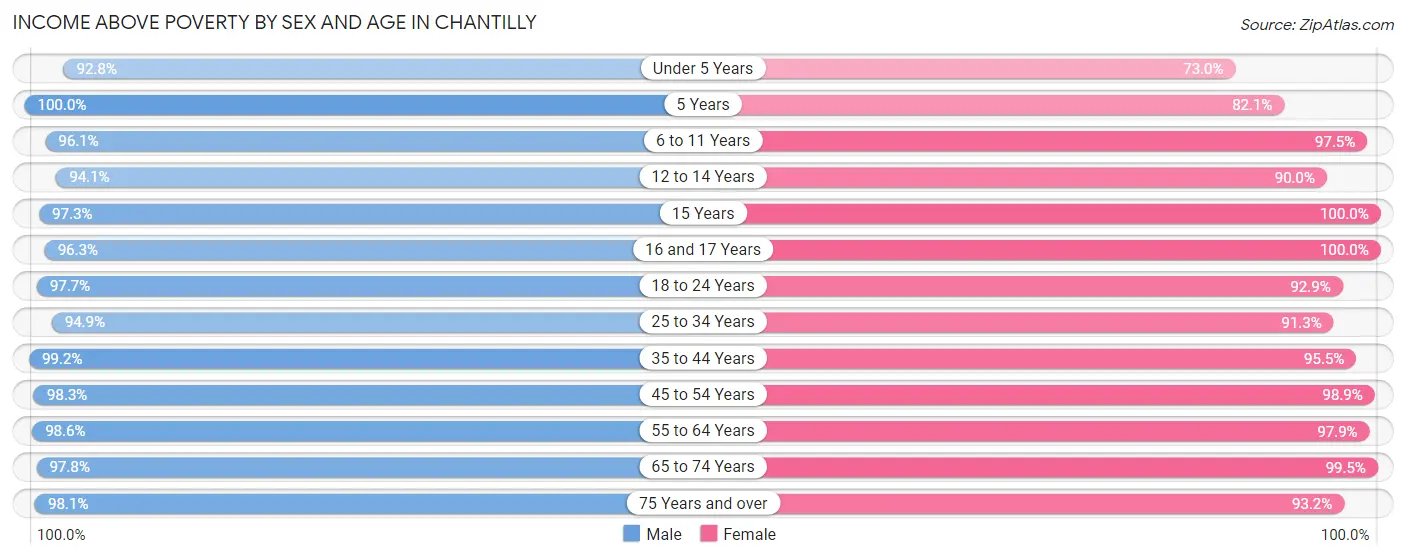
| Age Bracket | Male | Female |
| Under 5 Years | 539 (92.8%) | 363 (73.0%) |
| 5 Years | 110 (100.0%) | 78 (82.1%) |
| 6 to 11 Years | 922 (96.1%) | 896 (97.5%) |
| 12 to 14 Years | 511 (94.1%) | 496 (90.0%) |
| 15 Years | 215 (97.3%) | 183 (100.0%) |
| 16 and 17 Years | 360 (96.3%) | 499 (100.0%) |
| 18 to 24 Years | 1,112 (97.7%) | 986 (92.9%) |
| 25 to 34 Years | 1,182 (94.9%) | 941 (91.3%) |
| 35 to 44 Years | 1,568 (99.2%) | 1,644 (95.5%) |
| 45 to 54 Years | 1,819 (98.3%) | 1,966 (98.9%) |
| 55 to 64 Years | 1,525 (98.6%) | 1,375 (97.9%) |
| 65 to 74 Years | 885 (97.8%) | 1,113 (99.5%) |
| 75 Years and over | 455 (98.1%) | 427 (93.2%) |
| Total | 11,203 (97.3%) | 10,967 (95.1%) |
Income Below Poverty Among Married-Couple Families in Chantilly
The poverty statistics for married-couple families in Chantilly show that 1.6% or 79 of the total 4,955 families live below the poverty line. Families with 5 or more children have the highest poverty rate of 28.2%, comprising of 20 families. On the other hand, families with no children have the lowest poverty rate of 0.7%, which includes 17 families.
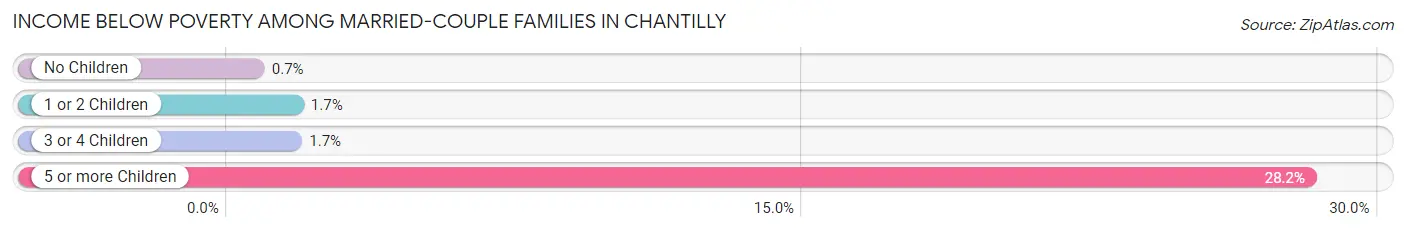
| Children | Above Poverty | Below Poverty |
| No Children | 2,411 (99.3%) | 17 (0.7%) |
| 1 or 2 Children | 2,004 (98.3%) | 35 (1.7%) |
| 3 or 4 Children | 410 (98.3%) | 7 (1.7%) |
| 5 or more Children | 51 (71.8%) | 20 (28.2%) |
| Total | 4,876 (98.4%) | 79 (1.6%) |
Income Below Poverty Among Single-Parent Households in Chantilly
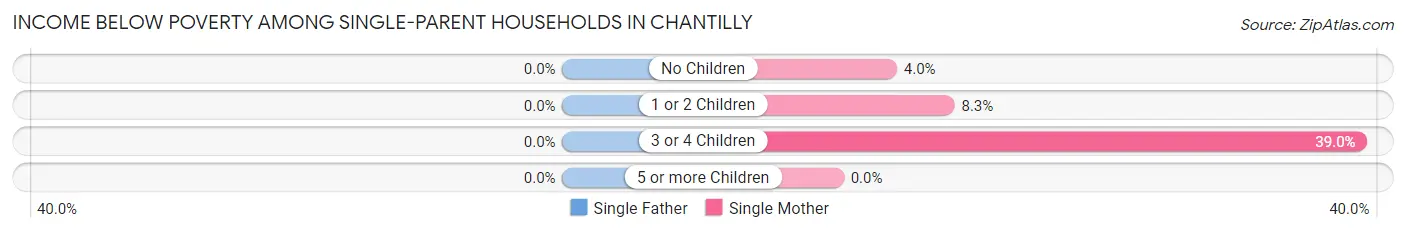
| Children | Single Father | Single Mother |
| No Children | 0 (0.0%) | 11 (4.0%) |
| 1 or 2 Children | 0 (0.0%) | 19 (8.3%) |
| 3 or 4 Children | 0 (0.0%) | 32 (39.0%) |
| 5 or more Children | 0 (0.0%) | 0 (0.0%) |
| Total | 0 (0.0%) | 62 (10.5%) |
Income Below Poverty Among Married-Couple vs Single-Parent Households in Chantilly
The poverty data for Chantilly shows that 79 of the married-couple family households (1.6%) and 62 of the single-parent households (7.3%) are living below the poverty level. Within the married-couple family households, those with 5 or more children have the highest poverty rate, with 20 households (28.2%) falling below the poverty line. Among the single-parent households, those with 3 or 4 children have the highest poverty rate, with 32 household (27.4%) living below poverty.
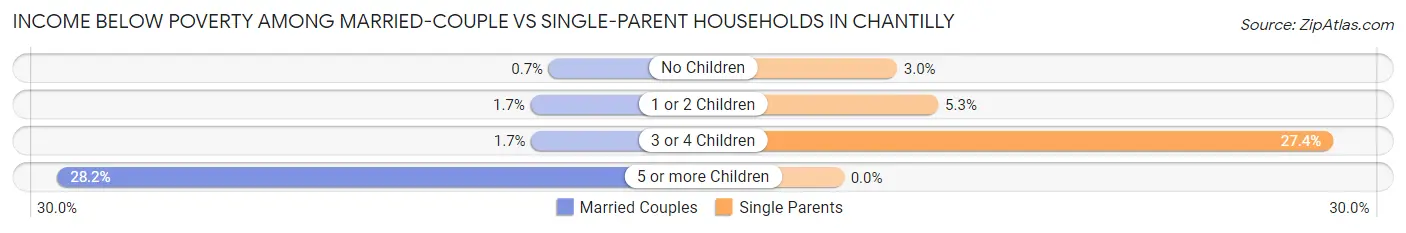
| Children | Married-Couple Families | Single-Parent Households |
| No Children | 17 (0.7%) | 11 (3.0%) |
| 1 or 2 Children | 35 (1.7%) | 19 (5.3%) |
| 3 or 4 Children | 7 (1.7%) | 32 (27.4%) |
| 5 or more Children | 20 (28.2%) | 0 (0.0%) |
| Total | 79 (1.6%) | 62 (7.3%) |
Race in Chantilly
The most populous races in Chantilly are White / Caucasian (9,940 | 43.0%), Asian (9,297 | 40.2%), and Hispanic or Latino (4,480 | 19.4%).
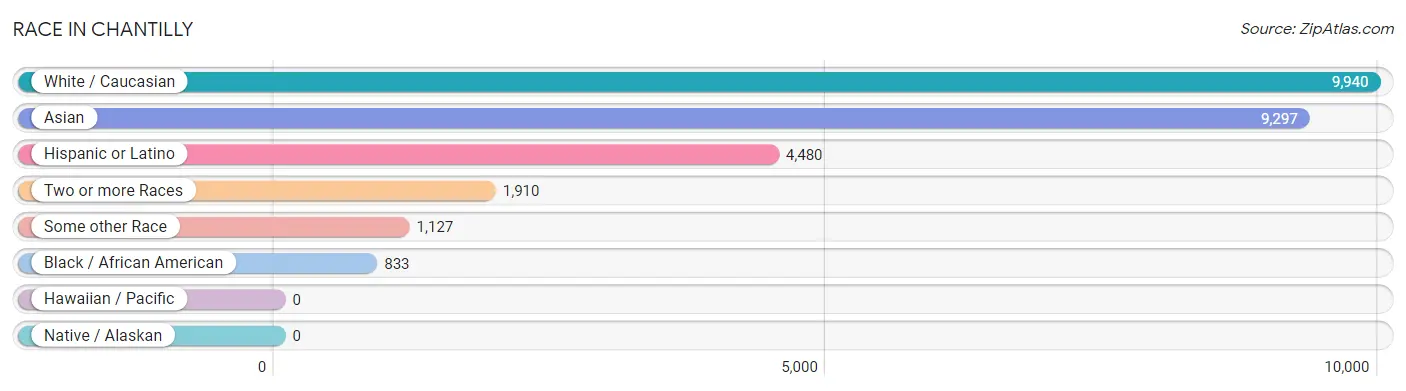
| Race | # Population | % Population |
| Asian | 9,297 | 40.2% |
| Black / African American | 833 | 3.6% |
| Hawaiian / Pacific | 0 | 0.0% |
| Hispanic or Latino | 4,480 | 19.4% |
| Native / Alaskan | 0 | 0.0% |
| White / Caucasian | 9,940 | 43.0% |
| Two or more Races | 1,910 | 8.3% |
| Some other Race | 1,127 | 4.9% |
| Total | 23,107 | 100.0% |
Ancestry in Chantilly
The most populous ancestries reported in Chantilly are Thai (3,010 | 13.0%), Central American (2,075 | 9.0%), English (1,687 | 7.3%), German (1,486 | 6.4%), and Irish (1,478 | 6.4%), together accounting for 42.1% of all Chantilly residents.
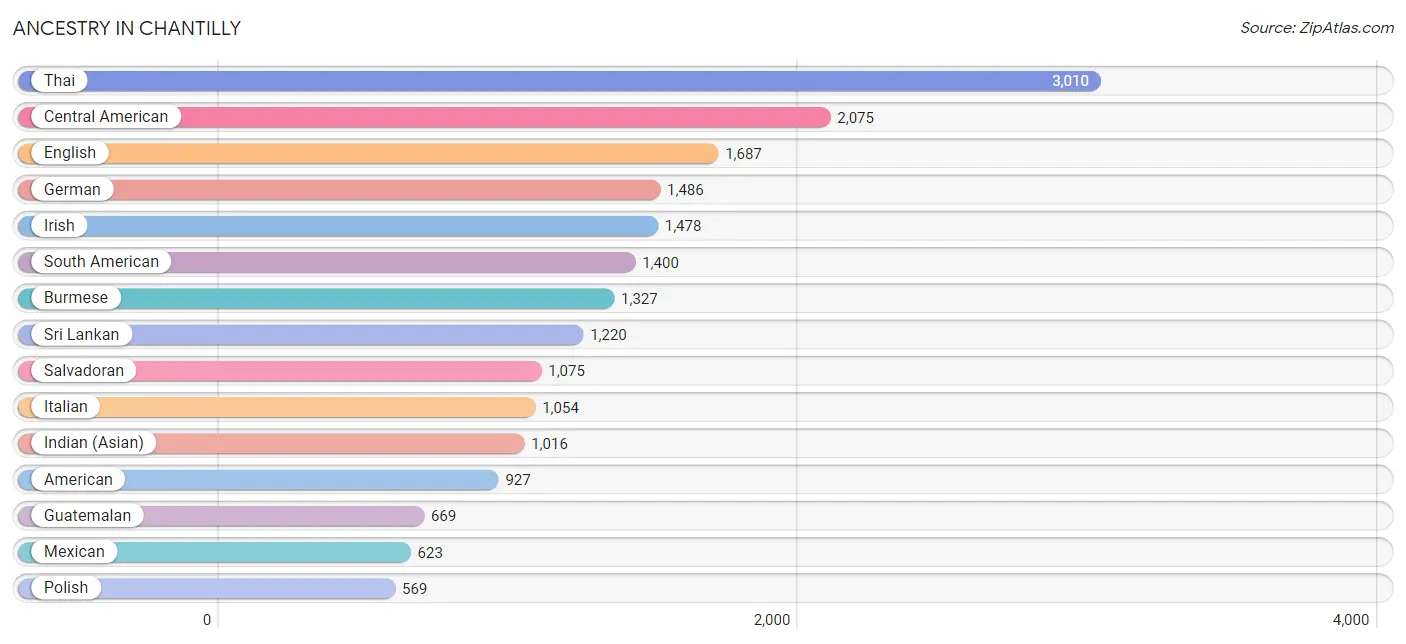
| Ancestry | # Population | % Population |
| Afghan | 133 | 0.6% |
| African | 54 | 0.2% |
| American | 927 | 4.0% |
| Arab | 315 | 1.4% |
| Argentinean | 122 | 0.5% |
| Austrian | 9 | 0.0% |
| Belgian | 2 | 0.0% |
| Bhutanese | 105 | 0.4% |
| Bolivian | 438 | 1.9% |
| British | 42 | 0.2% |
| Bulgarian | 14 | 0.1% |
| Burmese | 1,327 | 5.7% |
| Cajun | 13 | 0.1% |
| Canadian | 52 | 0.2% |
| Central American | 2,075 | 9.0% |
| Cherokee | 53 | 0.2% |
| Choctaw | 12 | 0.1% |
| Colombian | 163 | 0.7% |
| Costa Rican | 17 | 0.1% |
| Croatian | 31 | 0.1% |
| Czech | 66 | 0.3% |
| Czechoslovakian | 24 | 0.1% |
| Danish | 82 | 0.4% |
| Dutch | 15 | 0.1% |
| Eastern European | 58 | 0.3% |
| Ecuadorian | 75 | 0.3% |
| Egyptian | 90 | 0.4% |
| English | 1,687 | 7.3% |
| Ethiopian | 36 | 0.2% |
| European | 239 | 1.0% |
| Filipino | 112 | 0.5% |
| Finnish | 24 | 0.1% |
| French | 155 | 0.7% |
| French Canadian | 64 | 0.3% |
| German | 1,486 | 6.4% |
| Ghanaian | 39 | 0.2% |
| Greek | 109 | 0.5% |
| Guatemalan | 669 | 2.9% |
| Honduran | 229 | 1.0% |
| Hungarian | 129 | 0.6% |
| Indian (Asian) | 1,016 | 4.4% |
| Iranian | 268 | 1.2% |
| Iraqi | 97 | 0.4% |
| Irish | 1,478 | 6.4% |
| Israeli | 13 | 0.1% |
| Italian | 1,054 | 4.6% |
| Japanese | 338 | 1.5% |
| Korean | 514 | 2.2% |
| Laotian | 25 | 0.1% |
| Latvian | 27 | 0.1% |
| Lebanese | 35 | 0.2% |
| Mexican | 623 | 2.7% |
| Moroccan | 25 | 0.1% |
| Navajo | 13 | 0.1% |
| New Zealander | 21 | 0.1% |
| Nicaraguan | 85 | 0.4% |
| Nigerian | 10 | 0.0% |
| Northern European | 42 | 0.2% |
| Norwegian | 111 | 0.5% |
| Pakistani | 17 | 0.1% |
| Peruvian | 567 | 2.5% |
| Polish | 569 | 2.5% |
| Portuguese | 32 | 0.1% |
| Puerto Rican | 136 | 0.6% |
| Romanian | 39 | 0.2% |
| Russian | 209 | 0.9% |
| Salvadoran | 1,075 | 4.6% |
| Scotch-Irish | 157 | 0.7% |
| Scottish | 189 | 0.8% |
| Slavic | 35 | 0.2% |
| Slovak | 99 | 0.4% |
| Somali | 47 | 0.2% |
| South American | 1,400 | 6.1% |
| South American Indian | 12 | 0.1% |
| Spaniard | 9 | 0.0% |
| Sri Lankan | 1,220 | 5.3% |
| Subsaharan African | 211 | 0.9% |
| Sudanese | 33 | 0.1% |
| Swedish | 82 | 0.4% |
| Swiss | 63 | 0.3% |
| Thai | 3,010 | 13.0% |
| Trinidadian and Tobagonian | 11 | 0.1% |
| Turkish | 118 | 0.5% |
| Ukrainian | 69 | 0.3% |
| Uruguayan | 25 | 0.1% |
| Venezuelan | 10 | 0.0% |
| Vietnamese | 324 | 1.4% |
| Welsh | 72 | 0.3% | View All 88 Rows |
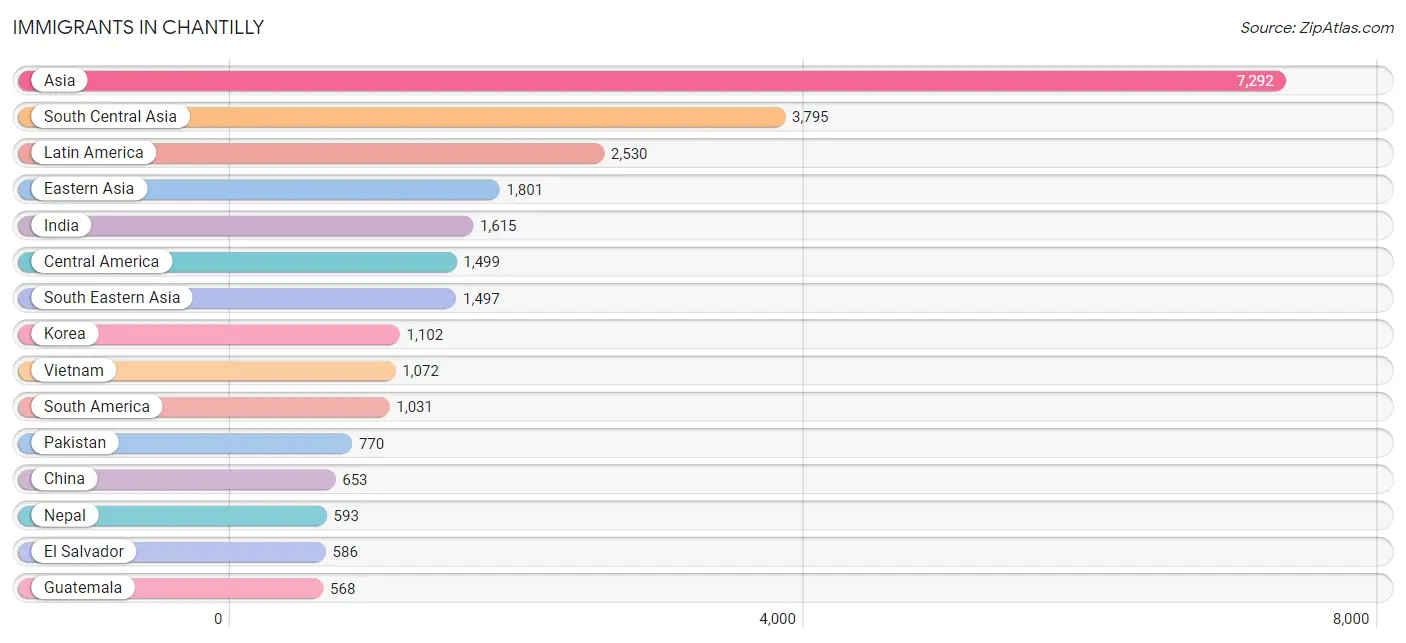
Immigrants in Chantilly
The most numerous immigrant groups reported in Chantilly came from Asia (7,292 | 31.6%), South Central Asia (3,795 | 16.4%), Latin America (2,530 | 11.0%), Eastern Asia (1,801 | 7.8%), and India (1,615 | 7.0%), together accounting for 73.7% of all Chantilly residents.
| Immigration Origin | # Population | % Population |
| Afghanistan | 120 | 0.5% |
| Africa | 255 | 1.1% |
| Argentina | 98 | 0.4% |
| Asia | 7,292 | 31.6% |
| Australia | 8 | 0.0% |
| Bangladesh | 396 | 1.7% |
| Bolivia | 331 | 1.4% |
| Brazil | 23 | 0.1% |
| Bulgaria | 14 | 0.1% |
| Cambodia | 156 | 0.7% |
| Canada | 22 | 0.1% |
| Central America | 1,499 | 6.5% |
| China | 653 | 2.8% |
| Colombia | 114 | 0.5% |
| Costa Rica | 17 | 0.1% |
| Eastern Africa | 90 | 0.4% |
| Eastern Asia | 1,801 | 7.8% |
| Eastern Europe | 155 | 0.7% |
| Ecuador | 24 | 0.1% |
| Egypt | 31 | 0.1% |
| El Salvador | 586 | 2.5% |
| Eritrea | 42 | 0.2% |
| Europe | 291 | 1.3% |
| France | 14 | 0.1% |
| Germany | 55 | 0.2% |
| Ghana | 39 | 0.2% |
| Guatemala | 568 | 2.5% |
| Honduras | 54 | 0.2% |
| Hong Kong | 101 | 0.4% |
| India | 1,615 | 7.0% |
| Indonesia | 13 | 0.1% |
| Iran | 301 | 1.3% |
| Iraq | 97 | 0.4% |
| Ireland | 22 | 0.1% |
| Israel | 13 | 0.1% |
| Italy | 17 | 0.1% |
| Japan | 46 | 0.2% |
| Jordan | 10 | 0.0% |
| Kenya | 14 | 0.1% |
| Korea | 1,102 | 4.8% |
| Kuwait | 19 | 0.1% |
| Latin America | 2,530 | 11.0% |
| Malaysia | 31 | 0.1% |
| Mexico | 207 | 0.9% |
| Moldova | 18 | 0.1% |
| Morocco | 30 | 0.1% |
| Nepal | 593 | 2.6% |
| Netherlands | 7 | 0.0% |
| Nicaragua | 67 | 0.3% |
| Nigeria | 10 | 0.0% |
| Northern Africa | 116 | 0.5% |
| Northern Europe | 34 | 0.2% |
| Oceania | 29 | 0.1% |
| Pakistan | 770 | 3.3% |
| Peru | 364 | 1.6% |
| Philippines | 208 | 0.9% |
| Poland | 37 | 0.2% |
| Romania | 18 | 0.1% |
| Russia | 68 | 0.3% |
| Somalia | 34 | 0.2% |
| South America | 1,031 | 4.5% |
| South Central Asia | 3,795 | 16.4% |
| South Eastern Asia | 1,497 | 6.5% |
| Southern Europe | 26 | 0.1% |
| Spain | 9 | 0.0% |
| Sudan | 55 | 0.2% |
| Taiwan | 139 | 0.6% |
| Thailand | 17 | 0.1% |
| Turkey | 60 | 0.3% |
| Uruguay | 25 | 0.1% |
| Venezuela | 10 | 0.0% |
| Vietnam | 1,072 | 4.6% |
| Western Africa | 49 | 0.2% |
| Western Asia | 199 | 0.9% |
| Western Europe | 76 | 0.3% | View All 75 Rows |
Sex and Age in Chantilly
Sex and Age in Chantilly
The most populous age groups in Chantilly are 40 to 44 Years (1,027 | 8.9%) for men and 15 to 19 Years (1,029 | 8.9%) for women.
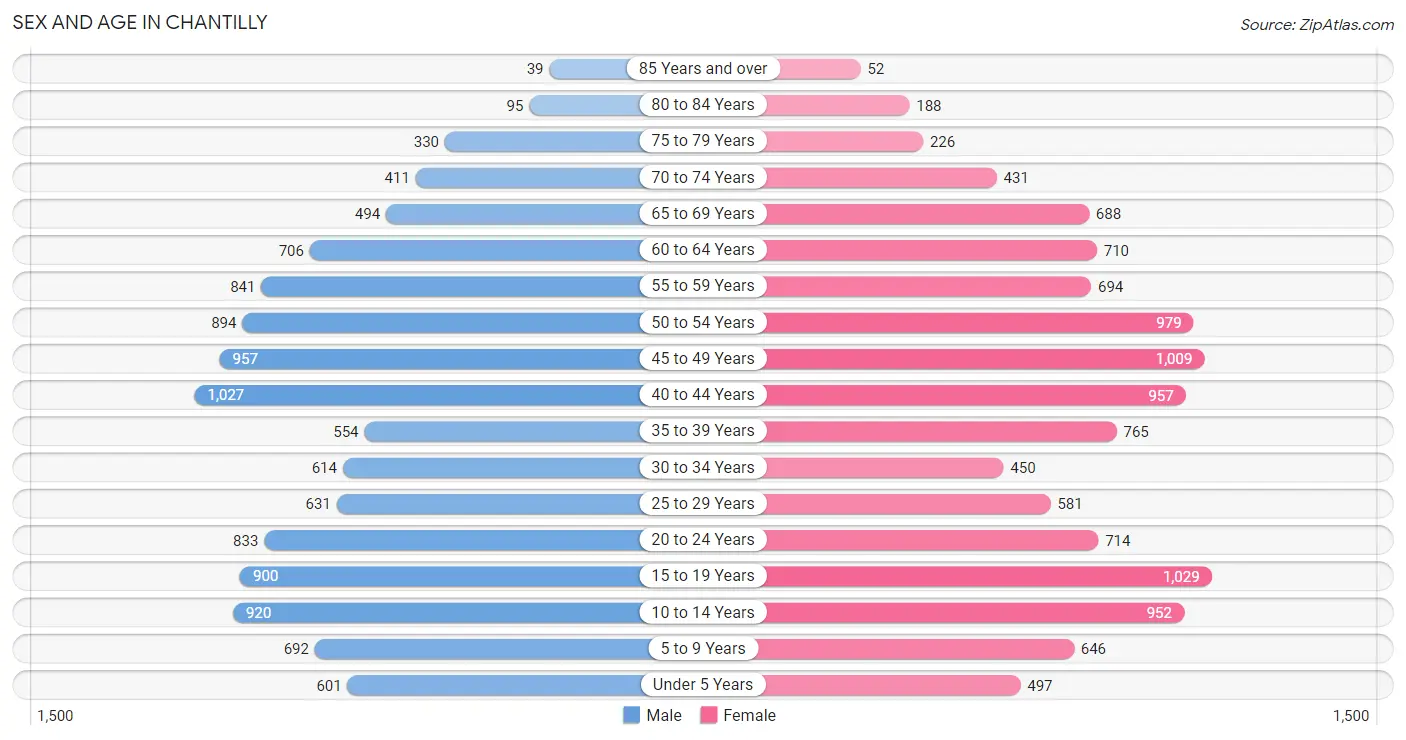
| Age Bracket | Male | Female |
| Under 5 Years | 601 (5.2%) | 497 (4.3%) |
| 5 to 9 Years | 692 (6.0%) | 646 (5.6%) |
| 10 to 14 Years | 920 (8.0%) | 952 (8.2%) |
| 15 to 19 Years | 900 (7.8%) | 1,029 (8.9%) |
| 20 to 24 Years | 833 (7.2%) | 714 (6.2%) |
| 25 to 29 Years | 631 (5.5%) | 581 (5.0%) |
| 30 to 34 Years | 614 (5.3%) | 450 (3.9%) |
| 35 to 39 Years | 554 (4.8%) | 765 (6.6%) |
| 40 to 44 Years | 1,027 (8.9%) | 957 (8.3%) |
| 45 to 49 Years | 957 (8.3%) | 1,009 (8.7%) |
| 50 to 54 Years | 894 (7.7%) | 979 (8.5%) |
| 55 to 59 Years | 841 (7.3%) | 694 (6.0%) |
| 60 to 64 Years | 706 (6.1%) | 710 (6.1%) |
| 65 to 69 Years | 494 (4.3%) | 688 (5.9%) |
| 70 to 74 Years | 411 (3.6%) | 431 (3.7%) |
| 75 to 79 Years | 330 (2.9%) | 226 (1.9%) |
| 80 to 84 Years | 95 (0.8%) | 188 (1.6%) |
| 85 Years and over | 39 (0.3%) | 52 (0.4%) |
| Total | 11,539 (100.0%) | 11,568 (100.0%) |
Families and Households in Chantilly
Median Family Size in Chantilly
The median family size in Chantilly is 3.56 persons per family, with single female/mother families (590 | 10.2%) accounting for the largest median family size of 3.95 persons per family. On the other hand, married-couple families (4,955 | 85.4%) represent the smallest median family size with 3.50 persons per family.
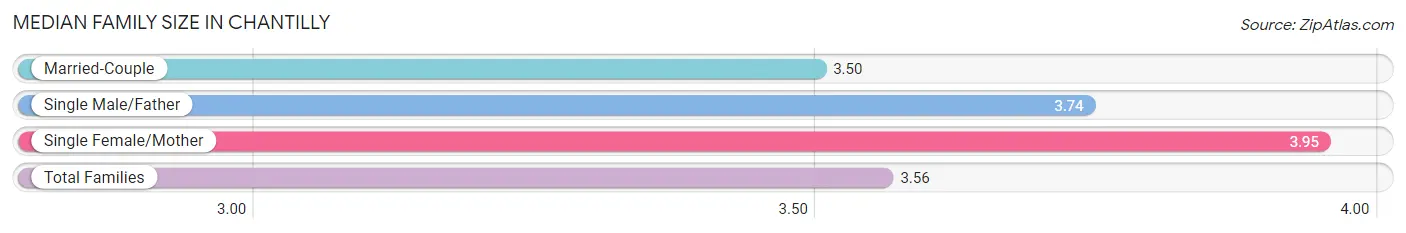
| Family Type | # Families | Family Size |
| Married-Couple | 4,955 (85.4%) | 3.50 |
| Single Male/Father | 257 (4.4%) | 3.74 |
| Single Female/Mother | 590 (10.2%) | 3.95 |
| Total Families | 5,802 (100.0%) | 3.56 |
Median Household Size in Chantilly
The median household size in Chantilly is 3.21 persons per household, with single female/mother households (590 | 8.2%) accounting for the largest median household size of 4.37 persons per household. non-family households (1,385 | 19.3%) represent the smallest median household size with 1.34 persons per household.
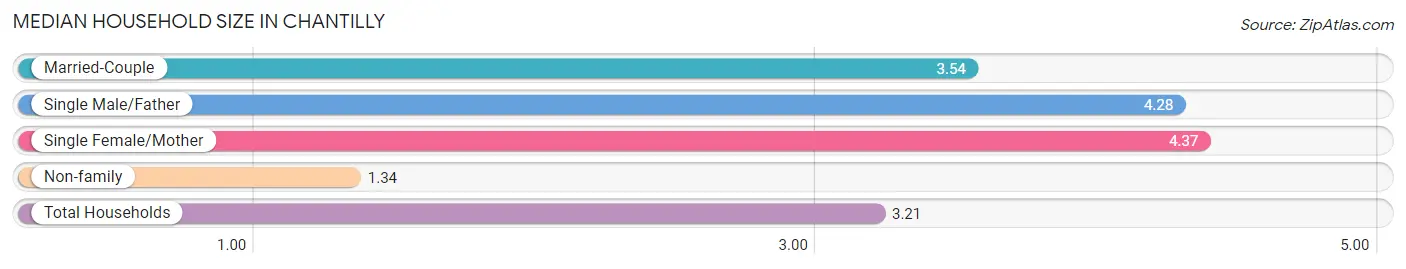
| Household Type | # Households | Household Size |
| Married-Couple | 4,955 (68.9%) | 3.54 |
| Single Male/Father | 257 (3.6%) | 4.28 |
| Single Female/Mother | 590 (8.2%) | 4.37 |
| Non-family | 1,385 (19.3%) | 1.34 |
| Total Households | 7,187 (100.0%) | 3.21 |
Household Size by Marriage Status in Chantilly
Out of a total of 7,187 households in Chantilly, 5,802 (80.7%) are family households, while 1,385 (19.3%) are nonfamily households. The most numerous type of family households are 2-person households, comprising 1,782, and the most common type of nonfamily households are 1-person households, comprising 1,104.
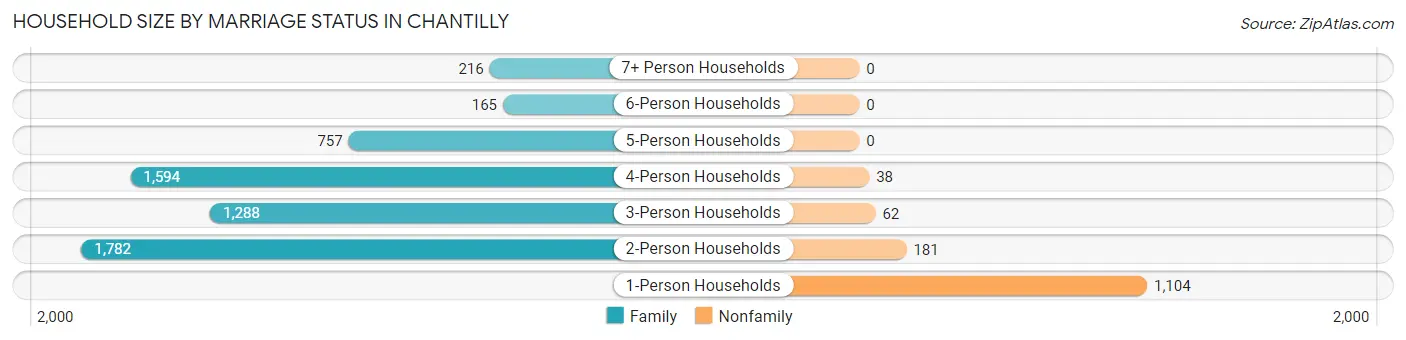
| Household Size | Family Households | Nonfamily Households |
| 1-Person Households | - | 1,104 (15.4%) |
| 2-Person Households | 1,782 (24.8%) | 181 (2.5%) |
| 3-Person Households | 1,288 (17.9%) | 62 (0.9%) |
| 4-Person Households | 1,594 (22.2%) | 38 (0.5%) |
| 5-Person Households | 757 (10.5%) | 0 (0.0%) |
| 6-Person Households | 165 (2.3%) | 0 (0.0%) |
| 7+ Person Households | 216 (3.0%) | 0 (0.0%) |
| Total | 5,802 (80.7%) | 1,385 (19.3%) |
Female Fertility in Chantilly
Fertility by Age in Chantilly
Average fertility rate in Chantilly is 45.0 births per 1,000 women. Women in the age bracket of 20 to 34 years have the highest fertility rate with 92.0 births per 1,000 women. Women in the age bracket of 20 to 34 years acount for 62.6% of all women with births.
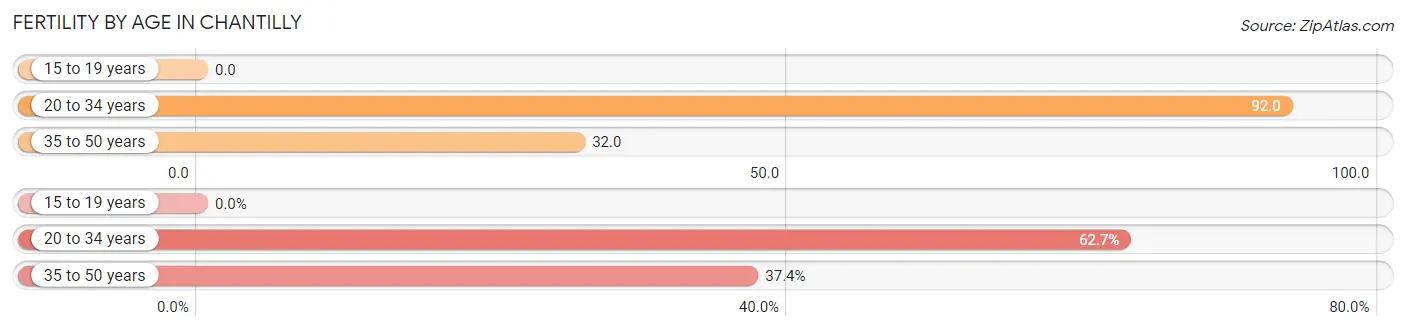
| Age Bracket | Women with Births | Births / 1,000 Women |
| 15 to 19 years | 0 (0.0%) | 0.0 |
| 20 to 34 years | 161 (62.6%) | 92.0 |
| 35 to 50 years | 96 (37.3%) | 32.0 |
| Total | 257 (100.0%) | 45.0 |
Fertility by Age by Marriage Status in Chantilly
94.6% of women with births (257) in Chantilly are married. The highest percentage of unmarried women with births falls into 35 to 50 years age bracket with 14.6% of them unmarried at the time of birth, while the lowest percentage of unmarried women with births belong to 20 to 34 years age bracket with 0.0% of them unmarried.
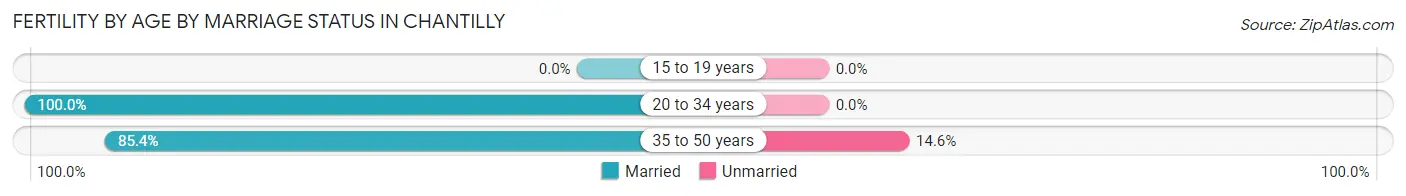
| Age Bracket | Married | Unmarried |
| 15 to 19 years | 0 (0.0%) | 0 (0.0%) |
| 20 to 34 years | 161 (100.0%) | 0 (0.0%) |
| 35 to 50 years | 82 (85.4%) | 14 (14.6%) |
| Total | 243 (94.6%) | 14 (5.4%) |
Fertility by Education in Chantilly
Average fertility rate in Chantilly is 45.0 births per 1,000 women. Women with the education attainment of college or associate's degree have the highest fertility rate of 66.0 births per 1,000 women, while women with the education attainment of less than high school have the lowest fertility at 21.0 births per 1,000 women. Women with the education attainment of bachelor's degree represent 37.7% of all women with births.
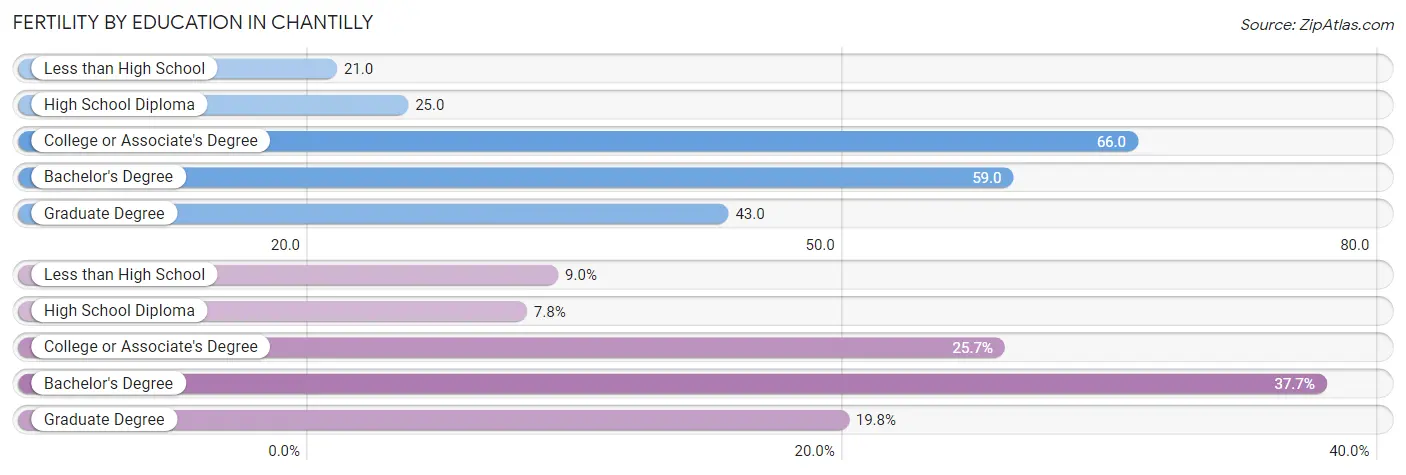
| Educational Attainment | Women with Births | Births / 1,000 Women |
| Less than High School | 23 (8.9%) | 21.0 |
| High School Diploma | 20 (7.8%) | 25.0 |
| College or Associate's Degree | 66 (25.7%) | 66.0 |
| Bachelor's Degree | 97 (37.7%) | 59.0 |
| Graduate Degree | 51 (19.8%) | 43.0 |
| Total | 257 (100.0%) | 45.0 |
Fertility by Education by Marriage Status in Chantilly
5.4% of women with births in Chantilly are unmarried. Women with the educational attainment of high school diploma are most likely to be married with 100.0% of them married at childbirth, while women with the educational attainment of less than high school are least likely to be married with 60.9% of them unmarried at childbirth.
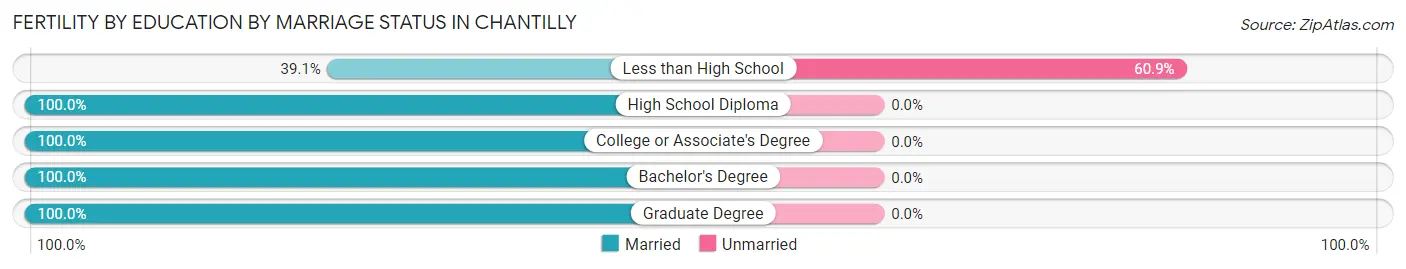
| Educational Attainment | Married | Unmarried |
| Less than High School | 9 (39.1%) | 14 (60.9%) |
| High School Diploma | 20 (100.0%) | 0 (0.0%) |
| College or Associate's Degree | 66 (100.0%) | 0 (0.0%) |
| Bachelor's Degree | 97 (100.0%) | 0 (0.0%) |
| Graduate Degree | 51 (100.0%) | 0 (0.0%) |
| Total | 243 (94.6%) | 14 (5.4%) |
Employment Characteristics in Chantilly
Employment by Class of Employer in Chantilly
Among the 12,545 employed individuals in Chantilly, private company employees (8,313 | 66.3%), federal government employees (1,288 | 10.3%), and local government employees (866 | 6.9%) make up the most common classes of employment.
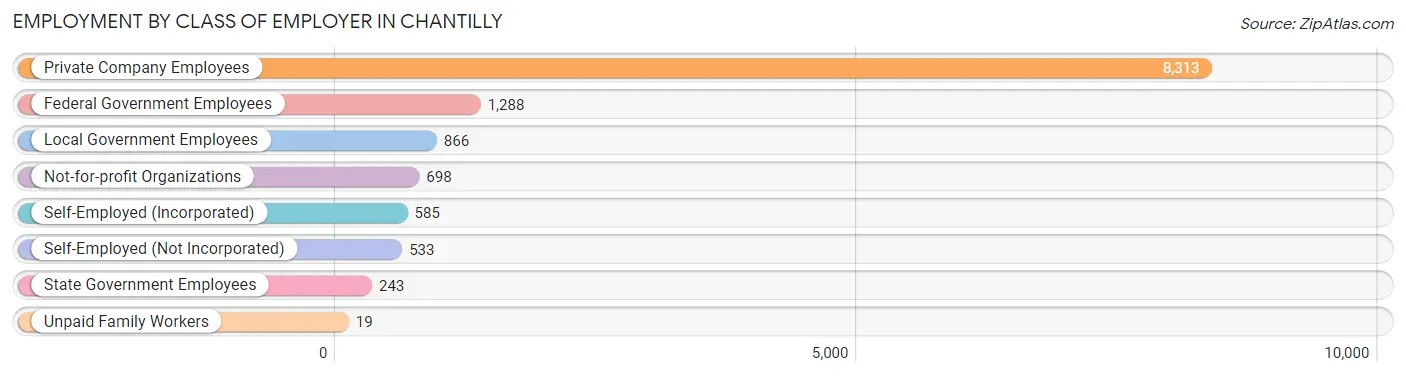
| Employer Class | # Employees | % Employees |
| Private Company Employees | 8,313 | 66.3% |
| Self-Employed (Incorporated) | 585 | 4.7% |
| Self-Employed (Not Incorporated) | 533 | 4.3% |
| Not-for-profit Organizations | 698 | 5.6% |
| Local Government Employees | 866 | 6.9% |
| State Government Employees | 243 | 1.9% |
| Federal Government Employees | 1,288 | 10.3% |
| Unpaid Family Workers | 19 | 0.2% |
| Total | 12,545 | 100.0% |
Employment Status by Age in Chantilly
According to the labor force statistics for Chantilly, out of the total population over 16 years of age (18,395), 71.6% or 13,171 individuals are in the labor force, with 2.9% or 382 of them unemployed. The age group with the highest labor force participation rate is 45 to 54 years, with 89.9% or 3,451 individuals in the labor force. Within the labor force, the 16 to 19 years age range has the highest percentage of unemployed individuals, with 9.6% or 50 of them being unemployed.
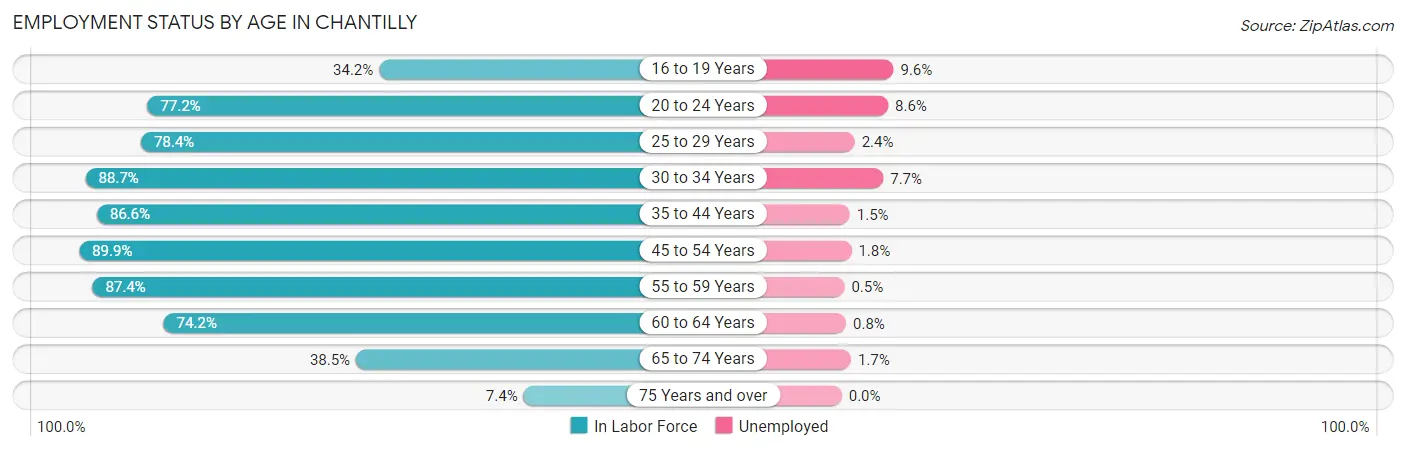
| Age Bracket | In Labor Force | Unemployed |
| 16 to 19 Years | 522 (34.2%) | 50 (9.6%) |
| 20 to 24 Years | 1,194 (77.2%) | 103 (8.6%) |
| 25 to 29 Years | 950 (78.4%) | 23 (2.4%) |
| 30 to 34 Years | 944 (88.7%) | 73 (7.7%) |
| 35 to 44 Years | 2,860 (86.6%) | 43 (1.5%) |
| 45 to 54 Years | 3,451 (89.9%) | 62 (1.8%) |
| 55 to 59 Years | 1,342 (87.4%) | 7 (0.5%) |
| 60 to 64 Years | 1,051 (74.2%) | 8 (0.8%) |
| 65 to 74 Years | 779 (38.5%) | 13 (1.7%) |
| 75 Years and over | 69 (7.4%) | 0 (0.0%) |
| Total | 13,171 (71.6%) | 382 (2.9%) |
Employment Status by Educational Attainment in Chantilly
According to labor force statistics for Chantilly, 85.7% of individuals (10,600) out of the total population between 25 and 64 years of age (12,369) are in the labor force, with 2.0% or 212 of them being unemployed. The group with the highest labor force participation rate are those with the educational attainment of bachelor's degree or higher, with 89.4% or 6,747 individuals in the labor force. Within the labor force, individuals with college / associate degree education have the highest percentage of unemployment, with 2.9% or 51 of them being unemployed.
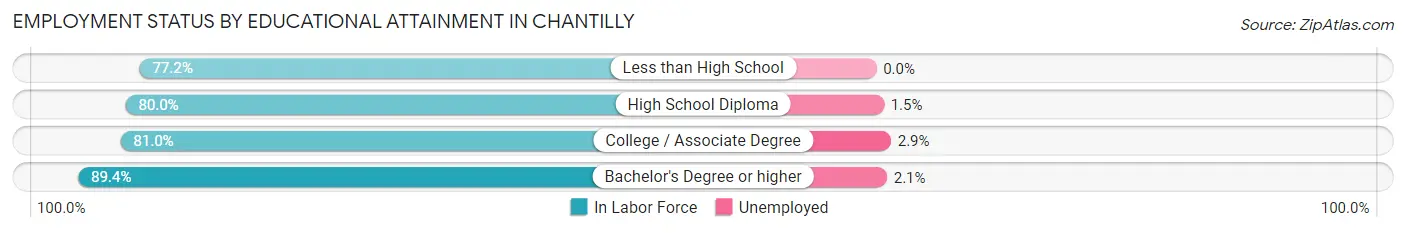
| Educational Attainment | In Labor Force | Unemployed |
| Less than High School | 714 (77.2%) | 0 (0.0%) |
| High School Diploma | 1,392 (80.0%) | 26 (1.5%) |
| College / Associate Degree | 1,747 (81.0%) | 63 (2.9%) |
| Bachelor's Degree or higher | 6,747 (89.4%) | 158 (2.1%) |
| Total | 10,600 (85.7%) | 247 (2.0%) |
Employment Occupations by Sex in Chantilly
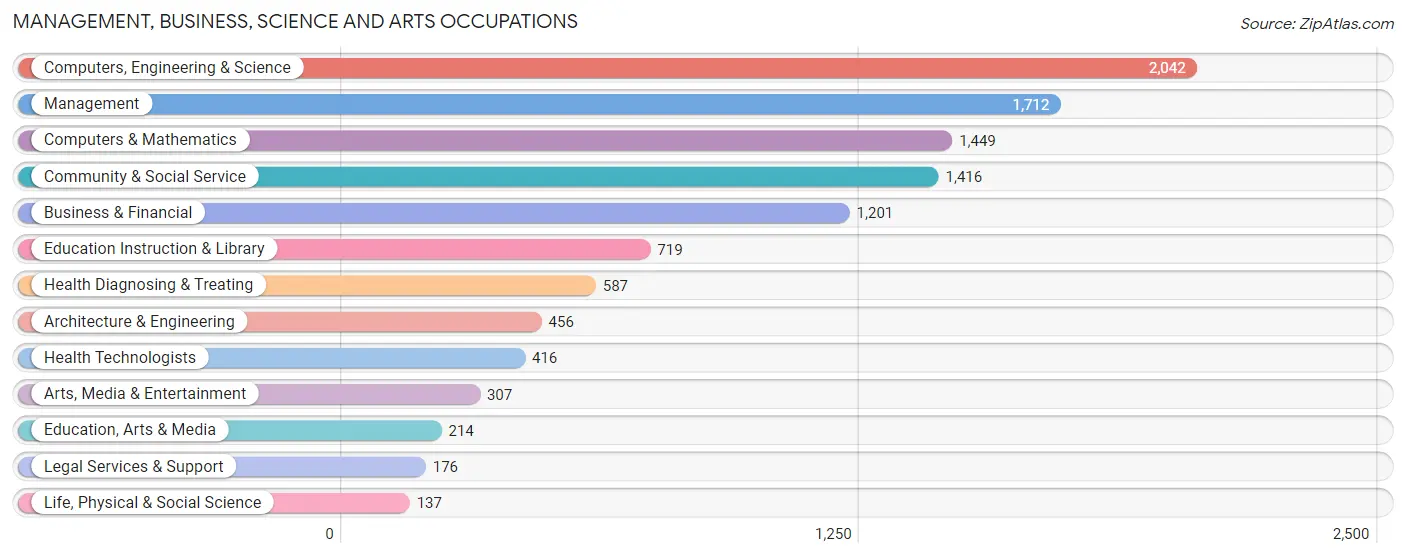
Management, Business, Science and Arts Occupations
The most common Management, Business, Science and Arts occupations in Chantilly are Computers, Engineering & Science (2,042 | 16.1%), Management (1,712 | 13.5%), Computers & Mathematics (1,449 | 11.4%), Community & Social Service (1,416 | 11.2%), and Business & Financial (1,201 | 9.5%).
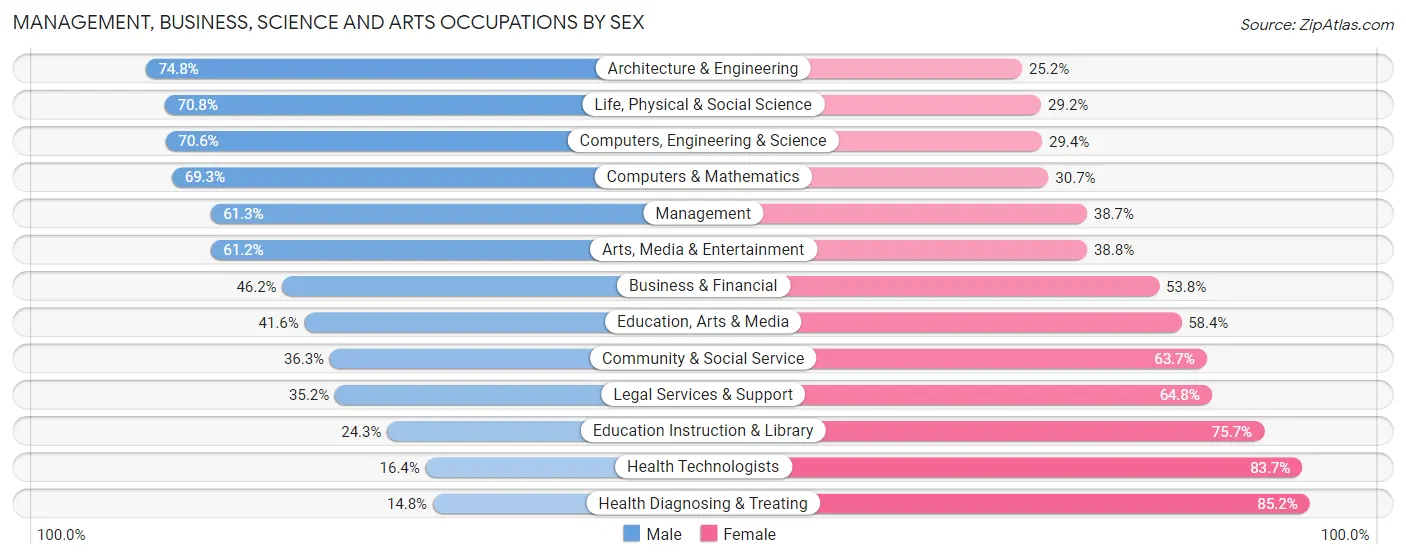
Management, Business, Science and Arts Occupations by Sex
Within the Management, Business, Science and Arts occupations in Chantilly, the most male-oriented occupations are Architecture & Engineering (74.8%), Life, Physical & Social Science (70.8%), and Computers, Engineering & Science (70.6%), while the most female-oriented occupations are Health Diagnosing & Treating (85.2%), Health Technologists (83.7%), and Education Instruction & Library (75.7%).
| Occupation | Male | Female |
| Management | 1,049 (61.3%) | 663 (38.7%) |
| Business & Financial | 555 (46.2%) | 646 (53.8%) |
| Computers, Engineering & Science | 1,442 (70.6%) | 600 (29.4%) |
| Computers & Mathematics | 1,004 (69.3%) | 445 (30.7%) |
| Architecture & Engineering | 341 (74.8%) | 115 (25.2%) |
| Life, Physical & Social Science | 97 (70.8%) | 40 (29.2%) |
| Community & Social Service | 514 (36.3%) | 902 (63.7%) |
| Education, Arts & Media | 89 (41.6%) | 125 (58.4%) |
| Legal Services & Support | 62 (35.2%) | 114 (64.8%) |
| Education Instruction & Library | 175 (24.3%) | 544 (75.7%) |
| Arts, Media & Entertainment | 188 (61.2%) | 119 (38.8%) |
| Health Diagnosing & Treating | 87 (14.8%) | 500 (85.2%) |
| Health Technologists | 68 (16.4%) | 348 (83.7%) |
| Total (Category) | 3,647 (52.4%) | 3,311 (47.6%) |
| Total (Overall) | 6,960 (54.8%) | 5,745 (45.2%) |
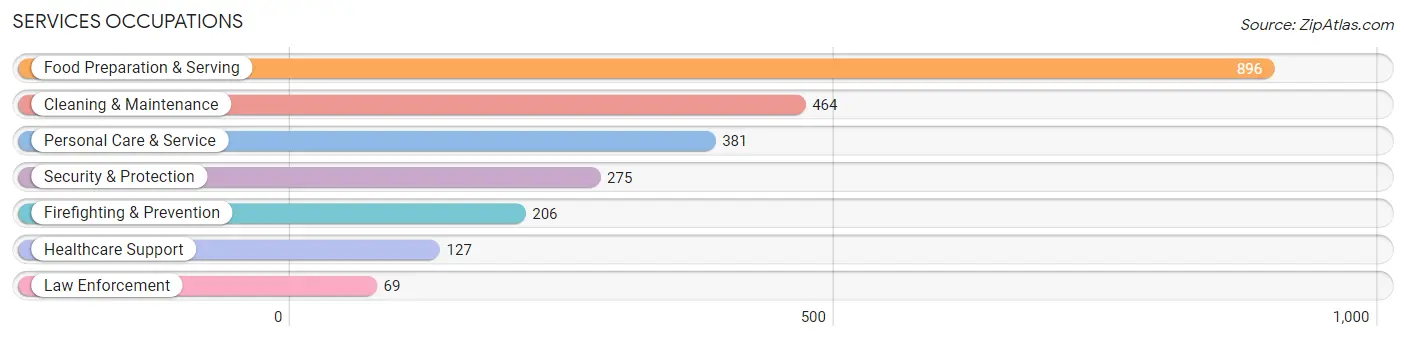
Services Occupations
The most common Services occupations in Chantilly are Food Preparation & Serving (896 | 7.0%), Cleaning & Maintenance (464 | 3.6%), Personal Care & Service (381 | 3.0%), Security & Protection (275 | 2.2%), and Firefighting & Prevention (206 | 1.6%).
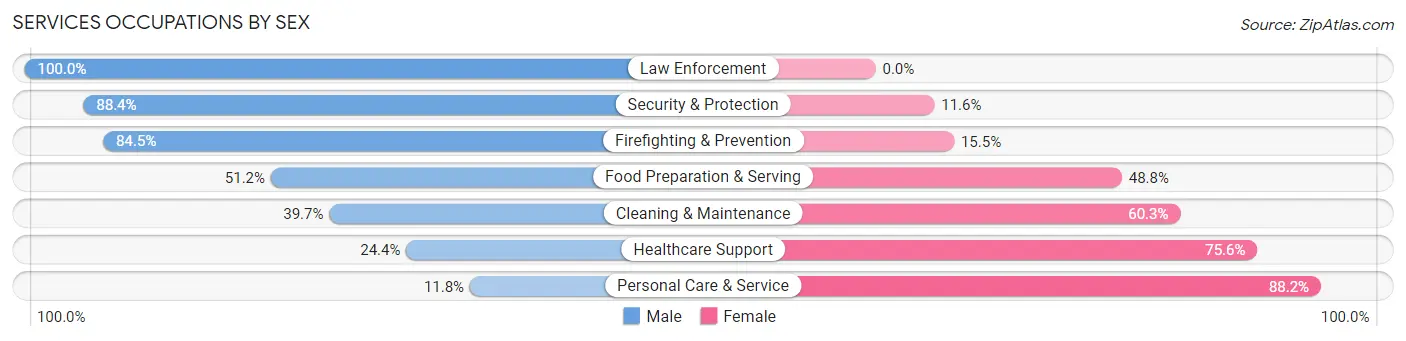
Services Occupations by Sex
Within the Services occupations in Chantilly, the most male-oriented occupations are Law Enforcement (100.0%), Security & Protection (88.4%), and Firefighting & Prevention (84.5%), while the most female-oriented occupations are Personal Care & Service (88.2%), Healthcare Support (75.6%), and Cleaning & Maintenance (60.3%).
| Occupation | Male | Female |
| Healthcare Support | 31 (24.4%) | 96 (75.6%) |
| Security & Protection | 243 (88.4%) | 32 (11.6%) |
| Firefighting & Prevention | 174 (84.5%) | 32 (15.5%) |
| Law Enforcement | 69 (100.0%) | 0 (0.0%) |
| Food Preparation & Serving | 459 (51.2%) | 437 (48.8%) |
| Cleaning & Maintenance | 184 (39.7%) | 280 (60.3%) |
| Personal Care & Service | 45 (11.8%) | 336 (88.2%) |
| Total (Category) | 962 (44.9%) | 1,181 (55.1%) |
| Total (Overall) | 6,960 (54.8%) | 5,745 (45.2%) |
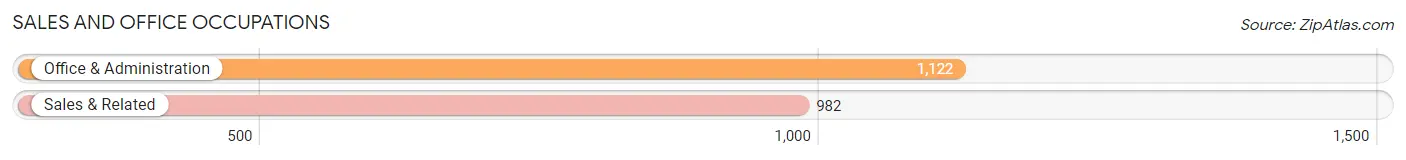
Sales and Office Occupations
The most common Sales and Office occupations in Chantilly are Office & Administration (1,122 | 8.8%), and Sales & Related (982 | 7.7%).
Sales and Office Occupations by Sex
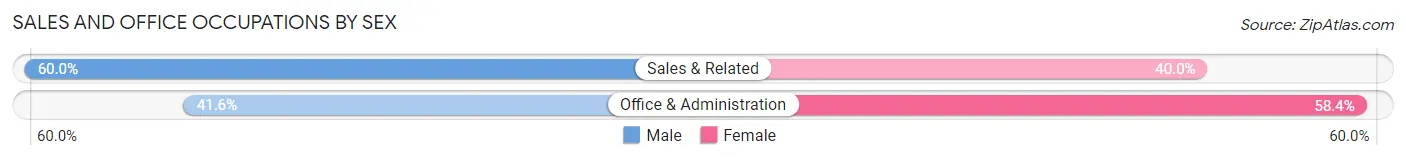
| Occupation | Male | Female |
| Sales & Related | 589 (60.0%) | 393 (40.0%) |
| Office & Administration | 467 (41.6%) | 655 (58.4%) |
| Total (Category) | 1,056 (50.2%) | 1,048 (49.8%) |
| Total (Overall) | 6,960 (54.8%) | 5,745 (45.2%) |
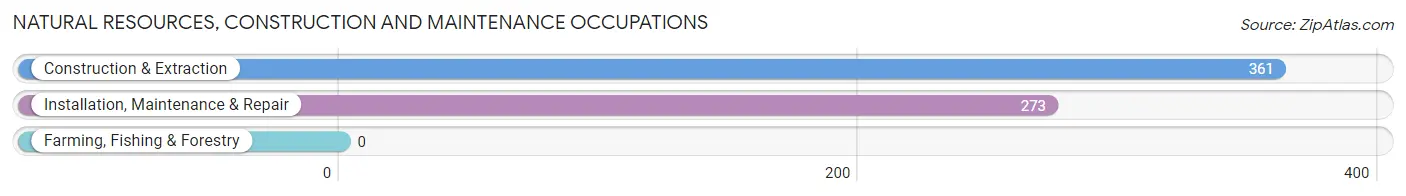
Natural Resources, Construction and Maintenance Occupations
The most common Natural Resources, Construction and Maintenance occupations in Chantilly are Construction & Extraction (361 | 2.8%), and Installation, Maintenance & Repair (273 | 2.1%).
Natural Resources, Construction and Maintenance Occupations by Sex
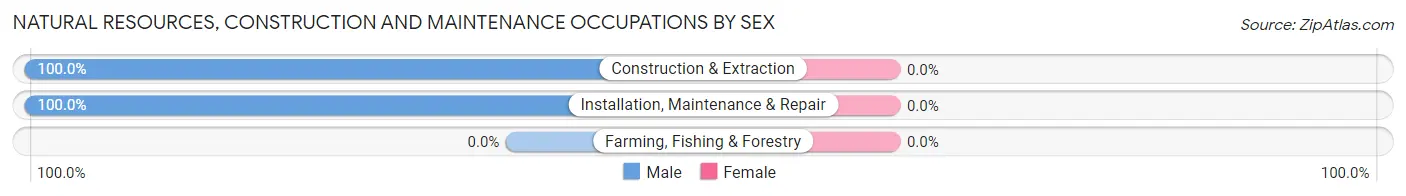
| Occupation | Male | Female |
| Farming, Fishing & Forestry | 0 (0.0%) | 0 (0.0%) |
| Construction & Extraction | 361 (100.0%) | 0 (0.0%) |
| Installation, Maintenance & Repair | 273 (100.0%) | 0 (0.0%) |
| Total (Category) | 634 (100.0%) | 0 (0.0%) |
| Total (Overall) | 6,960 (54.8%) | 5,745 (45.2%) |
Production, Transportation and Moving Occupations
The most common Production, Transportation and Moving occupations in Chantilly are Production (514 | 4.1%), Transportation (274 | 2.2%), and Material Moving (78 | 0.6%).
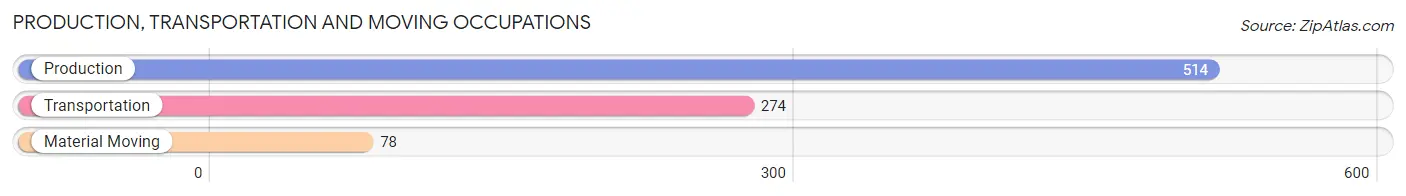
Production, Transportation and Moving Occupations by Sex
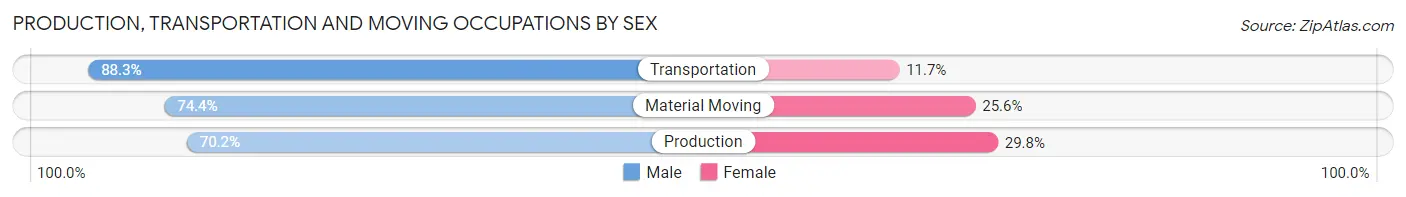
| Occupation | Male | Female |
| Production | 361 (70.2%) | 153 (29.8%) |
| Transportation | 242 (88.3%) | 32 (11.7%) |
| Material Moving | 58 (74.4%) | 20 (25.6%) |
| Total (Category) | 661 (76.3%) | 205 (23.7%) |
| Total (Overall) | 6,960 (54.8%) | 5,745 (45.2%) |
Employment Industries by Sex in Chantilly
Employment Industries in Chantilly
The major employment industries in Chantilly include Professional & Scientific (2,849 | 22.4%), Public Administration (1,124 | 8.8%), Health Care & Social Assistance (1,105 | 8.7%), Retail Trade (1,029 | 8.1%), and Accommodation & Food Services (978 | 7.7%).
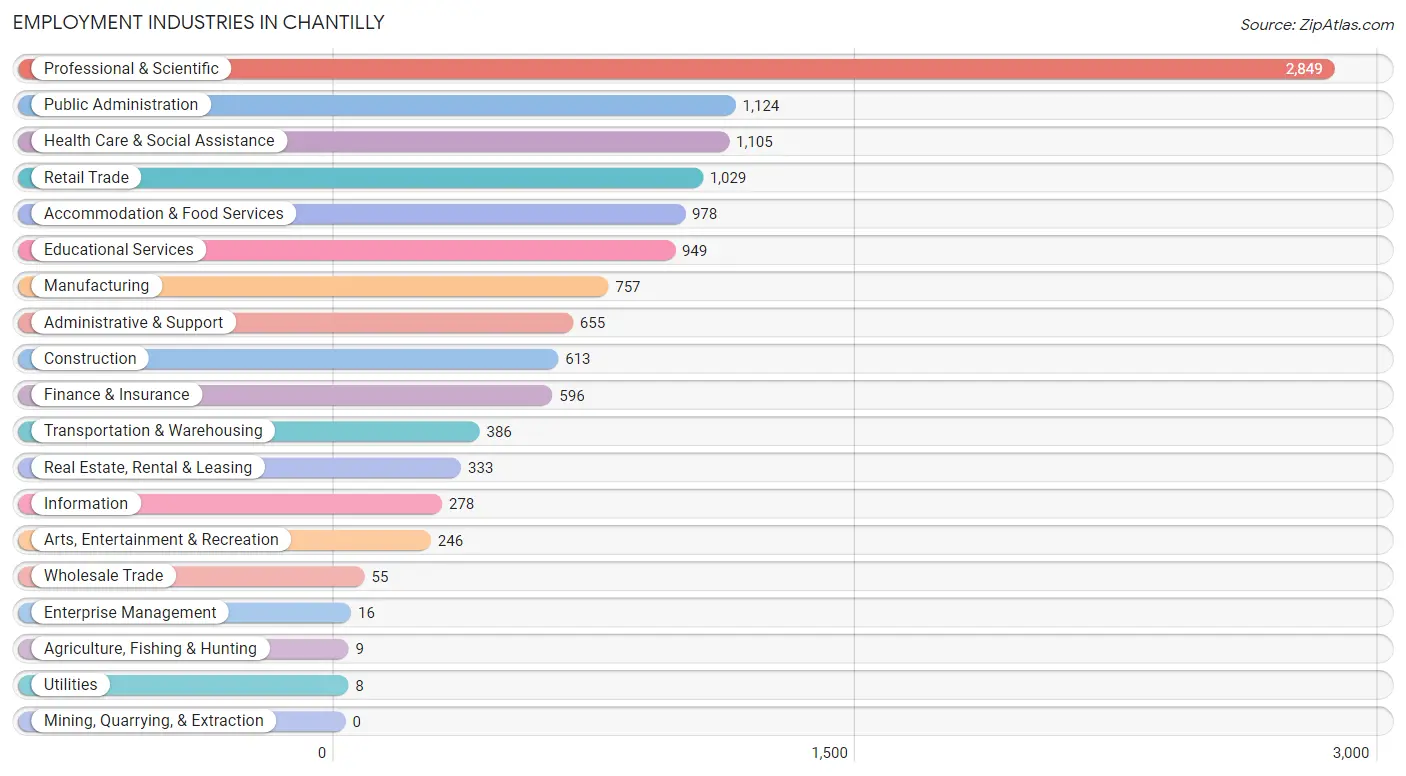
Employment Industries by Sex in Chantilly
The Chantilly industries that see more men than women are Construction (100.0%), Wholesale Trade (100.0%), and Utilities (100.0%), whereas the industries that tend to have a higher number of women are Agriculture, Fishing & Hunting (100.0%), Health Care & Social Assistance (80.4%), and Educational Services (74.5%).
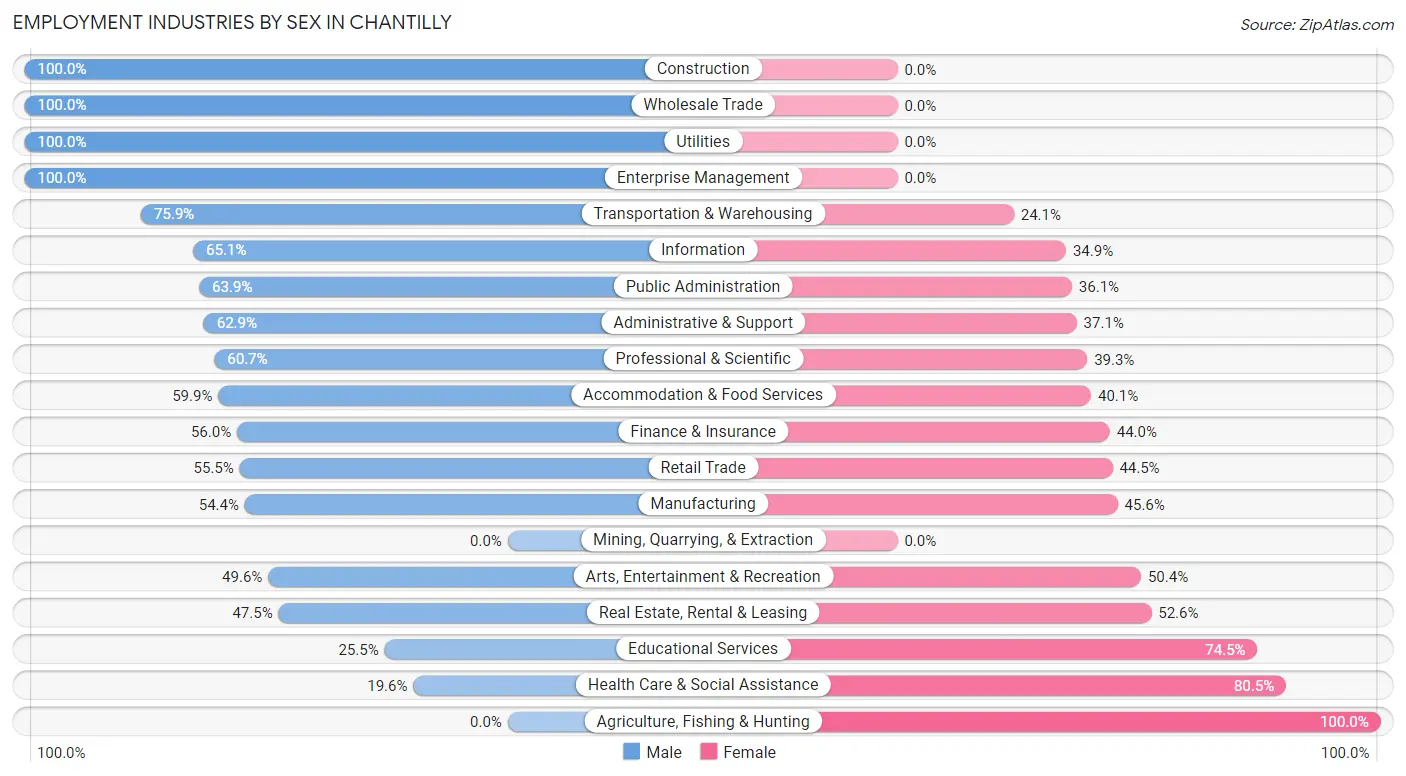
| Industry | Male | Female |
| Agriculture, Fishing & Hunting | 0 (0.0%) | 9 (100.0%) |
| Mining, Quarrying, & Extraction | 0 (0.0%) | 0 (0.0%) |
| Construction | 613 (100.0%) | 0 (0.0%) |
| Manufacturing | 412 (54.4%) | 345 (45.6%) |
| Wholesale Trade | 55 (100.0%) | 0 (0.0%) |
| Retail Trade | 571 (55.5%) | 458 (44.5%) |
| Transportation & Warehousing | 293 (75.9%) | 93 (24.1%) |
| Utilities | 8 (100.0%) | 0 (0.0%) |
| Information | 181 (65.1%) | 97 (34.9%) |
| Finance & Insurance | 334 (56.0%) | 262 (44.0%) |
| Real Estate, Rental & Leasing | 158 (47.4%) | 175 (52.5%) |
| Professional & Scientific | 1,730 (60.7%) | 1,119 (39.3%) |
| Enterprise Management | 16 (100.0%) | 0 (0.0%) |
| Administrative & Support | 412 (62.9%) | 243 (37.1%) |
| Educational Services | 242 (25.5%) | 707 (74.5%) |
| Health Care & Social Assistance | 216 (19.6%) | 889 (80.4%) |
| Arts, Entertainment & Recreation | 122 (49.6%) | 124 (50.4%) |
| Accommodation & Food Services | 586 (59.9%) | 392 (40.1%) |
| Public Administration | 718 (63.9%) | 406 (36.1%) |
| Total | 6,960 (54.8%) | 5,745 (45.2%) |
Education in Chantilly
School Enrollment in Chantilly
The most common levels of schooling among the 6,669 students in Chantilly are high school (1,548 | 23.2%), college / undergraduate (1,483 | 22.2%), and middle school (1,458 | 21.9%).
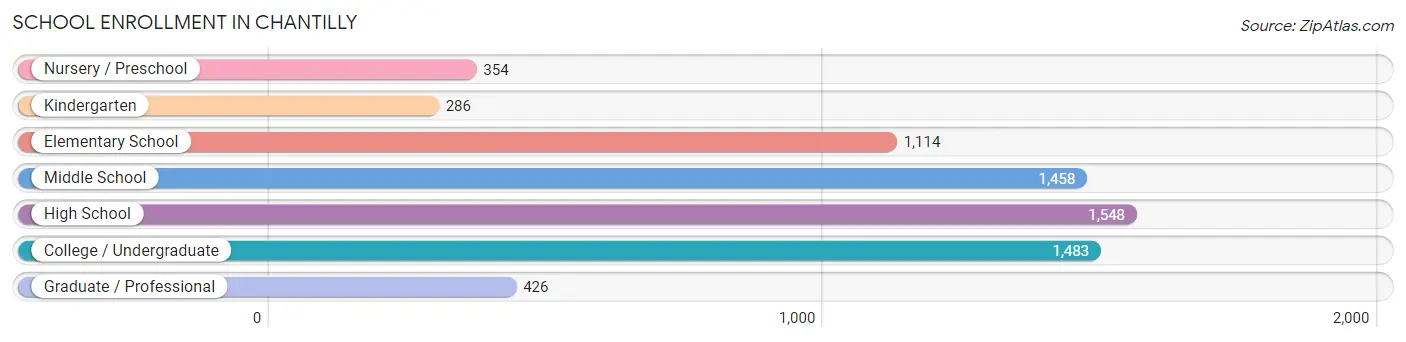
| School Level | # Students | % Students |
| Nursery / Preschool | 354 | 5.3% |
| Kindergarten | 286 | 4.3% |
| Elementary School | 1,114 | 16.7% |
| Middle School | 1,458 | 21.9% |
| High School | 1,548 | 23.2% |
| College / Undergraduate | 1,483 | 22.2% |
| Graduate / Professional | 426 | 6.4% |
| Total | 6,669 | 100.0% |
School Enrollment by Age by Funding Source in Chantilly
Out of a total of 6,669 students who are enrolled in schools in Chantilly, 934 (14.0%) attend a private institution, while the remaining 5,735 (86.0%) are enrolled in public schools. The age group of 35 years and over has the highest likelihood of being enrolled in private schools, with 133 (47.0% in the age bracket) enrolled. Conversely, the age group of 10 to 14 year olds has the lowest likelihood of being enrolled in a private school, with 1,740 (93.8% in the age bracket) attending a public institution.
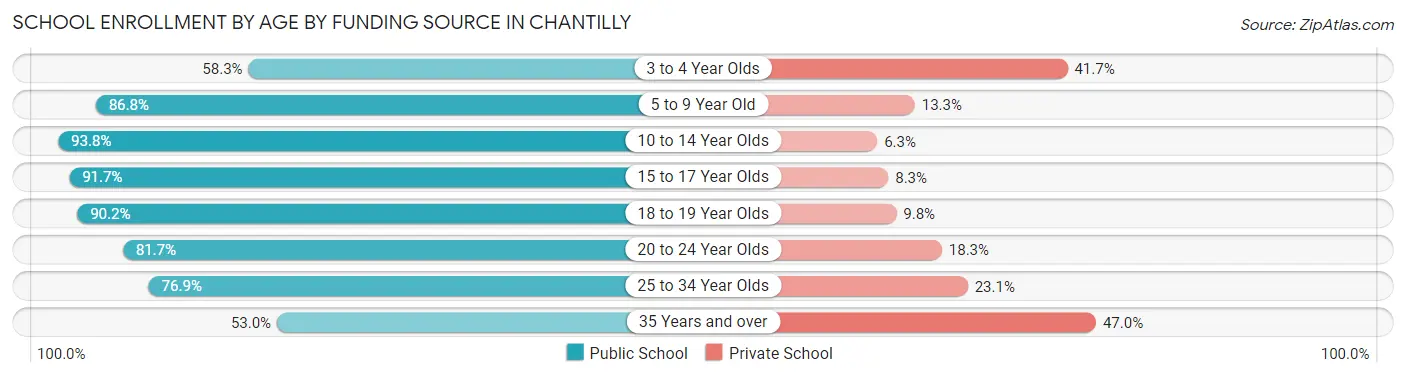
| Age Bracket | Public School | Private School |
| 3 to 4 Year Olds | 179 (58.3%) | 128 (41.7%) |
| 5 to 9 Year Old | 1,080 (86.8%) | 165 (13.3%) |
| 10 to 14 Year Olds | 1,740 (93.8%) | 116 (6.2%) |
| 15 to 17 Year Olds | 1,114 (91.7%) | 101 (8.3%) |
| 18 to 19 Year Olds | 524 (90.2%) | 57 (9.8%) |
| 20 to 24 Year Olds | 630 (81.7%) | 141 (18.3%) |
| 25 to 34 Year Olds | 316 (76.9%) | 95 (23.1%) |
| 35 Years and over | 150 (53.0%) | 133 (47.0%) |
| Total | 5,735 (86.0%) | 934 (14.0%) |
Educational Attainment by Field of Study in Chantilly
Business (1,820 | 19.3%), engineering (1,314 | 13.9%), social sciences (960 | 10.2%), computers & mathematics (937 | 9.9%), and education (671 | 7.1%) are the most common fields of study among 9,457 individuals in Chantilly who have obtained a bachelor's degree or higher.
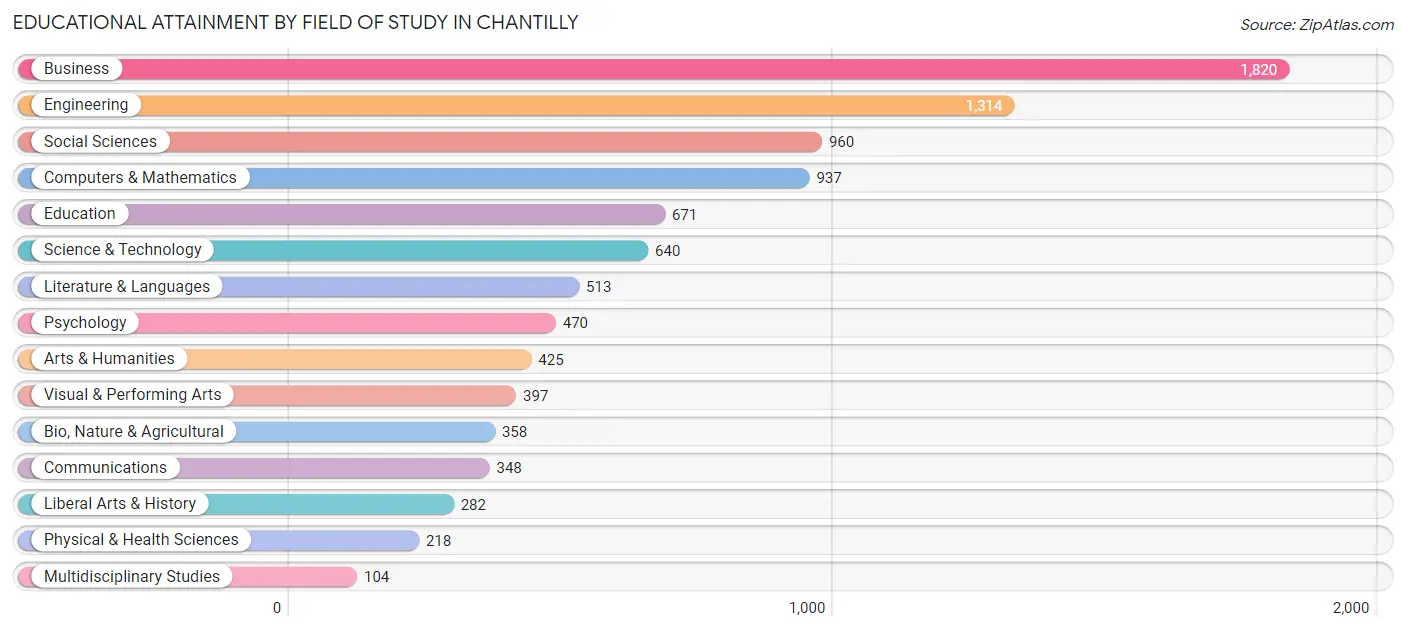
| Field of Study | # Graduates | % Graduates |
| Computers & Mathematics | 937 | 9.9% |
| Bio, Nature & Agricultural | 358 | 3.8% |
| Physical & Health Sciences | 218 | 2.3% |
| Psychology | 470 | 5.0% |
| Social Sciences | 960 | 10.2% |
| Engineering | 1,314 | 13.9% |
| Multidisciplinary Studies | 104 | 1.1% |
| Science & Technology | 640 | 6.8% |
| Business | 1,820 | 19.3% |
| Education | 671 | 7.1% |
| Literature & Languages | 513 | 5.4% |
| Liberal Arts & History | 282 | 3.0% |
| Visual & Performing Arts | 397 | 4.2% |
| Communications | 348 | 3.7% |
| Arts & Humanities | 425 | 4.5% |
| Total | 9,457 | 100.0% |
Transportation & Commute in Chantilly
Vehicle Availability by Sex in Chantilly
The most prevalent vehicle ownership categories in Chantilly are males with 2 vehicles (2,865, accounting for 41.4%) and females with 2 vehicles (2,504, making up 51.0%).
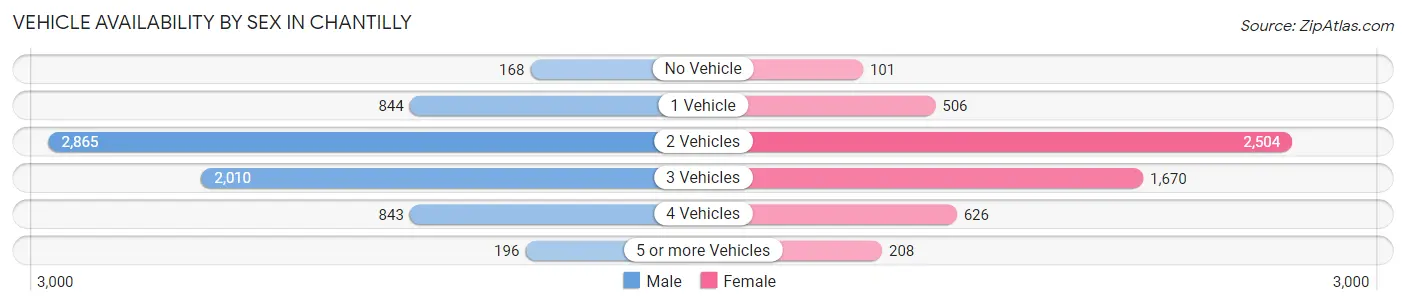
| Vehicles Available | Male | Female |
| No Vehicle | 168 (2.4%) | 101 (1.8%) |
| 1 Vehicle | 844 (12.2%) | 506 (9.0%) |
| 2 Vehicles | 2,865 (41.4%) | 2,504 (44.6%) |
| 3 Vehicles | 2,010 (29.0%) | 1,670 (29.7%) |
| 4 Vehicles | 843 (12.2%) | 626 (11.2%) |
| 5 or more Vehicles | 196 (2.8%) | 208 (3.7%) |
| Total | 6,926 (100.0%) | 5,615 (100.0%) |
Commute Time in Chantilly
The most frequently occuring commute durations in Chantilly are 20 to 24 minutes (1,463 commuters, 13.9%), 10 to 14 minutes (1,444 commuters, 13.7%), and 15 to 19 minutes (1,392 commuters, 13.2%).
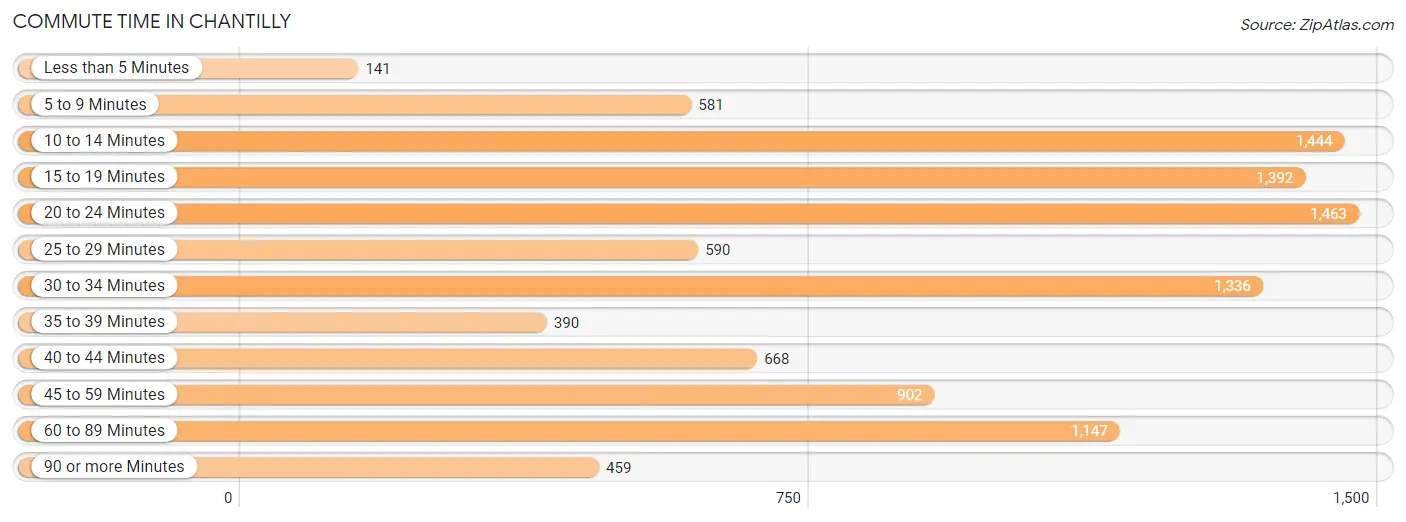
| Commute Time | # Commuters | % Commuters |
| Less than 5 Minutes | 141 | 1.3% |
| 5 to 9 Minutes | 581 | 5.5% |
| 10 to 14 Minutes | 1,444 | 13.7% |
| 15 to 19 Minutes | 1,392 | 13.2% |
| 20 to 24 Minutes | 1,463 | 13.9% |
| 25 to 29 Minutes | 590 | 5.6% |
| 30 to 34 Minutes | 1,336 | 12.7% |
| 35 to 39 Minutes | 390 | 3.7% |
| 40 to 44 Minutes | 668 | 6.4% |
| 45 to 59 Minutes | 902 | 8.6% |
| 60 to 89 Minutes | 1,147 | 10.9% |
| 90 or more Minutes | 459 | 4.4% |
Commute Time by Sex in Chantilly
The most common commute times in Chantilly are 20 to 24 minutes (779 commuters, 13.3%) for males and 10 to 14 minutes (697 commuters, 14.9%) for females.
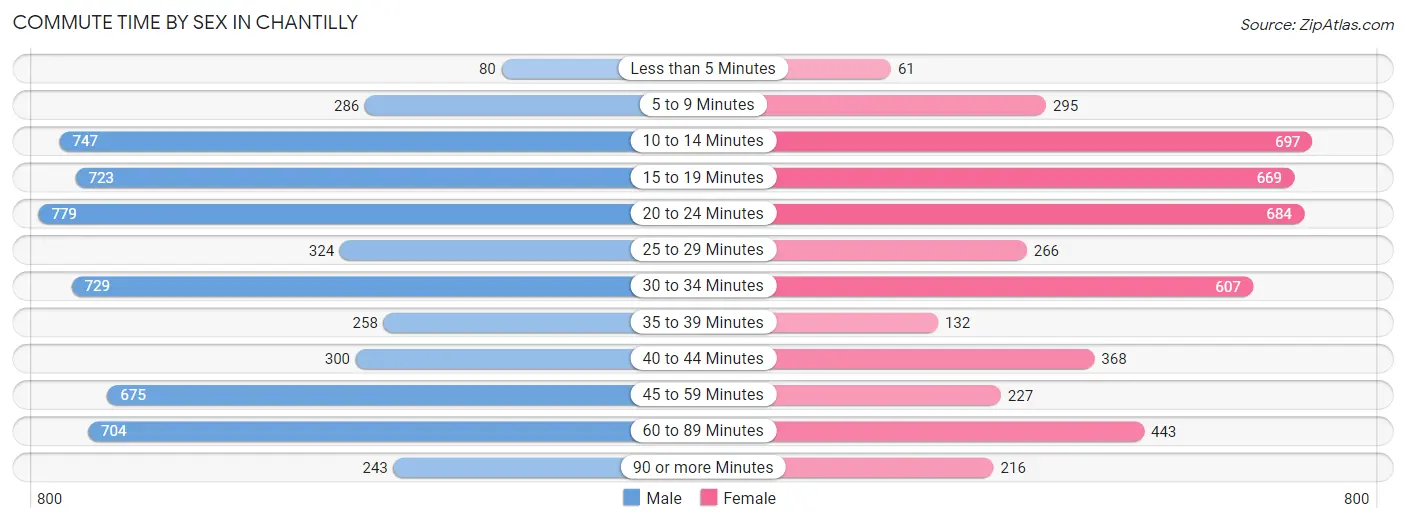
| Commute Time | Male | Female |
| Less than 5 Minutes | 80 (1.4%) | 61 (1.3%) |
| 5 to 9 Minutes | 286 (4.9%) | 295 (6.3%) |
| 10 to 14 Minutes | 747 (12.8%) | 697 (14.9%) |
| 15 to 19 Minutes | 723 (12.4%) | 669 (14.3%) |
| 20 to 24 Minutes | 779 (13.3%) | 684 (14.7%) |
| 25 to 29 Minutes | 324 (5.5%) | 266 (5.7%) |
| 30 to 34 Minutes | 729 (12.5%) | 607 (13.0%) |
| 35 to 39 Minutes | 258 (4.4%) | 132 (2.8%) |
| 40 to 44 Minutes | 300 (5.1%) | 368 (7.9%) |
| 45 to 59 Minutes | 675 (11.5%) | 227 (4.9%) |
| 60 to 89 Minutes | 704 (12.0%) | 443 (9.5%) |
| 90 or more Minutes | 243 (4.2%) | 216 (4.6%) |
Time of Departure to Work by Sex in Chantilly
The most frequent times of departure to work in Chantilly are 8:00 AM to 8:29 AM (877, 15.0%) for males and 7:30 AM to 7:59 AM (675, 14.5%) for females.
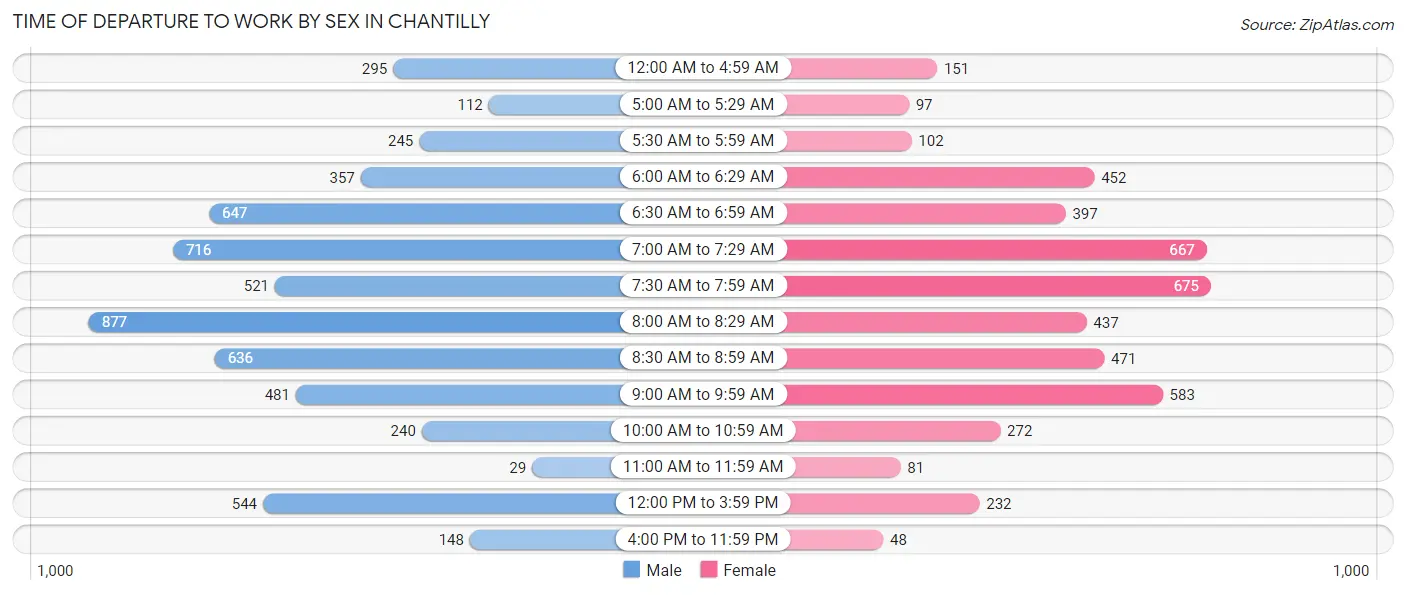
| Time of Departure | Male | Female |
| 12:00 AM to 4:59 AM | 295 (5.0%) | 151 (3.2%) |
| 5:00 AM to 5:29 AM | 112 (1.9%) | 97 (2.1%) |
| 5:30 AM to 5:59 AM | 245 (4.2%) | 102 (2.2%) |
| 6:00 AM to 6:29 AM | 357 (6.1%) | 452 (9.7%) |
| 6:30 AM to 6:59 AM | 647 (11.1%) | 397 (8.5%) |
| 7:00 AM to 7:29 AM | 716 (12.2%) | 667 (14.3%) |
| 7:30 AM to 7:59 AM | 521 (8.9%) | 675 (14.5%) |
| 8:00 AM to 8:29 AM | 877 (15.0%) | 437 (9.4%) |
| 8:30 AM to 8:59 AM | 636 (10.9%) | 471 (10.1%) |
| 9:00 AM to 9:59 AM | 481 (8.2%) | 583 (12.5%) |
| 10:00 AM to 10:59 AM | 240 (4.1%) | 272 (5.8%) |
| 11:00 AM to 11:59 AM | 29 (0.5%) | 81 (1.7%) |
| 12:00 PM to 3:59 PM | 544 (9.3%) | 232 (5.0%) |
| 4:00 PM to 11:59 PM | 148 (2.5%) | 48 (1.0%) |
| Total | 5,848 (100.0%) | 4,665 (100.0%) |
Housing Occupancy in Chantilly
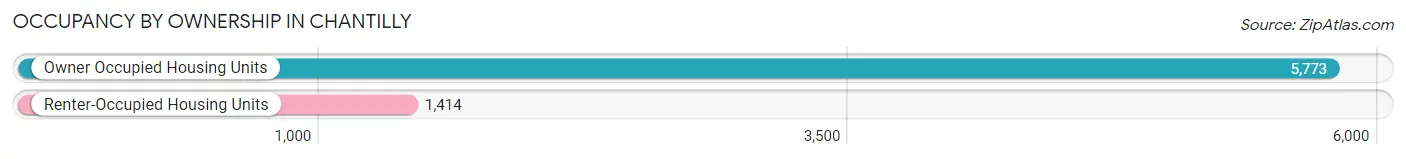
Occupancy by Ownership in Chantilly
Of the total 7,187 dwellings in Chantilly, owner-occupied units account for 5,773 (80.3%), while renter-occupied units make up 1,414 (19.7%).
| Occupancy | # Housing Units | % Housing Units |
| Owner Occupied Housing Units | 5,773 | 80.3% |
| Renter-Occupied Housing Units | 1,414 | 19.7% |
| Total Occupied Housing Units | 7,187 | 100.0% |
Occupancy by Household Size in Chantilly
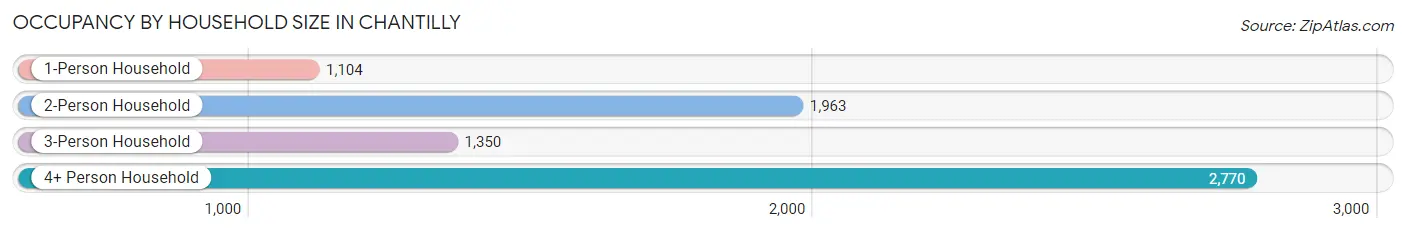
| Household Size | # Housing Units | % Housing Units |
| 1-Person Household | 1,104 | 15.4% |
| 2-Person Household | 1,963 | 27.3% |
| 3-Person Household | 1,350 | 18.8% |
| 4+ Person Household | 2,770 | 38.5% |
| Total Housing Units | 7,187 | 100.0% |
Occupancy by Ownership by Household Size in Chantilly
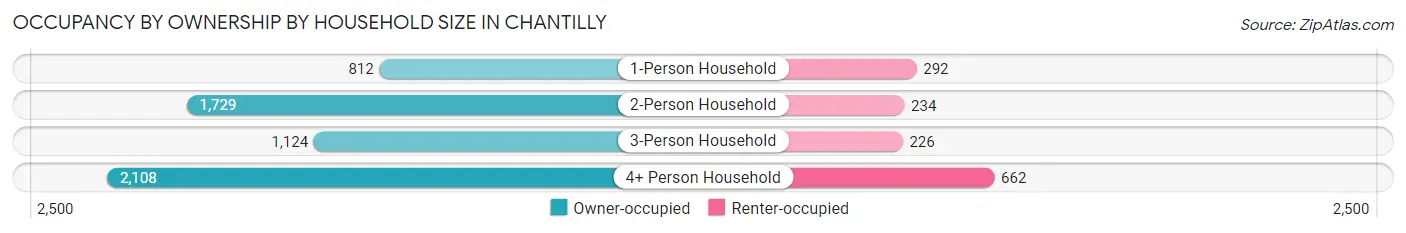
| Household Size | Owner-occupied | Renter-occupied |
| 1-Person Household | 812 (73.6%) | 292 (26.5%) |
| 2-Person Household | 1,729 (88.1%) | 234 (11.9%) |
| 3-Person Household | 1,124 (83.3%) | 226 (16.7%) |
| 4+ Person Household | 2,108 (76.1%) | 662 (23.9%) |
| Total Housing Units | 5,773 (80.3%) | 1,414 (19.7%) |
Occupancy by Educational Attainment in Chantilly
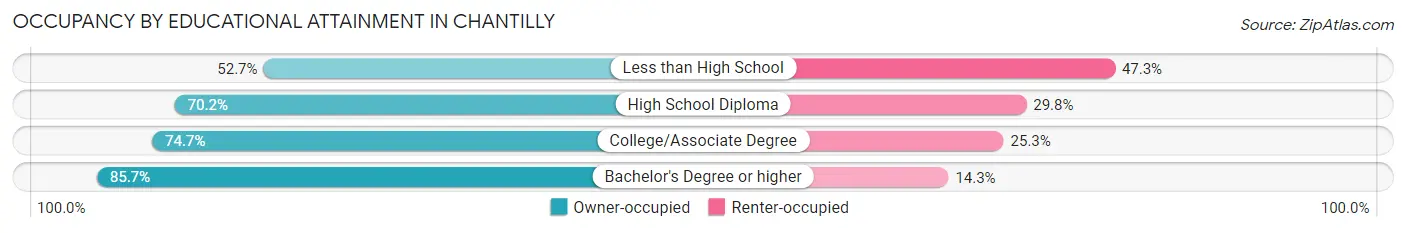
| Household Size | Owner-occupied | Renter-occupied |
| Less than High School | 218 (52.7%) | 196 (47.3%) |
| High School Diploma | 583 (70.2%) | 247 (29.8%) |
| College/Associate Degree | 816 (74.7%) | 276 (25.3%) |
| Bachelor's Degree or higher | 4,156 (85.7%) | 695 (14.3%) |
Occupancy by Age of Householder in Chantilly
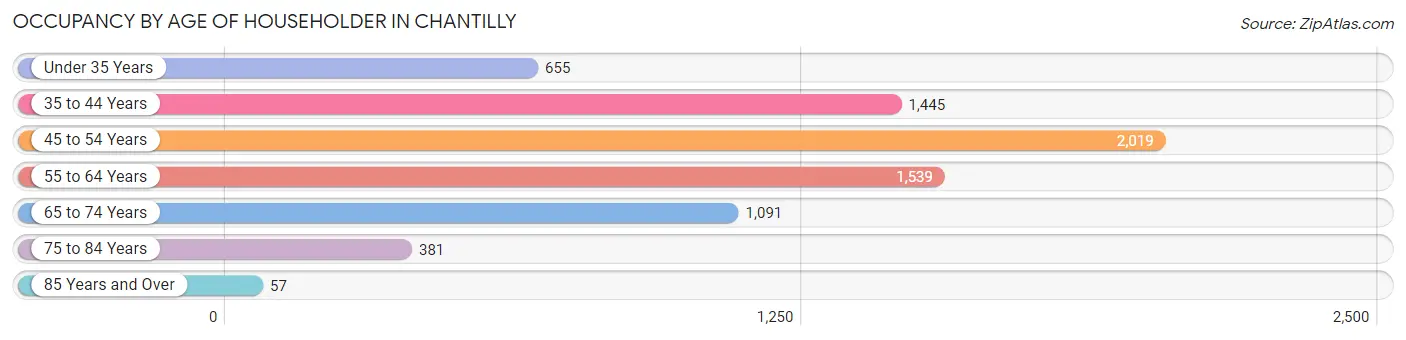
| Age Bracket | # Households | % Households |
| Under 35 Years | 655 | 9.1% |
| 35 to 44 Years | 1,445 | 20.1% |
| 45 to 54 Years | 2,019 | 28.1% |
| 55 to 64 Years | 1,539 | 21.4% |
| 65 to 74 Years | 1,091 | 15.2% |
| 75 to 84 Years | 381 | 5.3% |
| 85 Years and Over | 57 | 0.8% |
| Total | 7,187 | 100.0% |
Housing Finances in Chantilly
Median Income by Occupancy in Chantilly
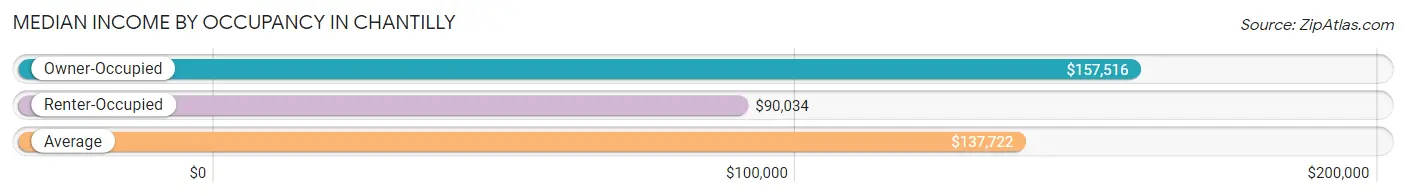
| Occupancy Type | # Households | Median Income |
| Owner-Occupied | 5,773 (80.3%) | $157,516 |
| Renter-Occupied | 1,414 (19.7%) | $90,034 |
| Average | 7,187 (100.0%) | $137,722 |
Occupancy by Householder Income Bracket in Chantilly
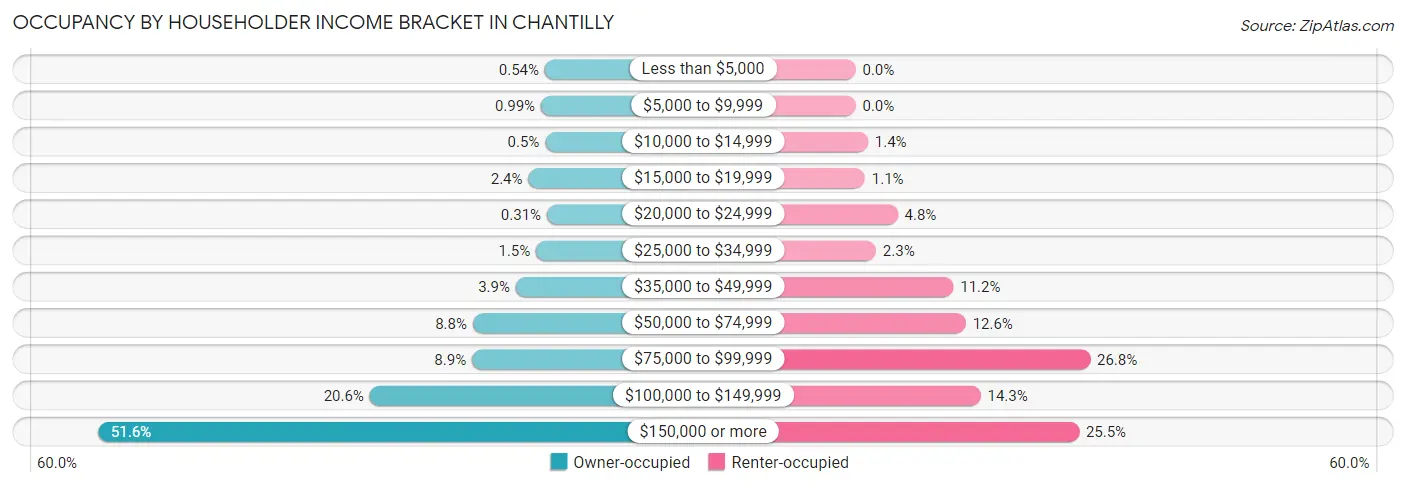
| Income Bracket | Owner-occupied | Renter-occupied |
| Less than $5,000 | 31 (0.5%) | 0 (0.0%) |
| $5,000 to $9,999 | 57 (1.0%) | 0 (0.0%) |
| $10,000 to $14,999 | 29 (0.5%) | 20 (1.4%) |
| $15,000 to $19,999 | 140 (2.4%) | 15 (1.1%) |
| $20,000 to $24,999 | 18 (0.3%) | 68 (4.8%) |
| $25,000 to $34,999 | 89 (1.5%) | 33 (2.3%) |
| $35,000 to $49,999 | 223 (3.9%) | 158 (11.2%) |
| $50,000 to $74,999 | 507 (8.8%) | 178 (12.6%) |
| $75,000 to $99,999 | 512 (8.9%) | 379 (26.8%) |
| $100,000 to $149,999 | 1,187 (20.6%) | 202 (14.3%) |
| $150,000 or more | 2,980 (51.6%) | 361 (25.5%) |
| Total | 5,773 (100.0%) | 1,414 (100.0%) |
Monthly Housing Cost Tiers in Chantilly
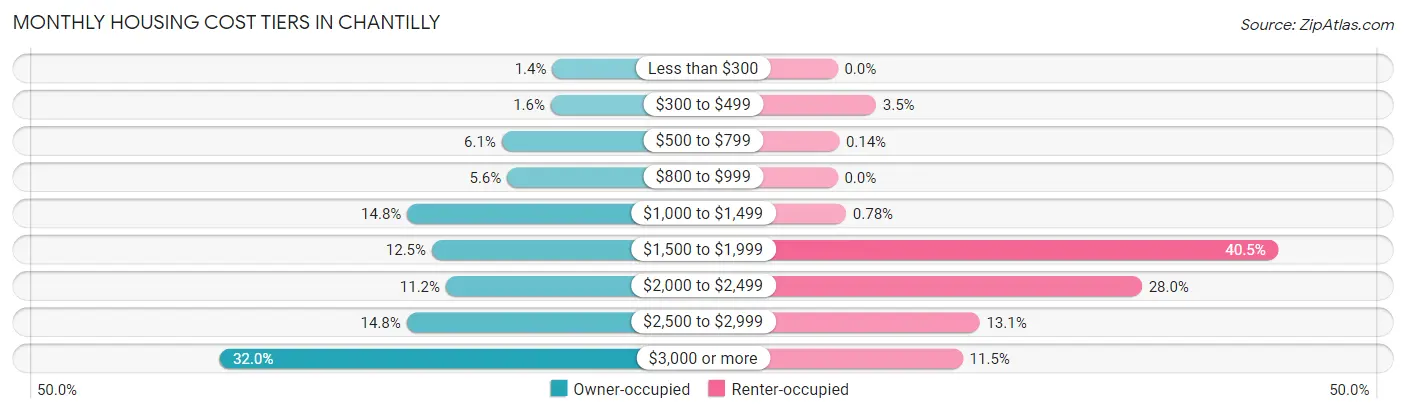
| Monthly Cost | Owner-occupied | Renter-occupied |
| Less than $300 | 82 (1.4%) | 0 (0.0%) |
| $300 to $499 | 90 (1.6%) | 50 (3.5%) |
| $500 to $799 | 351 (6.1%) | 2 (0.1%) |
| $800 to $999 | 322 (5.6%) | 0 (0.0%) |
| $1,000 to $1,499 | 853 (14.8%) | 11 (0.8%) |
| $1,500 to $1,999 | 722 (12.5%) | 573 (40.5%) |
| $2,000 to $2,499 | 648 (11.2%) | 396 (28.0%) |
| $2,500 to $2,999 | 857 (14.8%) | 185 (13.1%) |
| $3,000 or more | 1,848 (32.0%) | 163 (11.5%) |
| Total | 5,773 (100.0%) | 1,414 (100.0%) |
Physical Housing Characteristics in Chantilly
Housing Structures in Chantilly
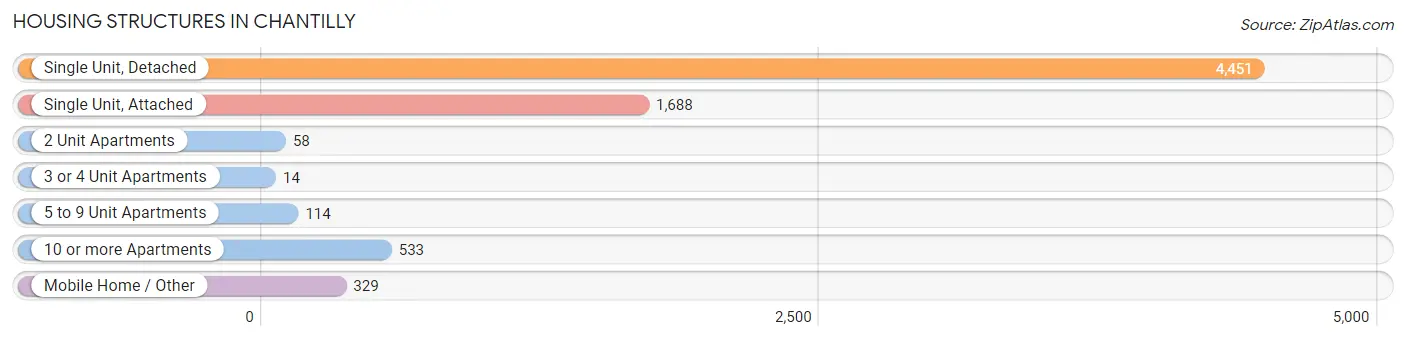
| Structure Type | # Housing Units | % Housing Units |
| Single Unit, Detached | 4,451 | 61.9% |
| Single Unit, Attached | 1,688 | 23.5% |
| 2 Unit Apartments | 58 | 0.8% |
| 3 or 4 Unit Apartments | 14 | 0.2% |
| 5 to 9 Unit Apartments | 114 | 1.6% |
| 10 or more Apartments | 533 | 7.4% |
| Mobile Home / Other | 329 | 4.6% |
| Total | 7,187 | 100.0% |
Housing Structures by Occupancy in Chantilly
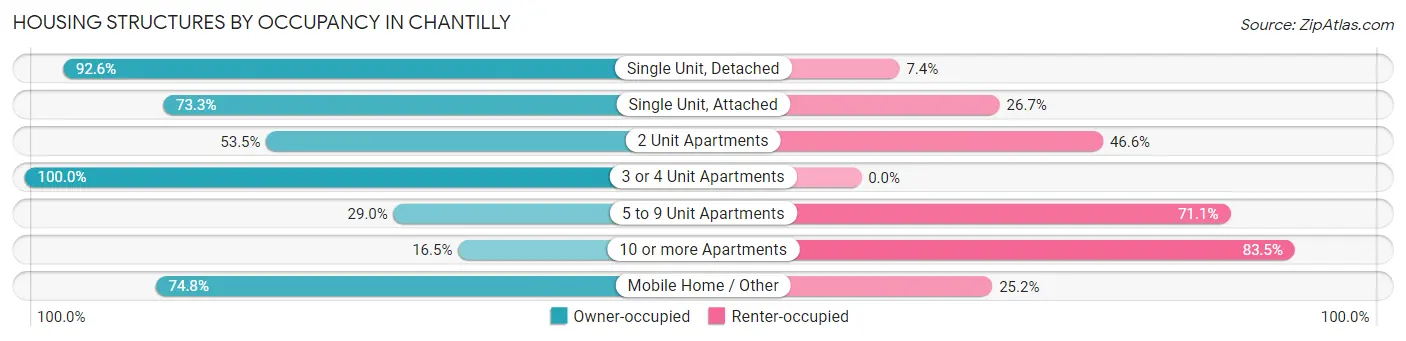
| Structure Type | Owner-occupied | Renter-occupied |
| Single Unit, Detached | 4,123 (92.6%) | 328 (7.4%) |
| Single Unit, Attached | 1,238 (73.3%) | 450 (26.7%) |
| 2 Unit Apartments | 31 (53.4%) | 27 (46.6%) |
| 3 or 4 Unit Apartments | 14 (100.0%) | 0 (0.0%) |
| 5 to 9 Unit Apartments | 33 (28.9%) | 81 (71.1%) |
| 10 or more Apartments | 88 (16.5%) | 445 (83.5%) |
| Mobile Home / Other | 246 (74.8%) | 83 (25.2%) |
| Total | 5,773 (80.3%) | 1,414 (19.7%) |
Housing Structures by Number of Rooms in Chantilly
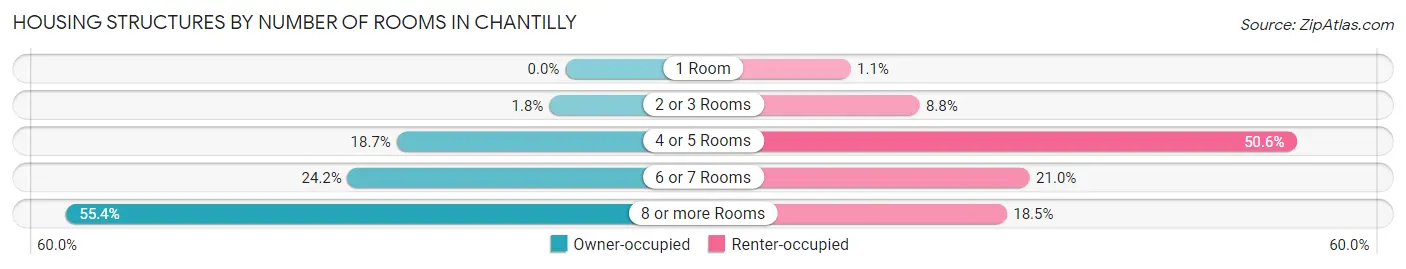
| Number of Rooms | Owner-occupied | Renter-occupied |
| 1 Room | 0 (0.0%) | 16 (1.1%) |
| 2 or 3 Rooms | 103 (1.8%) | 124 (8.8%) |
| 4 or 5 Rooms | 1,080 (18.7%) | 716 (50.6%) |
| 6 or 7 Rooms | 1,394 (24.1%) | 297 (21.0%) |
| 8 or more Rooms | 3,196 (55.4%) | 261 (18.5%) |
| Total | 5,773 (100.0%) | 1,414 (100.0%) |
Housing Structure by Heating Type in Chantilly
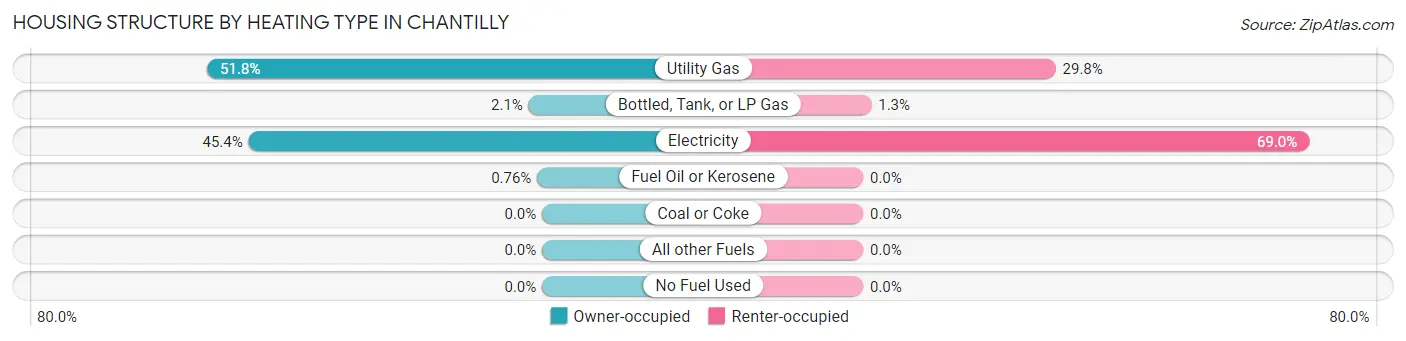
| Heating Type | Owner-occupied | Renter-occupied |
| Utility Gas | 2,989 (51.8%) | 421 (29.8%) |
| Bottled, Tank, or LP Gas | 120 (2.1%) | 18 (1.3%) |
| Electricity | 2,620 (45.4%) | 975 (69.0%) |
| Fuel Oil or Kerosene | 44 (0.8%) | 0 (0.0%) |
| Coal or Coke | 0 (0.0%) | 0 (0.0%) |
| All other Fuels | 0 (0.0%) | 0 (0.0%) |
| No Fuel Used | 0 (0.0%) | 0 (0.0%) |
| Total | 5,773 (100.0%) | 1,414 (100.0%) |
Household Vehicle Usage in Chantilly
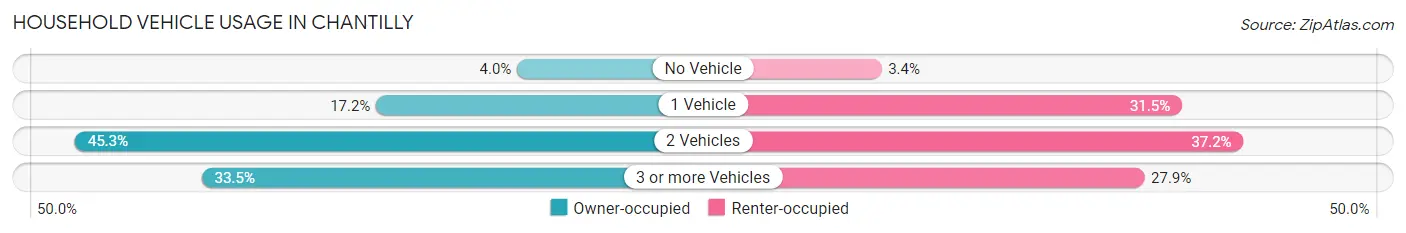
| Vehicles per Household | Owner-occupied | Renter-occupied |
| No Vehicle | 232 (4.0%) | 48 (3.4%) |
| 1 Vehicle | 992 (17.2%) | 445 (31.5%) |
| 2 Vehicles | 2,616 (45.3%) | 526 (37.2%) |
| 3 or more Vehicles | 1,933 (33.5%) | 395 (27.9%) |
| Total | 5,773 (100.0%) | 1,414 (100.0%) |
Real Estate & Mortgages in Chantilly
Real Estate and Mortgage Overview in Chantilly
| Characteristic | Without Mortgage | With Mortgage |
| Housing Units | 1,470 | 4,303 |
| Median Property Value | $603,800 | $616,800 |
| Median Household Income | $114,706 | $2,384 |
| Monthly Housing Costs | $968 | $1,848 |
| Real Estate Taxes | $6,865 | $72 |
Property Value by Mortgage Status in Chantilly
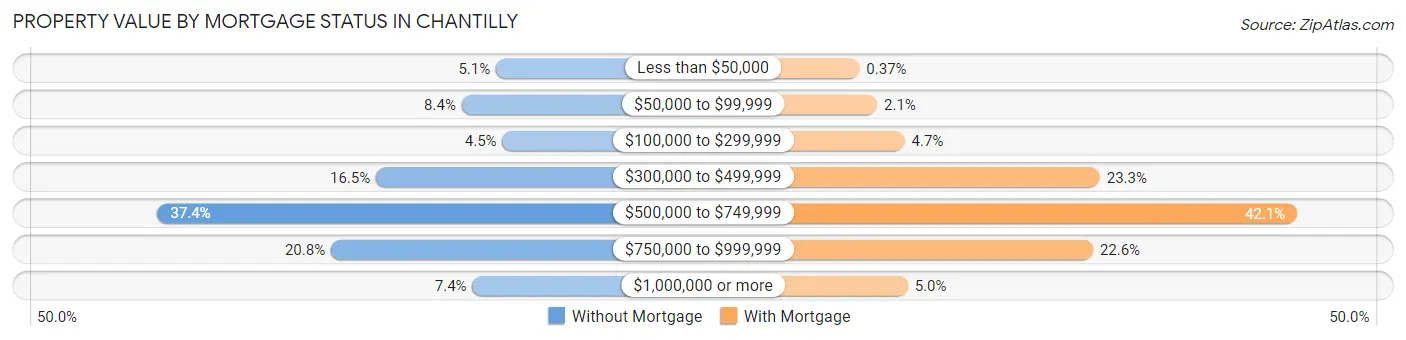
| Property Value | Without Mortgage | With Mortgage |
| Less than $50,000 | 75 (5.1%) | 16 (0.4%) |
| $50,000 to $99,999 | 123 (8.4%) | 88 (2.1%) |
| $100,000 to $299,999 | 66 (4.5%) | 201 (4.7%) |
| $300,000 to $499,999 | 243 (16.5%) | 1,001 (23.3%) |
| $500,000 to $749,999 | 549 (37.3%) | 1,810 (42.1%) |
| $750,000 to $999,999 | 306 (20.8%) | 973 (22.6%) |
| $1,000,000 or more | 108 (7.3%) | 214 (5.0%) |
| Total | 1,470 (100.0%) | 4,303 (100.0%) |
Household Income by Mortgage Status in Chantilly
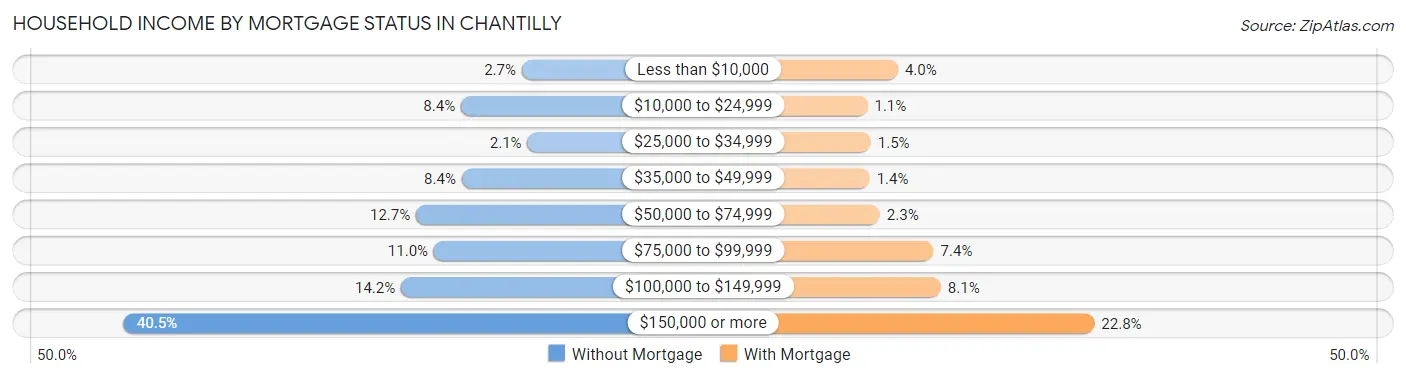
| Household Income | Without Mortgage | With Mortgage |
| Less than $10,000 | 39 (2.6%) | 174 (4.0%) |
| $10,000 to $24,999 | 124 (8.4%) | 49 (1.1%) |
| $25,000 to $34,999 | 31 (2.1%) | 63 (1.5%) |
| $35,000 to $49,999 | 123 (8.4%) | 58 (1.3%) |
| $50,000 to $74,999 | 187 (12.7%) | 100 (2.3%) |
| $75,000 to $99,999 | 162 (11.0%) | 320 (7.4%) |
| $100,000 to $149,999 | 208 (14.1%) | 350 (8.1%) |
| $150,000 or more | 596 (40.5%) | 979 (22.8%) |
| Total | 1,470 (100.0%) | 4,303 (100.0%) |
Property Value to Household Income Ratio in Chantilly
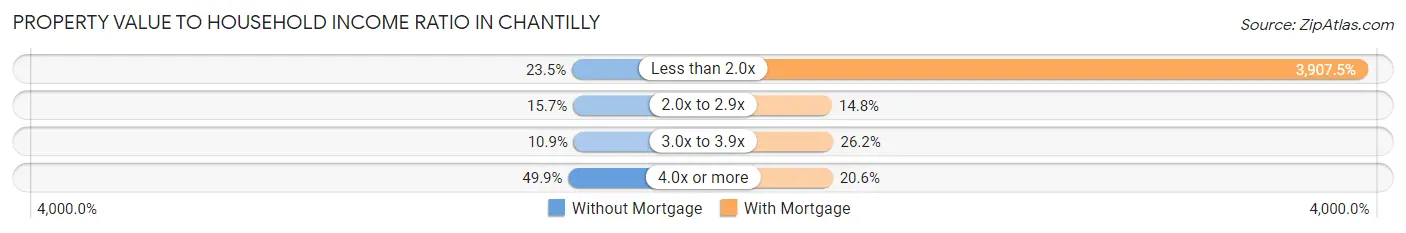
| Value-to-Income Ratio | Without Mortgage | With Mortgage |
| Less than 2.0x | 346 (23.5%) | 168,138 (3,907.5%) |
| 2.0x to 2.9x | 231 (15.7%) | 638 (14.8%) |
| 3.0x to 3.9x | 160 (10.9%) | 1,128 (26.2%) |
| 4.0x or more | 733 (49.9%) | 885 (20.6%) |
| Total | 1,470 (100.0%) | 4,303 (100.0%) |
Real Estate Taxes by Mortgage Status in Chantilly
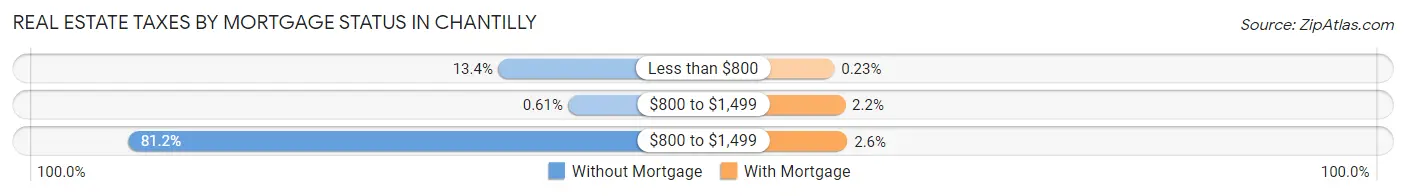
| Property Taxes | Without Mortgage | With Mortgage |
| Less than $800 | 197 (13.4%) | 10 (0.2%) |
| $800 to $1,499 | 9 (0.6%) | 95 (2.2%) |
| $800 to $1,499 | 1,193 (81.2%) | 112 (2.6%) |
| Total | 1,470 (100.0%) | 4,303 (100.0%) |
Health & Disability in Chantilly
Health Insurance Coverage by Age in Chantilly
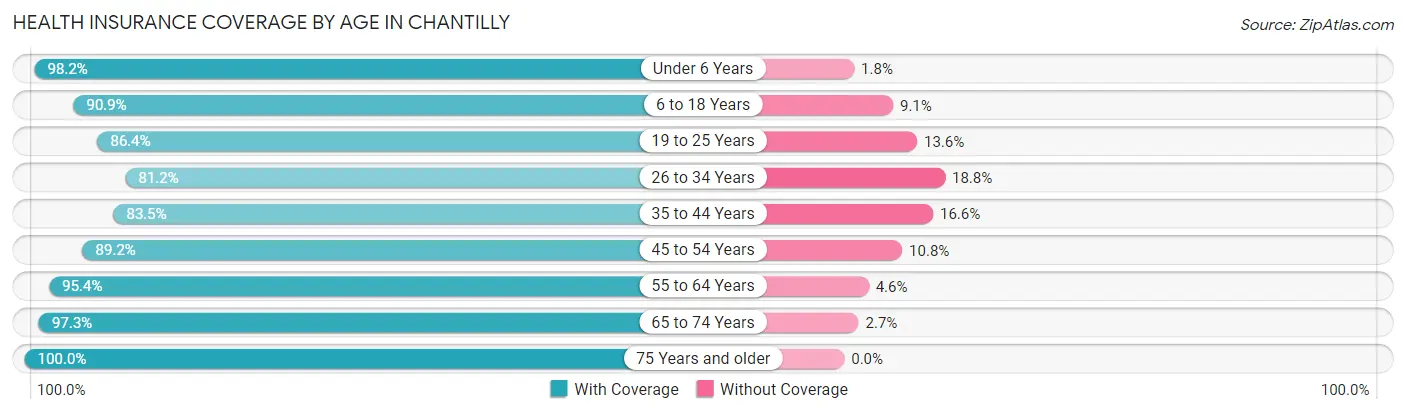
| Age Bracket | With Coverage | Without Coverage |
| Under 6 Years | 1,279 (98.2%) | 24 (1.8%) |
| 6 to 18 Years | 4,250 (90.9%) | 425 (9.1%) |
| 19 to 25 Years | 1,758 (86.4%) | 276 (13.6%) |
| 26 to 34 Years | 1,629 (81.2%) | 377 (18.8%) |
| 35 to 44 Years | 2,749 (83.5%) | 545 (16.6%) |
| 45 to 54 Years | 3,407 (89.2%) | 412 (10.8%) |
| 55 to 64 Years | 2,805 (95.4%) | 134 (4.6%) |
| 65 to 74 Years | 1,970 (97.3%) | 54 (2.7%) |
| 75 Years and older | 922 (100.0%) | 0 (0.0%) |
| Total | 20,769 (90.2%) | 2,247 (9.8%) |
Health Insurance Coverage by Citizenship Status in Chantilly
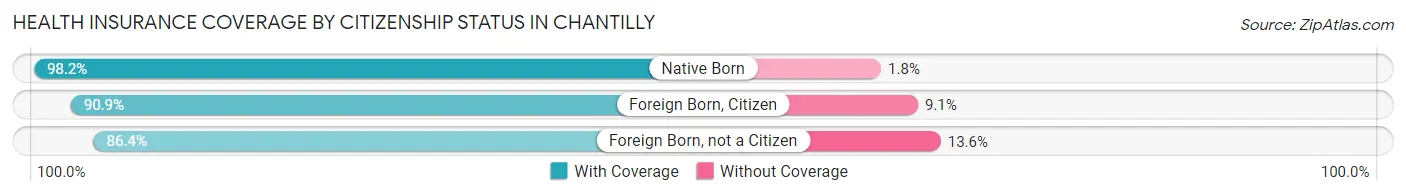
| Citizenship Status | With Coverage | Without Coverage |
| Native Born | 1,279 (98.2%) | 24 (1.8%) |
| Foreign Born, Citizen | 4,250 (90.9%) | 425 (9.1%) |
| Foreign Born, not a Citizen | 1,758 (86.4%) | 276 (13.6%) |
Health Insurance Coverage by Household Income in Chantilly
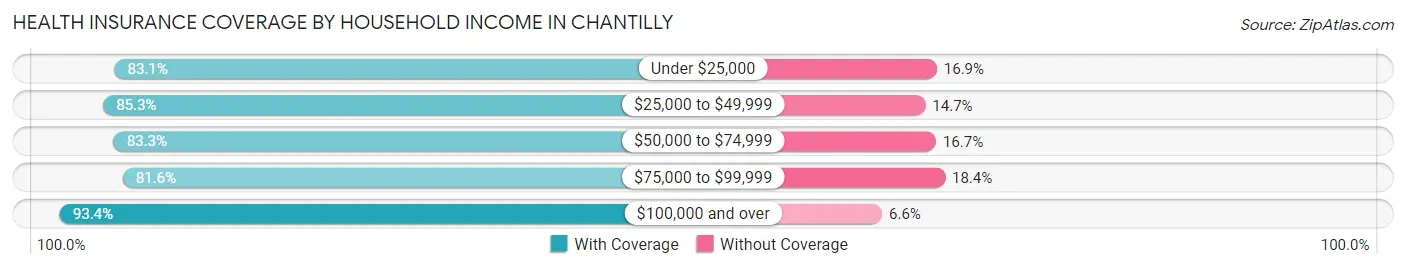
| Household Income | With Coverage | Without Coverage |
| Under $25,000 | 739 (83.1%) | 150 (16.9%) |
| $25,000 to $49,999 | 1,059 (85.3%) | 183 (14.7%) |
| $50,000 to $74,999 | 1,729 (83.3%) | 347 (16.7%) |
| $75,000 to $99,999 | 2,235 (81.6%) | 504 (18.4%) |
| $100,000 and over | 14,997 (93.4%) | 1,062 (6.6%) |
Public vs Private Health Insurance Coverage by Age in Chantilly
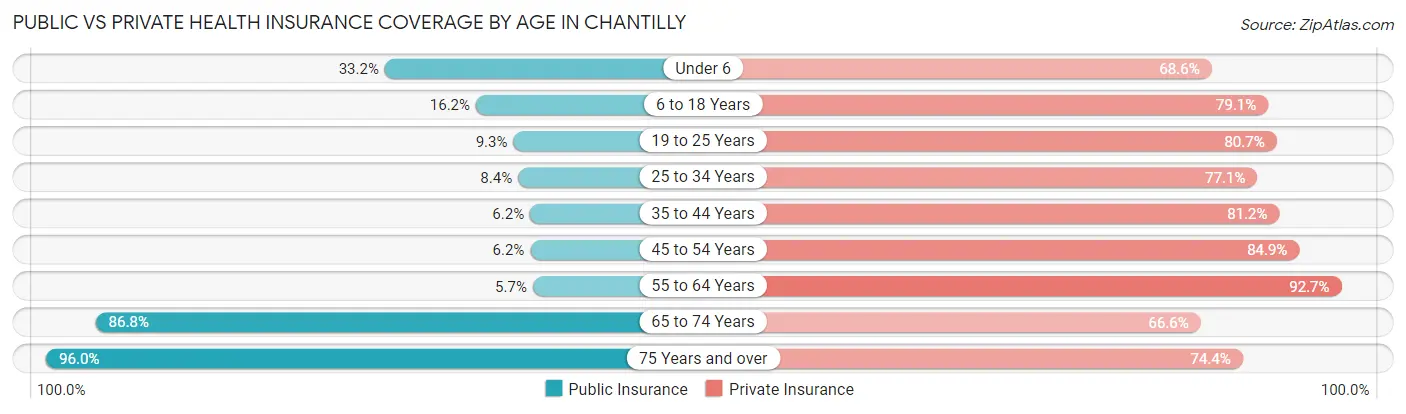
| Age Bracket | Public Insurance | Private Insurance |
| Under 6 | 432 (33.2%) | 894 (68.6%) |
| 6 to 18 Years | 759 (16.2%) | 3,699 (79.1%) |
| 19 to 25 Years | 189 (9.3%) | 1,641 (80.7%) |
| 25 to 34 Years | 169 (8.4%) | 1,547 (77.1%) |
| 35 to 44 Years | 204 (6.2%) | 2,675 (81.2%) |
| 45 to 54 Years | 235 (6.1%) | 3,242 (84.9%) |
| 55 to 64 Years | 167 (5.7%) | 2,725 (92.7%) |
| 65 to 74 Years | 1,757 (86.8%) | 1,348 (66.6%) |
| 75 Years and over | 885 (96.0%) | 686 (74.4%) |
| Total | 4,797 (20.8%) | 18,457 (80.2%) |
Disability Status by Sex by Age in Chantilly
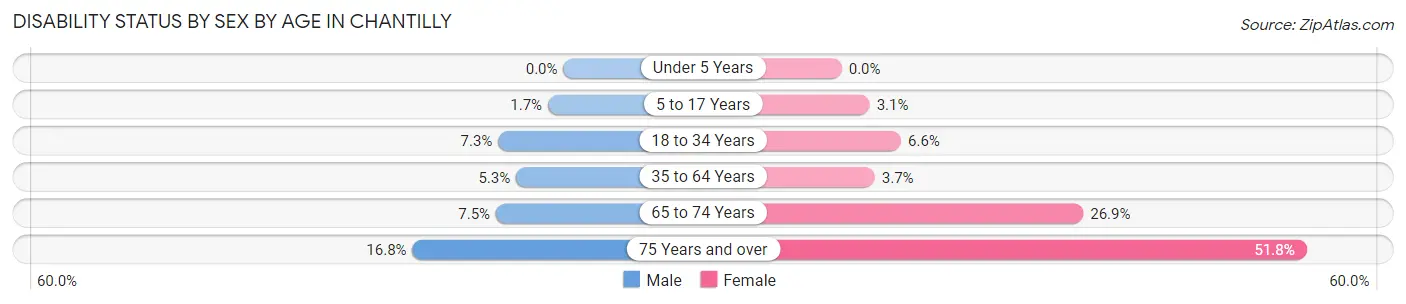
| Age Bracket | Male | Female |
| Under 5 Years | 0 (0.0%) | 0 (0.0%) |
| 5 to 17 Years | 38 (1.7%) | 71 (3.1%) |
| 18 to 34 Years | 170 (7.3%) | 138 (6.6%) |
| 35 to 64 Years | 260 (5.3%) | 188 (3.7%) |
| 65 to 74 Years | 68 (7.5%) | 301 (26.9%) |
| 75 Years and over | 78 (16.8%) | 237 (51.7%) |
Disability Class by Sex by Age in Chantilly
Disability Class: Hearing Difficulty
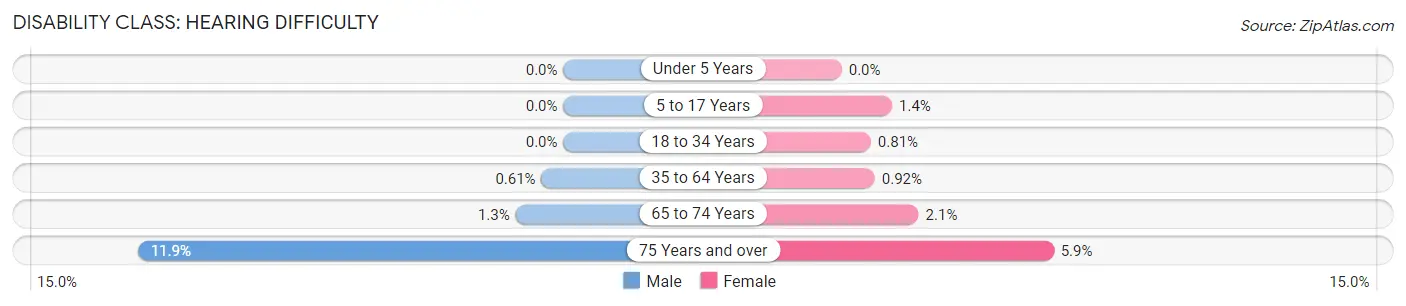
| Age Bracket | Male | Female |
| Under 5 Years | 0 (0.0%) | 0 (0.0%) |
| 5 to 17 Years | 0 (0.0%) | 32 (1.4%) |
| 18 to 34 Years | 0 (0.0%) | 17 (0.8%) |
| 35 to 64 Years | 30 (0.6%) | 47 (0.9%) |
| 65 to 74 Years | 12 (1.3%) | 24 (2.1%) |
| 75 Years and over | 55 (11.8%) | 27 (5.9%) |
Disability Class: Vision Difficulty
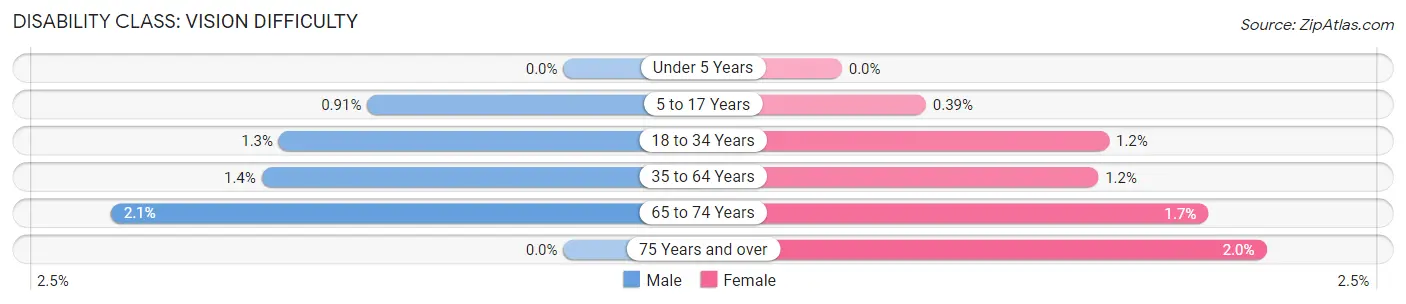
| Age Bracket | Male | Female |
| Under 5 Years | 0 (0.0%) | 0 (0.0%) |
| 5 to 17 Years | 20 (0.9%) | 9 (0.4%) |
| 18 to 34 Years | 31 (1.3%) | 26 (1.2%) |
| 35 to 64 Years | 69 (1.4%) | 61 (1.2%) |
| 65 to 74 Years | 19 (2.1%) | 19 (1.7%) |
| 75 Years and over | 0 (0.0%) | 9 (2.0%) |
Disability Class: Cognitive Difficulty
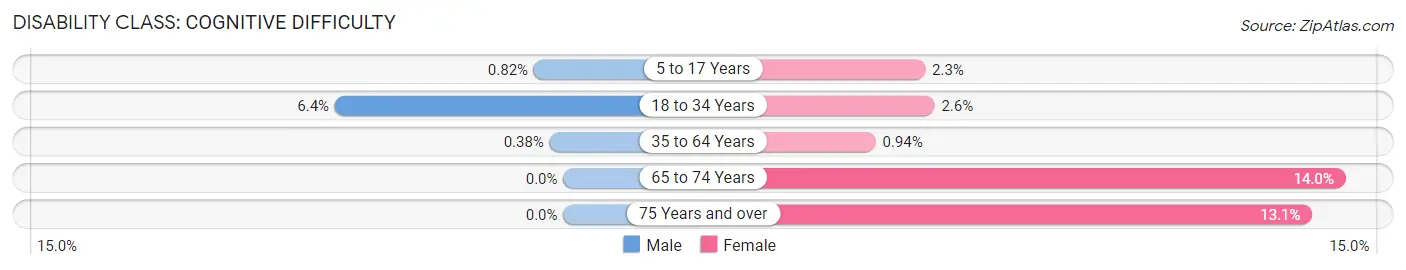
| Age Bracket | Male | Female |
| 5 to 17 Years | 18 (0.8%) | 53 (2.3%) |
| 18 to 34 Years | 149 (6.4%) | 54 (2.6%) |
| 35 to 64 Years | 19 (0.4%) | 48 (0.9%) |
| 65 to 74 Years | 0 (0.0%) | 157 (14.0%) |
| 75 Years and over | 0 (0.0%) | 60 (13.1%) |
Disability Class: Ambulatory Difficulty
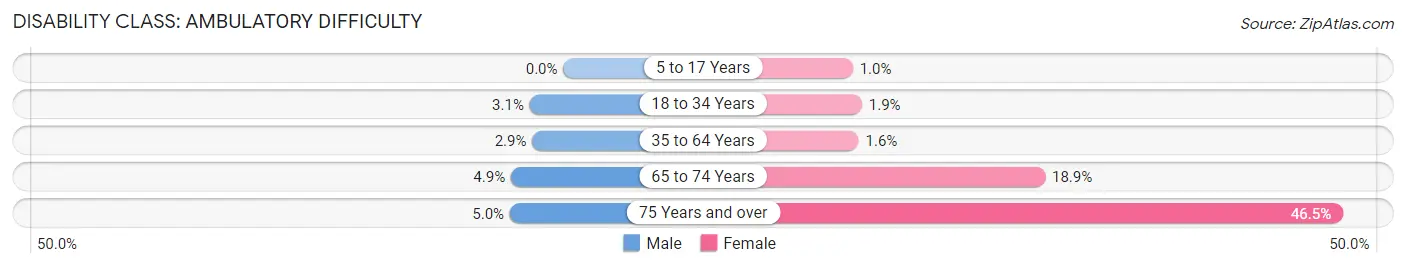
| Age Bracket | Male | Female |
| 5 to 17 Years | 0 (0.0%) | 23 (1.0%) |
| 18 to 34 Years | 73 (3.1%) | 39 (1.9%) |
| 35 to 64 Years | 142 (2.9%) | 80 (1.6%) |
| 65 to 74 Years | 44 (4.9%) | 211 (18.9%) |
| 75 Years and over | 23 (5.0%) | 213 (46.5%) |
Disability Class: Self-Care Difficulty
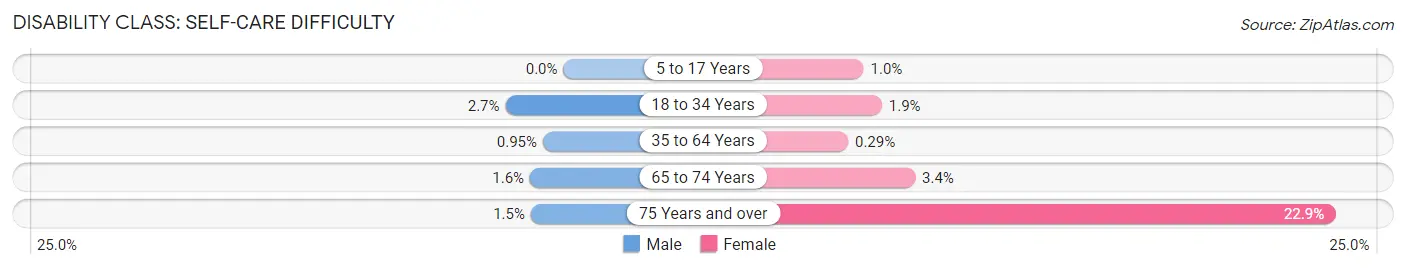
| Age Bracket | Male | Female |
| 5 to 17 Years | 0 (0.0%) | 23 (1.0%) |
| 18 to 34 Years | 63 (2.7%) | 39 (1.9%) |
| 35 to 64 Years | 47 (0.9%) | 15 (0.3%) |
| 65 to 74 Years | 14 (1.5%) | 38 (3.4%) |
| 75 Years and over | 7 (1.5%) | 105 (22.9%) |
Technology Access in Chantilly
Computing Device Access in Chantilly
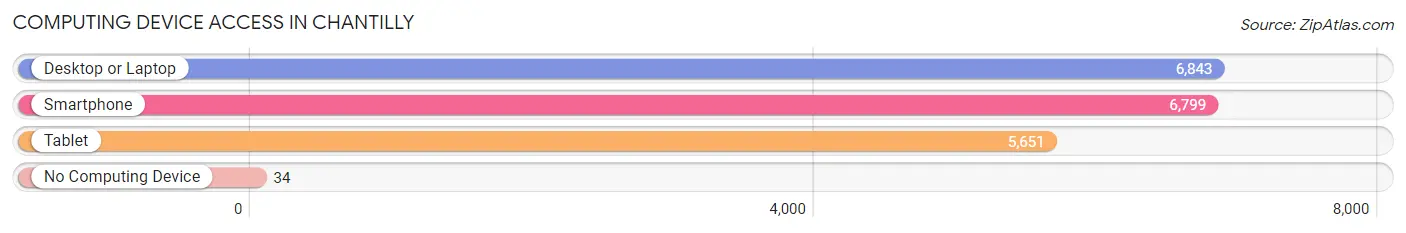
| Device Type | # Households | % Households |
| Desktop or Laptop | 6,843 | 95.2% |
| Smartphone | 6,799 | 94.6% |
| Tablet | 5,651 | 78.6% |
| No Computing Device | 34 | 0.5% |
| Total | 7,187 | 100.0% |
Internet Access in Chantilly
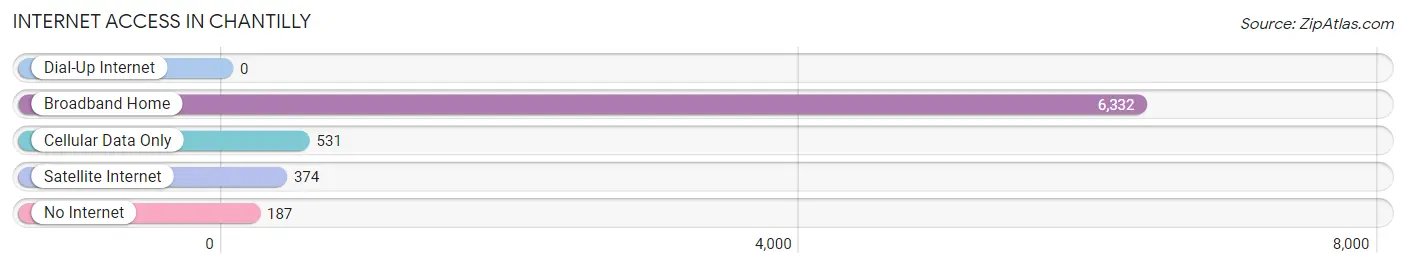
| Internet Type | # Households | % Households |
| Dial-Up Internet | 0 | 0.0% |
| Broadband Home | 6,332 | 88.1% |
| Cellular Data Only | 531 | 7.4% |
| Satellite Internet | 374 | 5.2% |
| No Internet | 187 | 2.6% |
| Total | 7,187 | 100.0% |
Chantilly Summary
Chantilly, Virginia is a census-designated place located in Fairfax County, Virginia. It is a suburb of Washington, D.C. and is part of the Washington metropolitan area. The population of Chantilly was 23,039 as of the 2010 census.
History
The area that is now Chantilly was first settled in the early 1700s by French Huguenots. The area was named after an early settler, Richard Chantilly. The area remained largely rural until the 1950s when it began to experience rapid growth due to its proximity to Washington, D.C. and the Dulles International Airport.
Geography
Chantilly is located in northern Fairfax County, Virginia. It is bordered by Centreville to the west, Dulles International Airport to the north, and Fairfax to the south. The city has a total area of 11.2 square miles, all of which is land.
Economy
Chantilly is home to many businesses and corporations, including the headquarters of the National Reconnaissance Office, the National Geospatial-Intelligence Agency, and the National Air and Space Museum. The city is also home to several technology companies, including Northrop Grumman, Lockheed Martin, and Raytheon.
Demographics
As of the 2010 census, the population of Chantilly was 23,039. The racial makeup of the city was 68.2% White, 15.3% Asian, 8.3% African American, and 5.2% Hispanic or Latino. The median household income was $117,811, and the median family income was $133,817.
Chantilly is a diverse and vibrant community. The city is home to a variety of cultures and religions, including Hindu, Muslim, and Christian. The city is also home to a large number of immigrants from India, China, and other countries.
Conclusion
Chantilly, Virginia is a vibrant and diverse community located in Fairfax County, Virginia. It is a suburb of Washington, D.C. and is part of the Washington metropolitan area. The city has a rich history and is home to many businesses and corporations. The population of Chantilly is 23,039 and is composed of a variety of races and cultures. The city is a great place to live and work, and is a great example of the diversity and vibrancy of the Washington metropolitan area.
Common Questions
What is Per Capita Income in Chantilly?
Per Capita income in Chantilly is $56,116.
What is the Median Family Income in Chantilly?
Median Family Income in Chantilly is $155,000.
What is the Median Household income in Chantilly?
Median Household Income in Chantilly is $137,722.
What is Income or Wage Gap in Chantilly?
Income or Wage Gap in Chantilly is 44.2%.
Women in Chantilly earn 55.8 cents for every dollar earned by a man.
What is Family Income Deficit in Chantilly?
Family Income Deficit in Chantilly is $16,302.
Families that are below poverty line in Chantilly earn $16,302 less on average than the poverty threshold level.
What is Inequality or Gini Index in Chantilly?
Inequality or Gini Index in Chantilly is 0.40.
What is the Total Population of Chantilly?
Total Population of Chantilly is 23,107.
What is the Total Male Population of Chantilly?
Total Male Population of Chantilly is 11,539.
What is the Total Female Population of Chantilly?
Total Female Population of Chantilly is 11,568.
What is the Ratio of Males per 100 Females in Chantilly?
There are 99.75 Males per 100 Females in Chantilly.
What is the Ratio of Females per 100 Males in Chantilly?
There are 100.25 Females per 100 Males in Chantilly.
What is the Median Population Age in Chantilly?
Median Population Age in Chantilly is 40.4 Years.
What is the Average Family Size in Chantilly
Average Family Size in Chantilly is 3.6 People.
What is the Average Household Size in Chantilly
Average Household Size in Chantilly is 3.2 People.
How Large is the Labor Force in Chantilly?
There are 13,171 People in the Labor Forcein in Chantilly.
What is the Percentage of People in the Labor Force in Chantilly?
71.6% of People are in the Labor Force in Chantilly.
What is the Unemployment Rate in Chantilly?
Unemployment Rate in Chantilly is 2.9%.