Bull Run, VA Map & Demographics
Bull Run Map
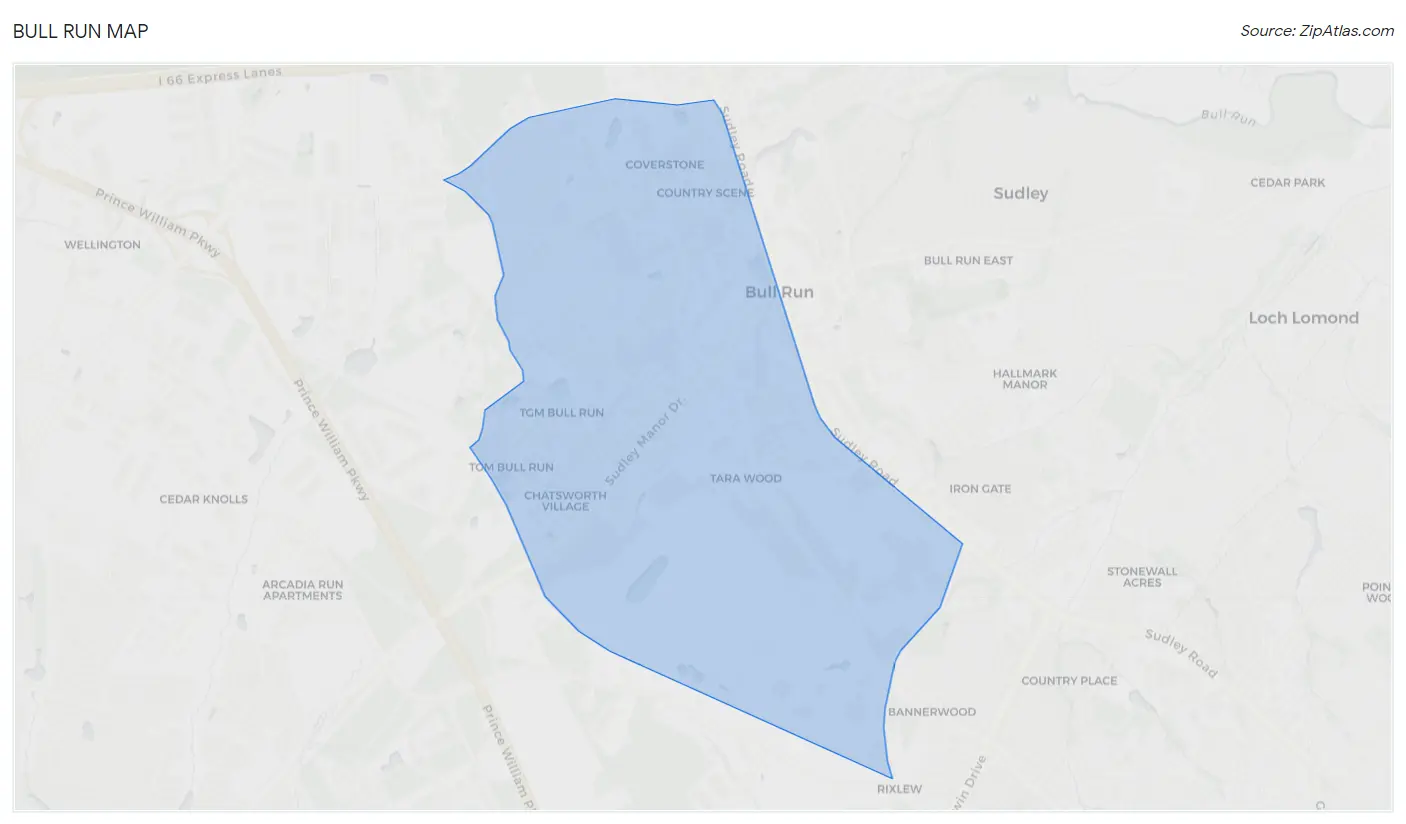
Bull Run Overview
$38,746
PER CAPITA INCOME
$85,232
AVG FAMILY INCOME
$82,401
AVG HOUSEHOLD INCOME
58.1%
WAGE / INCOME GAP [ % ]
41.9¢/ $1
WAGE / INCOME GAP [ $ ]
0.38
INEQUALITY / GINI INDEX
16,620
TOTAL POPULATION
7,910
MALE POPULATION
8,710
FEMALE POPULATION
90.82
MALES / 100 FEMALES
110.11
FEMALES / 100 MALES
32.4
MEDIAN AGE
3.3
AVG FAMILY SIZE
2.6
AVG HOUSEHOLD SIZE
10,247
LABOR FORCE [ PEOPLE ]
80.4%
PERCENT IN LABOR FORCE
2.9%
UNEMPLOYMENT RATE
Income in Bull Run
Income Overview in Bull Run
Per Capita Income in Bull Run is $38,746, while median incomes of families and households are $85,232 and $82,401 respectively.
| Characteristic | Number | Measure |
| Per Capita Income | 16,620 | $38,746 |
| Median Family Income | 3,748 | $85,232 |
| Mean Family Income | 3,748 | $105,292 |
| Median Household Income | 6,295 | $82,401 |
| Mean Household Income | 6,295 | $100,421 |
| Income Deficit | 3,748 | $0 |
| Wage / Income Gap (%) | 16,620 | 58.08% |
| Wage / Income Gap ($) | 16,620 | 41.92¢ per $1 |
| Gini / Inequality Index | 16,620 | 0.38 |
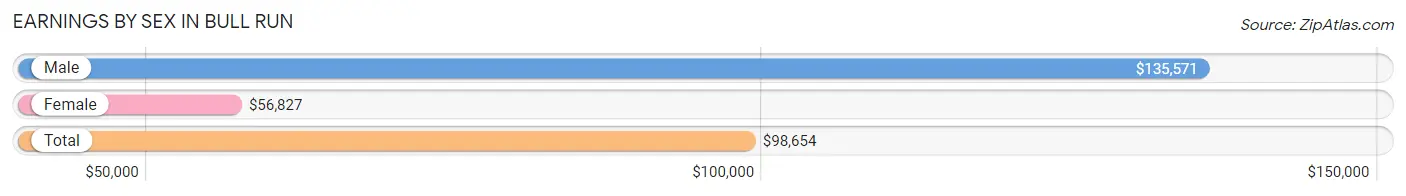
Earnings by Sex in Bull Run
Average Earnings in Bull Run are $98,654, $135,571 for men and $56,827 for women, a difference of 58.1%.
| Sex | Number | Average Earnings |
| Male | 5,442 (52.0%) | $135,571 |
| Female | 5,020 (48.0%) | $56,827 |
| Total | 10,462 (100.0%) | $98,654 |
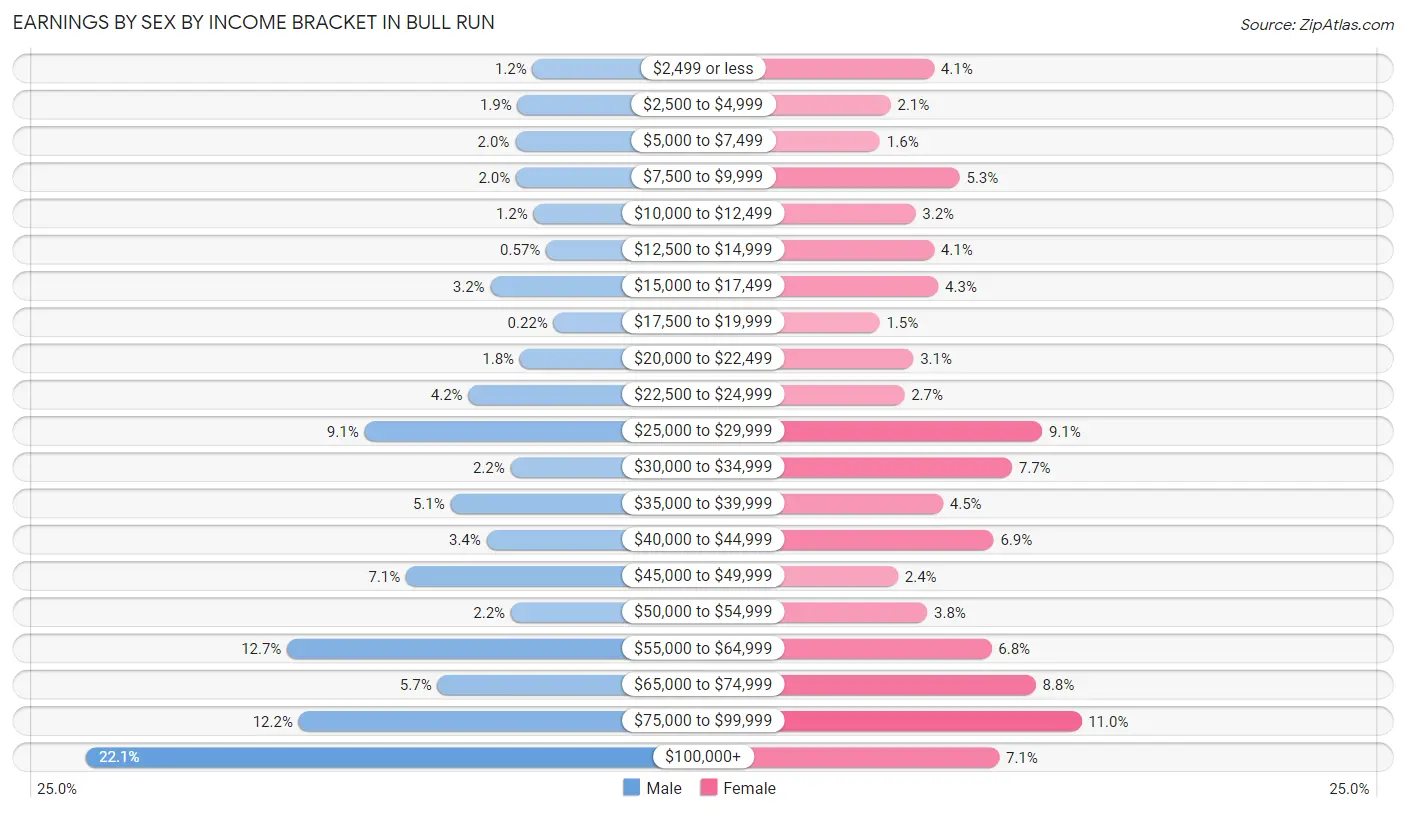
Earnings by Sex by Income Bracket in Bull Run
The most common earnings brackets in Bull Run are $100,000+ for men (1,204 | 22.1%) and $75,000 to $99,999 for women (551 | 11.0%).
| Income | Male | Female |
| $2,499 or less | 66 (1.2%) | 205 (4.1%) |
| $2,500 to $4,999 | 104 (1.9%) | 103 (2.1%) |
| $5,000 to $7,499 | 110 (2.0%) | 78 (1.5%) |
| $7,500 to $9,999 | 108 (2.0%) | 265 (5.3%) |
| $10,000 to $12,499 | 63 (1.2%) | 161 (3.2%) |
| $12,500 to $14,999 | 31 (0.6%) | 205 (4.1%) |
| $15,000 to $17,499 | 173 (3.2%) | 215 (4.3%) |
| $17,500 to $19,999 | 12 (0.2%) | 77 (1.5%) |
| $20,000 to $22,499 | 98 (1.8%) | 156 (3.1%) |
| $22,500 to $24,999 | 229 (4.2%) | 135 (2.7%) |
| $25,000 to $29,999 | 494 (9.1%) | 459 (9.1%) |
| $30,000 to $34,999 | 122 (2.2%) | 388 (7.7%) |
| $35,000 to $39,999 | 275 (5.1%) | 226 (4.5%) |
| $40,000 to $44,999 | 183 (3.4%) | 345 (6.9%) |
| $45,000 to $49,999 | 388 (7.1%) | 120 (2.4%) |
| $50,000 to $54,999 | 121 (2.2%) | 189 (3.8%) |
| $55,000 to $64,999 | 691 (12.7%) | 340 (6.8%) |
| $65,000 to $74,999 | 308 (5.7%) | 444 (8.8%) |
| $75,000 to $99,999 | 662 (12.2%) | 551 (11.0%) |
| $100,000+ | 1,204 (22.1%) | 358 (7.1%) |
| Total | 5,442 (100.0%) | 5,020 (100.0%) |
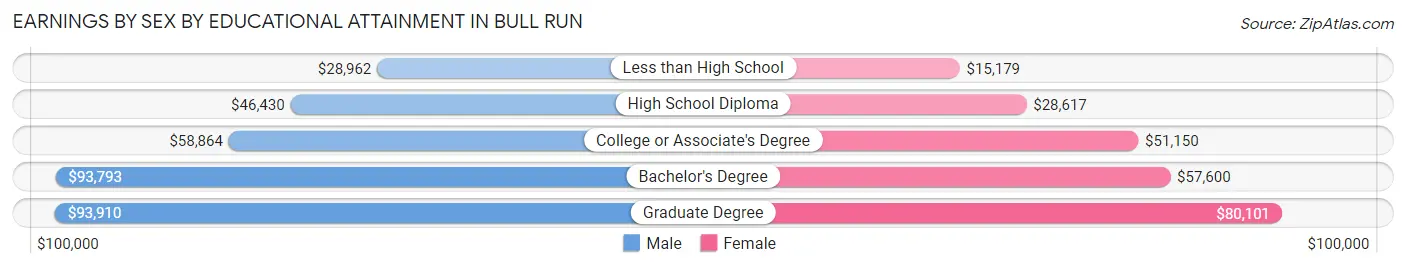
Earnings by Sex by Educational Attainment in Bull Run
Average earnings in Bull Run are $58,849 for men and $39,167 for women, a difference of 33.4%. Men with an educational attainment of graduate degree enjoy the highest average annual earnings of $93,910, while those with less than high school education earn the least with $28,962. Women with an educational attainment of graduate degree earn the most with the average annual earnings of $80,101, while those with less than high school education have the smallest earnings of $15,179.
| Educational Attainment | Male Income | Female Income |
| Less than High School | $28,962 | $15,179 |
| High School Diploma | $46,430 | $28,617 |
| College or Associate's Degree | $58,864 | $51,150 |
| Bachelor's Degree | $93,793 | $57,600 |
| Graduate Degree | $93,910 | $80,101 |
| Total | $58,849 | $39,167 |
Family Income in Bull Run
Family Income Brackets in Bull Run
According to the Bull Run family income data, there are 832 families falling into the $100,000 to $149,999 income range, which is the most common income bracket and makes up 22.2% of all families. Conversely, the $10,000 to $14,999 income bracket is the least frequent group with only 45 families (1.2%) belonging to this category.
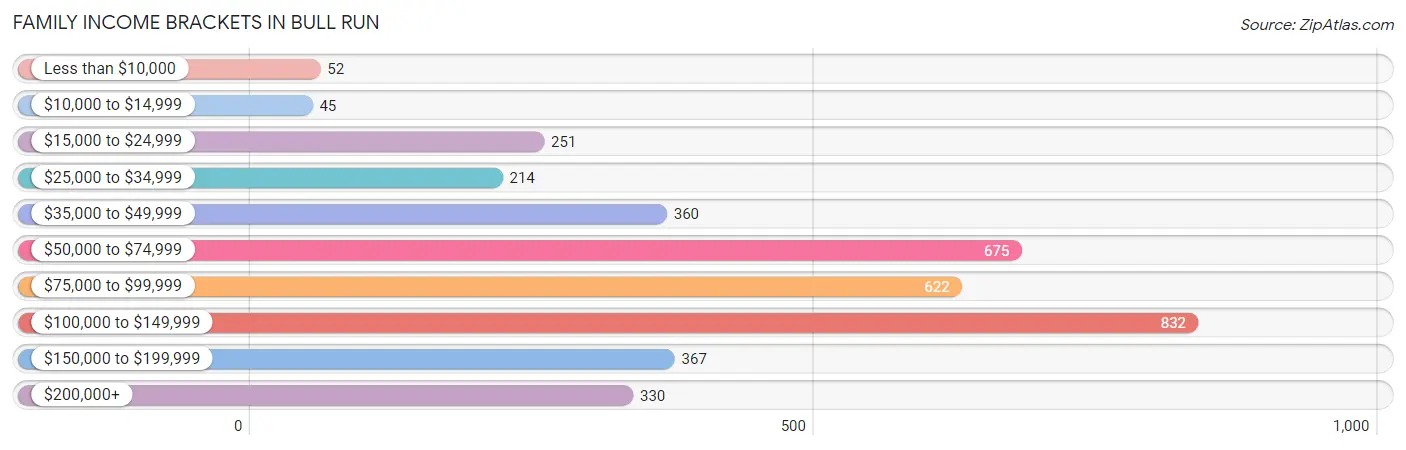
| Income Bracket | # Families | % Families |
| Less than $10,000 | 52 | 1.4% |
| $10,000 to $14,999 | 45 | 1.2% |
| $15,000 to $24,999 | 251 | 6.7% |
| $25,000 to $34,999 | 214 | 5.7% |
| $35,000 to $49,999 | 360 | 9.6% |
| $50,000 to $74,999 | 675 | 18.0% |
| $75,000 to $99,999 | 622 | 16.6% |
| $100,000 to $149,999 | 832 | 22.2% |
| $150,000 to $199,999 | 367 | 9.8% |
| $200,000+ | 330 | 8.8% |
Family Income by Famaliy Size in Bull Run
3-person families (912 | 24.3%) account for the highest median family income in Bull Run with $86,651 per family, while 2-person families (1,245 | 33.2%) have the highest median income of $41,269 per family member.
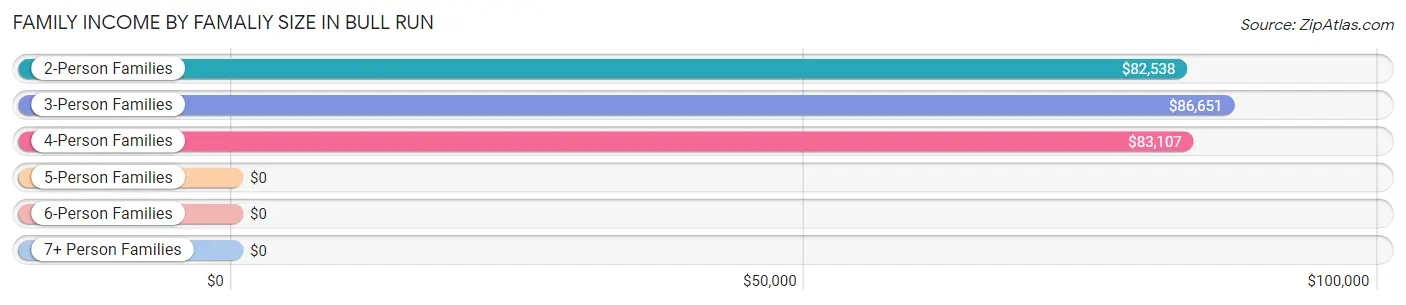
| Income Bracket | # Families | Median Income |
| 2-Person Families | 1,245 (33.2%) | $82,538 |
| 3-Person Families | 912 (24.3%) | $86,651 |
| 4-Person Families | 1,080 (28.8%) | $83,107 |
| 5-Person Families | 355 (9.5%) | $0 |
| 6-Person Families | 80 (2.1%) | $0 |
| 7+ Person Families | 76 (2.0%) | $0 |
| Total | 3,748 (100.0%) | $85,232 |
Family Income by Number of Earners in Bull Run
The median family income in Bull Run is $85,232, with families comprising 2 earners (1,824) having the highest median family income of $120,278, while families with no earners (92) have the lowest median family income of $23,235, accounting for 48.7% and 2.5% of families, respectively.
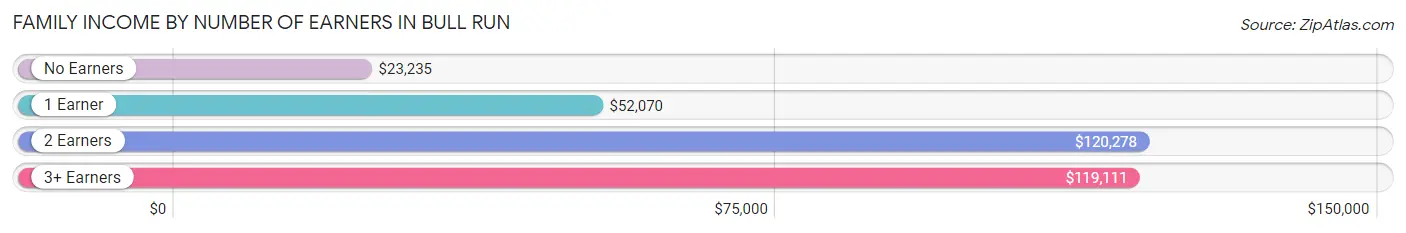
| Number of Earners | # Families | Median Income |
| No Earners | 92 (2.5%) | $23,235 |
| 1 Earner | 1,326 (35.4%) | $52,070 |
| 2 Earners | 1,824 (48.7%) | $120,278 |
| 3+ Earners | 506 (13.5%) | $119,111 |
| Total | 3,748 (100.0%) | $85,232 |
Household Income in Bull Run
Household Income Brackets in Bull Run
With 1,347 households falling in the category, the $100,000 to $149,999 income range is the most frequent in Bull Run, accounting for 21.4% of all households. In contrast, only 138 households (2.2%) fall into the less than $10,000 income bracket, making it the least populous group.
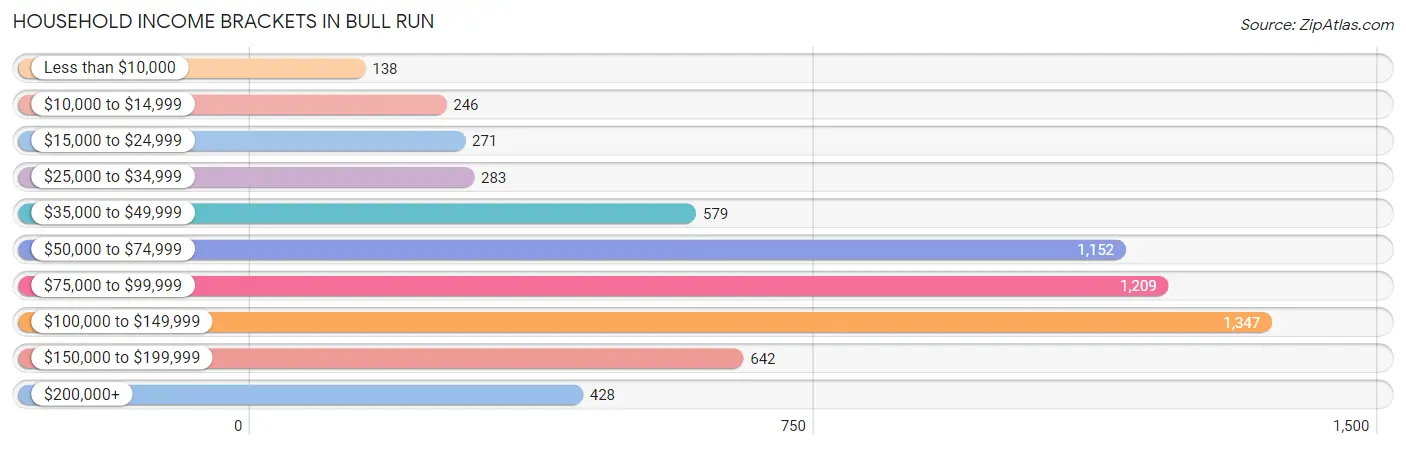
| Income Bracket | # Households | % Households |
| Less than $10,000 | 138 | 2.2% |
| $10,000 to $14,999 | 246 | 3.9% |
| $15,000 to $24,999 | 271 | 4.3% |
| $25,000 to $34,999 | 283 | 4.5% |
| $35,000 to $49,999 | 579 | 9.2% |
| $50,000 to $74,999 | 1,152 | 18.3% |
| $75,000 to $99,999 | 1,209 | 19.2% |
| $100,000 to $149,999 | 1,347 | 21.4% |
| $150,000 to $199,999 | 642 | 10.2% |
| $200,000+ | 428 | 6.8% |
Household Income by Householder Age in Bull Run
The median household income in Bull Run is $82,401, with the highest median household income of $87,572 found in the 45 to 64 years age bracket for the primary householder. A total of 2,223 households (35.3%) fall into this category. Meanwhile, the 65+ years age bracket for the primary householder has the lowest median household income of $38,924, with 556 households (8.8%) in this group.
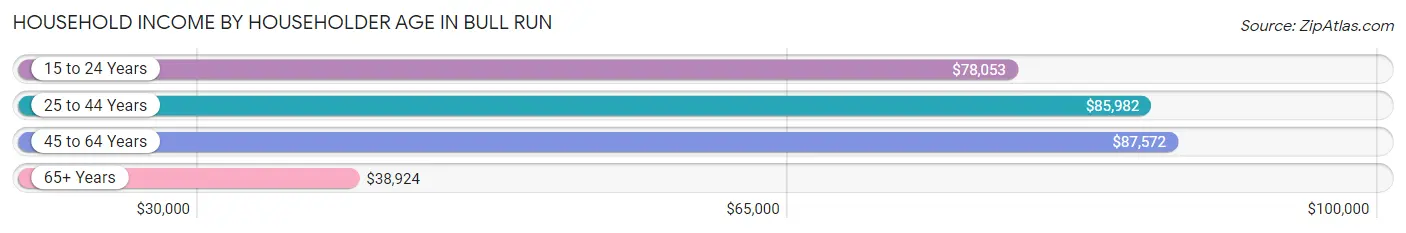
| Income Bracket | # Households | Median Income |
| 15 to 24 Years | 601 (9.6%) | $78,053 |
| 25 to 44 Years | 2,915 (46.3%) | $85,982 |
| 45 to 64 Years | 2,223 (35.3%) | $87,572 |
| 65+ Years | 556 (8.8%) | $38,924 |
| Total | 6,295 (100.0%) | $82,401 |
Poverty in Bull Run
Income Below Poverty by Sex and Age in Bull Run
With 8.1% poverty level for males and 14.5% for females among the residents of Bull Run, 12 to 14 year old males and 5 year old females are the most vulnerable to poverty, with 112 males (37.2%) and 123 females (68.0%) in their respective age groups living below the poverty level.
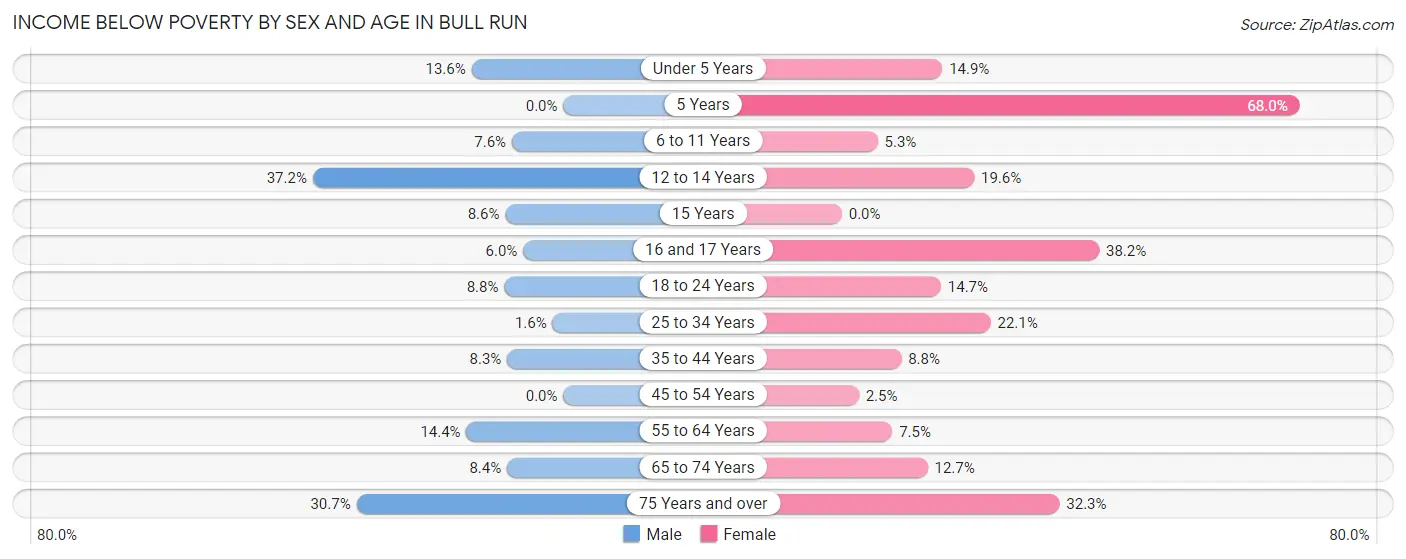
| Age Bracket | Male | Female |
| Under 5 Years | 83 (13.6%) | 126 (14.9%) |
| 5 Years | 0 (0.0%) | 123 (68.0%) |
| 6 to 11 Years | 49 (7.6%) | 37 (5.3%) |
| 12 to 14 Years | 112 (37.2%) | 44 (19.6%) |
| 15 Years | 5 (8.6%) | 0 (0.0%) |
| 16 and 17 Years | 12 (6.0%) | 68 (38.2%) |
| 18 to 24 Years | 54 (8.8%) | 128 (14.7%) |
| 25 to 34 Years | 25 (1.6%) | 361 (22.1%) |
| 35 to 44 Years | 146 (8.3%) | 126 (8.8%) |
| 45 to 54 Years | 0 (0.0%) | 21 (2.5%) |
| 55 to 64 Years | 81 (14.4%) | 79 (7.5%) |
| 65 to 74 Years | 24 (8.4%) | 28 (12.7%) |
| 75 Years and over | 47 (30.7%) | 105 (32.3%) |
| Total | 638 (8.1%) | 1,246 (14.5%) |
Income Above Poverty by Sex and Age in Bull Run
According to the poverty statistics in Bull Run, males aged 5 years and females aged 15 years are the age groups that are most secure financially, with 100.0% of males and 100.0% of females in these age groups living above the poverty line.
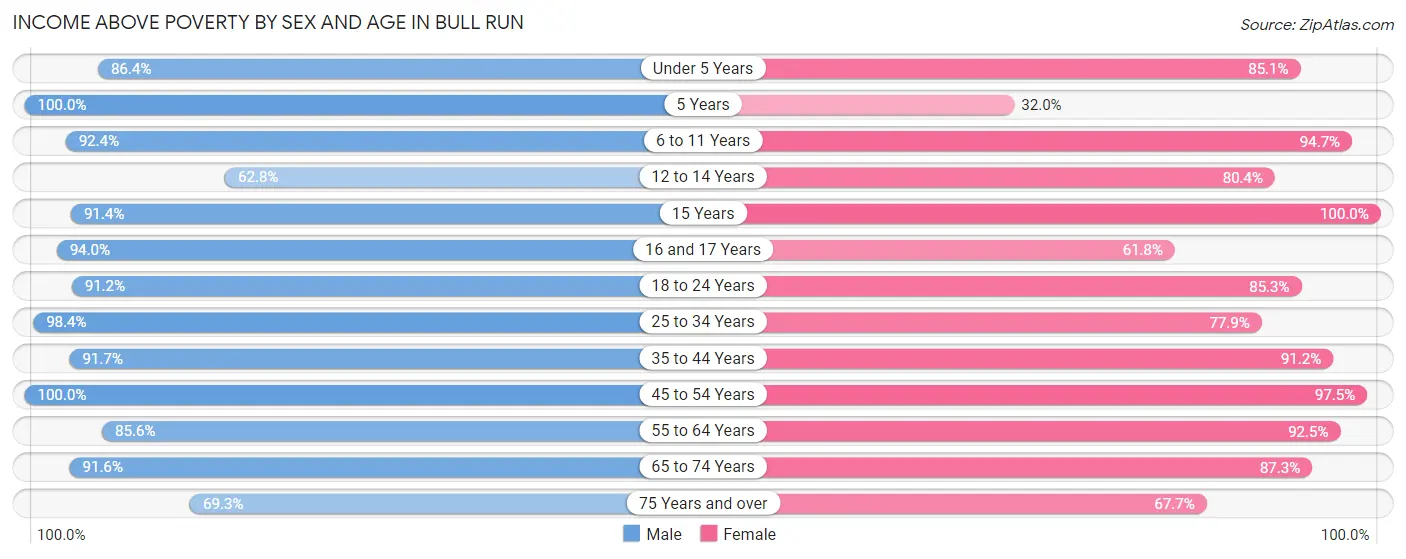
| Age Bracket | Male | Female |
| Under 5 Years | 526 (86.4%) | 719 (85.1%) |
| 5 Years | 82 (100.0%) | 58 (32.0%) |
| 6 to 11 Years | 592 (92.4%) | 659 (94.7%) |
| 12 to 14 Years | 189 (62.8%) | 180 (80.4%) |
| 15 Years | 53 (91.4%) | 119 (100.0%) |
| 16 and 17 Years | 189 (94.0%) | 110 (61.8%) |
| 18 to 24 Years | 562 (91.2%) | 742 (85.3%) |
| 25 to 34 Years | 1,534 (98.4%) | 1,273 (77.9%) |
| 35 to 44 Years | 1,605 (91.7%) | 1,303 (91.2%) |
| 45 to 54 Years | 1,066 (100.0%) | 817 (97.5%) |
| 55 to 64 Years | 482 (85.6%) | 976 (92.5%) |
| 65 to 74 Years | 263 (91.6%) | 192 (87.3%) |
| 75 Years and over | 106 (69.3%) | 220 (67.7%) |
| Total | 7,249 (91.9%) | 7,368 (85.5%) |
Income Below Poverty Among Married-Couple Families in Bull Run
The poverty statistics for married-couple families in Bull Run show that 4.8% or 115 of the total 2,374 families live below the poverty line. Families with 1 or 2 children have the highest poverty rate of 7.1%, comprising of 85 families. On the other hand, families with 5 or more children have the lowest poverty rate of 0.0%, which includes 0 families.
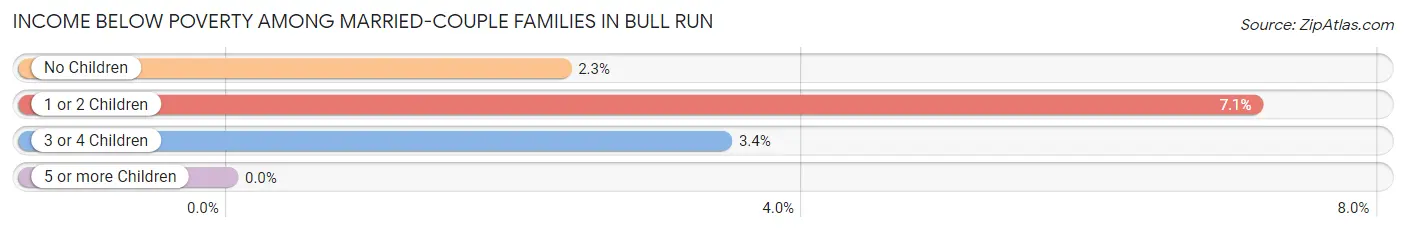
| Children | Above Poverty | Below Poverty |
| No Children | 884 (97.7%) | 21 (2.3%) |
| 1 or 2 Children | 1,106 (92.9%) | 85 (7.1%) |
| 3 or 4 Children | 253 (96.6%) | 9 (3.4%) |
| 5 or more Children | 16 (100.0%) | 0 (0.0%) |
| Total | 2,259 (95.2%) | 115 (4.8%) |
Income Below Poverty Among Single-Parent Households in Bull Run
According to the poverty data in Bull Run, 9.0% or 38 single-father households and 21.3% or 203 single-mother households are living below the poverty line. Among single-father households, those with 1 or 2 children have the highest poverty rate, with 29 households (9.5%) experiencing poverty. Likewise, among single-mother households, those with 1 or 2 children have the highest poverty rate, with 136 households (38.1%) falling below the poverty line.
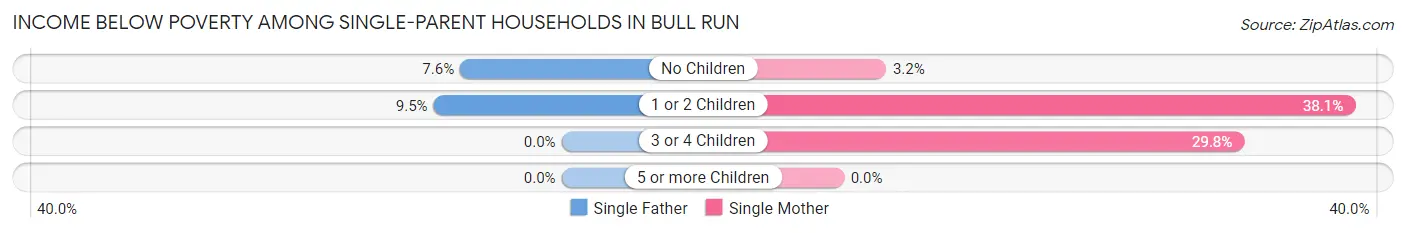
| Children | Single Father | Single Mother |
| No Children | 9 (7.6%) | 13 (3.2%) |
| 1 or 2 Children | 29 (9.5%) | 136 (38.1%) |
| 3 or 4 Children | 0 (0.0%) | 54 (29.8%) |
| 5 or more Children | 0 (0.0%) | 0 (0.0%) |
| Total | 38 (9.0%) | 203 (21.3%) |
Income Below Poverty Among Married-Couple vs Single-Parent Households in Bull Run
The poverty data for Bull Run shows that 115 of the married-couple family households (4.8%) and 241 of the single-parent households (17.5%) are living below the poverty level. Within the married-couple family households, those with 1 or 2 children have the highest poverty rate, with 85 households (7.1%) falling below the poverty line. Among the single-parent households, those with 3 or 4 children have the highest poverty rate, with 54 household (29.8%) living below poverty.
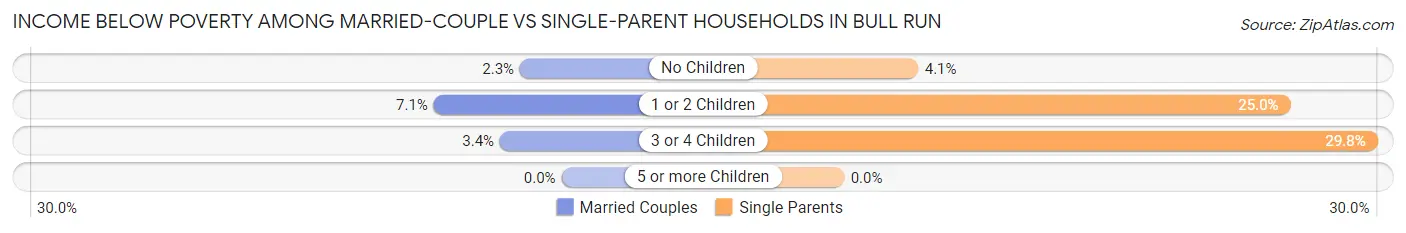
| Children | Married-Couple Families | Single-Parent Households |
| No Children | 21 (2.3%) | 22 (4.1%) |
| 1 or 2 Children | 85 (7.1%) | 165 (25.0%) |
| 3 or 4 Children | 9 (3.4%) | 54 (29.8%) |
| 5 or more Children | 0 (0.0%) | 0 (0.0%) |
| Total | 115 (4.8%) | 241 (17.5%) |
Race in Bull Run
The most populous races in Bull Run are White / Caucasian (7,034 | 42.3%), Hispanic or Latino (6,854 | 41.2%), and Black / African American (3,940 | 23.7%).
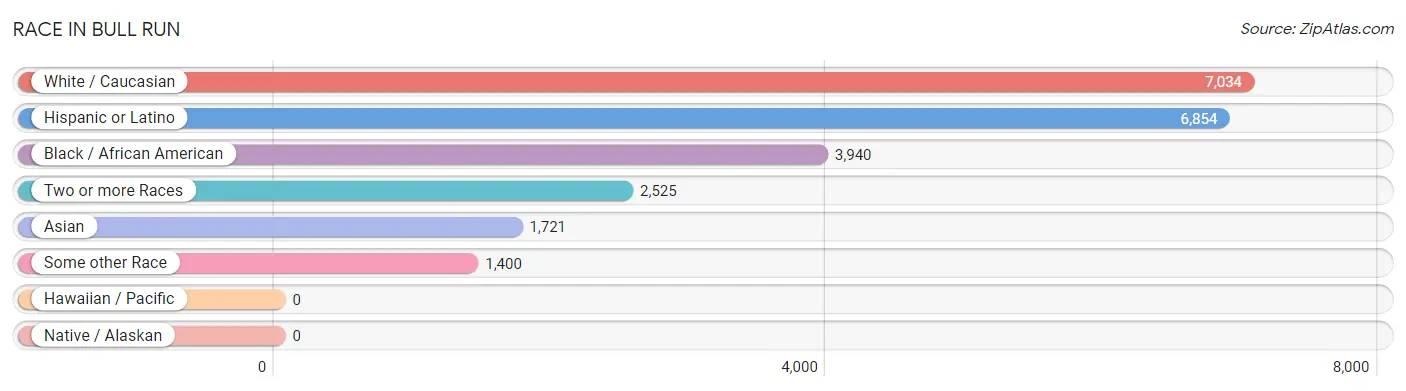
| Race | # Population | % Population |
| Asian | 1,721 | 10.3% |
| Black / African American | 3,940 | 23.7% |
| Hawaiian / Pacific | 0 | 0.0% |
| Hispanic or Latino | 6,854 | 41.2% |
| Native / Alaskan | 0 | 0.0% |
| White / Caucasian | 7,034 | 42.3% |
| Two or more Races | 2,525 | 15.2% |
| Some other Race | 1,400 | 8.4% |
| Total | 16,620 | 100.0% |
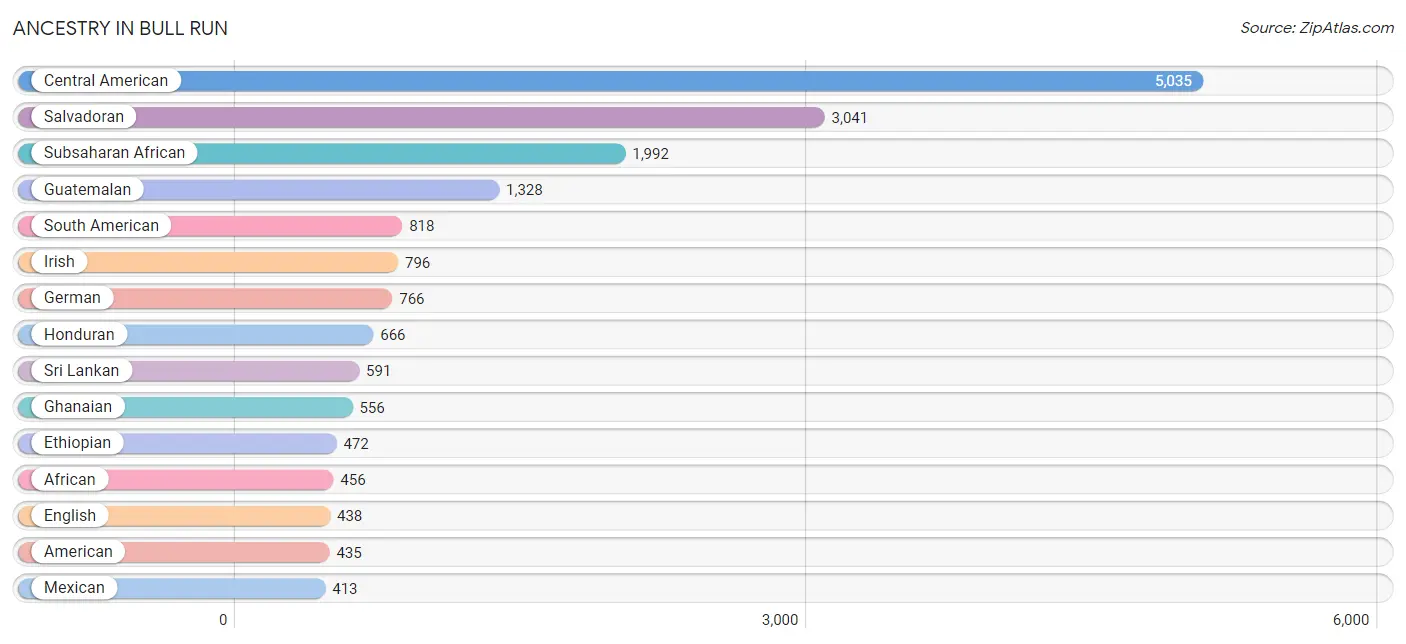
Ancestry in Bull Run
The most populous ancestries reported in Bull Run are Central American (5,035 | 30.3%), Salvadoran (3,041 | 18.3%), Subsaharan African (1,992 | 12.0%), Guatemalan (1,328 | 8.0%), and South American (818 | 4.9%), together accounting for 73.5% of all Bull Run residents.
| Ancestry | # Population | % Population |
| Afghan | 147 | 0.9% |
| African | 456 | 2.7% |
| American | 435 | 2.6% |
| Arab | 244 | 1.5% |
| Armenian | 16 | 0.1% |
| Austrian | 12 | 0.1% |
| Bhutanese | 21 | 0.1% |
| Blackfeet | 51 | 0.3% |
| Bolivian | 325 | 2.0% |
| British | 2 | 0.0% |
| Bulgarian | 20 | 0.1% |
| Burmese | 355 | 2.1% |
| Central American | 5,035 | 30.3% |
| Cherokee | 36 | 0.2% |
| Colombian | 55 | 0.3% |
| Croatian | 20 | 0.1% |
| Cuban | 54 | 0.3% |
| Czech | 8 | 0.1% |
| Eastern European | 58 | 0.4% |
| Ecuadorian | 16 | 0.1% |
| Egyptian | 75 | 0.4% |
| English | 438 | 2.6% |
| Ethiopian | 472 | 2.8% |
| European | 329 | 2.0% |
| French | 171 | 1.0% |
| French American Indian | 34 | 0.2% |
| French Canadian | 77 | 0.5% |
| German | 766 | 4.6% |
| Ghanaian | 556 | 3.4% |
| Greek | 23 | 0.1% |
| Guatemalan | 1,328 | 8.0% |
| Honduran | 666 | 4.0% |
| Hungarian | 17 | 0.1% |
| Indian (Asian) | 53 | 0.3% |
| Iranian | 4 | 0.0% |
| Irish | 796 | 4.8% |
| Italian | 108 | 0.6% |
| Jamaican | 54 | 0.3% |
| Korean | 289 | 1.7% |
| Laotian | 9 | 0.1% |
| Lebanese | 11 | 0.1% |
| Mexican | 413 | 2.5% |
| Native Hawaiian | 45 | 0.3% |
| Nigerian | 192 | 1.2% |
| Norwegian | 12 | 0.1% |
| Pakistani | 78 | 0.5% |
| Peruvian | 221 | 1.3% |
| Polish | 35 | 0.2% |
| Portuguese | 25 | 0.2% |
| Puerto Rican | 350 | 2.1% |
| Russian | 25 | 0.2% |
| Salvadoran | 3,041 | 18.3% |
| Scandinavian | 2 | 0.0% |
| Scotch-Irish | 19 | 0.1% |
| Scottish | 226 | 1.4% |
| Somali | 114 | 0.7% |
| South American | 818 | 4.9% |
| Spaniard | 14 | 0.1% |
| Spanish | 13 | 0.1% |
| Sri Lankan | 591 | 3.6% |
| Subsaharan African | 1,992 | 12.0% |
| Swiss | 44 | 0.3% |
| Thai | 212 | 1.3% |
| Venezuelan | 201 | 1.2% |
| Vietnamese | 39 | 0.2% |
| Welsh | 112 | 0.7% |
| West Indian | 8 | 0.1% | View All 67 Rows |
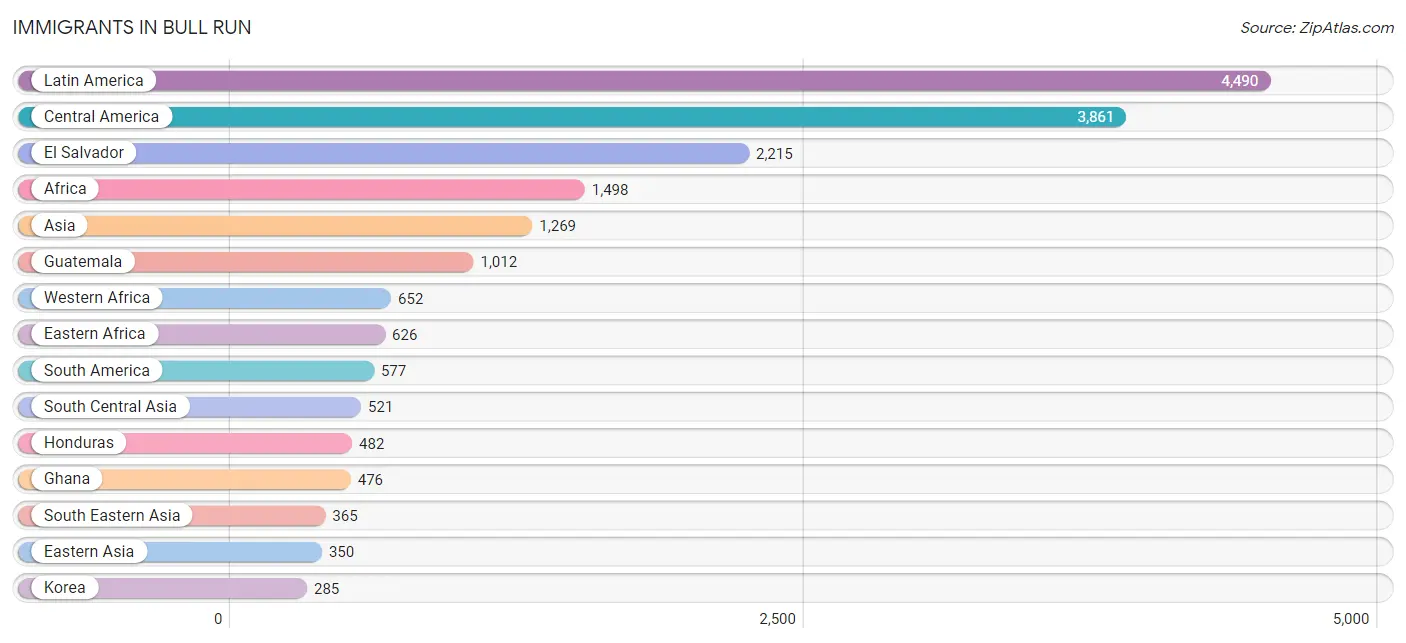
Immigrants in Bull Run
The most numerous immigrant groups reported in Bull Run came from Latin America (4,490 | 27.0%), Central America (3,861 | 23.2%), El Salvador (2,215 | 13.3%), Africa (1,498 | 9.0%), and Asia (1,269 | 7.6%), together accounting for 80.2% of all Bull Run residents.
| Immigration Origin | # Population | % Population |
| Afghanistan | 228 | 1.4% |
| Africa | 1,498 | 9.0% |
| Armenia | 16 | 0.1% |
| Asia | 1,269 | 7.6% |
| Australia | 20 | 0.1% |
| Bangladesh | 39 | 0.2% |
| Bolivia | 193 | 1.2% |
| Brazil | 13 | 0.1% |
| Bulgaria | 20 | 0.1% |
| Cameroon | 89 | 0.5% |
| Caribbean | 52 | 0.3% |
| Central America | 3,861 | 23.2% |
| China | 53 | 0.3% |
| Colombia | 30 | 0.2% |
| Croatia | 20 | 0.1% |
| Eastern Africa | 626 | 3.8% |
| Eastern Asia | 350 | 2.1% |
| Eastern Europe | 40 | 0.2% |
| Egypt | 55 | 0.3% |
| El Salvador | 2,215 | 13.3% |
| Ethiopia | 197 | 1.2% |
| Europe | 48 | 0.3% |
| Ghana | 476 | 2.9% |
| Greece | 8 | 0.1% |
| Guatemala | 1,012 | 6.1% |
| Haiti | 26 | 0.2% |
| Honduras | 482 | 2.9% |
| India | 132 | 0.8% |
| Indonesia | 9 | 0.1% |
| Jamaica | 14 | 0.1% |
| Japan | 12 | 0.1% |
| Korea | 285 | 1.7% |
| Latin America | 4,490 | 27.0% |
| Liberia | 18 | 0.1% |
| Mexico | 152 | 0.9% |
| Middle Africa | 89 | 0.5% |
| Nepal | 108 | 0.6% |
| Nigeria | 147 | 0.9% |
| Northern Africa | 131 | 0.8% |
| Oceania | 20 | 0.1% |
| Peru | 94 | 0.6% |
| Philippines | 168 | 1.0% |
| Sierra Leone | 11 | 0.1% |
| Somalia | 104 | 0.6% |
| South America | 577 | 3.5% |
| South Central Asia | 521 | 3.1% |
| South Eastern Asia | 365 | 2.2% |
| Southern Europe | 8 | 0.1% |
| Sri Lanka | 14 | 0.1% |
| Thailand | 20 | 0.1% |
| Trinidad and Tobago | 12 | 0.1% |
| Venezuela | 247 | 1.5% |
| Vietnam | 168 | 1.0% |
| Western Africa | 652 | 3.9% |
| Western Asia | 33 | 0.2% | View All 55 Rows |
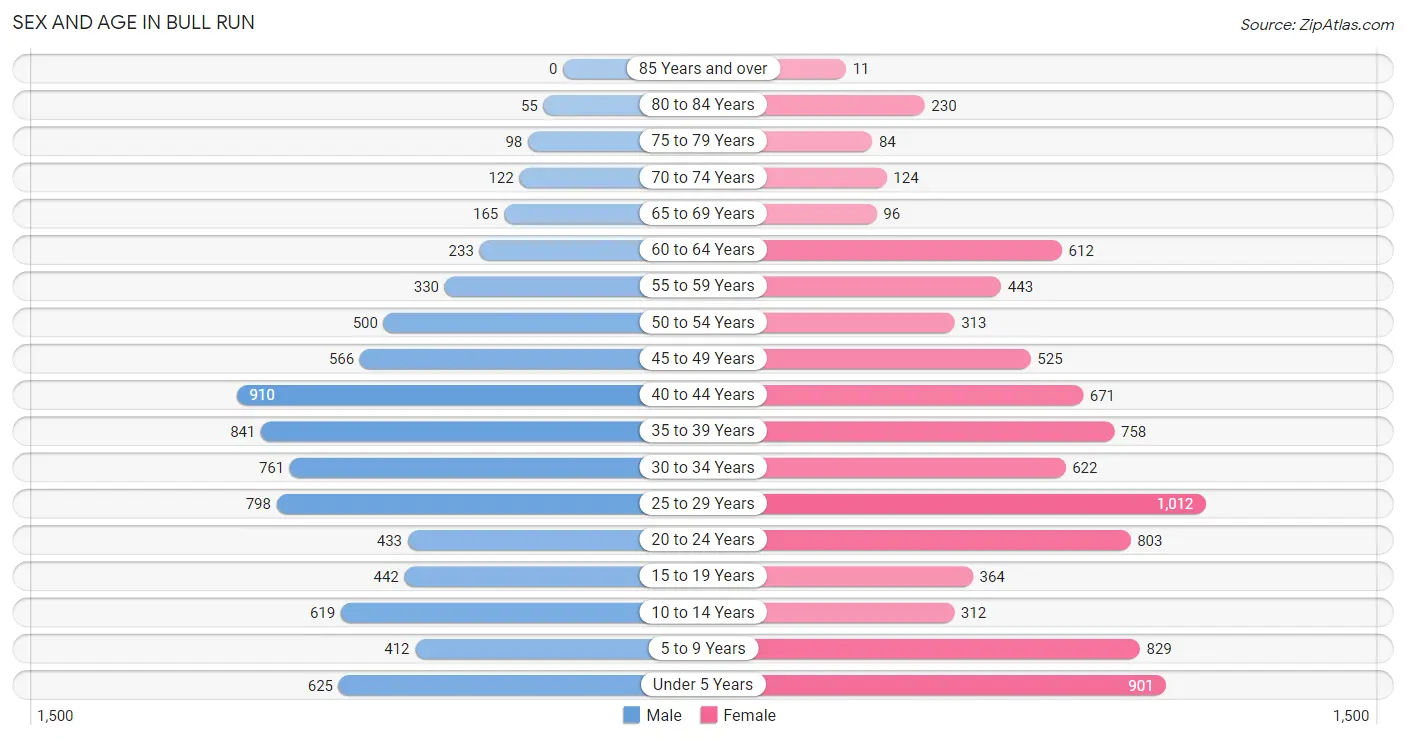
Sex and Age in Bull Run
Sex and Age in Bull Run
The most populous age groups in Bull Run are 40 to 44 Years (910 | 11.5%) for men and 25 to 29 Years (1,012 | 11.6%) for women.
| Age Bracket | Male | Female |
| Under 5 Years | 625 (7.9%) | 901 (10.3%) |
| 5 to 9 Years | 412 (5.2%) | 829 (9.5%) |
| 10 to 14 Years | 619 (7.8%) | 312 (3.6%) |
| 15 to 19 Years | 442 (5.6%) | 364 (4.2%) |
| 20 to 24 Years | 433 (5.5%) | 803 (9.2%) |
| 25 to 29 Years | 798 (10.1%) | 1,012 (11.6%) |
| 30 to 34 Years | 761 (9.6%) | 622 (7.1%) |
| 35 to 39 Years | 841 (10.6%) | 758 (8.7%) |
| 40 to 44 Years | 910 (11.5%) | 671 (7.7%) |
| 45 to 49 Years | 566 (7.2%) | 525 (6.0%) |
| 50 to 54 Years | 500 (6.3%) | 313 (3.6%) |
| 55 to 59 Years | 330 (4.2%) | 443 (5.1%) |
| 60 to 64 Years | 233 (2.9%) | 612 (7.0%) |
| 65 to 69 Years | 165 (2.1%) | 96 (1.1%) |
| 70 to 74 Years | 122 (1.5%) | 124 (1.4%) |
| 75 to 79 Years | 98 (1.2%) | 84 (1.0%) |
| 80 to 84 Years | 55 (0.7%) | 230 (2.6%) |
| 85 Years and over | 0 (0.0%) | 11 (0.1%) |
| Total | 7,910 (100.0%) | 8,710 (100.0%) |
Families and Households in Bull Run
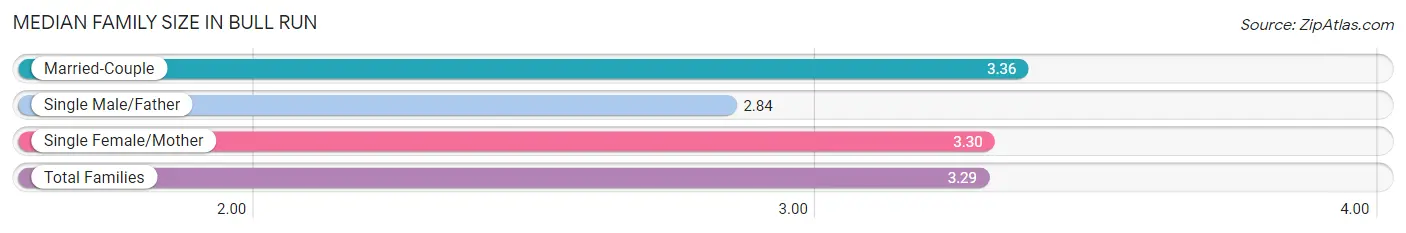
Median Family Size in Bull Run
The median family size in Bull Run is 3.29 persons per family, with married-couple families (2,374 | 63.3%) accounting for the largest median family size of 3.36 persons per family. On the other hand, single male/father families (423 | 11.3%) represent the smallest median family size with 2.84 persons per family.
| Family Type | # Families | Family Size |
| Married-Couple | 2,374 (63.3%) | 3.36 |
| Single Male/Father | 423 (11.3%) | 2.84 |
| Single Female/Mother | 951 (25.4%) | 3.30 |
| Total Families | 3,748 (100.0%) | 3.29 |
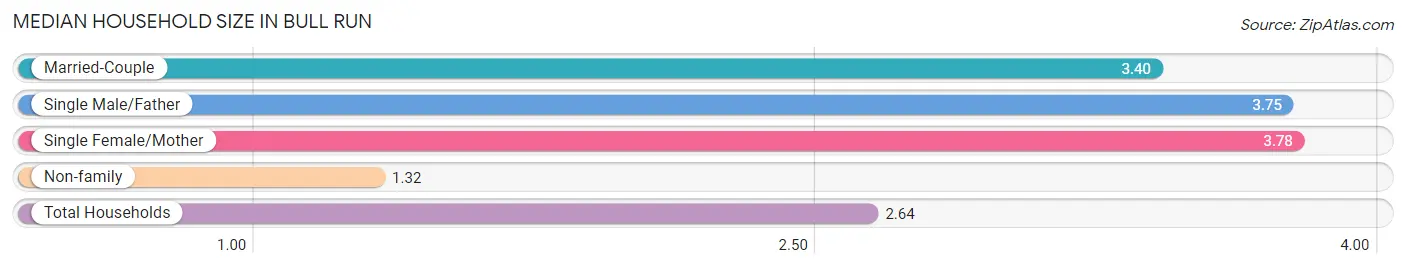
Median Household Size in Bull Run
The median household size in Bull Run is 2.64 persons per household, with single female/mother households (951 | 15.1%) accounting for the largest median household size of 3.78 persons per household. non-family households (2,547 | 40.5%) represent the smallest median household size with 1.32 persons per household.
| Household Type | # Households | Household Size |
| Married-Couple | 2,374 (37.7%) | 3.40 |
| Single Male/Father | 423 (6.7%) | 3.75 |
| Single Female/Mother | 951 (15.1%) | 3.78 |
| Non-family | 2,547 (40.5%) | 1.32 |
| Total Households | 6,295 (100.0%) | 2.64 |
Household Size by Marriage Status in Bull Run
Out of a total of 6,295 households in Bull Run, 3,748 (59.5%) are family households, while 2,547 (40.5%) are nonfamily households. The most numerous type of family households are 4-person households, comprising 1,092, and the most common type of nonfamily households are 1-person households, comprising 1,898.
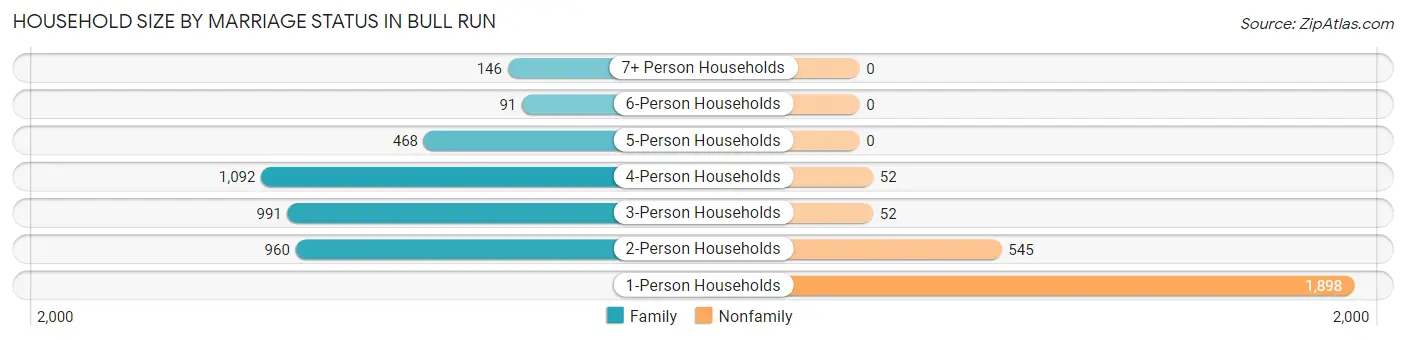
| Household Size | Family Households | Nonfamily Households |
| 1-Person Households | - | 1,898 (30.1%) |
| 2-Person Households | 960 (15.2%) | 545 (8.7%) |
| 3-Person Households | 991 (15.7%) | 52 (0.8%) |
| 4-Person Households | 1,092 (17.3%) | 52 (0.8%) |
| 5-Person Households | 468 (7.4%) | 0 (0.0%) |
| 6-Person Households | 91 (1.5%) | 0 (0.0%) |
| 7+ Person Households | 146 (2.3%) | 0 (0.0%) |
| Total | 3,748 (59.5%) | 2,547 (40.5%) |
Female Fertility in Bull Run
Fertility by Age in Bull Run
Average fertility rate in Bull Run is 48.0 births per 1,000 women. Women in the age bracket of 20 to 34 years have the highest fertility rate with 82.0 births per 1,000 women. Women in the age bracket of 20 to 34 years acount for 86.2% of all women with births.
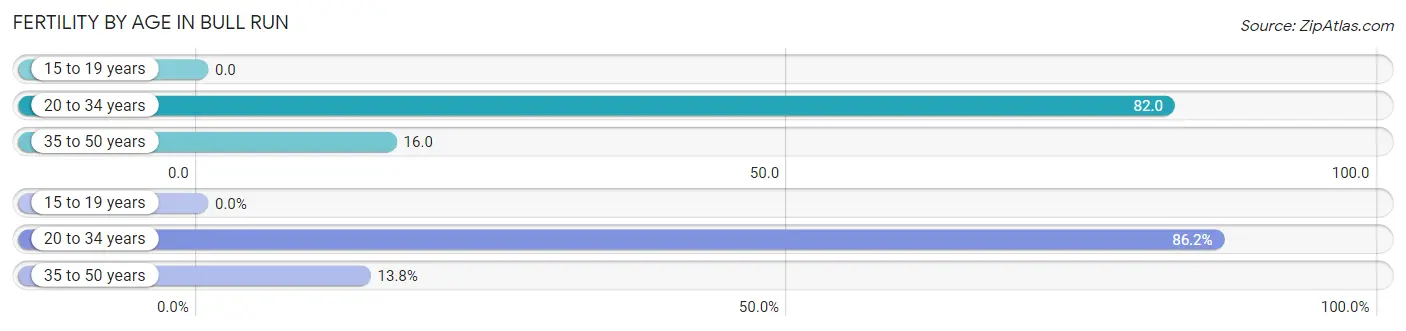
| Age Bracket | Women with Births | Births / 1,000 Women |
| 15 to 19 years | 0 (0.0%) | 0.0 |
| 20 to 34 years | 200 (86.2%) | 82.0 |
| 35 to 50 years | 32 (13.8%) | 16.0 |
| Total | 232 (100.0%) | 48.0 |
Fertility by Age by Marriage Status in Bull Run
70.3% of women with births (232) in Bull Run are married. The highest percentage of unmarried women with births falls into 35 to 50 years age bracket with 87.5% of them unmarried at the time of birth, while the lowest percentage of unmarried women with births belong to 20 to 34 years age bracket with 20.5% of them unmarried.
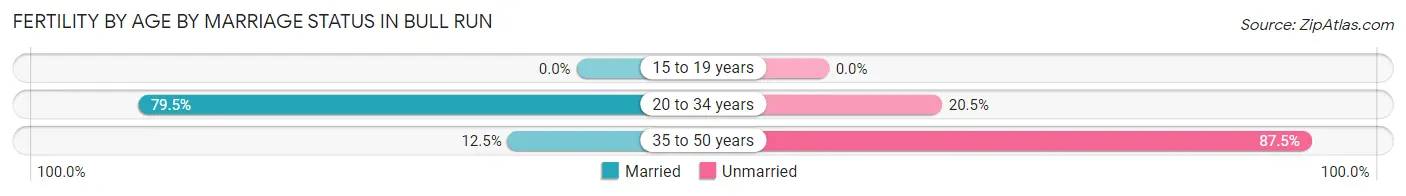
| Age Bracket | Married | Unmarried |
| 15 to 19 years | 0 (0.0%) | 0 (0.0%) |
| 20 to 34 years | 159 (79.5%) | 41 (20.5%) |
| 35 to 50 years | 4 (12.5%) | 28 (87.5%) |
| Total | 163 (70.3%) | 69 (29.7%) |
Fertility by Education in Bull Run
Average fertility rate in Bull Run is 48.0 births per 1,000 women. Women with the education attainment of less than high school have the highest fertility rate of 90.0 births per 1,000 women, while women with the education attainment of graduate degree have the lowest fertility at 4.0 births per 1,000 women. Women with the education attainment of less than high school represent 37.1% of all women with births.
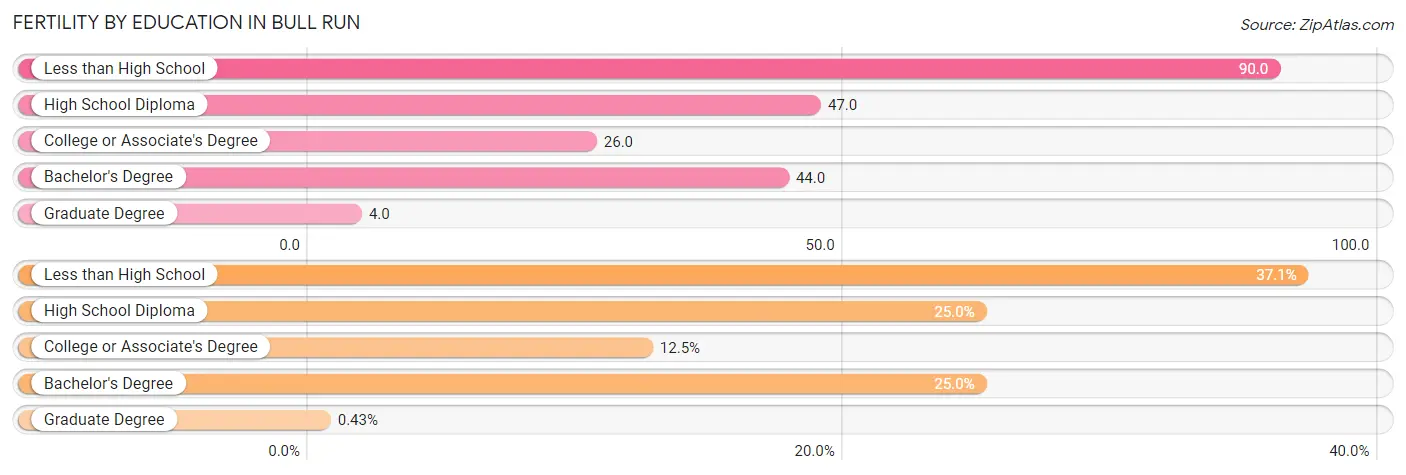
| Educational Attainment | Women with Births | Births / 1,000 Women |
| Less than High School | 86 (37.1%) | 90.0 |
| High School Diploma | 58 (25.0%) | 47.0 |
| College or Associate's Degree | 29 (12.5%) | 26.0 |
| Bachelor's Degree | 58 (25.0%) | 44.0 |
| Graduate Degree | 1 (0.4%) | 4.0 |
| Total | 232 (100.0%) | 48.0 |
Fertility by Education by Marriage Status in Bull Run
29.7% of women with births in Bull Run are unmarried. Women with the educational attainment of graduate degree are most likely to be married with 100.0% of them married at childbirth, while women with the educational attainment of college or associate's degree are least likely to be married with 37.9% of them unmarried at childbirth.
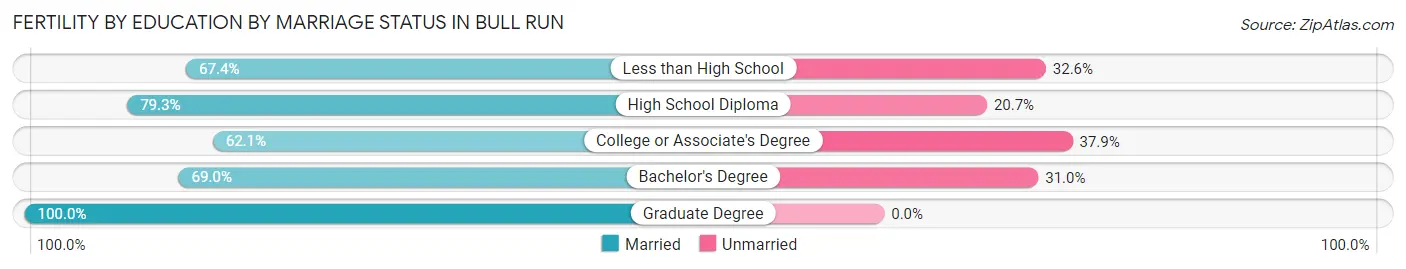
| Educational Attainment | Married | Unmarried |
| Less than High School | 58 (67.4%) | 28 (32.6%) |
| High School Diploma | 46 (79.3%) | 12 (20.7%) |
| College or Associate's Degree | 18 (62.1%) | 11 (37.9%) |
| Bachelor's Degree | 40 (69.0%) | 18 (31.0%) |
| Graduate Degree | 1 (100.0%) | 0 (0.0%) |
| Total | 163 (70.3%) | 69 (29.7%) |
Employment Characteristics in Bull Run
Employment by Class of Employer in Bull Run
Among the 9,747 employed individuals in Bull Run, private company employees (7,082 | 72.7%), not-for-profit organizations (714 | 7.3%), and federal government employees (601 | 6.2%) make up the most common classes of employment.
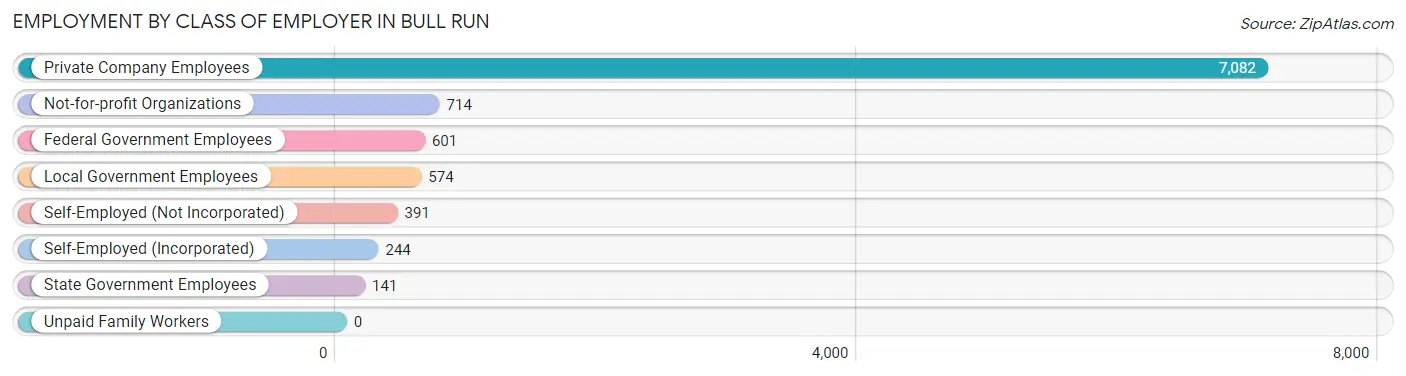
| Employer Class | # Employees | % Employees |
| Private Company Employees | 7,082 | 72.7% |
| Self-Employed (Incorporated) | 244 | 2.5% |
| Self-Employed (Not Incorporated) | 391 | 4.0% |
| Not-for-profit Organizations | 714 | 7.3% |
| Local Government Employees | 574 | 5.9% |
| State Government Employees | 141 | 1.5% |
| Federal Government Employees | 601 | 6.2% |
| Unpaid Family Workers | 0 | 0.0% |
| Total | 9,747 | 100.0% |
Employment Status by Age in Bull Run
According to the labor force statistics for Bull Run, out of the total population over 16 years of age (12,745), 80.4% or 10,247 individuals are in the labor force, with 2.9% or 297 of them unemployed. The age group with the highest labor force participation rate is 45 to 54 years, with 95.9% or 1,826 individuals in the labor force. Within the labor force, the 45 to 54 years age range has the highest percentage of unemployed individuals, with 8.8% or 161 of them being unemployed.
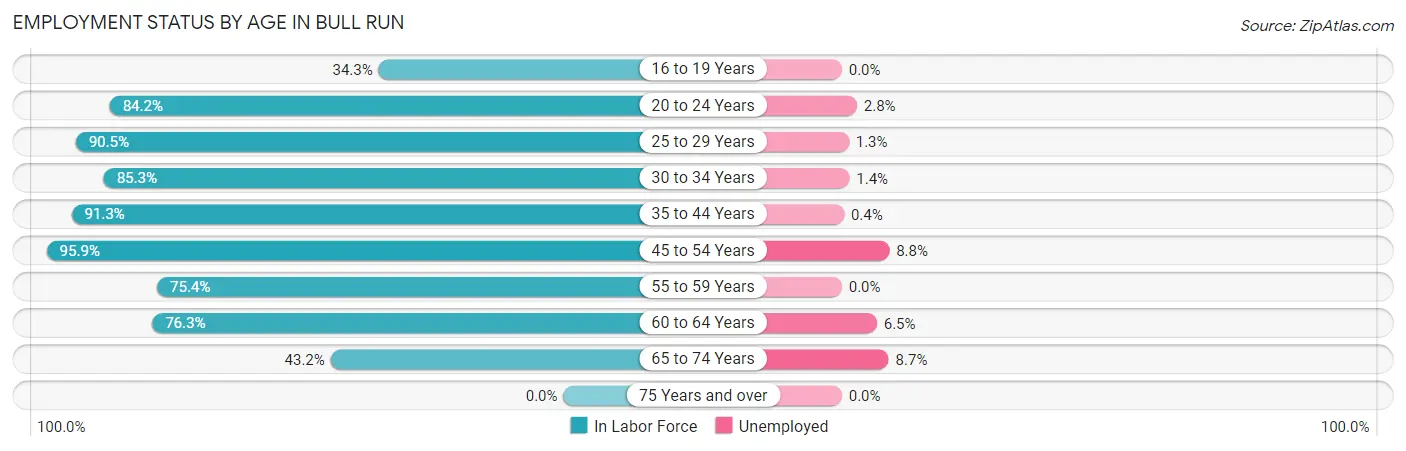
| Age Bracket | In Labor Force | Unemployed |
| 16 to 19 Years | 216 (34.3%) | 0 (0.0%) |
| 20 to 24 Years | 1,041 (84.2%) | 29 (2.8%) |
| 25 to 29 Years | 1,638 (90.5%) | 21 (1.3%) |
| 30 to 34 Years | 1,180 (85.3%) | 17 (1.4%) |
| 35 to 44 Years | 2,903 (91.3%) | 12 (0.4%) |
| 45 to 54 Years | 1,826 (95.9%) | 161 (8.8%) |
| 55 to 59 Years | 583 (75.4%) | 0 (0.0%) |
| 60 to 64 Years | 645 (76.3%) | 42 (6.5%) |
| 65 to 74 Years | 219 (43.2%) | 19 (8.7%) |
| 75 Years and over | 0 (0.0%) | 0 (0.0%) |
| Total | 10,247 (80.4%) | 297 (2.9%) |
Employment Status by Educational Attainment in Bull Run
According to labor force statistics for Bull Run, 88.7% of individuals (8,777) out of the total population between 25 and 64 years of age (9,895) are in the labor force, with 2.9% or 255 of them being unemployed. The group with the highest labor force participation rate are those with the educational attainment of college / associate degree, with 95.1% or 2,393 individuals in the labor force. Within the labor force, individuals with high school diploma education have the highest percentage of unemployment, with 10.0% or 217 of them being unemployed.
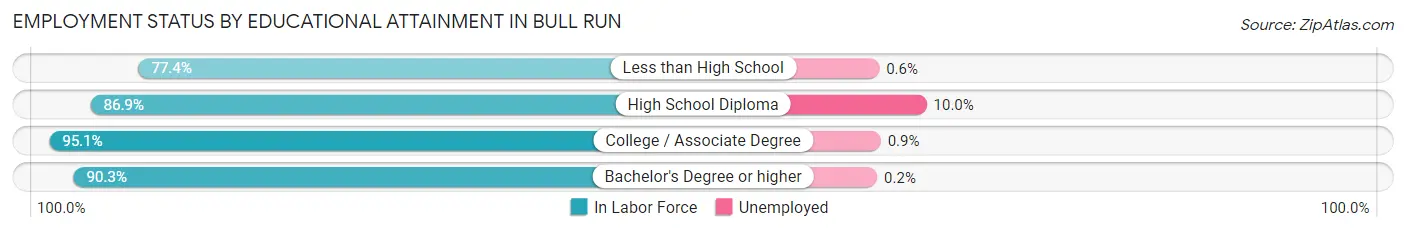
| Educational Attainment | In Labor Force | Unemployed |
| Less than High School | 1,187 (77.4%) | 9 (0.6%) |
| High School Diploma | 2,167 (86.9%) | 249 (10.0%) |
| College / Associate Degree | 2,393 (95.1%) | 23 (0.9%) |
| Bachelor's Degree or higher | 3,027 (90.3%) | 7 (0.2%) |
| Total | 8,777 (88.7%) | 287 (2.9%) |
Employment Occupations by Sex in Bull Run
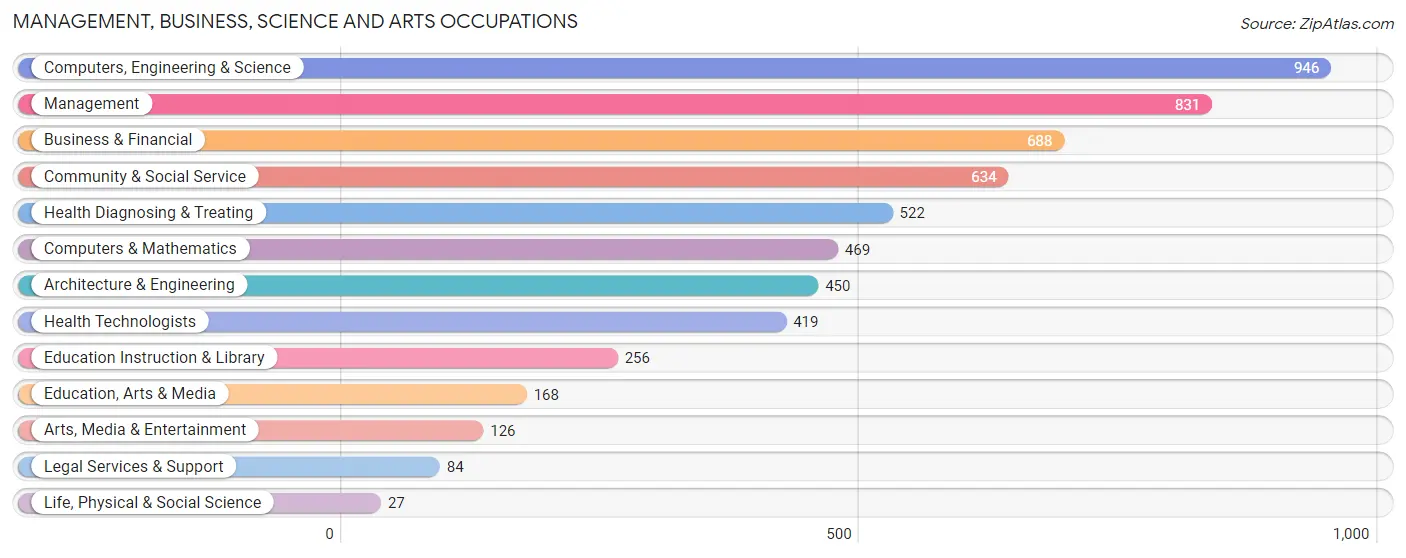
Management, Business, Science and Arts Occupations
The most common Management, Business, Science and Arts occupations in Bull Run are Computers, Engineering & Science (946 | 9.5%), Management (831 | 8.4%), Business & Financial (688 | 6.9%), Community & Social Service (634 | 6.4%), and Health Diagnosing & Treating (522 | 5.3%).
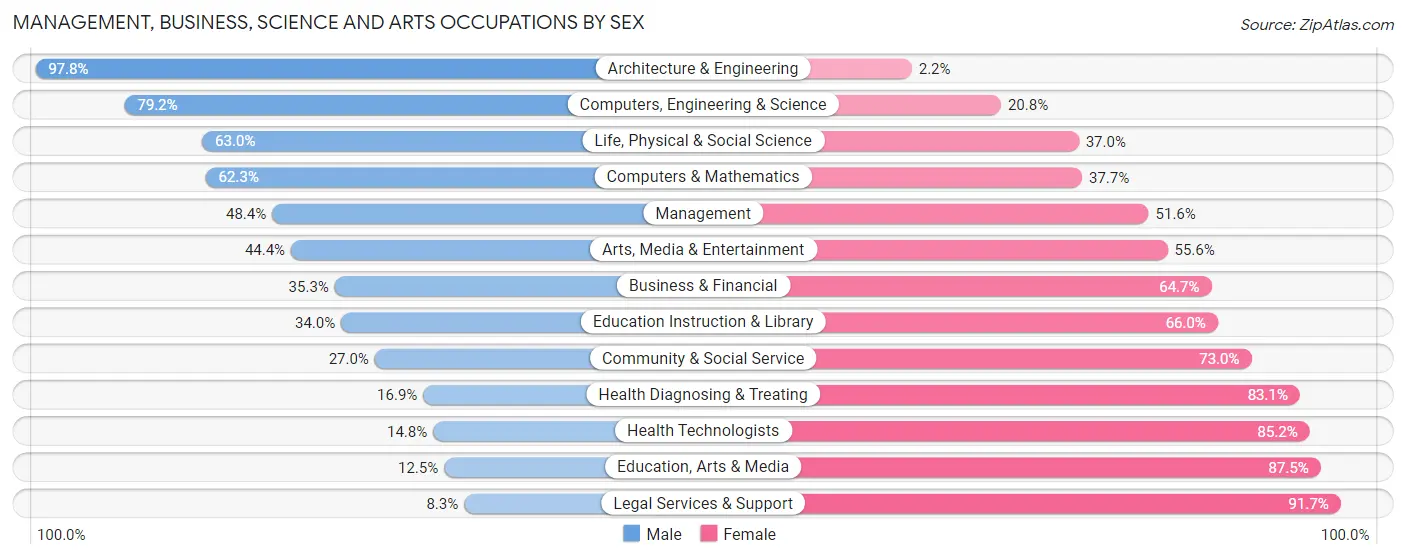
Management, Business, Science and Arts Occupations by Sex
Within the Management, Business, Science and Arts occupations in Bull Run, the most male-oriented occupations are Architecture & Engineering (97.8%), Computers, Engineering & Science (79.2%), and Life, Physical & Social Science (63.0%), while the most female-oriented occupations are Legal Services & Support (91.7%), Education, Arts & Media (87.5%), and Health Technologists (85.2%).
| Occupation | Male | Female |
| Management | 402 (48.4%) | 429 (51.6%) |
| Business & Financial | 243 (35.3%) | 445 (64.7%) |
| Computers, Engineering & Science | 749 (79.2%) | 197 (20.8%) |
| Computers & Mathematics | 292 (62.3%) | 177 (37.7%) |
| Architecture & Engineering | 440 (97.8%) | 10 (2.2%) |
| Life, Physical & Social Science | 17 (63.0%) | 10 (37.0%) |
| Community & Social Service | 171 (27.0%) | 463 (73.0%) |
| Education, Arts & Media | 21 (12.5%) | 147 (87.5%) |
| Legal Services & Support | 7 (8.3%) | 77 (91.7%) |
| Education Instruction & Library | 87 (34.0%) | 169 (66.0%) |
| Arts, Media & Entertainment | 56 (44.4%) | 70 (55.6%) |
| Health Diagnosing & Treating | 88 (16.9%) | 434 (83.1%) |
| Health Technologists | 62 (14.8%) | 357 (85.2%) |
| Total (Category) | 1,653 (45.7%) | 1,968 (54.3%) |
| Total (Overall) | 5,343 (53.9%) | 4,573 (46.1%) |
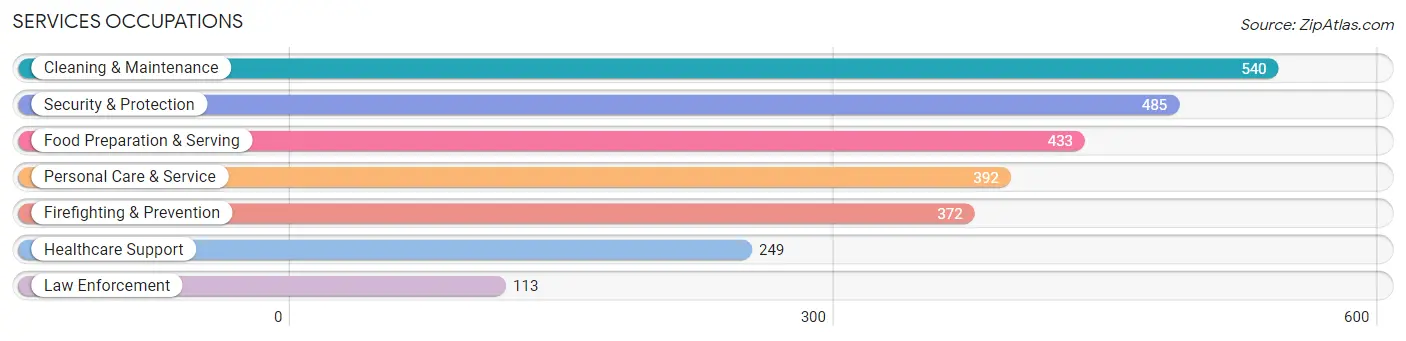
Services Occupations
The most common Services occupations in Bull Run are Cleaning & Maintenance (540 | 5.4%), Security & Protection (485 | 4.9%), Food Preparation & Serving (433 | 4.4%), Personal Care & Service (392 | 4.0%), and Firefighting & Prevention (372 | 3.7%).
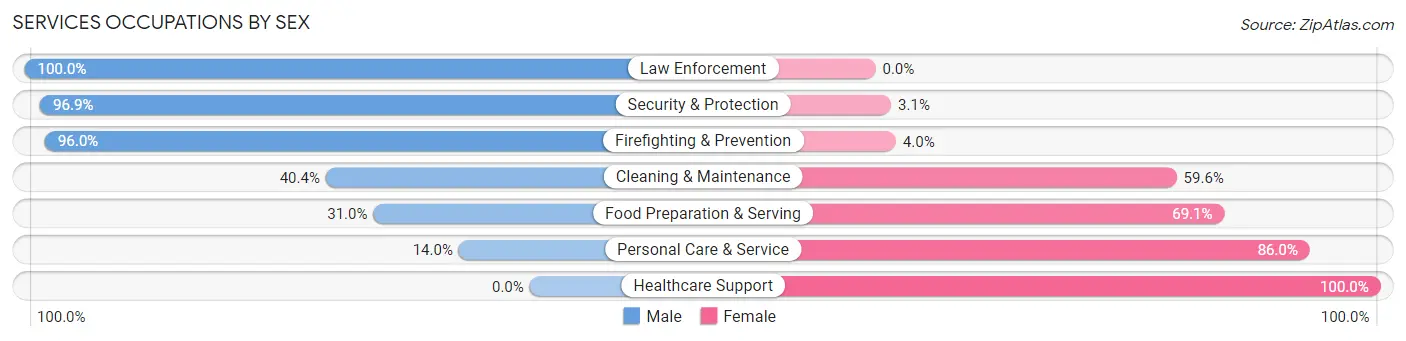
Services Occupations by Sex
Within the Services occupations in Bull Run, the most male-oriented occupations are Law Enforcement (100.0%), Security & Protection (96.9%), and Firefighting & Prevention (96.0%), while the most female-oriented occupations are Healthcare Support (100.0%), Personal Care & Service (86.0%), and Food Preparation & Serving (69.1%).
| Occupation | Male | Female |
| Healthcare Support | 0 (0.0%) | 249 (100.0%) |
| Security & Protection | 470 (96.9%) | 15 (3.1%) |
| Firefighting & Prevention | 357 (96.0%) | 15 (4.0%) |
| Law Enforcement | 113 (100.0%) | 0 (0.0%) |
| Food Preparation & Serving | 134 (30.9%) | 299 (69.1%) |
| Cleaning & Maintenance | 218 (40.4%) | 322 (59.6%) |
| Personal Care & Service | 55 (14.0%) | 337 (86.0%) |
| Total (Category) | 877 (41.8%) | 1,222 (58.2%) |
| Total (Overall) | 5,343 (53.9%) | 4,573 (46.1%) |
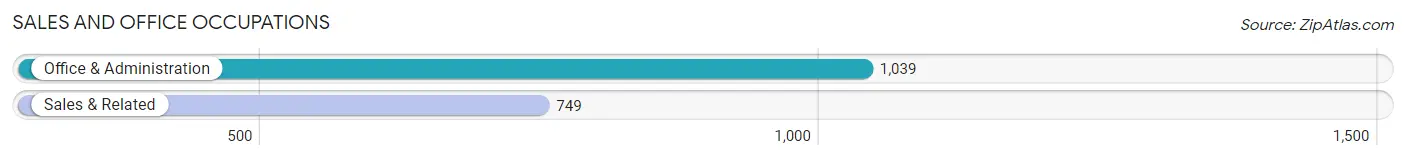
Sales and Office Occupations
The most common Sales and Office occupations in Bull Run are Office & Administration (1,039 | 10.5%), and Sales & Related (749 | 7.5%).
Sales and Office Occupations by Sex
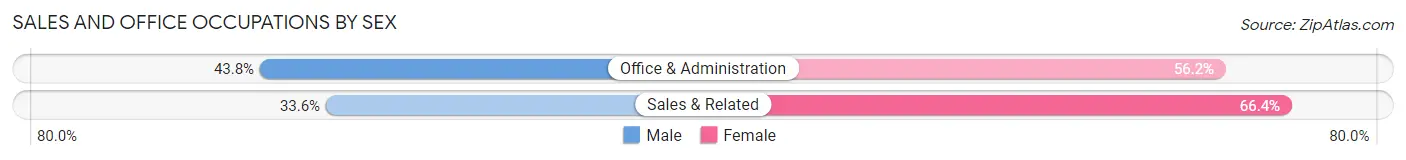
| Occupation | Male | Female |
| Sales & Related | 252 (33.6%) | 497 (66.4%) |
| Office & Administration | 455 (43.8%) | 584 (56.2%) |
| Total (Category) | 707 (39.5%) | 1,081 (60.5%) |
| Total (Overall) | 5,343 (53.9%) | 4,573 (46.1%) |
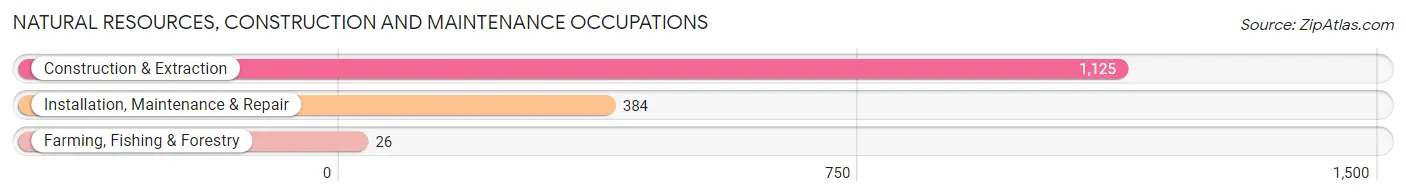
Natural Resources, Construction and Maintenance Occupations
The most common Natural Resources, Construction and Maintenance occupations in Bull Run are Construction & Extraction (1,125 | 11.4%), Installation, Maintenance & Repair (384 | 3.9%), and Farming, Fishing & Forestry (26 | 0.3%).
Natural Resources, Construction and Maintenance Occupations by Sex
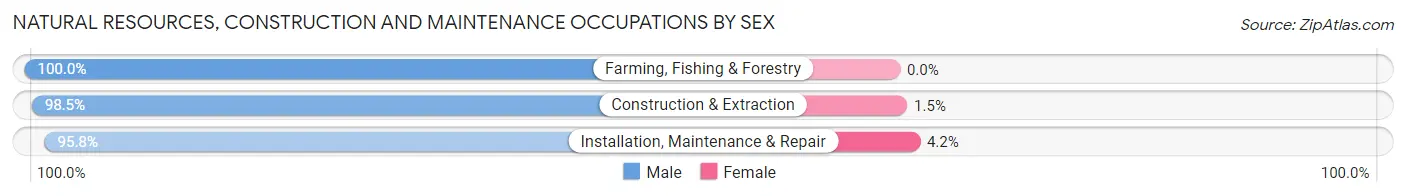
| Occupation | Male | Female |
| Farming, Fishing & Forestry | 26 (100.0%) | 0 (0.0%) |
| Construction & Extraction | 1,108 (98.5%) | 17 (1.5%) |
| Installation, Maintenance & Repair | 368 (95.8%) | 16 (4.2%) |
| Total (Category) | 1,502 (97.9%) | 33 (2.1%) |
| Total (Overall) | 5,343 (53.9%) | 4,573 (46.1%) |
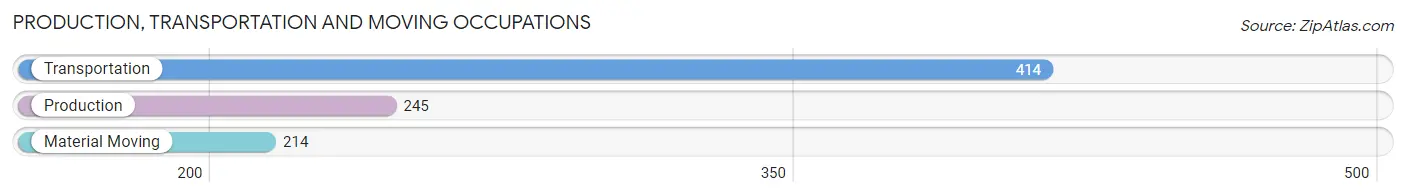
Production, Transportation and Moving Occupations
The most common Production, Transportation and Moving occupations in Bull Run are Transportation (414 | 4.2%), Production (245 | 2.5%), and Material Moving (214 | 2.2%).
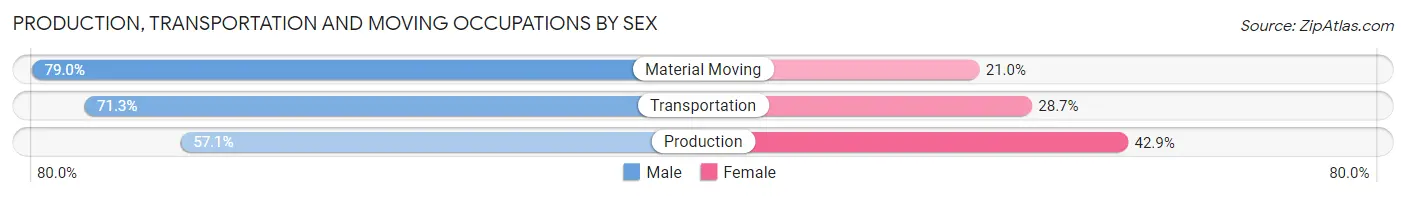
Production, Transportation and Moving Occupations by Sex
| Occupation | Male | Female |
| Production | 140 (57.1%) | 105 (42.9%) |
| Transportation | 295 (71.3%) | 119 (28.7%) |
| Material Moving | 169 (79.0%) | 45 (21.0%) |
| Total (Category) | 604 (69.2%) | 269 (30.8%) |
| Total (Overall) | 5,343 (53.9%) | 4,573 (46.1%) |
Employment Industries by Sex in Bull Run
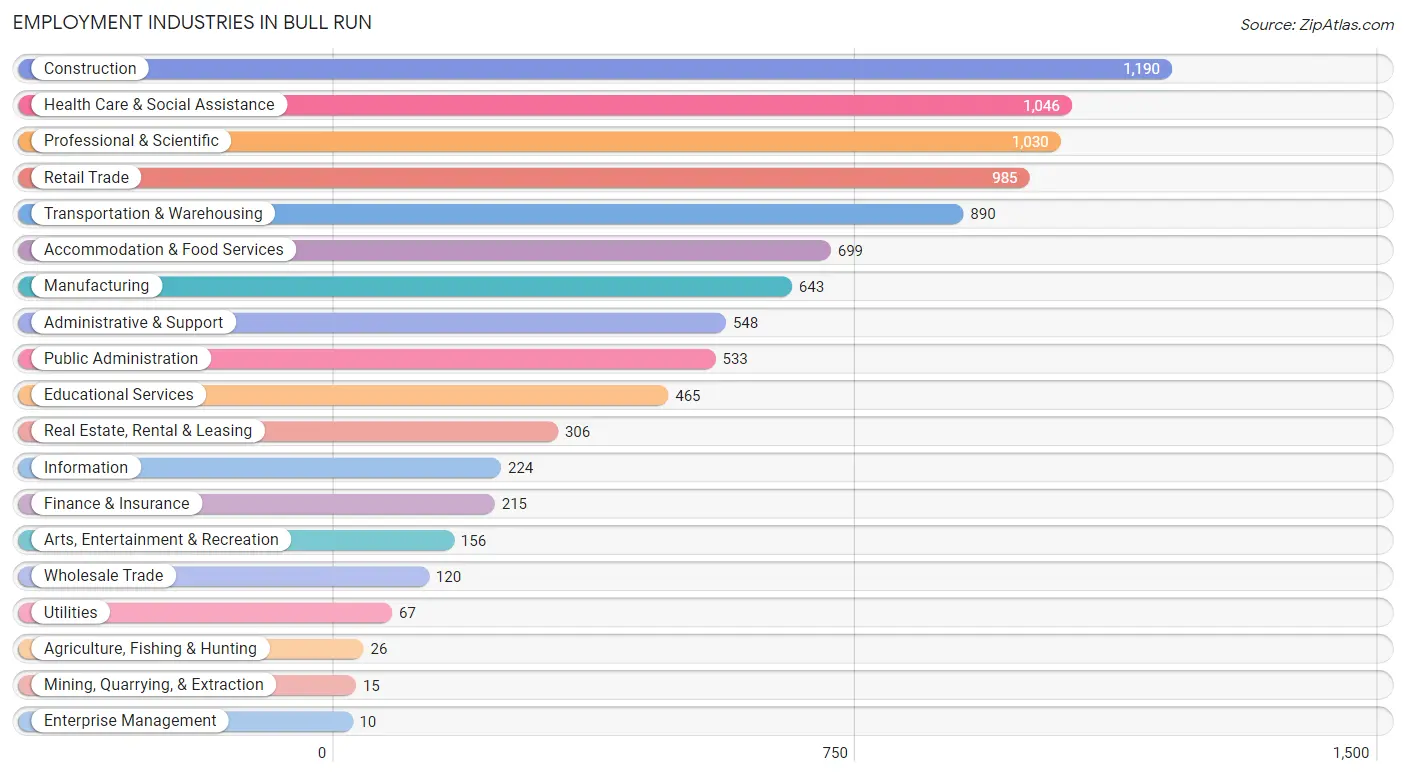
Employment Industries in Bull Run
The major employment industries in Bull Run include Construction (1,190 | 12.0%), Health Care & Social Assistance (1,046 | 10.5%), Professional & Scientific (1,030 | 10.4%), Retail Trade (985 | 9.9%), and Transportation & Warehousing (890 | 9.0%).
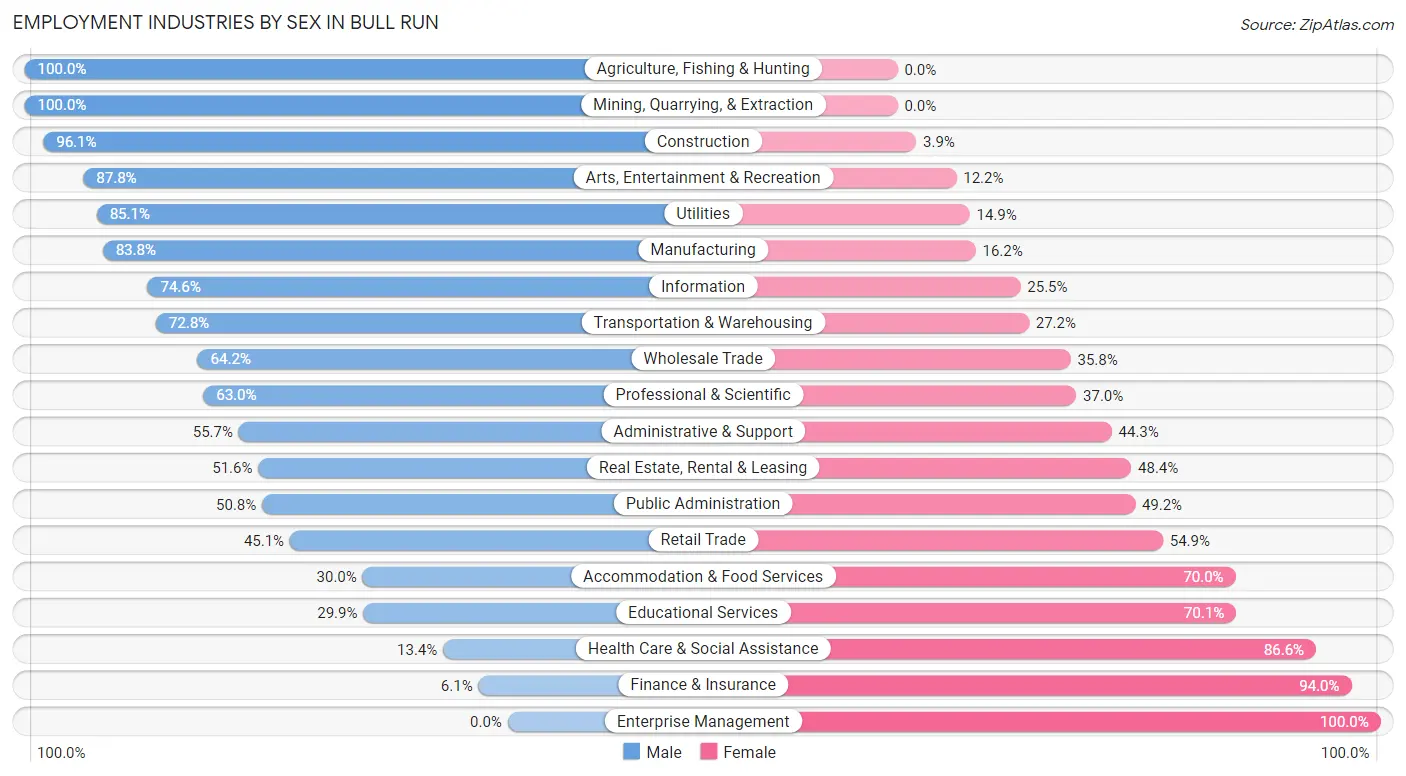
Employment Industries by Sex in Bull Run
The Bull Run industries that see more men than women are Agriculture, Fishing & Hunting (100.0%), Mining, Quarrying, & Extraction (100.0%), and Construction (96.1%), whereas the industries that tend to have a higher number of women are Enterprise Management (100.0%), Finance & Insurance (94.0%), and Health Care & Social Assistance (86.6%).
| Industry | Male | Female |
| Agriculture, Fishing & Hunting | 26 (100.0%) | 0 (0.0%) |
| Mining, Quarrying, & Extraction | 15 (100.0%) | 0 (0.0%) |
| Construction | 1,144 (96.1%) | 46 (3.9%) |
| Manufacturing | 539 (83.8%) | 104 (16.2%) |
| Wholesale Trade | 77 (64.2%) | 43 (35.8%) |
| Retail Trade | 444 (45.1%) | 541 (54.9%) |
| Transportation & Warehousing | 648 (72.8%) | 242 (27.2%) |
| Utilities | 57 (85.1%) | 10 (14.9%) |
| Information | 167 (74.6%) | 57 (25.5%) |
| Finance & Insurance | 13 (6.0%) | 202 (94.0%) |
| Real Estate, Rental & Leasing | 158 (51.6%) | 148 (48.4%) |
| Professional & Scientific | 649 (63.0%) | 381 (37.0%) |
| Enterprise Management | 0 (0.0%) | 10 (100.0%) |
| Administrative & Support | 305 (55.7%) | 243 (44.3%) |
| Educational Services | 139 (29.9%) | 326 (70.1%) |
| Health Care & Social Assistance | 140 (13.4%) | 906 (86.6%) |
| Arts, Entertainment & Recreation | 137 (87.8%) | 19 (12.2%) |
| Accommodation & Food Services | 210 (30.0%) | 489 (70.0%) |
| Public Administration | 271 (50.8%) | 262 (49.2%) |
| Total | 5,343 (53.9%) | 4,573 (46.1%) |
Education in Bull Run
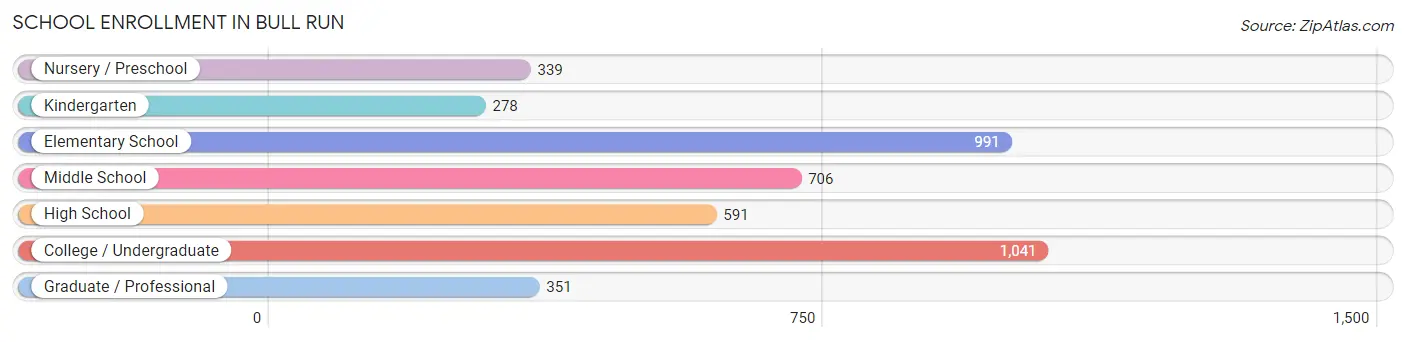
School Enrollment in Bull Run
The most common levels of schooling among the 4,297 students in Bull Run are college / undergraduate (1,041 | 24.2%), elementary school (991 | 23.1%), and middle school (706 | 16.4%).
| School Level | # Students | % Students |
| Nursery / Preschool | 339 | 7.9% |
| Kindergarten | 278 | 6.5% |
| Elementary School | 991 | 23.1% |
| Middle School | 706 | 16.4% |
| High School | 591 | 13.8% |
| College / Undergraduate | 1,041 | 24.2% |
| Graduate / Professional | 351 | 8.2% |
| Total | 4,297 | 100.0% |
School Enrollment by Age by Funding Source in Bull Run
Out of a total of 4,297 students who are enrolled in schools in Bull Run, 546 (12.7%) attend a private institution, while the remaining 3,751 (87.3%) are enrolled in public schools. The age group of 35 years and over has the highest likelihood of being enrolled in private schools, with 341 (69.9% in the age bracket) enrolled. Conversely, the age group of 15 to 17 year olds has the lowest likelihood of being enrolled in a private school, with 483 (100.0% in the age bracket) attending a public institution.
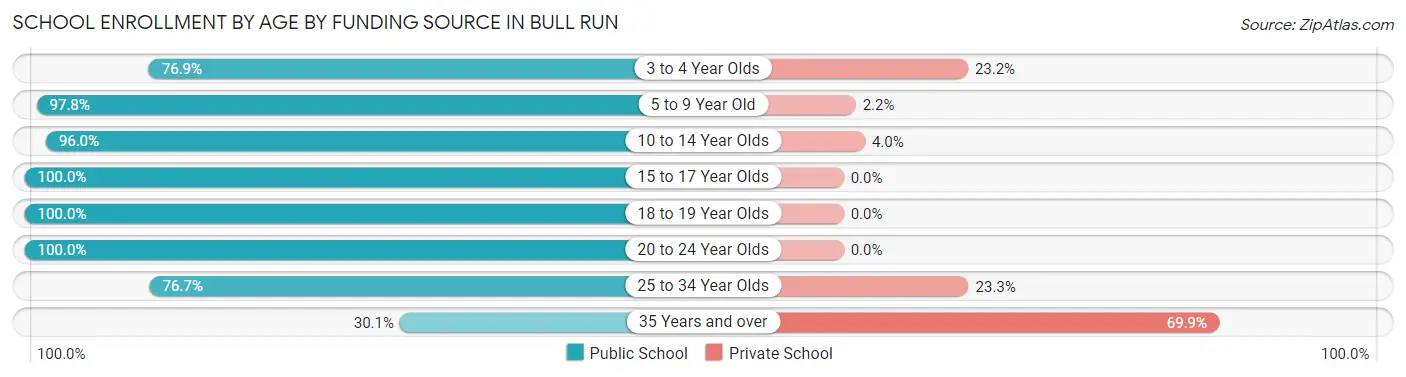
| Age Bracket | Public School | Private School |
| 3 to 4 Year Olds | 239 (76.8%) | 72 (23.2%) |
| 5 to 9 Year Old | 1,134 (97.8%) | 26 (2.2%) |
| 10 to 14 Year Olds | 822 (96.0%) | 34 (4.0%) |
| 15 to 17 Year Olds | 483 (100.0%) | 0 (0.0%) |
| 18 to 19 Year Olds | 173 (100.0%) | 0 (0.0%) |
| 20 to 24 Year Olds | 508 (100.0%) | 0 (0.0%) |
| 25 to 34 Year Olds | 244 (76.7%) | 74 (23.3%) |
| 35 Years and over | 147 (30.1%) | 341 (69.9%) |
| Total | 3,751 (87.3%) | 546 (12.7%) |
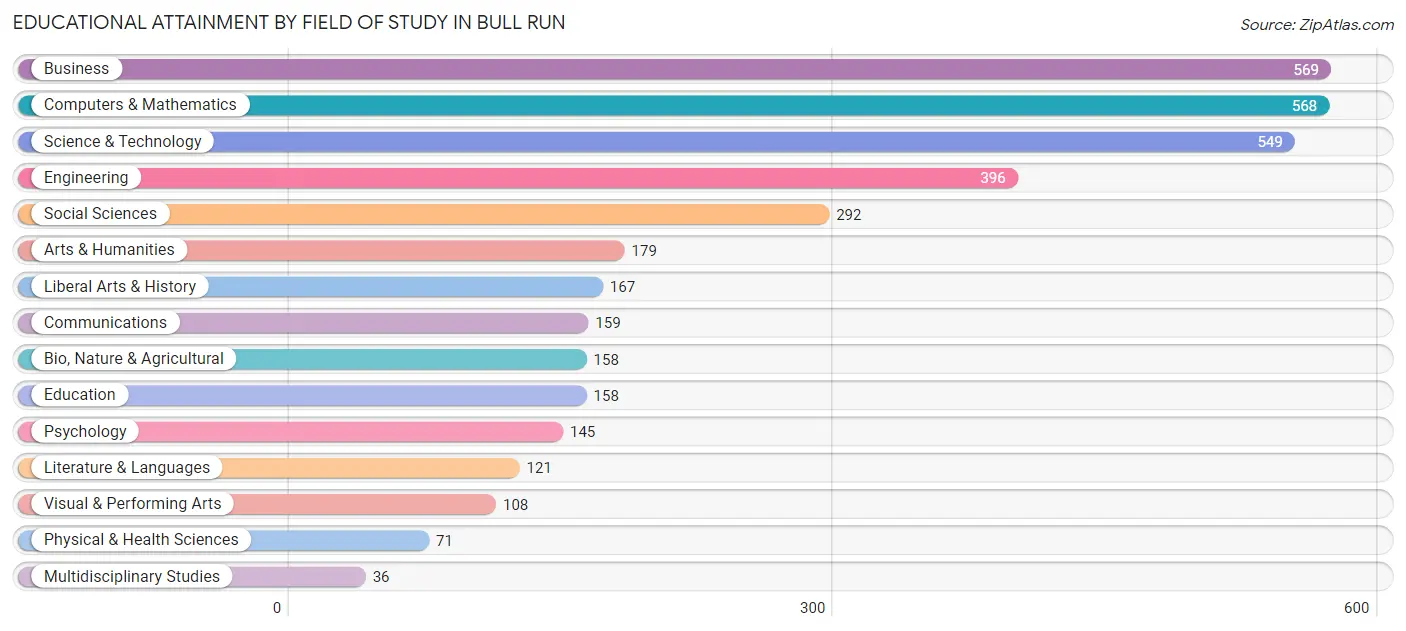
Educational Attainment by Field of Study in Bull Run
Business (569 | 15.5%), computers & mathematics (568 | 15.4%), science & technology (549 | 14.9%), engineering (396 | 10.8%), and social sciences (292 | 7.9%) are the most common fields of study among 3,676 individuals in Bull Run who have obtained a bachelor's degree or higher.
| Field of Study | # Graduates | % Graduates |
| Computers & Mathematics | 568 | 15.4% |
| Bio, Nature & Agricultural | 158 | 4.3% |
| Physical & Health Sciences | 71 | 1.9% |
| Psychology | 145 | 3.9% |
| Social Sciences | 292 | 7.9% |
| Engineering | 396 | 10.8% |
| Multidisciplinary Studies | 36 | 1.0% |
| Science & Technology | 549 | 14.9% |
| Business | 569 | 15.5% |
| Education | 158 | 4.3% |
| Literature & Languages | 121 | 3.3% |
| Liberal Arts & History | 167 | 4.5% |
| Visual & Performing Arts | 108 | 2.9% |
| Communications | 159 | 4.3% |
| Arts & Humanities | 179 | 4.9% |
| Total | 3,676 | 100.0% |
Transportation & Commute in Bull Run
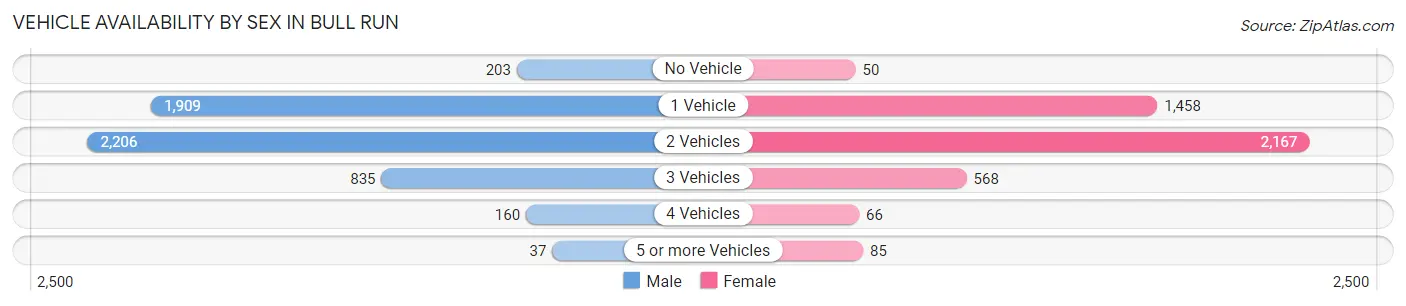
Vehicle Availability by Sex in Bull Run
The most prevalent vehicle ownership categories in Bull Run are males with 2 vehicles (2,206, accounting for 41.2%) and females with 2 vehicles (2,167, making up 50.2%).
| Vehicles Available | Male | Female |
| No Vehicle | 203 (3.8%) | 50 (1.1%) |
| 1 Vehicle | 1,909 (35.7%) | 1,458 (33.2%) |
| 2 Vehicles | 2,206 (41.2%) | 2,167 (49.3%) |
| 3 Vehicles | 835 (15.6%) | 568 (12.9%) |
| 4 Vehicles | 160 (3.0%) | 66 (1.5%) |
| 5 or more Vehicles | 37 (0.7%) | 85 (1.9%) |
| Total | 5,350 (100.0%) | 4,394 (100.0%) |
Commute Time in Bull Run
The most frequently occuring commute durations in Bull Run are 30 to 34 minutes (1,327 commuters, 15.0%), 10 to 14 minutes (1,316 commuters, 14.9%), and 60 to 89 minutes (1,286 commuters, 14.5%).
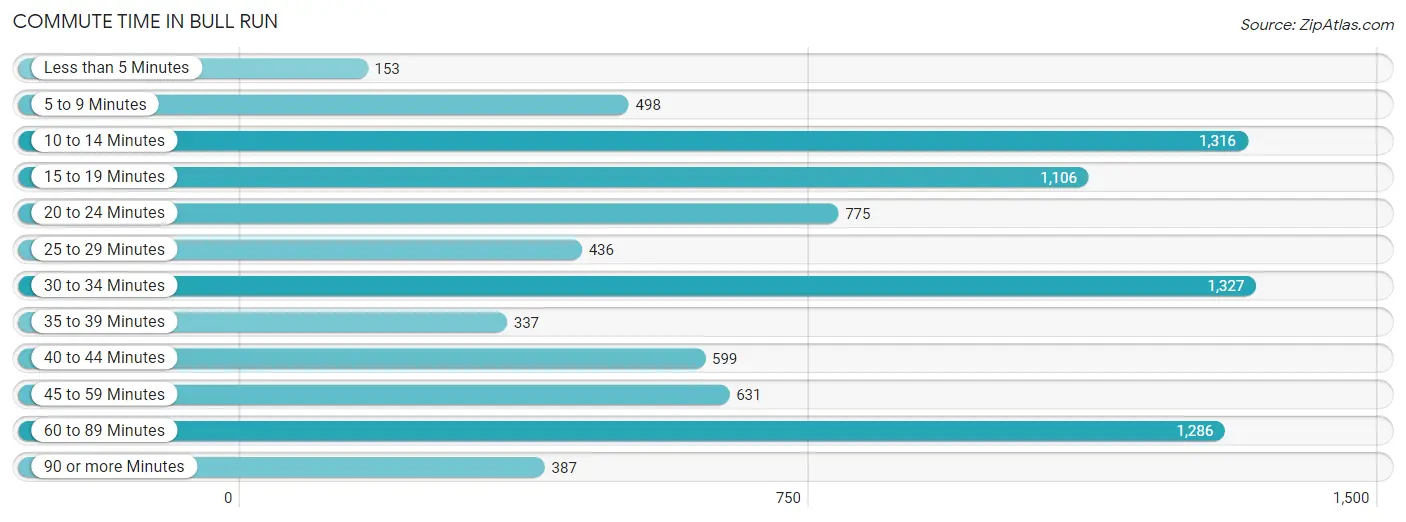
| Commute Time | # Commuters | % Commuters |
| Less than 5 Minutes | 153 | 1.7% |
| 5 to 9 Minutes | 498 | 5.6% |
| 10 to 14 Minutes | 1,316 | 14.9% |
| 15 to 19 Minutes | 1,106 | 12.5% |
| 20 to 24 Minutes | 775 | 8.8% |
| 25 to 29 Minutes | 436 | 4.9% |
| 30 to 34 Minutes | 1,327 | 15.0% |
| 35 to 39 Minutes | 337 | 3.8% |
| 40 to 44 Minutes | 599 | 6.8% |
| 45 to 59 Minutes | 631 | 7.1% |
| 60 to 89 Minutes | 1,286 | 14.5% |
| 90 or more Minutes | 387 | 4.4% |
Commute Time by Sex in Bull Run
The most common commute times in Bull Run are 60 to 89 minutes (962 commuters, 19.4%) for males and 10 to 14 minutes (687 commuters, 17.6%) for females.
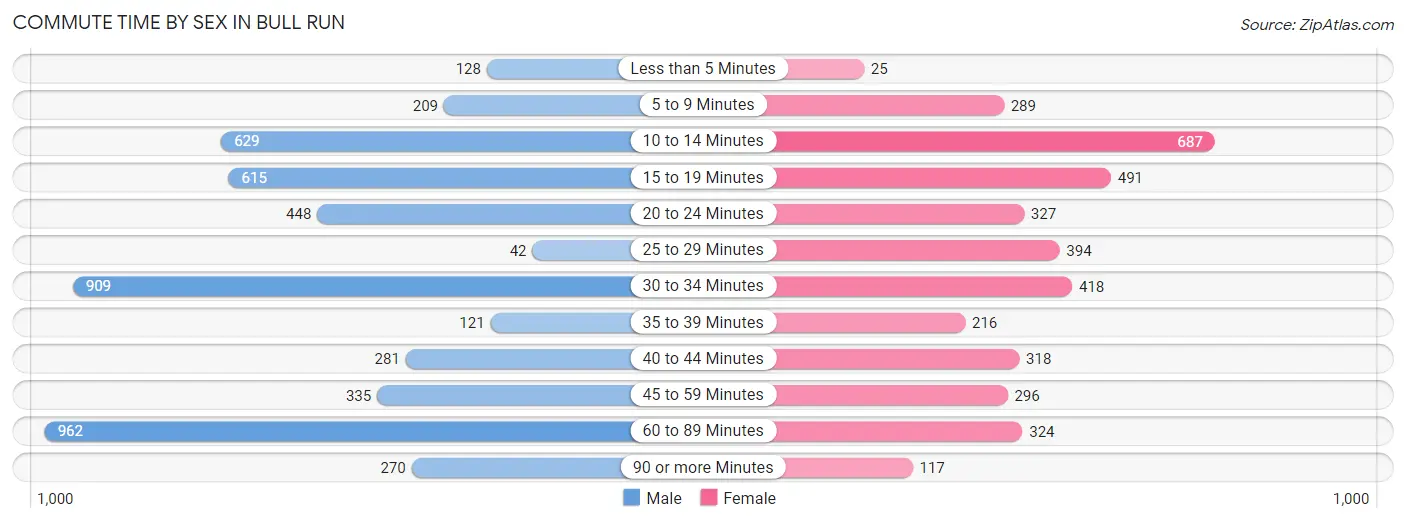
| Commute Time | Male | Female |
| Less than 5 Minutes | 128 (2.6%) | 25 (0.6%) |
| 5 to 9 Minutes | 209 (4.2%) | 289 (7.4%) |
| 10 to 14 Minutes | 629 (12.7%) | 687 (17.6%) |
| 15 to 19 Minutes | 615 (12.4%) | 491 (12.6%) |
| 20 to 24 Minutes | 448 (9.0%) | 327 (8.4%) |
| 25 to 29 Minutes | 42 (0.9%) | 394 (10.1%) |
| 30 to 34 Minutes | 909 (18.4%) | 418 (10.7%) |
| 35 to 39 Minutes | 121 (2.4%) | 216 (5.5%) |
| 40 to 44 Minutes | 281 (5.7%) | 318 (8.2%) |
| 45 to 59 Minutes | 335 (6.8%) | 296 (7.6%) |
| 60 to 89 Minutes | 962 (19.4%) | 324 (8.3%) |
| 90 or more Minutes | 270 (5.5%) | 117 (3.0%) |
Time of Departure to Work by Sex in Bull Run
The most frequent times of departure to work in Bull Run are 5:00 AM to 5:29 AM (867, 17.5%) for males and 7:00 AM to 7:29 AM (538, 13.8%) for females.
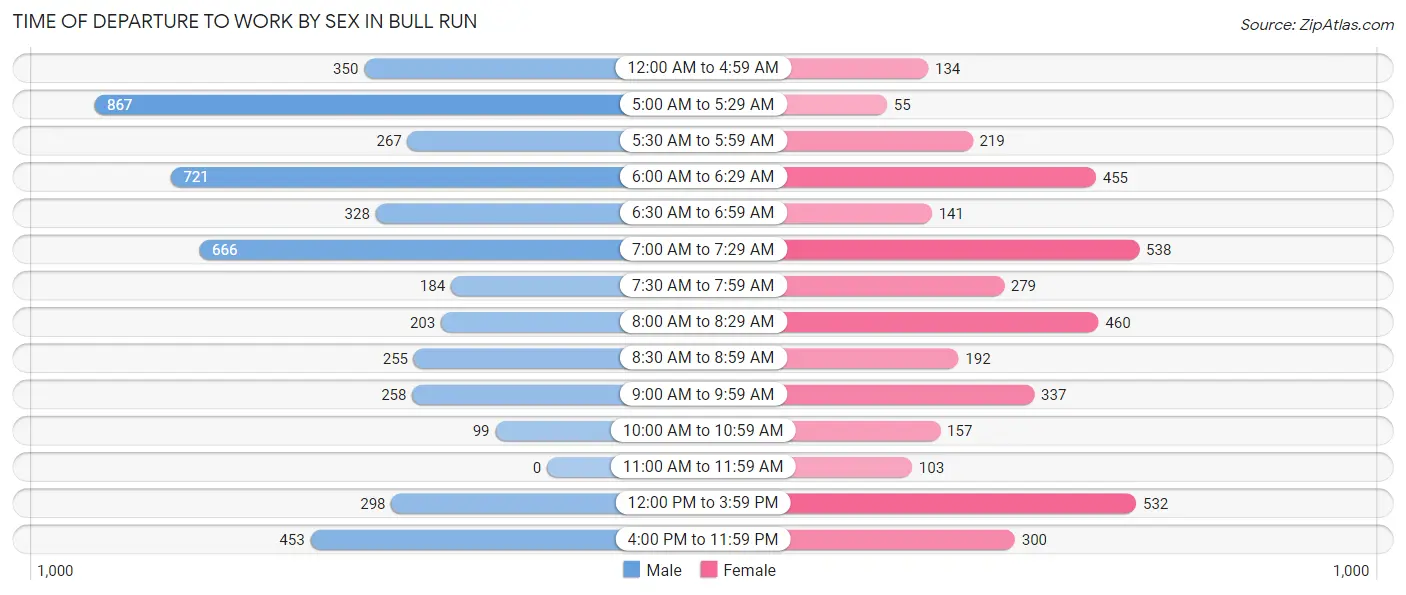
| Time of Departure | Male | Female |
| 12:00 AM to 4:59 AM | 350 (7.1%) | 134 (3.4%) |
| 5:00 AM to 5:29 AM | 867 (17.5%) | 55 (1.4%) |
| 5:30 AM to 5:59 AM | 267 (5.4%) | 219 (5.6%) |
| 6:00 AM to 6:29 AM | 721 (14.6%) | 455 (11.7%) |
| 6:30 AM to 6:59 AM | 328 (6.6%) | 141 (3.6%) |
| 7:00 AM to 7:29 AM | 666 (13.5%) | 538 (13.8%) |
| 7:30 AM to 7:59 AM | 184 (3.7%) | 279 (7.1%) |
| 8:00 AM to 8:29 AM | 203 (4.1%) | 460 (11.8%) |
| 8:30 AM to 8:59 AM | 255 (5.1%) | 192 (4.9%) |
| 9:00 AM to 9:59 AM | 258 (5.2%) | 337 (8.6%) |
| 10:00 AM to 10:59 AM | 99 (2.0%) | 157 (4.0%) |
| 11:00 AM to 11:59 AM | 0 (0.0%) | 103 (2.6%) |
| 12:00 PM to 3:59 PM | 298 (6.0%) | 532 (13.6%) |
| 4:00 PM to 11:59 PM | 453 (9.1%) | 300 (7.7%) |
| Total | 4,949 (100.0%) | 3,902 (100.0%) |
Housing Occupancy in Bull Run
Occupancy by Ownership in Bull Run
Of the total 2,133 dwellings in Bull Run, owner-occupied units account for 2,033 (95.3%), while renter-occupied units make up 100 (4.7%).
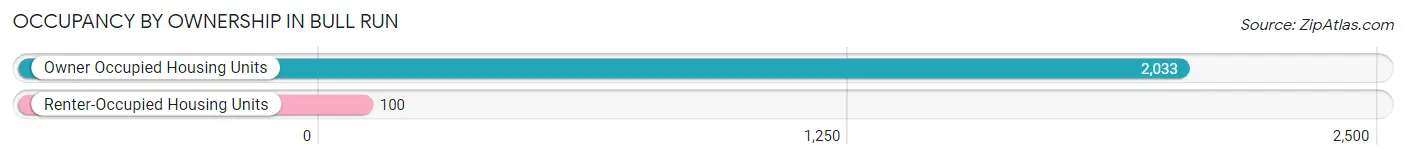
| Occupancy | # Housing Units | % Housing Units |
| Owner Occupied Housing Units | 2,033 | 95.3% |
| Renter-Occupied Housing Units | 100 | 4.7% |
| Total Occupied Housing Units | 2,133 | 100.0% |
Occupancy by Household Size in Bull Run
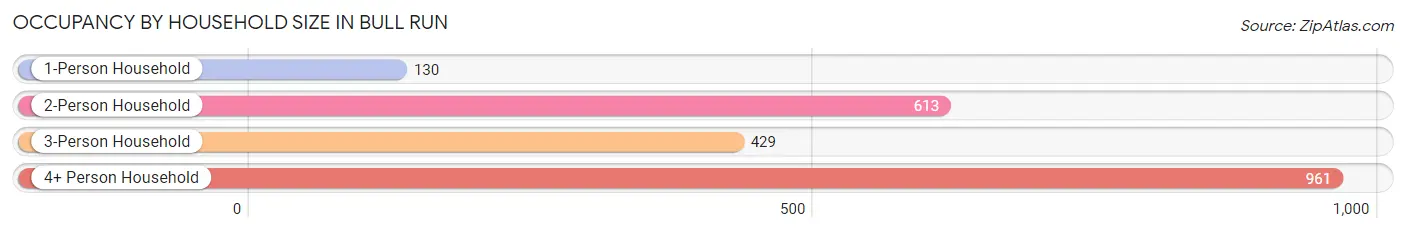
| Household Size | # Housing Units | % Housing Units |
| 1-Person Household | 130 | 6.1% |
| 2-Person Household | 613 | 28.7% |
| 3-Person Household | 429 | 20.1% |
| 4+ Person Household | 961 | 45.1% |
| Total Housing Units | 2,133 | 100.0% |
Occupancy by Ownership by Household Size in Bull Run
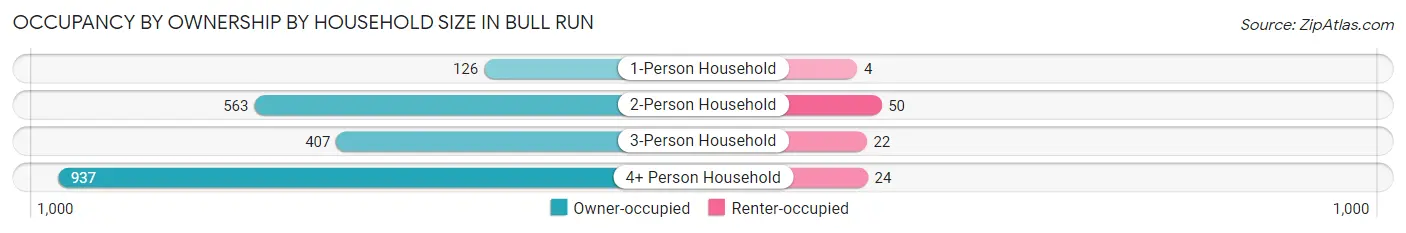
| Household Size | Owner-occupied | Renter-occupied |
| 1-Person Household | 126 (96.9%) | 4 (3.1%) |
| 2-Person Household | 563 (91.8%) | 50 (8.2%) |
| 3-Person Household | 407 (94.9%) | 22 (5.1%) |
| 4+ Person Household | 937 (97.5%) | 24 (2.5%) |
| Total Housing Units | 2,033 (95.3%) | 100 (4.7%) |
Occupancy by Educational Attainment in Bull Run
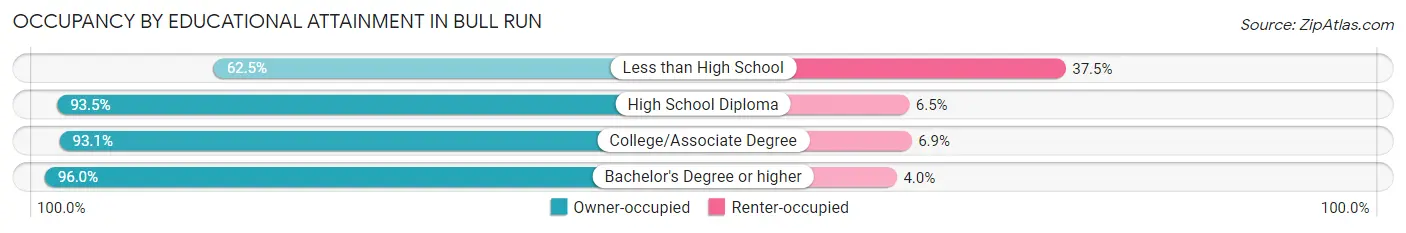
| Household Size | Owner-occupied | Renter-occupied |
| Less than High School | 10 (62.5%) | 6 (37.5%) |
| High School Diploma | 101 (93.5%) | 7 (6.5%) |
| College/Associate Degree | 201 (93.1%) | 15 (6.9%) |
| Bachelor's Degree or higher | 1,721 (96.0%) | 72 (4.0%) |
Occupancy by Age of Householder in Bull Run
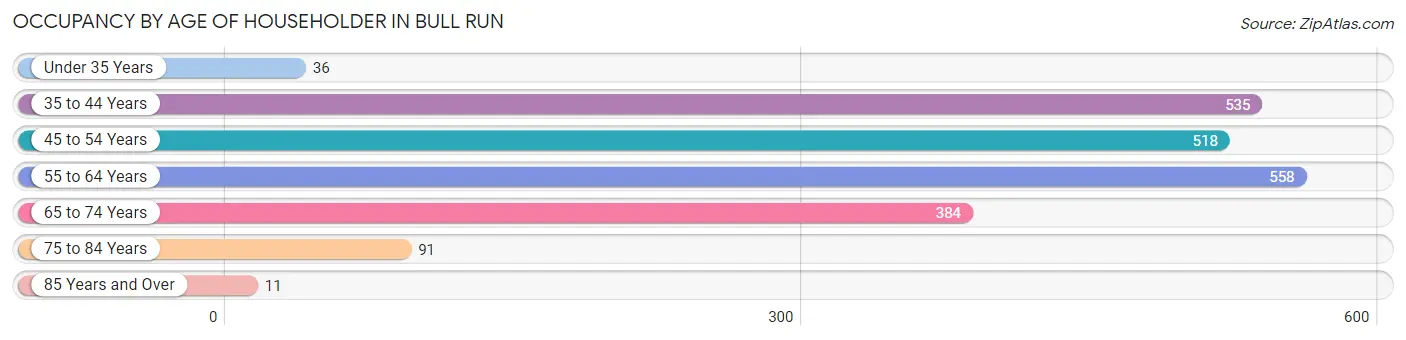
| Age Bracket | # Households | % Households |
| Under 35 Years | 36 | 1.7% |
| 35 to 44 Years | 535 | 25.1% |
| 45 to 54 Years | 518 | 24.3% |
| 55 to 64 Years | 558 | 26.2% |
| 65 to 74 Years | 384 | 18.0% |
| 75 to 84 Years | 91 | 4.3% |
| 85 Years and Over | 11 | 0.5% |
| Total | 2,133 | 100.0% |
Housing Finances in Bull Run
Median Income by Occupancy in Bull Run
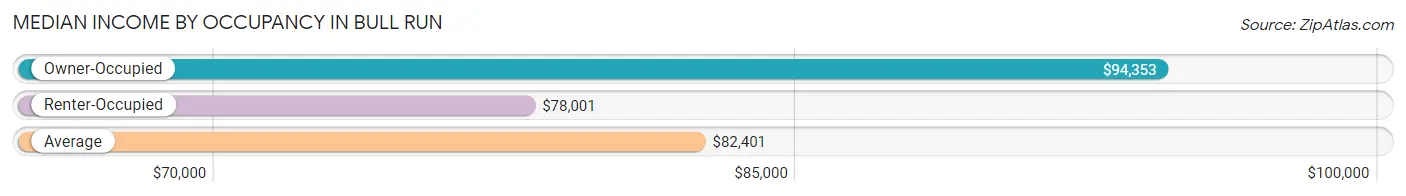
| Occupancy Type | # Households | Median Income |
| Owner-Occupied | 2,090 (33.2%) | $94,353 |
| Renter-Occupied | 4,205 (66.8%) | $78,001 |
| Average | 6,295 (100.0%) | $82,401 |
Occupancy by Householder Income Bracket in Bull Run
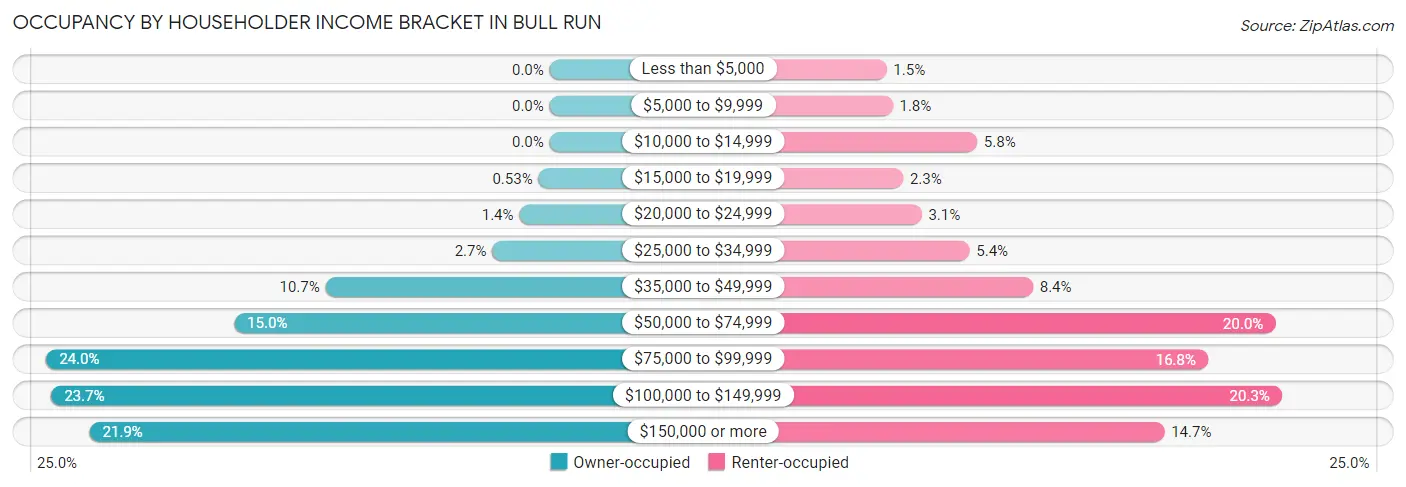
| Income Bracket | Owner-occupied | Renter-occupied |
| Less than $5,000 | 0 (0.0%) | 62 (1.5%) |
| $5,000 to $9,999 | 0 (0.0%) | 74 (1.8%) |
| $10,000 to $14,999 | 0 (0.0%) | 243 (5.8%) |
| $15,000 to $19,999 | 11 (0.5%) | 95 (2.3%) |
| $20,000 to $24,999 | 30 (1.4%) | 132 (3.1%) |
| $25,000 to $34,999 | 57 (2.7%) | 228 (5.4%) |
| $35,000 to $49,999 | 223 (10.7%) | 355 (8.4%) |
| $50,000 to $74,999 | 314 (15.0%) | 840 (20.0%) |
| $75,000 to $99,999 | 501 (24.0%) | 705 (16.8%) |
| $100,000 to $149,999 | 496 (23.7%) | 853 (20.3%) |
| $150,000 or more | 458 (21.9%) | 618 (14.7%) |
| Total | 2,090 (100.0%) | 4,205 (100.0%) |
Monthly Housing Cost Tiers in Bull Run
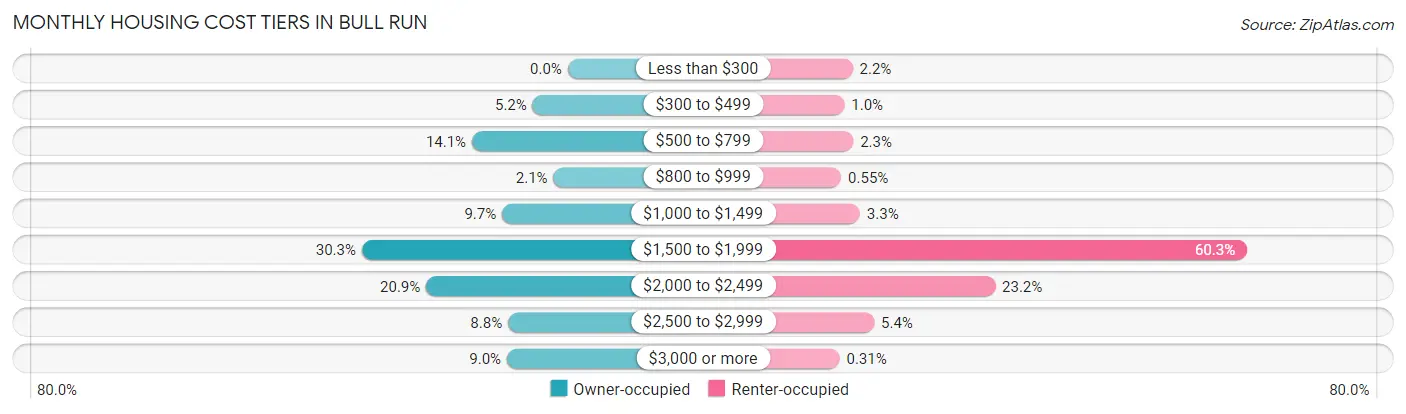
| Monthly Cost | Owner-occupied | Renter-occupied |
| Less than $300 | 0 (0.0%) | 94 (2.2%) |
| $300 to $499 | 108 (5.2%) | 43 (1.0%) |
| $500 to $799 | 295 (14.1%) | 98 (2.3%) |
| $800 to $999 | 44 (2.1%) | 23 (0.5%) |
| $1,000 to $1,499 | 202 (9.7%) | 139 (3.3%) |
| $1,500 to $1,999 | 634 (30.3%) | 2,537 (60.3%) |
| $2,000 to $2,499 | 436 (20.9%) | 977 (23.2%) |
| $2,500 to $2,999 | 184 (8.8%) | 227 (5.4%) |
| $3,000 or more | 187 (8.9%) | 13 (0.3%) |
| Total | 2,090 (100.0%) | 4,205 (100.0%) |
Physical Housing Characteristics in Bull Run
Housing Structures in Bull Run
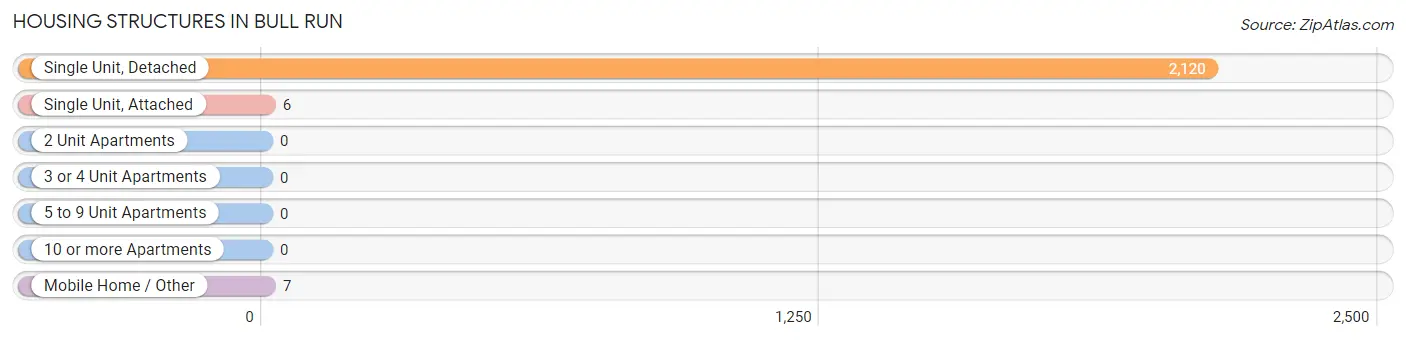
| Structure Type | # Housing Units | % Housing Units |
| Single Unit, Detached | 2,120 | 99.4% |
| Single Unit, Attached | 6 | 0.3% |
| 2 Unit Apartments | 0 | 0.0% |
| 3 or 4 Unit Apartments | 0 | 0.0% |
| 5 to 9 Unit Apartments | 0 | 0.0% |
| 10 or more Apartments | 0 | 0.0% |
| Mobile Home / Other | 7 | 0.3% |
| Total | 2,133 | 100.0% |
Housing Structures by Occupancy in Bull Run
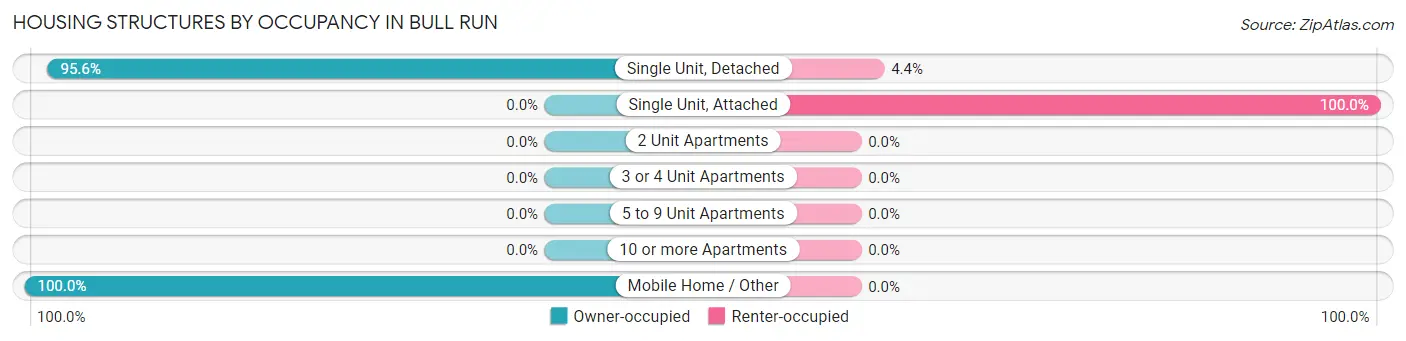
| Structure Type | Owner-occupied | Renter-occupied |
| Single Unit, Detached | 2,026 (95.6%) | 94 (4.4%) |
| Single Unit, Attached | 0 (0.0%) | 6 (100.0%) |
| 2 Unit Apartments | 0 (0.0%) | 0 (0.0%) |
| 3 or 4 Unit Apartments | 0 (0.0%) | 0 (0.0%) |
| 5 to 9 Unit Apartments | 0 (0.0%) | 0 (0.0%) |
| 10 or more Apartments | 0 (0.0%) | 0 (0.0%) |
| Mobile Home / Other | 7 (100.0%) | 0 (0.0%) |
| Total | 2,033 (95.3%) | 100 (4.7%) |
Housing Structures by Number of Rooms in Bull Run
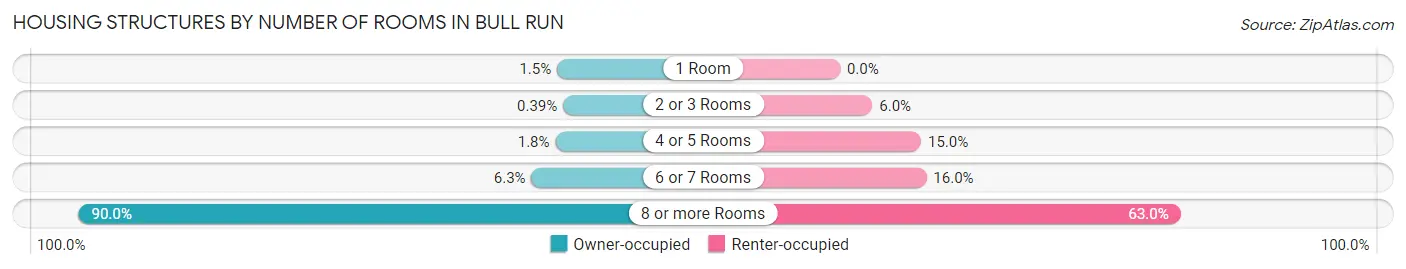
| Number of Rooms | Owner-occupied | Renter-occupied |
| 1 Room | 31 (1.5%) | 0 (0.0%) |
| 2 or 3 Rooms | 8 (0.4%) | 6 (6.0%) |
| 4 or 5 Rooms | 37 (1.8%) | 15 (15.0%) |
| 6 or 7 Rooms | 127 (6.2%) | 16 (16.0%) |
| 8 or more Rooms | 1,830 (90.0%) | 63 (63.0%) |
| Total | 2,033 (100.0%) | 100 (100.0%) |
Housing Structure by Heating Type in Bull Run
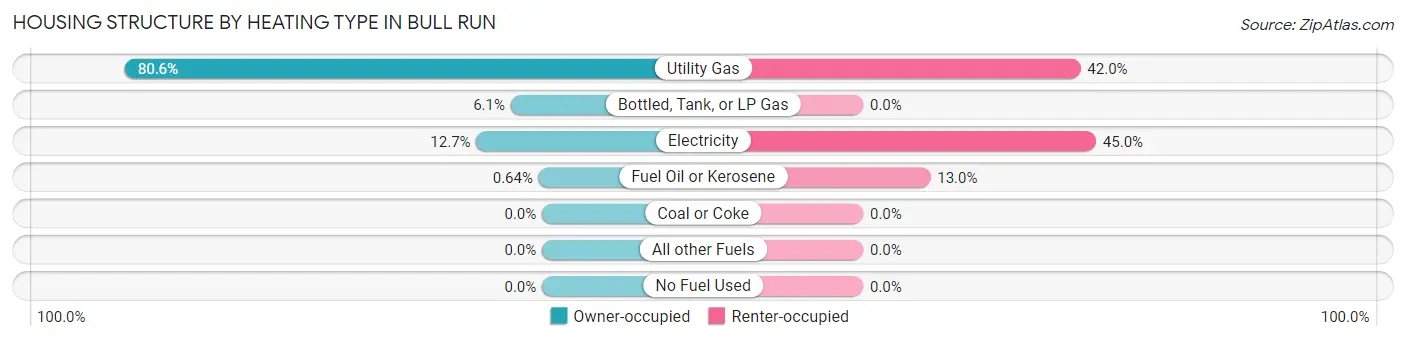
| Heating Type | Owner-occupied | Renter-occupied |
| Utility Gas | 1,639 (80.6%) | 42 (42.0%) |
| Bottled, Tank, or LP Gas | 123 (6.0%) | 0 (0.0%) |
| Electricity | 258 (12.7%) | 45 (45.0%) |
| Fuel Oil or Kerosene | 13 (0.6%) | 13 (13.0%) |
| Coal or Coke | 0 (0.0%) | 0 (0.0%) |
| All other Fuels | 0 (0.0%) | 0 (0.0%) |
| No Fuel Used | 0 (0.0%) | 0 (0.0%) |
| Total | 2,033 (100.0%) | 100 (100.0%) |
Household Vehicle Usage in Bull Run
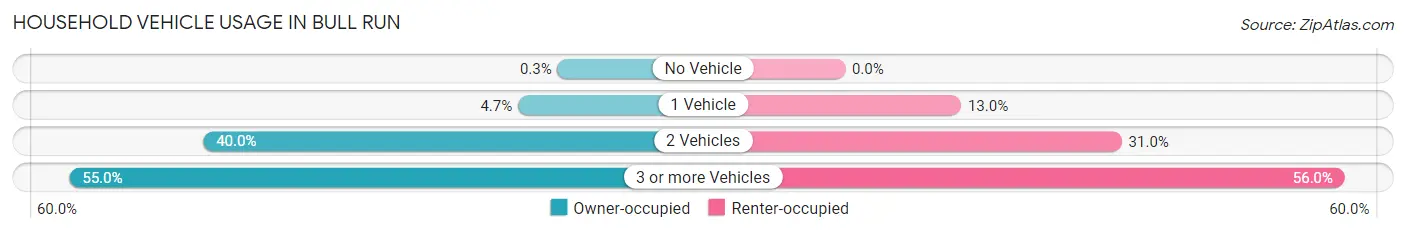
| Vehicles per Household | Owner-occupied | Renter-occupied |
| No Vehicle | 6 (0.3%) | 0 (0.0%) |
| 1 Vehicle | 96 (4.7%) | 13 (13.0%) |
| 2 Vehicles | 813 (40.0%) | 31 (31.0%) |
| 3 or more Vehicles | 1,118 (55.0%) | 56 (56.0%) |
| Total | 2,033 (100.0%) | 100 (100.0%) |
Real Estate & Mortgages in Bull Run
Real Estate and Mortgage Overview in Bull Run
| Characteristic | Without Mortgage | With Mortgage |
| Housing Units | 448 | 1,644 |
| Median Property Value | $808,900 | $328,000 |
| Median Household Income | $174,000 | $369 |
| Monthly Housing Costs | $1,136 | $187 |
| Real Estate Taxes | $8,249 | $27 |
Property Value by Mortgage Status in Bull Run
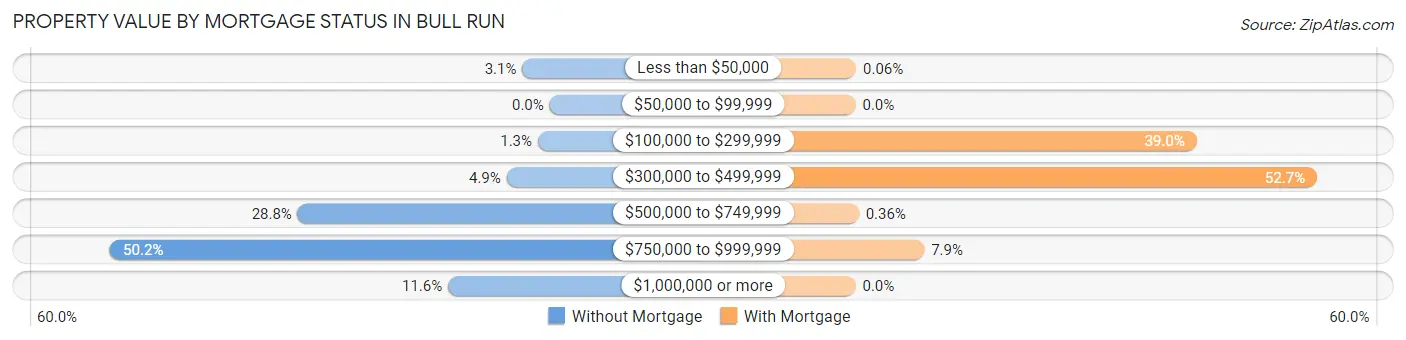
| Property Value | Without Mortgage | With Mortgage |
| Less than $50,000 | 14 (3.1%) | 1 (0.1%) |
| $50,000 to $99,999 | 0 (0.0%) | 0 (0.0%) |
| $100,000 to $299,999 | 6 (1.3%) | 641 (39.0%) |
| $300,000 to $499,999 | 22 (4.9%) | 867 (52.7%) |
| $500,000 to $749,999 | 129 (28.8%) | 6 (0.4%) |
| $750,000 to $999,999 | 225 (50.2%) | 129 (7.9%) |
| $1,000,000 or more | 52 (11.6%) | 0 (0.0%) |
| Total | 448 (100.0%) | 1,644 (100.0%) |
Household Income by Mortgage Status in Bull Run
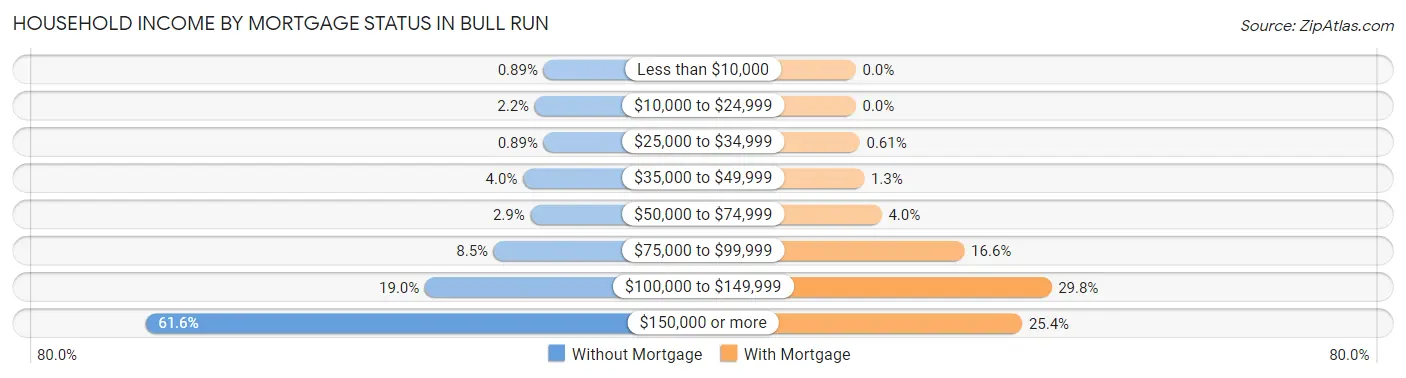
| Household Income | Without Mortgage | With Mortgage |
| Less than $10,000 | 4 (0.9%) | 0 (0.0%) |
| $10,000 to $24,999 | 10 (2.2%) | 0 (0.0%) |
| $25,000 to $34,999 | 4 (0.9%) | 10 (0.6%) |
| $35,000 to $49,999 | 18 (4.0%) | 21 (1.3%) |
| $50,000 to $74,999 | 13 (2.9%) | 65 (4.0%) |
| $75,000 to $99,999 | 38 (8.5%) | 272 (16.6%) |
| $100,000 to $149,999 | 85 (19.0%) | 490 (29.8%) |
| $150,000 or more | 276 (61.6%) | 417 (25.4%) |
| Total | 448 (100.0%) | 1,644 (100.0%) |
Property Value to Household Income Ratio in Bull Run
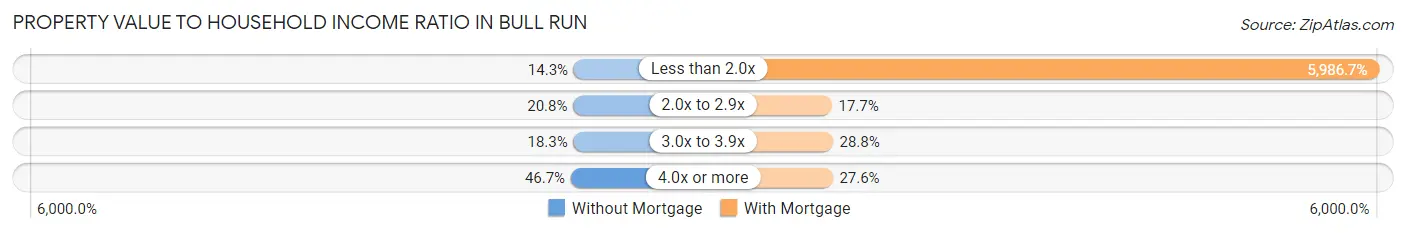
| Value-to-Income Ratio | Without Mortgage | With Mortgage |
| Less than 2.0x | 64 (14.3%) | 98,421 (5,986.7%) |
| 2.0x to 2.9x | 93 (20.8%) | 291 (17.7%) |
| 3.0x to 3.9x | 82 (18.3%) | 473 (28.8%) |
| 4.0x or more | 209 (46.7%) | 453 (27.6%) |
| Total | 448 (100.0%) | 1,644 (100.0%) |
Real Estate Taxes by Mortgage Status in Bull Run
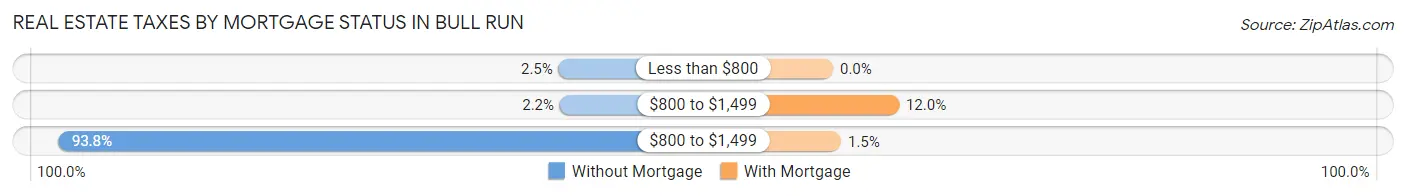
| Property Taxes | Without Mortgage | With Mortgage |
| Less than $800 | 11 (2.5%) | 0 (0.0%) |
| $800 to $1,499 | 10 (2.2%) | 198 (12.0%) |
| $800 to $1,499 | 420 (93.8%) | 24 (1.5%) |
| Total | 448 (100.0%) | 1,644 (100.0%) |
Health & Disability in Bull Run
Health Insurance Coverage by Age in Bull Run
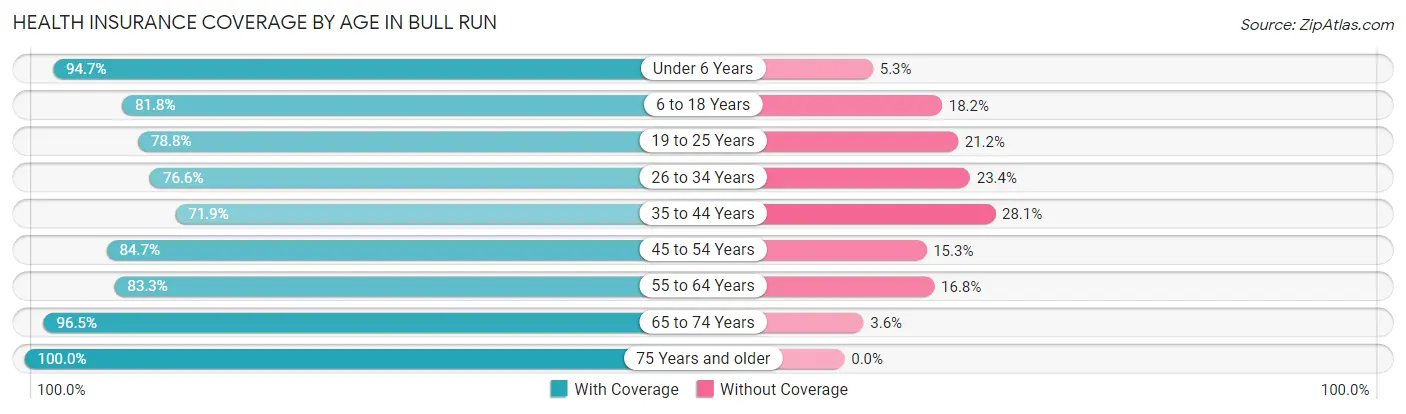
| Age Bracket | With Coverage | Without Coverage |
| Under 6 Years | 1,694 (94.7%) | 95 (5.3%) |
| 6 to 18 Years | 2,106 (81.8%) | 468 (18.2%) |
| 19 to 25 Years | 1,349 (78.8%) | 362 (21.2%) |
| 26 to 34 Years | 2,163 (76.6%) | 661 (23.4%) |
| 35 to 44 Years | 2,286 (71.9%) | 894 (28.1%) |
| 45 to 54 Years | 1,613 (84.7%) | 291 (15.3%) |
| 55 to 64 Years | 1,347 (83.3%) | 271 (16.8%) |
| 65 to 74 Years | 489 (96.5%) | 18 (3.5%) |
| 75 Years and older | 478 (100.0%) | 0 (0.0%) |
| Total | 13,525 (81.6%) | 3,060 (18.4%) |
Health Insurance Coverage by Citizenship Status in Bull Run
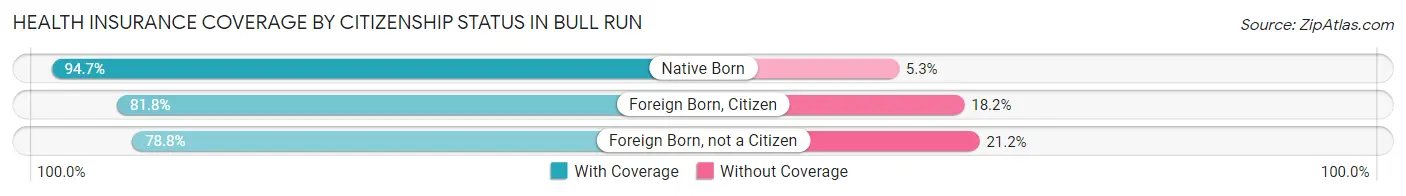
| Citizenship Status | With Coverage | Without Coverage |
| Native Born | 1,694 (94.7%) | 95 (5.3%) |
| Foreign Born, Citizen | 2,106 (81.8%) | 468 (18.2%) |
| Foreign Born, not a Citizen | 1,349 (78.8%) | 362 (21.2%) |
Health Insurance Coverage by Household Income in Bull Run
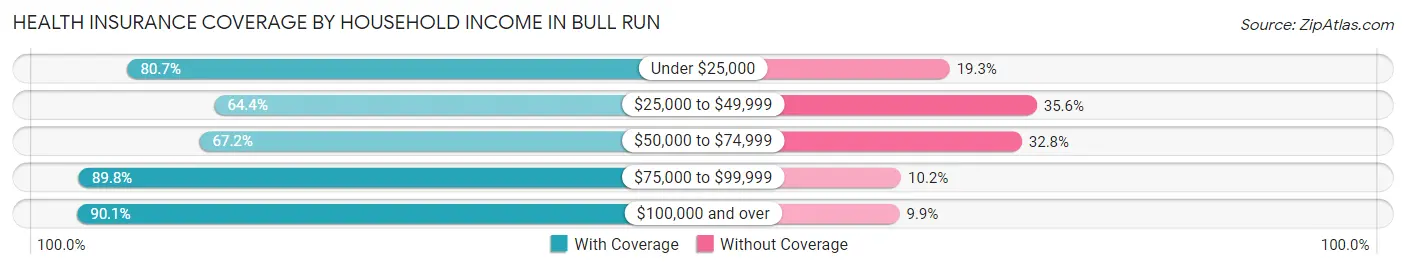
| Household Income | With Coverage | Without Coverage |
| Under $25,000 | 833 (80.7%) | 199 (19.3%) |
| $25,000 to $49,999 | 1,377 (64.4%) | 761 (35.6%) |
| $50,000 to $74,999 | 2,239 (67.2%) | 1,093 (32.8%) |
| $75,000 to $99,999 | 2,806 (89.8%) | 318 (10.2%) |
| $100,000 and over | 6,268 (90.1%) | 687 (9.9%) |
Public vs Private Health Insurance Coverage by Age in Bull Run
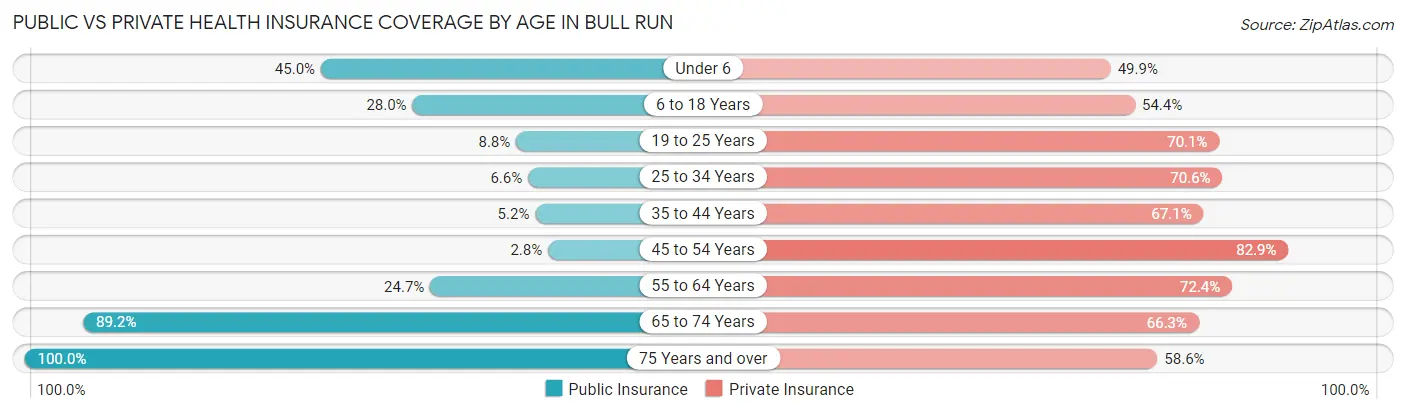
| Age Bracket | Public Insurance | Private Insurance |
| Under 6 | 805 (45.0%) | 893 (49.9%) |
| 6 to 18 Years | 721 (28.0%) | 1,401 (54.4%) |
| 19 to 25 Years | 150 (8.8%) | 1,199 (70.1%) |
| 25 to 34 Years | 185 (6.6%) | 1,995 (70.6%) |
| 35 to 44 Years | 166 (5.2%) | 2,135 (67.1%) |
| 45 to 54 Years | 54 (2.8%) | 1,578 (82.9%) |
| 55 to 64 Years | 400 (24.7%) | 1,172 (72.4%) |
| 65 to 74 Years | 452 (89.1%) | 336 (66.3%) |
| 75 Years and over | 478 (100.0%) | 280 (58.6%) |
| Total | 3,411 (20.6%) | 10,989 (66.3%) |
Disability Status by Sex by Age in Bull Run
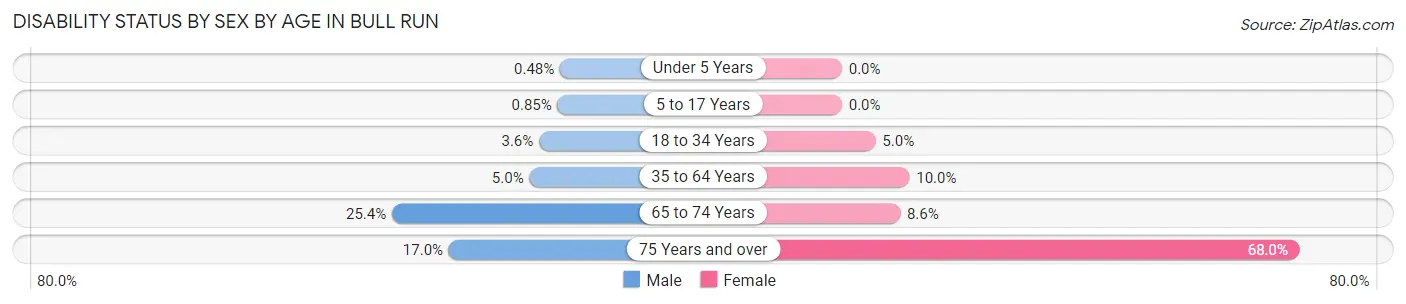
| Age Bracket | Male | Female |
| Under 5 Years | 3 (0.5%) | 0 (0.0%) |
| 5 to 17 Years | 11 (0.9%) | 0 (0.0%) |
| 18 to 34 Years | 77 (3.6%) | 125 (5.0%) |
| 35 to 64 Years | 170 (5.0%) | 333 (10.0%) |
| 65 to 74 Years | 73 (25.4%) | 19 (8.6%) |
| 75 Years and over | 26 (17.0%) | 221 (68.0%) |
Disability Class by Sex by Age in Bull Run
Disability Class: Hearing Difficulty
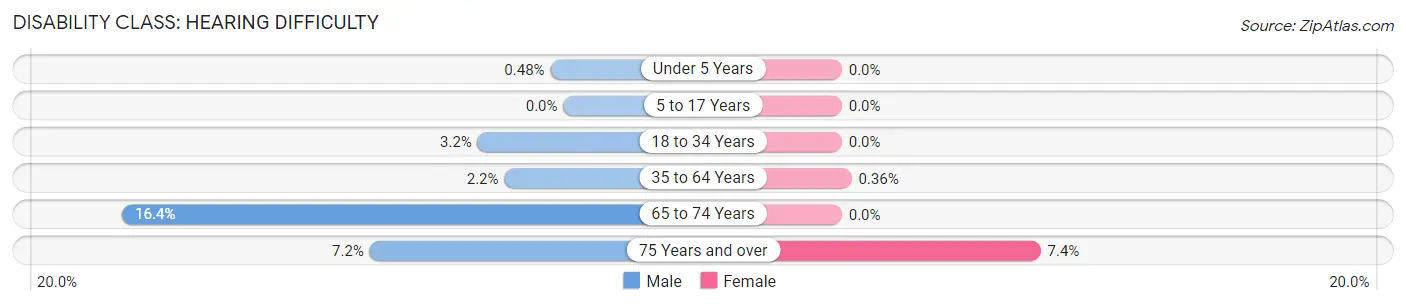
| Age Bracket | Male | Female |
| Under 5 Years | 3 (0.5%) | 0 (0.0%) |
| 5 to 17 Years | 0 (0.0%) | 0 (0.0%) |
| 18 to 34 Years | 68 (3.2%) | 0 (0.0%) |
| 35 to 64 Years | 74 (2.2%) | 12 (0.4%) |
| 65 to 74 Years | 47 (16.4%) | 0 (0.0%) |
| 75 Years and over | 11 (7.2%) | 24 (7.4%) |
Disability Class: Vision Difficulty
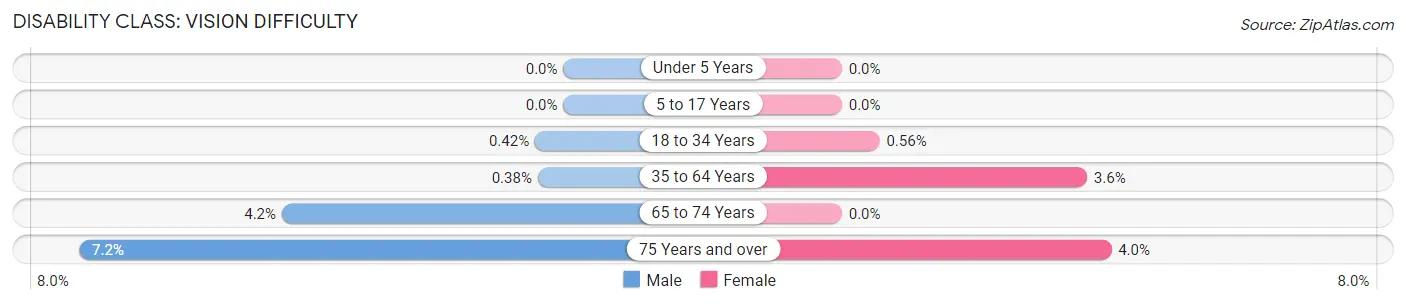
| Age Bracket | Male | Female |
| Under 5 Years | 0 (0.0%) | 0 (0.0%) |
| 5 to 17 Years | 0 (0.0%) | 0 (0.0%) |
| 18 to 34 Years | 9 (0.4%) | 14 (0.6%) |
| 35 to 64 Years | 13 (0.4%) | 121 (3.6%) |
| 65 to 74 Years | 12 (4.2%) | 0 (0.0%) |
| 75 Years and over | 11 (7.2%) | 13 (4.0%) |
Disability Class: Cognitive Difficulty
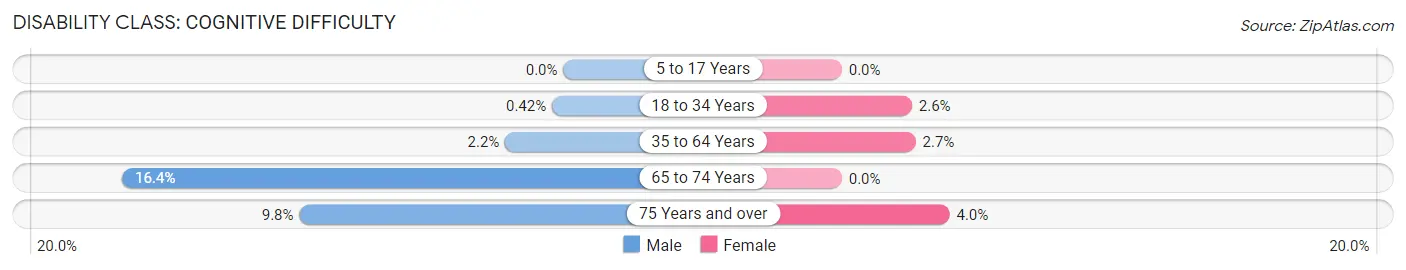
| Age Bracket | Male | Female |
| 5 to 17 Years | 0 (0.0%) | 0 (0.0%) |
| 18 to 34 Years | 9 (0.4%) | 65 (2.6%) |
| 35 to 64 Years | 73 (2.2%) | 91 (2.7%) |
| 65 to 74 Years | 47 (16.4%) | 0 (0.0%) |
| 75 Years and over | 15 (9.8%) | 13 (4.0%) |
Disability Class: Ambulatory Difficulty
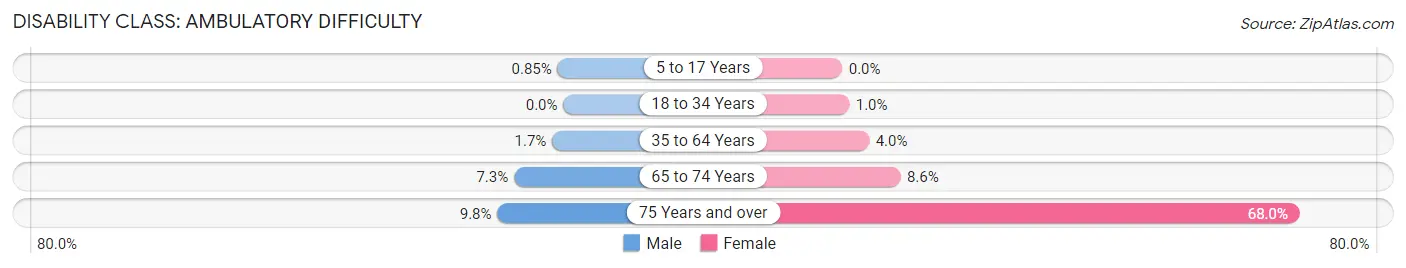
| Age Bracket | Male | Female |
| 5 to 17 Years | 11 (0.9%) | 0 (0.0%) |
| 18 to 34 Years | 0 (0.0%) | 26 (1.0%) |
| 35 to 64 Years | 56 (1.7%) | 133 (4.0%) |
| 65 to 74 Years | 21 (7.3%) | 19 (8.6%) |
| 75 Years and over | 15 (9.8%) | 221 (68.0%) |
Disability Class: Self-Care Difficulty
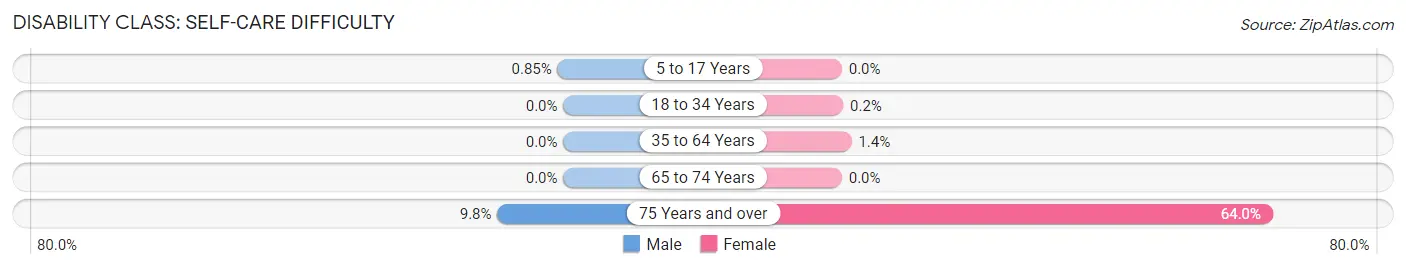
| Age Bracket | Male | Female |
| 5 to 17 Years | 11 (0.9%) | 0 (0.0%) |
| 18 to 34 Years | 0 (0.0%) | 5 (0.2%) |
| 35 to 64 Years | 0 (0.0%) | 48 (1.4%) |
| 65 to 74 Years | 0 (0.0%) | 0 (0.0%) |
| 75 Years and over | 15 (9.8%) | 208 (64.0%) |
Technology Access in Bull Run
Computing Device Access in Bull Run
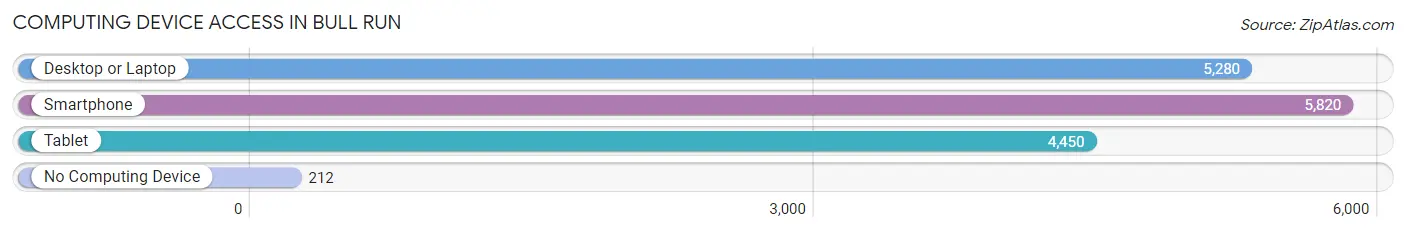
| Device Type | # Households | % Households |
| Desktop or Laptop | 5,280 | 83.9% |
| Smartphone | 5,820 | 92.4% |
| Tablet | 4,450 | 70.7% |
| No Computing Device | 212 | 3.4% |
| Total | 6,295 | 100.0% |
Internet Access in Bull Run
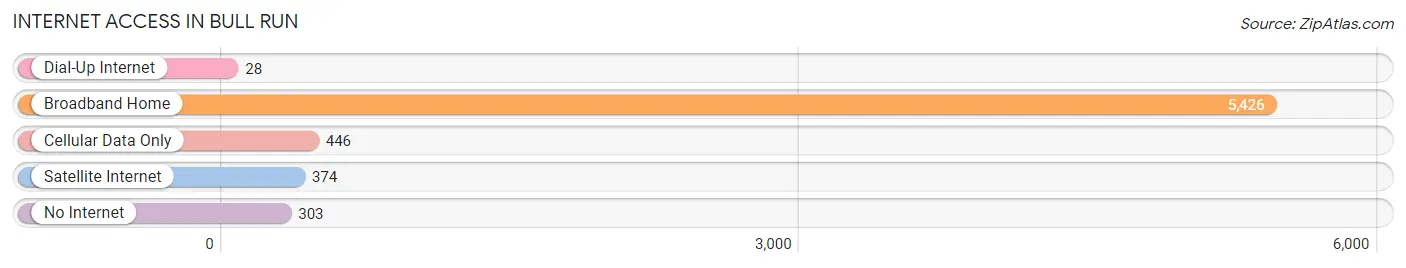
| Internet Type | # Households | % Households |
| Dial-Up Internet | 28 | 0.4% |
| Broadband Home | 5,426 | 86.2% |
| Cellular Data Only | 446 | 7.1% |
| Satellite Internet | 374 | 5.9% |
| No Internet | 303 | 4.8% |
| Total | 6,295 | 100.0% |
Bull Run Summary
Run, Virginia is a small town located in Prince William County, Virginia, about 30 miles southwest of Washington, D.C. It is situated on the banks of Bull Run, a tributary of the Potomac River. The town is best known for its role in the American Civil War, as it was the site of two major battles, the First Battle of Bull Run in 1861 and the Second Battle of Bull Run in 1862.
History
The area around Bull Run has been inhabited since the late 17th century, when it was part of the vast Fairfax Proprietary. The town of Bull Run was established in 1818, and was named after the nearby stream. The town was a small farming community until the outbreak of the Civil War in 1861.
The First Battle of Bull Run was fought on July 21, 1861, and was the first major battle of the Civil War. The Union forces, led by General Irvin McDowell, were defeated by the Confederate forces, led by General Thomas J. Jackson. The battle was a major victory for the Confederacy, and it helped to solidify their control of the region.
The Second Battle of Bull Run was fought on August 28-30, 1862. This battle was a major victory for the Confederate forces, and it helped to secure their control of the region. The Union forces, led by General John Pope, were defeated by the Confederate forces, led by General Robert E. Lee.
After the Civil War, Bull Run was a small farming community. In the late 19th century, the town began to grow as a result of the construction of the Washington and Old Dominion Railroad. The railroad connected the town to Washington, D.C., and it helped to spur economic growth in the area.
Geography
Bull Run is located in Prince William County, Virginia, about 30 miles southwest of Washington, D.C. The town is situated on the banks of Bull Run, a tributary of the Potomac River. The town is surrounded by rolling hills and woodlands, and it is located in the foothills of the Blue Ridge Mountains.
The climate in Bull Run is humid subtropical, with hot, humid summers and mild winters. The average annual temperature is around 60°F, and the average annual precipitation is around 40 inches.
Economy
The economy of Bull Run is largely based on tourism. The town is a popular destination for Civil War enthusiasts, and it is home to several historic sites related to the Civil War. The town is also home to several wineries, and it is a popular destination for wine tasting.
In addition to tourism, the town is also home to several small businesses, including restaurants, shops, and other services. The town is also home to several light industrial businesses, including a printing company and a furniture manufacturer.
Demographics
As of the 2010 census, the population of Bull Run was 1,811. The racial makeup of the town was 87.3% White, 8.2% African American, 0.7% Asian, 0.2% Native American, and 3.6% from other races. The median household income was $68,750, and the median family income was $76,250.
Conclusion
Bull Run, Virginia is a small town located in Prince William County, Virginia, about 30 miles southwest of Washington, D.C. It is best known for its role in the American Civil War, as it was the site of two major battles, the First Battle of Bull Run in 1861 and the Second Battle of Bull Run in 1862. The town is largely based on tourism, and it is home to several historic sites related to the Civil War. The town is also home to several small businesses, including restaurants, shops, and other services. As of the 2010 census, the population of Bull Run was 1,811.
Common Questions
What is Per Capita Income in Bull Run?
Per Capita income in Bull Run is $38,746.
What is the Median Family Income in Bull Run?
Median Family Income in Bull Run is $85,232.
What is the Median Household income in Bull Run?
Median Household Income in Bull Run is $82,401.
What is Income or Wage Gap in Bull Run?
Income or Wage Gap in Bull Run is 58.1%.
Women in Bull Run earn 41.9 cents for every dollar earned by a man.
What is Inequality or Gini Index in Bull Run?
Inequality or Gini Index in Bull Run is 0.38.
What is the Total Population of Bull Run?
Total Population of Bull Run is 16,620.
What is the Total Male Population of Bull Run?
Total Male Population of Bull Run is 7,910.
What is the Total Female Population of Bull Run?
Total Female Population of Bull Run is 8,710.
What is the Ratio of Males per 100 Females in Bull Run?
There are 90.82 Males per 100 Females in Bull Run.
What is the Ratio of Females per 100 Males in Bull Run?
There are 110.11 Females per 100 Males in Bull Run.
What is the Median Population Age in Bull Run?
Median Population Age in Bull Run is 32.4 Years.
What is the Average Family Size in Bull Run
Average Family Size in Bull Run is 3.3 People.
What is the Average Household Size in Bull Run
Average Household Size in Bull Run is 2.6 People.
How Large is the Labor Force in Bull Run?
There are 10,247 People in the Labor Forcein in Bull Run.
What is the Percentage of People in the Labor Force in Bull Run?
80.4% of People are in the Labor Force in Bull Run.
What is the Unemployment Rate in Bull Run?
Unemployment Rate in Bull Run is 2.9%.