Haymarket, VA Map & Demographics
Haymarket Map
Haymarket Overview
$58,325
PER CAPITA INCOME
$185,625
AVG FAMILY INCOME
$153,125
AVG HOUSEHOLD INCOME
16.0%
WAGE / INCOME GAP [ % ]
84.0¢/ $1
WAGE / INCOME GAP [ $ ]
0.40
INEQUALITY / GINI INDEX
1,572
TOTAL POPULATION
900
MALE POPULATION
672
FEMALE POPULATION
133.93
MALES / 100 FEMALES
74.67
FEMALES / 100 MALES
37.3
MEDIAN AGE
3.3
AVG FAMILY SIZE
3.0
AVG HOUSEHOLD SIZE
961
LABOR FORCE [ PEOPLE ]
76.8%
PERCENT IN LABOR FORCE
4.3%
UNEMPLOYMENT RATE
Haymarket Zip Codes
Income in Haymarket
Income Overview in Haymarket
Per Capita Income in Haymarket is $58,325, while median incomes of families and households are $185,625 and $153,125 respectively.
| Characteristic | Number | Measure |
| Per Capita Income | 1,572 | $58,325 |
| Median Family Income | 416 | $185,625 |
| Mean Family Income | 416 | $199,868 |
| Median Household Income | 529 | $153,125 |
| Mean Household Income | 529 | $169,461 |
| Income Deficit | 416 | $0 |
| Wage / Income Gap (%) | 1,572 | 16.01% |
| Wage / Income Gap ($) | 1,572 | 83.99¢ per $1 |
| Gini / Inequality Index | 1,572 | 0.40 |
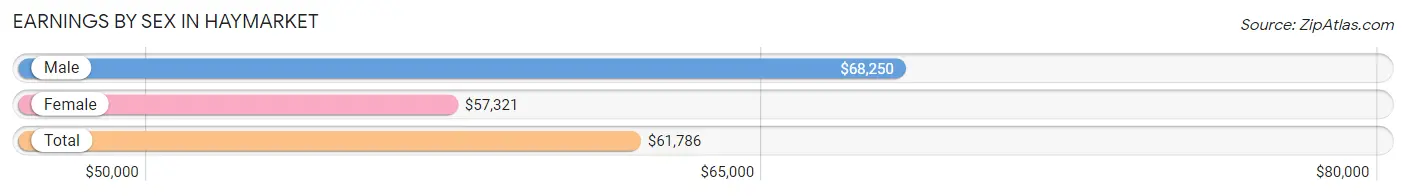
Earnings by Sex in Haymarket
Average Earnings in Haymarket are $61,786, $68,250 for men and $57,321 for women, a difference of 16.0%.
| Sex | Number | Average Earnings |
| Male | 583 (58.3%) | $68,250 |
| Female | 417 (41.7%) | $57,321 |
| Total | 1,000 (100.0%) | $61,786 |
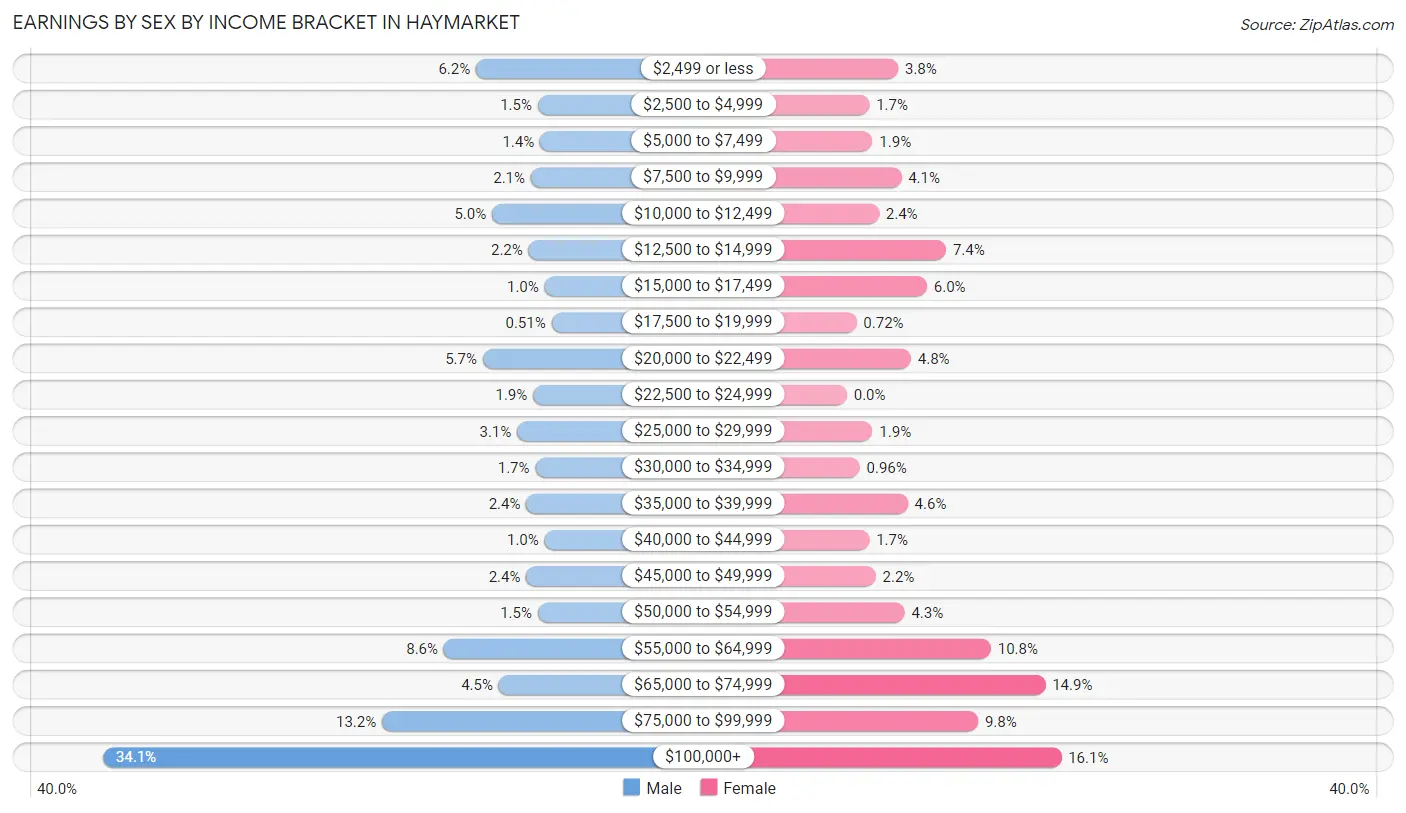
Earnings by Sex by Income Bracket in Haymarket
The most common earnings brackets in Haymarket are $100,000+ for men (199 | 34.1%) and $100,000+ for women (67 | 16.1%).
| Income | Male | Female |
| $2,499 or less | 36 (6.2%) | 16 (3.8%) |
| $2,500 to $4,999 | 9 (1.5%) | 7 (1.7%) |
| $5,000 to $7,499 | 8 (1.4%) | 8 (1.9%) |
| $7,500 to $9,999 | 12 (2.1%) | 17 (4.1%) |
| $10,000 to $12,499 | 29 (5.0%) | 10 (2.4%) |
| $12,500 to $14,999 | 13 (2.2%) | 31 (7.4%) |
| $15,000 to $17,499 | 6 (1.0%) | 25 (6.0%) |
| $17,500 to $19,999 | 3 (0.5%) | 3 (0.7%) |
| $20,000 to $22,499 | 33 (5.7%) | 20 (4.8%) |
| $22,500 to $24,999 | 11 (1.9%) | 0 (0.0%) |
| $25,000 to $29,999 | 18 (3.1%) | 8 (1.9%) |
| $30,000 to $34,999 | 10 (1.7%) | 4 (1.0%) |
| $35,000 to $39,999 | 14 (2.4%) | 19 (4.6%) |
| $40,000 to $44,999 | 6 (1.0%) | 7 (1.7%) |
| $45,000 to $49,999 | 14 (2.4%) | 9 (2.2%) |
| $50,000 to $54,999 | 9 (1.5%) | 18 (4.3%) |
| $55,000 to $64,999 | 50 (8.6%) | 45 (10.8%) |
| $65,000 to $74,999 | 26 (4.5%) | 62 (14.9%) |
| $75,000 to $99,999 | 77 (13.2%) | 41 (9.8%) |
| $100,000+ | 199 (34.1%) | 67 (16.1%) |
| Total | 583 (100.0%) | 417 (100.0%) |
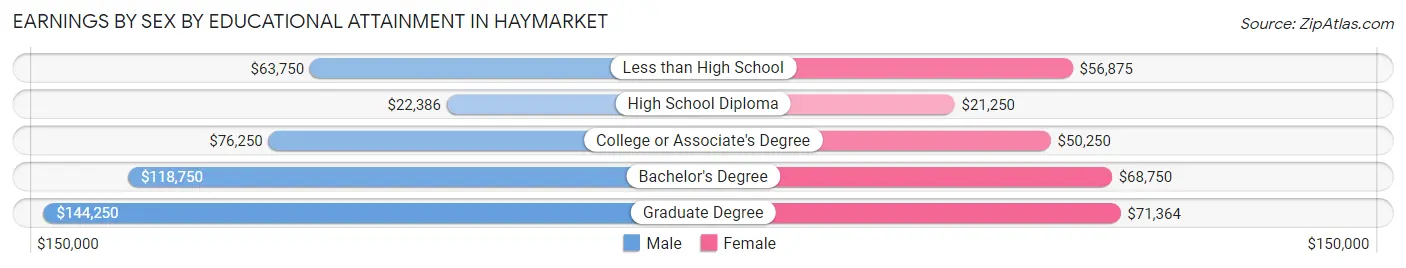
Earnings by Sex by Educational Attainment in Haymarket
Average earnings in Haymarket are $80,298 for men and $64,135 for women, a difference of 20.1%. Men with an educational attainment of graduate degree enjoy the highest average annual earnings of $144,250, while those with high school diploma education earn the least with $22,386. Women with an educational attainment of graduate degree earn the most with the average annual earnings of $71,364, while those with high school diploma education have the smallest earnings of $21,250.
| Educational Attainment | Male Income | Female Income |
| Less than High School | $63,750 | $56,875 |
| High School Diploma | $22,386 | $21,250 |
| College or Associate's Degree | $76,250 | $50,250 |
| Bachelor's Degree | $118,750 | $68,750 |
| Graduate Degree | $144,250 | $71,364 |
| Total | $80,298 | $64,135 |
Family Income in Haymarket
Family Income Brackets in Haymarket
According to the Haymarket family income data, there are 181 families falling into the $200,000+ income range, which is the most common income bracket and makes up 43.5% of all families.
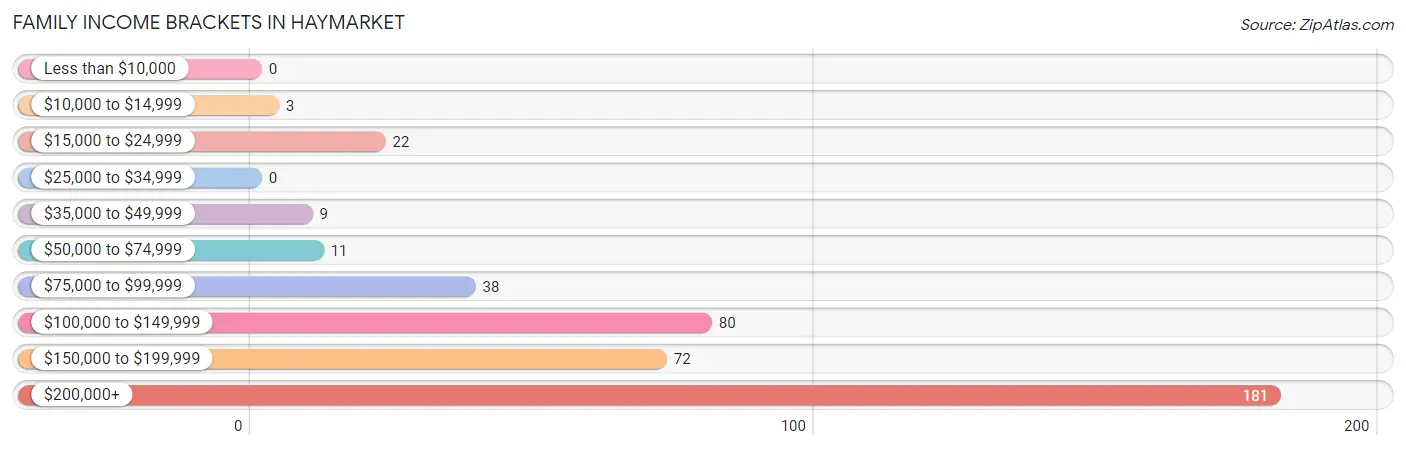
| Income Bracket | # Families | % Families |
| Less than $10,000 | 0 | 0.0% |
| $10,000 to $14,999 | 3 | 0.7% |
| $15,000 to $24,999 | 22 | 5.3% |
| $25,000 to $34,999 | 0 | 0.0% |
| $35,000 to $49,999 | 9 | 2.2% |
| $50,000 to $74,999 | 11 | 2.6% |
| $75,000 to $99,999 | 38 | 9.1% |
| $100,000 to $149,999 | 80 | 19.2% |
| $150,000 to $199,999 | 72 | 17.3% |
| $200,000+ | 181 | 43.5% |
Family Income by Famaliy Size in Haymarket
3-person families (165 | 39.7%) account for the highest median family income in Haymarket with $224,688 per family, while 3-person families (165 | 39.7%) have the highest median income of $74,896 per family member.
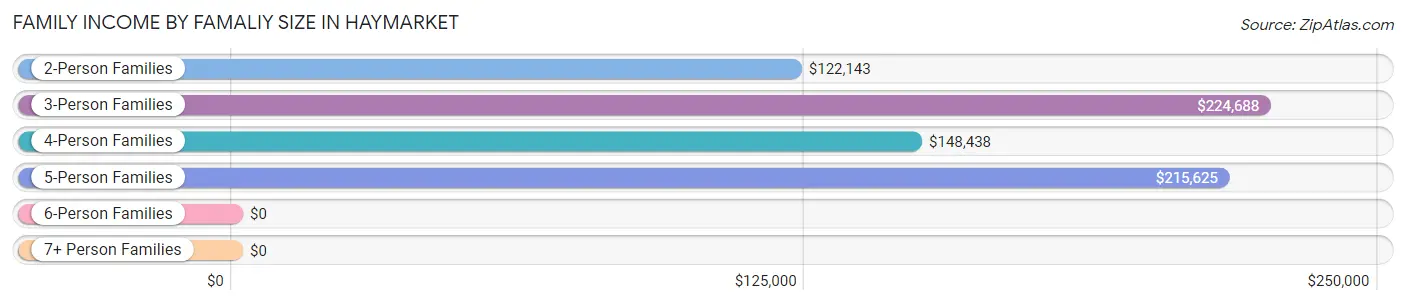
| Income Bracket | # Families | Median Income |
| 2-Person Families | 108 (26.0%) | $122,143 |
| 3-Person Families | 165 (39.7%) | $224,688 |
| 4-Person Families | 95 (22.8%) | $148,438 |
| 5-Person Families | 40 (9.6%) | $215,625 |
| 6-Person Families | 8 (1.9%) | $0 |
| 7+ Person Families | 0 (0.0%) | $0 |
| Total | 416 (100.0%) | $185,625 |
Family Income by Number of Earners in Haymarket
The median family income in Haymarket is $185,625, with families comprising 3+ earners (104) having the highest median family income of $222,679, while families with no earners (20) have the lowest median family income of $115,000, accounting for 25.0% and 4.8% of families, respectively.
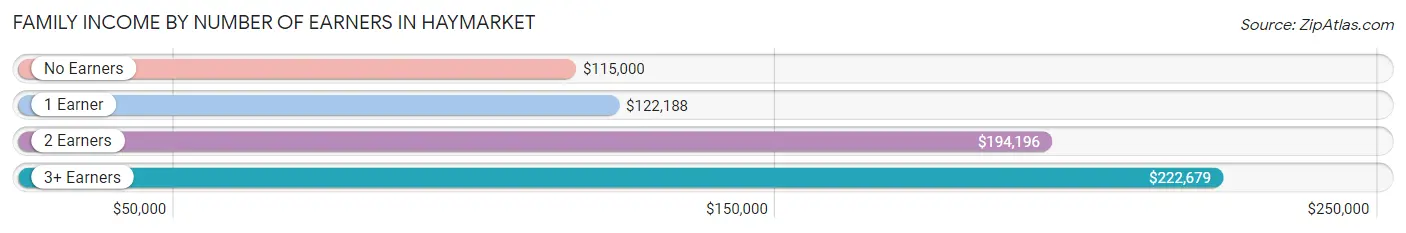
| Number of Earners | # Families | Median Income |
| No Earners | 20 (4.8%) | $115,000 |
| 1 Earner | 55 (13.2%) | $122,188 |
| 2 Earners | 237 (57.0%) | $194,196 |
| 3+ Earners | 104 (25.0%) | $222,679 |
| Total | 416 (100.0%) | $185,625 |
Household Income in Haymarket
Household Income Brackets in Haymarket
With 186 households falling in the category, the $200,000+ income range is the most frequent in Haymarket, accounting for 35.2% of all households. In contrast, only 3 households (0.6%) fall into the $10,000 to $14,999 income bracket, making it the least populous group.

| Income Bracket | # Households | % Households |
| Less than $10,000 | 37 | 7.0% |
| $10,000 to $14,999 | 3 | 0.6% |
| $15,000 to $24,999 | 33 | 6.2% |
| $25,000 to $34,999 | 6 | 1.1% |
| $35,000 to $49,999 | 29 | 5.5% |
| $50,000 to $74,999 | 18 | 3.4% |
| $75,000 to $99,999 | 56 | 10.6% |
| $100,000 to $149,999 | 78 | 14.7% |
| $150,000 to $199,999 | 83 | 15.7% |
| $200,000+ | 186 | 35.2% |
Household Income by Householder Age in Haymarket
The median household income in Haymarket is $153,125, with the highest median household income of $220,625 found in the 65+ years age bracket for the primary householder. A total of 108 households (20.4%) fall into this category. Meanwhile, the 15 to 24 years age bracket for the primary householder has the lowest median household income of $0, with 37 households (7.0%) in this group.
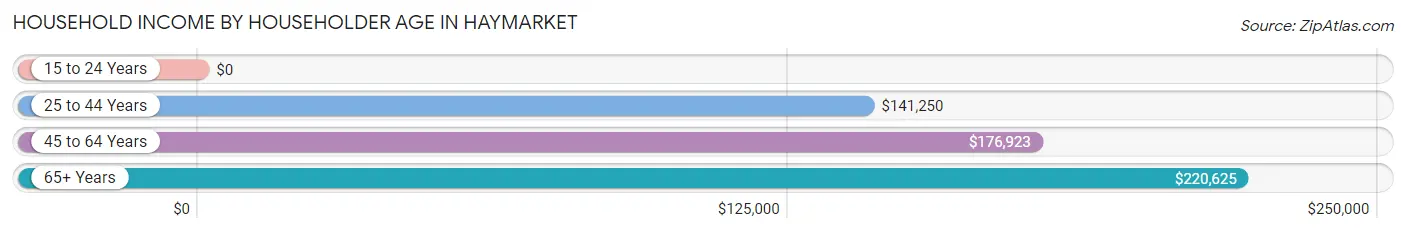
| Income Bracket | # Households | Median Income |
| 15 to 24 Years | 37 (7.0%) | $0 |
| 25 to 44 Years | 184 (34.8%) | $141,250 |
| 45 to 64 Years | 200 (37.8%) | $176,923 |
| 65+ Years | 108 (20.4%) | $220,625 |
| Total | 529 (100.0%) | $153,125 |
Poverty in Haymarket
Income Below Poverty by Sex and Age in Haymarket
With 11.4% poverty level for males and 1.8% for females among the residents of Haymarket, 18 to 24 year old males and 6 to 11 year old females are the most vulnerable to poverty, with 93 males (52.8%) and 3 females (7.0%) in their respective age groups living below the poverty level.
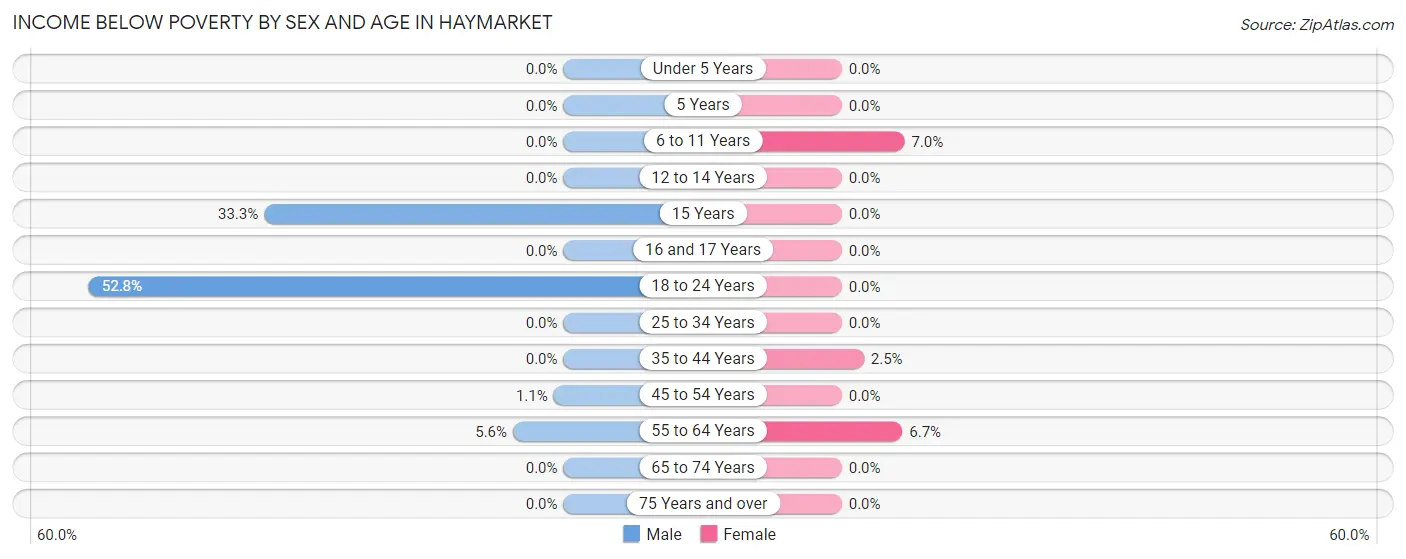
| Age Bracket | Male | Female |
| Under 5 Years | 0 (0.0%) | 0 (0.0%) |
| 5 Years | 0 (0.0%) | 0 (0.0%) |
| 6 to 11 Years | 0 (0.0%) | 3 (7.0%) |
| 12 to 14 Years | 0 (0.0%) | 0 (0.0%) |
| 15 Years | 4 (33.3%) | 0 (0.0%) |
| 16 and 17 Years | 0 (0.0%) | 0 (0.0%) |
| 18 to 24 Years | 93 (52.8%) | 0 (0.0%) |
| 25 to 34 Years | 0 (0.0%) | 0 (0.0%) |
| 35 to 44 Years | 0 (0.0%) | 3 (2.5%) |
| 45 to 54 Years | 1 (1.1%) | 0 (0.0%) |
| 55 to 64 Years | 5 (5.6%) | 6 (6.7%) |
| 65 to 74 Years | 0 (0.0%) | 0 (0.0%) |
| 75 Years and over | 0 (0.0%) | 0 (0.0%) |
| Total | 103 (11.4%) | 12 (1.8%) |
Income Above Poverty by Sex and Age in Haymarket
According to the poverty statistics in Haymarket, males aged under 5 years and females aged under 5 years are the age groups that are most secure financially, with 100.0% of males and 100.0% of females in these age groups living above the poverty line.
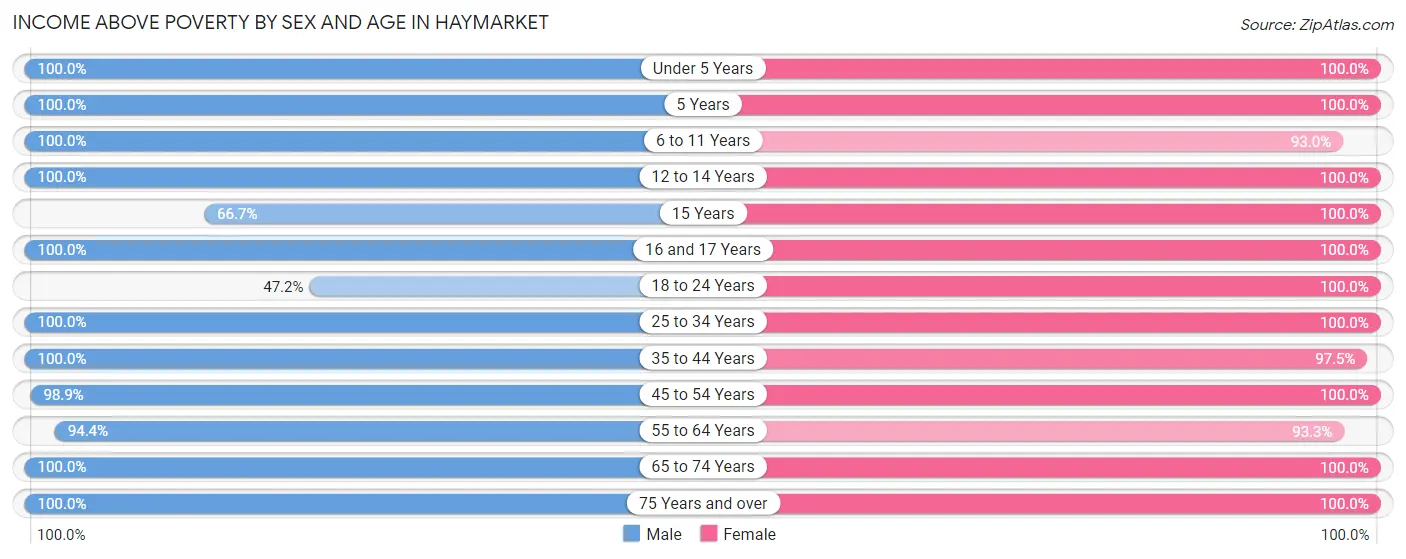
| Age Bracket | Male | Female |
| Under 5 Years | 28 (100.0%) | 50 (100.0%) |
| 5 Years | 4 (100.0%) | 4 (100.0%) |
| 6 to 11 Years | 69 (100.0%) | 40 (93.0%) |
| 12 to 14 Years | 62 (100.0%) | 45 (100.0%) |
| 15 Years | 8 (66.7%) | 4 (100.0%) |
| 16 and 17 Years | 25 (100.0%) | 19 (100.0%) |
| 18 to 24 Years | 83 (47.2%) | 57 (100.0%) |
| 25 to 34 Years | 74 (100.0%) | 61 (100.0%) |
| 35 to 44 Years | 158 (100.0%) | 119 (97.5%) |
| 45 to 54 Years | 91 (98.9%) | 105 (100.0%) |
| 55 to 64 Years | 84 (94.4%) | 83 (93.3%) |
| 65 to 74 Years | 69 (100.0%) | 49 (100.0%) |
| 75 Years and over | 42 (100.0%) | 24 (100.0%) |
| Total | 797 (88.6%) | 660 (98.2%) |
Income Below Poverty Among Married-Couple Families in Haymarket
The poverty statistics for married-couple families in Haymarket show that 1.1% or 4 of the total 351 families live below the poverty line. Families with no children have the highest poverty rate of 2.3%, comprising of 4 families. On the other hand, families with 1 or 2 children have the lowest poverty rate of 0.0%, which includes 0 families.
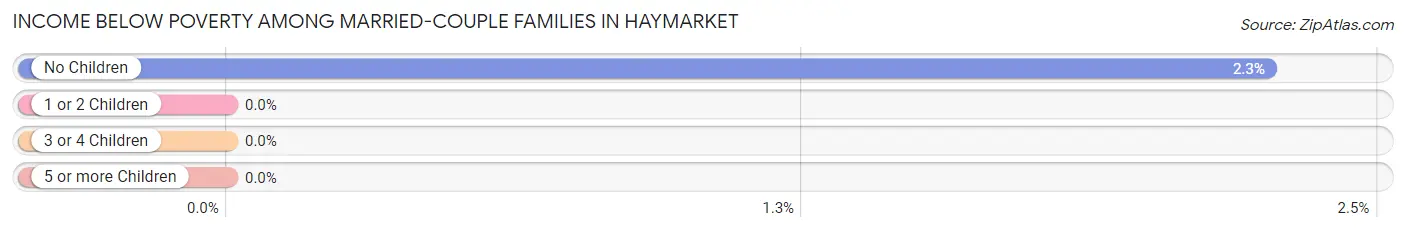
| Children | Above Poverty | Below Poverty |
| No Children | 173 (97.7%) | 4 (2.3%) |
| 1 or 2 Children | 159 (100.0%) | 0 (0.0%) |
| 3 or 4 Children | 15 (100.0%) | 0 (0.0%) |
| 5 or more Children | 0 (0.0%) | 0 (0.0%) |
| Total | 347 (98.9%) | 4 (1.1%) |
Income Below Poverty Among Single-Parent Households in Haymarket
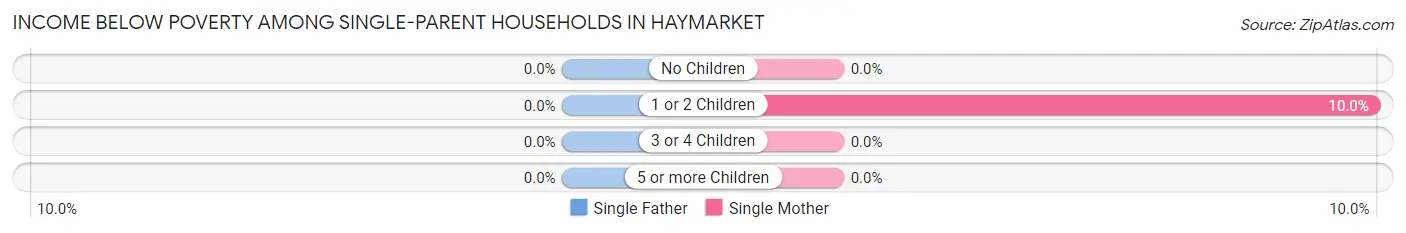
| Children | Single Father | Single Mother |
| No Children | 0 (0.0%) | 0 (0.0%) |
| 1 or 2 Children | 0 (0.0%) | 3 (10.0%) |
| 3 or 4 Children | 0 (0.0%) | 0 (0.0%) |
| 5 or more Children | 0 (0.0%) | 0 (0.0%) |
| Total | 0 (0.0%) | 3 (7.5%) |
Income Below Poverty Among Married-Couple vs Single-Parent Households in Haymarket
The poverty data for Haymarket shows that 4 of the married-couple family households (1.1%) and 3 of the single-parent households (4.6%) are living below the poverty level. Within the married-couple family households, those with no children have the highest poverty rate, with 4 households (2.3%) falling below the poverty line. Among the single-parent households, those with 1 or 2 children have the highest poverty rate, with 3 household (9.1%) living below poverty.
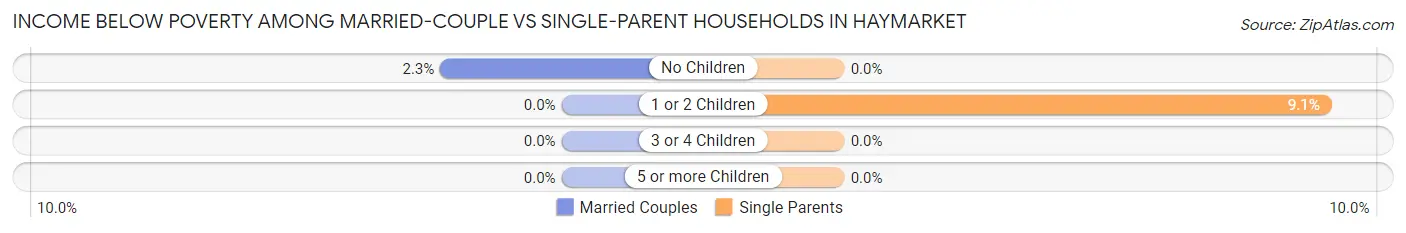
| Children | Married-Couple Families | Single-Parent Households |
| No Children | 4 (2.3%) | 0 (0.0%) |
| 1 or 2 Children | 0 (0.0%) | 3 (9.1%) |
| 3 or 4 Children | 0 (0.0%) | 0 (0.0%) |
| 5 or more Children | 0 (0.0%) | 0 (0.0%) |
| Total | 4 (1.1%) | 3 (4.6%) |
Race in Haymarket
The most populous races in Haymarket are White / Caucasian (1,078 | 68.6%), Asian (181 | 11.5%), and Black / African American (168 | 10.7%).
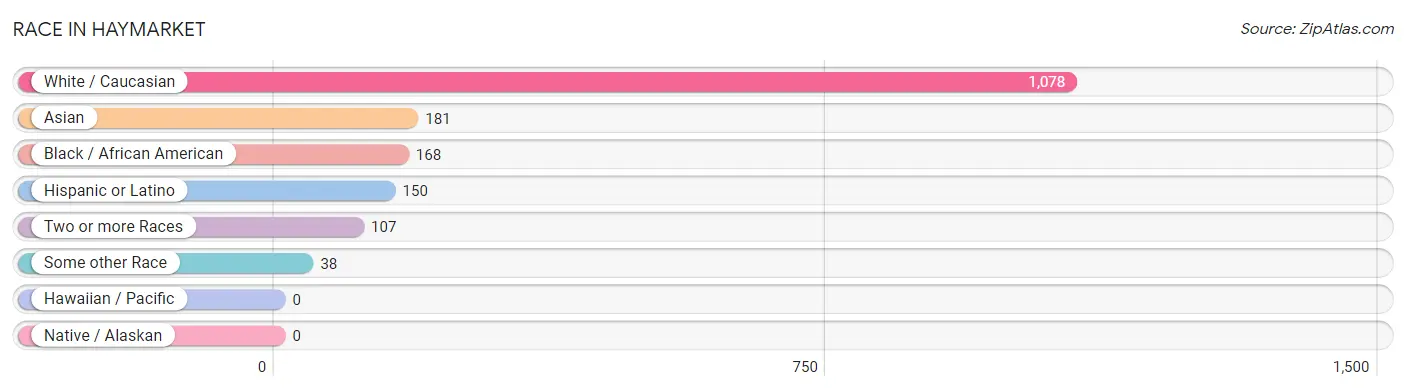
| Race | # Population | % Population |
| Asian | 181 | 11.5% |
| Black / African American | 168 | 10.7% |
| Hawaiian / Pacific | 0 | 0.0% |
| Hispanic or Latino | 150 | 9.5% |
| Native / Alaskan | 0 | 0.0% |
| White / Caucasian | 1,078 | 68.6% |
| Two or more Races | 107 | 6.8% |
| Some other Race | 38 | 2.4% |
| Total | 1,572 | 100.0% |
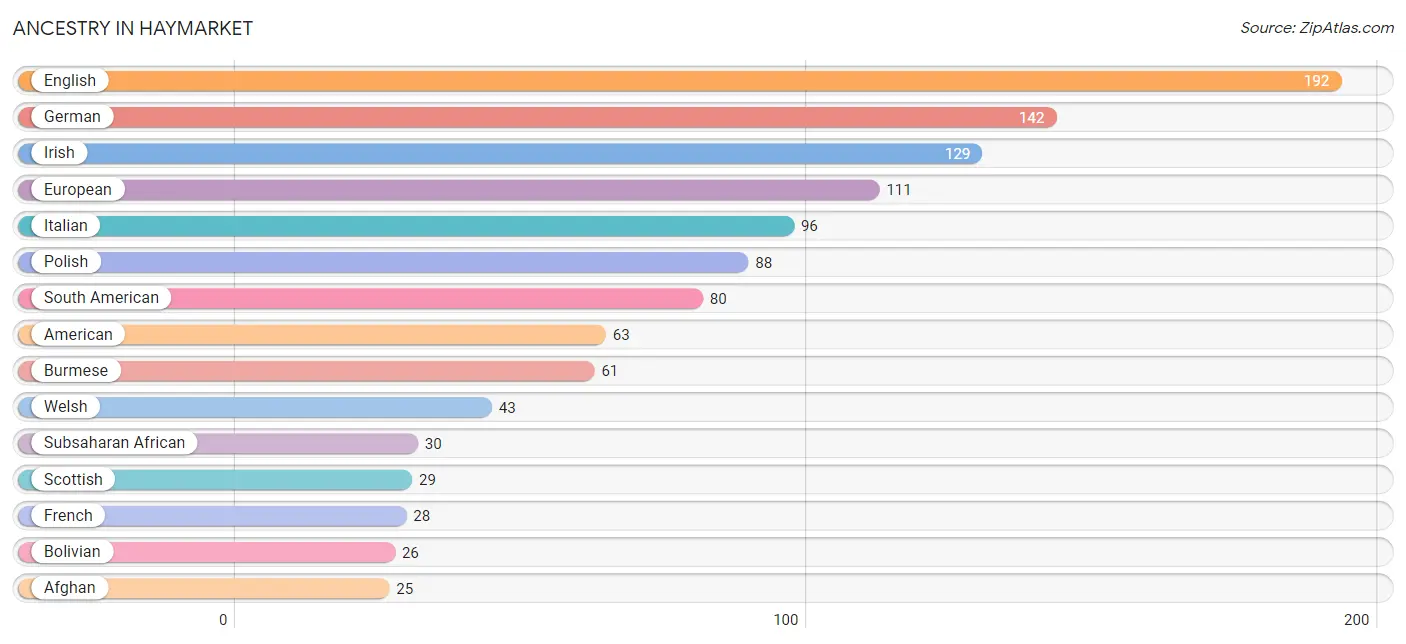
Ancestry in Haymarket
The most populous ancestries reported in Haymarket are English (192 | 12.2%), German (142 | 9.0%), Irish (129 | 8.2%), European (111 | 7.1%), and Italian (96 | 6.1%), together accounting for 42.6% of all Haymarket residents.
| Ancestry | # Population | % Population |
| Afghan | 25 | 1.6% |
| African | 8 | 0.5% |
| American | 63 | 4.0% |
| Arab | 22 | 1.4% |
| Austrian | 7 | 0.4% |
| Belgian | 2 | 0.1% |
| Bhutanese | 10 | 0.6% |
| Bolivian | 26 | 1.7% |
| Brazilian | 5 | 0.3% |
| British | 7 | 0.4% |
| Burmese | 61 | 3.9% |
| Central American | 25 | 1.6% |
| Chilean | 10 | 0.6% |
| Colombian | 13 | 0.8% |
| Cuban | 5 | 0.3% |
| Czech | 3 | 0.2% |
| Dominican | 18 | 1.1% |
| Dutch | 18 | 1.1% |
| Eastern European | 4 | 0.3% |
| Ecuadorian | 4 | 0.3% |
| English | 192 | 12.2% |
| Ethiopian | 22 | 1.4% |
| European | 111 | 7.1% |
| Finnish | 3 | 0.2% |
| French | 28 | 1.8% |
| French Canadian | 3 | 0.2% |
| German | 142 | 9.0% |
| Greek | 2 | 0.1% |
| Guatemalan | 4 | 0.3% |
| Hungarian | 8 | 0.5% |
| Indian (Asian) | 7 | 0.4% |
| Iraqi | 19 | 1.2% |
| Irish | 129 | 8.2% |
| Italian | 96 | 6.1% |
| Jamaican | 4 | 0.3% |
| Korean | 16 | 1.0% |
| Laotian | 7 | 0.4% |
| Mexican | 9 | 0.6% |
| Mongolian | 4 | 0.3% |
| Norwegian | 14 | 0.9% |
| Panamanian | 4 | 0.3% |
| Peruvian | 23 | 1.5% |
| Polish | 88 | 5.6% |
| Puerto Rican | 9 | 0.6% |
| Romanian | 3 | 0.2% |
| Russian | 22 | 1.4% |
| Salvadoran | 17 | 1.1% |
| Scandinavian | 16 | 1.0% |
| Scotch-Irish | 3 | 0.2% |
| Scottish | 29 | 1.8% |
| Slovak | 8 | 0.5% |
| South American | 80 | 5.1% |
| Sri Lankan | 3 | 0.2% |
| Subsaharan African | 30 | 1.9% |
| Swedish | 10 | 0.6% |
| Thai | 21 | 1.3% |
| Venezuelan | 4 | 0.3% |
| Welsh | 43 | 2.7% | View All 58 Rows |
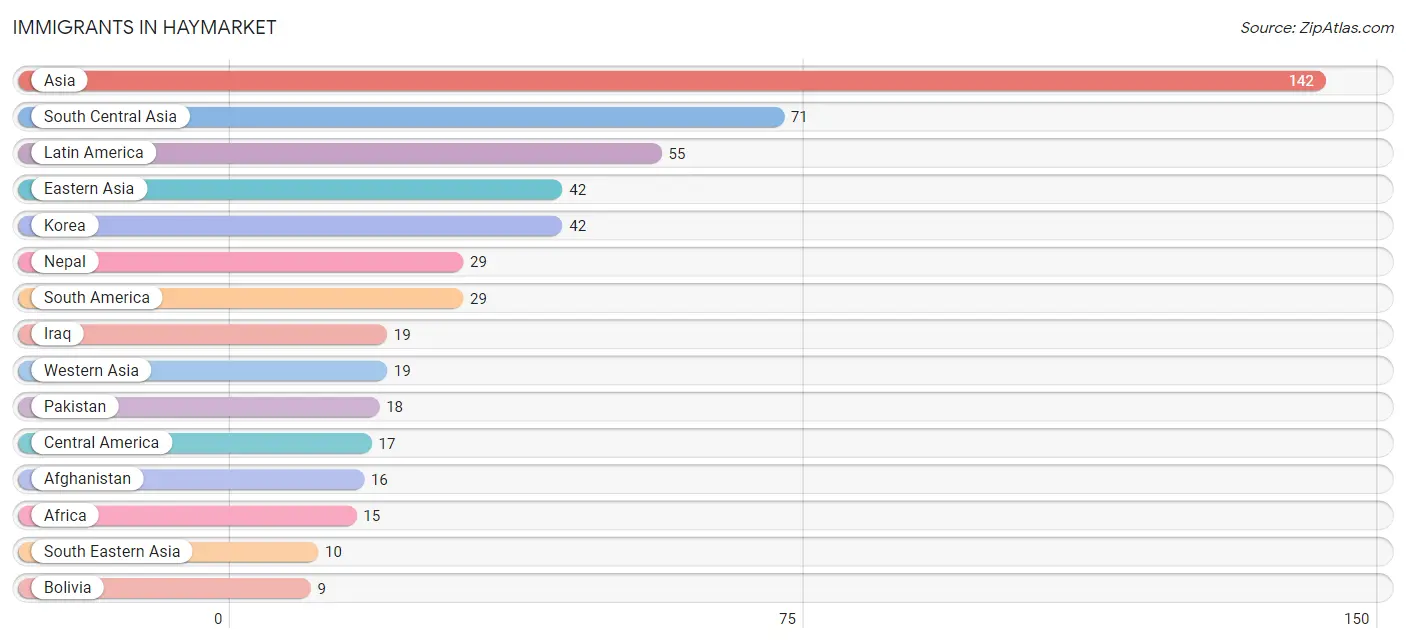
Immigrants in Haymarket
The most numerous immigrant groups reported in Haymarket came from Asia (142 | 9.0%), South Central Asia (71 | 4.5%), Latin America (55 | 3.5%), Eastern Asia (42 | 2.7%), and Korea (42 | 2.7%), together accounting for 22.4% of all Haymarket residents.
| Immigration Origin | # Population | % Population |
| Afghanistan | 16 | 1.0% |
| Africa | 15 | 0.9% |
| Argentina | 5 | 0.3% |
| Asia | 142 | 9.0% |
| Bolivia | 9 | 0.6% |
| Brazil | 3 | 0.2% |
| Caribbean | 9 | 0.6% |
| Central America | 17 | 1.1% |
| Costa Rica | 3 | 0.2% |
| Dominican Republic | 5 | 0.3% |
| Eastern Africa | 9 | 0.6% |
| Eastern Asia | 42 | 2.7% |
| Ecuador | 4 | 0.3% |
| El Salvador | 9 | 0.6% |
| Ethiopia | 9 | 0.6% |
| Europe | 9 | 0.6% |
| India | 8 | 0.5% |
| Iraq | 19 | 1.2% |
| Ireland | 3 | 0.2% |
| Italy | 3 | 0.2% |
| Jamaica | 4 | 0.3% |
| Korea | 42 | 2.7% |
| Latin America | 55 | 3.5% |
| Mexico | 5 | 0.3% |
| Nepal | 29 | 1.8% |
| Netherlands | 3 | 0.2% |
| Northern Africa | 6 | 0.4% |
| Northern Europe | 3 | 0.2% |
| Pakistan | 18 | 1.1% |
| Peru | 4 | 0.3% |
| Philippines | 6 | 0.4% |
| Singapore | 4 | 0.3% |
| South America | 29 | 1.8% |
| South Central Asia | 71 | 4.5% |
| South Eastern Asia | 10 | 0.6% |
| Southern Europe | 3 | 0.2% |
| Venezuela | 4 | 0.3% |
| Western Asia | 19 | 1.2% |
| Western Europe | 3 | 0.2% | View All 39 Rows |
Sex and Age in Haymarket
Sex and Age in Haymarket
The most populous age groups in Haymarket are 15 to 19 Years (113 | 12.6%) for men and 40 to 44 Years (74 | 11.0%) for women.
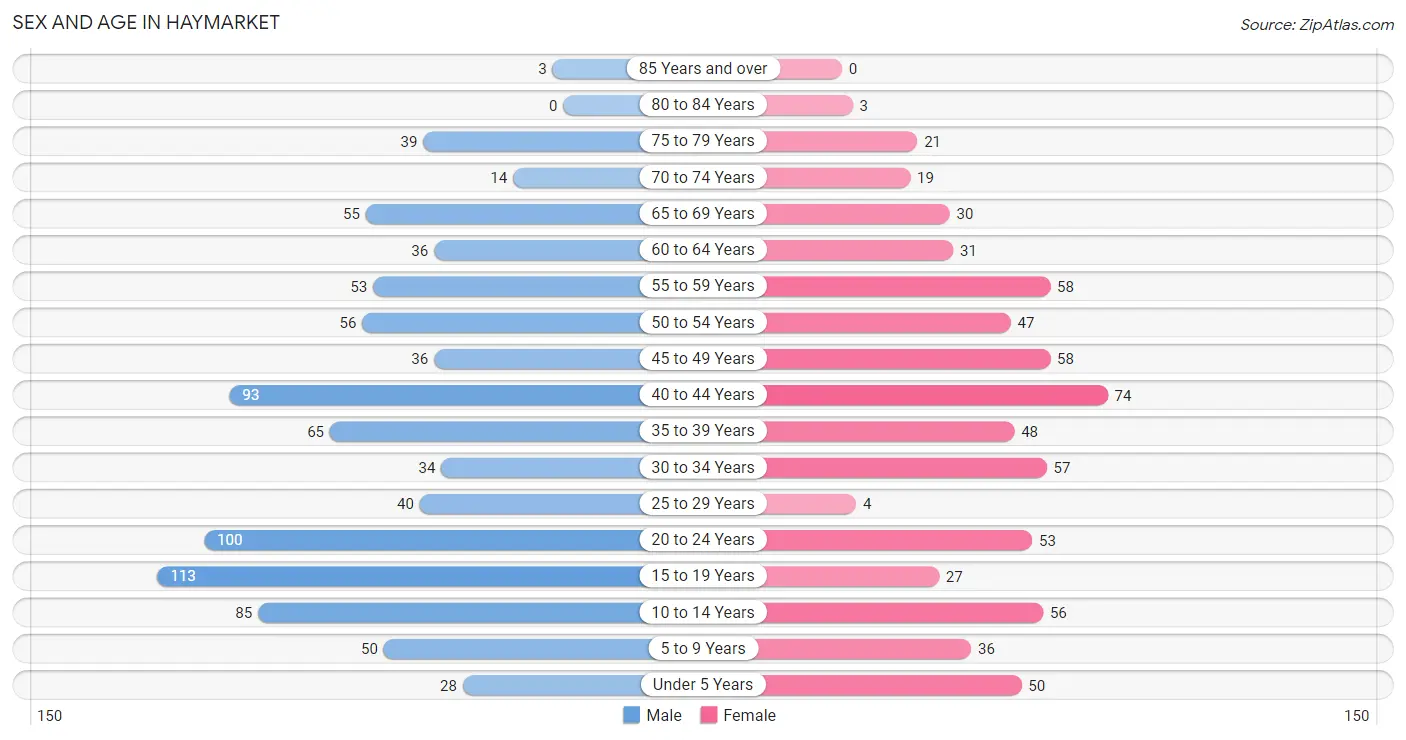
| Age Bracket | Male | Female |
| Under 5 Years | 28 (3.1%) | 50 (7.4%) |
| 5 to 9 Years | 50 (5.6%) | 36 (5.4%) |
| 10 to 14 Years | 85 (9.4%) | 56 (8.3%) |
| 15 to 19 Years | 113 (12.6%) | 27 (4.0%) |
| 20 to 24 Years | 100 (11.1%) | 53 (7.9%) |
| 25 to 29 Years | 40 (4.4%) | 4 (0.6%) |
| 30 to 34 Years | 34 (3.8%) | 57 (8.5%) |
| 35 to 39 Years | 65 (7.2%) | 48 (7.1%) |
| 40 to 44 Years | 93 (10.3%) | 74 (11.0%) |
| 45 to 49 Years | 36 (4.0%) | 58 (8.6%) |
| 50 to 54 Years | 56 (6.2%) | 47 (7.0%) |
| 55 to 59 Years | 53 (5.9%) | 58 (8.6%) |
| 60 to 64 Years | 36 (4.0%) | 31 (4.6%) |
| 65 to 69 Years | 55 (6.1%) | 30 (4.5%) |
| 70 to 74 Years | 14 (1.6%) | 19 (2.8%) |
| 75 to 79 Years | 39 (4.3%) | 21 (3.1%) |
| 80 to 84 Years | 0 (0.0%) | 3 (0.4%) |
| 85 Years and over | 3 (0.3%) | 0 (0.0%) |
| Total | 900 (100.0%) | 672 (100.0%) |
Families and Households in Haymarket
Median Family Size in Haymarket
The median family size in Haymarket is 3.32 persons per family, with single female/mother families (40 | 9.6%) accounting for the largest median family size of 3.78 persons per family. On the other hand, single male/father families (25 | 6.0%) represent the smallest median family size with 3.04 persons per family.
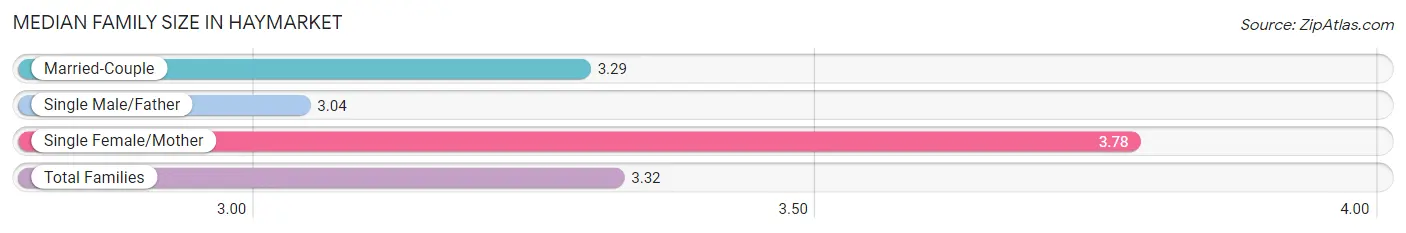
| Family Type | # Families | Family Size |
| Married-Couple | 351 (84.4%) | 3.29 |
| Single Male/Father | 25 (6.0%) | 3.04 |
| Single Female/Mother | 40 (9.6%) | 3.78 |
| Total Families | 416 (100.0%) | 3.32 |
Median Household Size in Haymarket
The median household size in Haymarket is 2.96 persons per household, with single female/mother households (40 | 7.6%) accounting for the largest median household size of 4.2 persons per household. non-family households (113 | 21.4%) represent the smallest median household size with 1.42 persons per household.
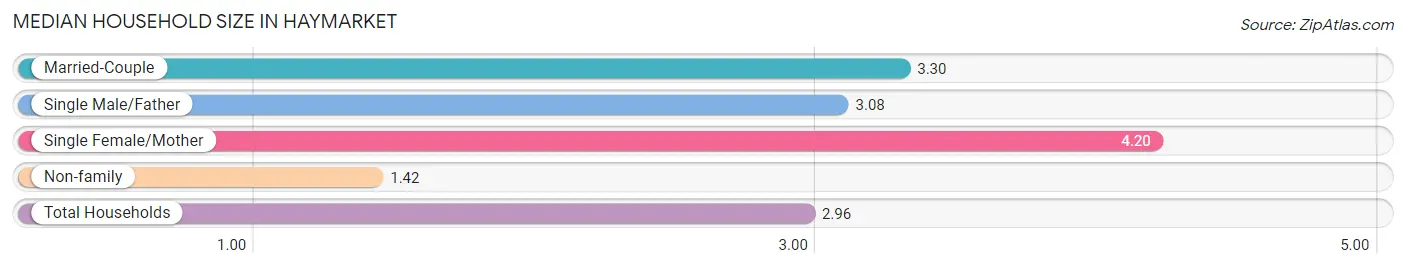
| Household Type | # Households | Household Size |
| Married-Couple | 351 (66.3%) | 3.30 |
| Single Male/Father | 25 (4.7%) | 3.08 |
| Single Female/Mother | 40 (7.6%) | 4.20 |
| Non-family | 113 (21.4%) | 1.42 |
| Total Households | 529 (100.0%) | 2.96 |
Household Size by Marriage Status in Haymarket
Out of a total of 529 households in Haymarket, 416 (78.6%) are family households, while 113 (21.4%) are nonfamily households. The most numerous type of family households are 3-person households, comprising 174, and the most common type of nonfamily households are 1-person households, comprising 75.
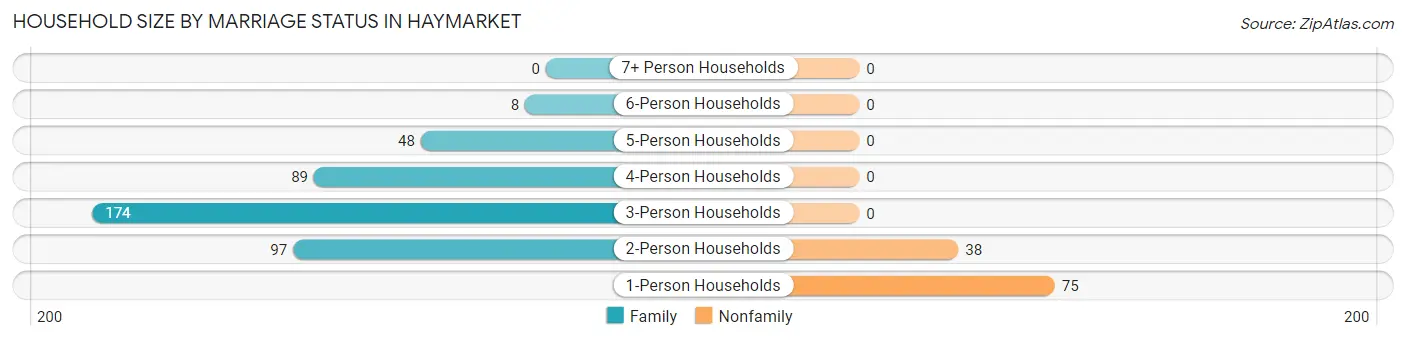
| Household Size | Family Households | Nonfamily Households |
| 1-Person Households | - | 75 (14.2%) |
| 2-Person Households | 97 (18.3%) | 38 (7.2%) |
| 3-Person Households | 174 (32.9%) | 0 (0.0%) |
| 4-Person Households | 89 (16.8%) | 0 (0.0%) |
| 5-Person Households | 48 (9.1%) | 0 (0.0%) |
| 6-Person Households | 8 (1.5%) | 0 (0.0%) |
| 7+ Person Households | 0 (0.0%) | 0 (0.0%) |
| Total | 416 (78.6%) | 113 (21.4%) |
Female Fertility in Haymarket
Fertility by Age in Haymarket
Average fertility rate in Haymarket is 67.0 births per 1,000 women. Women in the age bracket of 35 to 50 years have the highest fertility rate with 81.0 births per 1,000 women. Women in the age bracket of 35 to 50 years acount for 68.2% of all women with births.
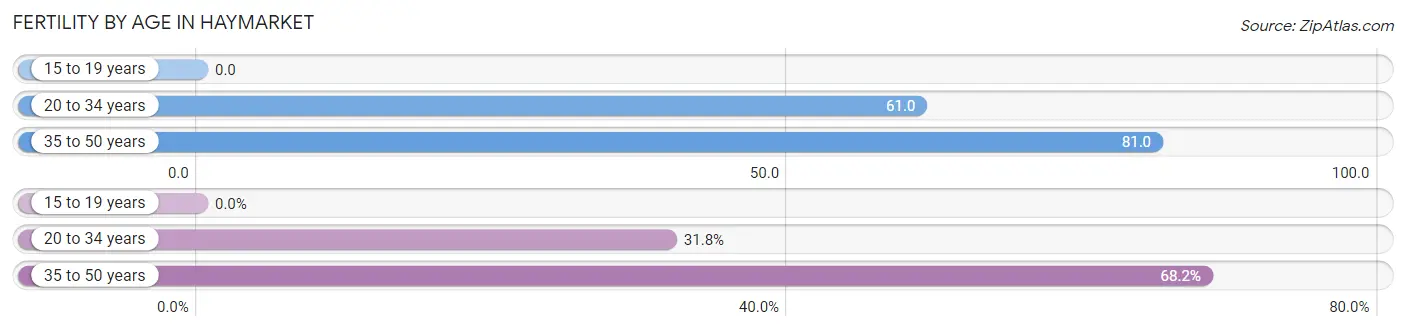
| Age Bracket | Women with Births | Births / 1,000 Women |
| 15 to 19 years | 0 (0.0%) | 0.0 |
| 20 to 34 years | 7 (31.8%) | 61.0 |
| 35 to 50 years | 15 (68.2%) | 81.0 |
| Total | 22 (100.0%) | 67.0 |
Fertility by Age by Marriage Status in Haymarket
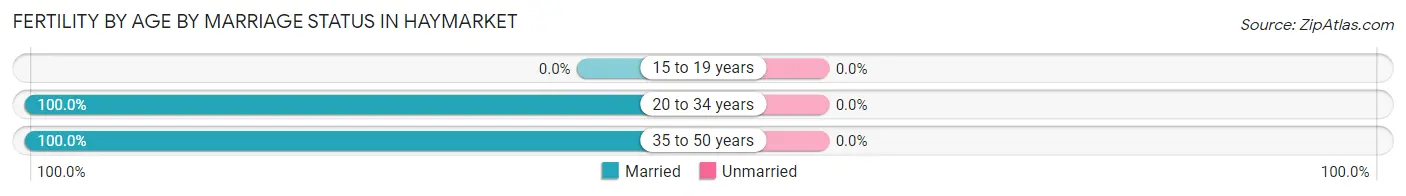
| Age Bracket | Married | Unmarried |
| 15 to 19 years | 0 (0.0%) | 0 (0.0%) |
| 20 to 34 years | 7 (100.0%) | 0 (0.0%) |
| 35 to 50 years | 15 (100.0%) | 0 (0.0%) |
| Total | 22 (100.0%) | 0 (0.0%) |
Fertility by Education in Haymarket
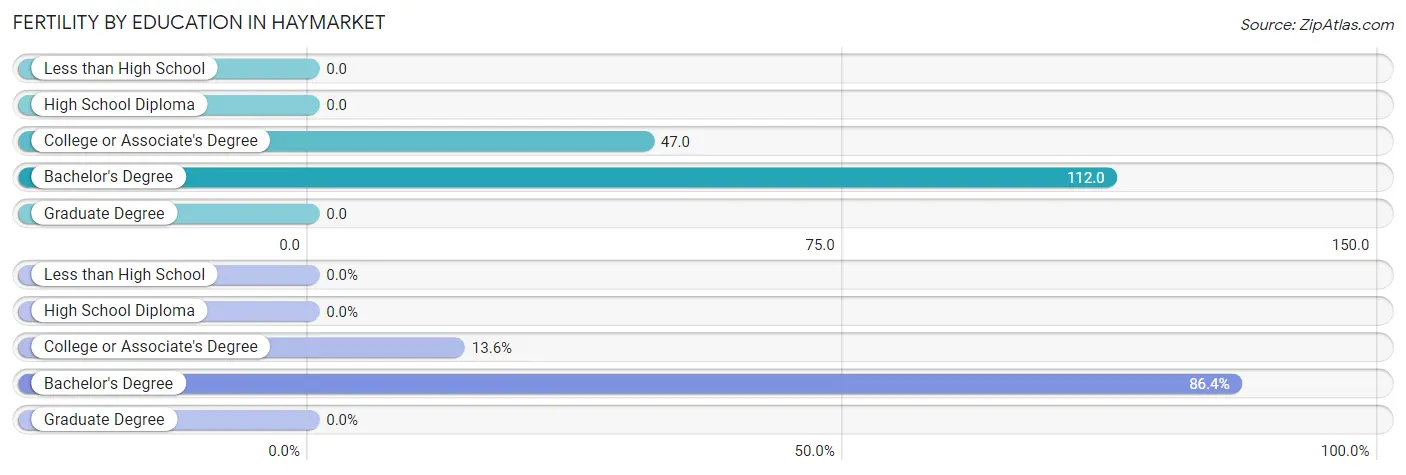
| Educational Attainment | Women with Births | Births / 1,000 Women |
| Less than High School | 0 (0.0%) | 0.0 |
| High School Diploma | 0 (0.0%) | 0.0 |
| College or Associate's Degree | 3 (13.6%) | 47.0 |
| Bachelor's Degree | 19 (86.4%) | 112.0 |
| Graduate Degree | 0 (0.0%) | 0.0 |
| Total | 22 (100.0%) | 67.0 |
Fertility by Education by Marriage Status in Haymarket
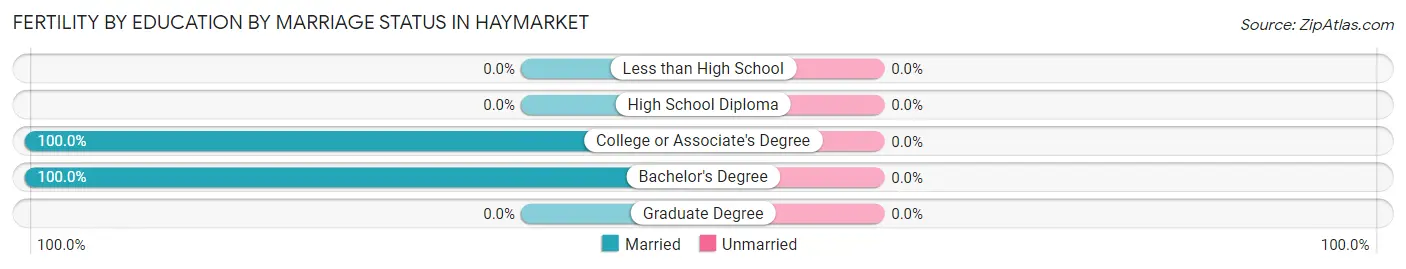
| Educational Attainment | Married | Unmarried |
| Less than High School | 0 (0.0%) | 0 (0.0%) |
| High School Diploma | 0 (0.0%) | 0 (0.0%) |
| College or Associate's Degree | 3 (100.0%) | 0 (0.0%) |
| Bachelor's Degree | 19 (100.0%) | 0 (0.0%) |
| Graduate Degree | 0 (0.0%) | 0 (0.0%) |
| Total | 22 (100.0%) | 0 (0.0%) |
Employment Characteristics in Haymarket
Employment by Class of Employer in Haymarket
Among the 889 employed individuals in Haymarket, private company employees (571 | 64.2%), local government employees (113 | 12.7%), and not-for-profit organizations (72 | 8.1%) make up the most common classes of employment.
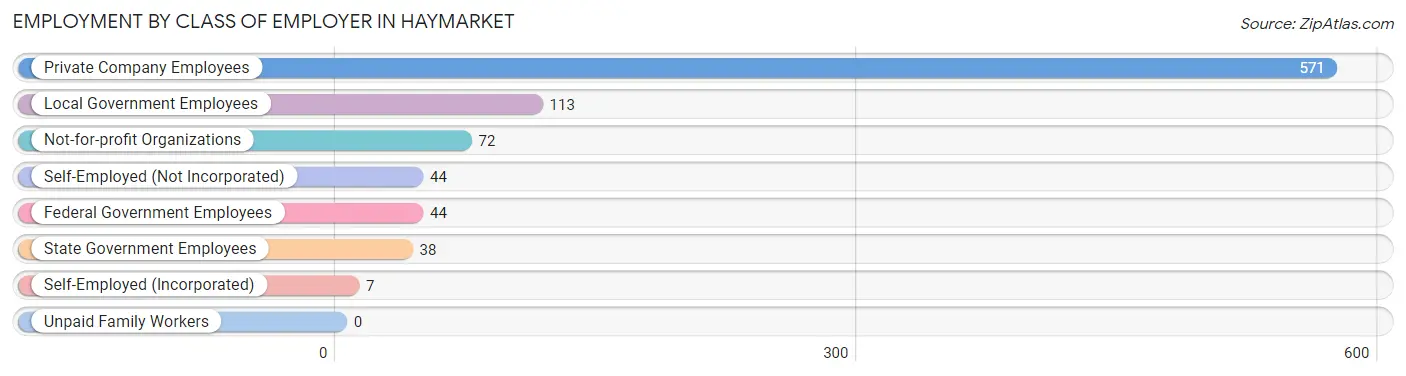
| Employer Class | # Employees | % Employees |
| Private Company Employees | 571 | 64.2% |
| Self-Employed (Incorporated) | 7 | 0.8% |
| Self-Employed (Not Incorporated) | 44 | 5.0% |
| Not-for-profit Organizations | 72 | 8.1% |
| Local Government Employees | 113 | 12.7% |
| State Government Employees | 38 | 4.3% |
| Federal Government Employees | 44 | 5.0% |
| Unpaid Family Workers | 0 | 0.0% |
| Total | 889 | 100.0% |
Employment Status by Age in Haymarket
According to the labor force statistics for Haymarket, out of the total population over 16 years of age (1,251), 76.8% or 961 individuals are in the labor force, with 4.3% or 41 of them unemployed. The age group with the highest labor force participation rate is 25 to 29 years, with 100.0% or 44 individuals in the labor force. Within the labor force, the 20 to 24 years age range has the highest percentage of unemployed individuals, with 15.5% or 15 of them being unemployed.
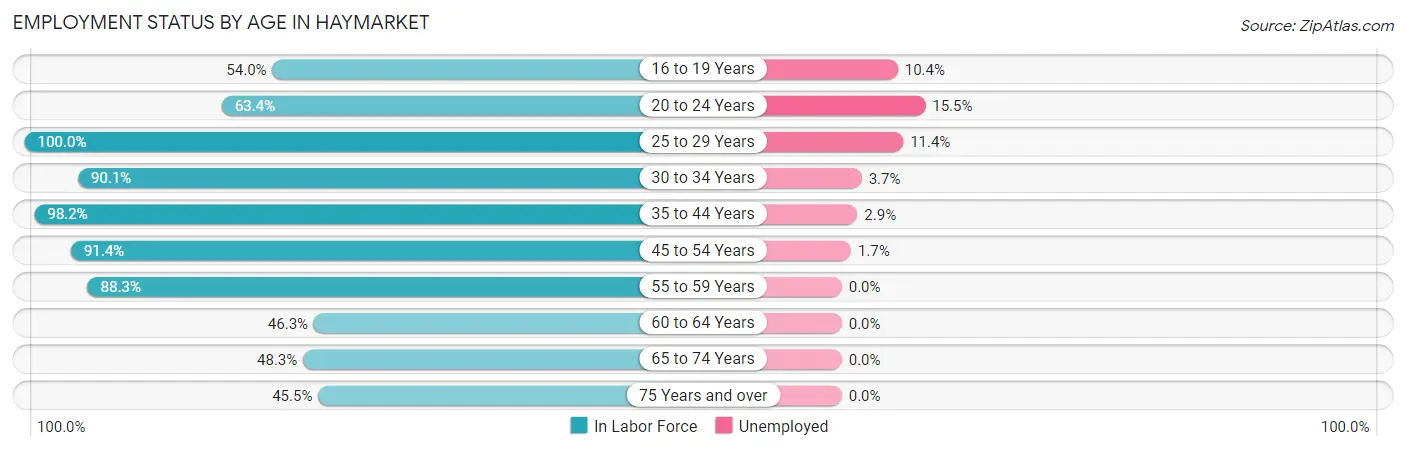
| Age Bracket | In Labor Force | Unemployed |
| 16 to 19 Years | 67 (54.0%) | 7 (10.4%) |
| 20 to 24 Years | 97 (63.4%) | 15 (15.5%) |
| 25 to 29 Years | 44 (100.0%) | 5 (11.4%) |
| 30 to 34 Years | 82 (90.1%) | 3 (3.7%) |
| 35 to 44 Years | 275 (98.2%) | 8 (2.9%) |
| 45 to 54 Years | 180 (91.4%) | 3 (1.7%) |
| 55 to 59 Years | 98 (88.3%) | 0 (0.0%) |
| 60 to 64 Years | 31 (46.3%) | 0 (0.0%) |
| 65 to 74 Years | 57 (48.3%) | 0 (0.0%) |
| 75 Years and over | 30 (45.5%) | 0 (0.0%) |
| Total | 961 (76.8%) | 41 (4.3%) |
Employment Status by Educational Attainment in Haymarket
According to labor force statistics for Haymarket, 89.9% of individuals (710) out of the total population between 25 and 64 years of age (790) are in the labor force, with 2.7% or 19 of them being unemployed. The group with the highest labor force participation rate are those with the educational attainment of high school diploma, with 92.4% or 121 individuals in the labor force. Within the labor force, individuals with high school diploma education have the highest percentage of unemployment, with 6.6% or 8 of them being unemployed.
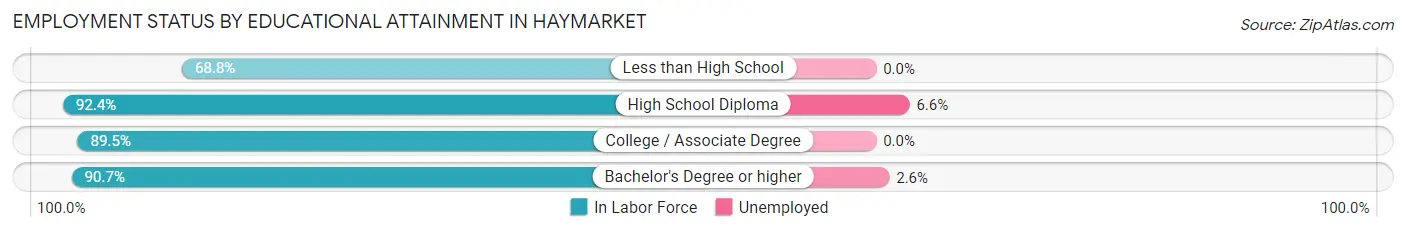
| Educational Attainment | In Labor Force | Unemployed |
| Less than High School | 22 (68.8%) | 0 (0.0%) |
| High School Diploma | 121 (92.4%) | 9 (6.6%) |
| College / Associate Degree | 137 (89.5%) | 0 (0.0%) |
| Bachelor's Degree or higher | 430 (90.7%) | 12 (2.6%) |
| Total | 710 (89.9%) | 21 (2.7%) |
Employment Occupations by Sex in Haymarket
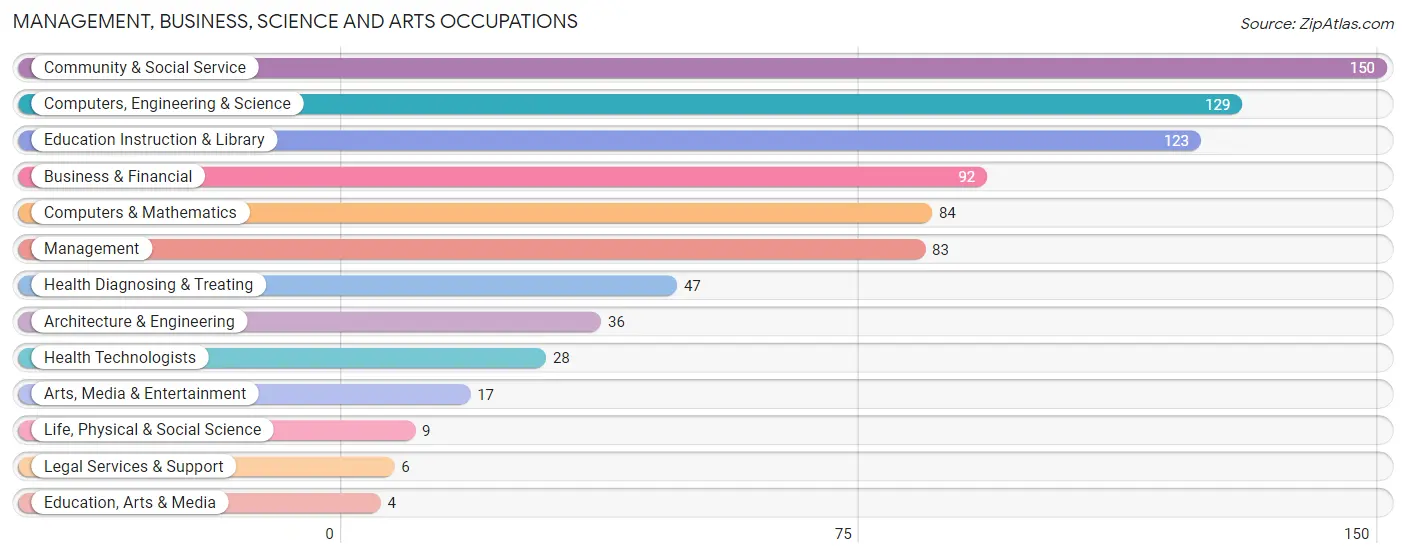
Management, Business, Science and Arts Occupations
The most common Management, Business, Science and Arts occupations in Haymarket are Community & Social Service (150 | 16.3%), Computers, Engineering & Science (129 | 14.0%), Education Instruction & Library (123 | 13.4%), Business & Financial (92 | 10.0%), and Computers & Mathematics (84 | 9.1%).
Management, Business, Science and Arts Occupations by Sex
Within the Management, Business, Science and Arts occupations in Haymarket, the most male-oriented occupations are Architecture & Engineering (100.0%), Legal Services & Support (100.0%), and Computers, Engineering & Science (86.8%), while the most female-oriented occupations are Education, Arts & Media (100.0%), Arts, Media & Entertainment (100.0%), and Health Technologists (85.7%).
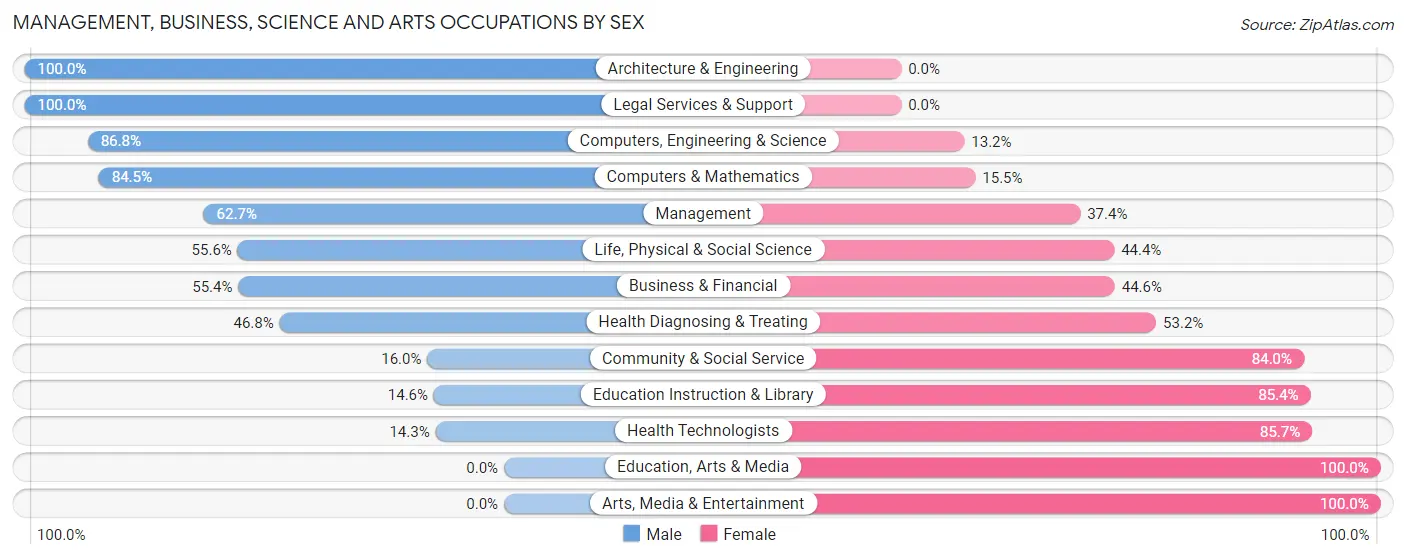
| Occupation | Male | Female |
| Management | 52 (62.6%) | 31 (37.3%) |
| Business & Financial | 51 (55.4%) | 41 (44.6%) |
| Computers, Engineering & Science | 112 (86.8%) | 17 (13.2%) |
| Computers & Mathematics | 71 (84.5%) | 13 (15.5%) |
| Architecture & Engineering | 36 (100.0%) | 0 (0.0%) |
| Life, Physical & Social Science | 5 (55.6%) | 4 (44.4%) |
| Community & Social Service | 24 (16.0%) | 126 (84.0%) |
| Education, Arts & Media | 0 (0.0%) | 4 (100.0%) |
| Legal Services & Support | 6 (100.0%) | 0 (0.0%) |
| Education Instruction & Library | 18 (14.6%) | 105 (85.4%) |
| Arts, Media & Entertainment | 0 (0.0%) | 17 (100.0%) |
| Health Diagnosing & Treating | 22 (46.8%) | 25 (53.2%) |
| Health Technologists | 4 (14.3%) | 24 (85.7%) |
| Total (Category) | 261 (52.1%) | 240 (47.9%) |
| Total (Overall) | 526 (57.2%) | 394 (42.8%) |
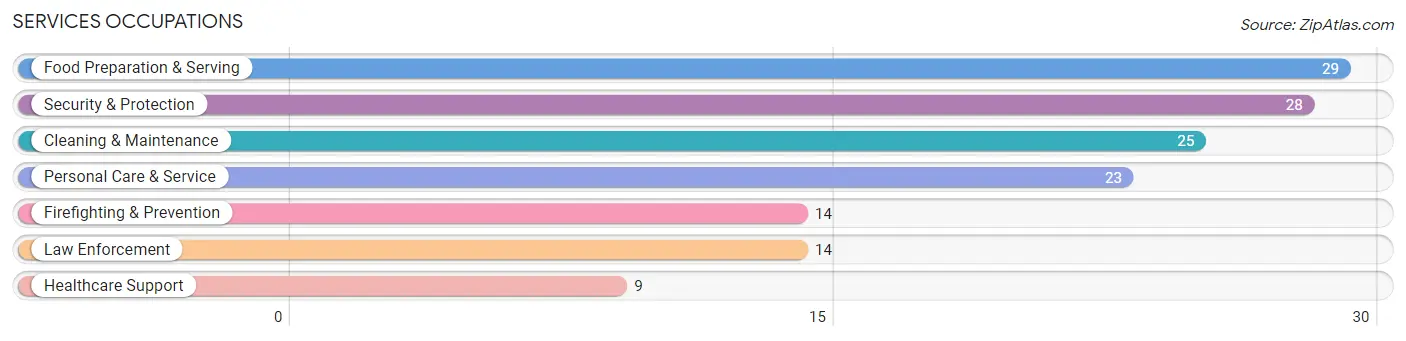
Services Occupations
The most common Services occupations in Haymarket are Food Preparation & Serving (29 | 3.2%), Security & Protection (28 | 3.0%), Cleaning & Maintenance (25 | 2.7%), Personal Care & Service (23 | 2.5%), and Firefighting & Prevention (14 | 1.5%).
Services Occupations by Sex
Within the Services occupations in Haymarket, the most male-oriented occupations are Law Enforcement (100.0%), Security & Protection (89.3%), and Food Preparation & Serving (82.8%), while the most female-oriented occupations are Healthcare Support (100.0%), Personal Care & Service (56.5%), and Cleaning & Maintenance (24.0%).
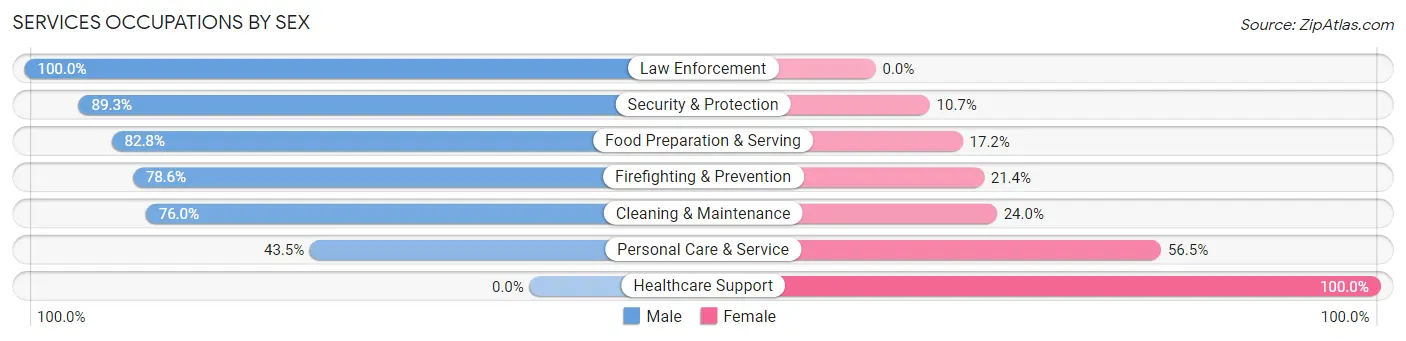
| Occupation | Male | Female |
| Healthcare Support | 0 (0.0%) | 9 (100.0%) |
| Security & Protection | 25 (89.3%) | 3 (10.7%) |
| Firefighting & Prevention | 11 (78.6%) | 3 (21.4%) |
| Law Enforcement | 14 (100.0%) | 0 (0.0%) |
| Food Preparation & Serving | 24 (82.8%) | 5 (17.2%) |
| Cleaning & Maintenance | 19 (76.0%) | 6 (24.0%) |
| Personal Care & Service | 10 (43.5%) | 13 (56.5%) |
| Total (Category) | 78 (68.4%) | 36 (31.6%) |
| Total (Overall) | 526 (57.2%) | 394 (42.8%) |
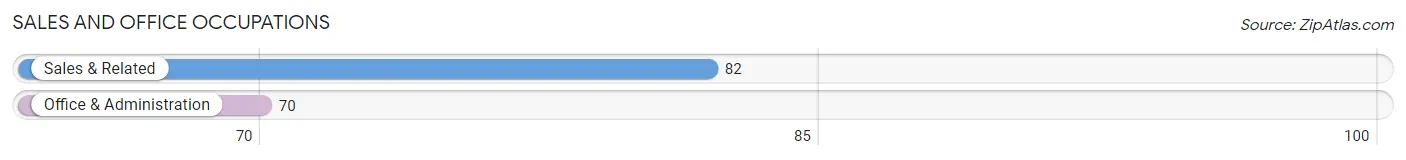
Sales and Office Occupations
The most common Sales and Office occupations in Haymarket are Sales & Related (82 | 8.9%), and Office & Administration (70 | 7.6%).
Sales and Office Occupations by Sex

| Occupation | Male | Female |
| Sales & Related | 44 (53.7%) | 38 (46.3%) |
| Office & Administration | 11 (15.7%) | 59 (84.3%) |
| Total (Category) | 55 (36.2%) | 97 (63.8%) |
| Total (Overall) | 526 (57.2%) | 394 (42.8%) |
Natural Resources, Construction and Maintenance Occupations
The most common Natural Resources, Construction and Maintenance occupations in Haymarket are Installation, Maintenance & Repair (39 | 4.2%), and Construction & Extraction (25 | 2.7%).
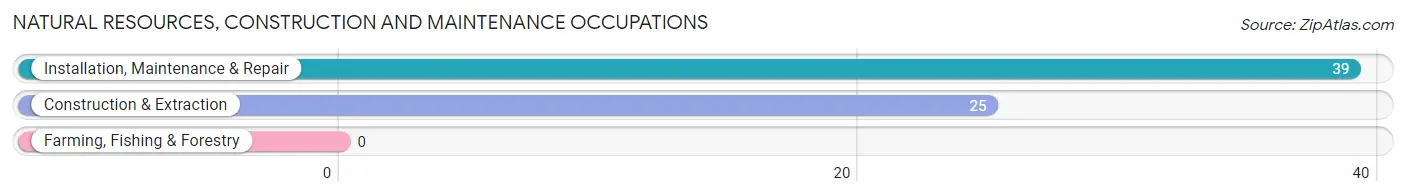
Natural Resources, Construction and Maintenance Occupations by Sex
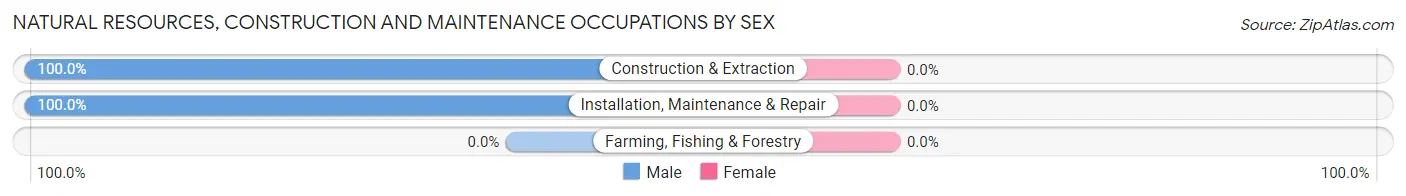
| Occupation | Male | Female |
| Farming, Fishing & Forestry | 0 (0.0%) | 0 (0.0%) |
| Construction & Extraction | 25 (100.0%) | 0 (0.0%) |
| Installation, Maintenance & Repair | 39 (100.0%) | 0 (0.0%) |
| Total (Category) | 64 (100.0%) | 0 (0.0%) |
| Total (Overall) | 526 (57.2%) | 394 (42.8%) |
Production, Transportation and Moving Occupations
The most common Production, Transportation and Moving occupations in Haymarket are Material Moving (49 | 5.3%), Production (23 | 2.5%), and Transportation (17 | 1.8%).

Production, Transportation and Moving Occupations by Sex
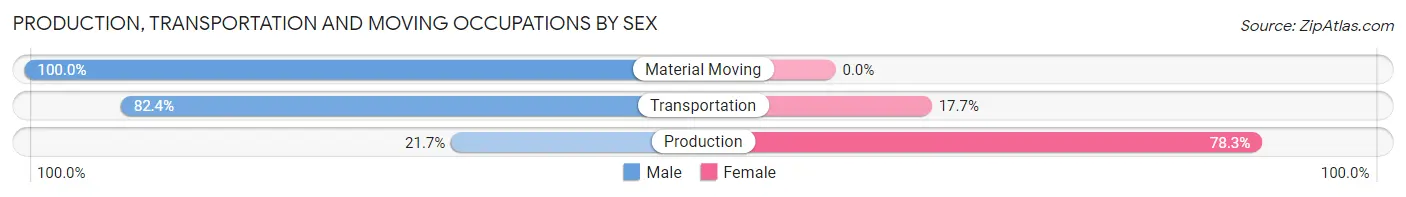
| Occupation | Male | Female |
| Production | 5 (21.7%) | 18 (78.3%) |
| Transportation | 14 (82.4%) | 3 (17.6%) |
| Material Moving | 49 (100.0%) | 0 (0.0%) |
| Total (Category) | 68 (76.4%) | 21 (23.6%) |
| Total (Overall) | 526 (57.2%) | 394 (42.8%) |
Employment Industries by Sex in Haymarket
Employment Industries in Haymarket
The major employment industries in Haymarket include Professional & Scientific (137 | 14.9%), Educational Services (136 | 14.8%), Retail Trade (107 | 11.6%), Public Administration (93 | 10.1%), and Health Care & Social Assistance (87 | 9.5%).
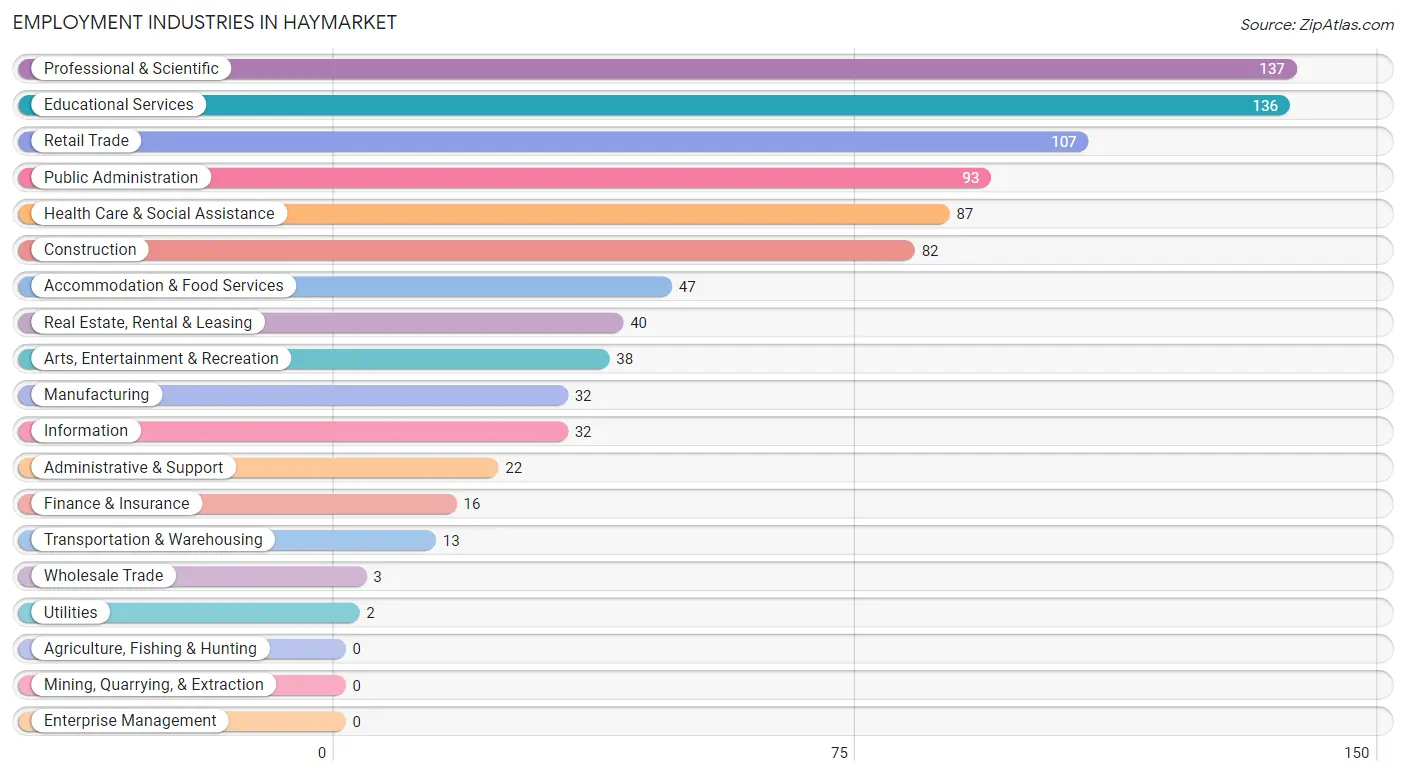
Employment Industries by Sex in Haymarket
The Haymarket industries that see more men than women are Construction (100.0%), Wholesale Trade (100.0%), and Transportation & Warehousing (100.0%), whereas the industries that tend to have a higher number of women are Educational Services (81.6%), Health Care & Social Assistance (67.8%), and Real Estate, Rental & Leasing (57.5%).
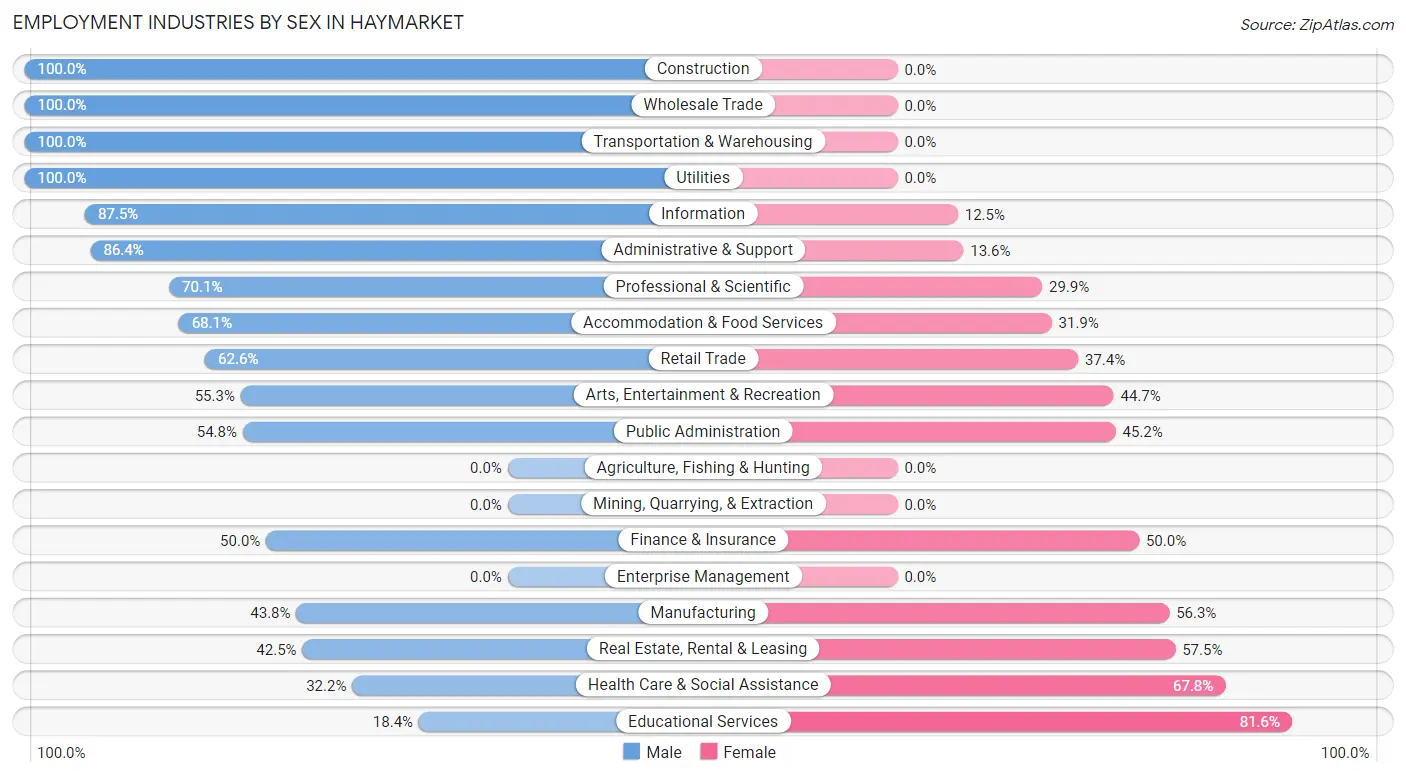
| Industry | Male | Female |
| Agriculture, Fishing & Hunting | 0 (0.0%) | 0 (0.0%) |
| Mining, Quarrying, & Extraction | 0 (0.0%) | 0 (0.0%) |
| Construction | 82 (100.0%) | 0 (0.0%) |
| Manufacturing | 14 (43.8%) | 18 (56.2%) |
| Wholesale Trade | 3 (100.0%) | 0 (0.0%) |
| Retail Trade | 67 (62.6%) | 40 (37.4%) |
| Transportation & Warehousing | 13 (100.0%) | 0 (0.0%) |
| Utilities | 2 (100.0%) | 0 (0.0%) |
| Information | 28 (87.5%) | 4 (12.5%) |
| Finance & Insurance | 8 (50.0%) | 8 (50.0%) |
| Real Estate, Rental & Leasing | 17 (42.5%) | 23 (57.5%) |
| Professional & Scientific | 96 (70.1%) | 41 (29.9%) |
| Enterprise Management | 0 (0.0%) | 0 (0.0%) |
| Administrative & Support | 19 (86.4%) | 3 (13.6%) |
| Educational Services | 25 (18.4%) | 111 (81.6%) |
| Health Care & Social Assistance | 28 (32.2%) | 59 (67.8%) |
| Arts, Entertainment & Recreation | 21 (55.3%) | 17 (44.7%) |
| Accommodation & Food Services | 32 (68.1%) | 15 (31.9%) |
| Public Administration | 51 (54.8%) | 42 (45.2%) |
| Total | 526 (57.2%) | 394 (42.8%) |
Education in Haymarket
School Enrollment in Haymarket
The most common levels of schooling among the 429 students in Haymarket are high school (111 | 25.9%), middle school (108 | 25.2%), and college / undergraduate (74 | 17.2%).
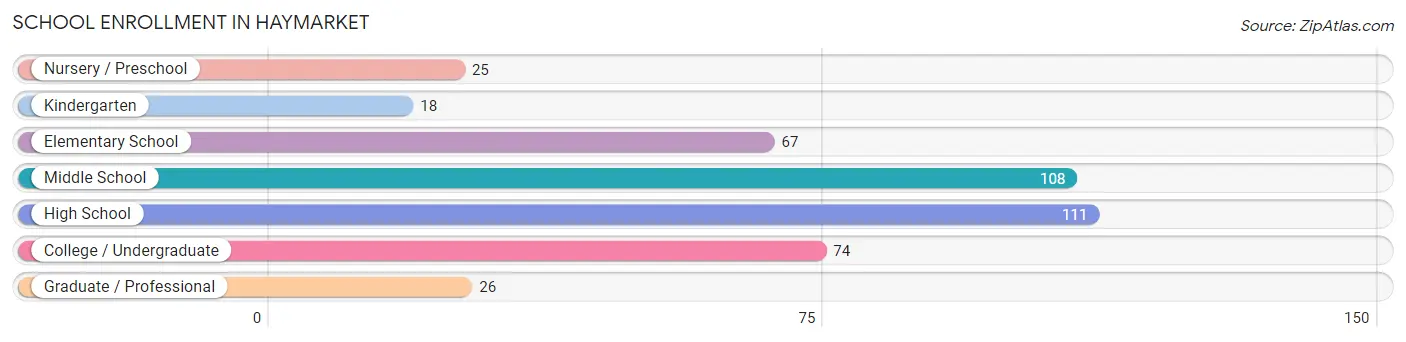
| School Level | # Students | % Students |
| Nursery / Preschool | 25 | 5.8% |
| Kindergarten | 18 | 4.2% |
| Elementary School | 67 | 15.6% |
| Middle School | 108 | 25.2% |
| High School | 111 | 25.9% |
| College / Undergraduate | 74 | 17.2% |
| Graduate / Professional | 26 | 6.1% |
| Total | 429 | 100.0% |
School Enrollment by Age by Funding Source in Haymarket
Out of a total of 429 students who are enrolled in schools in Haymarket, 67 (15.6%) attend a private institution, while the remaining 362 (84.4%) are enrolled in public schools. The age group of 25 to 34 year olds has the highest likelihood of being enrolled in private schools, with 7 (70.0% in the age bracket) enrolled. Conversely, the age group of 10 to 14 year olds has the lowest likelihood of being enrolled in a private school, with 135 (95.7% in the age bracket) attending a public institution.
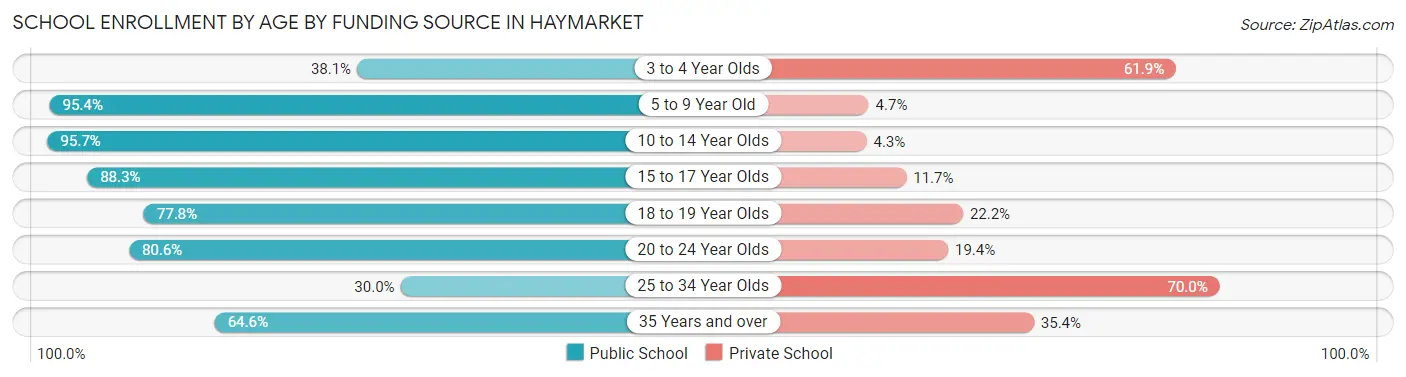
| Age Bracket | Public School | Private School |
| 3 to 4 Year Olds | 8 (38.1%) | 13 (61.9%) |
| 5 to 9 Year Old | 82 (95.4%) | 4 (4.6%) |
| 10 to 14 Year Olds | 135 (95.7%) | 6 (4.3%) |
| 15 to 17 Year Olds | 53 (88.3%) | 7 (11.7%) |
| 18 to 19 Year Olds | 21 (77.8%) | 6 (22.2%) |
| 20 to 24 Year Olds | 29 (80.6%) | 7 (19.4%) |
| 25 to 34 Year Olds | 3 (30.0%) | 7 (70.0%) |
| 35 Years and over | 31 (64.6%) | 17 (35.4%) |
| Total | 362 (84.4%) | 67 (15.6%) |
Educational Attainment by Field of Study in Haymarket
Business (135 | 23.0%), arts & humanities (61 | 10.4%), social sciences (56 | 9.5%), education (56 | 9.5%), and science & technology (51 | 8.7%) are the most common fields of study among 587 individuals in Haymarket who have obtained a bachelor's degree or higher.
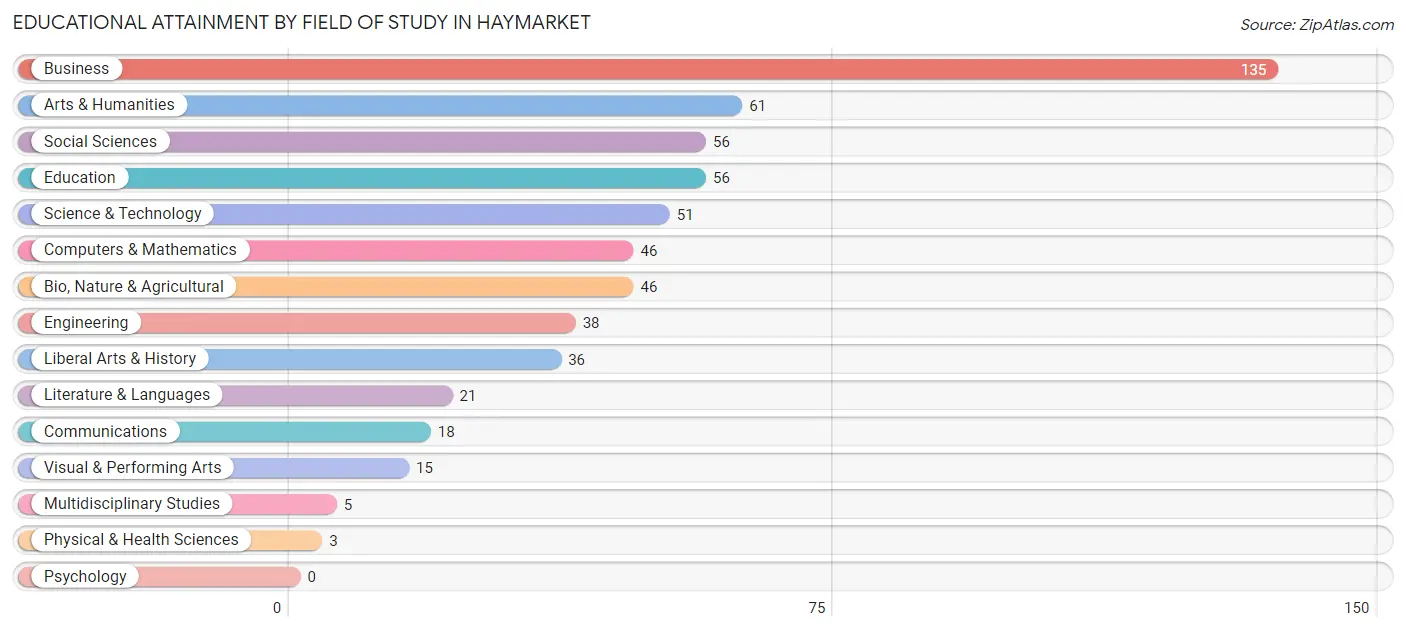
| Field of Study | # Graduates | % Graduates |
| Computers & Mathematics | 46 | 7.8% |
| Bio, Nature & Agricultural | 46 | 7.8% |
| Physical & Health Sciences | 3 | 0.5% |
| Psychology | 0 | 0.0% |
| Social Sciences | 56 | 9.5% |
| Engineering | 38 | 6.5% |
| Multidisciplinary Studies | 5 | 0.9% |
| Science & Technology | 51 | 8.7% |
| Business | 135 | 23.0% |
| Education | 56 | 9.5% |
| Literature & Languages | 21 | 3.6% |
| Liberal Arts & History | 36 | 6.1% |
| Visual & Performing Arts | 15 | 2.6% |
| Communications | 18 | 3.1% |
| Arts & Humanities | 61 | 10.4% |
| Total | 587 | 100.0% |
Transportation & Commute in Haymarket
Vehicle Availability by Sex in Haymarket
The most prevalent vehicle ownership categories in Haymarket are males with 3 vehicles (220, accounting for 42.5%) and females with 3 vehicles (117, making up 59.5%).
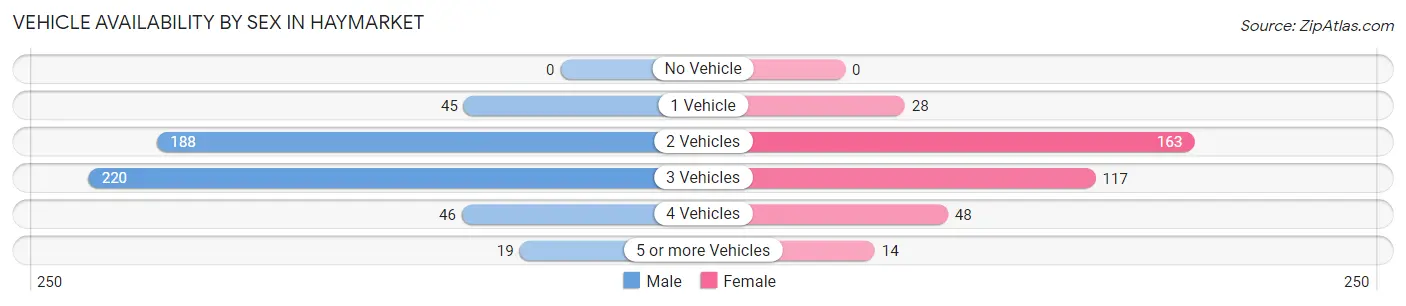
| Vehicles Available | Male | Female |
| No Vehicle | 0 (0.0%) | 0 (0.0%) |
| 1 Vehicle | 45 (8.7%) | 28 (7.6%) |
| 2 Vehicles | 188 (36.3%) | 163 (44.1%) |
| 3 Vehicles | 220 (42.5%) | 117 (31.6%) |
| 4 Vehicles | 46 (8.9%) | 48 (13.0%) |
| 5 or more Vehicles | 19 (3.7%) | 14 (3.8%) |
| Total | 518 (100.0%) | 370 (100.0%) |
Commute Time in Haymarket
The most frequently occuring commute durations in Haymarket are 45 to 59 minutes (118 commuters, 15.4%), 30 to 34 minutes (109 commuters, 14.2%), and 60 to 89 minutes (94 commuters, 12.3%).
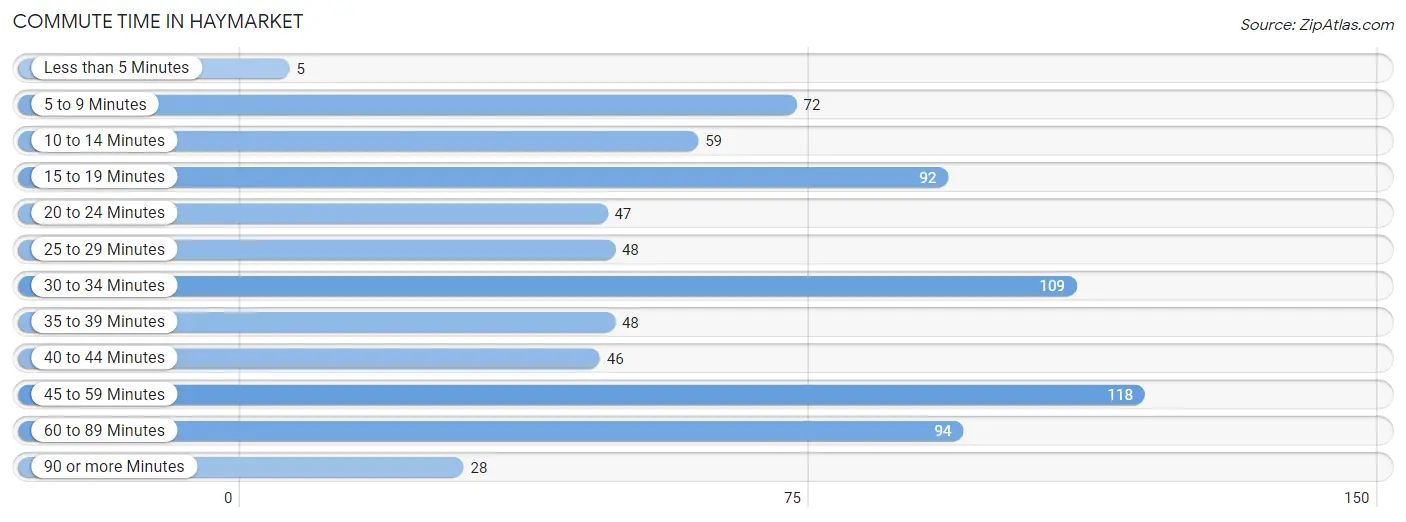
| Commute Time | # Commuters | % Commuters |
| Less than 5 Minutes | 5 | 0.6% |
| 5 to 9 Minutes | 72 | 9.4% |
| 10 to 14 Minutes | 59 | 7.7% |
| 15 to 19 Minutes | 92 | 12.0% |
| 20 to 24 Minutes | 47 | 6.1% |
| 25 to 29 Minutes | 48 | 6.3% |
| 30 to 34 Minutes | 109 | 14.2% |
| 35 to 39 Minutes | 48 | 6.3% |
| 40 to 44 Minutes | 46 | 6.0% |
| 45 to 59 Minutes | 118 | 15.4% |
| 60 to 89 Minutes | 94 | 12.3% |
| 90 or more Minutes | 28 | 3.7% |
Commute Time by Sex in Haymarket
The most common commute times in Haymarket are 30 to 34 minutes (70 commuters, 15.3%) for males and 45 to 59 minutes (54 commuters, 17.4%) for females.
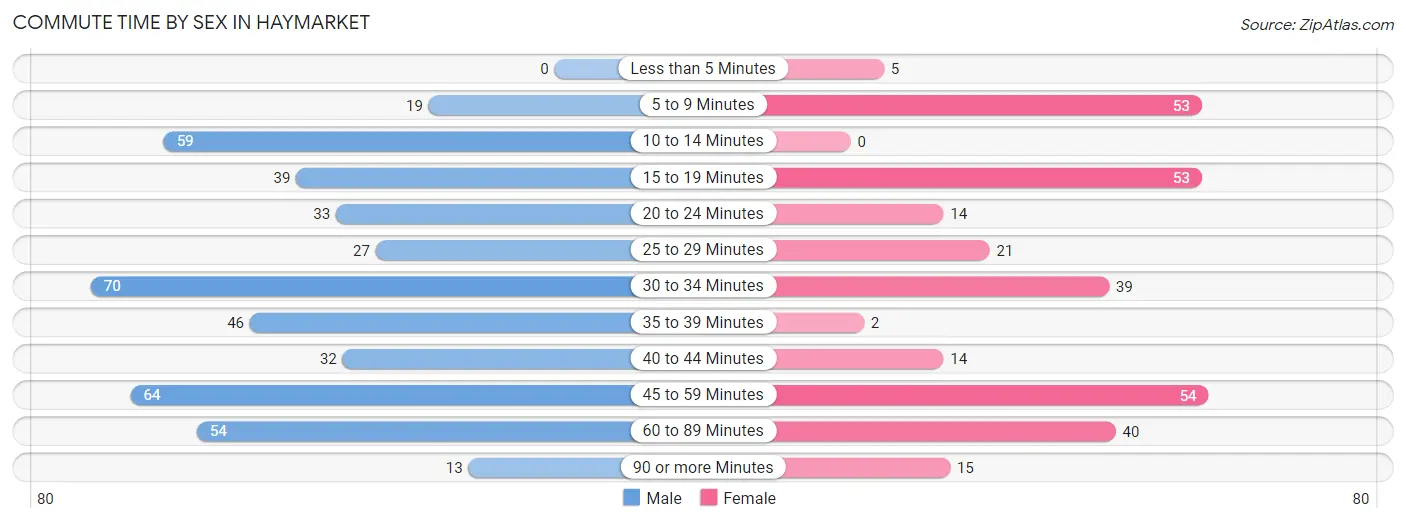
| Commute Time | Male | Female |
| Less than 5 Minutes | 0 (0.0%) | 5 (1.6%) |
| 5 to 9 Minutes | 19 (4.2%) | 53 (17.1%) |
| 10 to 14 Minutes | 59 (12.9%) | 0 (0.0%) |
| 15 to 19 Minutes | 39 (8.6%) | 53 (17.1%) |
| 20 to 24 Minutes | 33 (7.2%) | 14 (4.5%) |
| 25 to 29 Minutes | 27 (5.9%) | 21 (6.8%) |
| 30 to 34 Minutes | 70 (15.3%) | 39 (12.6%) |
| 35 to 39 Minutes | 46 (10.1%) | 2 (0.6%) |
| 40 to 44 Minutes | 32 (7.0%) | 14 (4.5%) |
| 45 to 59 Minutes | 64 (14.0%) | 54 (17.4%) |
| 60 to 89 Minutes | 54 (11.8%) | 40 (12.9%) |
| 90 or more Minutes | 13 (2.9%) | 15 (4.8%) |
Time of Departure to Work by Sex in Haymarket
The most frequent times of departure to work in Haymarket are 5:30 AM to 5:59 AM (90, 19.7%) for males and 5:30 AM to 5:59 AM (46, 14.8%) for females.
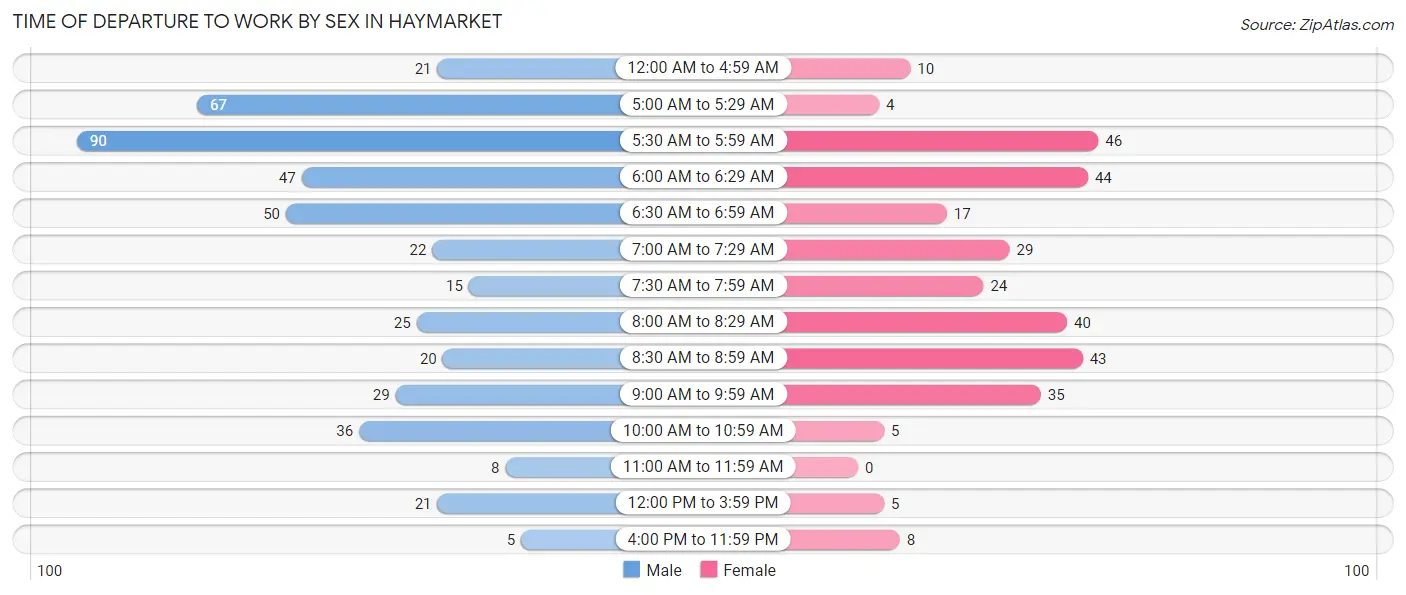
| Time of Departure | Male | Female |
| 12:00 AM to 4:59 AM | 21 (4.6%) | 10 (3.2%) |
| 5:00 AM to 5:29 AM | 67 (14.7%) | 4 (1.3%) |
| 5:30 AM to 5:59 AM | 90 (19.7%) | 46 (14.8%) |
| 6:00 AM to 6:29 AM | 47 (10.3%) | 44 (14.2%) |
| 6:30 AM to 6:59 AM | 50 (11.0%) | 17 (5.5%) |
| 7:00 AM to 7:29 AM | 22 (4.8%) | 29 (9.3%) |
| 7:30 AM to 7:59 AM | 15 (3.3%) | 24 (7.7%) |
| 8:00 AM to 8:29 AM | 25 (5.5%) | 40 (12.9%) |
| 8:30 AM to 8:59 AM | 20 (4.4%) | 43 (13.9%) |
| 9:00 AM to 9:59 AM | 29 (6.4%) | 35 (11.3%) |
| 10:00 AM to 10:59 AM | 36 (7.9%) | 5 (1.6%) |
| 11:00 AM to 11:59 AM | 8 (1.8%) | 0 (0.0%) |
| 12:00 PM to 3:59 PM | 21 (4.6%) | 5 (1.6%) |
| 4:00 PM to 11:59 PM | 5 (1.1%) | 8 (2.6%) |
| Total | 456 (100.0%) | 310 (100.0%) |
Housing Occupancy in Haymarket
Occupancy by Ownership in Haymarket
Of the total 529 dwellings in Haymarket, owner-occupied units account for 438 (82.8%), while renter-occupied units make up 91 (17.2%).
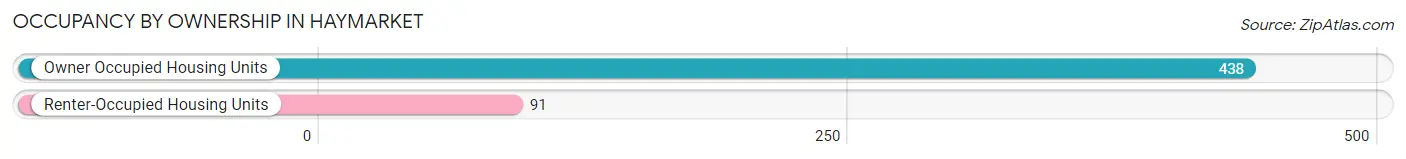
| Occupancy | # Housing Units | % Housing Units |
| Owner Occupied Housing Units | 438 | 82.8% |
| Renter-Occupied Housing Units | 91 | 17.2% |
| Total Occupied Housing Units | 529 | 100.0% |
Occupancy by Household Size in Haymarket
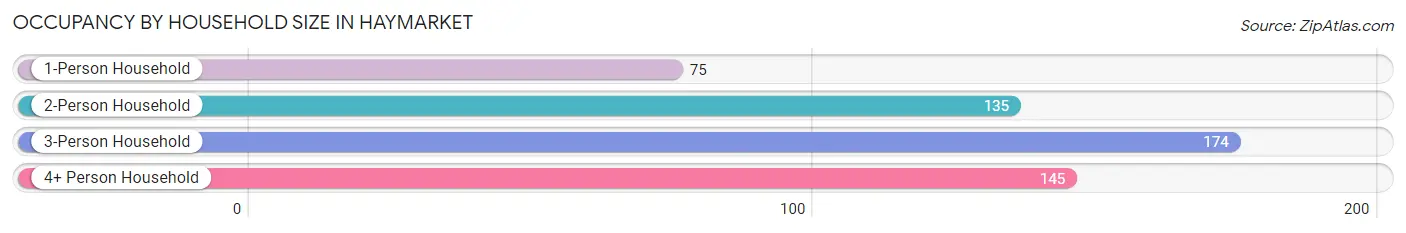
| Household Size | # Housing Units | % Housing Units |
| 1-Person Household | 75 | 14.2% |
| 2-Person Household | 135 | 25.5% |
| 3-Person Household | 174 | 32.9% |
| 4+ Person Household | 145 | 27.4% |
| Total Housing Units | 529 | 100.0% |
Occupancy by Ownership by Household Size in Haymarket
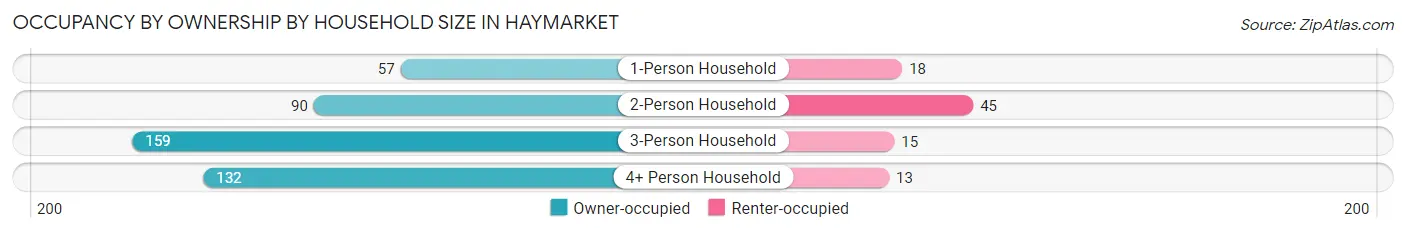
| Household Size | Owner-occupied | Renter-occupied |
| 1-Person Household | 57 (76.0%) | 18 (24.0%) |
| 2-Person Household | 90 (66.7%) | 45 (33.3%) |
| 3-Person Household | 159 (91.4%) | 15 (8.6%) |
| 4+ Person Household | 132 (91.0%) | 13 (9.0%) |
| Total Housing Units | 438 (82.8%) | 91 (17.2%) |
Occupancy by Educational Attainment in Haymarket
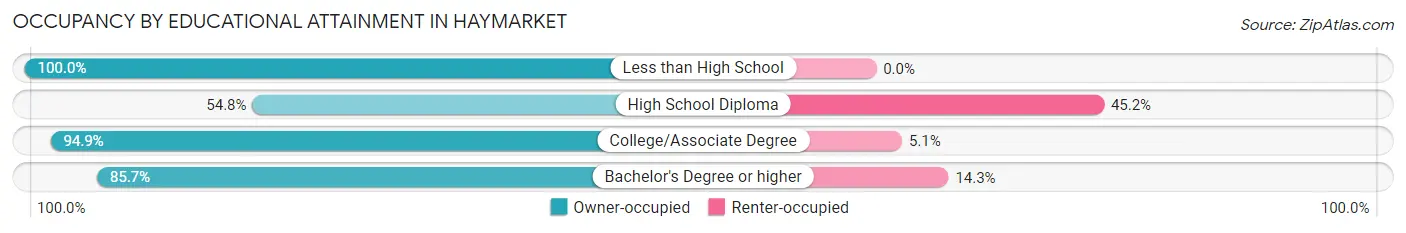
| Household Size | Owner-occupied | Renter-occupied |
| Less than High School | 19 (100.0%) | 0 (0.0%) |
| High School Diploma | 51 (54.8%) | 42 (45.2%) |
| College/Associate Degree | 111 (94.9%) | 6 (5.1%) |
| Bachelor's Degree or higher | 257 (85.7%) | 43 (14.3%) |
Occupancy by Age of Householder in Haymarket
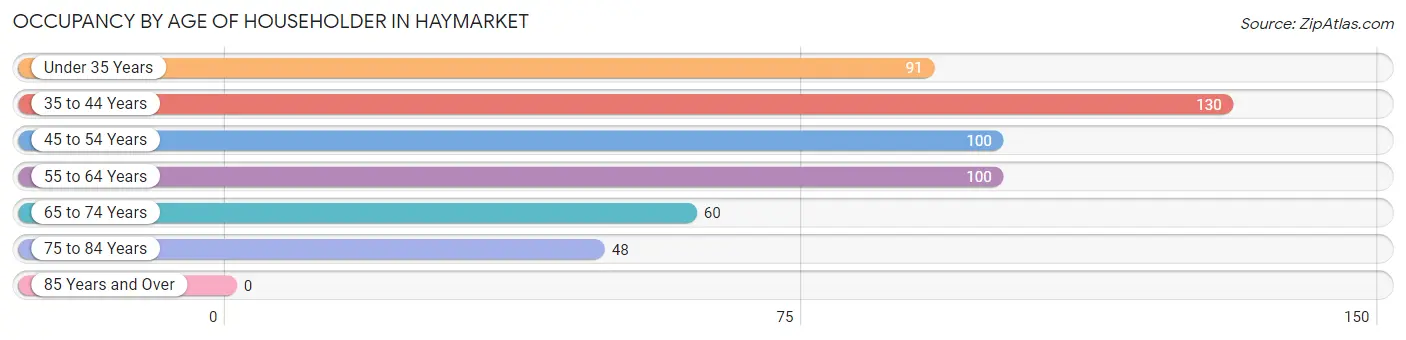
| Age Bracket | # Households | % Households |
| Under 35 Years | 91 | 17.2% |
| 35 to 44 Years | 130 | 24.6% |
| 45 to 54 Years | 100 | 18.9% |
| 55 to 64 Years | 100 | 18.9% |
| 65 to 74 Years | 60 | 11.3% |
| 75 to 84 Years | 48 | 9.1% |
| 85 Years and Over | 0 | 0.0% |
| Total | 529 | 100.0% |
Housing Finances in Haymarket
Median Income by Occupancy in Haymarket
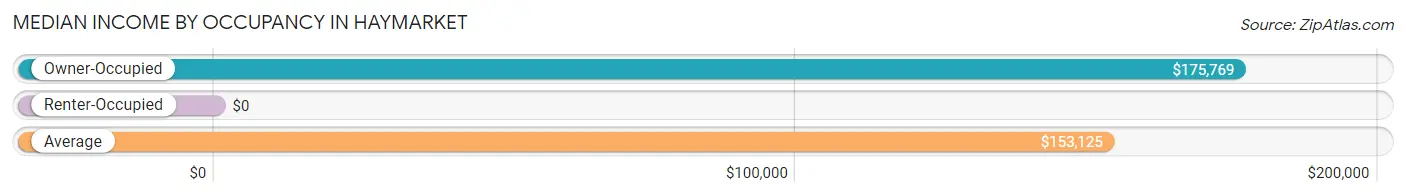
| Occupancy Type | # Households | Median Income |
| Owner-Occupied | 438 (82.8%) | $175,769 |
| Renter-Occupied | 91 (17.2%) | $0 |
| Average | 529 (100.0%) | $153,125 |
Occupancy by Householder Income Bracket in Haymarket
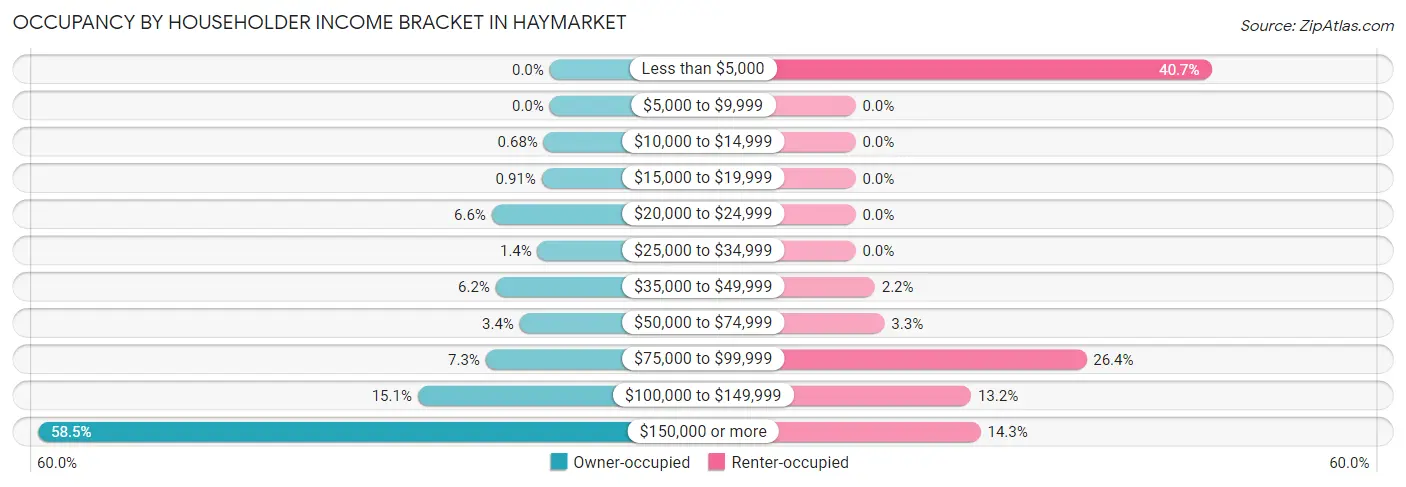
| Income Bracket | Owner-occupied | Renter-occupied |
| Less than $5,000 | 0 (0.0%) | 37 (40.7%) |
| $5,000 to $9,999 | 0 (0.0%) | 0 (0.0%) |
| $10,000 to $14,999 | 3 (0.7%) | 0 (0.0%) |
| $15,000 to $19,999 | 4 (0.9%) | 0 (0.0%) |
| $20,000 to $24,999 | 29 (6.6%) | 0 (0.0%) |
| $25,000 to $34,999 | 6 (1.4%) | 0 (0.0%) |
| $35,000 to $49,999 | 27 (6.2%) | 2 (2.2%) |
| $50,000 to $74,999 | 15 (3.4%) | 3 (3.3%) |
| $75,000 to $99,999 | 32 (7.3%) | 24 (26.4%) |
| $100,000 to $149,999 | 66 (15.1%) | 12 (13.2%) |
| $150,000 or more | 256 (58.5%) | 13 (14.3%) |
| Total | 438 (100.0%) | 91 (100.0%) |
Monthly Housing Cost Tiers in Haymarket
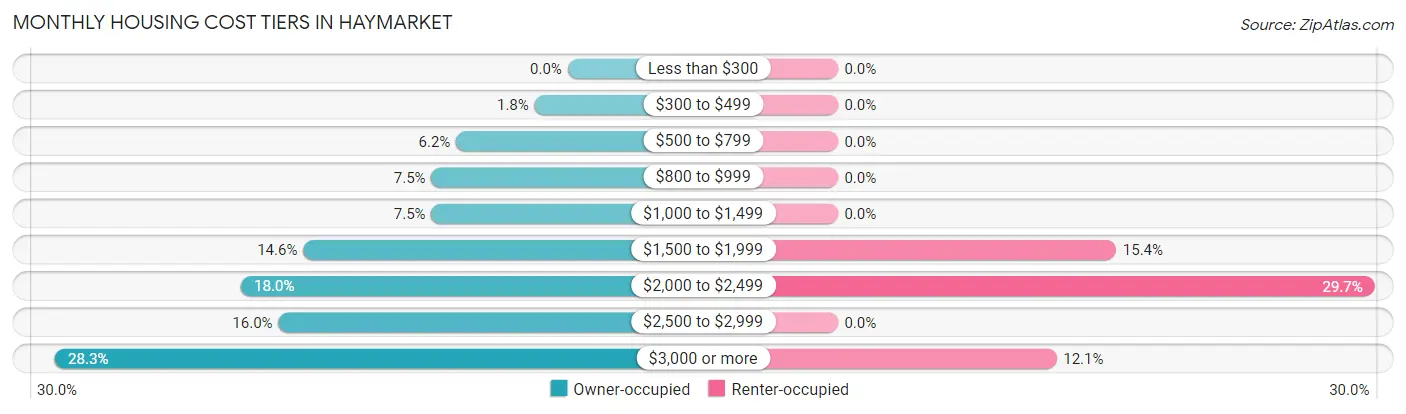
| Monthly Cost | Owner-occupied | Renter-occupied |
| Less than $300 | 0 (0.0%) | 0 (0.0%) |
| $300 to $499 | 8 (1.8%) | 0 (0.0%) |
| $500 to $799 | 27 (6.2%) | 0 (0.0%) |
| $800 to $999 | 33 (7.5%) | 0 (0.0%) |
| $1,000 to $1,499 | 33 (7.5%) | 0 (0.0%) |
| $1,500 to $1,999 | 64 (14.6%) | 14 (15.4%) |
| $2,000 to $2,499 | 79 (18.0%) | 27 (29.7%) |
| $2,500 to $2,999 | 70 (16.0%) | 0 (0.0%) |
| $3,000 or more | 124 (28.3%) | 11 (12.1%) |
| Total | 438 (100.0%) | 91 (100.0%) |
Physical Housing Characteristics in Haymarket
Housing Structures in Haymarket
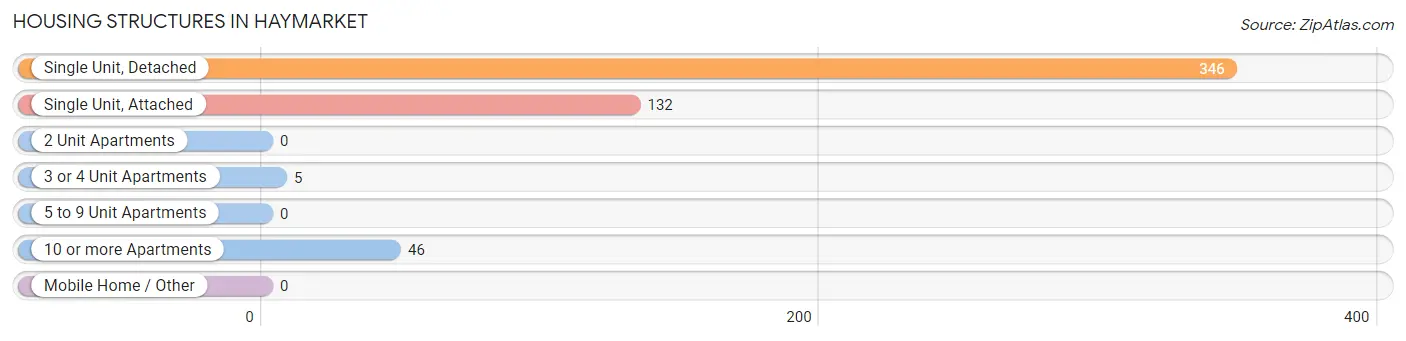
| Structure Type | # Housing Units | % Housing Units |
| Single Unit, Detached | 346 | 65.4% |
| Single Unit, Attached | 132 | 24.9% |
| 2 Unit Apartments | 0 | 0.0% |
| 3 or 4 Unit Apartments | 5 | 0.9% |
| 5 to 9 Unit Apartments | 0 | 0.0% |
| 10 or more Apartments | 46 | 8.7% |
| Mobile Home / Other | 0 | 0.0% |
| Total | 529 | 100.0% |
Housing Structures by Occupancy in Haymarket
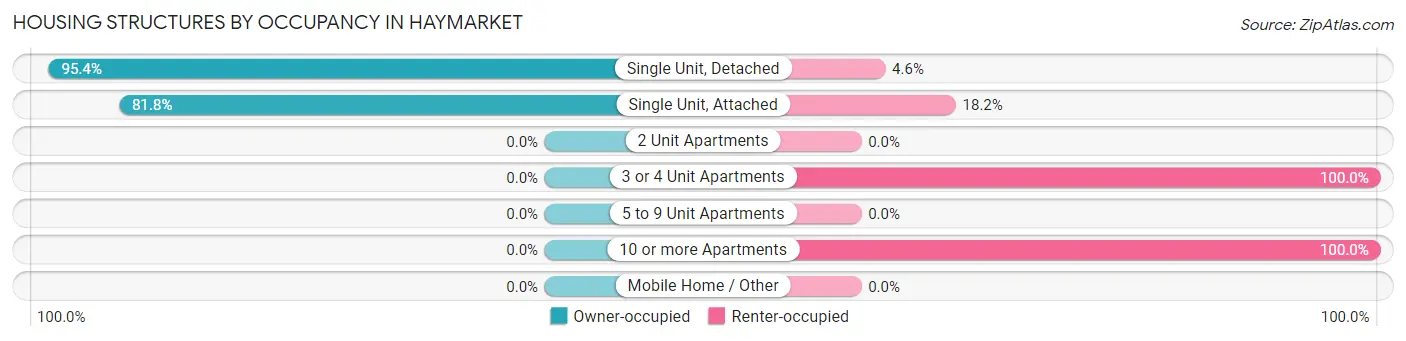
| Structure Type | Owner-occupied | Renter-occupied |
| Single Unit, Detached | 330 (95.4%) | 16 (4.6%) |
| Single Unit, Attached | 108 (81.8%) | 24 (18.2%) |
| 2 Unit Apartments | 0 (0.0%) | 0 (0.0%) |
| 3 or 4 Unit Apartments | 0 (0.0%) | 5 (100.0%) |
| 5 to 9 Unit Apartments | 0 (0.0%) | 0 (0.0%) |
| 10 or more Apartments | 0 (0.0%) | 46 (100.0%) |
| Mobile Home / Other | 0 (0.0%) | 0 (0.0%) |
| Total | 438 (82.8%) | 91 (17.2%) |
Housing Structures by Number of Rooms in Haymarket
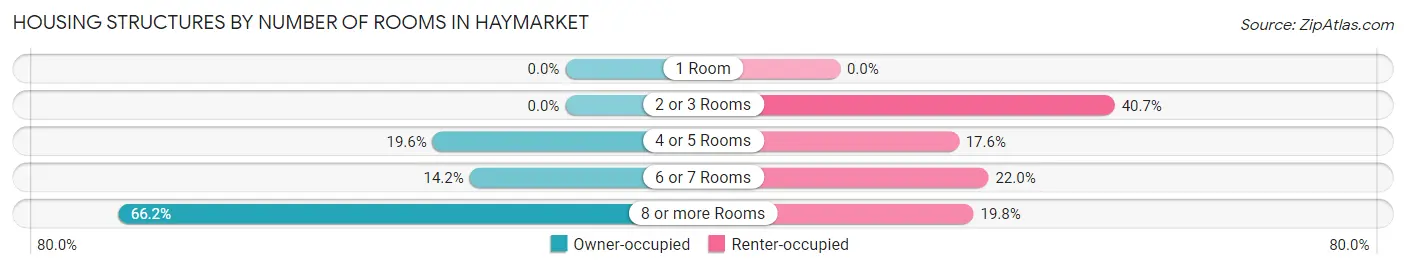
| Number of Rooms | Owner-occupied | Renter-occupied |
| 1 Room | 0 (0.0%) | 0 (0.0%) |
| 2 or 3 Rooms | 0 (0.0%) | 37 (40.7%) |
| 4 or 5 Rooms | 86 (19.6%) | 16 (17.6%) |
| 6 or 7 Rooms | 62 (14.2%) | 20 (22.0%) |
| 8 or more Rooms | 290 (66.2%) | 18 (19.8%) |
| Total | 438 (100.0%) | 91 (100.0%) |
Housing Structure by Heating Type in Haymarket
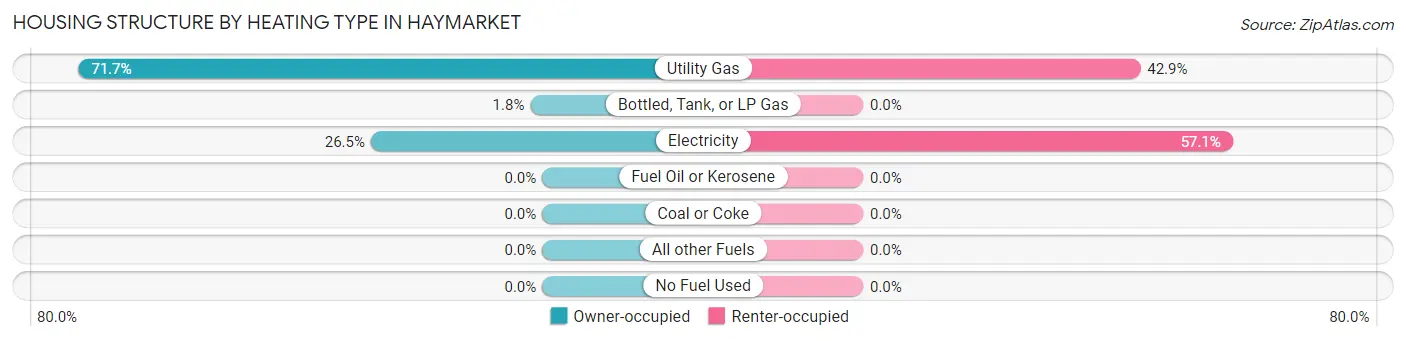
| Heating Type | Owner-occupied | Renter-occupied |
| Utility Gas | 314 (71.7%) | 39 (42.9%) |
| Bottled, Tank, or LP Gas | 8 (1.8%) | 0 (0.0%) |
| Electricity | 116 (26.5%) | 52 (57.1%) |
| Fuel Oil or Kerosene | 0 (0.0%) | 0 (0.0%) |
| Coal or Coke | 0 (0.0%) | 0 (0.0%) |
| All other Fuels | 0 (0.0%) | 0 (0.0%) |
| No Fuel Used | 0 (0.0%) | 0 (0.0%) |
| Total | 438 (100.0%) | 91 (100.0%) |
Household Vehicle Usage in Haymarket
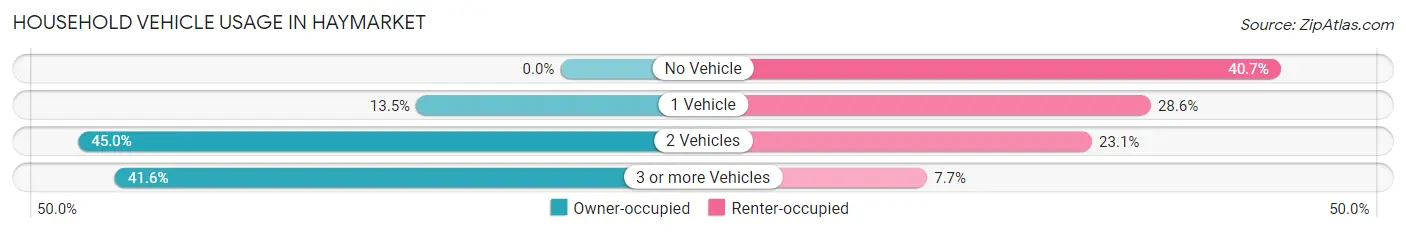
| Vehicles per Household | Owner-occupied | Renter-occupied |
| No Vehicle | 0 (0.0%) | 37 (40.7%) |
| 1 Vehicle | 59 (13.5%) | 26 (28.6%) |
| 2 Vehicles | 197 (45.0%) | 21 (23.1%) |
| 3 or more Vehicles | 182 (41.5%) | 7 (7.7%) |
| Total | 438 (100.0%) | 91 (100.0%) |
Real Estate & Mortgages in Haymarket
Real Estate and Mortgage Overview in Haymarket
| Characteristic | Without Mortgage | With Mortgage |
| Housing Units | 59 | 379 |
| Median Property Value | $539,300 | $570,400 |
| Median Household Income | - | - |
| Monthly Housing Costs | $844 | $124 |
| Real Estate Taxes | $5,750 | $4 |
Property Value by Mortgage Status in Haymarket
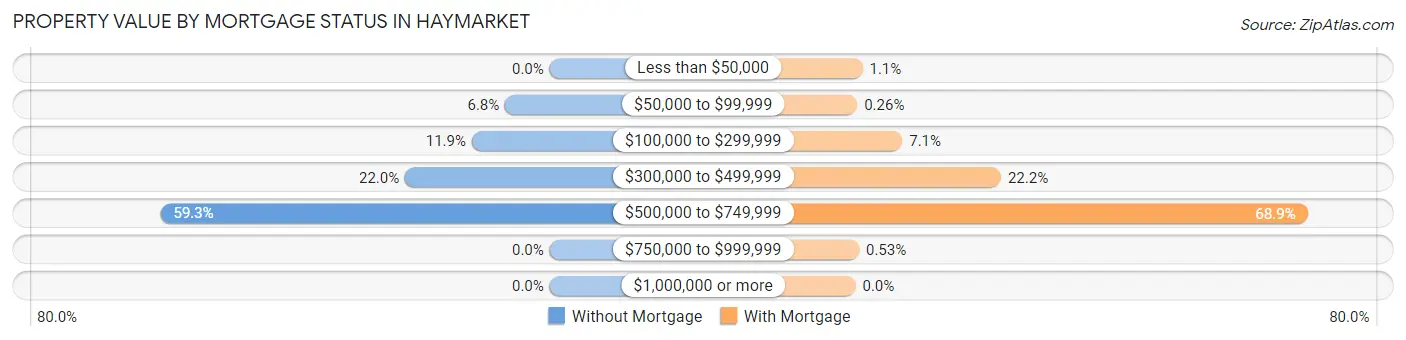
| Property Value | Without Mortgage | With Mortgage |
| Less than $50,000 | 0 (0.0%) | 4 (1.1%) |
| $50,000 to $99,999 | 4 (6.8%) | 1 (0.3%) |
| $100,000 to $299,999 | 7 (11.9%) | 27 (7.1%) |
| $300,000 to $499,999 | 13 (22.0%) | 84 (22.2%) |
| $500,000 to $749,999 | 35 (59.3%) | 261 (68.9%) |
| $750,000 to $999,999 | 0 (0.0%) | 2 (0.5%) |
| $1,000,000 or more | 0 (0.0%) | 0 (0.0%) |
| Total | 59 (100.0%) | 379 (100.0%) |
Household Income by Mortgage Status in Haymarket
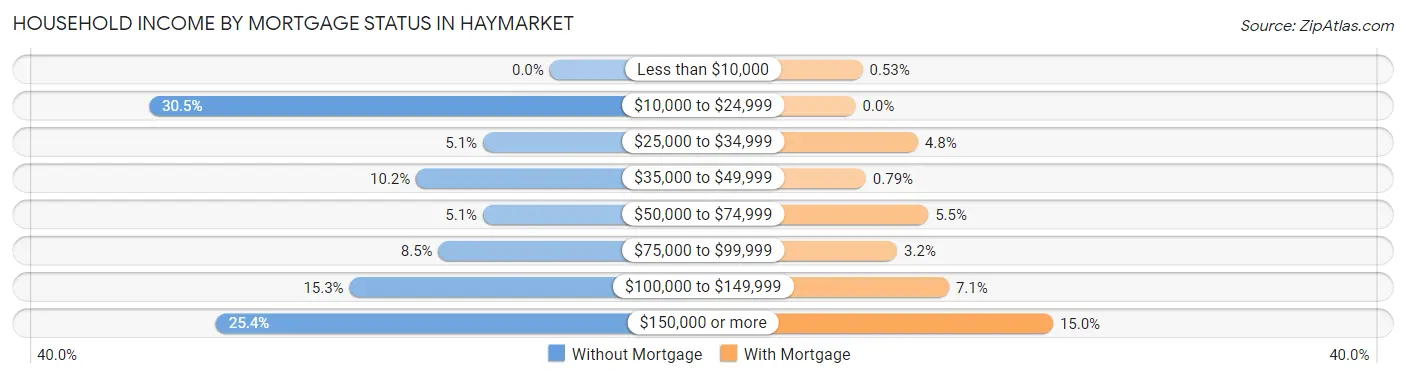
| Household Income | Without Mortgage | With Mortgage |
| Less than $10,000 | 0 (0.0%) | 2 (0.5%) |
| $10,000 to $24,999 | 18 (30.5%) | 0 (0.0%) |
| $25,000 to $34,999 | 3 (5.1%) | 18 (4.8%) |
| $35,000 to $49,999 | 6 (10.2%) | 3 (0.8%) |
| $50,000 to $74,999 | 3 (5.1%) | 21 (5.5%) |
| $75,000 to $99,999 | 5 (8.5%) | 12 (3.2%) |
| $100,000 to $149,999 | 9 (15.2%) | 27 (7.1%) |
| $150,000 or more | 15 (25.4%) | 57 (15.0%) |
| Total | 59 (100.0%) | 379 (100.0%) |
Property Value to Household Income Ratio in Haymarket
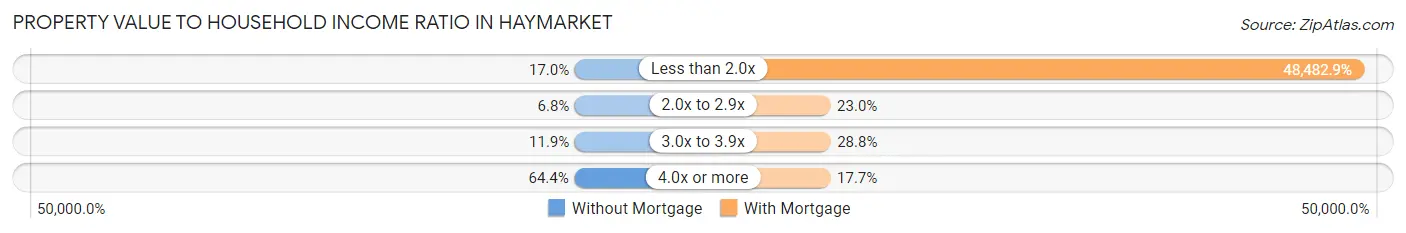
| Value-to-Income Ratio | Without Mortgage | With Mortgage |
| Less than 2.0x | 10 (17.0%) | 183,750 (48,482.9%) |
| 2.0x to 2.9x | 4 (6.8%) | 87 (23.0%) |
| 3.0x to 3.9x | 7 (11.9%) | 109 (28.8%) |
| 4.0x or more | 38 (64.4%) | 67 (17.7%) |
| Total | 59 (100.0%) | 379 (100.0%) |
Real Estate Taxes by Mortgage Status in Haymarket
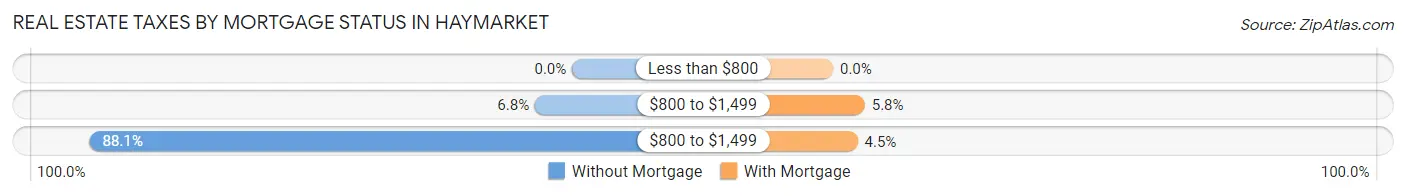
| Property Taxes | Without Mortgage | With Mortgage |
| Less than $800 | 0 (0.0%) | 0 (0.0%) |
| $800 to $1,499 | 4 (6.8%) | 22 (5.8%) |
| $800 to $1,499 | 52 (88.1%) | 17 (4.5%) |
| Total | 59 (100.0%) | 379 (100.0%) |
Health & Disability in Haymarket
Health Insurance Coverage by Age in Haymarket
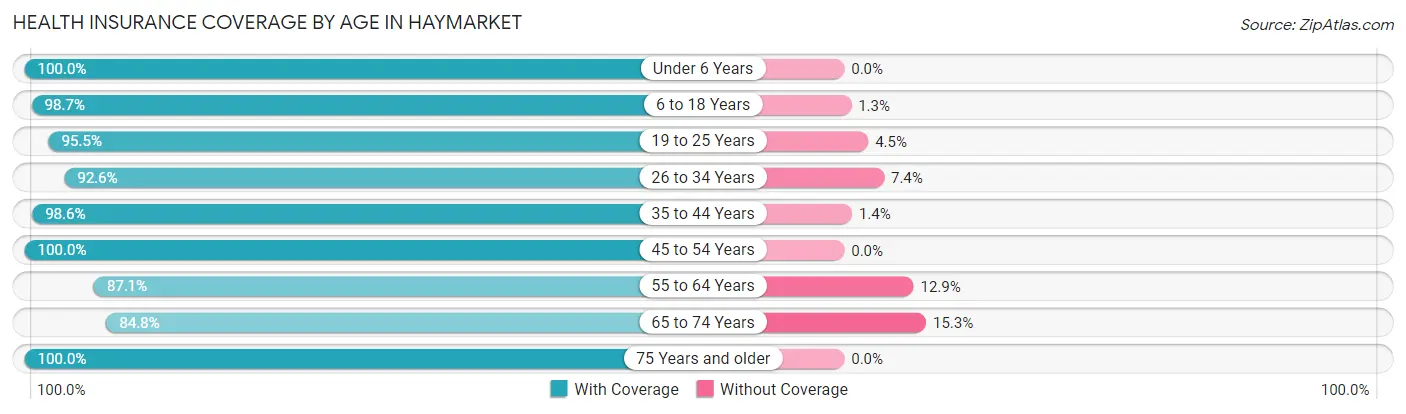
| Age Bracket | With Coverage | Without Coverage |
| Under 6 Years | 86 (100.0%) | 0 (0.0%) |
| 6 to 18 Years | 306 (98.7%) | 4 (1.3%) |
| 19 to 25 Years | 193 (95.5%) | 9 (4.5%) |
| 26 to 34 Years | 125 (92.6%) | 10 (7.4%) |
| 35 to 44 Years | 276 (98.6%) | 4 (1.4%) |
| 45 to 54 Years | 197 (100.0%) | 0 (0.0%) |
| 55 to 64 Years | 155 (87.1%) | 23 (12.9%) |
| 65 to 74 Years | 100 (84.8%) | 18 (15.2%) |
| 75 Years and older | 66 (100.0%) | 0 (0.0%) |
| Total | 1,504 (95.7%) | 68 (4.3%) |
Health Insurance Coverage by Citizenship Status in Haymarket
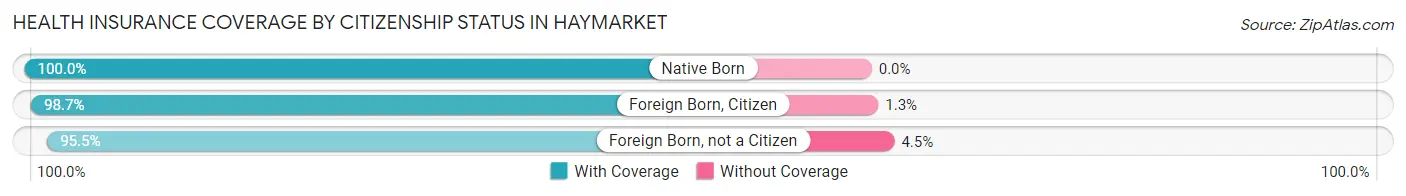
| Citizenship Status | With Coverage | Without Coverage |
| Native Born | 86 (100.0%) | 0 (0.0%) |
| Foreign Born, Citizen | 306 (98.7%) | 4 (1.3%) |
| Foreign Born, not a Citizen | 193 (95.5%) | 9 (4.5%) |
Health Insurance Coverage by Household Income in Haymarket
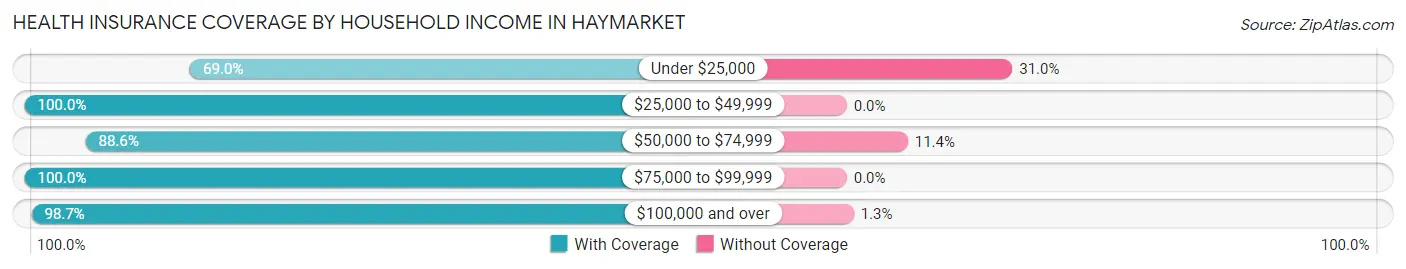
| Household Income | With Coverage | Without Coverage |
| Under $25,000 | 109 (69.0%) | 49 (31.0%) |
| $25,000 to $49,999 | 55 (100.0%) | 0 (0.0%) |
| $50,000 to $74,999 | 31 (88.6%) | 4 (11.4%) |
| $75,000 to $99,999 | 156 (100.0%) | 0 (0.0%) |
| $100,000 and over | 1,146 (98.7%) | 15 (1.3%) |
Public vs Private Health Insurance Coverage by Age in Haymarket
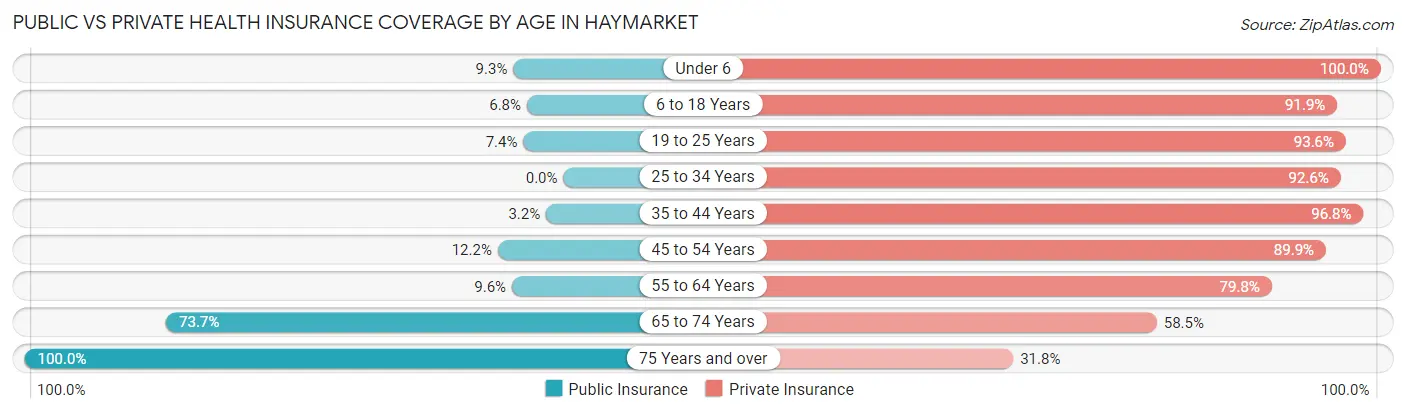
| Age Bracket | Public Insurance | Private Insurance |
| Under 6 | 8 (9.3%) | 86 (100.0%) |
| 6 to 18 Years | 21 (6.8%) | 285 (91.9%) |
| 19 to 25 Years | 15 (7.4%) | 189 (93.6%) |
| 25 to 34 Years | 0 (0.0%) | 125 (92.6%) |
| 35 to 44 Years | 9 (3.2%) | 271 (96.8%) |
| 45 to 54 Years | 24 (12.2%) | 177 (89.8%) |
| 55 to 64 Years | 17 (9.6%) | 142 (79.8%) |
| 65 to 74 Years | 87 (73.7%) | 69 (58.5%) |
| 75 Years and over | 66 (100.0%) | 21 (31.8%) |
| Total | 247 (15.7%) | 1,365 (86.8%) |
Disability Status by Sex by Age in Haymarket
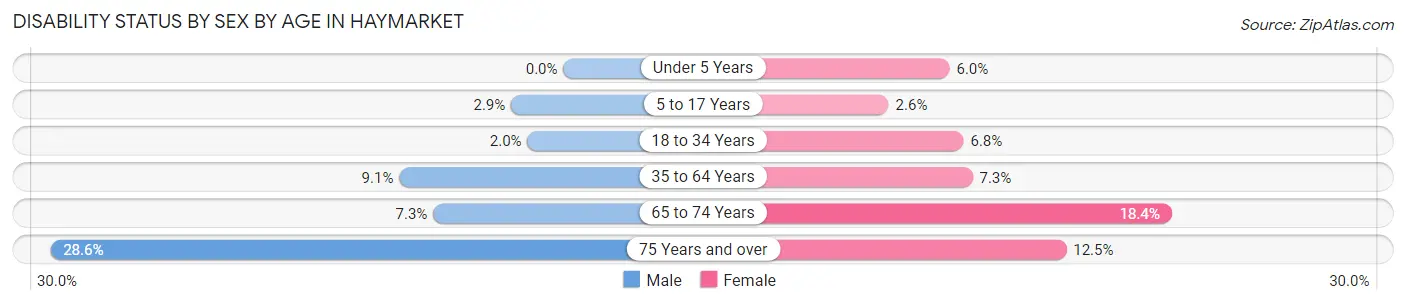
| Age Bracket | Male | Female |
| Under 5 Years | 0 (0.0%) | 3 (6.0%) |
| 5 to 17 Years | 5 (2.9%) | 3 (2.6%) |
| 18 to 34 Years | 5 (2.0%) | 8 (6.8%) |
| 35 to 64 Years | 31 (9.1%) | 23 (7.3%) |
| 65 to 74 Years | 5 (7.2%) | 9 (18.4%) |
| 75 Years and over | 12 (28.6%) | 3 (12.5%) |
Disability Class by Sex by Age in Haymarket
Disability Class: Hearing Difficulty
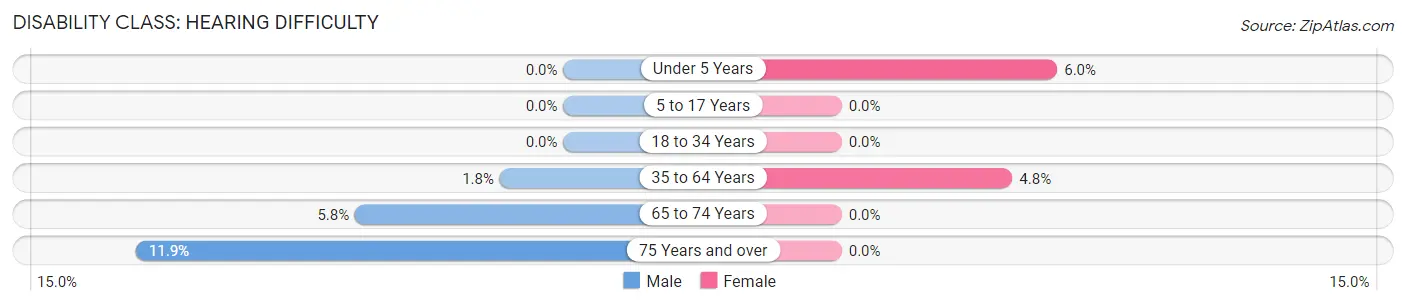
| Age Bracket | Male | Female |
| Under 5 Years | 0 (0.0%) | 3 (6.0%) |
| 5 to 17 Years | 0 (0.0%) | 0 (0.0%) |
| 18 to 34 Years | 0 (0.0%) | 0 (0.0%) |
| 35 to 64 Years | 6 (1.8%) | 15 (4.8%) |
| 65 to 74 Years | 4 (5.8%) | 0 (0.0%) |
| 75 Years and over | 5 (11.9%) | 0 (0.0%) |
Disability Class: Vision Difficulty
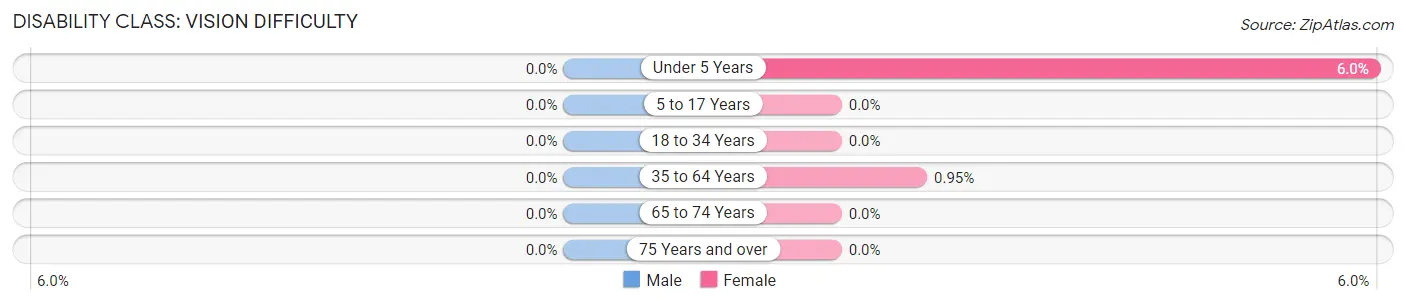
| Age Bracket | Male | Female |
| Under 5 Years | 0 (0.0%) | 3 (6.0%) |
| 5 to 17 Years | 0 (0.0%) | 0 (0.0%) |
| 18 to 34 Years | 0 (0.0%) | 0 (0.0%) |
| 35 to 64 Years | 0 (0.0%) | 3 (0.9%) |
| 65 to 74 Years | 0 (0.0%) | 0 (0.0%) |
| 75 Years and over | 0 (0.0%) | 0 (0.0%) |
Disability Class: Cognitive Difficulty
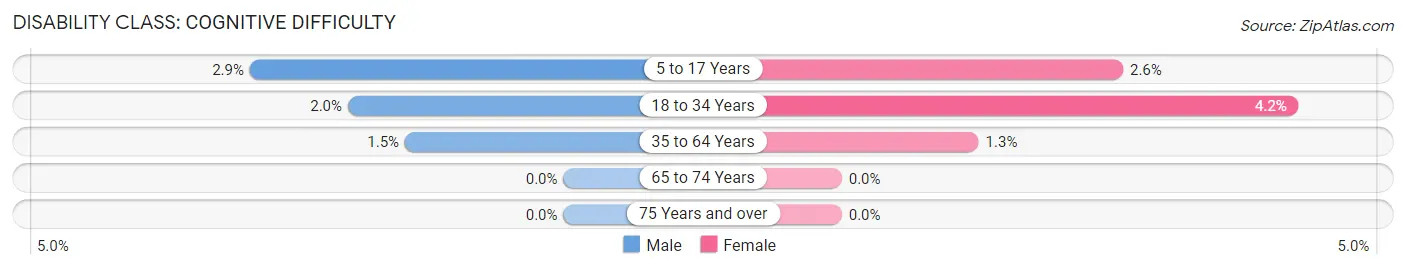
| Age Bracket | Male | Female |
| 5 to 17 Years | 5 (2.9%) | 3 (2.6%) |
| 18 to 34 Years | 5 (2.0%) | 5 (4.2%) |
| 35 to 64 Years | 5 (1.5%) | 4 (1.3%) |
| 65 to 74 Years | 0 (0.0%) | 0 (0.0%) |
| 75 Years and over | 0 (0.0%) | 0 (0.0%) |
Disability Class: Ambulatory Difficulty
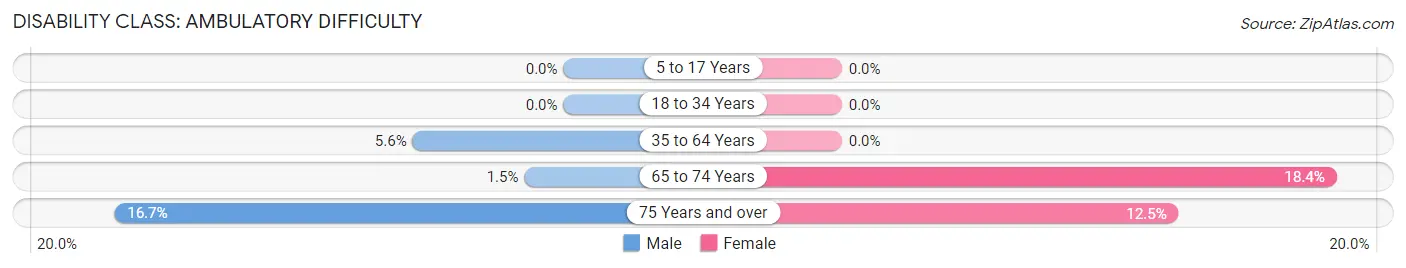
| Age Bracket | Male | Female |
| 5 to 17 Years | 0 (0.0%) | 0 (0.0%) |
| 18 to 34 Years | 0 (0.0%) | 0 (0.0%) |
| 35 to 64 Years | 19 (5.6%) | 0 (0.0%) |
| 65 to 74 Years | 1 (1.5%) | 9 (18.4%) |
| 75 Years and over | 7 (16.7%) | 3 (12.5%) |
Disability Class: Self-Care Difficulty
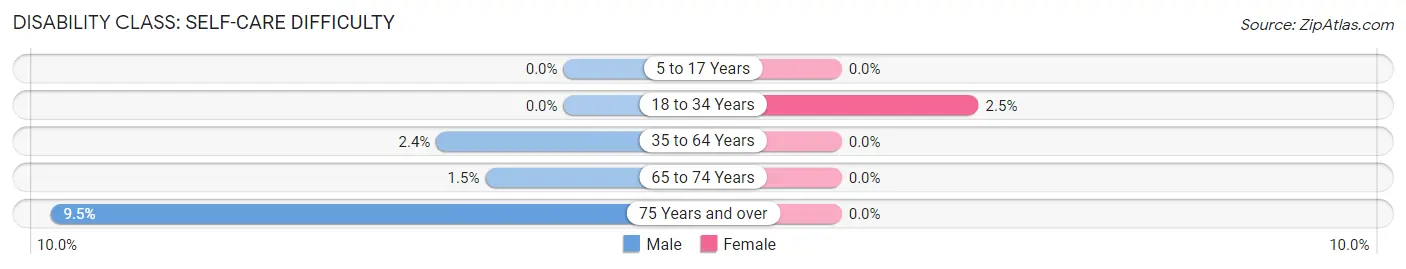
| Age Bracket | Male | Female |
| 5 to 17 Years | 0 (0.0%) | 0 (0.0%) |
| 18 to 34 Years | 0 (0.0%) | 3 (2.5%) |
| 35 to 64 Years | 8 (2.4%) | 0 (0.0%) |
| 65 to 74 Years | 1 (1.5%) | 0 (0.0%) |
| 75 Years and over | 4 (9.5%) | 0 (0.0%) |
Technology Access in Haymarket
Computing Device Access in Haymarket
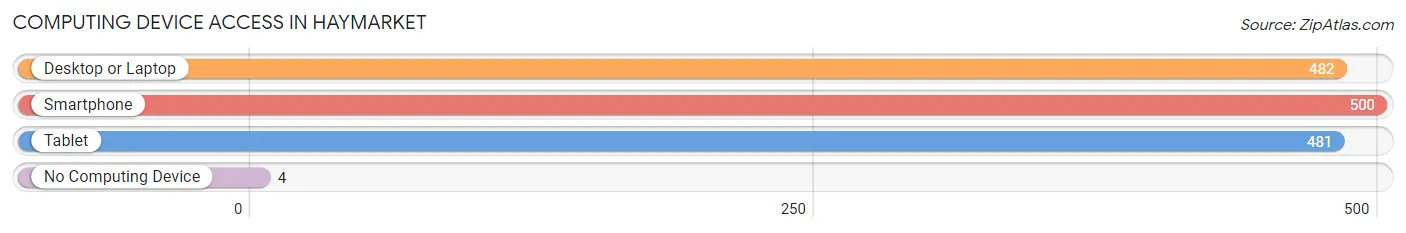
| Device Type | # Households | % Households |
| Desktop or Laptop | 482 | 91.1% |
| Smartphone | 500 | 94.5% |
| Tablet | 481 | 90.9% |
| No Computing Device | 4 | 0.8% |
| Total | 529 | 100.0% |
Internet Access in Haymarket
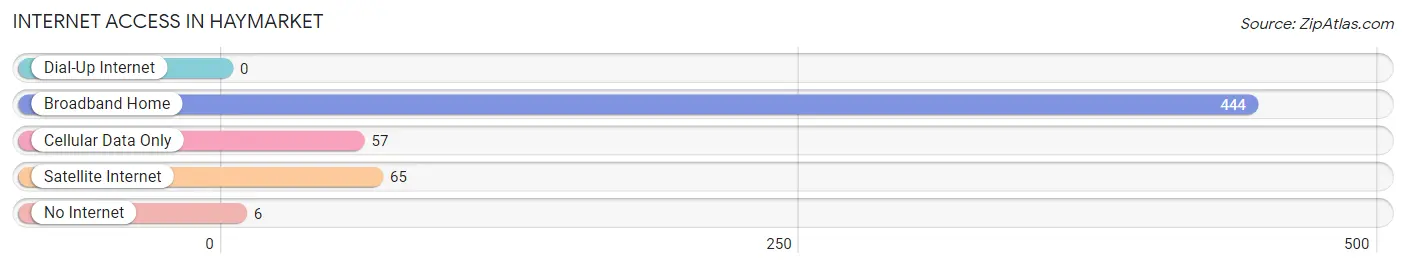
| Internet Type | # Households | % Households |
| Dial-Up Internet | 0 | 0.0% |
| Broadband Home | 444 | 83.9% |
| Cellular Data Only | 57 | 10.8% |
| Satellite Internet | 65 | 12.3% |
| No Internet | 6 | 1.1% |
| Total | 529 | 100.0% |
Haymarket Summary
History
The area now known as Haymarket, Virginia was first settled in the late 1700s by German and Scots-Irish immigrants. The town was originally known as “New Berlin” and was located in Prince William County. The town was renamed Haymarket in 1882 after the nearby Battle of Haymarket during the Civil War. The town was officially incorporated in 1884.
In the late 1800s, Haymarket was a small agricultural community with a population of just over 500 people. The town was home to several small businesses, including a general store, a blacksmith shop, and a gristmill. The town also had a post office, a school, and a church.
In the early 1900s, Haymarket began to grow and develop. The town was connected to the Washington, D.C. area by the Washington & Old Dominion Railroad in 1908. This allowed for the growth of the town’s population and economy. The town also became a popular tourist destination due to its proximity to the nation’s capital.
In the mid-1900s, Haymarket continued to grow and develop. The town was home to several businesses, including a grocery store, a hardware store, and a movie theater. The town also had a library, a fire station, and a police station.
In the late 1900s, Haymarket experienced a period of rapid growth. The town was home to several large businesses, including a shopping center, a hospital, and a movie theater. The town also had a library, a fire station, and a police station.
Geography
Haymarket is located in Prince William County, Virginia. The town is situated in the northern part of the county, about 30 miles west of Washington, D.C. The town is located at the intersection of U.S. Route 15 and U.S. Route 29.
The town is situated in the foothills of the Blue Ridge Mountains. The town is surrounded by rolling hills and forests. The town is also located near several rivers, including the Occoquan River and the Bull Run River.
The climate in Haymarket is temperate. The town experiences hot, humid summers and cold, wet winters. The average temperature in the summer is around 80 degrees Fahrenheit, and the average temperature in the winter is around 40 degrees Fahrenheit.
Economy
The economy of Haymarket is largely based on tourism and retail. The town is home to several large businesses, including a shopping center, a hospital, and a movie theater. The town also has several small businesses, including restaurants, bars, and shops.
The town is also home to several large employers, including the Prince William County Government, the Haymarket Medical Center, and the Haymarket Post Office. The town is also home to several small businesses, including restaurants, bars, and shops.
Demographics
As of the 2010 census, the population of Haymarket was 1,782. The town has a population density of 1,845 people per square mile. The median age in the town is 37.7 years.
The racial makeup of the town is 87.3% White, 5.3% African American, 0.3% Native American, 2.2% Asian, 0.1% Pacific Islander, 2.2% from other races, and 2.7% from two or more races. The town has a Hispanic or Latino population of 5.3%.
The median household income in the town is $90,917. The per capita income in the town is $37,845. The town has a poverty rate of 4.3%.
Common Questions
What is Per Capita Income in Haymarket?
Per Capita income in Haymarket is $58,325.
What is the Median Family Income in Haymarket?
Median Family Income in Haymarket is $185,625.
What is the Median Household income in Haymarket?
Median Household Income in Haymarket is $153,125.
What is Income or Wage Gap in Haymarket?
Income or Wage Gap in Haymarket is 16.0%.
Women in Haymarket earn 84.0 cents for every dollar earned by a man.
What is Inequality or Gini Index in Haymarket?
Inequality or Gini Index in Haymarket is 0.40.
What is the Total Population of Haymarket?
Total Population of Haymarket is 1,572.
What is the Total Male Population of Haymarket?
Total Male Population of Haymarket is 900.
What is the Total Female Population of Haymarket?
Total Female Population of Haymarket is 672.
What is the Ratio of Males per 100 Females in Haymarket?
There are 133.93 Males per 100 Females in Haymarket.
What is the Ratio of Females per 100 Males in Haymarket?
There are 74.67 Females per 100 Males in Haymarket.
What is the Median Population Age in Haymarket?
Median Population Age in Haymarket is 37.3 Years.
What is the Average Family Size in Haymarket
Average Family Size in Haymarket is 3.3 People.
What is the Average Household Size in Haymarket
Average Household Size in Haymarket is 3.0 People.
How Large is the Labor Force in Haymarket?
There are 961 People in the Labor Forcein in Haymarket.
What is the Percentage of People in the Labor Force in Haymarket?
76.8% of People are in the Labor Force in Haymarket.
What is the Unemployment Rate in Haymarket?
Unemployment Rate in Haymarket is 4.3%.