Franklin Farm, VA Map & Demographics
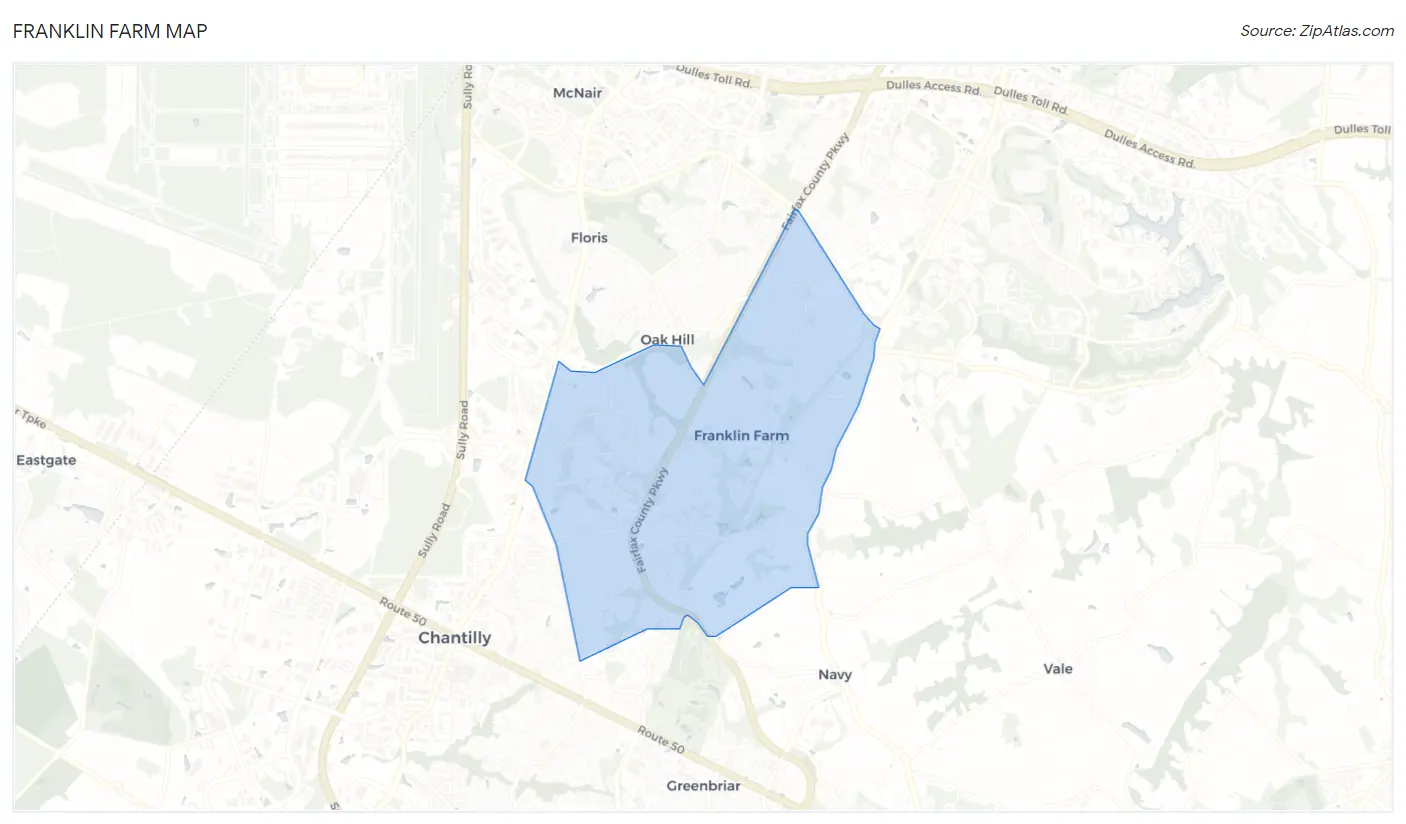
Franklin Farm Map
Franklin Farm Overview
$82,446
PER CAPITA INCOME
$221,381
AVG FAMILY INCOME
$209,442
AVG HOUSEHOLD INCOME
44.2%
WAGE / INCOME GAP [ % ]
55.8¢/ $1
WAGE / INCOME GAP [ $ ]
0.36
INEQUALITY / GINI INDEX
18,903
TOTAL POPULATION
9,776
MALE POPULATION
9,127
FEMALE POPULATION
107.11
MALES / 100 FEMALES
93.36
FEMALES / 100 MALES
42.3
MEDIAN AGE
3.3
AVG FAMILY SIZE
3.1
AVG HOUSEHOLD SIZE
10,636
LABOR FORCE [ PEOPLE ]
72.8%
PERCENT IN LABOR FORCE
2.5%
UNEMPLOYMENT RATE
Income in Franklin Farm
Income Overview in Franklin Farm
Per Capita Income in Franklin Farm is $82,446, while median incomes of families and households are $221,381 and $209,442 respectively.
| Characteristic | Number | Measure |
| Per Capita Income | 18,903 | $82,446 |
| Median Family Income | 5,391 | $221,381 |
| Mean Family Income | 5,391 | $263,607 |
| Median Household Income | 6,137 | $209,442 |
| Mean Household Income | 6,137 | $247,971 |
| Income Deficit | 5,391 | $0 |
| Wage / Income Gap (%) | 18,903 | 44.18% |
| Wage / Income Gap ($) | 18,903 | 55.82¢ per $1 |
| Gini / Inequality Index | 18,903 | 0.36 |
Earnings by Sex in Franklin Farm
Average Earnings in Franklin Farm are $99,175, $137,335 for men and $76,667 for women, a difference of 44.2%.
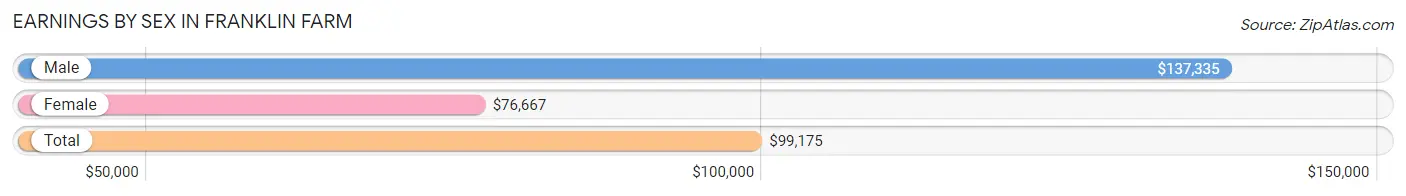
| Sex | Number | Average Earnings |
| Male | 6,045 (54.9%) | $137,335 |
| Female | 4,970 (45.1%) | $76,667 |
| Total | 11,015 (100.0%) | $99,175 |
Earnings by Sex by Income Bracket in Franklin Farm
The most common earnings brackets in Franklin Farm are $100,000+ for men (3,707 | 61.3%) and $100,000+ for women (1,783 | 35.9%).
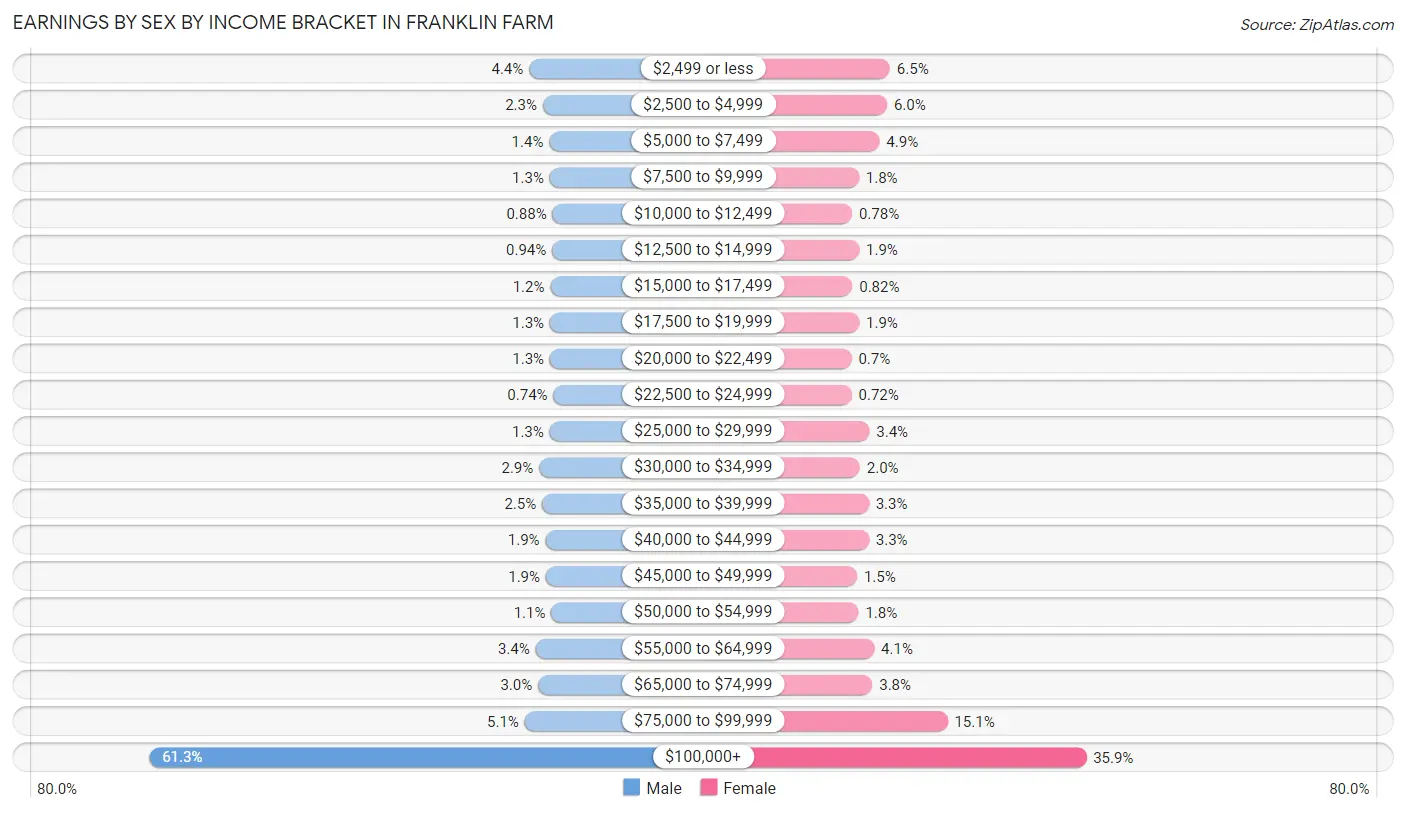
| Income | Male | Female |
| $2,499 or less | 265 (4.4%) | 321 (6.5%) |
| $2,500 to $4,999 | 141 (2.3%) | 299 (6.0%) |
| $5,000 to $7,499 | 83 (1.4%) | 243 (4.9%) |
| $7,500 to $9,999 | 78 (1.3%) | 90 (1.8%) |
| $10,000 to $12,499 | 53 (0.9%) | 39 (0.8%) |
| $12,500 to $14,999 | 57 (0.9%) | 92 (1.8%) |
| $15,000 to $17,499 | 73 (1.2%) | 41 (0.8%) |
| $17,500 to $19,999 | 76 (1.3%) | 92 (1.8%) |
| $20,000 to $22,499 | 76 (1.3%) | 35 (0.7%) |
| $22,500 to $24,999 | 45 (0.7%) | 36 (0.7%) |
| $25,000 to $29,999 | 79 (1.3%) | 168 (3.4%) |
| $30,000 to $34,999 | 174 (2.9%) | 97 (1.9%) |
| $35,000 to $39,999 | 148 (2.5%) | 163 (3.3%) |
| $40,000 to $44,999 | 117 (1.9%) | 164 (3.3%) |
| $45,000 to $49,999 | 113 (1.9%) | 76 (1.5%) |
| $50,000 to $54,999 | 64 (1.1%) | 87 (1.8%) |
| $55,000 to $64,999 | 207 (3.4%) | 204 (4.1%) |
| $65,000 to $74,999 | 184 (3.0%) | 190 (3.8%) |
| $75,000 to $99,999 | 305 (5.1%) | 750 (15.1%) |
| $100,000+ | 3,707 (61.3%) | 1,783 (35.9%) |
| Total | 6,045 (100.0%) | 4,970 (100.0%) |
Earnings by Sex by Educational Attainment in Franklin Farm
Average earnings in Franklin Farm are $150,010 for men and $90,472 for women, a difference of 39.7%. Men with an educational attainment of graduate degree enjoy the highest average annual earnings of $176,123, while those with high school diploma education earn the least with $33,056. Women with an educational attainment of graduate degree earn the most with the average annual earnings of $104,508, while those with less than high school education have the smallest earnings of $38,906.
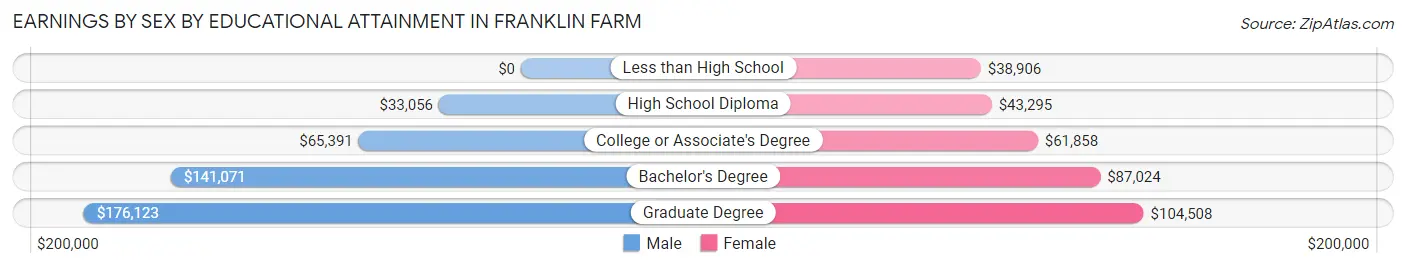
| Educational Attainment | Male Income | Female Income |
| Less than High School | - | - |
| High School Diploma | $33,056 | $43,295 |
| College or Associate's Degree | $65,391 | $61,858 |
| Bachelor's Degree | $141,071 | $87,024 |
| Graduate Degree | $176,123 | $104,508 |
| Total | $150,010 | $90,472 |
Family Income in Franklin Farm
Family Income Brackets in Franklin Farm
According to the Franklin Farm family income data, there are 3,003 families falling into the $200,000+ income range, which is the most common income bracket and makes up 55.7% of all families.
| Income Bracket | # Families | % Families |
| Less than $10,000 | 65 | 1.2% |
| $10,000 to $14,999 | 16 | 0.3% |
| $15,000 to $24,999 | 32 | 0.6% |
| $25,000 to $34,999 | 0 | 0.0% |
| $35,000 to $49,999 | 5 | 0.1% |
| $50,000 to $74,999 | 178 | 3.3% |
| $75,000 to $99,999 | 264 | 4.9% |
| $100,000 to $149,999 | 830 | 15.4% |
| $150,000 to $199,999 | 992 | 18.4% |
| $200,000+ | 3,003 | 55.7% |
Family Income by Famaliy Size in Franklin Farm
4-person families (1,412 | 26.2%) account for the highest median family income in Franklin Farm with $250,001 per family, while 2-person families (2,033 | 37.7%) have the highest median income of $84,254 per family member.
| Income Bracket | # Families | Median Income |
| 2-Person Families | 2,033 (37.7%) | $168,508 |
| 3-Person Families | 1,279 (23.7%) | $225,536 |
| 4-Person Families | 1,412 (26.2%) | $250,001 |
| 5-Person Families | 559 (10.4%) | $222,369 |
| 6-Person Families | 60 (1.1%) | $248,214 |
| 7+ Person Families | 48 (0.9%) | $223,438 |
| Total | 5,391 (100.0%) | $221,381 |
Family Income by Number of Earners in Franklin Farm
The median family income in Franklin Farm is $221,381, with families comprising 2 earners (2,952) having the highest median family income of $250,001, while families with no earners (488) have the lowest median family income of $121,667, accounting for 54.8% and 9.0% of families, respectively.
| Number of Earners | # Families | Median Income |
| No Earners | 488 (9.0%) | $121,667 |
| 1 Earner | 1,156 (21.4%) | $164,630 |
| 2 Earners | 2,952 (54.8%) | $250,001 |
| 3+ Earners | 795 (14.7%) | $250,001 |
| Total | 5,391 (100.0%) | $221,381 |
Household Income in Franklin Farm
Household Income Brackets in Franklin Farm
With 3,185 households falling in the category, the $200,000+ income range is the most frequent in Franklin Farm, accounting for 51.9% of all households. In contrast, only 12 households (0.2%) fall into the $10,000 to $14,999 income bracket, making it the least populous group.
| Income Bracket | # Households | % Households |
| Less than $10,000 | 92 | 1.5% |
| $10,000 to $14,999 | 12 | 0.2% |
| $15,000 to $24,999 | 25 | 0.4% |
| $25,000 to $34,999 | 86 | 1.4% |
| $35,000 to $49,999 | 172 | 2.8% |
| $50,000 to $74,999 | 215 | 3.5% |
| $75,000 to $99,999 | 301 | 4.9% |
| $100,000 to $149,999 | 951 | 15.5% |
| $150,000 to $199,999 | 1,105 | 18.0% |
| $200,000+ | 3,185 | 51.9% |
Household Income by Householder Age in Franklin Farm
The median household income in Franklin Farm is $209,442, with the highest median household income of $248,912 found in the 45 to 64 years age bracket for the primary householder. A total of 3,249 households (52.9%) fall into this category. Meanwhile, the 15 to 24 years age bracket for the primary householder has the lowest median household income of $0, with 37 households (0.6%) in this group.
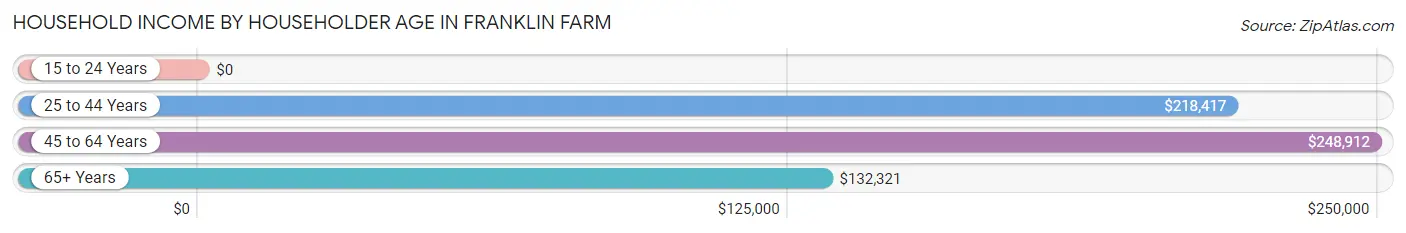
| Income Bracket | # Households | Median Income |
| 15 to 24 Years | 37 (0.6%) | $0 |
| 25 to 44 Years | 1,477 (24.1%) | $218,417 |
| 45 to 64 Years | 3,249 (52.9%) | $248,912 |
| 65+ Years | 1,374 (22.4%) | $132,321 |
| Total | 6,137 (100.0%) | $209,442 |
Poverty in Franklin Farm
Income Below Poverty by Sex and Age in Franklin Farm
With 2.1% poverty level for males and 2.2% for females among the residents of Franklin Farm, 15 year old males and 45 to 54 year old females are the most vulnerable to poverty, with 25 males (14.7%) and 103 females (6.7%) in their respective age groups living below the poverty level.
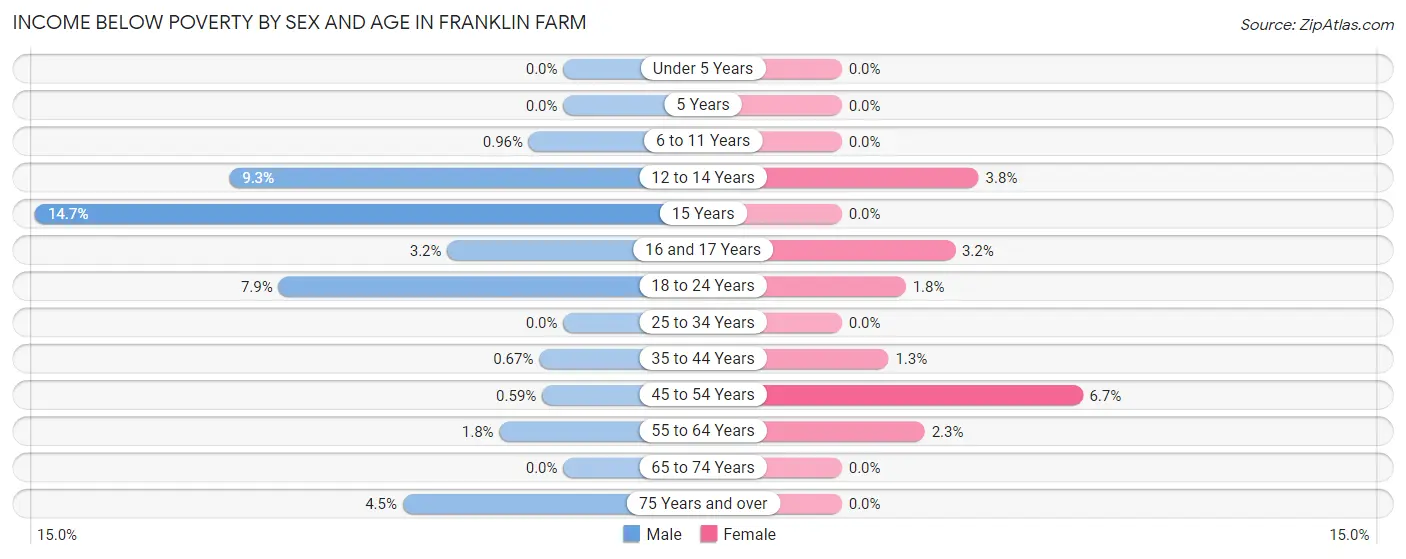
| Age Bracket | Male | Female |
| Under 5 Years | 0 (0.0%) | 0 (0.0%) |
| 5 Years | 0 (0.0%) | 0 (0.0%) |
| 6 to 11 Years | 11 (1.0%) | 0 (0.0%) |
| 12 to 14 Years | 49 (9.3%) | 19 (3.8%) |
| 15 Years | 25 (14.7%) | 0 (0.0%) |
| 16 and 17 Years | 8 (3.2%) | 9 (3.2%) |
| 18 to 24 Years | 46 (7.9%) | 13 (1.8%) |
| 25 to 34 Years | 0 (0.0%) | 0 (0.0%) |
| 35 to 44 Years | 9 (0.7%) | 18 (1.3%) |
| 45 to 54 Years | 9 (0.6%) | 103 (6.7%) |
| 55 to 64 Years | 26 (1.8%) | 36 (2.3%) |
| 65 to 74 Years | 0 (0.0%) | 0 (0.0%) |
| 75 Years and over | 19 (4.5%) | 0 (0.0%) |
| Total | 202 (2.1%) | 198 (2.2%) |
Income Above Poverty by Sex and Age in Franklin Farm
According to the poverty statistics in Franklin Farm, males aged under 5 years and females aged under 5 years are the age groups that are most secure financially, with 100.0% of males and 100.0% of females in these age groups living above the poverty line.
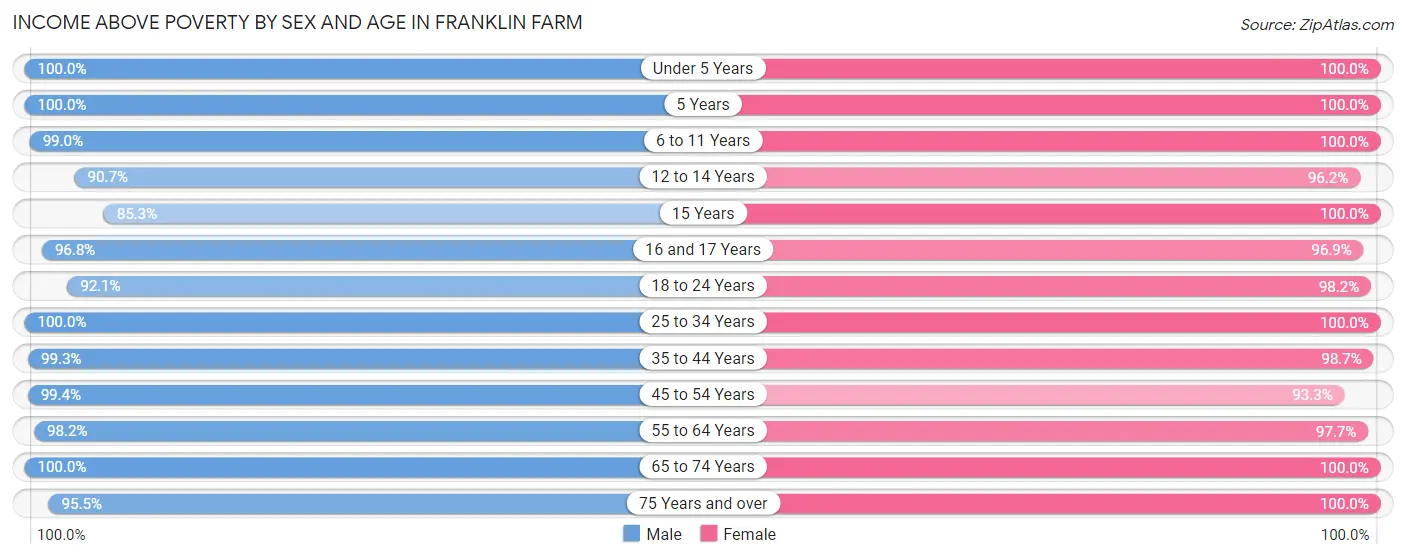
| Age Bracket | Male | Female |
| Under 5 Years | 488 (100.0%) | 288 (100.0%) |
| 5 Years | 100 (100.0%) | 100 (100.0%) |
| 6 to 11 Years | 1,138 (99.0%) | 746 (100.0%) |
| 12 to 14 Years | 478 (90.7%) | 480 (96.2%) |
| 15 Years | 145 (85.3%) | 198 (100.0%) |
| 16 and 17 Years | 240 (96.8%) | 277 (96.9%) |
| 18 to 24 Years | 534 (92.1%) | 719 (98.2%) |
| 25 to 34 Years | 862 (100.0%) | 482 (100.0%) |
| 35 to 44 Years | 1,332 (99.3%) | 1,365 (98.7%) |
| 45 to 54 Years | 1,522 (99.4%) | 1,434 (93.3%) |
| 55 to 64 Years | 1,437 (98.2%) | 1,522 (97.7%) |
| 65 to 74 Years | 883 (100.0%) | 851 (100.0%) |
| 75 Years and over | 406 (95.5%) | 448 (100.0%) |
| Total | 9,565 (97.9%) | 8,910 (97.8%) |
Income Below Poverty Among Married-Couple Families in Franklin Farm
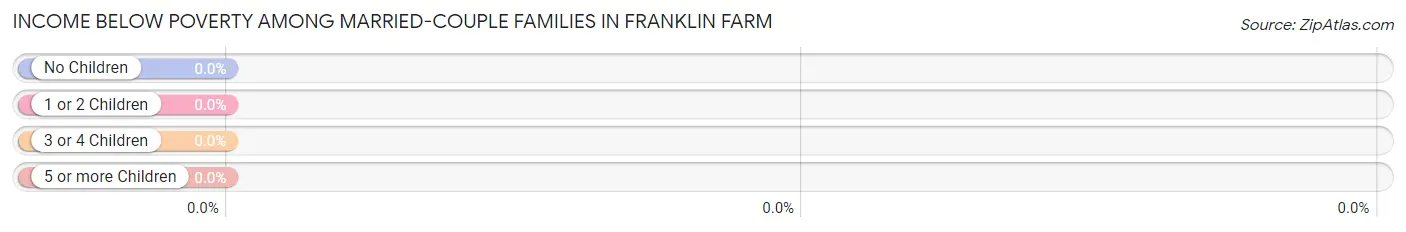
| Children | Above Poverty | Below Poverty |
| No Children | 2,469 (100.0%) | 0 (0.0%) |
| 1 or 2 Children | 1,840 (100.0%) | 0 (0.0%) |
| 3 or 4 Children | 466 (100.0%) | 0 (0.0%) |
| 5 or more Children | 25 (100.0%) | 0 (0.0%) |
| Total | 4,800 (100.0%) | 0 (0.0%) |
Income Below Poverty Among Single-Parent Households in Franklin Farm
According to the poverty data in Franklin Farm, 19.6% or 35 single-father households and 19.2% or 79 single-mother households are living below the poverty line. Among single-father households, those with no children have the highest poverty rate, with 26 households (24.1%) experiencing poverty. Likewise, among single-mother households, those with 1 or 2 children have the highest poverty rate, with 64 households (47.8%) falling below the poverty line.
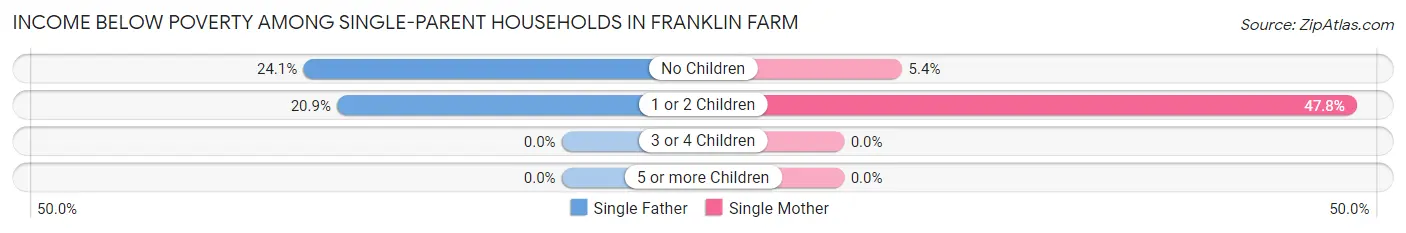
| Children | Single Father | Single Mother |
| No Children | 26 (24.1%) | 15 (5.4%) |
| 1 or 2 Children | 9 (20.9%) | 64 (47.8%) |
| 3 or 4 Children | 0 (0.0%) | 0 (0.0%) |
| 5 or more Children | 0 (0.0%) | 0 (0.0%) |
| Total | 35 (19.6%) | 79 (19.2%) |
Income Below Poverty Among Married-Couple vs Single-Parent Households in Franklin Farm
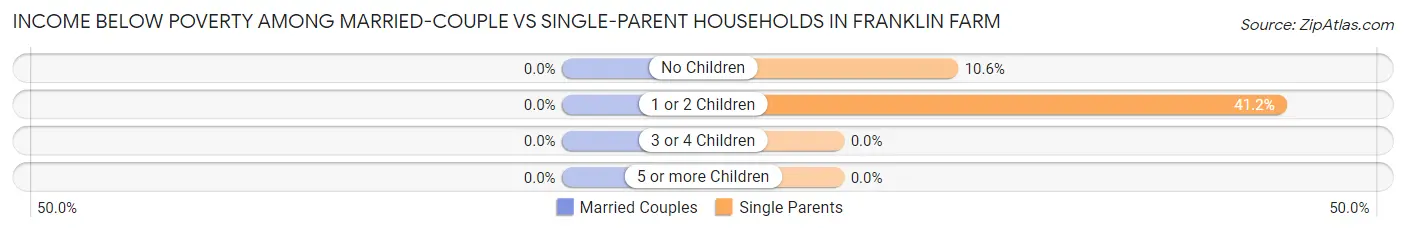
| Children | Married-Couple Families | Single-Parent Households |
| No Children | 0 (0.0%) | 41 (10.6%) |
| 1 or 2 Children | 0 (0.0%) | 73 (41.2%) |
| 3 or 4 Children | 0 (0.0%) | 0 (0.0%) |
| 5 or more Children | 0 (0.0%) | 0 (0.0%) |
| Total | 0 (0.0%) | 114 (19.3%) |
Race in Franklin Farm
The most populous races in Franklin Farm are White / Caucasian (12,591 | 66.6%), Asian (4,208 | 22.3%), and Two or more Races (1,293 | 6.8%).
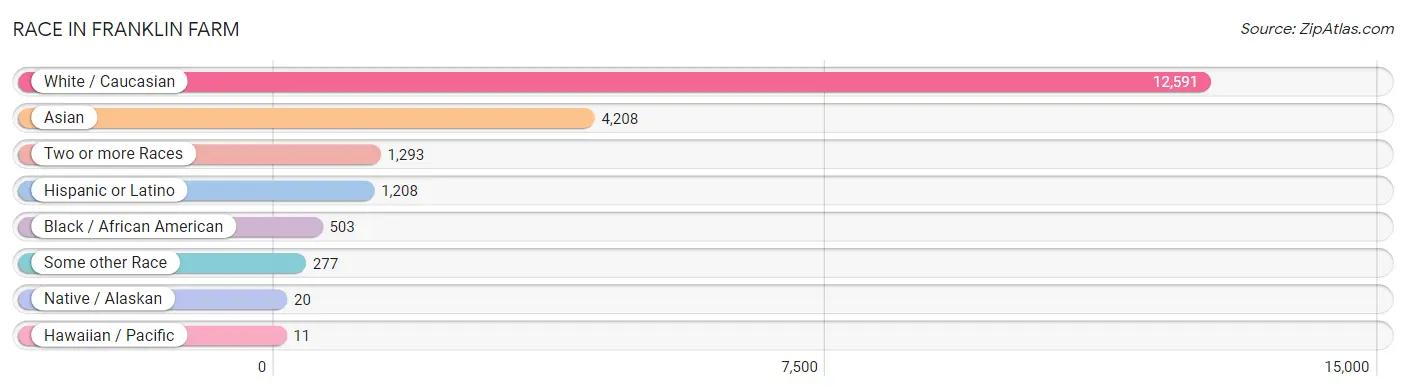
| Race | # Population | % Population |
| Asian | 4,208 | 22.3% |
| Black / African American | 503 | 2.7% |
| Hawaiian / Pacific | 11 | 0.1% |
| Hispanic or Latino | 1,208 | 6.4% |
| Native / Alaskan | 20 | 0.1% |
| White / Caucasian | 12,591 | 66.6% |
| Two or more Races | 1,293 | 6.8% |
| Some other Race | 277 | 1.5% |
| Total | 18,903 | 100.0% |
Ancestry in Franklin Farm
The most populous ancestries reported in Franklin Farm are English (2,886 | 15.3%), German (2,440 | 12.9%), Irish (2,410 | 12.8%), Thai (2,109 | 11.2%), and Italian (1,491 | 7.9%), together accounting for 60.0% of all Franklin Farm residents.
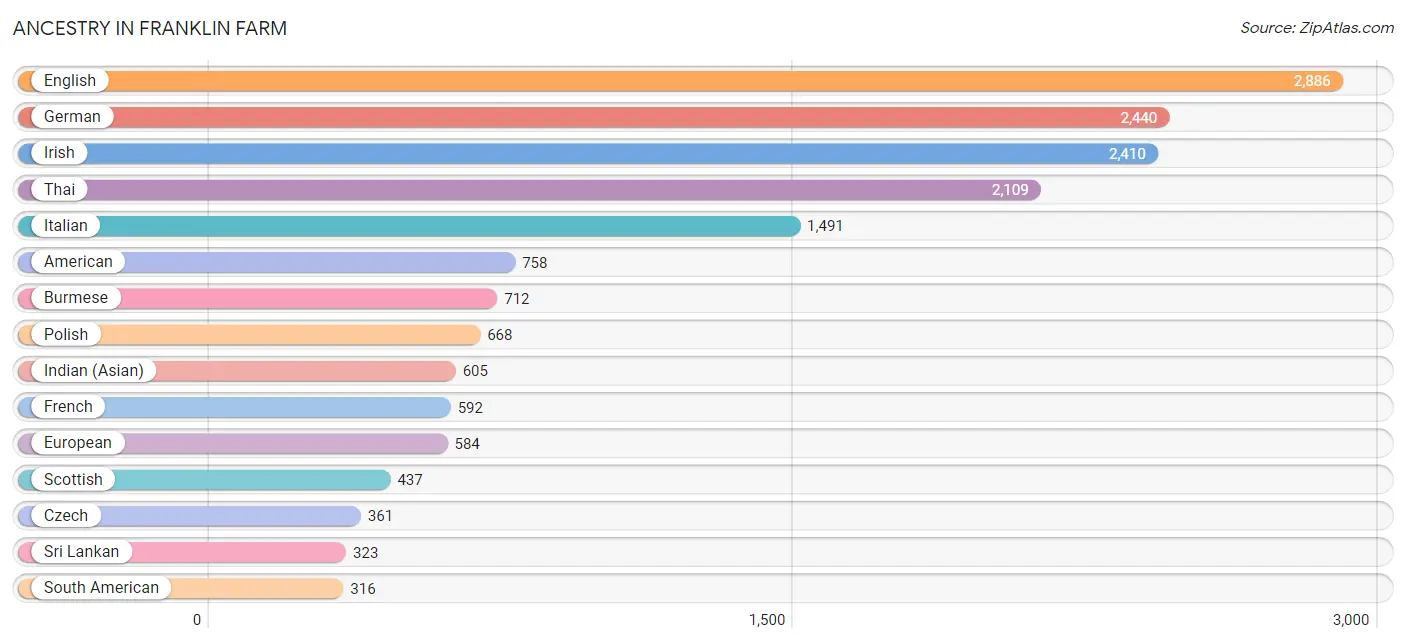
| Ancestry | # Population | % Population |
| Afghan | 42 | 0.2% |
| African | 49 | 0.3% |
| American | 758 | 4.0% |
| Arab | 100 | 0.5% |
| Armenian | 28 | 0.2% |
| Austrian | 217 | 1.1% |
| Barbadian | 8 | 0.0% |
| Bhutanese | 173 | 0.9% |
| Bolivian | 61 | 0.3% |
| British | 171 | 0.9% |
| Burmese | 712 | 3.8% |
| Canadian | 17 | 0.1% |
| Central American | 160 | 0.9% |
| Central American Indian | 7 | 0.0% |
| Cherokee | 10 | 0.1% |
| Colombian | 82 | 0.4% |
| Croatian | 14 | 0.1% |
| Cuban | 69 | 0.4% |
| Czech | 361 | 1.9% |
| Czechoslovakian | 10 | 0.1% |
| Danish | 64 | 0.3% |
| Dominican | 27 | 0.1% |
| Dutch | 140 | 0.7% |
| Eastern European | 185 | 1.0% |
| Ecuadorian | 11 | 0.1% |
| Egyptian | 11 | 0.1% |
| English | 2,886 | 15.3% |
| European | 584 | 3.1% |
| Filipino | 122 | 0.6% |
| Finnish | 53 | 0.3% |
| French | 592 | 3.1% |
| French Canadian | 57 | 0.3% |
| German | 2,440 | 12.9% |
| Greek | 42 | 0.2% |
| Guatemalan | 7 | 0.0% |
| Honduran | 50 | 0.3% |
| Hungarian | 159 | 0.8% |
| Indian (Asian) | 605 | 3.2% |
| Iranian | 225 | 1.2% |
| Iraqi | 45 | 0.2% |
| Irish | 2,410 | 12.8% |
| Italian | 1,491 | 7.9% |
| Jamaican | 8 | 0.0% |
| Japanese | 24 | 0.1% |
| Korean | 224 | 1.2% |
| Laotian | 43 | 0.2% |
| Lebanese | 10 | 0.1% |
| Lithuanian | 105 | 0.6% |
| Mexican | 299 | 1.6% |
| Mexican American Indian | 16 | 0.1% |
| Native Hawaiian | 11 | 0.1% |
| Nicaraguan | 18 | 0.1% |
| Nigerian | 17 | 0.1% |
| Northern European | 24 | 0.1% |
| Norwegian | 126 | 0.7% |
| Pakistani | 30 | 0.2% |
| Panamanian | 8 | 0.0% |
| Paraguayan | 14 | 0.1% |
| Pennsylvania German | 19 | 0.1% |
| Peruvian | 148 | 0.8% |
| Polish | 668 | 3.5% |
| Portuguese | 64 | 0.3% |
| Puerto Rican | 83 | 0.4% |
| Romanian | 17 | 0.1% |
| Russian | 266 | 1.4% |
| Salvadoran | 77 | 0.4% |
| Scandinavian | 60 | 0.3% |
| Scotch-Irish | 202 | 1.1% |
| Scottish | 437 | 2.3% |
| Serbian | 16 | 0.1% |
| Slavic | 33 | 0.2% |
| Slovak | 76 | 0.4% |
| Slovene | 33 | 0.2% |
| South American | 316 | 1.7% |
| Spaniard | 126 | 0.7% |
| Spanish | 81 | 0.4% |
| Sri Lankan | 323 | 1.7% |
| Subsaharan African | 105 | 0.6% |
| Swedish | 199 | 1.1% |
| Swiss | 29 | 0.2% |
| Thai | 2,109 | 11.2% |
| Turkish | 74 | 0.4% |
| Ukrainian | 201 | 1.1% |
| Welsh | 176 | 0.9% | View All 84 Rows |
Immigrants in Franklin Farm
The most numerous immigrant groups reported in Franklin Farm came from Asia (2,984 | 15.8%), South Central Asia (1,699 | 9.0%), India (1,312 | 6.9%), Eastern Asia (824 | 4.4%), and China (426 | 2.2%), together accounting for 38.3% of all Franklin Farm residents.
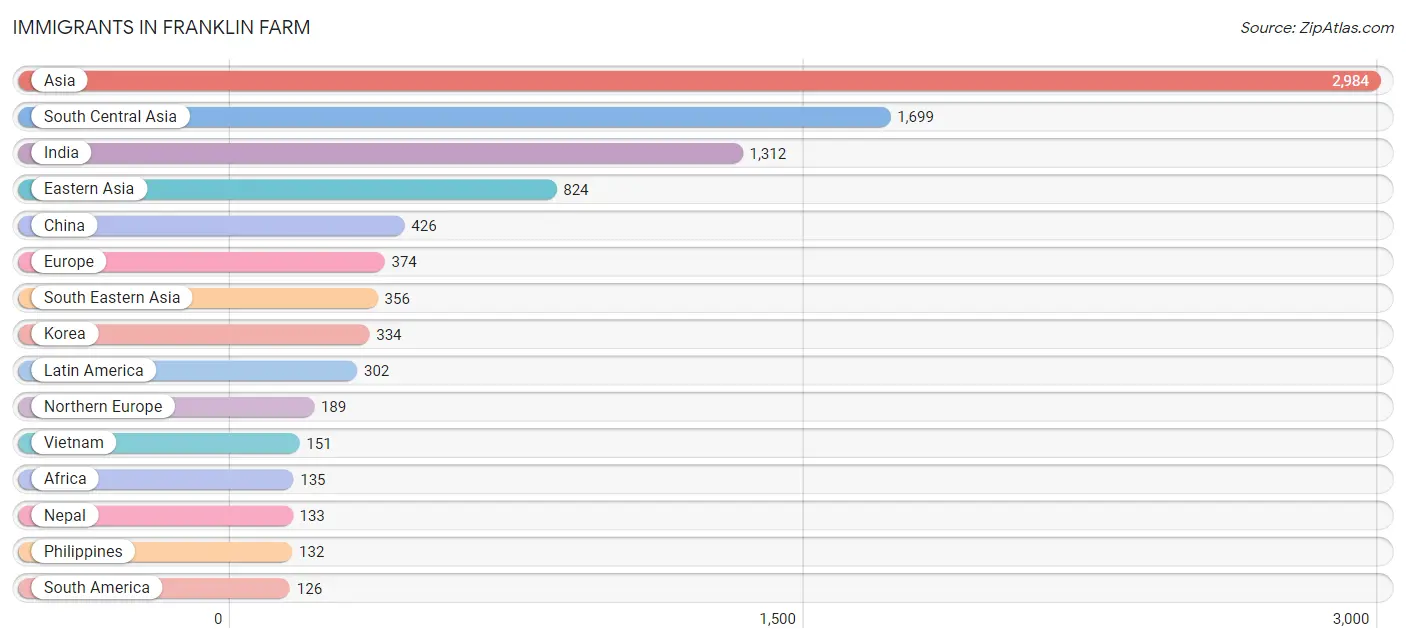
| Immigration Origin | # Population | % Population |
| Afghanistan | 16 | 0.1% |
| Africa | 135 | 0.7% |
| Armenia | 7 | 0.0% |
| Asia | 2,984 | 15.8% |
| Bolivia | 9 | 0.1% |
| Brazil | 8 | 0.0% |
| Cambodia | 15 | 0.1% |
| Canada | 76 | 0.4% |
| Caribbean | 57 | 0.3% |
| Central America | 119 | 0.6% |
| China | 426 | 2.2% |
| Colombia | 35 | 0.2% |
| Cuba | 15 | 0.1% |
| Czechoslovakia | 9 | 0.1% |
| Dominican Republic | 20 | 0.1% |
| Eastern Africa | 8 | 0.0% |
| Eastern Asia | 824 | 4.4% |
| Eastern Europe | 73 | 0.4% |
| Ecuador | 11 | 0.1% |
| Egypt | 8 | 0.0% |
| El Salvador | 63 | 0.3% |
| England | 90 | 0.5% |
| Europe | 374 | 2.0% |
| France | 31 | 0.2% |
| Germany | 39 | 0.2% |
| Ghana | 9 | 0.1% |
| Guatemala | 7 | 0.0% |
| Honduras | 23 | 0.1% |
| Hong Kong | 18 | 0.1% |
| Hungary | 34 | 0.2% |
| India | 1,312 | 6.9% |
| Indonesia | 24 | 0.1% |
| Iran | 123 | 0.6% |
| Iraq | 34 | 0.2% |
| Ireland | 24 | 0.1% |
| Japan | 64 | 0.3% |
| Korea | 334 | 1.8% |
| Latin America | 302 | 1.6% |
| Lebanon | 10 | 0.1% |
| Malaysia | 14 | 0.1% |
| Middle Africa | 39 | 0.2% |
| Nepal | 133 | 0.7% |
| Netherlands | 24 | 0.1% |
| Nicaragua | 18 | 0.1% |
| Nigeria | 25 | 0.1% |
| Northern Africa | 8 | 0.0% |
| Northern Europe | 189 | 1.0% |
| Pakistan | 81 | 0.4% |
| Panama | 8 | 0.0% |
| Peru | 63 | 0.3% |
| Philippines | 132 | 0.7% |
| Russia | 7 | 0.0% |
| Sierra Leone | 46 | 0.2% |
| South America | 126 | 0.7% |
| South Central Asia | 1,699 | 9.0% |
| South Eastern Asia | 356 | 1.9% |
| Southern Europe | 12 | 0.1% |
| Spain | 12 | 0.1% |
| Switzerland | 6 | 0.0% |
| Syria | 7 | 0.0% |
| Taiwan | 104 | 0.5% |
| Thailand | 20 | 0.1% |
| Trinidad and Tobago | 22 | 0.1% |
| Turkey | 47 | 0.3% |
| Ukraine | 15 | 0.1% |
| Vietnam | 151 | 0.8% |
| Western Africa | 80 | 0.4% |
| Western Asia | 105 | 0.6% |
| Western Europe | 100 | 0.5% |
| Zaire | 39 | 0.2% | View All 70 Rows |
Sex and Age in Franklin Farm
Sex and Age in Franklin Farm
The most populous age groups in Franklin Farm are 10 to 14 Years (970 | 9.9%) for men and 50 to 54 Years (798 | 8.7%) for women.
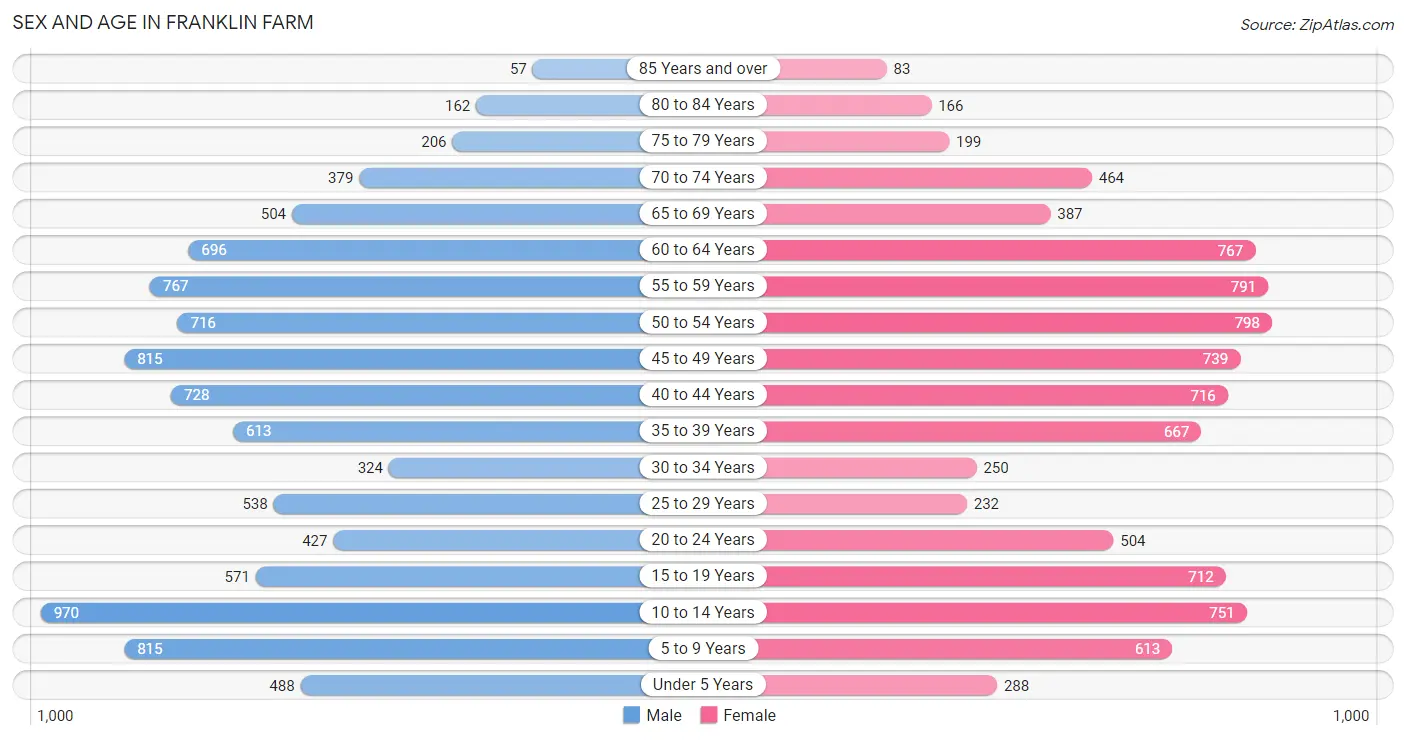
| Age Bracket | Male | Female |
| Under 5 Years | 488 (5.0%) | 288 (3.2%) |
| 5 to 9 Years | 815 (8.3%) | 613 (6.7%) |
| 10 to 14 Years | 970 (9.9%) | 751 (8.2%) |
| 15 to 19 Years | 571 (5.8%) | 712 (7.8%) |
| 20 to 24 Years | 427 (4.4%) | 504 (5.5%) |
| 25 to 29 Years | 538 (5.5%) | 232 (2.5%) |
| 30 to 34 Years | 324 (3.3%) | 250 (2.7%) |
| 35 to 39 Years | 613 (6.3%) | 667 (7.3%) |
| 40 to 44 Years | 728 (7.4%) | 716 (7.8%) |
| 45 to 49 Years | 815 (8.3%) | 739 (8.1%) |
| 50 to 54 Years | 716 (7.3%) | 798 (8.7%) |
| 55 to 59 Years | 767 (7.9%) | 791 (8.7%) |
| 60 to 64 Years | 696 (7.1%) | 767 (8.4%) |
| 65 to 69 Years | 504 (5.2%) | 387 (4.2%) |
| 70 to 74 Years | 379 (3.9%) | 464 (5.1%) |
| 75 to 79 Years | 206 (2.1%) | 199 (2.2%) |
| 80 to 84 Years | 162 (1.7%) | 166 (1.8%) |
| 85 Years and over | 57 (0.6%) | 83 (0.9%) |
| Total | 9,776 (100.0%) | 9,127 (100.0%) |
Families and Households in Franklin Farm
Median Family Size in Franklin Farm
The median family size in Franklin Farm is 3.28 persons per family, with married-couple families (4,800 | 89.0%) accounting for the largest median family size of 3.32 persons per family. On the other hand, single male/father families (179 | 3.3%) represent the smallest median family size with 2.69 persons per family.
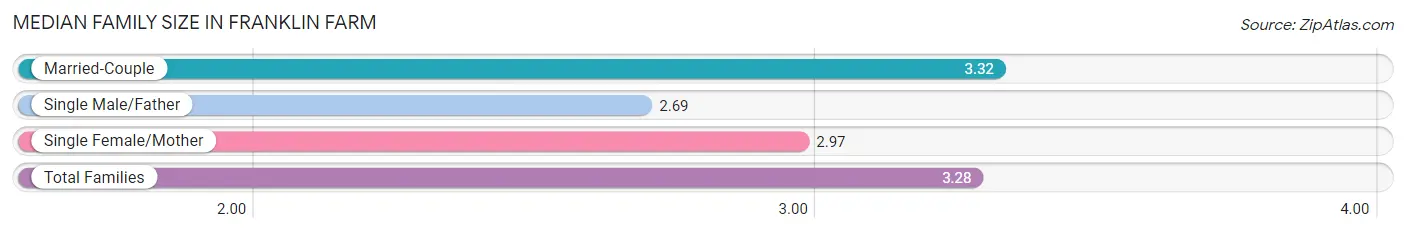
| Family Type | # Families | Family Size |
| Married-Couple | 4,800 (89.0%) | 3.32 |
| Single Male/Father | 179 (3.3%) | 2.69 |
| Single Female/Mother | 412 (7.6%) | 2.97 |
| Total Families | 5,391 (100.0%) | 3.28 |
Median Household Size in Franklin Farm
The median household size in Franklin Farm is 3.08 persons per household, with married-couple households (4,800 | 78.2%) accounting for the largest median household size of 3.35 persons per household. non-family households (746 | 12.2%) represent the smallest median household size with 1.32 persons per household.

| Household Type | # Households | Household Size |
| Married-Couple | 4,800 (78.2%) | 3.35 |
| Single Male/Father | 179 (2.9%) | 2.88 |
| Single Female/Mother | 412 (6.7%) | 3.20 |
| Non-family | 746 (12.2%) | 1.32 |
| Total Households | 6,137 (100.0%) | 3.08 |
Household Size by Marriage Status in Franklin Farm
Out of a total of 6,137 households in Franklin Farm, 5,391 (87.8%) are family households, while 746 (12.2%) are nonfamily households. The most numerous type of family households are 2-person households, comprising 1,965, and the most common type of nonfamily households are 1-person households, comprising 612.
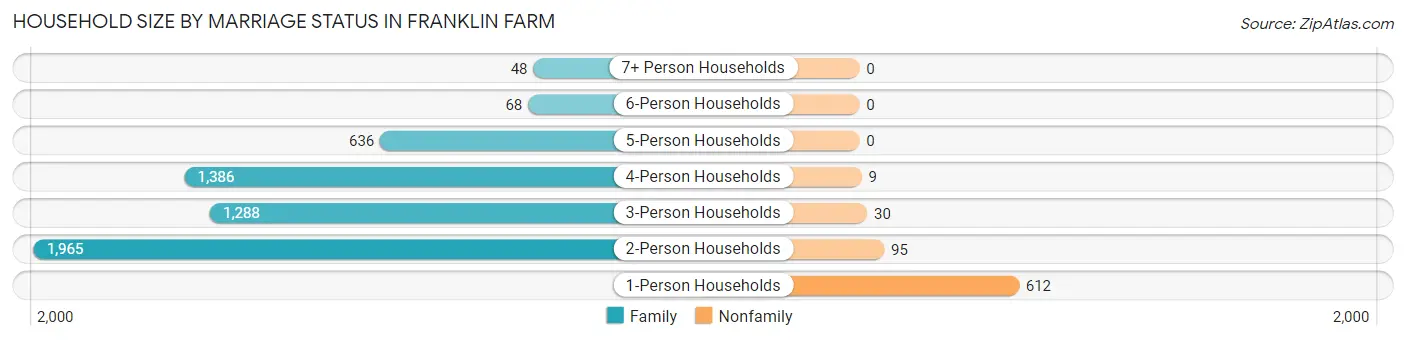
| Household Size | Family Households | Nonfamily Households |
| 1-Person Households | - | 612 (10.0%) |
| 2-Person Households | 1,965 (32.0%) | 95 (1.5%) |
| 3-Person Households | 1,288 (21.0%) | 30 (0.5%) |
| 4-Person Households | 1,386 (22.6%) | 9 (0.2%) |
| 5-Person Households | 636 (10.4%) | 0 (0.0%) |
| 6-Person Households | 68 (1.1%) | 0 (0.0%) |
| 7+ Person Households | 48 (0.8%) | 0 (0.0%) |
| Total | 5,391 (87.8%) | 746 (12.2%) |
Female Fertility in Franklin Farm
Fertility by Age in Franklin Farm
Average fertility rate in Franklin Farm is 29.0 births per 1,000 women. Women in the age bracket of 20 to 34 years have the highest fertility rate with 51.0 births per 1,000 women. Women in the age bracket of 35 to 50 years acount for 55.7% of all women with births.
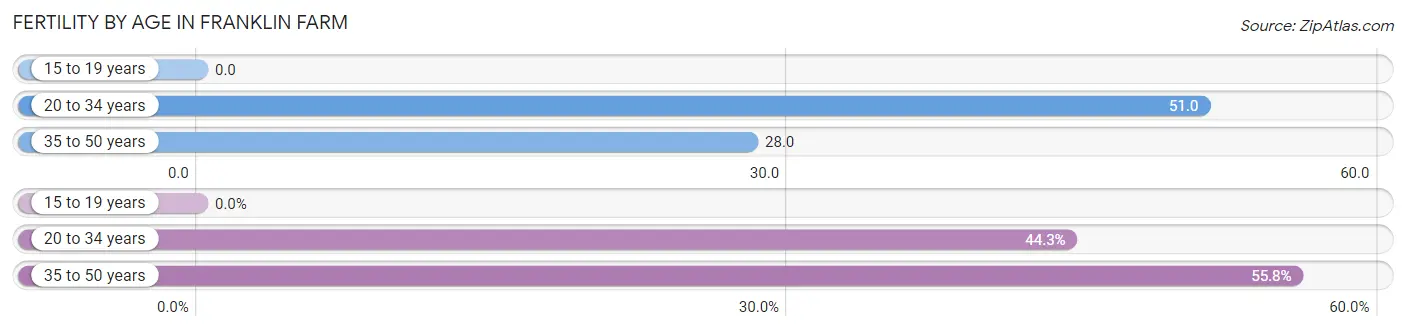
| Age Bracket | Women with Births | Births / 1,000 Women |
| 15 to 19 years | 0 (0.0%) | 0.0 |
| 20 to 34 years | 50 (44.3%) | 51.0 |
| 35 to 50 years | 63 (55.7%) | 28.0 |
| Total | 113 (100.0%) | 29.0 |
Fertility by Age by Marriage Status in Franklin Farm
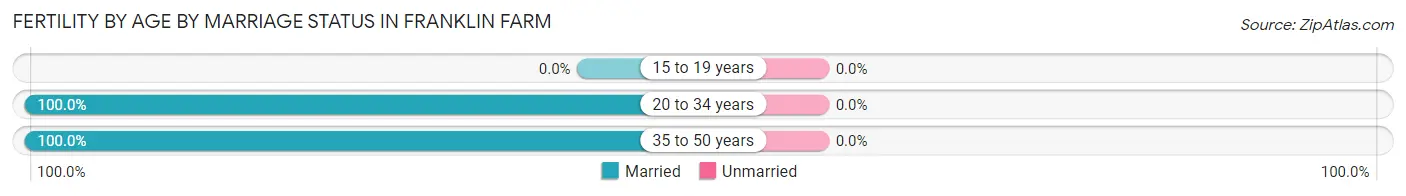
| Age Bracket | Married | Unmarried |
| 15 to 19 years | 0 (0.0%) | 0 (0.0%) |
| 20 to 34 years | 50 (100.0%) | 0 (0.0%) |
| 35 to 50 years | 63 (100.0%) | 0 (0.0%) |
| Total | 113 (100.0%) | 0 (0.0%) |
Fertility by Education in Franklin Farm
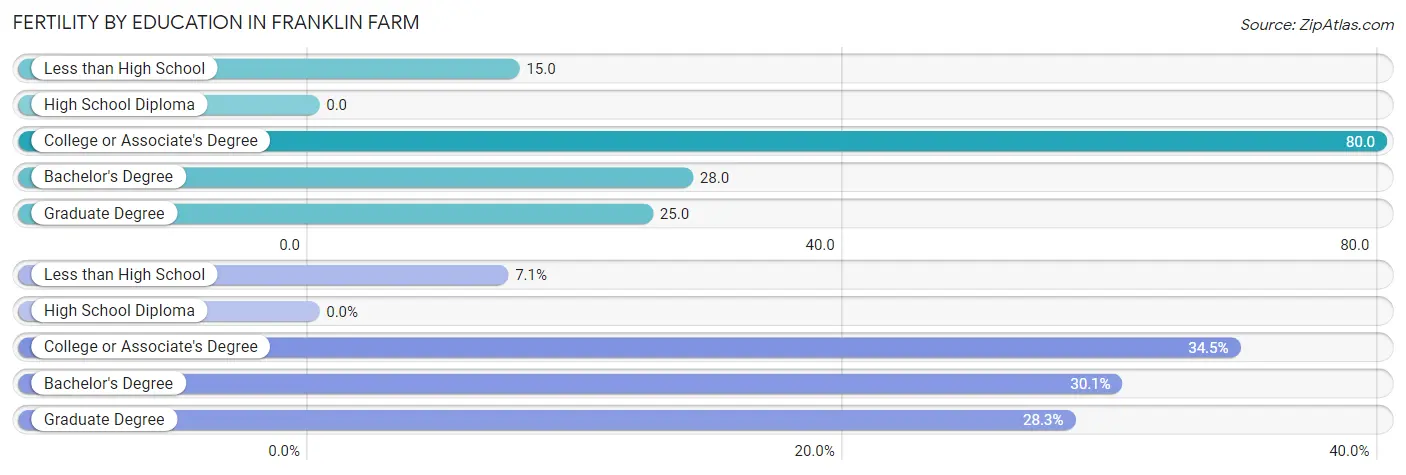
| Educational Attainment | Women with Births | Births / 1,000 Women |
| Less than High School | 8 (7.1%) | 15.0 |
| High School Diploma | 0 (0.0%) | 0.0 |
| College or Associate's Degree | 39 (34.5%) | 80.0 |
| Bachelor's Degree | 34 (30.1%) | 28.0 |
| Graduate Degree | 32 (28.3%) | 25.0 |
| Total | 113 (100.0%) | 29.0 |
Fertility by Education by Marriage Status in Franklin Farm
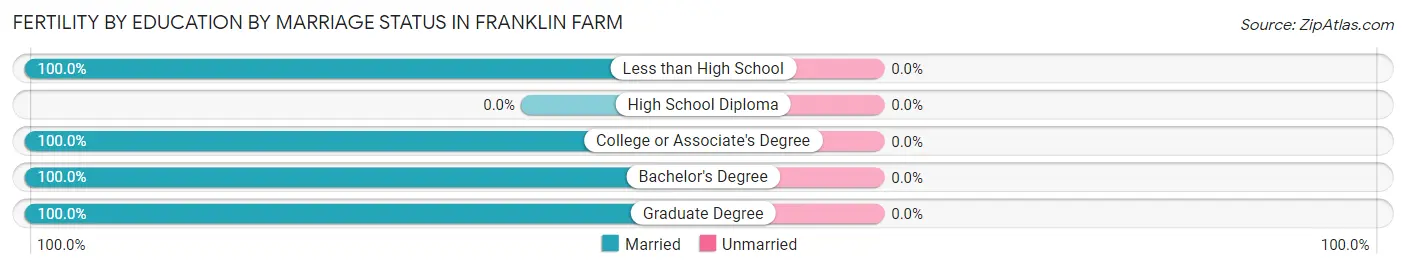
| Educational Attainment | Married | Unmarried |
| Less than High School | 8 (100.0%) | 0 (0.0%) |
| High School Diploma | 0 (0.0%) | 0 (0.0%) |
| College or Associate's Degree | 39 (100.0%) | 0 (0.0%) |
| Bachelor's Degree | 34 (100.0%) | 0 (0.0%) |
| Graduate Degree | 32 (100.0%) | 0 (0.0%) |
| Total | 113 (100.0%) | 0 (0.0%) |
Employment Characteristics in Franklin Farm
Employment by Class of Employer in Franklin Farm
Among the 10,177 employed individuals in Franklin Farm, private company employees (6,132 | 60.3%), federal government employees (1,155 | 11.4%), and not-for-profit organizations (931 | 9.1%) make up the most common classes of employment.
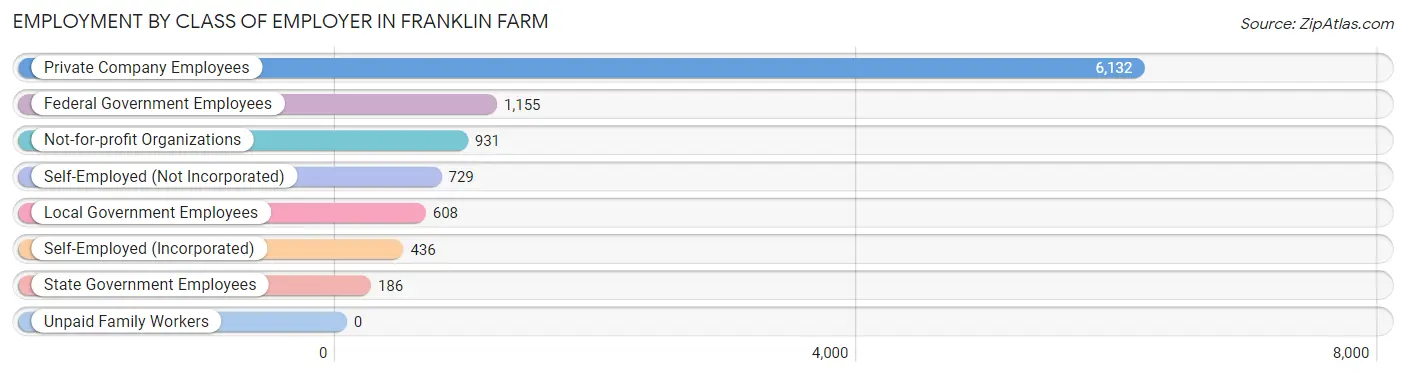
| Employer Class | # Employees | % Employees |
| Private Company Employees | 6,132 | 60.3% |
| Self-Employed (Incorporated) | 436 | 4.3% |
| Self-Employed (Not Incorporated) | 729 | 7.2% |
| Not-for-profit Organizations | 931 | 9.1% |
| Local Government Employees | 608 | 6.0% |
| State Government Employees | 186 | 1.8% |
| Federal Government Employees | 1,155 | 11.4% |
| Unpaid Family Workers | 0 | 0.0% |
| Total | 10,177 | 100.0% |
Employment Status by Age in Franklin Farm
According to the labor force statistics for Franklin Farm, out of the total population over 16 years of age (14,610), 72.8% or 10,636 individuals are in the labor force, with 2.5% or 266 of them unemployed. The age group with the highest labor force participation rate is 25 to 29 years, with 90.5% or 697 individuals in the labor force. Within the labor force, the 30 to 34 years age range has the highest percentage of unemployed individuals, with 11.3% or 55 of them being unemployed.
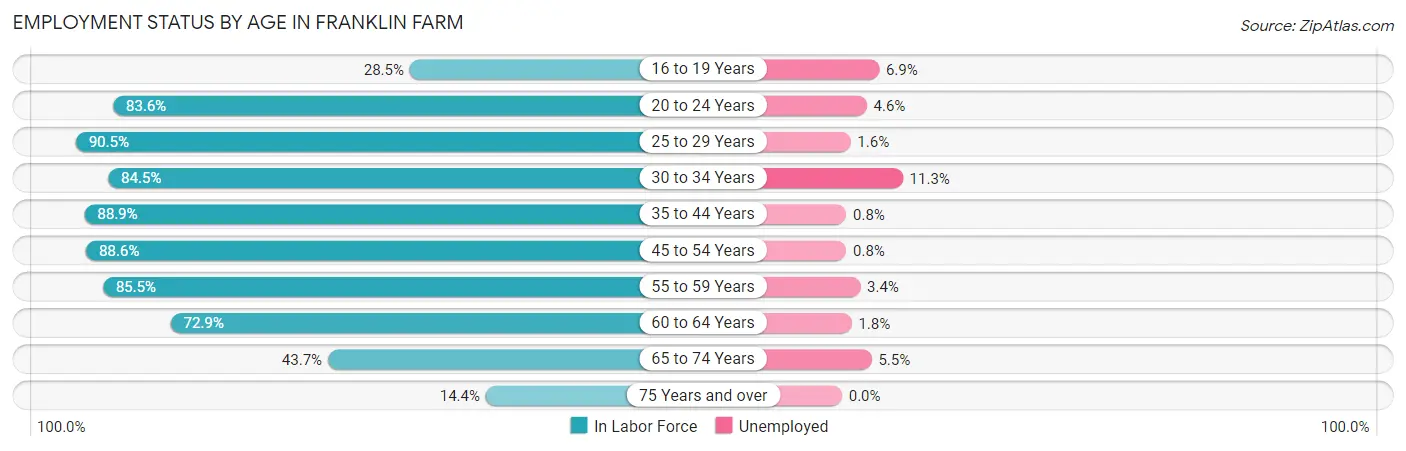
| Age Bracket | In Labor Force | Unemployed |
| 16 to 19 Years | 261 (28.5%) | 18 (6.9%) |
| 20 to 24 Years | 778 (83.6%) | 36 (4.6%) |
| 25 to 29 Years | 697 (90.5%) | 11 (1.6%) |
| 30 to 34 Years | 485 (84.5%) | 55 (11.3%) |
| 35 to 44 Years | 2,422 (88.9%) | 19 (0.8%) |
| 45 to 54 Years | 2,718 (88.6%) | 22 (0.8%) |
| 55 to 59 Years | 1,332 (85.5%) | 45 (3.4%) |
| 60 to 64 Years | 1,067 (72.9%) | 19 (1.8%) |
| 65 to 74 Years | 758 (43.7%) | 42 (5.5%) |
| 75 Years and over | 126 (14.4%) | 0 (0.0%) |
| Total | 10,636 (72.8%) | 266 (2.5%) |
Employment Status by Educational Attainment in Franklin Farm
According to labor force statistics for Franklin Farm, 85.9% of individuals (8,725) out of the total population between 25 and 64 years of age (10,157) are in the labor force, with 1.9% or 166 of them being unemployed. The group with the highest labor force participation rate are those with the educational attainment of bachelor's degree or higher, with 87.1% or 7,022 individuals in the labor force. Within the labor force, individuals with less than high school education have the highest percentage of unemployment, with 10.9% or 7 of them being unemployed.
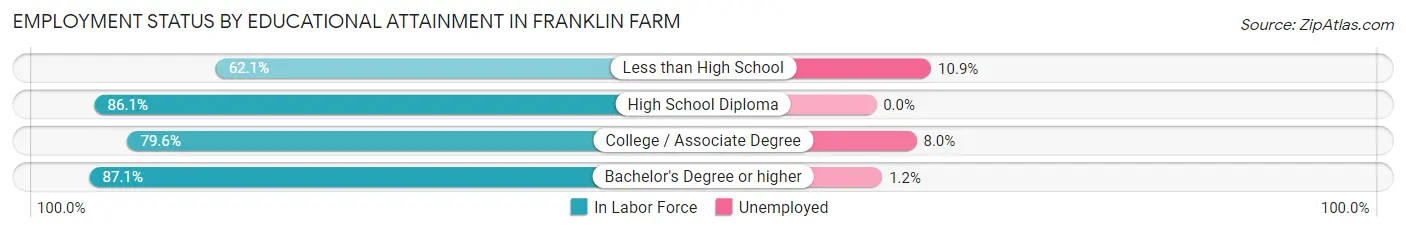
| Educational Attainment | In Labor Force | Unemployed |
| Less than High School | 64 (62.1%) | 11 (10.9%) |
| High School Diploma | 621 (86.1%) | 0 (0.0%) |
| College / Associate Degree | 1,012 (79.6%) | 102 (8.0%) |
| Bachelor's Degree or higher | 7,022 (87.1%) | 97 (1.2%) |
| Total | 8,725 (85.9%) | 193 (1.9%) |
Employment Occupations by Sex in Franklin Farm
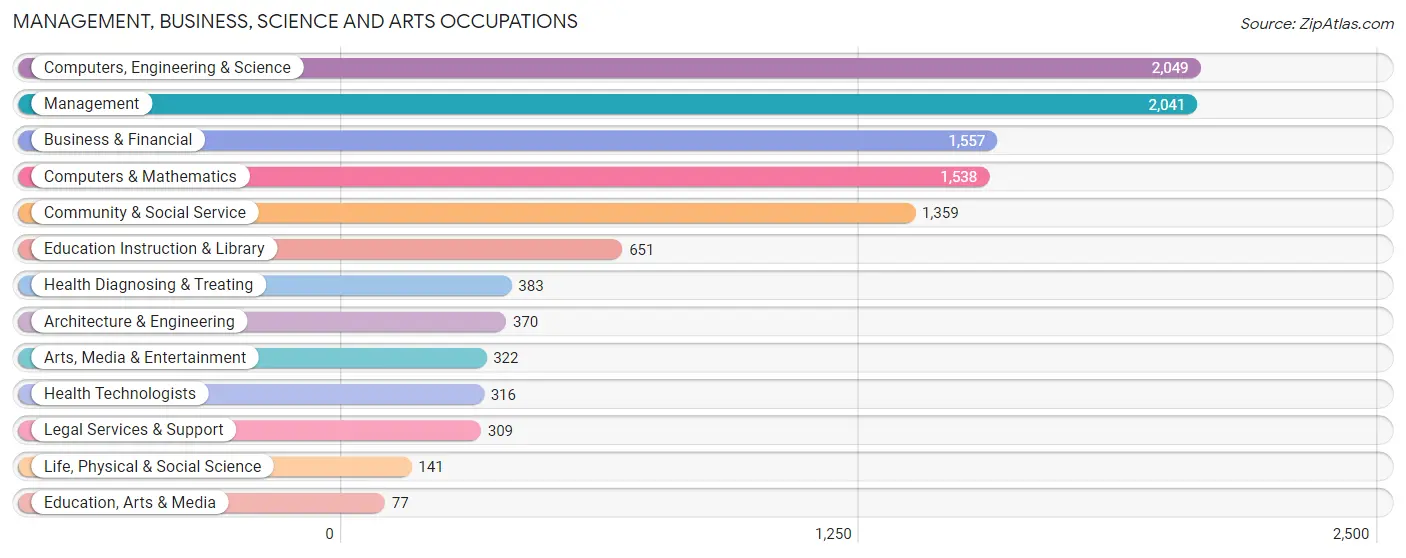
Management, Business, Science and Arts Occupations
The most common Management, Business, Science and Arts occupations in Franklin Farm are Computers, Engineering & Science (2,049 | 19.8%), Management (2,041 | 19.7%), Business & Financial (1,557 | 15.0%), Computers & Mathematics (1,538 | 14.9%), and Community & Social Service (1,359 | 13.1%).
Management, Business, Science and Arts Occupations by Sex
Within the Management, Business, Science and Arts occupations in Franklin Farm, the most male-oriented occupations are Computers & Mathematics (75.4%), Legal Services & Support (73.8%), and Computers, Engineering & Science (73.6%), while the most female-oriented occupations are Health Technologists (79.1%), Health Diagnosing & Treating (71.0%), and Education Instruction & Library (65.6%).
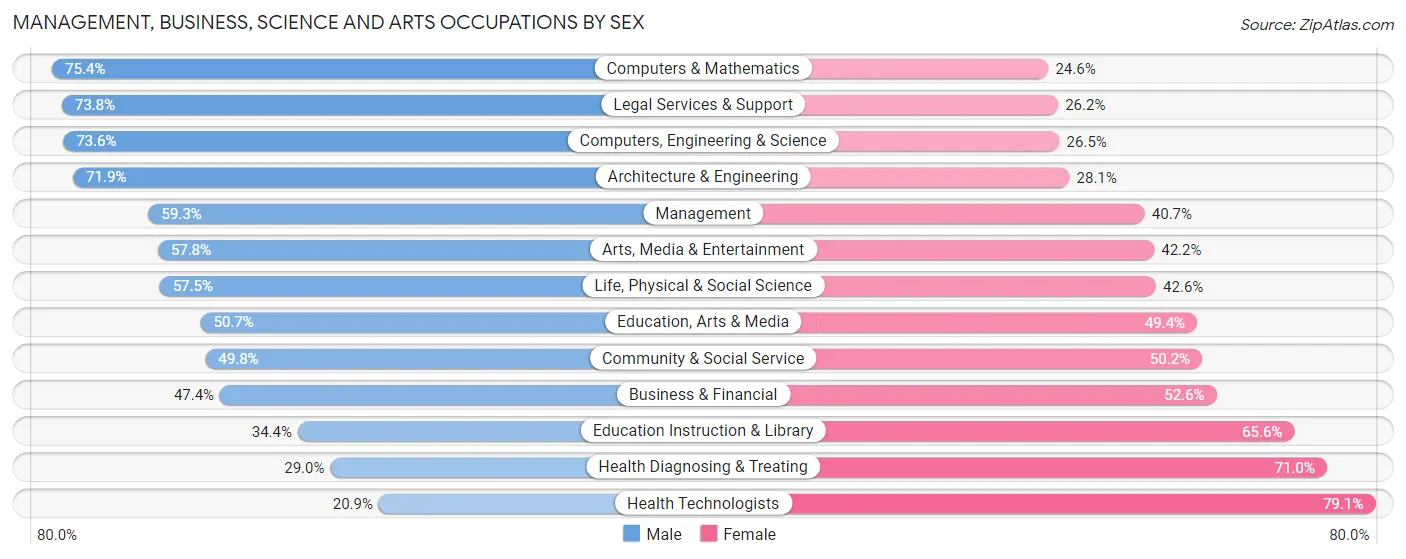
| Occupation | Male | Female |
| Management | 1,211 (59.3%) | 830 (40.7%) |
| Business & Financial | 738 (47.4%) | 819 (52.6%) |
| Computers, Engineering & Science | 1,507 (73.6%) | 542 (26.5%) |
| Computers & Mathematics | 1,160 (75.4%) | 378 (24.6%) |
| Architecture & Engineering | 266 (71.9%) | 104 (28.1%) |
| Life, Physical & Social Science | 81 (57.5%) | 60 (42.5%) |
| Community & Social Service | 677 (49.8%) | 682 (50.2%) |
| Education, Arts & Media | 39 (50.6%) | 38 (49.3%) |
| Legal Services & Support | 228 (73.8%) | 81 (26.2%) |
| Education Instruction & Library | 224 (34.4%) | 427 (65.6%) |
| Arts, Media & Entertainment | 186 (57.8%) | 136 (42.2%) |
| Health Diagnosing & Treating | 111 (29.0%) | 272 (71.0%) |
| Health Technologists | 66 (20.9%) | 250 (79.1%) |
| Total (Category) | 4,244 (57.4%) | 3,145 (42.6%) |
| Total (Overall) | 5,686 (54.9%) | 4,661 (45.1%) |
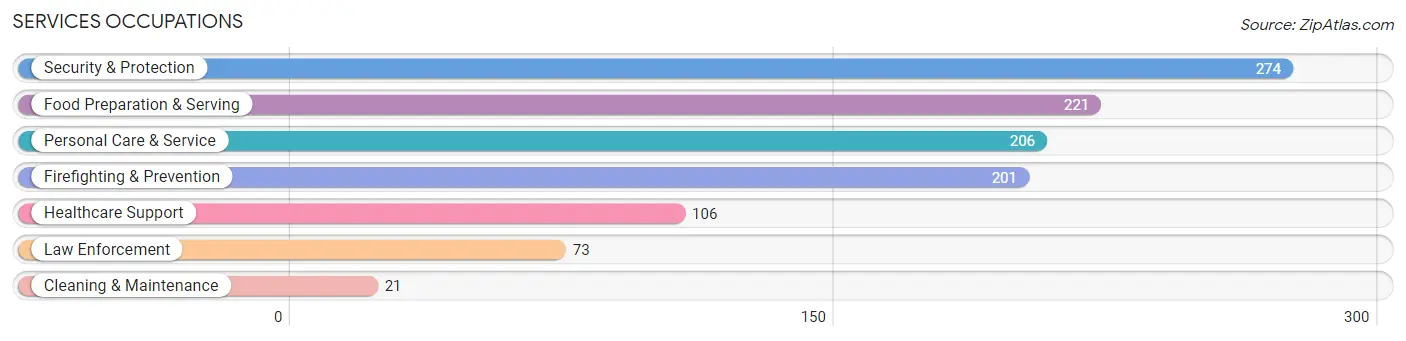
Services Occupations
The most common Services occupations in Franklin Farm are Security & Protection (274 | 2.6%), Food Preparation & Serving (221 | 2.1%), Personal Care & Service (206 | 2.0%), Firefighting & Prevention (201 | 1.9%), and Healthcare Support (106 | 1.0%).
Services Occupations by Sex
Within the Services occupations in Franklin Farm, the most male-oriented occupations are Law Enforcement (89.0%), Cleaning & Maintenance (61.9%), and Security & Protection (54.7%), while the most female-oriented occupations are Personal Care & Service (90.8%), Healthcare Support (85.9%), and Food Preparation & Serving (64.7%).
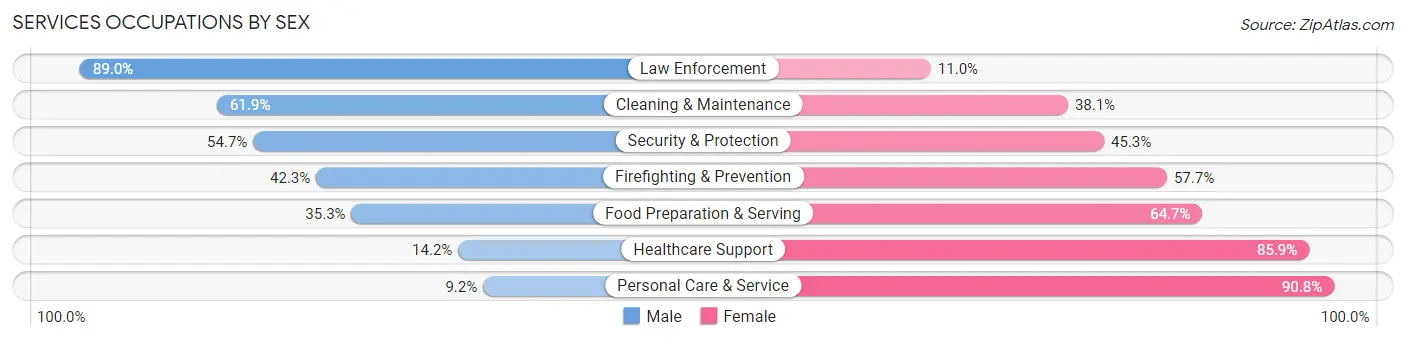
| Occupation | Male | Female |
| Healthcare Support | 15 (14.1%) | 91 (85.9%) |
| Security & Protection | 150 (54.7%) | 124 (45.3%) |
| Firefighting & Prevention | 85 (42.3%) | 116 (57.7%) |
| Law Enforcement | 65 (89.0%) | 8 (11.0%) |
| Food Preparation & Serving | 78 (35.3%) | 143 (64.7%) |
| Cleaning & Maintenance | 13 (61.9%) | 8 (38.1%) |
| Personal Care & Service | 19 (9.2%) | 187 (90.8%) |
| Total (Category) | 275 (33.2%) | 553 (66.8%) |
| Total (Overall) | 5,686 (54.9%) | 4,661 (45.1%) |
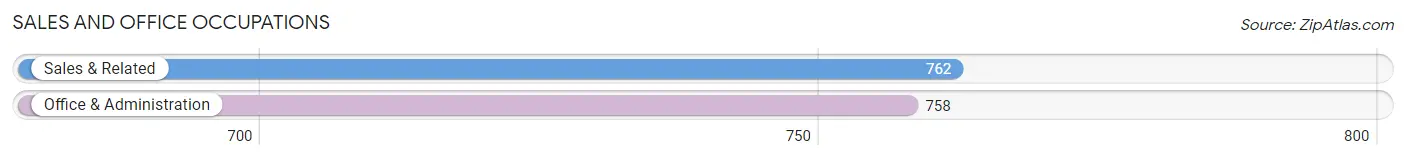
Sales and Office Occupations
The most common Sales and Office occupations in Franklin Farm are Sales & Related (762 | 7.4%), and Office & Administration (758 | 7.3%).
Sales and Office Occupations by Sex
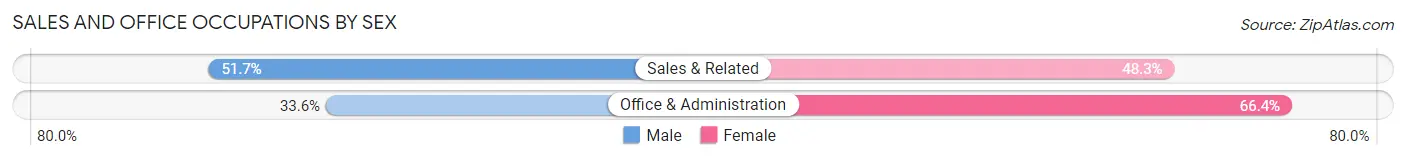
| Occupation | Male | Female |
| Sales & Related | 394 (51.7%) | 368 (48.3%) |
| Office & Administration | 255 (33.6%) | 503 (66.4%) |
| Total (Category) | 649 (42.7%) | 871 (57.3%) |
| Total (Overall) | 5,686 (54.9%) | 4,661 (45.1%) |
Natural Resources, Construction and Maintenance Occupations
The most common Natural Resources, Construction and Maintenance occupations in Franklin Farm are Installation, Maintenance & Repair (130 | 1.3%), and Construction & Extraction (67 | 0.6%).
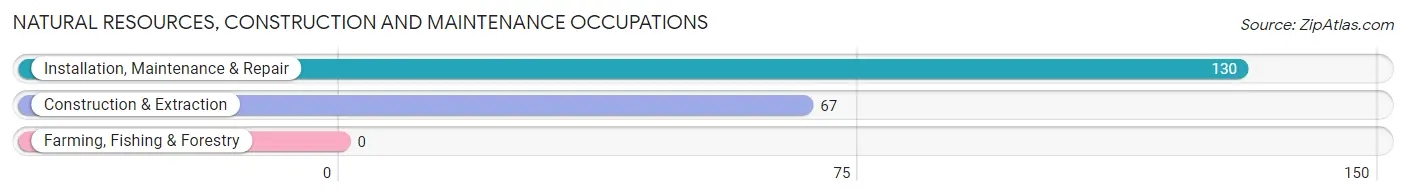
Natural Resources, Construction and Maintenance Occupations by Sex
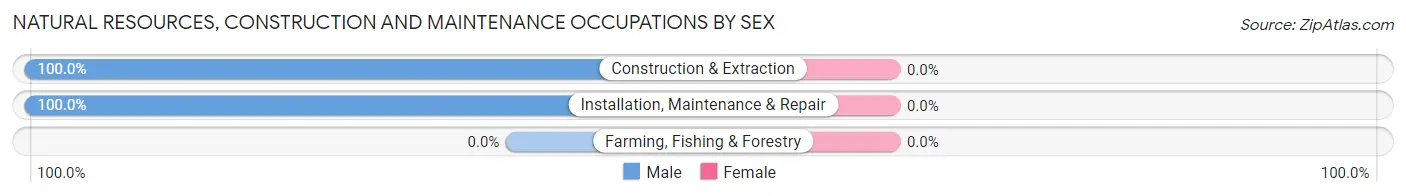
| Occupation | Male | Female |
| Farming, Fishing & Forestry | 0 (0.0%) | 0 (0.0%) |
| Construction & Extraction | 67 (100.0%) | 0 (0.0%) |
| Installation, Maintenance & Repair | 130 (100.0%) | 0 (0.0%) |
| Total (Category) | 197 (100.0%) | 0 (0.0%) |
| Total (Overall) | 5,686 (54.9%) | 4,661 (45.1%) |
Production, Transportation and Moving Occupations
The most common Production, Transportation and Moving occupations in Franklin Farm are Transportation (208 | 2.0%), Production (130 | 1.3%), and Material Moving (75 | 0.7%).
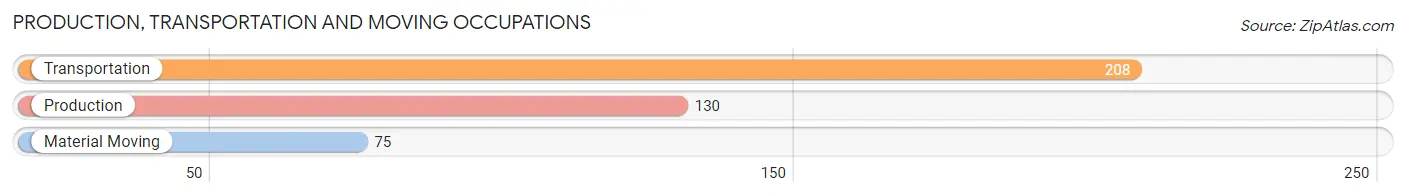
Production, Transportation and Moving Occupations by Sex
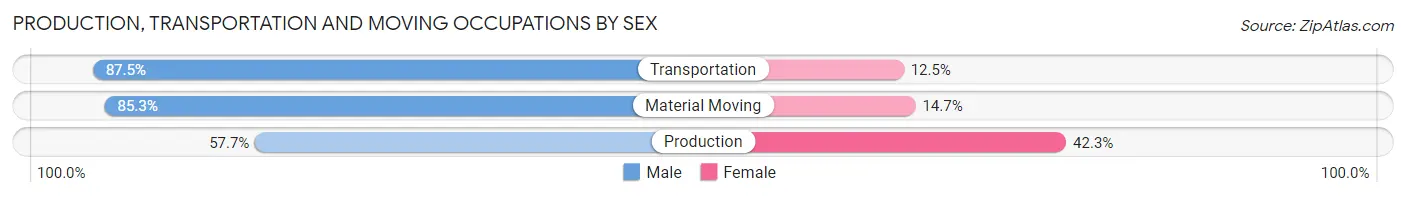
| Occupation | Male | Female |
| Production | 75 (57.7%) | 55 (42.3%) |
| Transportation | 182 (87.5%) | 26 (12.5%) |
| Material Moving | 64 (85.3%) | 11 (14.7%) |
| Total (Category) | 321 (77.7%) | 92 (22.3%) |
| Total (Overall) | 5,686 (54.9%) | 4,661 (45.1%) |
Employment Industries by Sex in Franklin Farm
Employment Industries in Franklin Farm
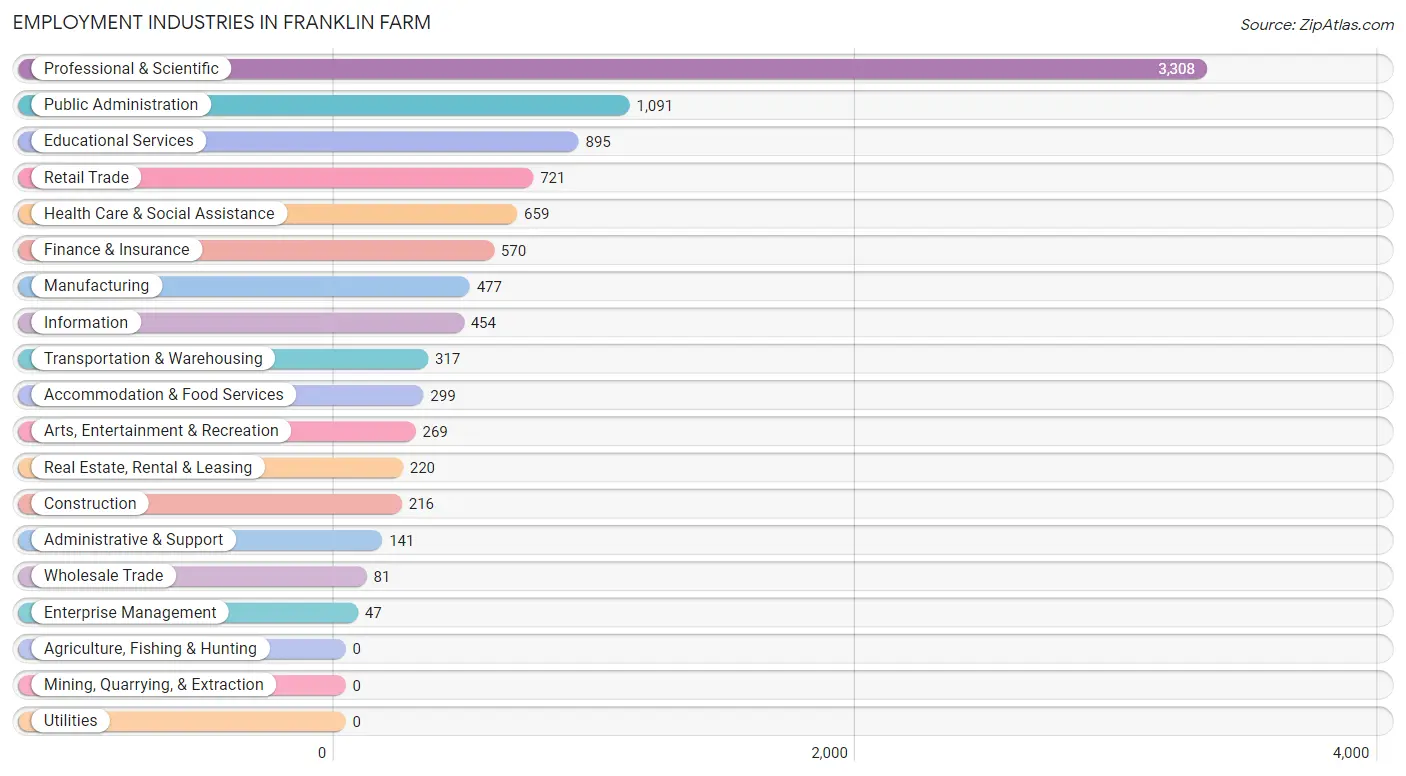
The major employment industries in Franklin Farm include Professional & Scientific (3,308 | 32.0%), Public Administration (1,091 | 10.5%), Educational Services (895 | 8.6%), Retail Trade (721 | 7.0%), and Health Care & Social Assistance (659 | 6.4%).
Employment Industries by Sex in Franklin Farm
The Franklin Farm industries that see more men than women are Transportation & Warehousing (78.5%), Wholesale Trade (77.8%), and Information (76.0%), whereas the industries that tend to have a higher number of women are Health Care & Social Assistance (77.4%), Administrative & Support (63.8%), and Educational Services (63.1%).
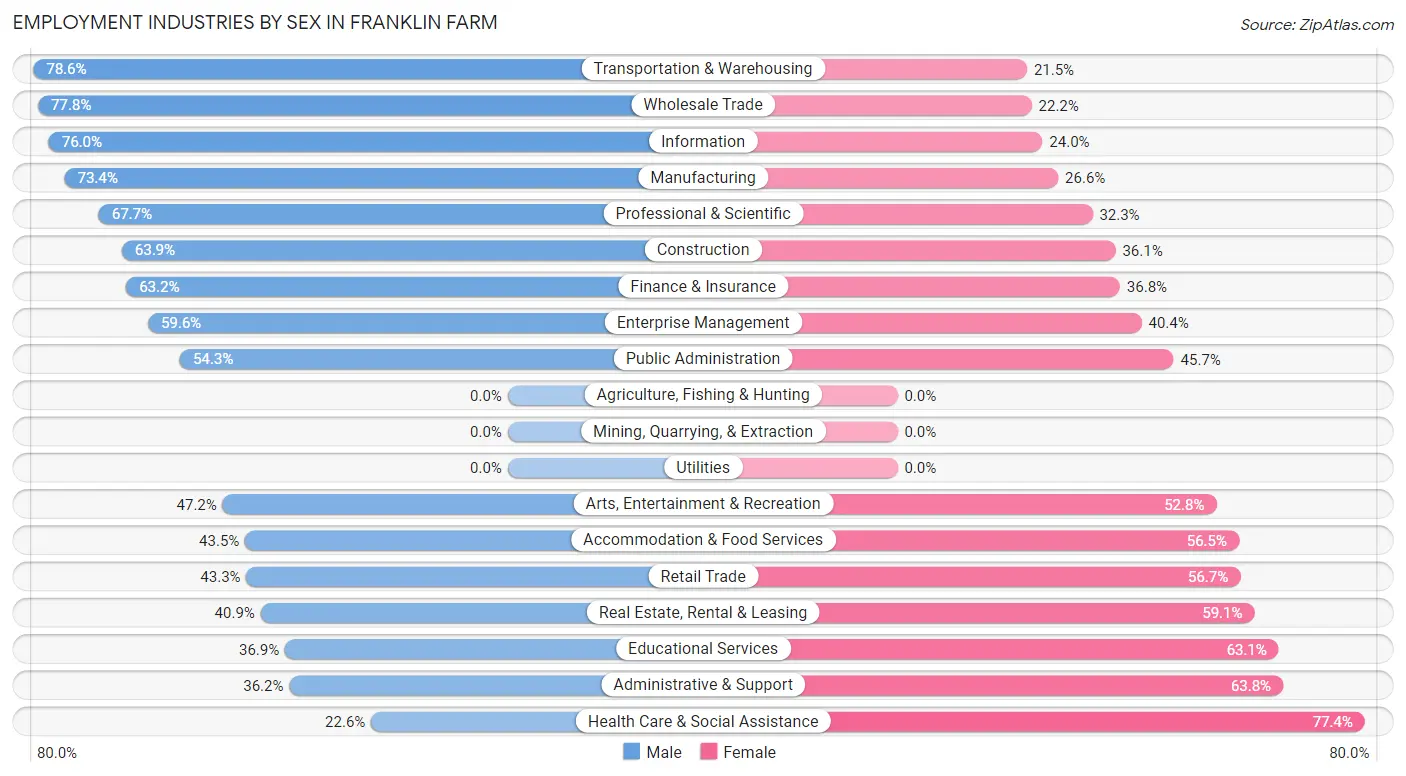
| Industry | Male | Female |
| Agriculture, Fishing & Hunting | 0 (0.0%) | 0 (0.0%) |
| Mining, Quarrying, & Extraction | 0 (0.0%) | 0 (0.0%) |
| Construction | 138 (63.9%) | 78 (36.1%) |
| Manufacturing | 350 (73.4%) | 127 (26.6%) |
| Wholesale Trade | 63 (77.8%) | 18 (22.2%) |
| Retail Trade | 312 (43.3%) | 409 (56.7%) |
| Transportation & Warehousing | 249 (78.5%) | 68 (21.4%) |
| Utilities | 0 (0.0%) | 0 (0.0%) |
| Information | 345 (76.0%) | 109 (24.0%) |
| Finance & Insurance | 360 (63.2%) | 210 (36.8%) |
| Real Estate, Rental & Leasing | 90 (40.9%) | 130 (59.1%) |
| Professional & Scientific | 2,240 (67.7%) | 1,068 (32.3%) |
| Enterprise Management | 28 (59.6%) | 19 (40.4%) |
| Administrative & Support | 51 (36.2%) | 90 (63.8%) |
| Educational Services | 330 (36.9%) | 565 (63.1%) |
| Health Care & Social Assistance | 149 (22.6%) | 510 (77.4%) |
| Arts, Entertainment & Recreation | 127 (47.2%) | 142 (52.8%) |
| Accommodation & Food Services | 130 (43.5%) | 169 (56.5%) |
| Public Administration | 592 (54.3%) | 499 (45.7%) |
| Total | 5,686 (54.9%) | 4,661 (45.1%) |
Education in Franklin Farm
School Enrollment in Franklin Farm
The most common levels of schooling among the 5,720 students in Franklin Farm are high school (1,301 | 22.7%), middle school (1,276 | 22.3%), and elementary school (1,101 | 19.3%).
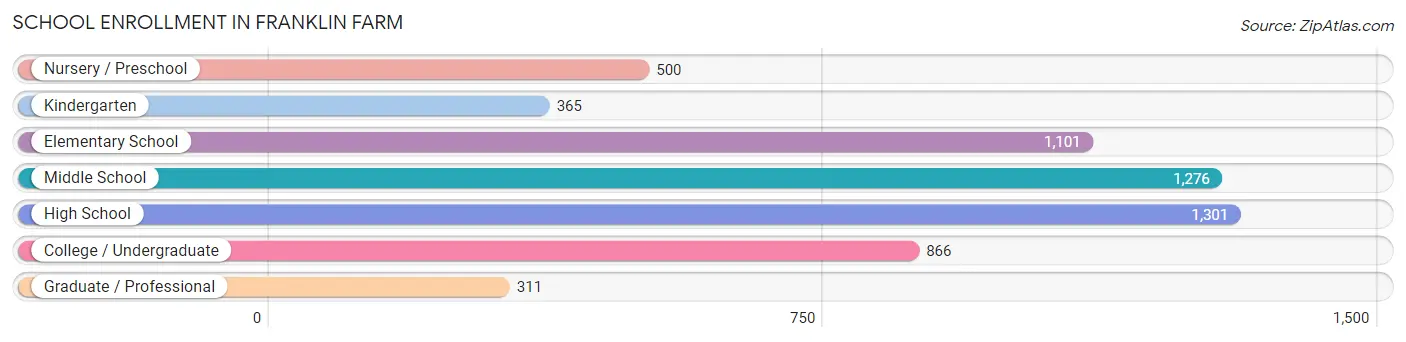
| School Level | # Students | % Students |
| Nursery / Preschool | 500 | 8.7% |
| Kindergarten | 365 | 6.4% |
| Elementary School | 1,101 | 19.3% |
| Middle School | 1,276 | 22.3% |
| High School | 1,301 | 22.7% |
| College / Undergraduate | 866 | 15.1% |
| Graduate / Professional | 311 | 5.4% |
| Total | 5,720 | 100.0% |
School Enrollment by Age by Funding Source in Franklin Farm
Out of a total of 5,720 students who are enrolled in schools in Franklin Farm, 1,178 (20.6%) attend a private institution, while the remaining 4,542 (79.4%) are enrolled in public schools. The age group of 3 to 4 year olds has the highest likelihood of being enrolled in private schools, with 364 (86.7% in the age bracket) enrolled. Conversely, the age group of 10 to 14 year olds has the lowest likelihood of being enrolled in a private school, with 1,600 (93.6% in the age bracket) attending a public institution.
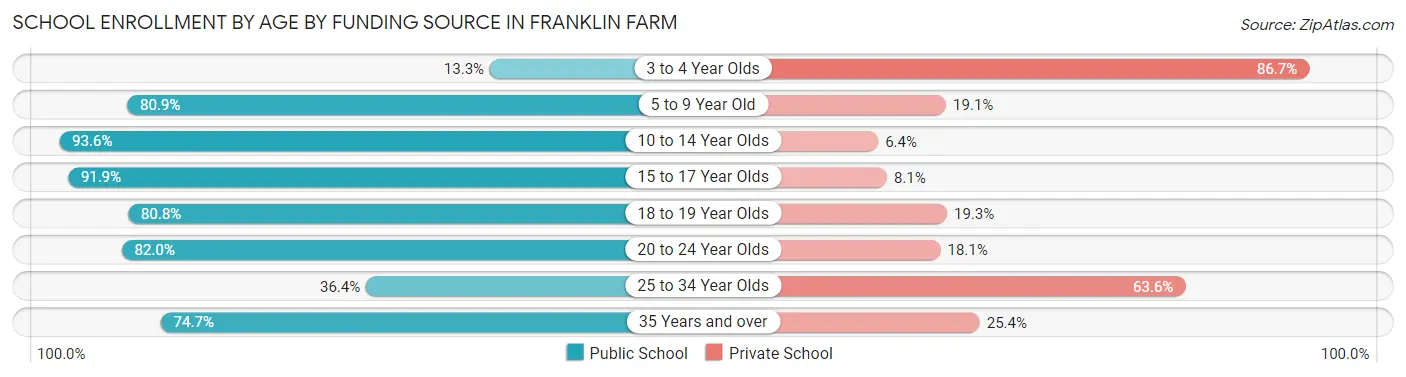
| Age Bracket | Public School | Private School |
| 3 to 4 Year Olds | 56 (13.3%) | 364 (86.7%) |
| 5 to 9 Year Old | 1,115 (80.9%) | 263 (19.1%) |
| 10 to 14 Year Olds | 1,600 (93.6%) | 110 (6.4%) |
| 15 to 17 Year Olds | 821 (91.9%) | 72 (8.1%) |
| 18 to 19 Year Olds | 302 (80.7%) | 72 (19.3%) |
| 20 to 24 Year Olds | 395 (82.0%) | 87 (18.0%) |
| 25 to 34 Year Olds | 91 (36.4%) | 159 (63.6%) |
| 35 Years and over | 159 (74.7%) | 54 (25.4%) |
| Total | 4,542 (79.4%) | 1,178 (20.6%) |
Educational Attainment by Field of Study in Franklin Farm
Business (1,748 | 16.6%), social sciences (1,425 | 13.6%), engineering (1,402 | 13.3%), computers & mathematics (989 | 9.4%), and education (725 | 6.9%) are the most common fields of study among 10,510 individuals in Franklin Farm who have obtained a bachelor's degree or higher.
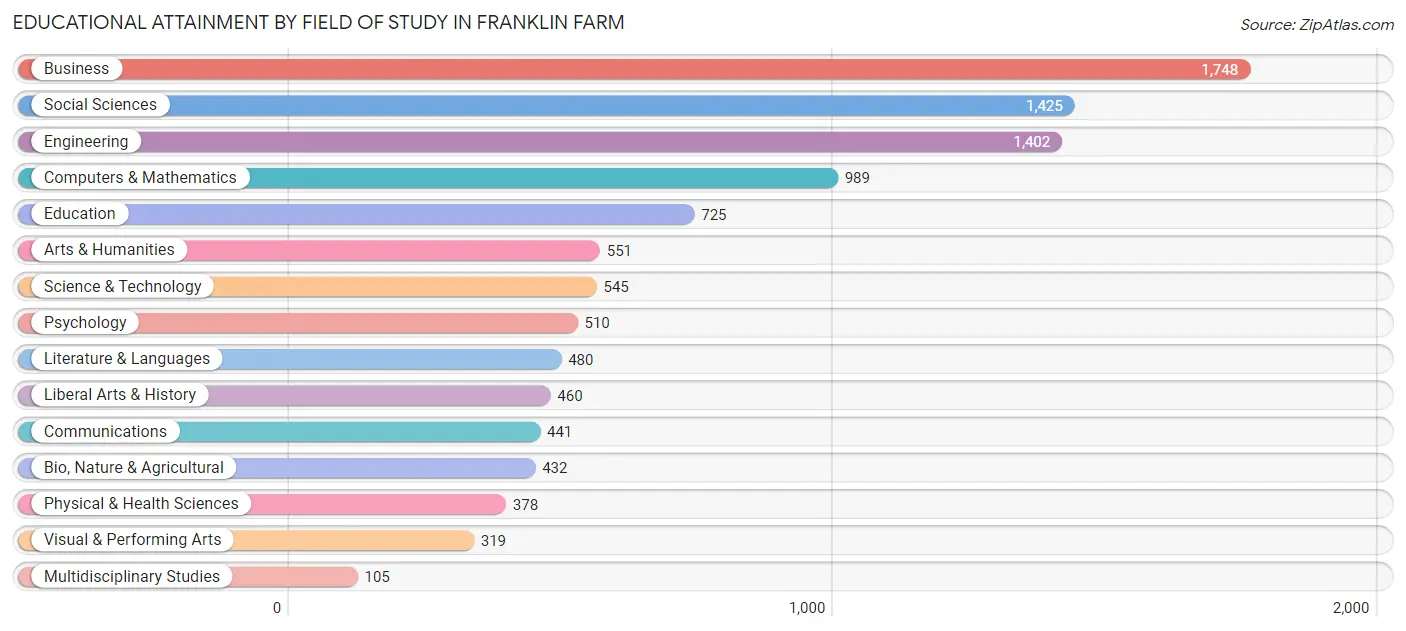
| Field of Study | # Graduates | % Graduates |
| Computers & Mathematics | 989 | 9.4% |
| Bio, Nature & Agricultural | 432 | 4.1% |
| Physical & Health Sciences | 378 | 3.6% |
| Psychology | 510 | 4.9% |
| Social Sciences | 1,425 | 13.6% |
| Engineering | 1,402 | 13.3% |
| Multidisciplinary Studies | 105 | 1.0% |
| Science & Technology | 545 | 5.2% |
| Business | 1,748 | 16.6% |
| Education | 725 | 6.9% |
| Literature & Languages | 480 | 4.6% |
| Liberal Arts & History | 460 | 4.4% |
| Visual & Performing Arts | 319 | 3.0% |
| Communications | 441 | 4.2% |
| Arts & Humanities | 551 | 5.2% |
| Total | 10,510 | 100.0% |
Transportation & Commute in Franklin Farm
Vehicle Availability by Sex in Franklin Farm
The most prevalent vehicle ownership categories in Franklin Farm are males with 2 vehicles (2,884, accounting for 50.8%) and females with 2 vehicles (2,385, making up 64.0%).
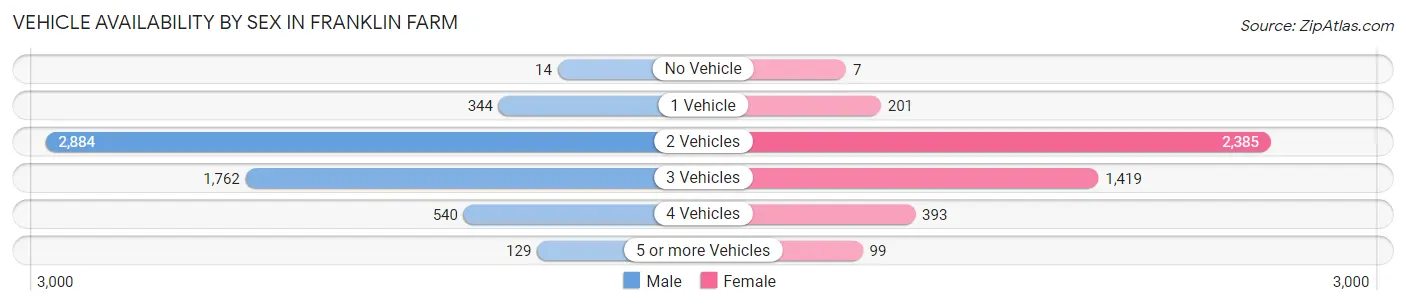
| Vehicles Available | Male | Female |
| No Vehicle | 14 (0.3%) | 7 (0.2%) |
| 1 Vehicle | 344 (6.1%) | 201 (4.5%) |
| 2 Vehicles | 2,884 (50.8%) | 2,385 (52.9%) |
| 3 Vehicles | 1,762 (31.1%) | 1,419 (31.5%) |
| 4 Vehicles | 540 (9.5%) | 393 (8.7%) |
| 5 or more Vehicles | 129 (2.3%) | 99 (2.2%) |
| Total | 5,673 (100.0%) | 4,504 (100.0%) |
Commute Time in Franklin Farm
The most frequently occuring commute durations in Franklin Farm are 15 to 19 minutes (1,364 commuters, 19.8%), 20 to 24 minutes (983 commuters, 14.3%), and 30 to 34 minutes (872 commuters, 12.7%).
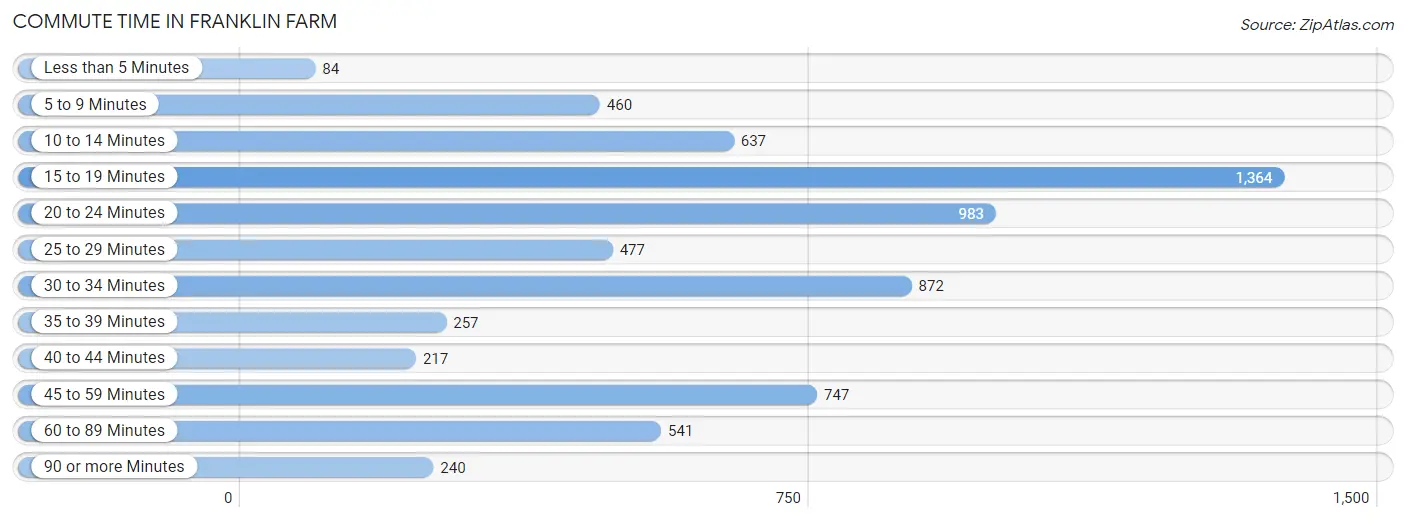
| Commute Time | # Commuters | % Commuters |
| Less than 5 Minutes | 84 | 1.2% |
| 5 to 9 Minutes | 460 | 6.7% |
| 10 to 14 Minutes | 637 | 9.3% |
| 15 to 19 Minutes | 1,364 | 19.8% |
| 20 to 24 Minutes | 983 | 14.3% |
| 25 to 29 Minutes | 477 | 6.9% |
| 30 to 34 Minutes | 872 | 12.7% |
| 35 to 39 Minutes | 257 | 3.7% |
| 40 to 44 Minutes | 217 | 3.2% |
| 45 to 59 Minutes | 747 | 10.9% |
| 60 to 89 Minutes | 541 | 7.9% |
| 90 or more Minutes | 240 | 3.5% |
Commute Time by Sex in Franklin Farm
The most common commute times in Franklin Farm are 15 to 19 minutes (788 commuters, 20.8%) for males and 15 to 19 minutes (576 commuters, 18.6%) for females.
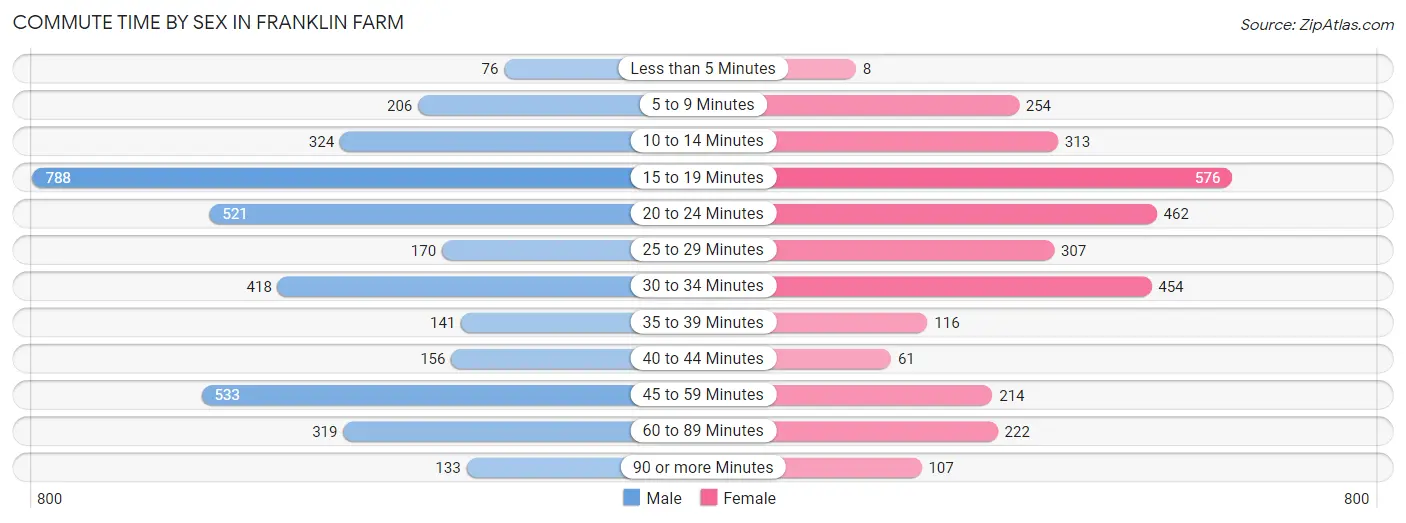
| Commute Time | Male | Female |
| Less than 5 Minutes | 76 (2.0%) | 8 (0.3%) |
| 5 to 9 Minutes | 206 (5.4%) | 254 (8.2%) |
| 10 to 14 Minutes | 324 (8.6%) | 313 (10.1%) |
| 15 to 19 Minutes | 788 (20.8%) | 576 (18.6%) |
| 20 to 24 Minutes | 521 (13.8%) | 462 (14.9%) |
| 25 to 29 Minutes | 170 (4.5%) | 307 (9.9%) |
| 30 to 34 Minutes | 418 (11.0%) | 454 (14.7%) |
| 35 to 39 Minutes | 141 (3.7%) | 116 (3.7%) |
| 40 to 44 Minutes | 156 (4.1%) | 61 (2.0%) |
| 45 to 59 Minutes | 533 (14.1%) | 214 (6.9%) |
| 60 to 89 Minutes | 319 (8.4%) | 222 (7.2%) |
| 90 or more Minutes | 133 (3.5%) | 107 (3.5%) |
Time of Departure to Work by Sex in Franklin Farm
The most frequent times of departure to work in Franklin Farm are 9:00 AM to 9:59 AM (678, 17.9%) for males and 8:00 AM to 8:29 AM (477, 15.4%) for females.
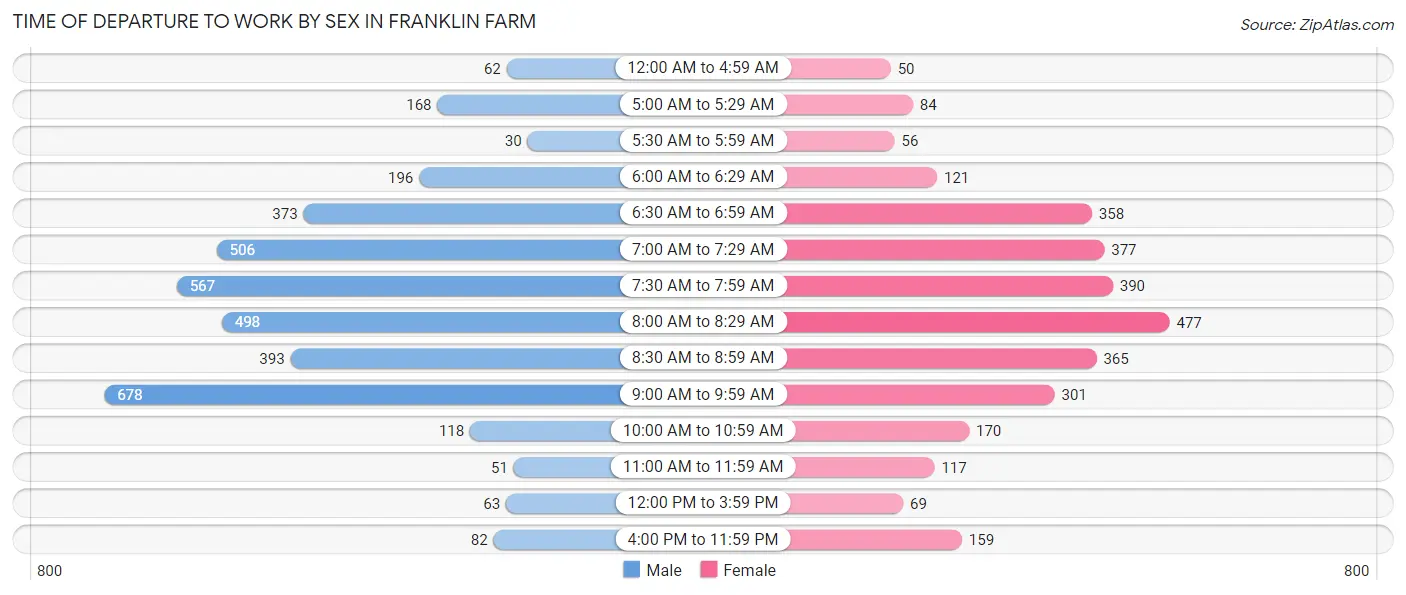
| Time of Departure | Male | Female |
| 12:00 AM to 4:59 AM | 62 (1.6%) | 50 (1.6%) |
| 5:00 AM to 5:29 AM | 168 (4.4%) | 84 (2.7%) |
| 5:30 AM to 5:59 AM | 30 (0.8%) | 56 (1.8%) |
| 6:00 AM to 6:29 AM | 196 (5.2%) | 121 (3.9%) |
| 6:30 AM to 6:59 AM | 373 (9.9%) | 358 (11.6%) |
| 7:00 AM to 7:29 AM | 506 (13.4%) | 377 (12.2%) |
| 7:30 AM to 7:59 AM | 567 (15.0%) | 390 (12.6%) |
| 8:00 AM to 8:29 AM | 498 (13.2%) | 477 (15.4%) |
| 8:30 AM to 8:59 AM | 393 (10.4%) | 365 (11.8%) |
| 9:00 AM to 9:59 AM | 678 (17.9%) | 301 (9.7%) |
| 10:00 AM to 10:59 AM | 118 (3.1%) | 170 (5.5%) |
| 11:00 AM to 11:59 AM | 51 (1.3%) | 117 (3.8%) |
| 12:00 PM to 3:59 PM | 63 (1.7%) | 69 (2.2%) |
| 4:00 PM to 11:59 PM | 82 (2.2%) | 159 (5.1%) |
| Total | 3,785 (100.0%) | 3,094 (100.0%) |
Housing Occupancy in Franklin Farm
Occupancy by Ownership in Franklin Farm
Of the total 6,137 dwellings in Franklin Farm, owner-occupied units account for 5,669 (92.4%), while renter-occupied units make up 468 (7.6%).
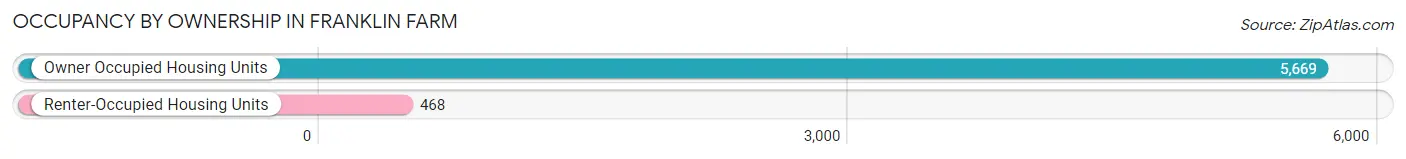
| Occupancy | # Housing Units | % Housing Units |
| Owner Occupied Housing Units | 5,669 | 92.4% |
| Renter-Occupied Housing Units | 468 | 7.6% |
| Total Occupied Housing Units | 6,137 | 100.0% |
Occupancy by Household Size in Franklin Farm
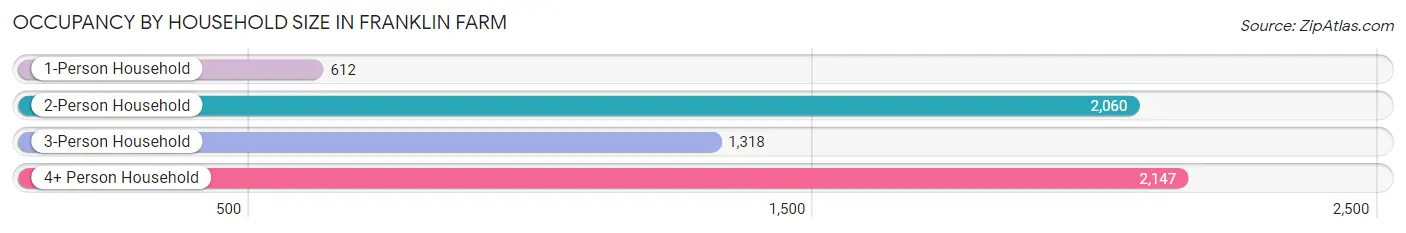
| Household Size | # Housing Units | % Housing Units |
| 1-Person Household | 612 | 10.0% |
| 2-Person Household | 2,060 | 33.6% |
| 3-Person Household | 1,318 | 21.5% |
| 4+ Person Household | 2,147 | 35.0% |
| Total Housing Units | 6,137 | 100.0% |
Occupancy by Ownership by Household Size in Franklin Farm
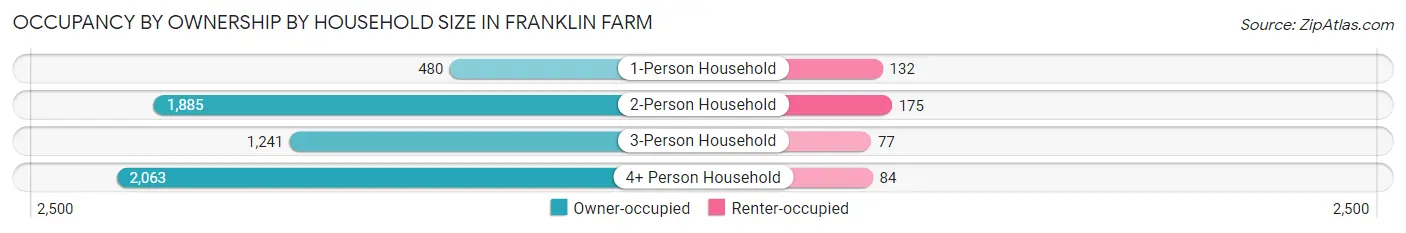
| Household Size | Owner-occupied | Renter-occupied |
| 1-Person Household | 480 (78.4%) | 132 (21.6%) |
| 2-Person Household | 1,885 (91.5%) | 175 (8.5%) |
| 3-Person Household | 1,241 (94.2%) | 77 (5.8%) |
| 4+ Person Household | 2,063 (96.1%) | 84 (3.9%) |
| Total Housing Units | 5,669 (92.4%) | 468 (7.6%) |
Occupancy by Educational Attainment in Franklin Farm
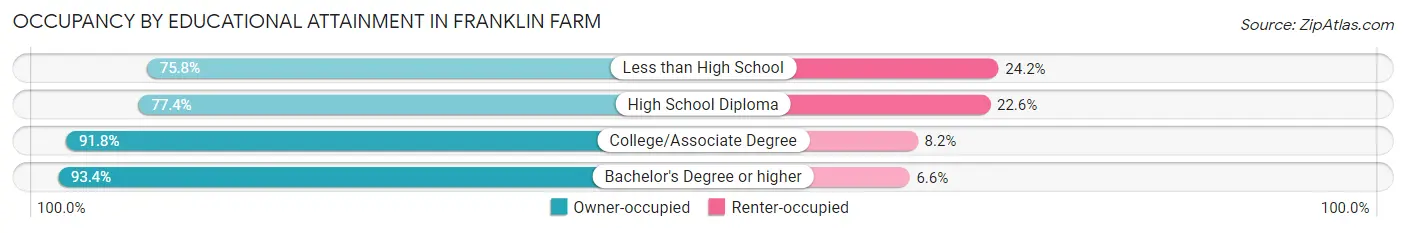
| Household Size | Owner-occupied | Renter-occupied |
| Less than High School | 25 (75.8%) | 8 (24.2%) |
| High School Diploma | 223 (77.4%) | 65 (22.6%) |
| College/Associate Degree | 625 (91.8%) | 56 (8.2%) |
| Bachelor's Degree or higher | 4,796 (93.4%) | 339 (6.6%) |
Occupancy by Age of Householder in Franklin Farm
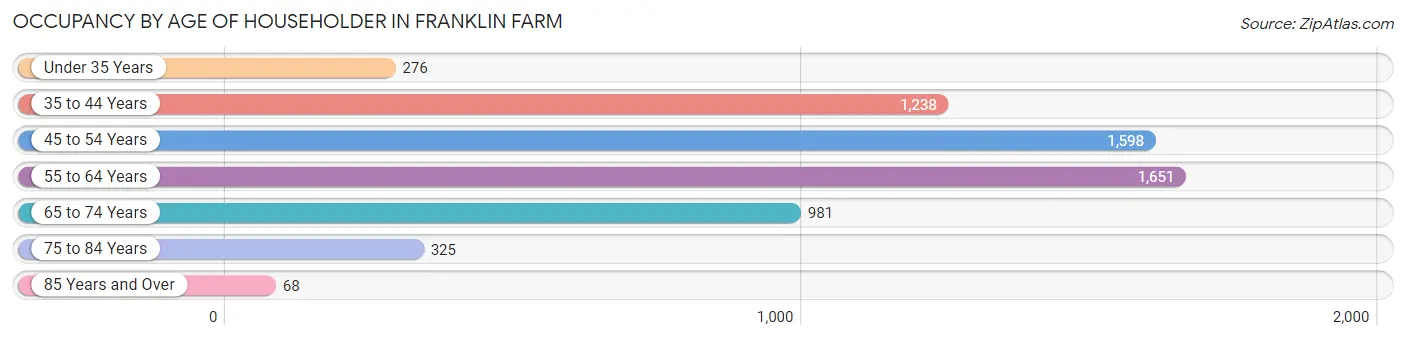
| Age Bracket | # Households | % Households |
| Under 35 Years | 276 | 4.5% |
| 35 to 44 Years | 1,238 | 20.2% |
| 45 to 54 Years | 1,598 | 26.0% |
| 55 to 64 Years | 1,651 | 26.9% |
| 65 to 74 Years | 981 | 16.0% |
| 75 to 84 Years | 325 | 5.3% |
| 85 Years and Over | 68 | 1.1% |
| Total | 6,137 | 100.0% |
Housing Finances in Franklin Farm
Median Income by Occupancy in Franklin Farm
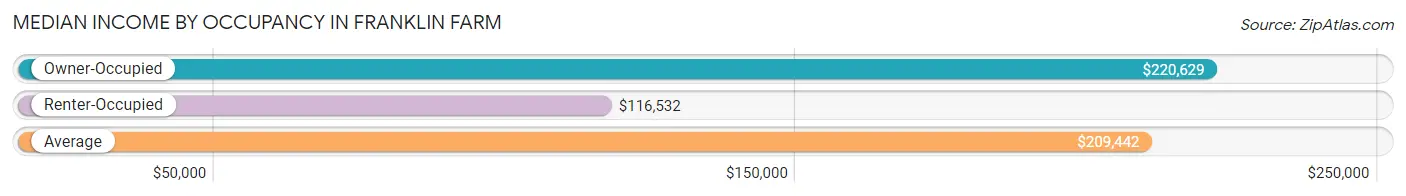
| Occupancy Type | # Households | Median Income |
| Owner-Occupied | 5,669 (92.4%) | $220,629 |
| Renter-Occupied | 468 (7.6%) | $116,532 |
| Average | 6,137 (100.0%) | $209,442 |
Occupancy by Householder Income Bracket in Franklin Farm
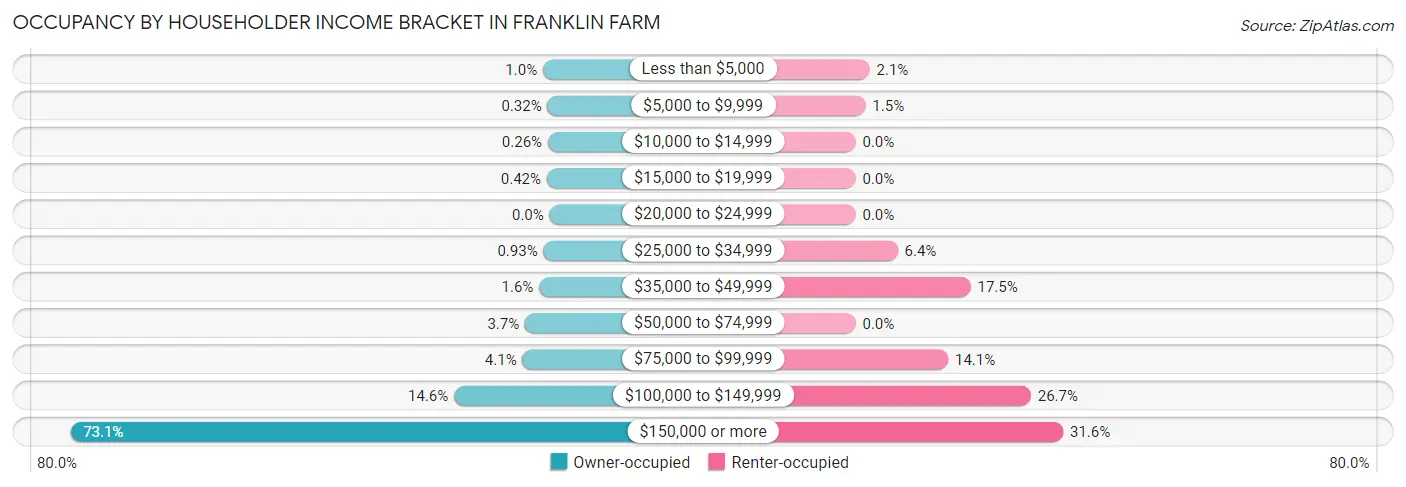
| Income Bracket | Owner-occupied | Renter-occupied |
| Less than $5,000 | 57 (1.0%) | 10 (2.1%) |
| $5,000 to $9,999 | 18 (0.3%) | 7 (1.5%) |
| $10,000 to $14,999 | 15 (0.3%) | 0 (0.0%) |
| $15,000 to $19,999 | 24 (0.4%) | 0 (0.0%) |
| $20,000 to $24,999 | 0 (0.0%) | 0 (0.0%) |
| $25,000 to $34,999 | 53 (0.9%) | 30 (6.4%) |
| $35,000 to $49,999 | 90 (1.6%) | 82 (17.5%) |
| $50,000 to $74,999 | 212 (3.7%) | 0 (0.0%) |
| $75,000 to $99,999 | 234 (4.1%) | 66 (14.1%) |
| $100,000 to $149,999 | 825 (14.5%) | 125 (26.7%) |
| $150,000 or more | 4,141 (73.1%) | 148 (31.6%) |
| Total | 5,669 (100.0%) | 468 (100.0%) |
Monthly Housing Cost Tiers in Franklin Farm
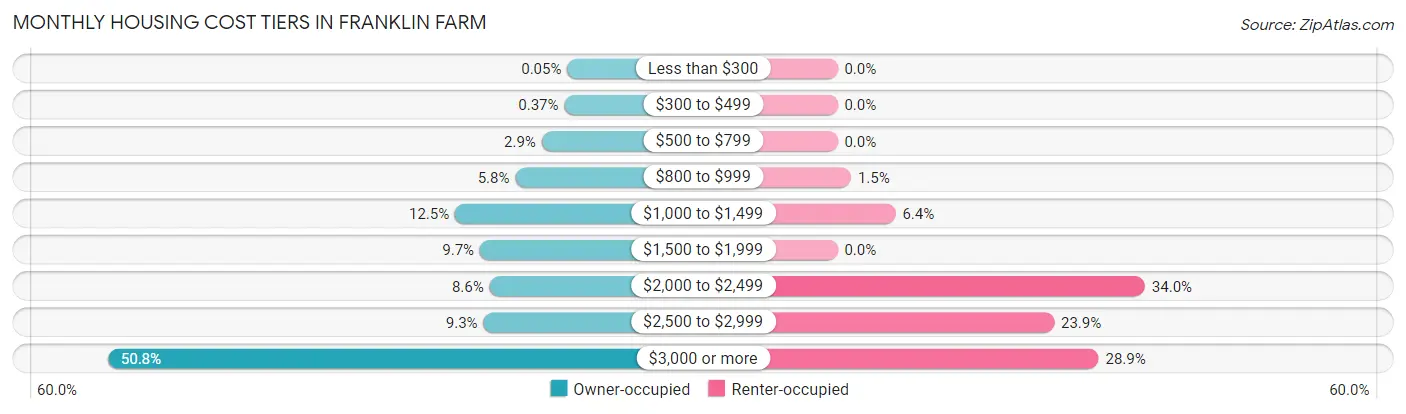
| Monthly Cost | Owner-occupied | Renter-occupied |
| Less than $300 | 3 (0.1%) | 0 (0.0%) |
| $300 to $499 | 21 (0.4%) | 0 (0.0%) |
| $500 to $799 | 163 (2.9%) | 0 (0.0%) |
| $800 to $999 | 328 (5.8%) | 7 (1.5%) |
| $1,000 to $1,499 | 706 (12.4%) | 30 (6.4%) |
| $1,500 to $1,999 | 550 (9.7%) | 0 (0.0%) |
| $2,000 to $2,499 | 490 (8.6%) | 159 (34.0%) |
| $2,500 to $2,999 | 528 (9.3%) | 112 (23.9%) |
| $3,000 or more | 2,880 (50.8%) | 135 (28.8%) |
| Total | 5,669 (100.0%) | 468 (100.0%) |
Physical Housing Characteristics in Franklin Farm
Housing Structures in Franklin Farm
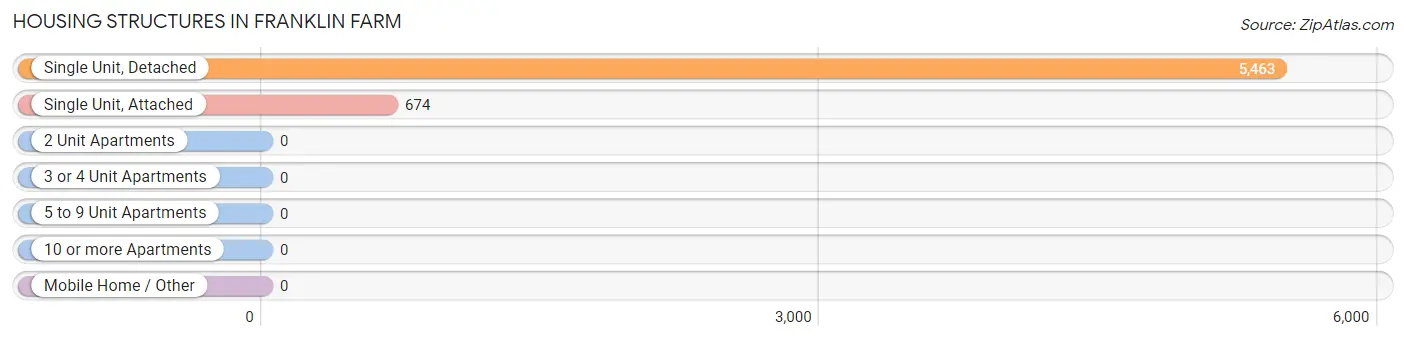
| Structure Type | # Housing Units | % Housing Units |
| Single Unit, Detached | 5,463 | 89.0% |
| Single Unit, Attached | 674 | 11.0% |
| 2 Unit Apartments | 0 | 0.0% |
| 3 or 4 Unit Apartments | 0 | 0.0% |
| 5 to 9 Unit Apartments | 0 | 0.0% |
| 10 or more Apartments | 0 | 0.0% |
| Mobile Home / Other | 0 | 0.0% |
| Total | 6,137 | 100.0% |
Housing Structures by Occupancy in Franklin Farm
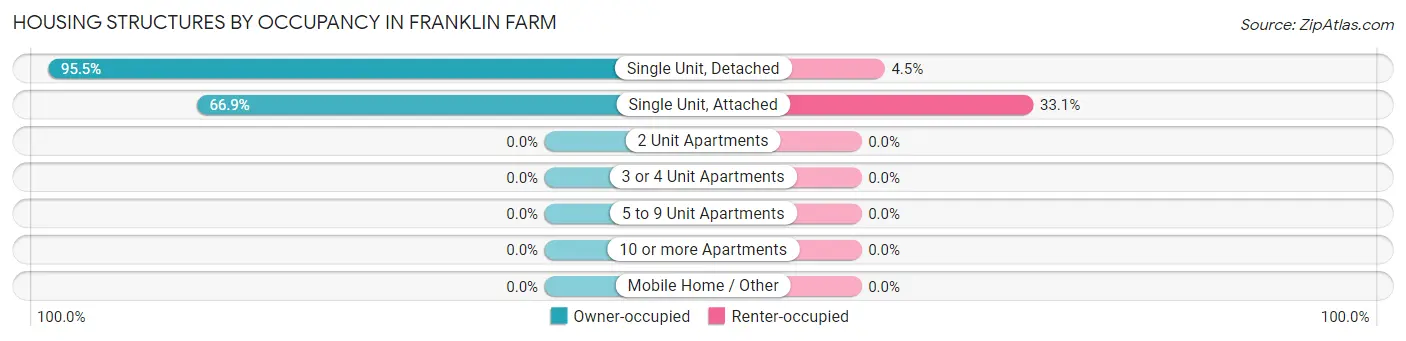
| Structure Type | Owner-occupied | Renter-occupied |
| Single Unit, Detached | 5,218 (95.5%) | 245 (4.5%) |
| Single Unit, Attached | 451 (66.9%) | 223 (33.1%) |
| 2 Unit Apartments | 0 (0.0%) | 0 (0.0%) |
| 3 or 4 Unit Apartments | 0 (0.0%) | 0 (0.0%) |
| 5 to 9 Unit Apartments | 0 (0.0%) | 0 (0.0%) |
| 10 or more Apartments | 0 (0.0%) | 0 (0.0%) |
| Mobile Home / Other | 0 (0.0%) | 0 (0.0%) |
| Total | 5,669 (92.4%) | 468 (7.6%) |
Housing Structures by Number of Rooms in Franklin Farm
| Number of Rooms | Owner-occupied | Renter-occupied |
| 1 Room | 0 (0.0%) | 0 (0.0%) |
| 2 or 3 Rooms | 8 (0.1%) | 10 (2.1%) |
| 4 or 5 Rooms | 341 (6.0%) | 129 (27.6%) |
| 6 or 7 Rooms | 837 (14.8%) | 253 (54.1%) |
| 8 or more Rooms | 4,483 (79.1%) | 76 (16.2%) |
| Total | 5,669 (100.0%) | 468 (100.0%) |
Housing Structure by Heating Type in Franklin Farm
| Heating Type | Owner-occupied | Renter-occupied |
| Utility Gas | 2,673 (47.1%) | 100 (21.4%) |
| Bottled, Tank, or LP Gas | 14 (0.3%) | 8 (1.7%) |
| Electricity | 2,867 (50.6%) | 360 (76.9%) |
| Fuel Oil or Kerosene | 105 (1.8%) | 0 (0.0%) |
| Coal or Coke | 0 (0.0%) | 0 (0.0%) |
| All other Fuels | 10 (0.2%) | 0 (0.0%) |
| No Fuel Used | 0 (0.0%) | 0 (0.0%) |
| Total | 5,669 (100.0%) | 468 (100.0%) |
Household Vehicle Usage in Franklin Farm
| Vehicles per Household | Owner-occupied | Renter-occupied |
| No Vehicle | 14 (0.3%) | 0 (0.0%) |
| 1 Vehicle | 646 (11.4%) | 195 (41.7%) |
| 2 Vehicles | 3,138 (55.3%) | 199 (42.5%) |
| 3 or more Vehicles | 1,871 (33.0%) | 74 (15.8%) |
| Total | 5,669 (100.0%) | 468 (100.0%) |
Real Estate & Mortgages in Franklin Farm
Real Estate and Mortgage Overview in Franklin Farm
| Characteristic | Without Mortgage | With Mortgage |
| Housing Units | 1,270 | 4,399 |
| Median Property Value | $796,300 | $759,400 |
| Median Household Income | $188,158 | $3,412 |
| Monthly Housing Costs | $1,103 | $2,880 |
| Real Estate Taxes | $8,773 | $21 |
Property Value by Mortgage Status in Franklin Farm
| Property Value | Without Mortgage | With Mortgage |
| Less than $50,000 | 0 (0.0%) | 3 (0.1%) |
| $50,000 to $99,999 | 0 (0.0%) | 19 (0.4%) |
| $100,000 to $299,999 | 7 (0.5%) | 25 (0.6%) |
| $300,000 to $499,999 | 95 (7.5%) | 397 (9.0%) |
| $500,000 to $749,999 | 440 (34.6%) | 1,692 (38.5%) |
| $750,000 to $999,999 | 502 (39.5%) | 1,687 (38.4%) |
| $1,000,000 or more | 226 (17.8%) | 576 (13.1%) |
| Total | 1,270 (100.0%) | 4,399 (100.0%) |
Household Income by Mortgage Status in Franklin Farm
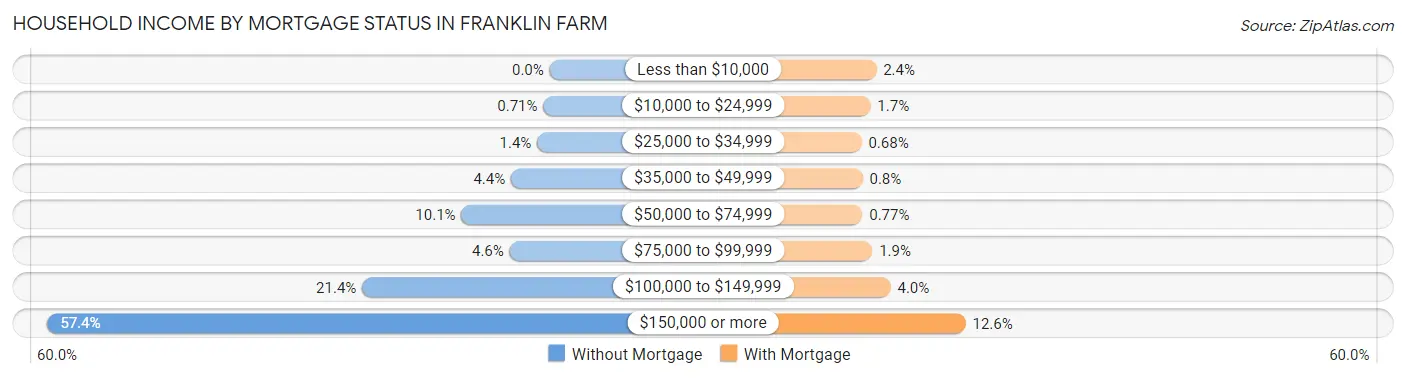
| Household Income | Without Mortgage | With Mortgage |
| Less than $10,000 | 0 (0.0%) | 104 (2.4%) |
| $10,000 to $24,999 | 9 (0.7%) | 75 (1.7%) |
| $25,000 to $34,999 | 18 (1.4%) | 30 (0.7%) |
| $35,000 to $49,999 | 56 (4.4%) | 35 (0.8%) |
| $50,000 to $74,999 | 128 (10.1%) | 34 (0.8%) |
| $75,000 to $99,999 | 58 (4.6%) | 84 (1.9%) |
| $100,000 to $149,999 | 272 (21.4%) | 176 (4.0%) |
| $150,000 or more | 729 (57.4%) | 553 (12.6%) |
| Total | 1,270 (100.0%) | 4,399 (100.0%) |
Property Value to Household Income Ratio in Franklin Farm
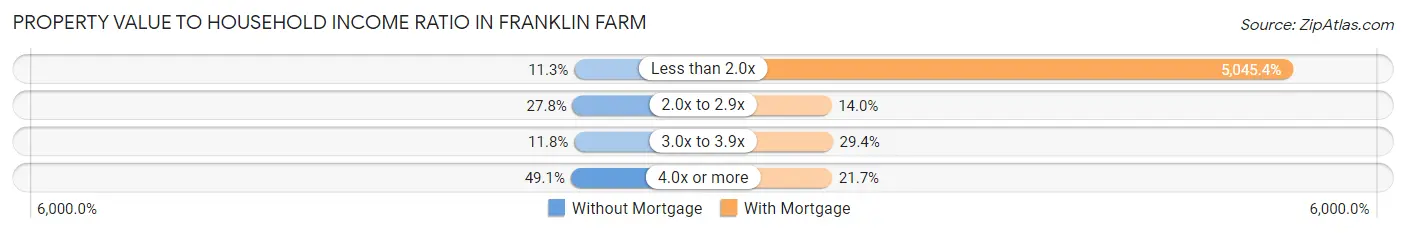
| Value-to-Income Ratio | Without Mortgage | With Mortgage |
| Less than 2.0x | 143 (11.3%) | 221,947 (5,045.4%) |
| 2.0x to 2.9x | 353 (27.8%) | 617 (14.0%) |
| 3.0x to 3.9x | 150 (11.8%) | 1,291 (29.3%) |
| 4.0x or more | 624 (49.1%) | 953 (21.7%) |
| Total | 1,270 (100.0%) | 4,399 (100.0%) |
Real Estate Taxes by Mortgage Status in Franklin Farm
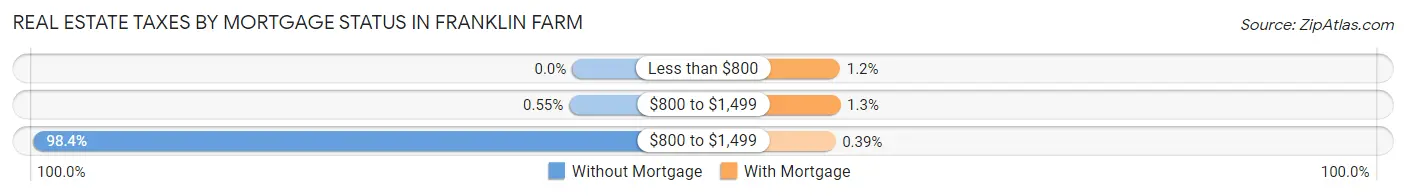
| Property Taxes | Without Mortgage | With Mortgage |
| Less than $800 | 0 (0.0%) | 54 (1.2%) |
| $800 to $1,499 | 7 (0.5%) | 57 (1.3%) |
| $800 to $1,499 | 1,249 (98.4%) | 17 (0.4%) |
| Total | 1,270 (100.0%) | 4,399 (100.0%) |
Health & Disability in Franklin Farm
Health Insurance Coverage by Age in Franklin Farm
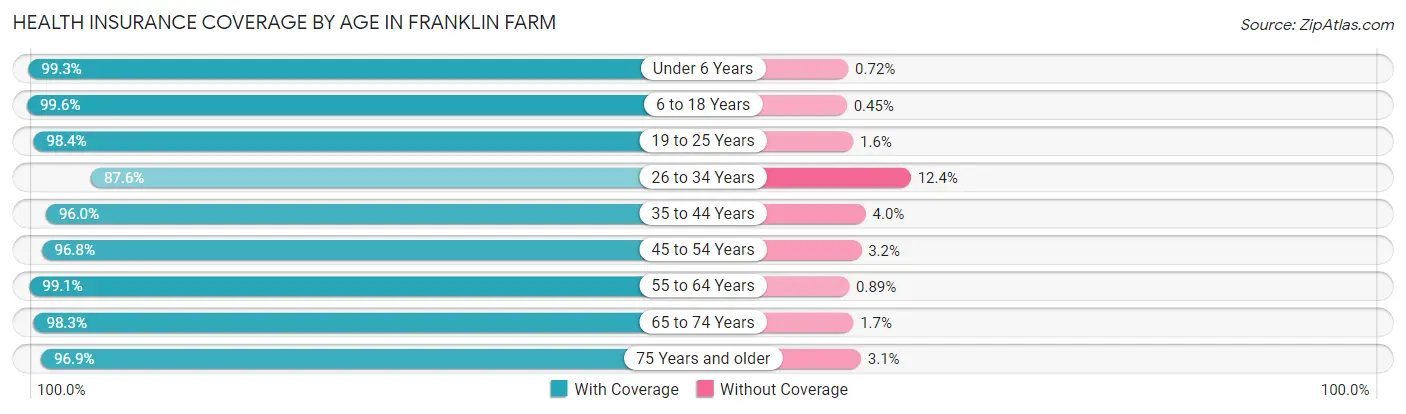
| Age Bracket | With Coverage | Without Coverage |
| Under 6 Years | 969 (99.3%) | 7 (0.7%) |
| 6 to 18 Years | 4,019 (99.6%) | 18 (0.4%) |
| 19 to 25 Years | 1,317 (98.4%) | 22 (1.6%) |
| 26 to 34 Years | 991 (87.6%) | 140 (12.4%) |
| 35 to 44 Years | 2,587 (96.0%) | 107 (4.0%) |
| 45 to 54 Years | 2,971 (96.8%) | 97 (3.2%) |
| 55 to 64 Years | 2,994 (99.1%) | 27 (0.9%) |
| 65 to 74 Years | 1,705 (98.3%) | 29 (1.7%) |
| 75 Years and older | 846 (96.9%) | 27 (3.1%) |
| Total | 18,399 (97.5%) | 474 (2.5%) |
Health Insurance Coverage by Citizenship Status in Franklin Farm
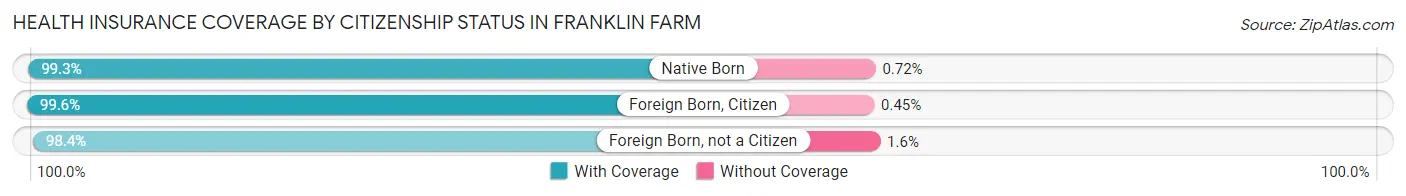
| Citizenship Status | With Coverage | Without Coverage |
| Native Born | 969 (99.3%) | 7 (0.7%) |
| Foreign Born, Citizen | 4,019 (99.6%) | 18 (0.4%) |
| Foreign Born, not a Citizen | 1,317 (98.4%) | 22 (1.6%) |
Health Insurance Coverage by Household Income in Franklin Farm

| Household Income | With Coverage | Without Coverage |
| Under $25,000 | 294 (100.0%) | 0 (0.0%) |
| $25,000 to $49,999 | 323 (97.6%) | 8 (2.4%) |
| $50,000 to $74,999 | 472 (100.0%) | 0 (0.0%) |
| $75,000 to $99,999 | 588 (85.6%) | 99 (14.4%) |
| $100,000 and over | 16,722 (97.9%) | 367 (2.1%) |
Public vs Private Health Insurance Coverage by Age in Franklin Farm
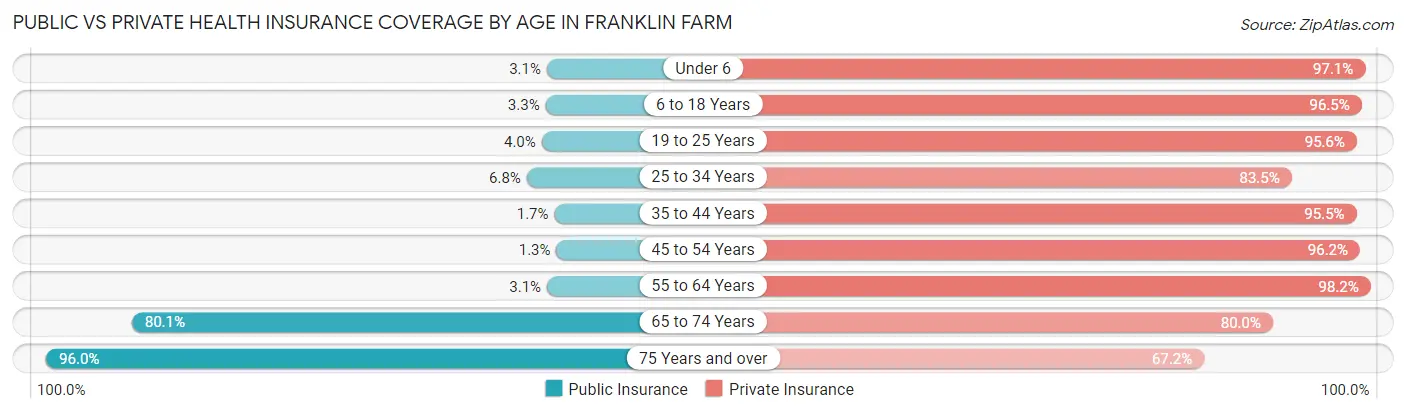
| Age Bracket | Public Insurance | Private Insurance |
| Under 6 | 30 (3.1%) | 948 (97.1%) |
| 6 to 18 Years | 134 (3.3%) | 3,895 (96.5%) |
| 19 to 25 Years | 54 (4.0%) | 1,280 (95.6%) |
| 25 to 34 Years | 77 (6.8%) | 944 (83.5%) |
| 35 to 44 Years | 45 (1.7%) | 2,573 (95.5%) |
| 45 to 54 Years | 40 (1.3%) | 2,950 (96.2%) |
| 55 to 64 Years | 92 (3.0%) | 2,965 (98.2%) |
| 65 to 74 Years | 1,389 (80.1%) | 1,387 (80.0%) |
| 75 Years and over | 838 (96.0%) | 587 (67.2%) |
| Total | 2,699 (14.3%) | 17,529 (92.9%) |
Disability Status by Sex by Age in Franklin Farm
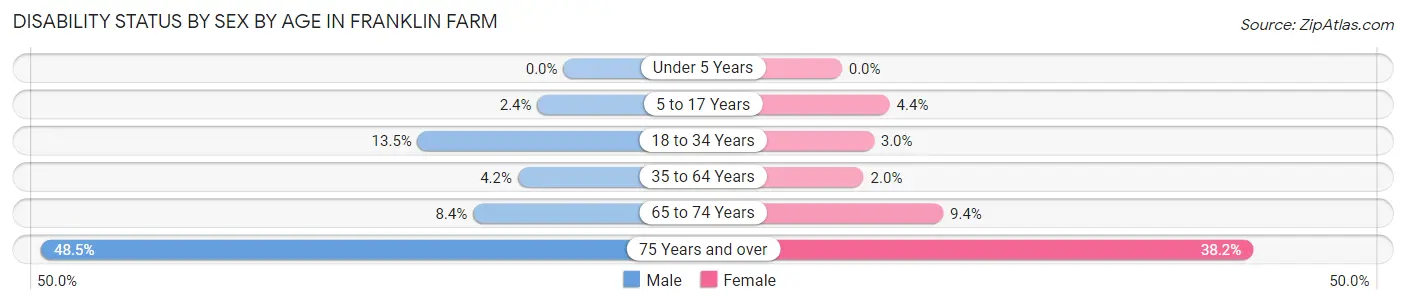
| Age Bracket | Male | Female |
| Under 5 Years | 0 (0.0%) | 0 (0.0%) |
| 5 to 17 Years | 53 (2.4%) | 82 (4.4%) |
| 18 to 34 Years | 195 (13.5%) | 36 (3.0%) |
| 35 to 64 Years | 182 (4.2%) | 91 (2.0%) |
| 65 to 74 Years | 74 (8.4%) | 80 (9.4%) |
| 75 Years and over | 206 (48.5%) | 171 (38.2%) |
Disability Class by Sex by Age in Franklin Farm
Disability Class: Hearing Difficulty
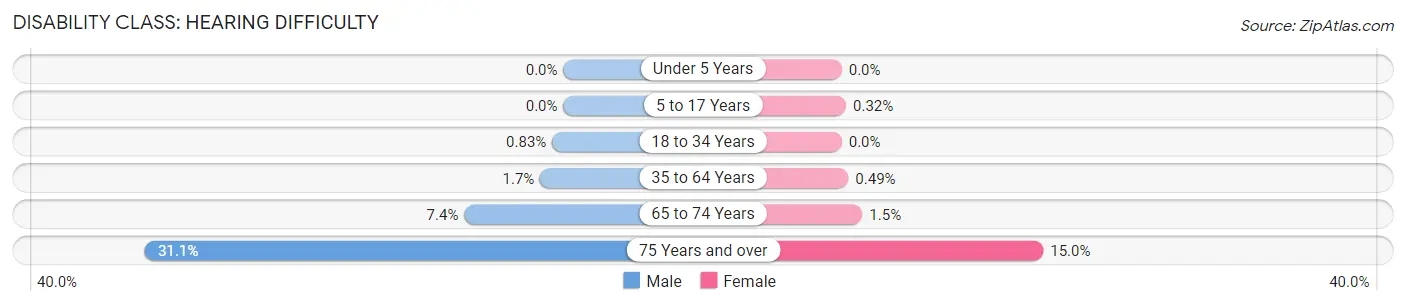
| Age Bracket | Male | Female |
| Under 5 Years | 0 (0.0%) | 0 (0.0%) |
| 5 to 17 Years | 0 (0.0%) | 6 (0.3%) |
| 18 to 34 Years | 12 (0.8%) | 0 (0.0%) |
| 35 to 64 Years | 74 (1.7%) | 22 (0.5%) |
| 65 to 74 Years | 65 (7.4%) | 13 (1.5%) |
| 75 Years and over | 132 (31.1%) | 67 (15.0%) |
Disability Class: Vision Difficulty
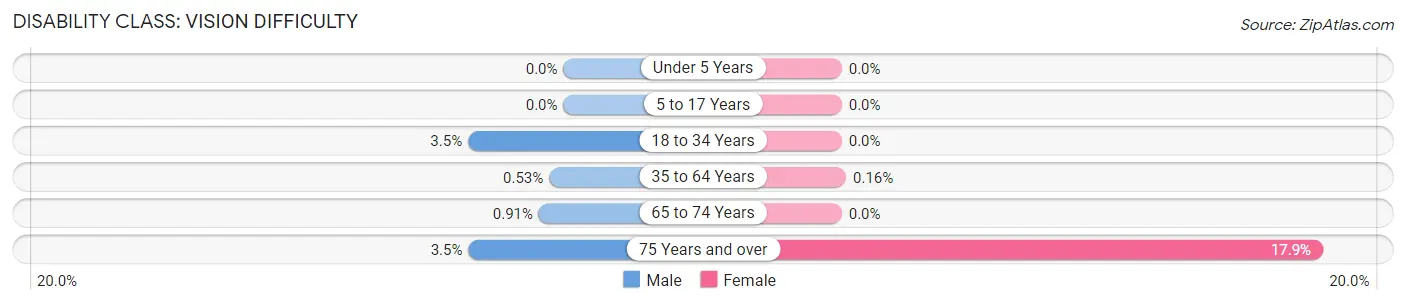
| Age Bracket | Male | Female |
| Under 5 Years | 0 (0.0%) | 0 (0.0%) |
| 5 to 17 Years | 0 (0.0%) | 0 (0.0%) |
| 18 to 34 Years | 51 (3.5%) | 0 (0.0%) |
| 35 to 64 Years | 23 (0.5%) | 7 (0.2%) |
| 65 to 74 Years | 8 (0.9%) | 0 (0.0%) |
| 75 Years and over | 15 (3.5%) | 80 (17.9%) |
Disability Class: Cognitive Difficulty
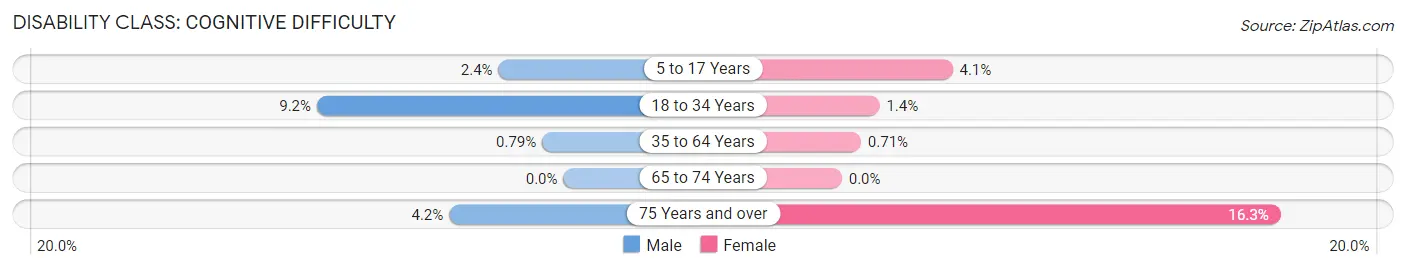
| Age Bracket | Male | Female |
| 5 to 17 Years | 53 (2.4%) | 76 (4.1%) |
| 18 to 34 Years | 132 (9.1%) | 17 (1.4%) |
| 35 to 64 Years | 34 (0.8%) | 32 (0.7%) |
| 65 to 74 Years | 0 (0.0%) | 0 (0.0%) |
| 75 Years and over | 18 (4.2%) | 73 (16.3%) |
Disability Class: Ambulatory Difficulty
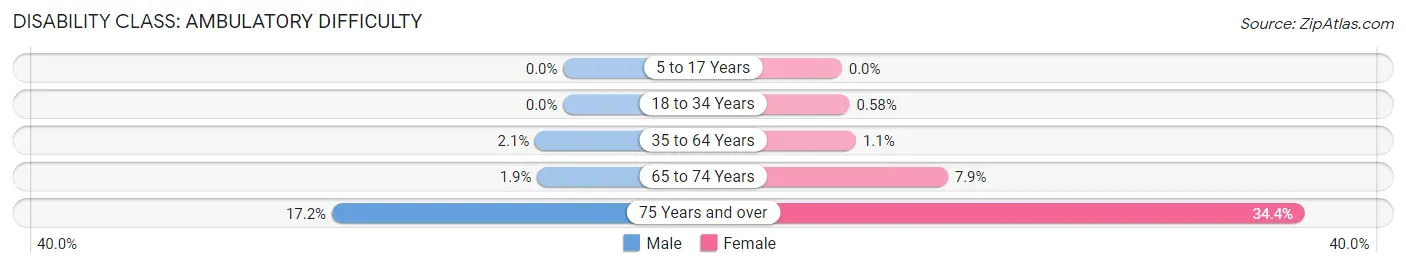
| Age Bracket | Male | Female |
| 5 to 17 Years | 0 (0.0%) | 0 (0.0%) |
| 18 to 34 Years | 0 (0.0%) | 7 (0.6%) |
| 35 to 64 Years | 90 (2.1%) | 47 (1.1%) |
| 65 to 74 Years | 17 (1.9%) | 67 (7.9%) |
| 75 Years and over | 73 (17.2%) | 154 (34.4%) |
Disability Class: Self-Care Difficulty
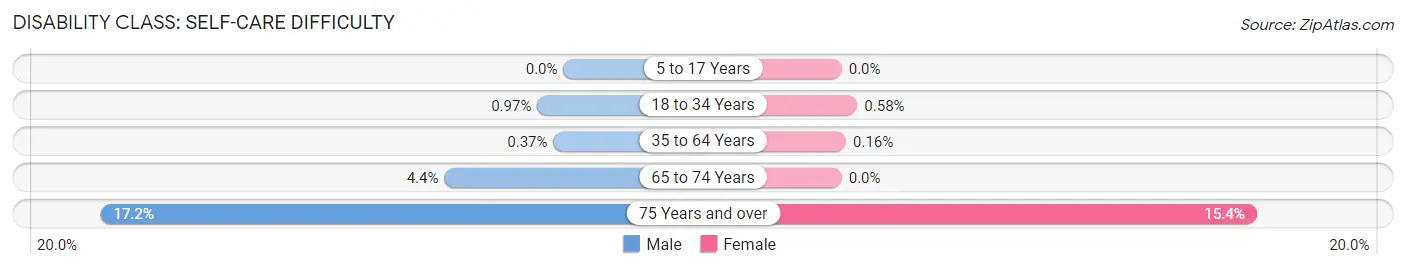
| Age Bracket | Male | Female |
| 5 to 17 Years | 0 (0.0%) | 0 (0.0%) |
| 18 to 34 Years | 14 (1.0%) | 7 (0.6%) |
| 35 to 64 Years | 16 (0.4%) | 7 (0.2%) |
| 65 to 74 Years | 39 (4.4%) | 0 (0.0%) |
| 75 Years and over | 73 (17.2%) | 69 (15.4%) |
Technology Access in Franklin Farm
Computing Device Access in Franklin Farm
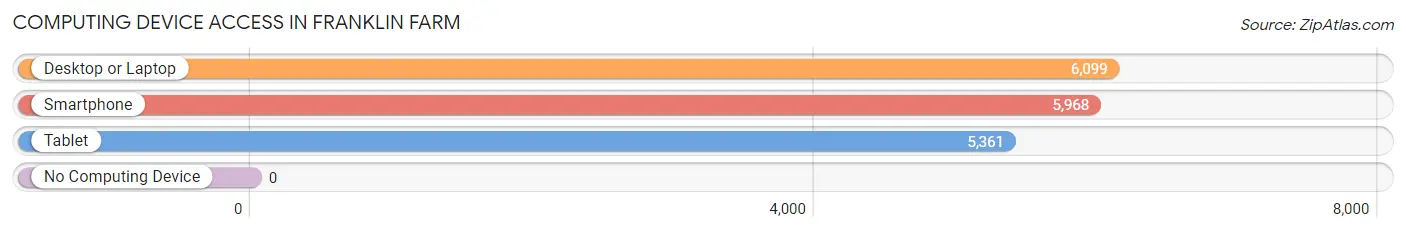
| Device Type | # Households | % Households |
| Desktop or Laptop | 6,099 | 99.4% |
| Smartphone | 5,968 | 97.3% |
| Tablet | 5,361 | 87.4% |
| No Computing Device | 0 | 0.0% |
| Total | 6,137 | 100.0% |
Internet Access in Franklin Farm
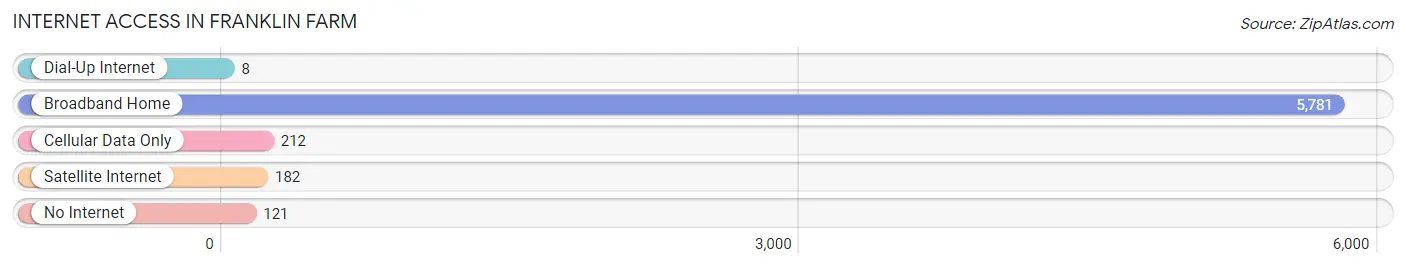
| Internet Type | # Households | % Households |
| Dial-Up Internet | 8 | 0.1% |
| Broadband Home | 5,781 | 94.2% |
| Cellular Data Only | 212 | 3.5% |
| Satellite Internet | 182 | 3.0% |
| No Internet | 121 | 2.0% |
| Total | 6,137 | 100.0% |
Franklin Farm Summary
Franklin Farm is an unincorporated community located in Fairfax County, Virginia. It is situated in the western part of the county, approximately 20 miles west of Washington, D.C. The community is bordered by the towns of Herndon and Reston to the east, and by the cities of Fairfax and Vienna to the south.
History
Franklin Farm was first settled in the late 1700s by a group of Quakers from Pennsylvania. The community was named after Benjamin Franklin, who was a prominent figure in the Quaker movement. The Quakers established a meeting house in the area, which served as a place of worship and a center of community life.
In the early 1800s, the area was home to a number of small farms and businesses. The community was largely agricultural, with many of the residents growing crops such as corn, wheat, and tobacco. In the late 1800s, the area began to experience rapid growth as the Washington, D.C. metropolitan area expanded.
Geography
Franklin Farm is located in the western part of Fairfax County, Virginia. It is situated approximately 20 miles west of Washington, D.C. The community is bordered by the towns of Herndon and Reston to the east, and by the cities of Fairfax and Vienna to the south.
The area is characterized by rolling hills and wooded areas. The terrain is generally flat, with some areas of higher elevation. The climate is temperate, with hot summers and cold winters.
Economy
Franklin Farm is primarily a residential community, with most of the residents employed in the nearby cities of Fairfax and Vienna. The area is home to a number of small businesses, including restaurants, retail stores, and professional services.
The community is also home to a number of corporate offices, including those of the defense contractor Northrop Grumman and the software company Oracle. The area is served by the Washington Dulles International Airport, which is located approximately 15 miles to the east.
Demographics
As of the 2010 census, the population of Franklin Farm was 8,945. The racial makeup of the community was 79.3% White, 11.2% Asian, 5.2% African American, and 4.3% Hispanic or Latino. The median household income was $117,945, and the median home value was $541,000.
The majority of the population is employed in professional and managerial occupations. The area is home to a number of highly educated residents, with nearly 70% of the population having a bachelor’s degree or higher.
Conclusion
Franklin Farm is an unincorporated community located in Fairfax County, Virginia. It is situated in the western part of the county, approximately 20 miles west of Washington, D.C. The community is bordered by the towns of Herndon and Reston to the east, and by the cities of Fairfax and Vienna to the south. The area is characterized by rolling hills and wooded areas, and is primarily a residential community. The population of Franklin Farm is 8,945, and the median household income is $117,945. The majority of the population is employed in professional and managerial occupations, and the area is home to a number of corporate offices.
Common Questions
What is Per Capita Income in Franklin Farm?
Per Capita income in Franklin Farm is $82,446.
What is the Median Family Income in Franklin Farm?
Median Family Income in Franklin Farm is $221,381.
What is the Median Household income in Franklin Farm?
Median Household Income in Franklin Farm is $209,442.
What is Income or Wage Gap in Franklin Farm?
Income or Wage Gap in Franklin Farm is 44.2%.
Women in Franklin Farm earn 55.8 cents for every dollar earned by a man.
What is Inequality or Gini Index in Franklin Farm?
Inequality or Gini Index in Franklin Farm is 0.36.
What is the Total Population of Franklin Farm?
Total Population of Franklin Farm is 18,903.
What is the Total Male Population of Franklin Farm?
Total Male Population of Franklin Farm is 9,776.
What is the Total Female Population of Franklin Farm?
Total Female Population of Franklin Farm is 9,127.
What is the Ratio of Males per 100 Females in Franklin Farm?
There are 107.11 Males per 100 Females in Franklin Farm.
What is the Ratio of Females per 100 Males in Franklin Farm?
There are 93.36 Females per 100 Males in Franklin Farm.
What is the Median Population Age in Franklin Farm?
Median Population Age in Franklin Farm is 42.3 Years.
What is the Average Family Size in Franklin Farm
Average Family Size in Franklin Farm is 3.3 People.
What is the Average Household Size in Franklin Farm
Average Household Size in Franklin Farm is 3.1 People.
How Large is the Labor Force in Franklin Farm?
There are 10,636 People in the Labor Forcein in Franklin Farm.
What is the Percentage of People in the Labor Force in Franklin Farm?
72.8% of People are in the Labor Force in Franklin Farm.
What is the Unemployment Rate in Franklin Farm?
Unemployment Rate in Franklin Farm is 2.5%.