Mantua, VA Map & Demographics
Mantua Map
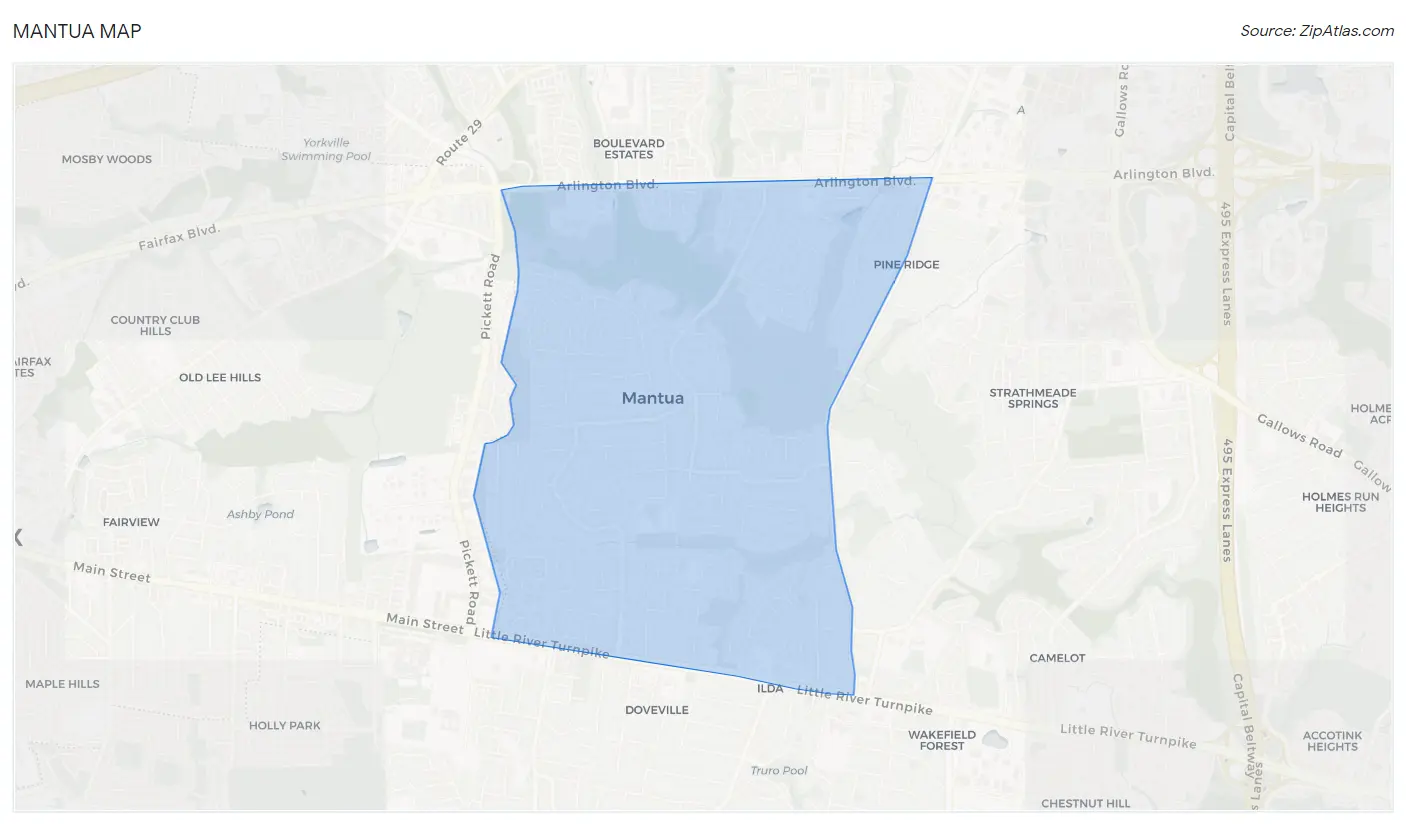
Mantua Overview
$79,318
PER CAPITA INCOME
$233,145
AVG FAMILY INCOME
$196,726
AVG HOUSEHOLD INCOME
47.3%
WAGE / INCOME GAP [ % ]
52.7¢/ $1
WAGE / INCOME GAP [ $ ]
0.37
INEQUALITY / GINI INDEX
7,531
TOTAL POPULATION
3,756
MALE POPULATION
3,775
FEMALE POPULATION
99.50
MALES / 100 FEMALES
100.51
FEMALES / 100 MALES
40.3
MEDIAN AGE
3.2
AVG FAMILY SIZE
2.9
AVG HOUSEHOLD SIZE
3,945
LABOR FORCE [ PEOPLE ]
68.8%
PERCENT IN LABOR FORCE
4.7%
UNEMPLOYMENT RATE
Income in Mantua
Income Overview in Mantua
Per Capita Income in Mantua is $79,318, while median incomes of families and households are $233,145 and $196,726 respectively.
| Characteristic | Number | Measure |
| Per Capita Income | 7,531 | $79,318 |
| Median Family Income | 2,048 | $233,145 |
| Mean Family Income | 2,048 | $248,711 |
| Median Household Income | 2,591 | $196,726 |
| Mean Household Income | 2,591 | $224,035 |
| Income Deficit | 2,048 | $0 |
| Wage / Income Gap (%) | 7,531 | 47.33% |
| Wage / Income Gap ($) | 7,531 | 52.67¢ per $1 |
| Gini / Inequality Index | 7,531 | 0.37 |
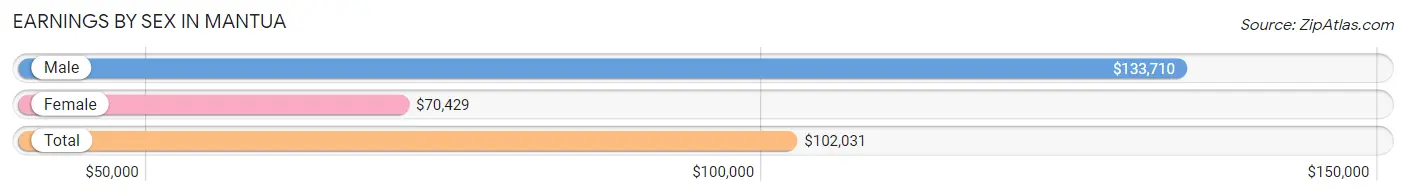
Earnings by Sex in Mantua
Average Earnings in Mantua are $102,031, $133,710 for men and $70,429 for women, a difference of 47.3%.
| Sex | Number | Average Earnings |
| Male | 2,489 (57.5%) | $133,710 |
| Female | 1,842 (42.5%) | $70,429 |
| Total | 4,331 (100.0%) | $102,031 |
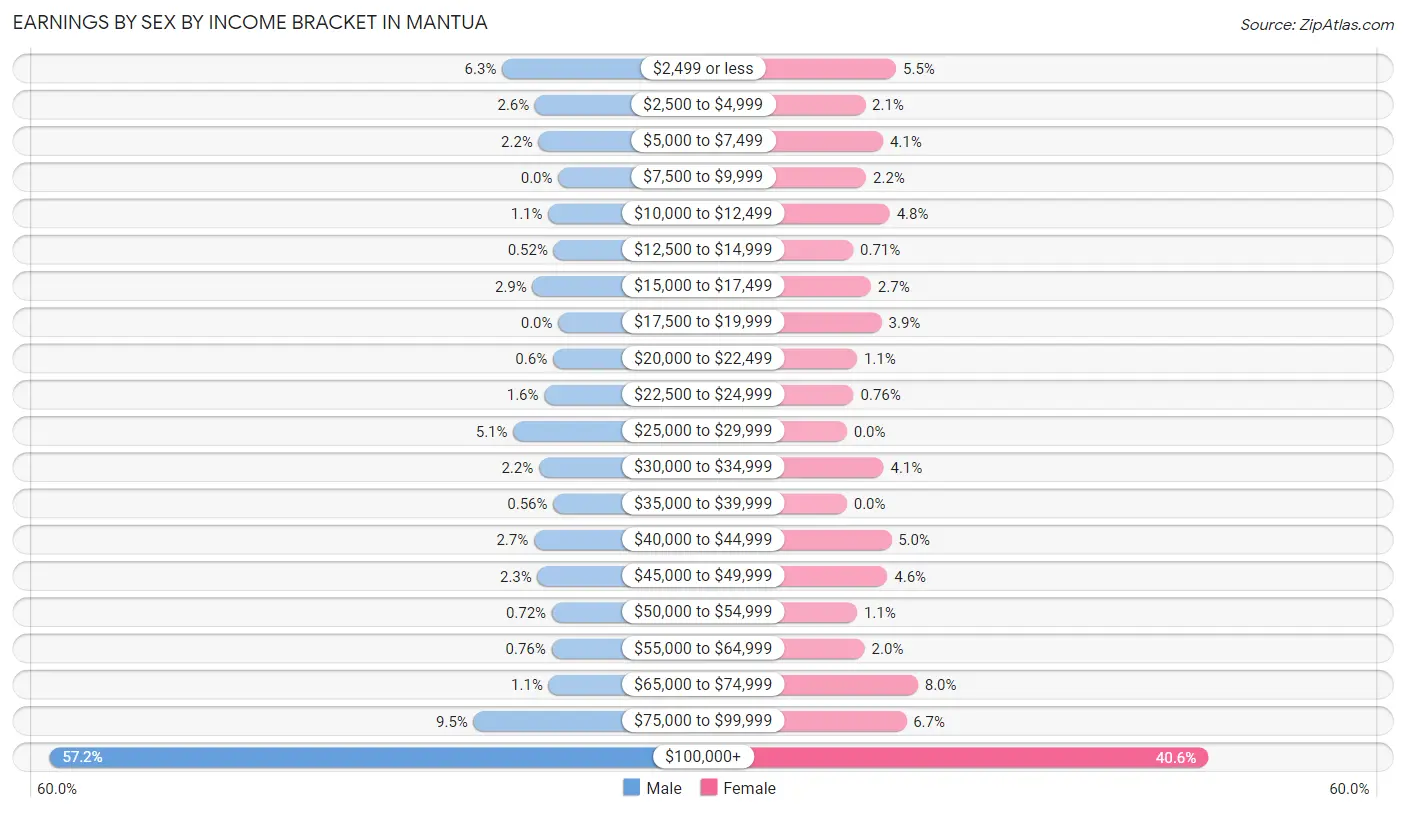
Earnings by Sex by Income Bracket in Mantua
The most common earnings brackets in Mantua are $100,000+ for men (1,424 | 57.2%) and $100,000+ for women (748 | 40.6%).
| Income | Male | Female |
| $2,499 or less | 157 (6.3%) | 102 (5.5%) |
| $2,500 to $4,999 | 65 (2.6%) | 38 (2.1%) |
| $5,000 to $7,499 | 55 (2.2%) | 75 (4.1%) |
| $7,500 to $9,999 | 0 (0.0%) | 40 (2.2%) |
| $10,000 to $12,499 | 28 (1.1%) | 89 (4.8%) |
| $12,500 to $14,999 | 13 (0.5%) | 13 (0.7%) |
| $15,000 to $17,499 | 72 (2.9%) | 50 (2.7%) |
| $17,500 to $19,999 | 0 (0.0%) | 72 (3.9%) |
| $20,000 to $22,499 | 15 (0.6%) | 21 (1.1%) |
| $22,500 to $24,999 | 39 (1.6%) | 14 (0.8%) |
| $25,000 to $29,999 | 126 (5.1%) | 0 (0.0%) |
| $30,000 to $34,999 | 54 (2.2%) | 76 (4.1%) |
| $35,000 to $39,999 | 14 (0.6%) | 0 (0.0%) |
| $40,000 to $44,999 | 68 (2.7%) | 92 (5.0%) |
| $45,000 to $49,999 | 58 (2.3%) | 84 (4.6%) |
| $50,000 to $54,999 | 18 (0.7%) | 21 (1.1%) |
| $55,000 to $64,999 | 19 (0.8%) | 37 (2.0%) |
| $65,000 to $74,999 | 27 (1.1%) | 147 (8.0%) |
| $75,000 to $99,999 | 237 (9.5%) | 123 (6.7%) |
| $100,000+ | 1,424 (57.2%) | 748 (40.6%) |
| Total | 2,489 (100.0%) | 1,842 (100.0%) |
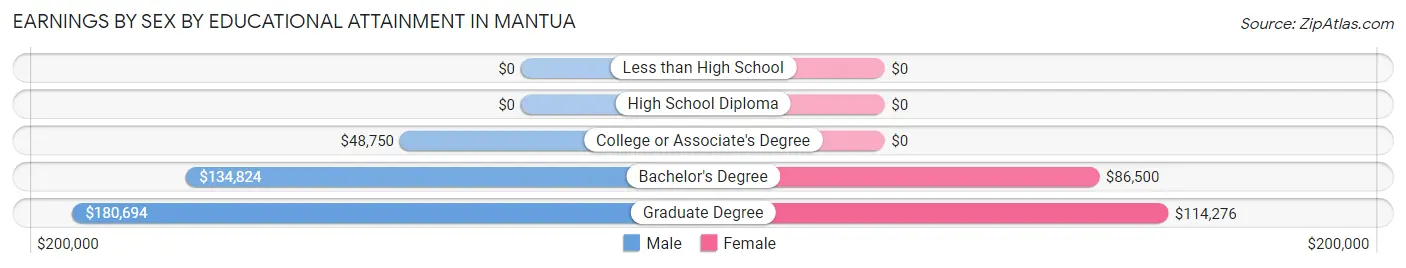
Earnings by Sex by Educational Attainment in Mantua
Average earnings in Mantua are $155,441 for men and $85,125 for women, a difference of 45.2%. Men with an educational attainment of graduate degree enjoy the highest average annual earnings of $180,694, while those with college or associate's degree education earn the least with $48,750. Women with an educational attainment of graduate degree earn the most with the average annual earnings of $114,276, while those with bachelor's degree education have the smallest earnings of $86,500.
| Educational Attainment | Male Income | Female Income |
| Less than High School | - | - |
| High School Diploma | - | - |
| College or Associate's Degree | $48,750 | $0 |
| Bachelor's Degree | $134,824 | $86,500 |
| Graduate Degree | $180,694 | $114,276 |
| Total | $155,441 | $85,125 |
Family Income in Mantua
Family Income Brackets in Mantua
According to the Mantua family income data, there are 1,161 families falling into the $200,000+ income range, which is the most common income bracket and makes up 56.7% of all families.
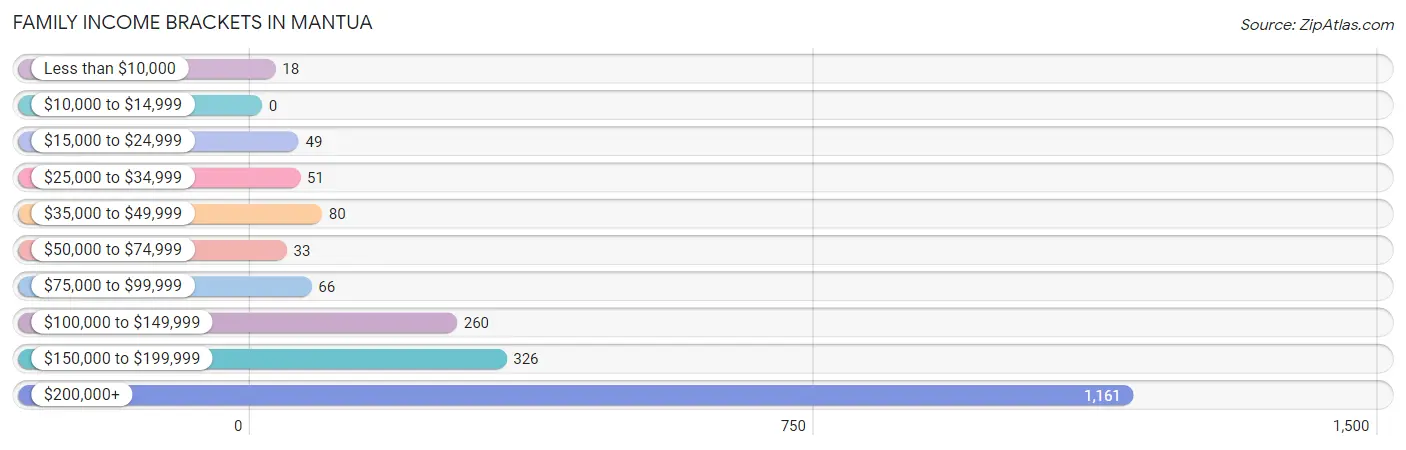
| Income Bracket | # Families | % Families |
| Less than $10,000 | 18 | 0.9% |
| $10,000 to $14,999 | 0 | 0.0% |
| $15,000 to $24,999 | 49 | 2.4% |
| $25,000 to $34,999 | 51 | 2.5% |
| $35,000 to $49,999 | 80 | 3.9% |
| $50,000 to $74,999 | 33 | 1.6% |
| $75,000 to $99,999 | 66 | 3.2% |
| $100,000 to $149,999 | 260 | 12.7% |
| $150,000 to $199,999 | 326 | 15.9% |
| $200,000+ | 1,161 | 56.7% |
Family Income by Famaliy Size in Mantua
4-person families (677 | 33.1%) account for the highest median family income in Mantua with $250,001 per family, while 2-person families (842 | 41.1%) have the highest median income of $90,966 per family member.
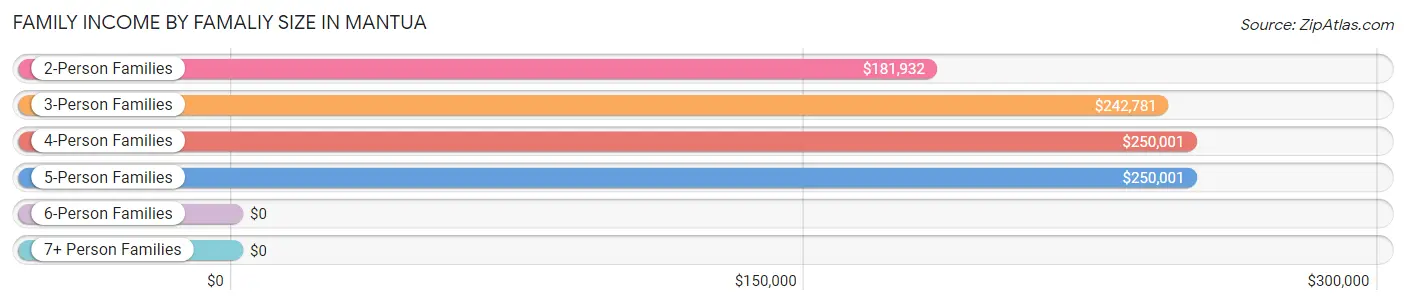
| Income Bracket | # Families | Median Income |
| 2-Person Families | 842 (41.1%) | $181,932 |
| 3-Person Families | 399 (19.5%) | $242,781 |
| 4-Person Families | 677 (33.1%) | $250,001 |
| 5-Person Families | 102 (5.0%) | $250,001 |
| 6-Person Families | 18 (0.9%) | $0 |
| 7+ Person Families | 10 (0.5%) | $0 |
| Total | 2,048 (100.0%) | $233,145 |
Family Income by Number of Earners in Mantua
The median family income in Mantua is $233,145, with families comprising 2 earners (1,076) having the highest median family income of $250,001, while families with no earners (206) have the lowest median family income of $148,750, accounting for 52.5% and 10.1% of families, respectively.
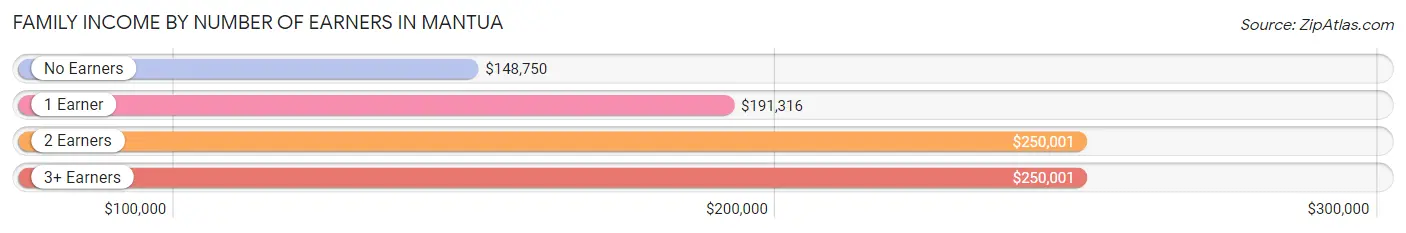
| Number of Earners | # Families | Median Income |
| No Earners | 206 (10.1%) | $148,750 |
| 1 Earner | 527 (25.7%) | $191,316 |
| 2 Earners | 1,076 (52.5%) | $250,001 |
| 3+ Earners | 239 (11.7%) | $250,001 |
| Total | 2,048 (100.0%) | $233,145 |
Household Income in Mantua
Household Income Brackets in Mantua
With 1,288 households falling in the category, the $200,000+ income range is the most frequent in Mantua, accounting for 49.7% of all households. In contrast, only 21 households (0.8%) fall into the $10,000 to $14,999 income bracket, making it the least populous group.
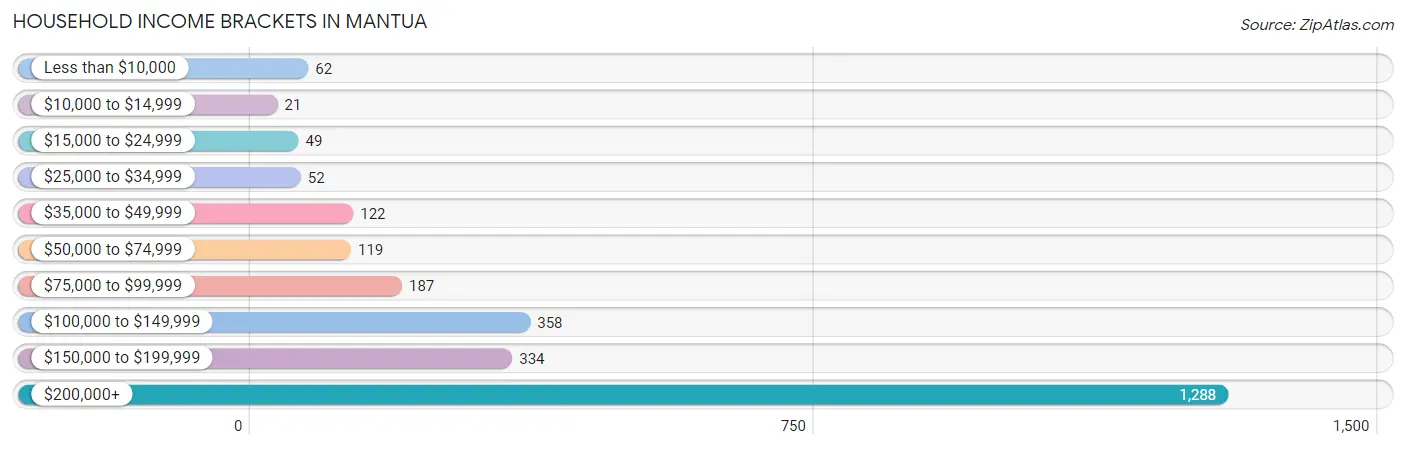
| Income Bracket | # Households | % Households |
| Less than $10,000 | 62 | 2.4% |
| $10,000 to $14,999 | 21 | 0.8% |
| $15,000 to $24,999 | 49 | 1.9% |
| $25,000 to $34,999 | 52 | 2.0% |
| $35,000 to $49,999 | 122 | 4.7% |
| $50,000 to $74,999 | 119 | 4.6% |
| $75,000 to $99,999 | 187 | 7.2% |
| $100,000 to $149,999 | 358 | 13.8% |
| $150,000 to $199,999 | 334 | 12.9% |
| $200,000+ | 1,288 | 49.7% |
Household Income by Householder Age in Mantua
The median household income in Mantua is $196,726, with the highest median household income of $250,001 found in the 45 to 64 years age bracket for the primary householder. A total of 1,148 households (44.3%) fall into this category. Meanwhile, the 15 to 24 years age bracket for the primary householder has the lowest median household income of $0, with 72 households (2.8%) in this group.
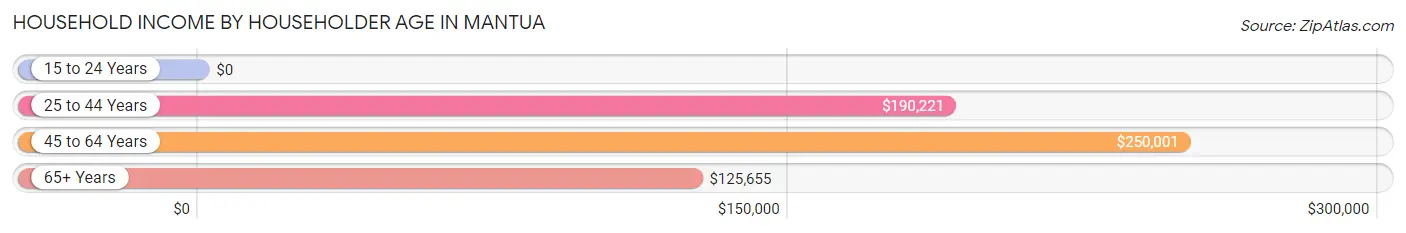
| Income Bracket | # Households | Median Income |
| 15 to 24 Years | 72 (2.8%) | $0 |
| 25 to 44 Years | 732 (28.2%) | $190,221 |
| 45 to 64 Years | 1,148 (44.3%) | $250,001 |
| 65+ Years | 639 (24.7%) | $125,655 |
| Total | 2,591 (100.0%) | $196,726 |
Poverty in Mantua
Income Below Poverty by Sex and Age in Mantua
With 1.5% poverty level for males and 4.3% for females among the residents of Mantua, 18 to 24 year old males and 18 to 24 year old females are the most vulnerable to poverty, with 51 males (12.2%) and 66 females (29.7%) in their respective age groups living below the poverty level.
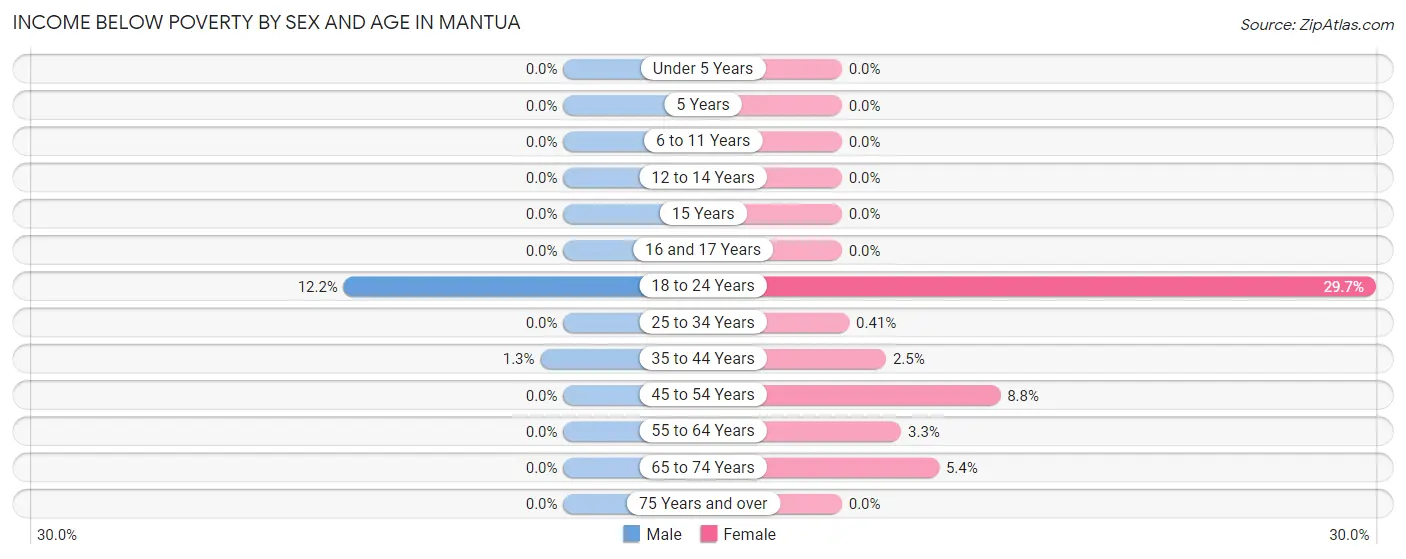
| Age Bracket | Male | Female |
| Under 5 Years | 0 (0.0%) | 0 (0.0%) |
| 5 Years | 0 (0.0%) | 0 (0.0%) |
| 6 to 11 Years | 0 (0.0%) | 0 (0.0%) |
| 12 to 14 Years | 0 (0.0%) | 0 (0.0%) |
| 15 Years | 0 (0.0%) | 0 (0.0%) |
| 16 and 17 Years | 0 (0.0%) | 0 (0.0%) |
| 18 to 24 Years | 51 (12.2%) | 66 (29.7%) |
| 25 to 34 Years | 0 (0.0%) | 1 (0.4%) |
| 35 to 44 Years | 6 (1.3%) | 14 (2.5%) |
| 45 to 54 Years | 0 (0.0%) | 45 (8.8%) |
| 55 to 64 Years | 0 (0.0%) | 19 (3.3%) |
| 65 to 74 Years | 0 (0.0%) | 18 (5.4%) |
| 75 Years and over | 0 (0.0%) | 0 (0.0%) |
| Total | 57 (1.5%) | 163 (4.3%) |
Income Above Poverty by Sex and Age in Mantua
According to the poverty statistics in Mantua, males aged under 5 years and females aged under 5 years are the age groups that are most secure financially, with 100.0% of males and 100.0% of females in these age groups living above the poverty line.
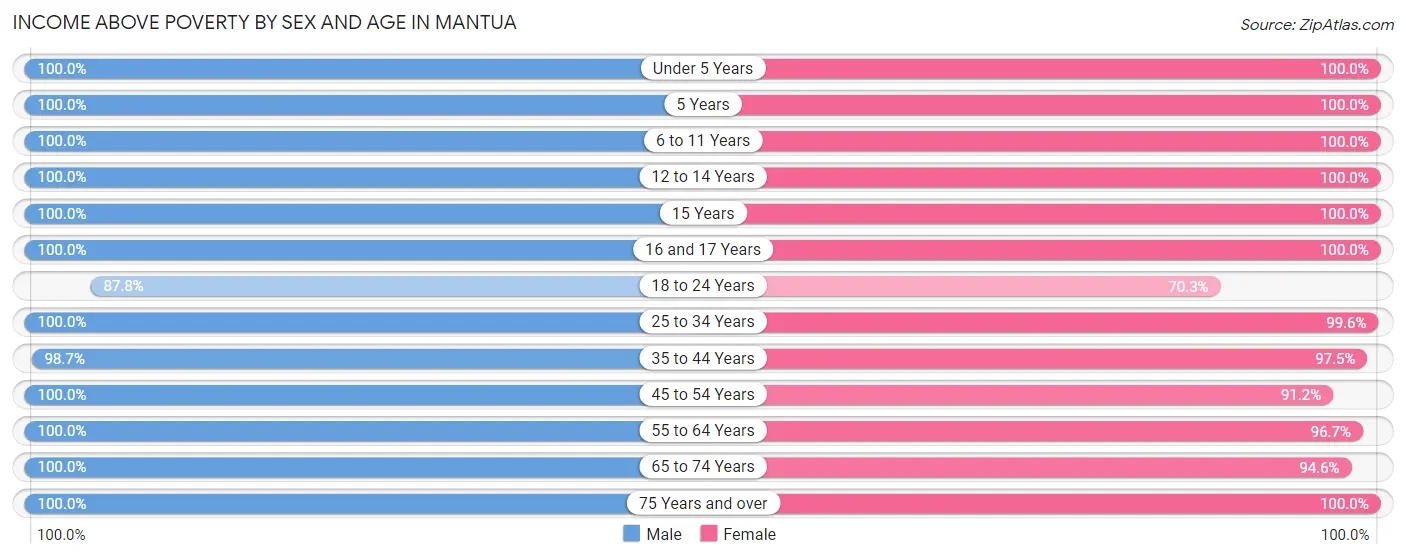
| Age Bracket | Male | Female |
| Under 5 Years | 200 (100.0%) | 284 (100.0%) |
| 5 Years | 51 (100.0%) | 156 (100.0%) |
| 6 to 11 Years | 340 (100.0%) | 235 (100.0%) |
| 12 to 14 Years | 116 (100.0%) | 237 (100.0%) |
| 15 Years | 87 (100.0%) | 91 (100.0%) |
| 16 and 17 Years | 55 (100.0%) | 104 (100.0%) |
| 18 to 24 Years | 366 (87.8%) | 156 (70.3%) |
| 25 to 34 Years | 264 (100.0%) | 240 (99.6%) |
| 35 to 44 Years | 462 (98.7%) | 554 (97.5%) |
| 45 to 54 Years | 627 (100.0%) | 465 (91.2%) |
| 55 to 64 Years | 590 (100.0%) | 557 (96.7%) |
| 65 to 74 Years | 269 (100.0%) | 315 (94.6%) |
| 75 Years and over | 241 (100.0%) | 201 (100.0%) |
| Total | 3,668 (98.5%) | 3,595 (95.7%) |
Income Below Poverty Among Married-Couple Families in Mantua
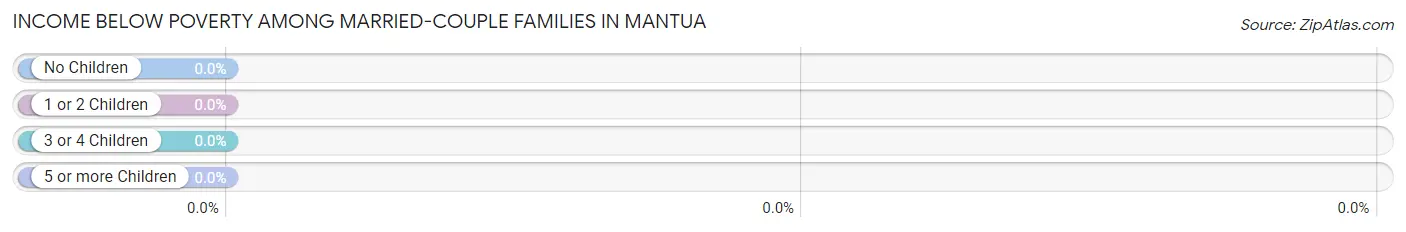
| Children | Above Poverty | Below Poverty |
| No Children | 812 (100.0%) | 0 (0.0%) |
| 1 or 2 Children | 782 (100.0%) | 0 (0.0%) |
| 3 or 4 Children | 99 (100.0%) | 0 (0.0%) |
| 5 or more Children | 10 (100.0%) | 0 (0.0%) |
| Total | 1,703 (100.0%) | 0 (0.0%) |
Income Below Poverty Among Single-Parent Households in Mantua
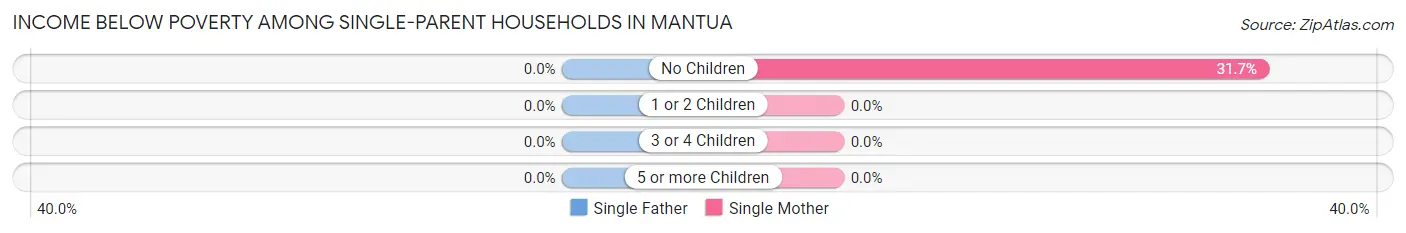
| Children | Single Father | Single Mother |
| No Children | 0 (0.0%) | 19 (31.7%) |
| 1 or 2 Children | 0 (0.0%) | 0 (0.0%) |
| 3 or 4 Children | 0 (0.0%) | 0 (0.0%) |
| 5 or more Children | 0 (0.0%) | 0 (0.0%) |
| Total | 0 (0.0%) | 19 (10.6%) |
Income Below Poverty Among Married-Couple vs Single-Parent Households in Mantua
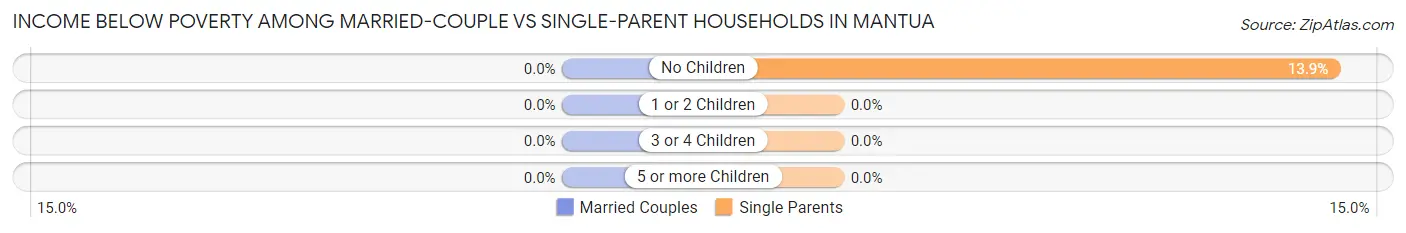
| Children | Married-Couple Families | Single-Parent Households |
| No Children | 0 (0.0%) | 19 (13.9%) |
| 1 or 2 Children | 0 (0.0%) | 0 (0.0%) |
| 3 or 4 Children | 0 (0.0%) | 0 (0.0%) |
| 5 or more Children | 0 (0.0%) | 0 (0.0%) |
| Total | 0 (0.0%) | 19 (5.5%) |
Race in Mantua
The most populous races in Mantua are White / Caucasian (5,661 | 75.2%), Asian (1,215 | 16.1%), and Hispanic or Latino (717 | 9.5%).
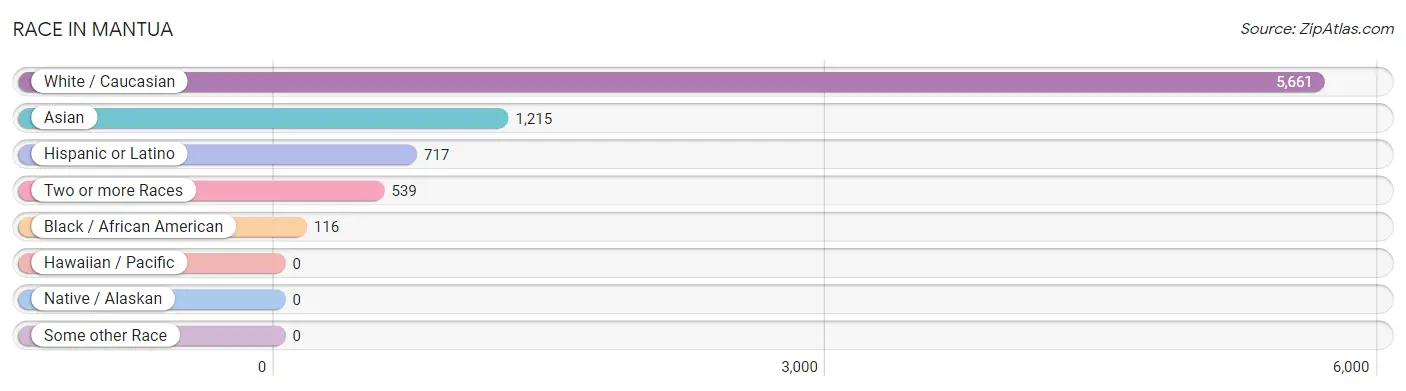
| Race | # Population | % Population |
| Asian | 1,215 | 16.1% |
| Black / African American | 116 | 1.5% |
| Hawaiian / Pacific | 0 | 0.0% |
| Hispanic or Latino | 717 | 9.5% |
| Native / Alaskan | 0 | 0.0% |
| White / Caucasian | 5,661 | 75.2% |
| Two or more Races | 539 | 7.2% |
| Some other Race | 0 | 0.0% |
| Total | 7,531 | 100.0% |
Ancestry in Mantua
The most populous ancestries reported in Mantua are German (1,077 | 14.3%), Irish (1,025 | 13.6%), English (938 | 12.5%), Italian (516 | 6.9%), and South American (488 | 6.5%), together accounting for 53.7% of all Mantua residents.
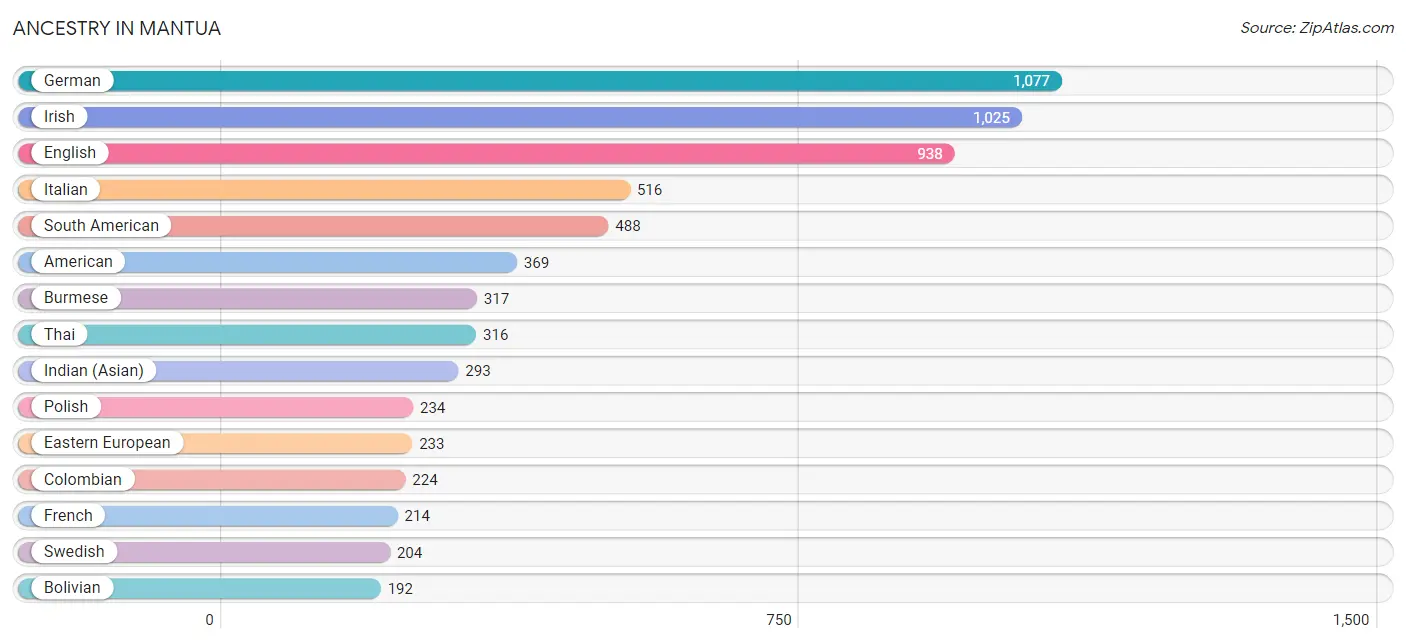
| Ancestry | # Population | % Population |
| African | 35 | 0.5% |
| American | 369 | 4.9% |
| Arab | 111 | 1.5% |
| Argentinean | 51 | 0.7% |
| Bhutanese | 31 | 0.4% |
| Bolivian | 192 | 2.5% |
| British | 53 | 0.7% |
| Burmese | 317 | 4.2% |
| Cambodian | 91 | 1.2% |
| Canadian | 40 | 0.5% |
| Central American | 56 | 0.7% |
| Colombian | 224 | 3.0% |
| Dutch | 50 | 0.7% |
| Eastern European | 233 | 3.1% |
| English | 938 | 12.5% |
| European | 144 | 1.9% |
| Finnish | 20 | 0.3% |
| French | 214 | 2.8% |
| German | 1,077 | 14.3% |
| Greek | 12 | 0.2% |
| Guatemalan | 56 | 0.7% |
| Hungarian | 57 | 0.8% |
| Indian (Asian) | 293 | 3.9% |
| Indonesian | 66 | 0.9% |
| Irish | 1,025 | 13.6% |
| Israeli | 80 | 1.1% |
| Italian | 516 | 6.9% |
| Jordanian | 18 | 0.2% |
| Lebanese | 16 | 0.2% |
| Northern European | 53 | 0.7% |
| Norwegian | 91 | 1.2% |
| Palestinian | 21 | 0.3% |
| Peruvian | 21 | 0.3% |
| Polish | 234 | 3.1% |
| Puerto Rican | 114 | 1.5% |
| Romanian | 33 | 0.4% |
| Russian | 160 | 2.1% |
| Scotch-Irish | 113 | 1.5% |
| Scottish | 145 | 1.9% |
| Slovak | 9 | 0.1% |
| Slovene | 19 | 0.3% |
| South American | 488 | 6.5% |
| Spaniard | 22 | 0.3% |
| Spanish | 29 | 0.4% |
| Sri Lankan | 142 | 1.9% |
| Subsaharan African | 35 | 0.5% |
| Swedish | 204 | 2.7% |
| Swiss | 12 | 0.2% |
| Syrian | 29 | 0.4% |
| Thai | 316 | 4.2% |
| Tlingit-Haida | 17 | 0.2% |
| Turkish | 19 | 0.3% |
| Ukrainian | 84 | 1.1% |
| Welsh | 118 | 1.6% | View All 54 Rows |
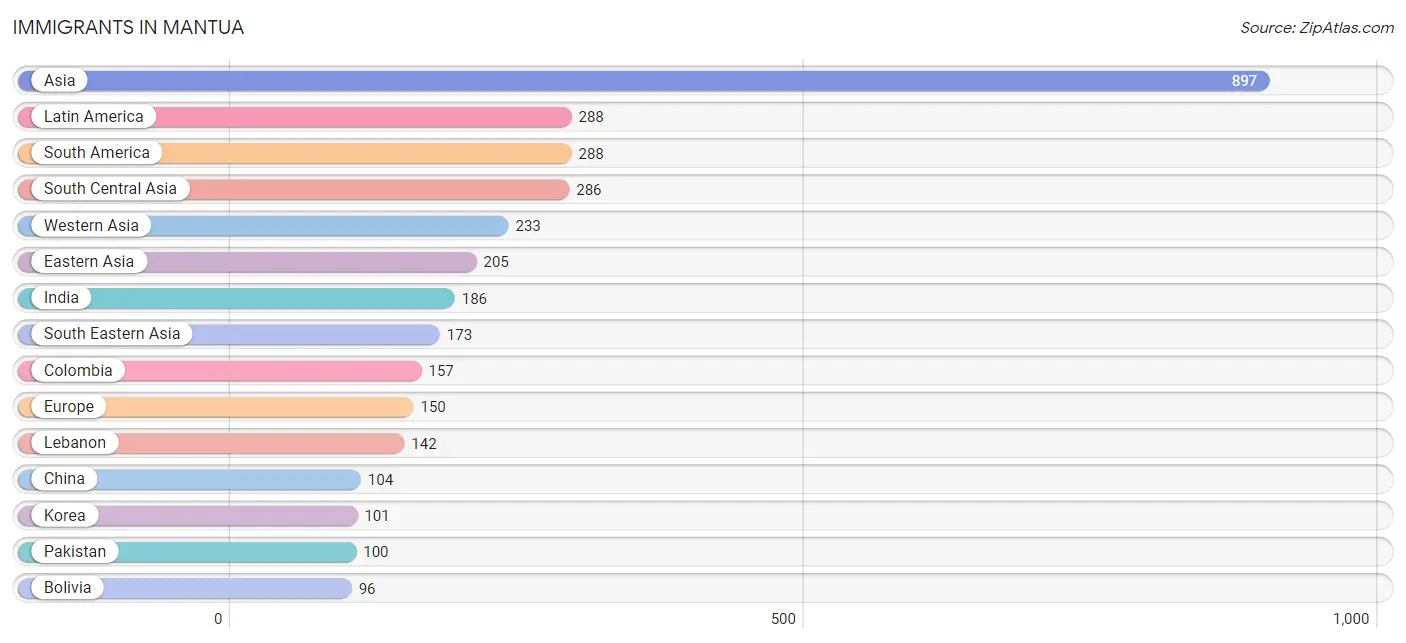
Immigrants in Mantua
The most numerous immigrant groups reported in Mantua came from Asia (897 | 11.9%), Latin America (288 | 3.8%), South America (288 | 3.8%), South Central Asia (286 | 3.8%), and Western Asia (233 | 3.1%), together accounting for 26.4% of all Mantua residents.
| Immigration Origin | # Population | % Population |
| Africa | 71 | 0.9% |
| Argentina | 14 | 0.2% |
| Asia | 897 | 11.9% |
| Australia | 19 | 0.3% |
| Bolivia | 96 | 1.3% |
| Canada | 11 | 0.2% |
| China | 104 | 1.4% |
| Colombia | 157 | 2.1% |
| Eastern Africa | 28 | 0.4% |
| Eastern Asia | 205 | 2.7% |
| Eastern Europe | 38 | 0.5% |
| Egypt | 16 | 0.2% |
| Ethiopia | 28 | 0.4% |
| Europe | 150 | 2.0% |
| India | 186 | 2.5% |
| Israel | 72 | 1.0% |
| Korea | 101 | 1.3% |
| Latin America | 288 | 3.8% |
| Lebanon | 142 | 1.9% |
| Morocco | 27 | 0.4% |
| Netherlands | 49 | 0.6% |
| Northern Africa | 43 | 0.6% |
| Northern Europe | 63 | 0.8% |
| Oceania | 19 | 0.3% |
| Pakistan | 100 | 1.3% |
| Peru | 21 | 0.3% |
| Russia | 38 | 0.5% |
| Singapore | 28 | 0.4% |
| South America | 288 | 3.8% |
| South Central Asia | 286 | 3.8% |
| South Eastern Asia | 173 | 2.3% |
| Sweden | 49 | 0.6% |
| Turkey | 19 | 0.3% |
| Vietnam | 79 | 1.1% |
| Western Asia | 233 | 3.1% |
| Western Europe | 49 | 0.6% | View All 36 Rows |
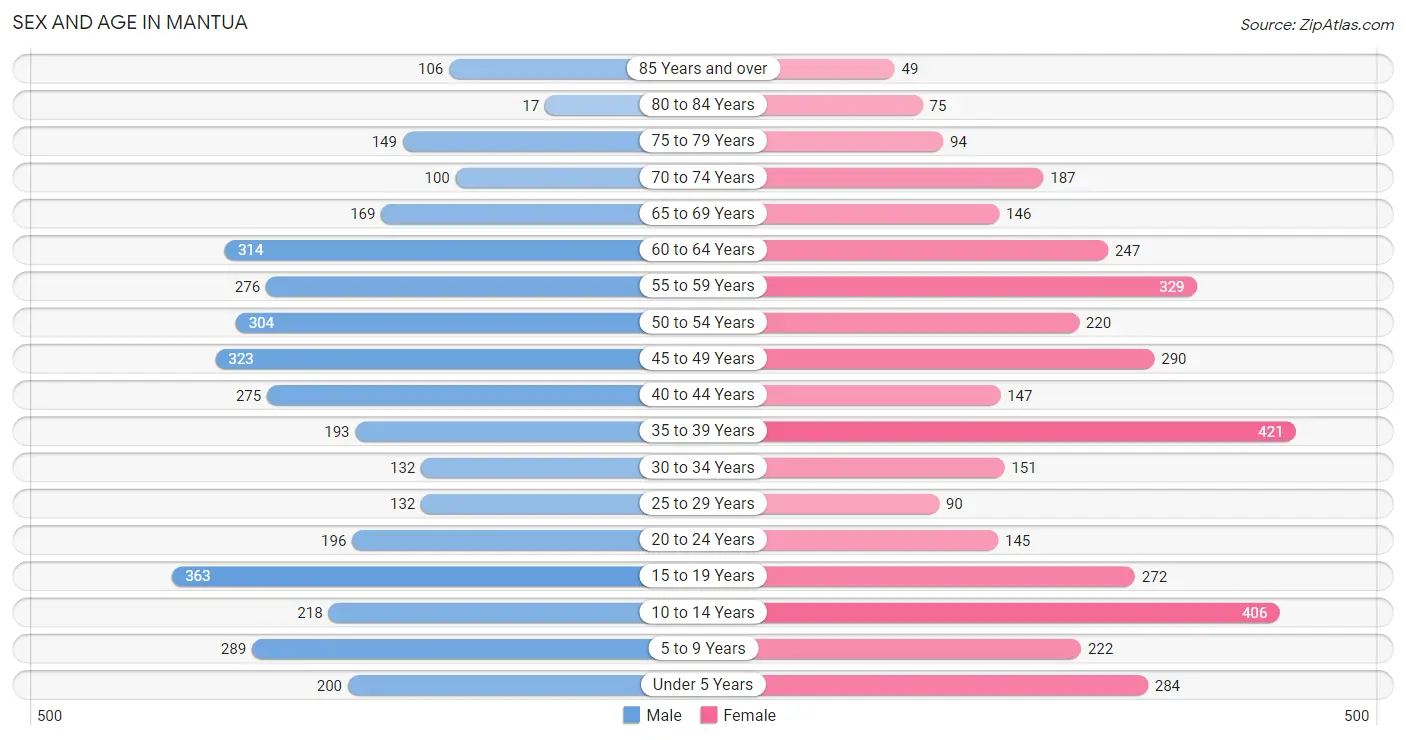
Sex and Age in Mantua
Sex and Age in Mantua
The most populous age groups in Mantua are 15 to 19 Years (363 | 9.7%) for men and 35 to 39 Years (421 | 11.2%) for women.
| Age Bracket | Male | Female |
| Under 5 Years | 200 (5.3%) | 284 (7.5%) |
| 5 to 9 Years | 289 (7.7%) | 222 (5.9%) |
| 10 to 14 Years | 218 (5.8%) | 406 (10.7%) |
| 15 to 19 Years | 363 (9.7%) | 272 (7.2%) |
| 20 to 24 Years | 196 (5.2%) | 145 (3.8%) |
| 25 to 29 Years | 132 (3.5%) | 90 (2.4%) |
| 30 to 34 Years | 132 (3.5%) | 151 (4.0%) |
| 35 to 39 Years | 193 (5.1%) | 421 (11.2%) |
| 40 to 44 Years | 275 (7.3%) | 147 (3.9%) |
| 45 to 49 Years | 323 (8.6%) | 290 (7.7%) |
| 50 to 54 Years | 304 (8.1%) | 220 (5.8%) |
| 55 to 59 Years | 276 (7.3%) | 329 (8.7%) |
| 60 to 64 Years | 314 (8.4%) | 247 (6.5%) |
| 65 to 69 Years | 169 (4.5%) | 146 (3.9%) |
| 70 to 74 Years | 100 (2.7%) | 187 (5.0%) |
| 75 to 79 Years | 149 (4.0%) | 94 (2.5%) |
| 80 to 84 Years | 17 (0.4%) | 75 (2.0%) |
| 85 Years and over | 106 (2.8%) | 49 (1.3%) |
| Total | 3,756 (100.0%) | 3,775 (100.0%) |
Families and Households in Mantua
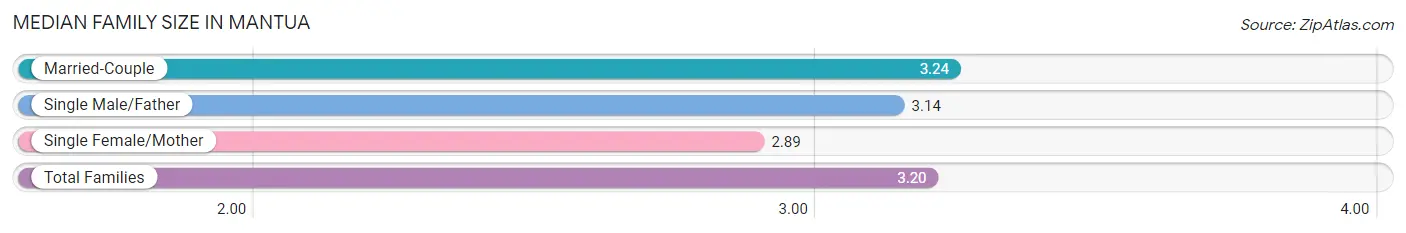
Median Family Size in Mantua
The median family size in Mantua is 3.20 persons per family, with married-couple families (1,703 | 83.2%) accounting for the largest median family size of 3.24 persons per family. On the other hand, single female/mother families (180 | 8.8%) represent the smallest median family size with 2.89 persons per family.
| Family Type | # Families | Family Size |
| Married-Couple | 1,703 (83.2%) | 3.24 |
| Single Male/Father | 165 (8.1%) | 3.14 |
| Single Female/Mother | 180 (8.8%) | 2.89 |
| Total Families | 2,048 (100.0%) | 3.20 |
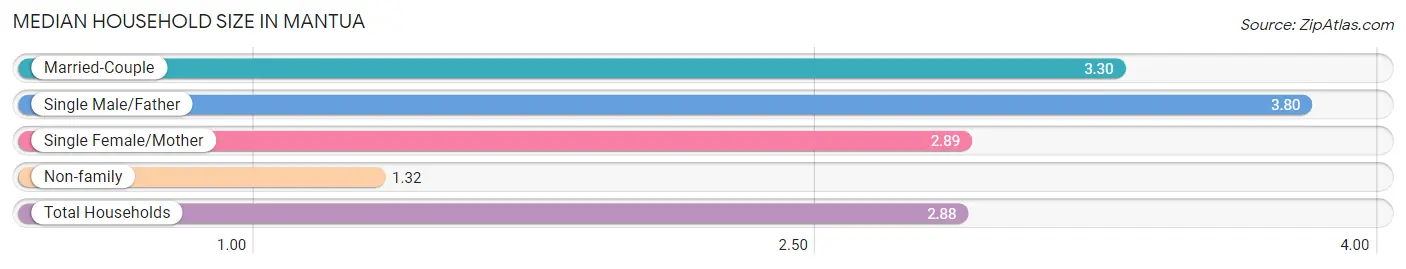
Median Household Size in Mantua
The median household size in Mantua is 2.88 persons per household, with single male/father households (165 | 6.4%) accounting for the largest median household size of 3.8 persons per household. non-family households (543 | 21.0%) represent the smallest median household size with 1.32 persons per household.
| Household Type | # Households | Household Size |
| Married-Couple | 1,703 (65.7%) | 3.30 |
| Single Male/Father | 165 (6.4%) | 3.80 |
| Single Female/Mother | 180 (7.0%) | 2.89 |
| Non-family | 543 (21.0%) | 1.32 |
| Total Households | 2,591 (100.0%) | 2.88 |
Household Size by Marriage Status in Mantua
Out of a total of 2,591 households in Mantua, 2,048 (79.0%) are family households, while 543 (21.0%) are nonfamily households. The most numerous type of family households are 2-person households, comprising 842, and the most common type of nonfamily households are 1-person households, comprising 424.
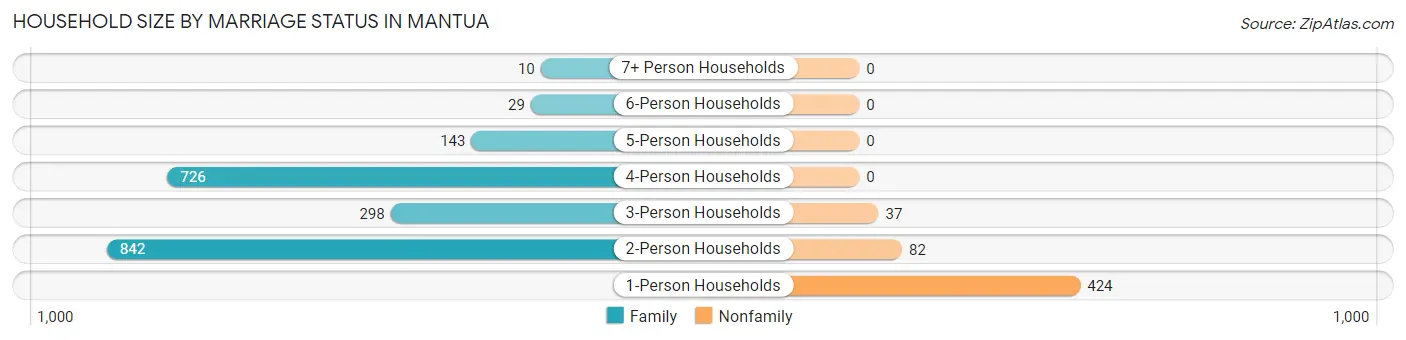
| Household Size | Family Households | Nonfamily Households |
| 1-Person Households | - | 424 (16.4%) |
| 2-Person Households | 842 (32.5%) | 82 (3.2%) |
| 3-Person Households | 298 (11.5%) | 37 (1.4%) |
| 4-Person Households | 726 (28.0%) | 0 (0.0%) |
| 5-Person Households | 143 (5.5%) | 0 (0.0%) |
| 6-Person Households | 29 (1.1%) | 0 (0.0%) |
| 7+ Person Households | 10 (0.4%) | 0 (0.0%) |
| Total | 2,048 (79.0%) | 543 (21.0%) |
Female Fertility in Mantua
Fertility by Age in Mantua
Average fertility rate in Mantua is 49.0 births per 1,000 women. Women in the age bracket of 20 to 34 years have the highest fertility rate with 150.0 births per 1,000 women. Women in the age bracket of 20 to 34 years acount for 78.4% of all women with births.
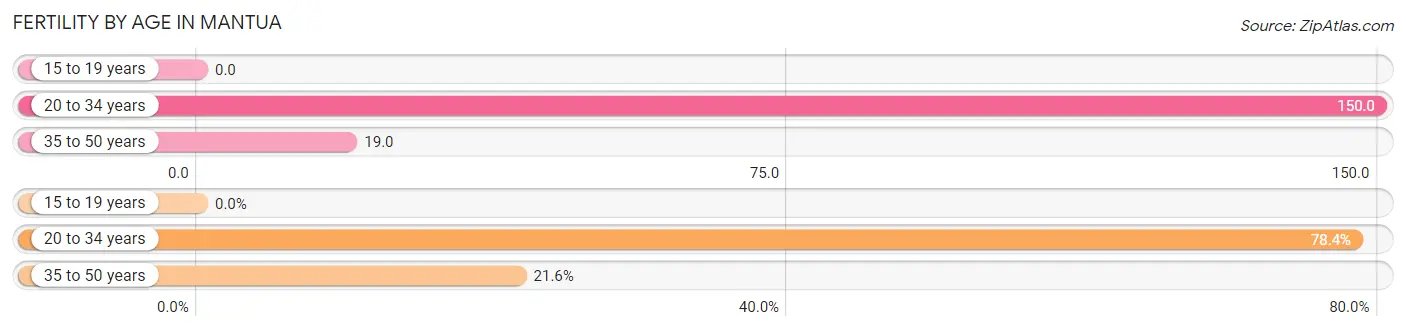
| Age Bracket | Women with Births | Births / 1,000 Women |
| 15 to 19 years | 0 (0.0%) | 0.0 |
| 20 to 34 years | 58 (78.4%) | 150.0 |
| 35 to 50 years | 16 (21.6%) | 19.0 |
| Total | 74 (100.0%) | 49.0 |
Fertility by Age by Marriage Status in Mantua
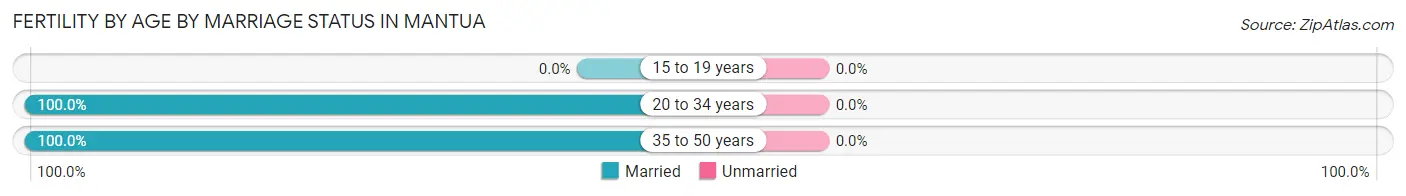
| Age Bracket | Married | Unmarried |
| 15 to 19 years | 0 (0.0%) | 0 (0.0%) |
| 20 to 34 years | 58 (100.0%) | 0 (0.0%) |
| 35 to 50 years | 16 (100.0%) | 0 (0.0%) |
| Total | 74 (100.0%) | 0 (0.0%) |
Fertility by Education in Mantua

| Educational Attainment | Women with Births | Births / 1,000 Women |
| Less than High School | 0 (0.0%) | 0.0 |
| High School Diploma | 38 (51.3%) | 342.0 |
| College or Associate's Degree | 0 (0.0%) | 0.0 |
| Bachelor's Degree | 8 (10.8%) | 16.0 |
| Graduate Degree | 28 (37.8%) | 72.0 |
| Total | 74 (100.0%) | 49.0 |
Fertility by Education by Marriage Status in Mantua
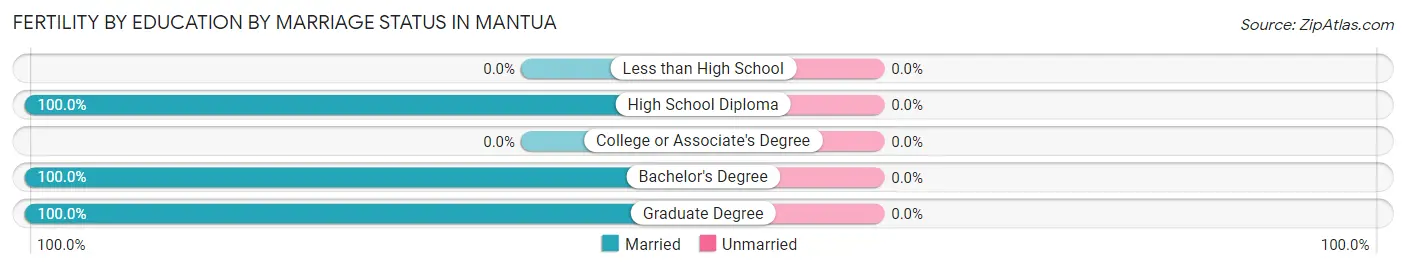
| Educational Attainment | Married | Unmarried |
| Less than High School | 0 (0.0%) | 0 (0.0%) |
| High School Diploma | 38 (100.0%) | 0 (0.0%) |
| College or Associate's Degree | 0 (0.0%) | 0 (0.0%) |
| Bachelor's Degree | 8 (100.0%) | 0 (0.0%) |
| Graduate Degree | 28 (100.0%) | 0 (0.0%) |
| Total | 74 (100.0%) | 0 (0.0%) |
Employment Characteristics in Mantua
Employment by Class of Employer in Mantua
Among the 3,719 employed individuals in Mantua, private company employees (1,987 | 53.4%), federal government employees (552 | 14.8%), and not-for-profit organizations (481 | 12.9%) make up the most common classes of employment.
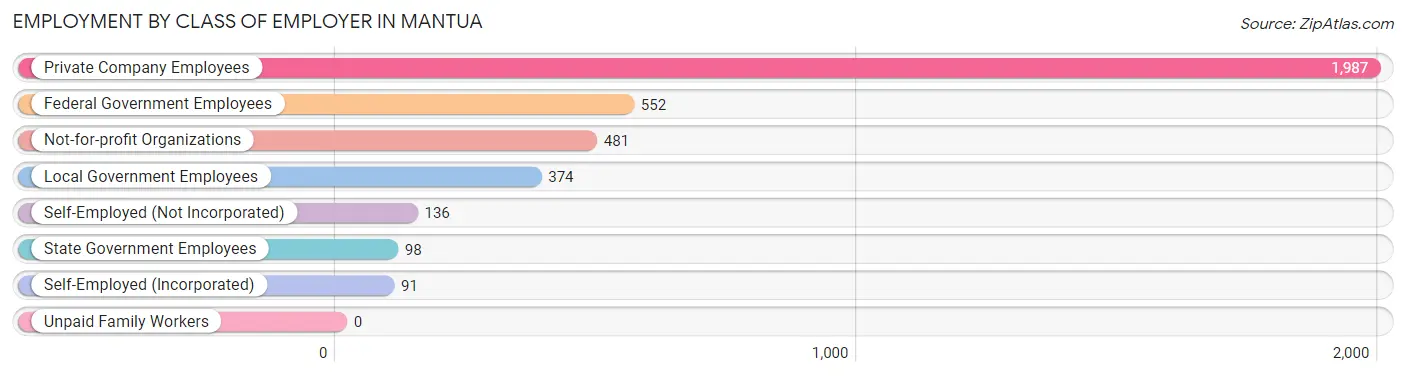
| Employer Class | # Employees | % Employees |
| Private Company Employees | 1,987 | 53.4% |
| Self-Employed (Incorporated) | 91 | 2.5% |
| Self-Employed (Not Incorporated) | 136 | 3.7% |
| Not-for-profit Organizations | 481 | 12.9% |
| Local Government Employees | 374 | 10.1% |
| State Government Employees | 98 | 2.6% |
| Federal Government Employees | 552 | 14.8% |
| Unpaid Family Workers | 0 | 0.0% |
| Total | 3,719 | 100.0% |
Employment Status by Age in Mantua
According to the labor force statistics for Mantua, out of the total population over 16 years of age (5,734), 68.8% or 3,945 individuals are in the labor force, with 4.7% or 185 of them unemployed. The age group with the highest labor force participation rate is 25 to 29 years, with 99.5% or 221 individuals in the labor force. Within the labor force, the 25 to 29 years age range has the highest percentage of unemployed individuals, with 33.5% or 74 of them being unemployed.
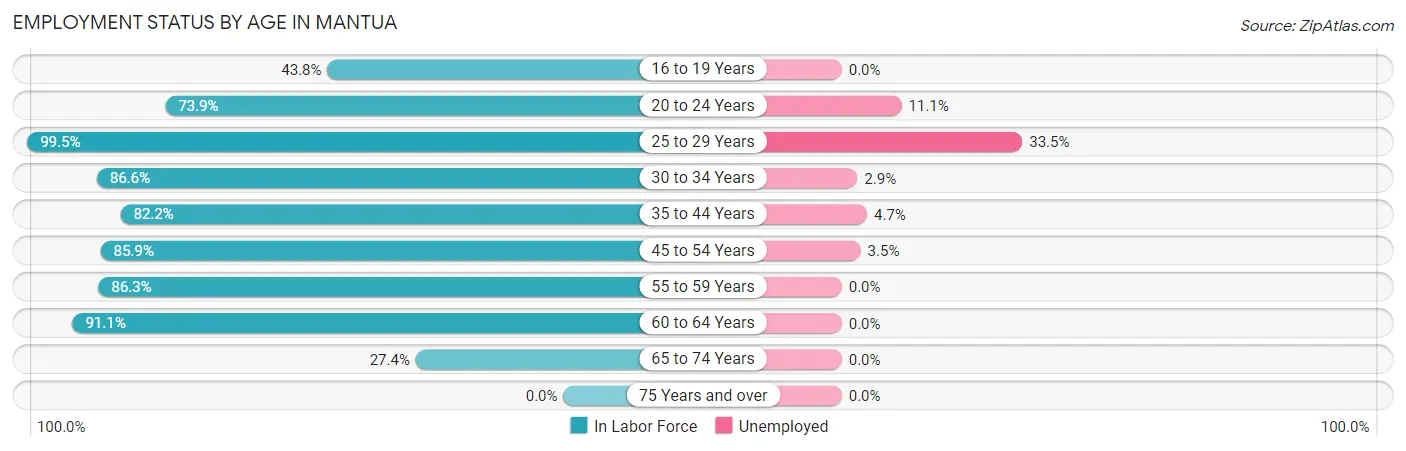
| Age Bracket | In Labor Force | Unemployed |
| 16 to 19 Years | 200 (43.8%) | 0 (0.0%) |
| 20 to 24 Years | 252 (73.9%) | 28 (11.1%) |
| 25 to 29 Years | 221 (99.5%) | 74 (33.5%) |
| 30 to 34 Years | 245 (86.6%) | 7 (2.9%) |
| 35 to 44 Years | 852 (82.2%) | 40 (4.7%) |
| 45 to 54 Years | 977 (85.9%) | 34 (3.5%) |
| 55 to 59 Years | 522 (86.3%) | 0 (0.0%) |
| 60 to 64 Years | 511 (91.1%) | 0 (0.0%) |
| 65 to 74 Years | 165 (27.4%) | 0 (0.0%) |
| 75 Years and over | 0 (0.0%) | 0 (0.0%) |
| Total | 3,945 (68.8%) | 185 (4.7%) |
Employment Status by Educational Attainment in Mantua
According to labor force statistics for Mantua, 86.6% of individuals (3,329) out of the total population between 25 and 64 years of age (3,844) are in the labor force, with 4.7% or 156 of them being unemployed. The group with the highest labor force participation rate are those with the educational attainment of college / associate degree, with 94.4% or 340 individuals in the labor force. Within the labor force, individuals with less than high school education have the highest percentage of unemployment, with 47.7% or 21 of them being unemployed.
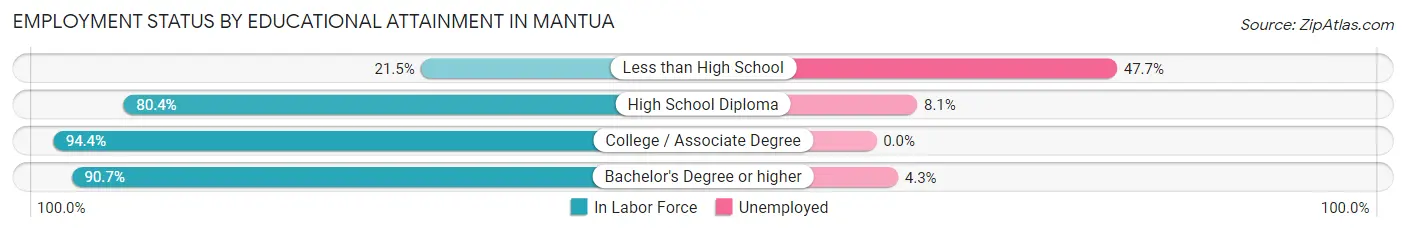
| Educational Attainment | In Labor Force | Unemployed |
| Less than High School | 44 (21.5%) | 98 (47.7%) |
| High School Diploma | 234 (80.4%) | 24 (8.1%) |
| College / Associate Degree | 340 (94.4%) | 0 (0.0%) |
| Bachelor's Degree or higher | 2,710 (90.7%) | 128 (4.3%) |
| Total | 3,329 (86.6%) | 181 (4.7%) |
Employment Occupations by Sex in Mantua
Management, Business, Science and Arts Occupations
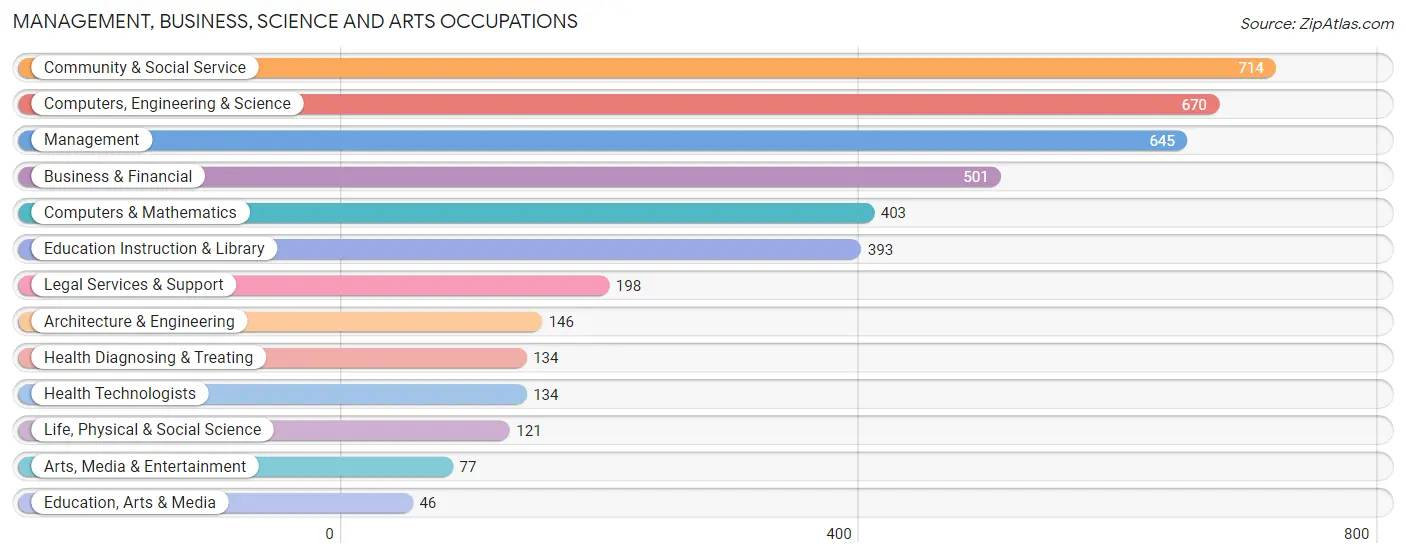
The most common Management, Business, Science and Arts occupations in Mantua are Community & Social Service (714 | 19.3%), Computers, Engineering & Science (670 | 18.1%), Management (645 | 17.4%), Business & Financial (501 | 13.5%), and Computers & Mathematics (403 | 10.9%).
Management, Business, Science and Arts Occupations by Sex
Within the Management, Business, Science and Arts occupations in Mantua, the most male-oriented occupations are Computers & Mathematics (84.9%), Health Diagnosing & Treating (81.3%), and Health Technologists (81.3%), while the most female-oriented occupations are Education, Arts & Media (69.6%), Education Instruction & Library (69.0%), and Community & Social Service (64.7%).
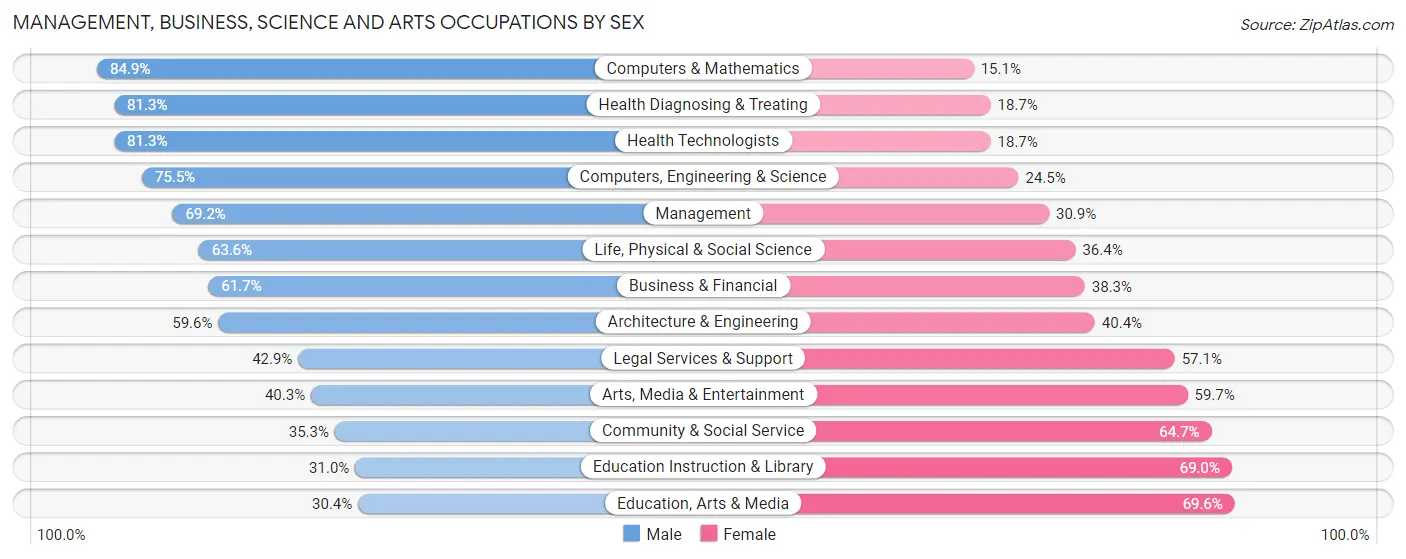
| Occupation | Male | Female |
| Management | 446 (69.2%) | 199 (30.8%) |
| Business & Financial | 309 (61.7%) | 192 (38.3%) |
| Computers, Engineering & Science | 506 (75.5%) | 164 (24.5%) |
| Computers & Mathematics | 342 (84.9%) | 61 (15.1%) |
| Architecture & Engineering | 87 (59.6%) | 59 (40.4%) |
| Life, Physical & Social Science | 77 (63.6%) | 44 (36.4%) |
| Community & Social Service | 252 (35.3%) | 462 (64.7%) |
| Education, Arts & Media | 14 (30.4%) | 32 (69.6%) |
| Legal Services & Support | 85 (42.9%) | 113 (57.1%) |
| Education Instruction & Library | 122 (31.0%) | 271 (69.0%) |
| Arts, Media & Entertainment | 31 (40.3%) | 46 (59.7%) |
| Health Diagnosing & Treating | 109 (81.3%) | 25 (18.7%) |
| Health Technologists | 109 (81.3%) | 25 (18.7%) |
| Total (Category) | 1,622 (60.9%) | 1,042 (39.1%) |
| Total (Overall) | 2,244 (60.5%) | 1,466 (39.5%) |
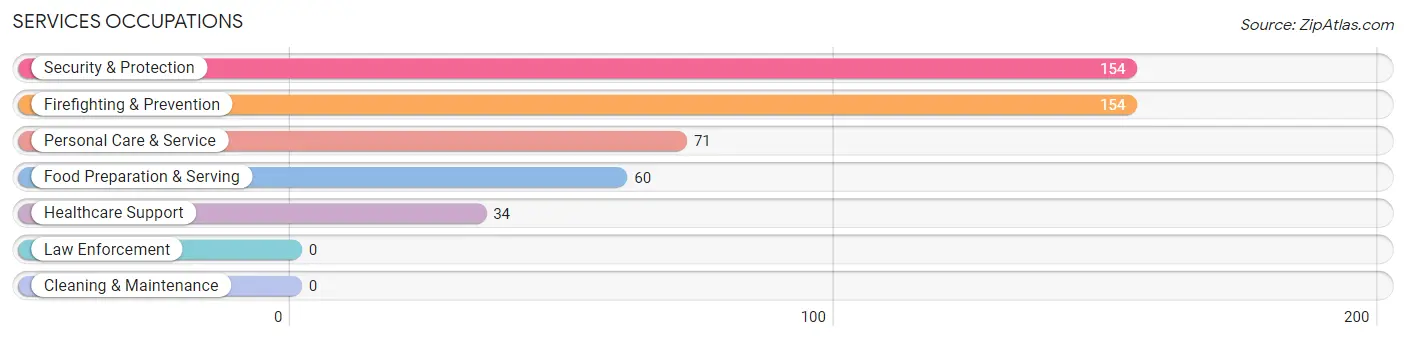
Services Occupations
The most common Services occupations in Mantua are Security & Protection (154 | 4.2%), Firefighting & Prevention (154 | 4.2%), Personal Care & Service (71 | 1.9%), Food Preparation & Serving (60 | 1.6%), and Healthcare Support (34 | 0.9%).
Services Occupations by Sex
Within the Services occupations in Mantua, the most male-oriented occupations are Security & Protection (66.2%), Firefighting & Prevention (66.2%), and Healthcare Support (38.2%), while the most female-oriented occupations are Personal Care & Service (77.5%), Food Preparation & Serving (63.3%), and Healthcare Support (61.8%).
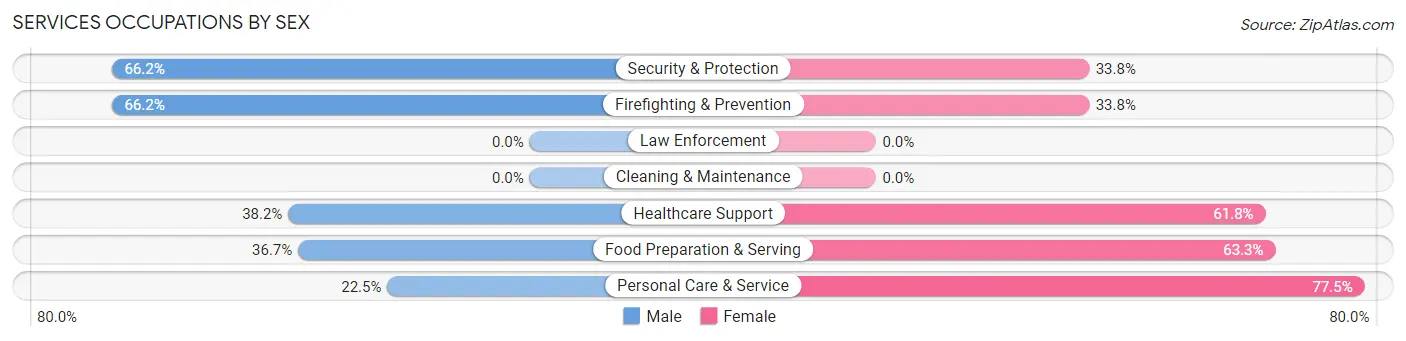
| Occupation | Male | Female |
| Healthcare Support | 13 (38.2%) | 21 (61.8%) |
| Security & Protection | 102 (66.2%) | 52 (33.8%) |
| Firefighting & Prevention | 102 (66.2%) | 52 (33.8%) |
| Law Enforcement | 0 (0.0%) | 0 (0.0%) |
| Food Preparation & Serving | 22 (36.7%) | 38 (63.3%) |
| Cleaning & Maintenance | 0 (0.0%) | 0 (0.0%) |
| Personal Care & Service | 16 (22.5%) | 55 (77.5%) |
| Total (Category) | 153 (48.0%) | 166 (52.0%) |
| Total (Overall) | 2,244 (60.5%) | 1,466 (39.5%) |
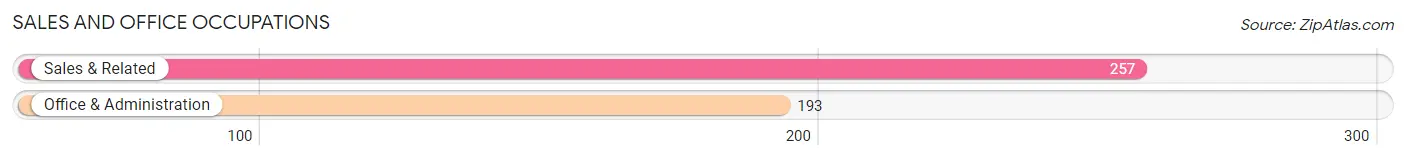
Sales and Office Occupations
The most common Sales and Office occupations in Mantua are Sales & Related (257 | 6.9%), and Office & Administration (193 | 5.2%).
Sales and Office Occupations by Sex
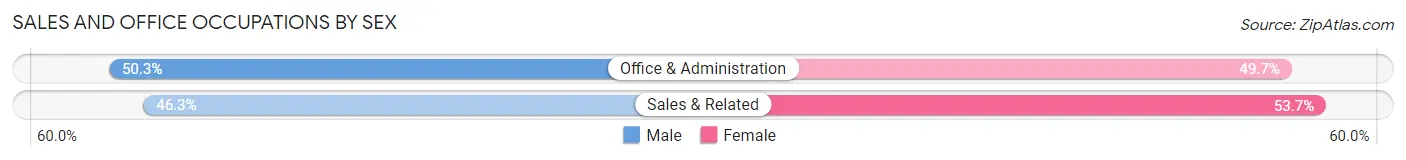
| Occupation | Male | Female |
| Sales & Related | 119 (46.3%) | 138 (53.7%) |
| Office & Administration | 97 (50.3%) | 96 (49.7%) |
| Total (Category) | 216 (48.0%) | 234 (52.0%) |
| Total (Overall) | 2,244 (60.5%) | 1,466 (39.5%) |
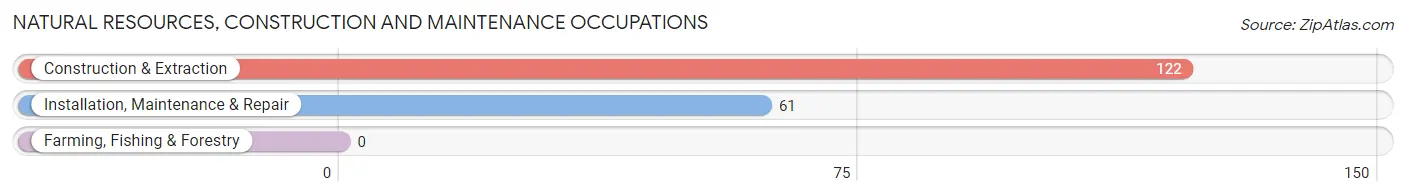
Natural Resources, Construction and Maintenance Occupations
The most common Natural Resources, Construction and Maintenance occupations in Mantua are Construction & Extraction (122 | 3.3%), and Installation, Maintenance & Repair (61 | 1.6%).
Natural Resources, Construction and Maintenance Occupations by Sex
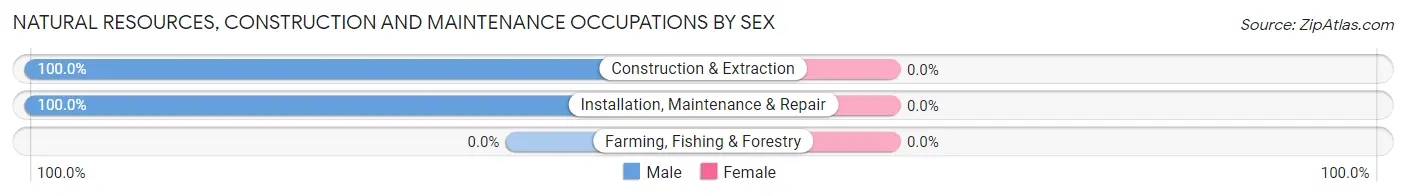
| Occupation | Male | Female |
| Farming, Fishing & Forestry | 0 (0.0%) | 0 (0.0%) |
| Construction & Extraction | 122 (100.0%) | 0 (0.0%) |
| Installation, Maintenance & Repair | 61 (100.0%) | 0 (0.0%) |
| Total (Category) | 183 (100.0%) | 0 (0.0%) |
| Total (Overall) | 2,244 (60.5%) | 1,466 (39.5%) |
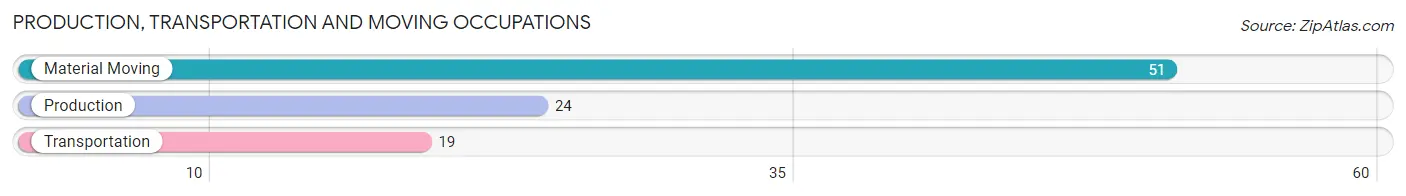
Production, Transportation and Moving Occupations
The most common Production, Transportation and Moving occupations in Mantua are Material Moving (51 | 1.4%), Production (24 | 0.6%), and Transportation (19 | 0.5%).
Production, Transportation and Moving Occupations by Sex
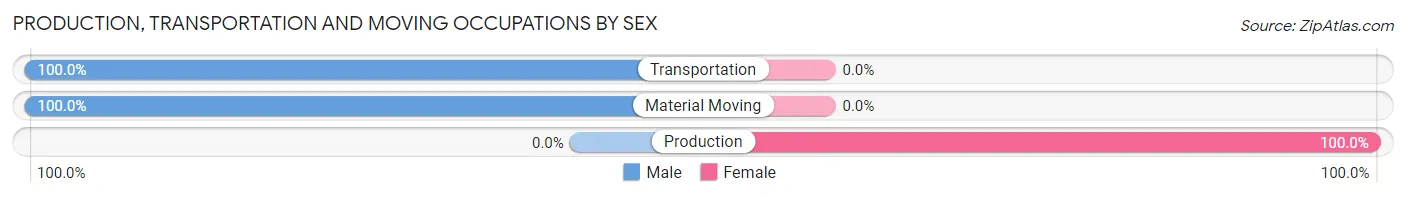
| Occupation | Male | Female |
| Production | 0 (0.0%) | 24 (100.0%) |
| Transportation | 19 (100.0%) | 0 (0.0%) |
| Material Moving | 51 (100.0%) | 0 (0.0%) |
| Total (Category) | 70 (74.5%) | 24 (25.5%) |
| Total (Overall) | 2,244 (60.5%) | 1,466 (39.5%) |
Employment Industries by Sex in Mantua
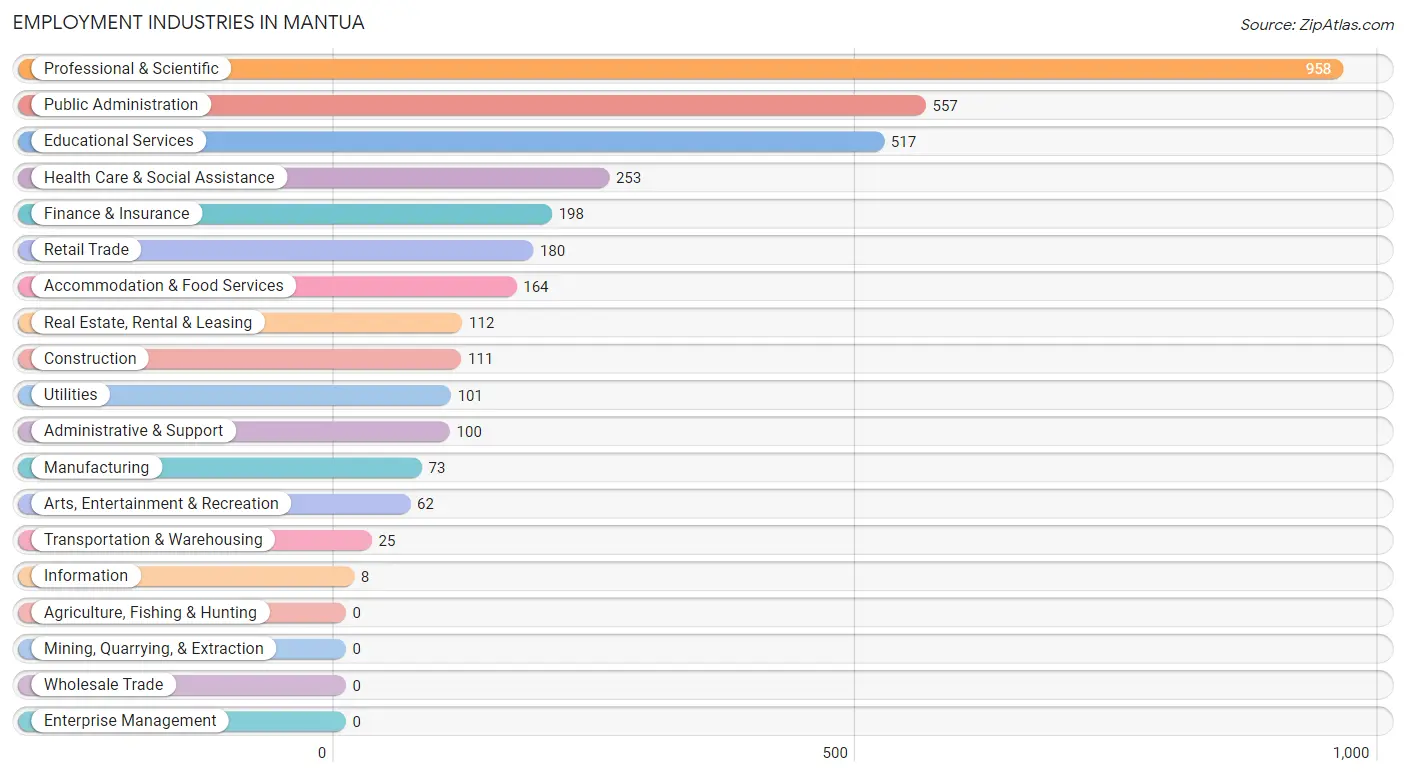
Employment Industries in Mantua
The major employment industries in Mantua include Professional & Scientific (958 | 25.8%), Public Administration (557 | 15.0%), Educational Services (517 | 13.9%), Health Care & Social Assistance (253 | 6.8%), and Finance & Insurance (198 | 5.3%).
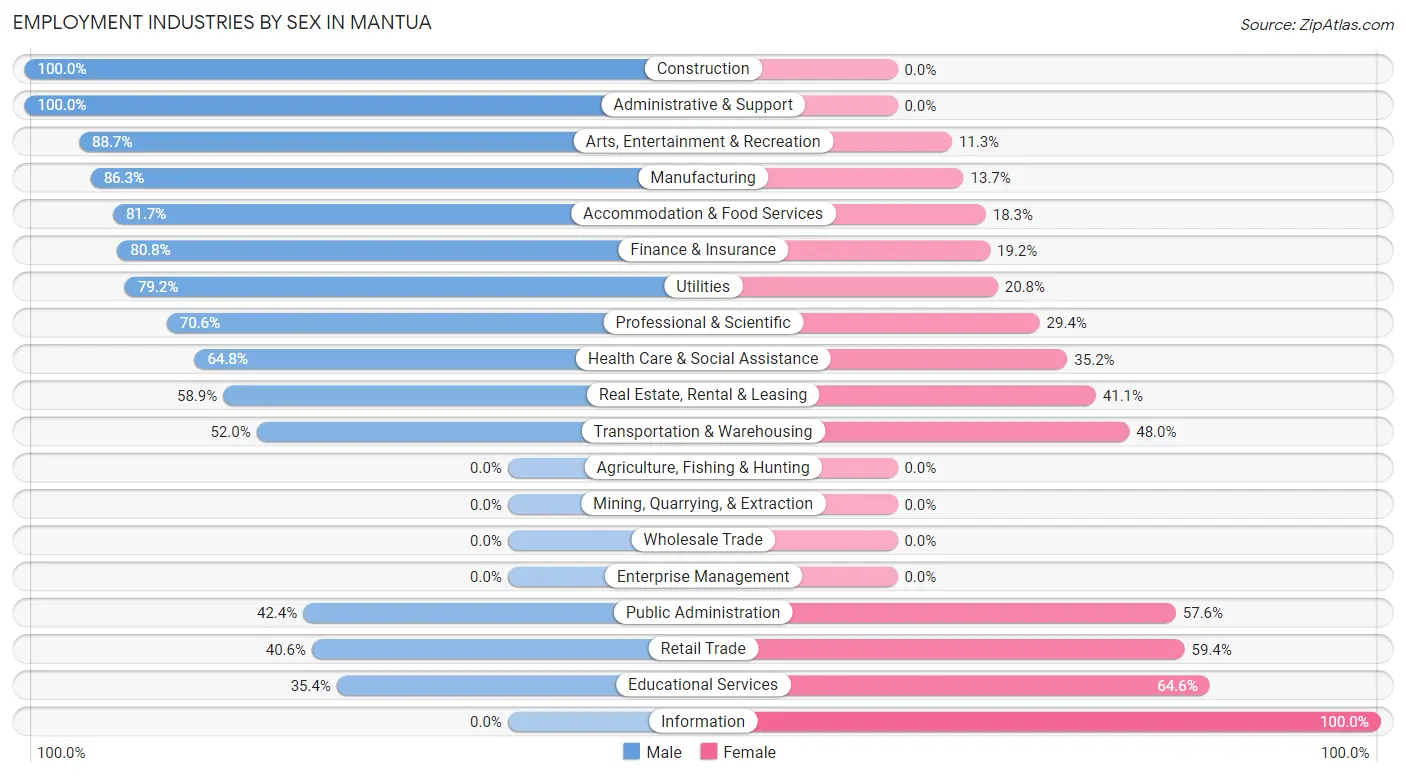
Employment Industries by Sex in Mantua
The Mantua industries that see more men than women are Construction (100.0%), Administrative & Support (100.0%), and Arts, Entertainment & Recreation (88.7%), whereas the industries that tend to have a higher number of women are Information (100.0%), Educational Services (64.6%), and Retail Trade (59.4%).
| Industry | Male | Female |
| Agriculture, Fishing & Hunting | 0 (0.0%) | 0 (0.0%) |
| Mining, Quarrying, & Extraction | 0 (0.0%) | 0 (0.0%) |
| Construction | 111 (100.0%) | 0 (0.0%) |
| Manufacturing | 63 (86.3%) | 10 (13.7%) |
| Wholesale Trade | 0 (0.0%) | 0 (0.0%) |
| Retail Trade | 73 (40.6%) | 107 (59.4%) |
| Transportation & Warehousing | 13 (52.0%) | 12 (48.0%) |
| Utilities | 80 (79.2%) | 21 (20.8%) |
| Information | 0 (0.0%) | 8 (100.0%) |
| Finance & Insurance | 160 (80.8%) | 38 (19.2%) |
| Real Estate, Rental & Leasing | 66 (58.9%) | 46 (41.1%) |
| Professional & Scientific | 676 (70.6%) | 282 (29.4%) |
| Enterprise Management | 0 (0.0%) | 0 (0.0%) |
| Administrative & Support | 100 (100.0%) | 0 (0.0%) |
| Educational Services | 183 (35.4%) | 334 (64.6%) |
| Health Care & Social Assistance | 164 (64.8%) | 89 (35.2%) |
| Arts, Entertainment & Recreation | 55 (88.7%) | 7 (11.3%) |
| Accommodation & Food Services | 134 (81.7%) | 30 (18.3%) |
| Public Administration | 236 (42.4%) | 321 (57.6%) |
| Total | 2,244 (60.5%) | 1,466 (39.5%) |
Education in Mantua
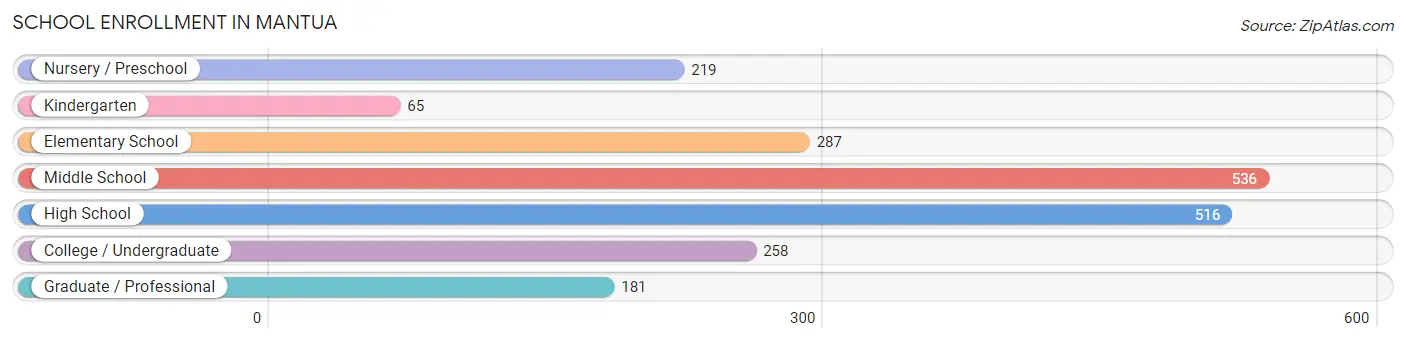
School Enrollment in Mantua
The most common levels of schooling among the 2,062 students in Mantua are middle school (536 | 26.0%), high school (516 | 25.0%), and elementary school (287 | 13.9%).
| School Level | # Students | % Students |
| Nursery / Preschool | 219 | 10.6% |
| Kindergarten | 65 | 3.2% |
| Elementary School | 287 | 13.9% |
| Middle School | 536 | 26.0% |
| High School | 516 | 25.0% |
| College / Undergraduate | 258 | 12.5% |
| Graduate / Professional | 181 | 8.8% |
| Total | 2,062 | 100.0% |
School Enrollment by Age by Funding Source in Mantua
Out of a total of 2,062 students who are enrolled in schools in Mantua, 371 (18.0%) attend a private institution, while the remaining 1,691 (82.0%) are enrolled in public schools. The age group of 3 to 4 year olds has the highest likelihood of being enrolled in private schools, with 128 (71.9% in the age bracket) enrolled. Conversely, the age group of 25 to 34 year olds has the lowest likelihood of being enrolled in a private school, with 55 (100.0% in the age bracket) attending a public institution.
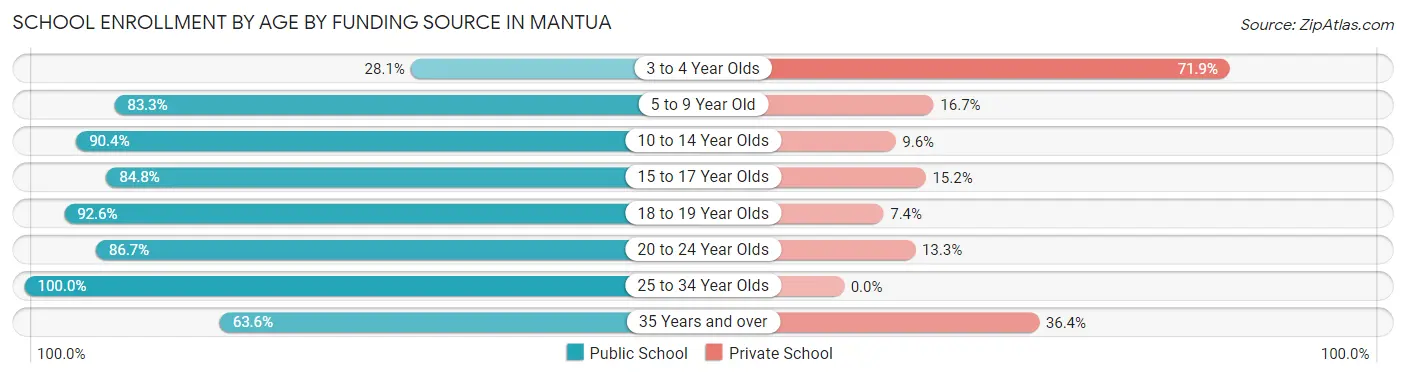
| Age Bracket | Public School | Private School |
| 3 to 4 Year Olds | 50 (28.1%) | 128 (71.9%) |
| 5 to 9 Year Old | 304 (83.3%) | 61 (16.7%) |
| 10 to 14 Year Olds | 564 (90.4%) | 60 (9.6%) |
| 15 to 17 Year Olds | 267 (84.8%) | 48 (15.2%) |
| 18 to 19 Year Olds | 276 (92.6%) | 22 (7.4%) |
| 20 to 24 Year Olds | 111 (86.7%) | 17 (13.3%) |
| 25 to 34 Year Olds | 55 (100.0%) | 0 (0.0%) |
| 35 Years and over | 63 (63.6%) | 36 (36.4%) |
| Total | 1,691 (82.0%) | 371 (18.0%) |
Educational Attainment by Field of Study in Mantua
Social sciences (766 | 17.6%), business (726 | 16.7%), engineering (479 | 11.0%), literature & languages (405 | 9.3%), and arts & humanities (280 | 6.4%) are the most common fields of study among 4,359 individuals in Mantua who have obtained a bachelor's degree or higher.
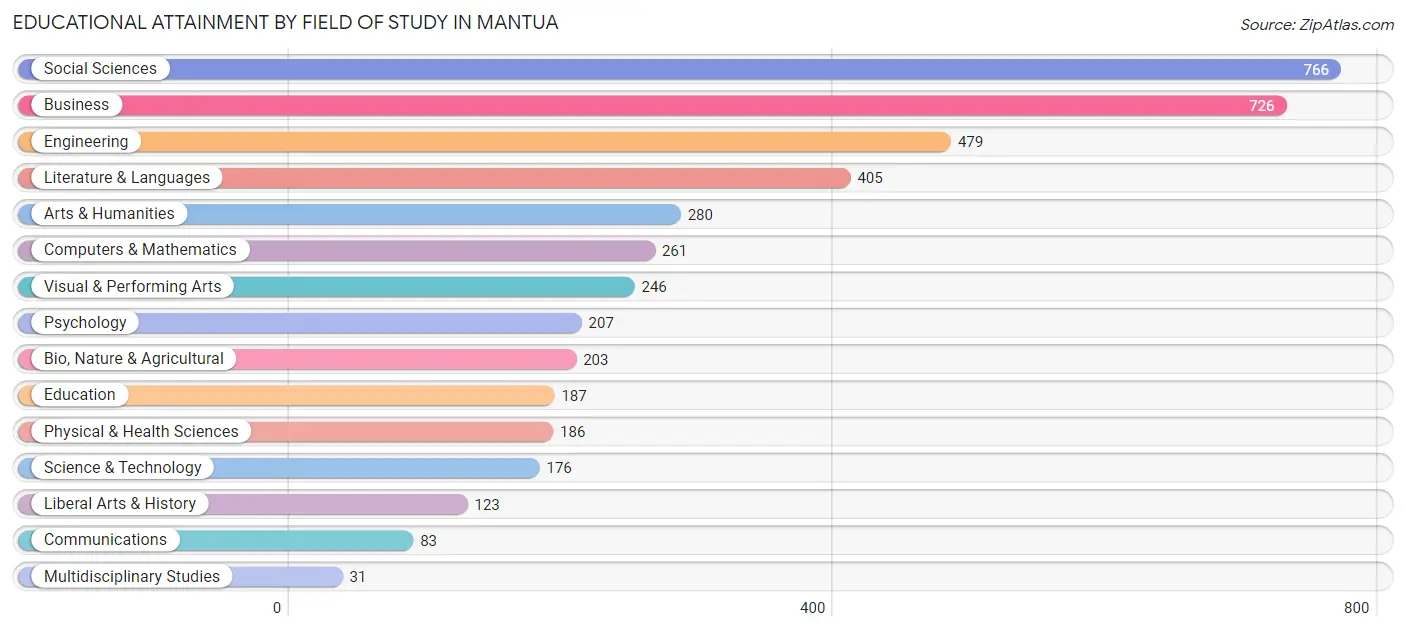
| Field of Study | # Graduates | % Graduates |
| Computers & Mathematics | 261 | 6.0% |
| Bio, Nature & Agricultural | 203 | 4.7% |
| Physical & Health Sciences | 186 | 4.3% |
| Psychology | 207 | 4.8% |
| Social Sciences | 766 | 17.6% |
| Engineering | 479 | 11.0% |
| Multidisciplinary Studies | 31 | 0.7% |
| Science & Technology | 176 | 4.0% |
| Business | 726 | 16.7% |
| Education | 187 | 4.3% |
| Literature & Languages | 405 | 9.3% |
| Liberal Arts & History | 123 | 2.8% |
| Visual & Performing Arts | 246 | 5.6% |
| Communications | 83 | 1.9% |
| Arts & Humanities | 280 | 6.4% |
| Total | 4,359 | 100.0% |
Transportation & Commute in Mantua
Vehicle Availability by Sex in Mantua
The most prevalent vehicle ownership categories in Mantua are males with 2 vehicles (933, accounting for 40.9%) and females with 2 vehicles (644, making up 65.0%).
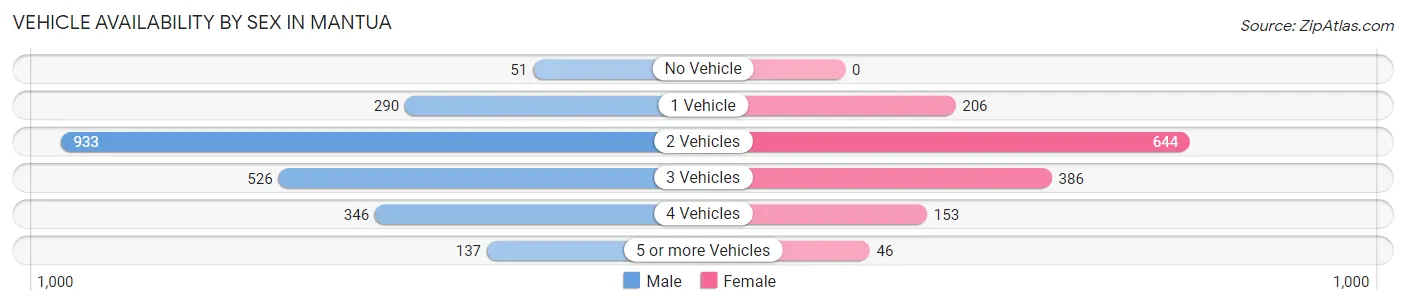
| Vehicles Available | Male | Female |
| No Vehicle | 51 (2.2%) | 0 (0.0%) |
| 1 Vehicle | 290 (12.7%) | 206 (14.4%) |
| 2 Vehicles | 933 (40.9%) | 644 (44.9%) |
| 3 Vehicles | 526 (23.0%) | 386 (26.9%) |
| 4 Vehicles | 346 (15.2%) | 153 (10.7%) |
| 5 or more Vehicles | 137 (6.0%) | 46 (3.2%) |
| Total | 2,283 (100.0%) | 1,435 (100.0%) |
Commute Time in Mantua
The most frequently occuring commute durations in Mantua are 20 to 24 minutes (449 commuters, 15.5%), 30 to 34 minutes (448 commuters, 15.5%), and 60 to 89 minutes (334 commuters, 11.5%).
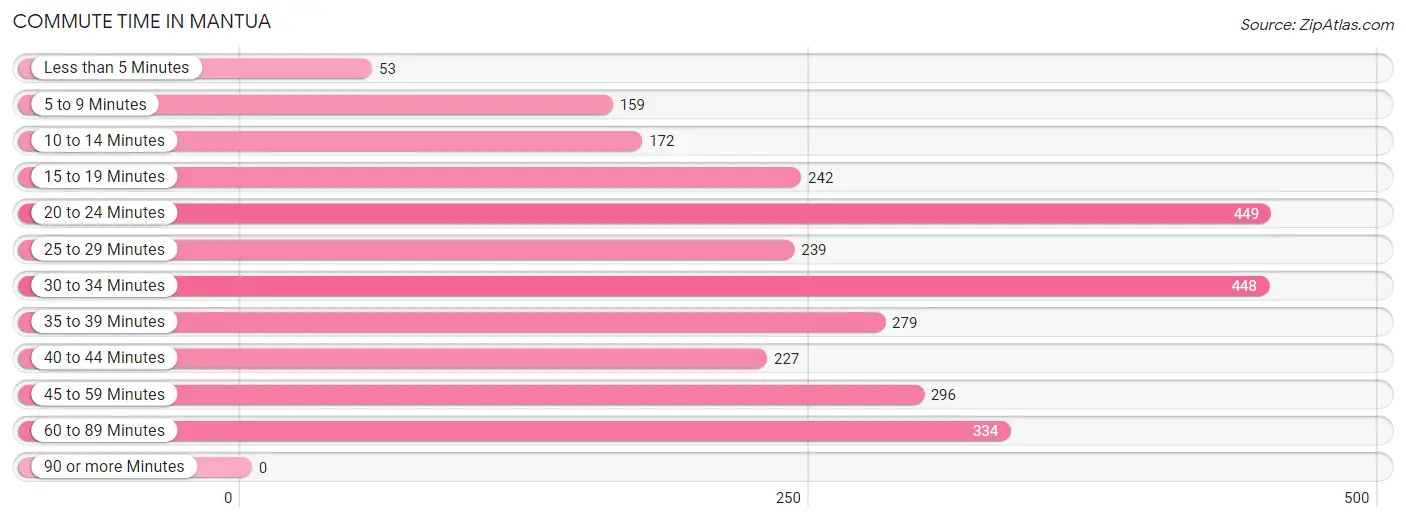
| Commute Time | # Commuters | % Commuters |
| Less than 5 Minutes | 53 | 1.8% |
| 5 to 9 Minutes | 159 | 5.5% |
| 10 to 14 Minutes | 172 | 5.9% |
| 15 to 19 Minutes | 242 | 8.4% |
| 20 to 24 Minutes | 449 | 15.5% |
| 25 to 29 Minutes | 239 | 8.3% |
| 30 to 34 Minutes | 448 | 15.5% |
| 35 to 39 Minutes | 279 | 9.6% |
| 40 to 44 Minutes | 227 | 7.8% |
| 45 to 59 Minutes | 296 | 10.2% |
| 60 to 89 Minutes | 334 | 11.5% |
| 90 or more Minutes | 0 | 0.0% |
Commute Time by Sex in Mantua
The most common commute times in Mantua are 60 to 89 minutes (280 commuters, 15.1%) for males and 30 to 34 minutes (233 commuters, 22.4%) for females.
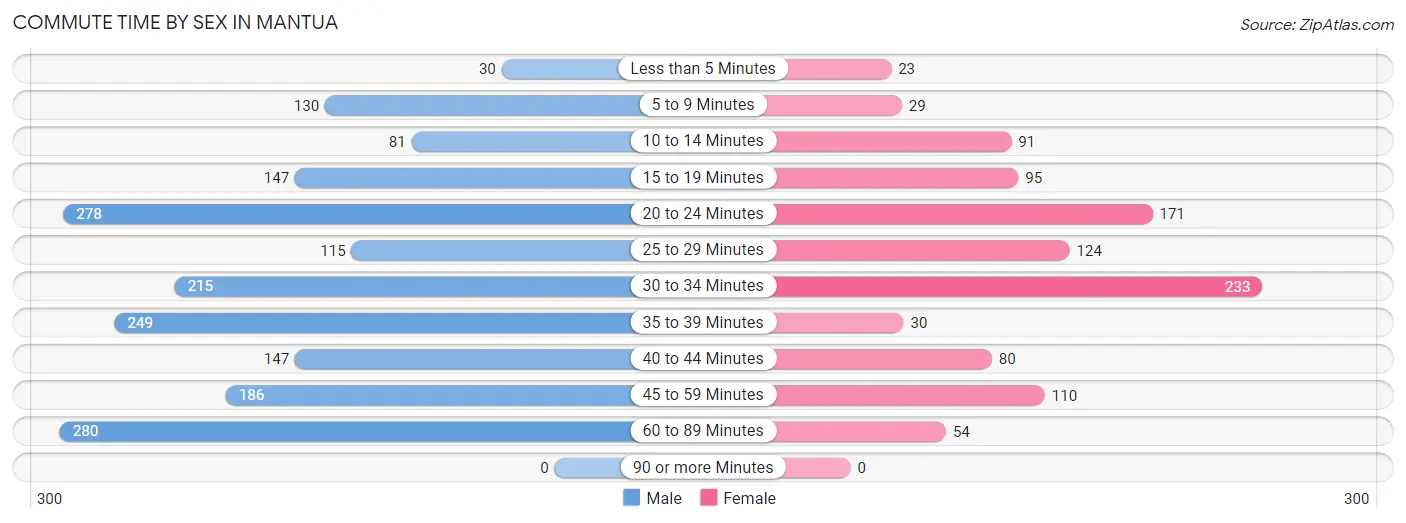
| Commute Time | Male | Female |
| Less than 5 Minutes | 30 (1.6%) | 23 (2.2%) |
| 5 to 9 Minutes | 130 (7.0%) | 29 (2.8%) |
| 10 to 14 Minutes | 81 (4.4%) | 91 (8.7%) |
| 15 to 19 Minutes | 147 (7.9%) | 95 (9.1%) |
| 20 to 24 Minutes | 278 (15.0%) | 171 (16.4%) |
| 25 to 29 Minutes | 115 (6.2%) | 124 (11.9%) |
| 30 to 34 Minutes | 215 (11.6%) | 233 (22.4%) |
| 35 to 39 Minutes | 249 (13.4%) | 30 (2.9%) |
| 40 to 44 Minutes | 147 (7.9%) | 80 (7.7%) |
| 45 to 59 Minutes | 186 (10.0%) | 110 (10.6%) |
| 60 to 89 Minutes | 280 (15.1%) | 54 (5.2%) |
| 90 or more Minutes | 0 (0.0%) | 0 (0.0%) |
Time of Departure to Work by Sex in Mantua
The most frequent times of departure to work in Mantua are 7:30 AM to 7:59 AM (365, 19.6%) for males and 8:00 AM to 8:29 AM (232, 22.3%) for females.
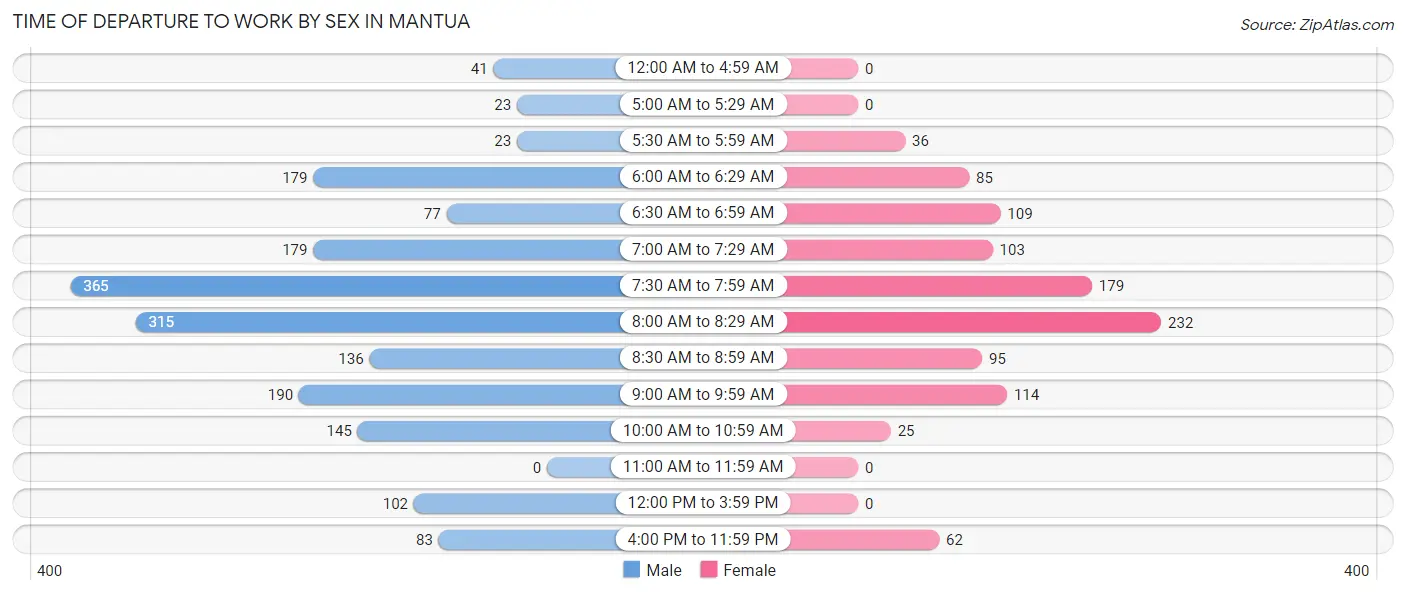
| Time of Departure | Male | Female |
| 12:00 AM to 4:59 AM | 41 (2.2%) | 0 (0.0%) |
| 5:00 AM to 5:29 AM | 23 (1.2%) | 0 (0.0%) |
| 5:30 AM to 5:59 AM | 23 (1.2%) | 36 (3.5%) |
| 6:00 AM to 6:29 AM | 179 (9.6%) | 85 (8.2%) |
| 6:30 AM to 6:59 AM | 77 (4.1%) | 109 (10.5%) |
| 7:00 AM to 7:29 AM | 179 (9.6%) | 103 (9.9%) |
| 7:30 AM to 7:59 AM | 365 (19.6%) | 179 (17.2%) |
| 8:00 AM to 8:29 AM | 315 (17.0%) | 232 (22.3%) |
| 8:30 AM to 8:59 AM | 136 (7.3%) | 95 (9.1%) |
| 9:00 AM to 9:59 AM | 190 (10.2%) | 114 (11.0%) |
| 10:00 AM to 10:59 AM | 145 (7.8%) | 25 (2.4%) |
| 11:00 AM to 11:59 AM | 0 (0.0%) | 0 (0.0%) |
| 12:00 PM to 3:59 PM | 102 (5.5%) | 0 (0.0%) |
| 4:00 PM to 11:59 PM | 83 (4.5%) | 62 (6.0%) |
| Total | 1,858 (100.0%) | 1,040 (100.0%) |
Housing Occupancy in Mantua
Occupancy by Ownership in Mantua
Of the total 2,591 dwellings in Mantua, owner-occupied units account for 1,935 (74.7%), while renter-occupied units make up 656 (25.3%).
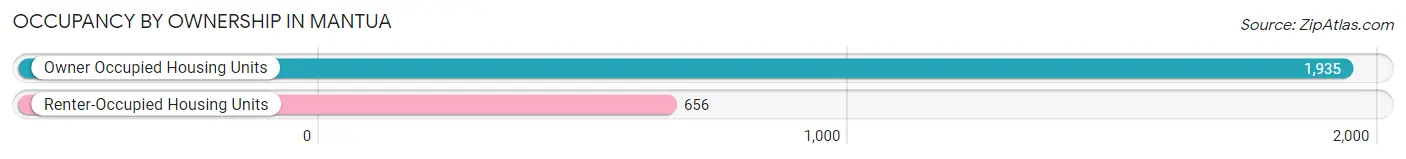
| Occupancy | # Housing Units | % Housing Units |
| Owner Occupied Housing Units | 1,935 | 74.7% |
| Renter-Occupied Housing Units | 656 | 25.3% |
| Total Occupied Housing Units | 2,591 | 100.0% |
Occupancy by Household Size in Mantua
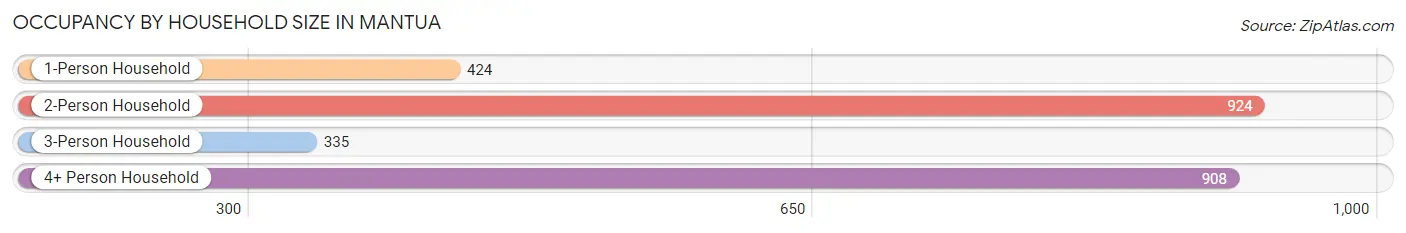
| Household Size | # Housing Units | % Housing Units |
| 1-Person Household | 424 | 16.4% |
| 2-Person Household | 924 | 35.7% |
| 3-Person Household | 335 | 12.9% |
| 4+ Person Household | 908 | 35.0% |
| Total Housing Units | 2,591 | 100.0% |
Occupancy by Ownership by Household Size in Mantua
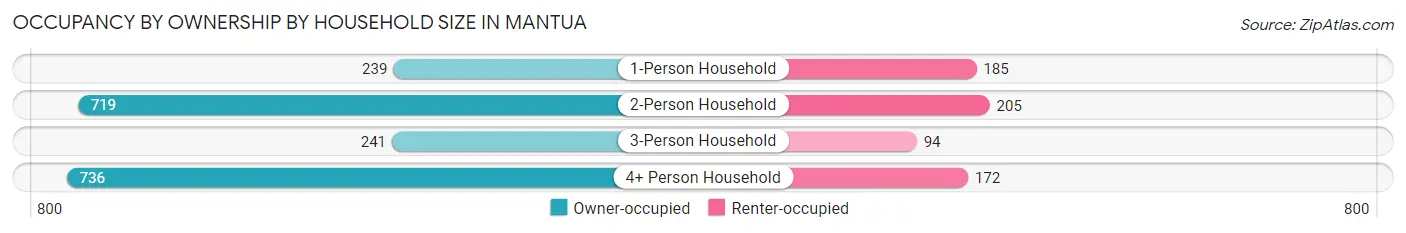
| Household Size | Owner-occupied | Renter-occupied |
| 1-Person Household | 239 (56.4%) | 185 (43.6%) |
| 2-Person Household | 719 (77.8%) | 205 (22.2%) |
| 3-Person Household | 241 (71.9%) | 94 (28.1%) |
| 4+ Person Household | 736 (81.1%) | 172 (18.9%) |
| Total Housing Units | 1,935 (74.7%) | 656 (25.3%) |
Occupancy by Educational Attainment in Mantua
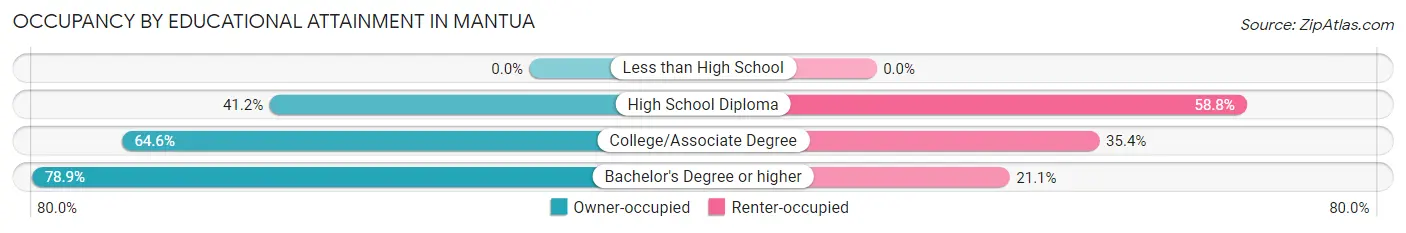
| Household Size | Owner-occupied | Renter-occupied |
| Less than High School | 0 (0.0%) | 0 (0.0%) |
| High School Diploma | 73 (41.2%) | 104 (58.8%) |
| College/Associate Degree | 190 (64.6%) | 104 (35.4%) |
| Bachelor's Degree or higher | 1,672 (78.9%) | 448 (21.1%) |
Occupancy by Age of Householder in Mantua
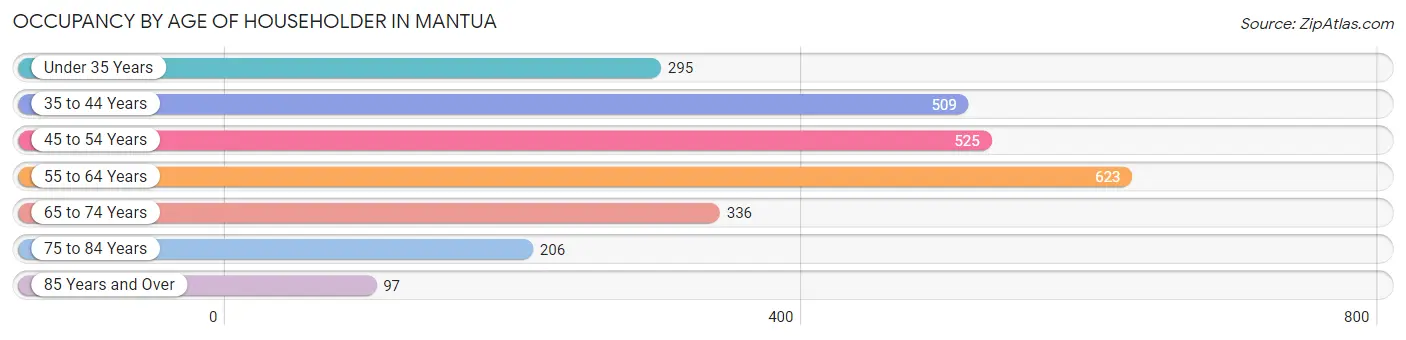
| Age Bracket | # Households | % Households |
| Under 35 Years | 295 | 11.4% |
| 35 to 44 Years | 509 | 19.6% |
| 45 to 54 Years | 525 | 20.3% |
| 55 to 64 Years | 623 | 24.0% |
| 65 to 74 Years | 336 | 13.0% |
| 75 to 84 Years | 206 | 8.0% |
| 85 Years and Over | 97 | 3.7% |
| Total | 2,591 | 100.0% |
Housing Finances in Mantua
Median Income by Occupancy in Mantua
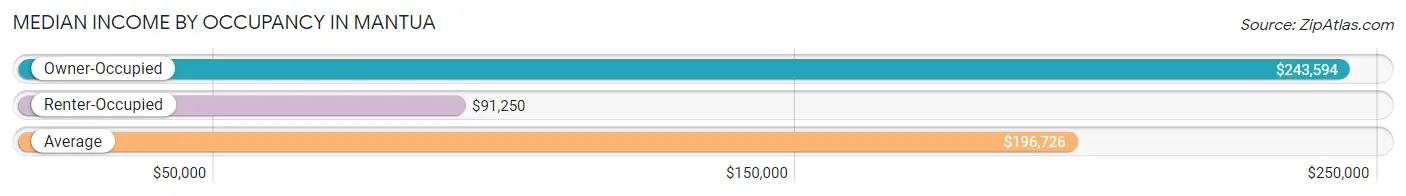
| Occupancy Type | # Households | Median Income |
| Owner-Occupied | 1,935 (74.7%) | $243,594 |
| Renter-Occupied | 656 (25.3%) | $91,250 |
| Average | 2,591 (100.0%) | $196,726 |
Occupancy by Householder Income Bracket in Mantua
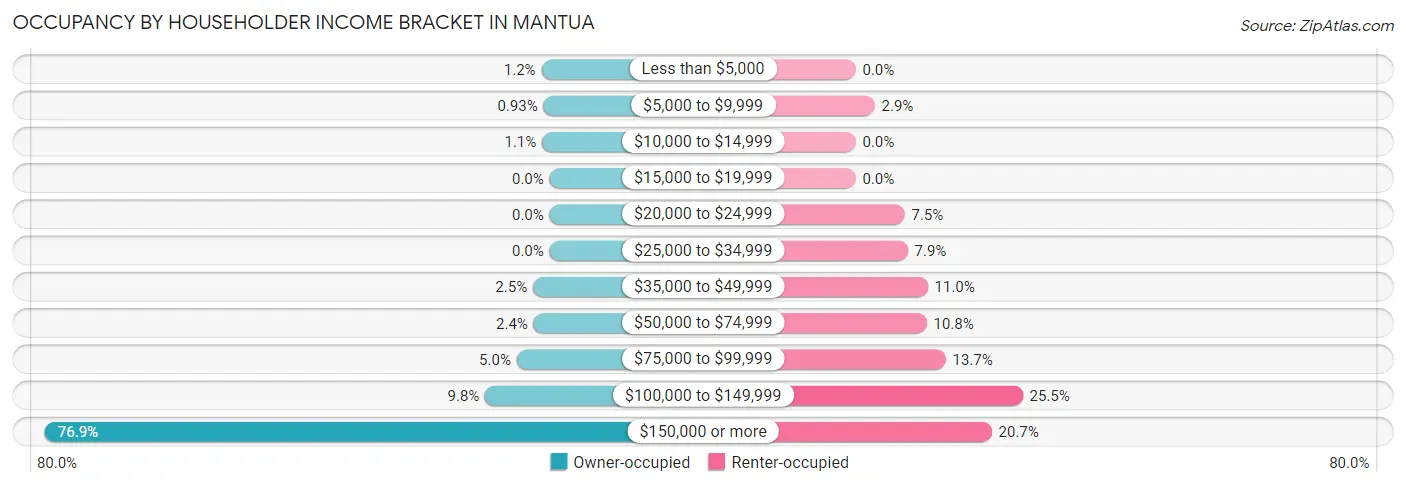
| Income Bracket | Owner-occupied | Renter-occupied |
| Less than $5,000 | 24 (1.2%) | 0 (0.0%) |
| $5,000 to $9,999 | 18 (0.9%) | 19 (2.9%) |
| $10,000 to $14,999 | 22 (1.1%) | 0 (0.0%) |
| $15,000 to $19,999 | 0 (0.0%) | 0 (0.0%) |
| $20,000 to $24,999 | 0 (0.0%) | 49 (7.5%) |
| $25,000 to $34,999 | 0 (0.0%) | 52 (7.9%) |
| $35,000 to $49,999 | 49 (2.5%) | 72 (11.0%) |
| $50,000 to $74,999 | 47 (2.4%) | 71 (10.8%) |
| $75,000 to $99,999 | 97 (5.0%) | 90 (13.7%) |
| $100,000 to $149,999 | 190 (9.8%) | 167 (25.5%) |
| $150,000 or more | 1,488 (76.9%) | 136 (20.7%) |
| Total | 1,935 (100.0%) | 656 (100.0%) |
Monthly Housing Cost Tiers in Mantua
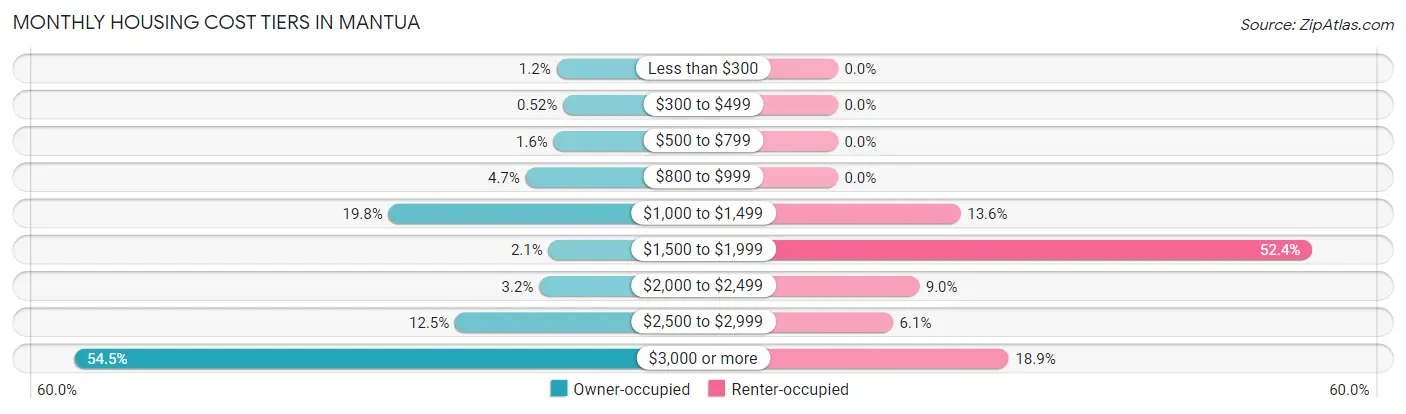
| Monthly Cost | Owner-occupied | Renter-occupied |
| Less than $300 | 24 (1.2%) | 0 (0.0%) |
| $300 to $499 | 10 (0.5%) | 0 (0.0%) |
| $500 to $799 | 30 (1.5%) | 0 (0.0%) |
| $800 to $999 | 90 (4.6%) | 0 (0.0%) |
| $1,000 to $1,499 | 383 (19.8%) | 89 (13.6%) |
| $1,500 to $1,999 | 41 (2.1%) | 344 (52.4%) |
| $2,000 to $2,499 | 61 (3.2%) | 59 (9.0%) |
| $2,500 to $2,999 | 241 (12.4%) | 40 (6.1%) |
| $3,000 or more | 1,055 (54.5%) | 124 (18.9%) |
| Total | 1,935 (100.0%) | 656 (100.0%) |
Physical Housing Characteristics in Mantua
Housing Structures in Mantua
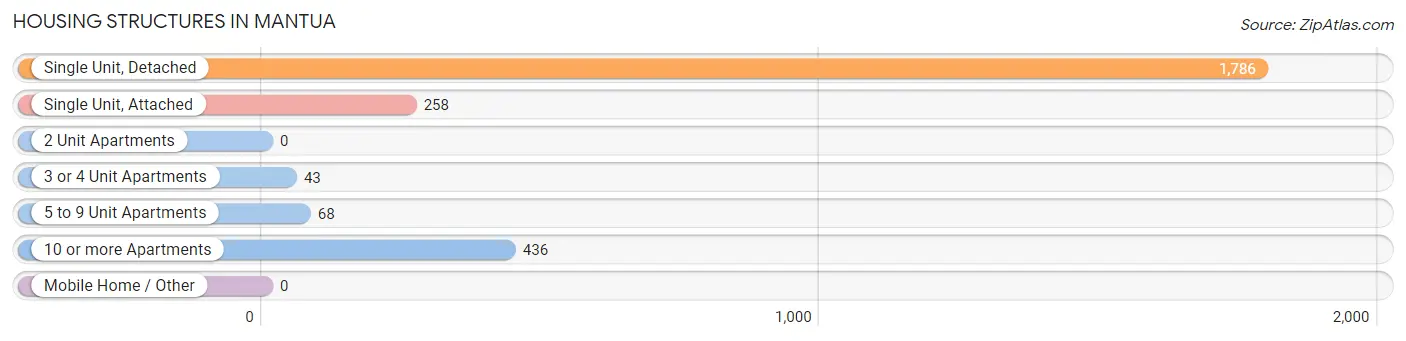
| Structure Type | # Housing Units | % Housing Units |
| Single Unit, Detached | 1,786 | 68.9% |
| Single Unit, Attached | 258 | 10.0% |
| 2 Unit Apartments | 0 | 0.0% |
| 3 or 4 Unit Apartments | 43 | 1.7% |
| 5 to 9 Unit Apartments | 68 | 2.6% |
| 10 or more Apartments | 436 | 16.8% |
| Mobile Home / Other | 0 | 0.0% |
| Total | 2,591 | 100.0% |
Housing Structures by Occupancy in Mantua
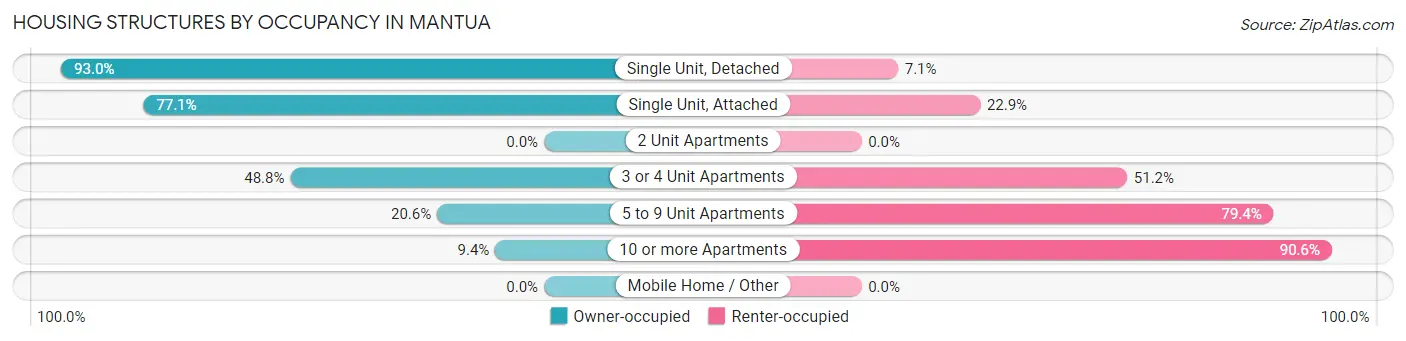
| Structure Type | Owner-occupied | Renter-occupied |
| Single Unit, Detached | 1,660 (92.9%) | 126 (7.0%) |
| Single Unit, Attached | 199 (77.1%) | 59 (22.9%) |
| 2 Unit Apartments | 0 (0.0%) | 0 (0.0%) |
| 3 or 4 Unit Apartments | 21 (48.8%) | 22 (51.2%) |
| 5 to 9 Unit Apartments | 14 (20.6%) | 54 (79.4%) |
| 10 or more Apartments | 41 (9.4%) | 395 (90.6%) |
| Mobile Home / Other | 0 (0.0%) | 0 (0.0%) |
| Total | 1,935 (74.7%) | 656 (25.3%) |
Housing Structures by Number of Rooms in Mantua
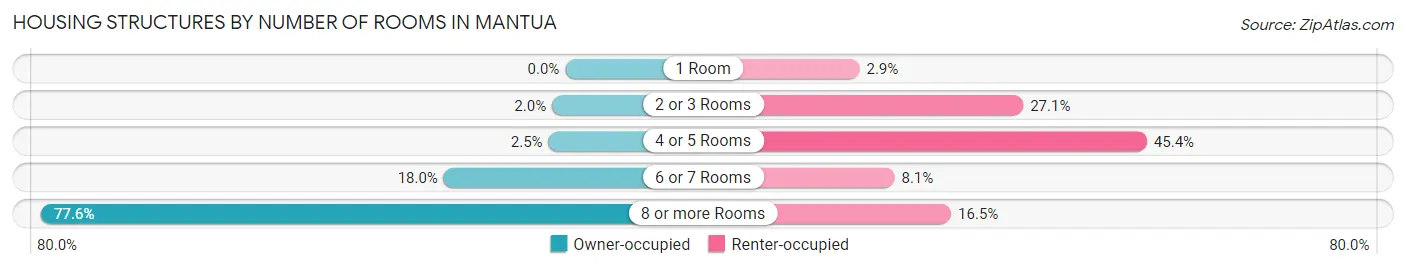
| Number of Rooms | Owner-occupied | Renter-occupied |
| 1 Room | 0 (0.0%) | 19 (2.9%) |
| 2 or 3 Rooms | 38 (2.0%) | 178 (27.1%) |
| 4 or 5 Rooms | 48 (2.5%) | 298 (45.4%) |
| 6 or 7 Rooms | 348 (18.0%) | 53 (8.1%) |
| 8 or more Rooms | 1,501 (77.6%) | 108 (16.5%) |
| Total | 1,935 (100.0%) | 656 (100.0%) |
Housing Structure by Heating Type in Mantua
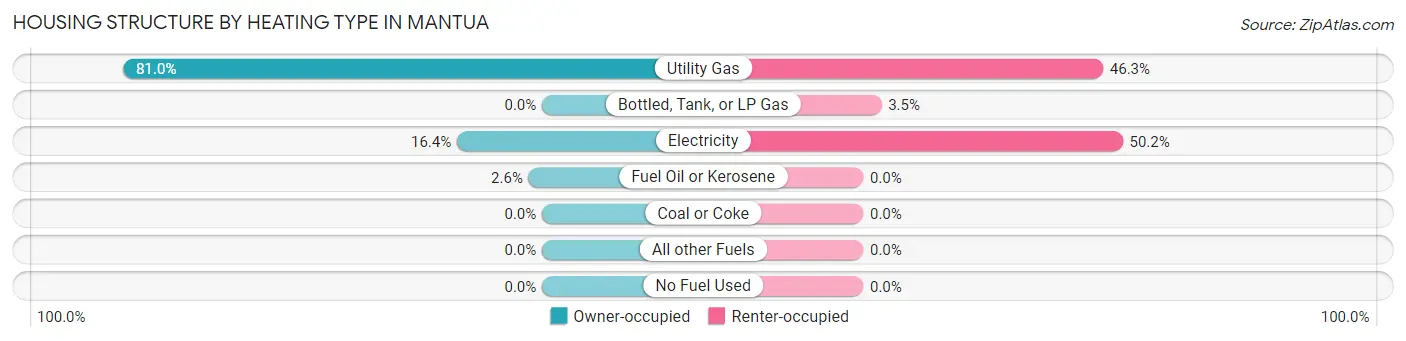
| Heating Type | Owner-occupied | Renter-occupied |
| Utility Gas | 1,567 (81.0%) | 304 (46.3%) |
| Bottled, Tank, or LP Gas | 0 (0.0%) | 23 (3.5%) |
| Electricity | 318 (16.4%) | 329 (50.1%) |
| Fuel Oil or Kerosene | 50 (2.6%) | 0 (0.0%) |
| Coal or Coke | 0 (0.0%) | 0 (0.0%) |
| All other Fuels | 0 (0.0%) | 0 (0.0%) |
| No Fuel Used | 0 (0.0%) | 0 (0.0%) |
| Total | 1,935 (100.0%) | 656 (100.0%) |
Household Vehicle Usage in Mantua
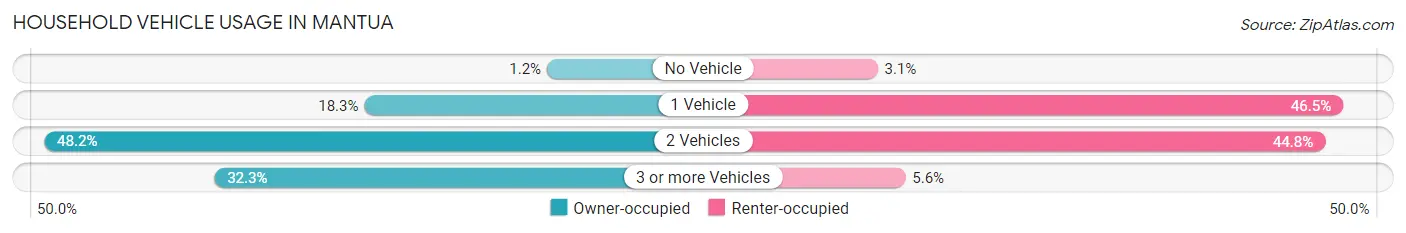
| Vehicles per Household | Owner-occupied | Renter-occupied |
| No Vehicle | 24 (1.2%) | 20 (3.0%) |
| 1 Vehicle | 354 (18.3%) | 305 (46.5%) |
| 2 Vehicles | 932 (48.2%) | 294 (44.8%) |
| 3 or more Vehicles | 625 (32.3%) | 37 (5.6%) |
| Total | 1,935 (100.0%) | 656 (100.0%) |
Real Estate & Mortgages in Mantua
Real Estate and Mortgage Overview in Mantua
| Characteristic | Without Mortgage | With Mortgage |
| Housing Units | 541 | 1,394 |
| Median Property Value | $867,300 | $900,900 |
| Median Household Income | $176,420 | $1,196 |
| Monthly Housing Costs | $1,111 | $1,046 |
| Real Estate Taxes | $9,372 | $0 |
Property Value by Mortgage Status in Mantua
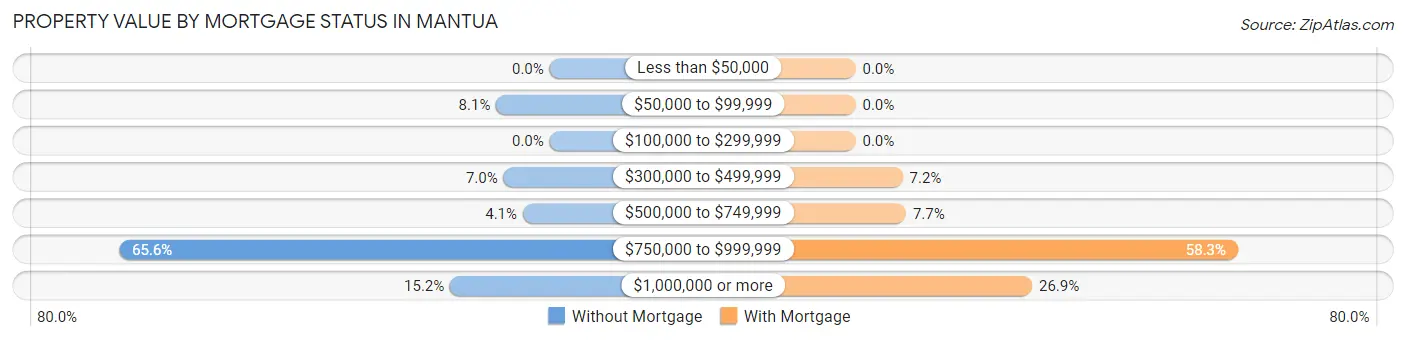
| Property Value | Without Mortgage | With Mortgage |
| Less than $50,000 | 0 (0.0%) | 0 (0.0%) |
| $50,000 to $99,999 | 44 (8.1%) | 0 (0.0%) |
| $100,000 to $299,999 | 0 (0.0%) | 0 (0.0%) |
| $300,000 to $499,999 | 38 (7.0%) | 100 (7.2%) |
| $500,000 to $749,999 | 22 (4.1%) | 107 (7.7%) |
| $750,000 to $999,999 | 355 (65.6%) | 812 (58.3%) |
| $1,000,000 or more | 82 (15.2%) | 375 (26.9%) |
| Total | 541 (100.0%) | 1,394 (100.0%) |
Household Income by Mortgage Status in Mantua
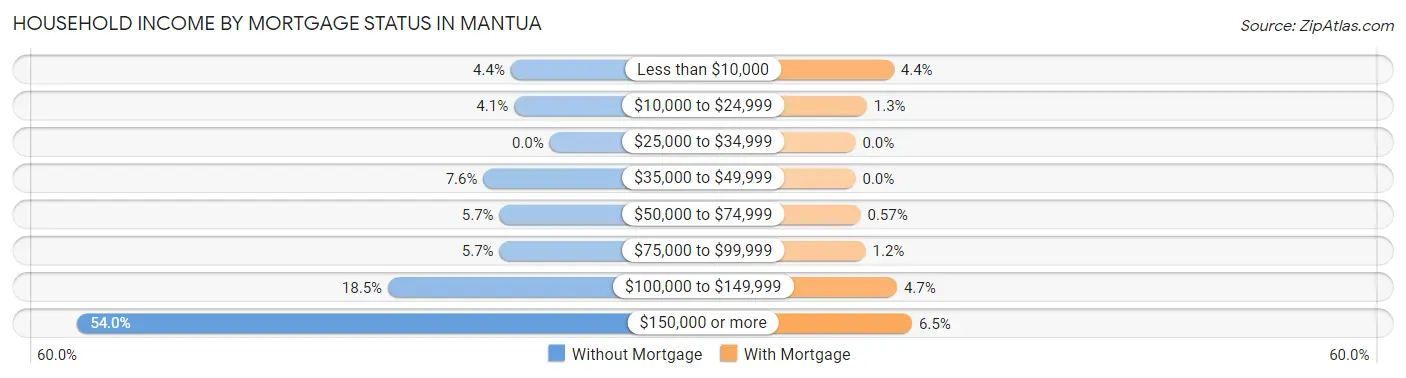
| Household Income | Without Mortgage | With Mortgage |
| Less than $10,000 | 24 (4.4%) | 61 (4.4%) |
| $10,000 to $24,999 | 22 (4.1%) | 18 (1.3%) |
| $25,000 to $34,999 | 0 (0.0%) | 0 (0.0%) |
| $35,000 to $49,999 | 41 (7.6%) | 0 (0.0%) |
| $50,000 to $74,999 | 31 (5.7%) | 8 (0.6%) |
| $75,000 to $99,999 | 31 (5.7%) | 16 (1.1%) |
| $100,000 to $149,999 | 100 (18.5%) | 66 (4.7%) |
| $150,000 or more | 292 (54.0%) | 90 (6.5%) |
| Total | 541 (100.0%) | 1,394 (100.0%) |
Property Value to Household Income Ratio in Mantua
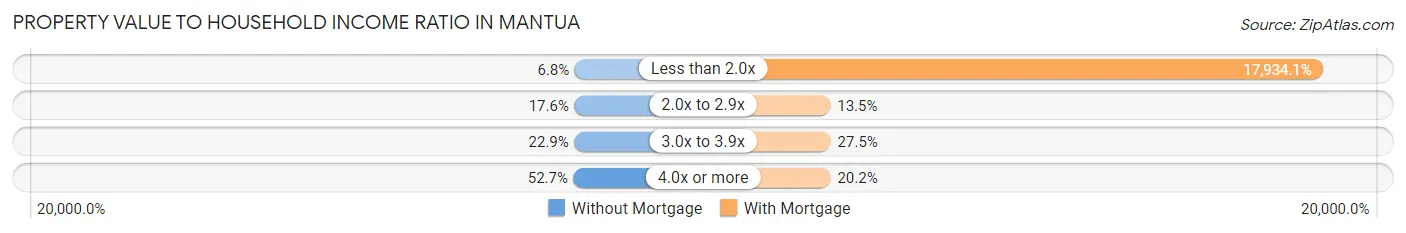
| Value-to-Income Ratio | Without Mortgage | With Mortgage |
| Less than 2.0x | 37 (6.8%) | 250,001 (17,934.1%) |
| 2.0x to 2.9x | 95 (17.6%) | 188 (13.5%) |
| 3.0x to 3.9x | 124 (22.9%) | 383 (27.5%) |
| 4.0x or more | 285 (52.7%) | 282 (20.2%) |
| Total | 541 (100.0%) | 1,394 (100.0%) |
Real Estate Taxes by Mortgage Status in Mantua
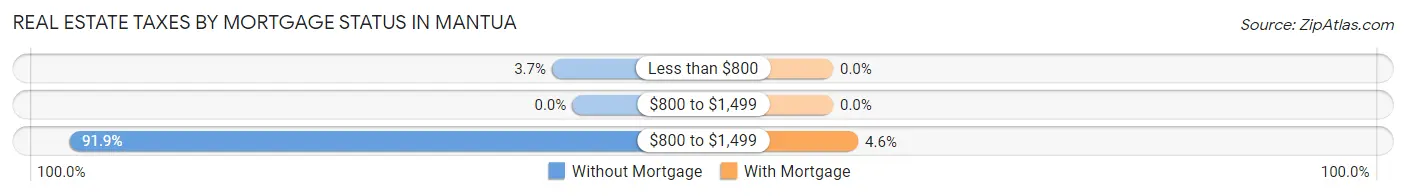
| Property Taxes | Without Mortgage | With Mortgage |
| Less than $800 | 20 (3.7%) | 0 (0.0%) |
| $800 to $1,499 | 0 (0.0%) | 0 (0.0%) |
| $800 to $1,499 | 497 (91.9%) | 64 (4.6%) |
| Total | 541 (100.0%) | 1,394 (100.0%) |
Health & Disability in Mantua
Health Insurance Coverage by Age in Mantua
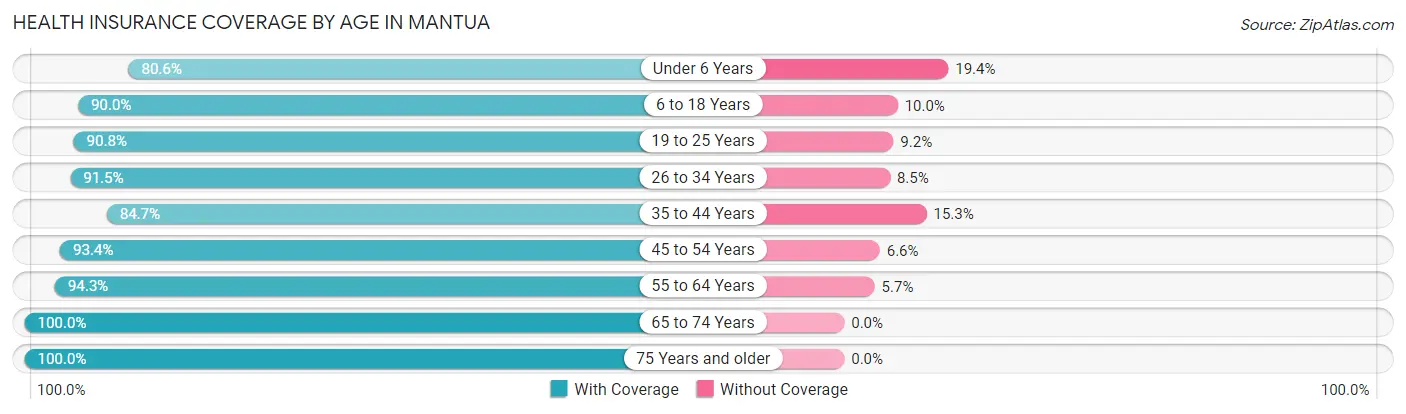
| Age Bracket | With Coverage | Without Coverage |
| Under 6 Years | 557 (80.6%) | 134 (19.4%) |
| 6 to 18 Years | 1,266 (90.0%) | 140 (10.0%) |
| 19 to 25 Years | 506 (90.8%) | 51 (9.2%) |
| 26 to 34 Years | 408 (91.5%) | 38 (8.5%) |
| 35 to 44 Years | 861 (84.7%) | 156 (15.3%) |
| 45 to 54 Years | 1,029 (93.4%) | 73 (6.6%) |
| 55 to 64 Years | 1,100 (94.3%) | 66 (5.7%) |
| 65 to 74 Years | 602 (100.0%) | 0 (0.0%) |
| 75 Years and older | 442 (100.0%) | 0 (0.0%) |
| Total | 6,771 (91.1%) | 658 (8.9%) |
Health Insurance Coverage by Citizenship Status in Mantua
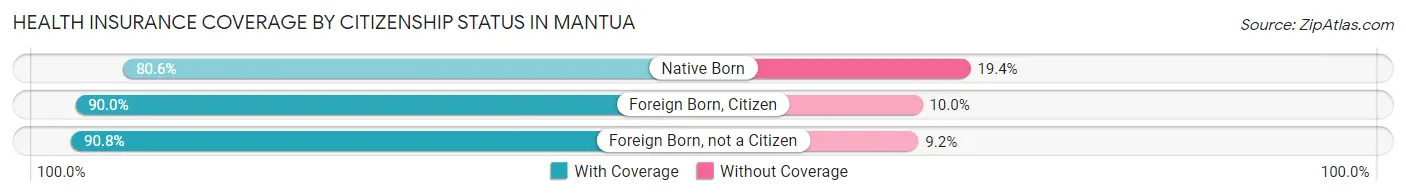
| Citizenship Status | With Coverage | Without Coverage |
| Native Born | 557 (80.6%) | 134 (19.4%) |
| Foreign Born, Citizen | 1,266 (90.0%) | 140 (10.0%) |
| Foreign Born, not a Citizen | 506 (90.8%) | 51 (9.2%) |
Health Insurance Coverage by Household Income in Mantua
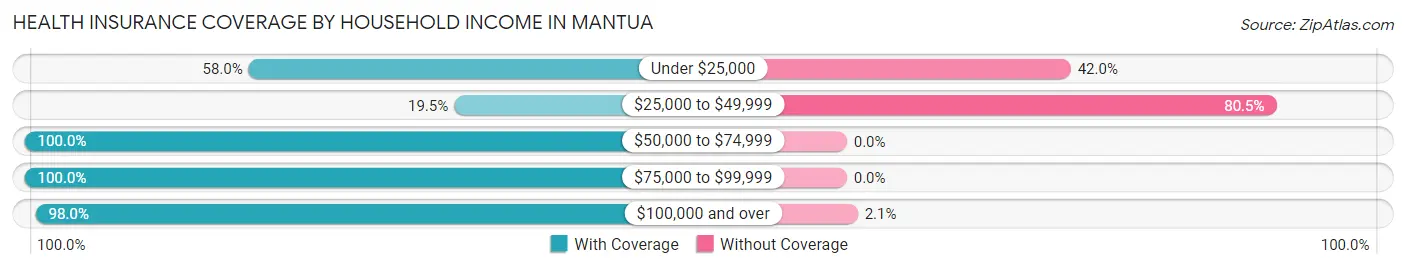
| Household Income | With Coverage | Without Coverage |
| Under $25,000 | 148 (58.0%) | 107 (42.0%) |
| $25,000 to $49,999 | 103 (19.5%) | 424 (80.5%) |
| $50,000 to $74,999 | 184 (100.0%) | 0 (0.0%) |
| $75,000 to $99,999 | 254 (100.0%) | 0 (0.0%) |
| $100,000 and over | 6,073 (98.0%) | 127 (2.1%) |
Public vs Private Health Insurance Coverage by Age in Mantua
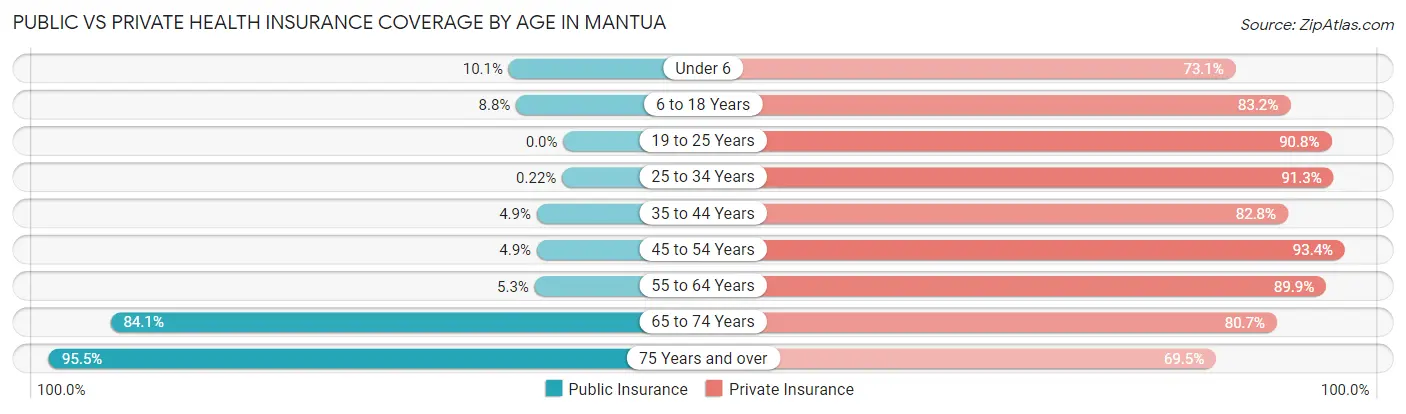
| Age Bracket | Public Insurance | Private Insurance |
| Under 6 | 70 (10.1%) | 505 (73.1%) |
| 6 to 18 Years | 123 (8.7%) | 1,170 (83.2%) |
| 19 to 25 Years | 0 (0.0%) | 506 (90.8%) |
| 25 to 34 Years | 1 (0.2%) | 407 (91.3%) |
| 35 to 44 Years | 50 (4.9%) | 842 (82.8%) |
| 45 to 54 Years | 54 (4.9%) | 1,029 (93.4%) |
| 55 to 64 Years | 62 (5.3%) | 1,048 (89.9%) |
| 65 to 74 Years | 506 (84.1%) | 486 (80.7%) |
| 75 Years and over | 422 (95.5%) | 307 (69.5%) |
| Total | 1,288 (17.3%) | 6,300 (84.8%) |
Disability Status by Sex by Age in Mantua
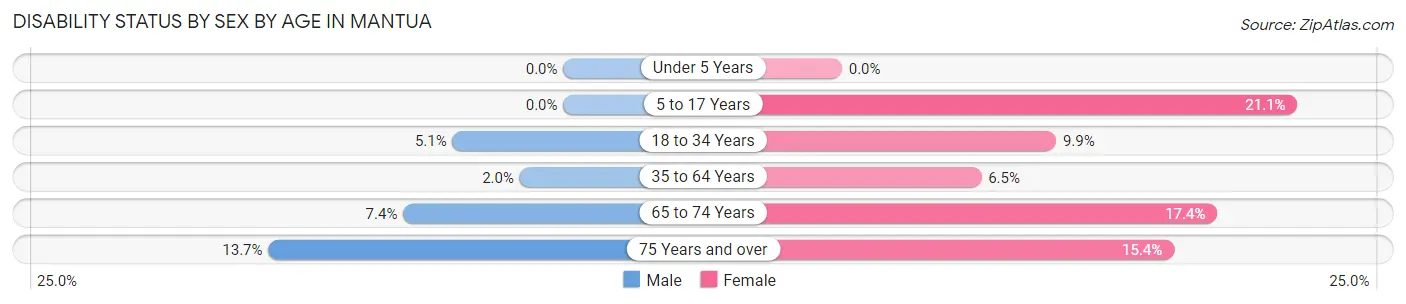
| Age Bracket | Male | Female |
| Under 5 Years | 0 (0.0%) | 0 (0.0%) |
| 5 to 17 Years | 0 (0.0%) | 174 (21.1%) |
| 18 to 34 Years | 35 (5.1%) | 46 (9.9%) |
| 35 to 64 Years | 33 (2.0%) | 107 (6.5%) |
| 65 to 74 Years | 20 (7.4%) | 58 (17.4%) |
| 75 Years and over | 33 (13.7%) | 31 (15.4%) |
Disability Class by Sex by Age in Mantua
Disability Class: Hearing Difficulty
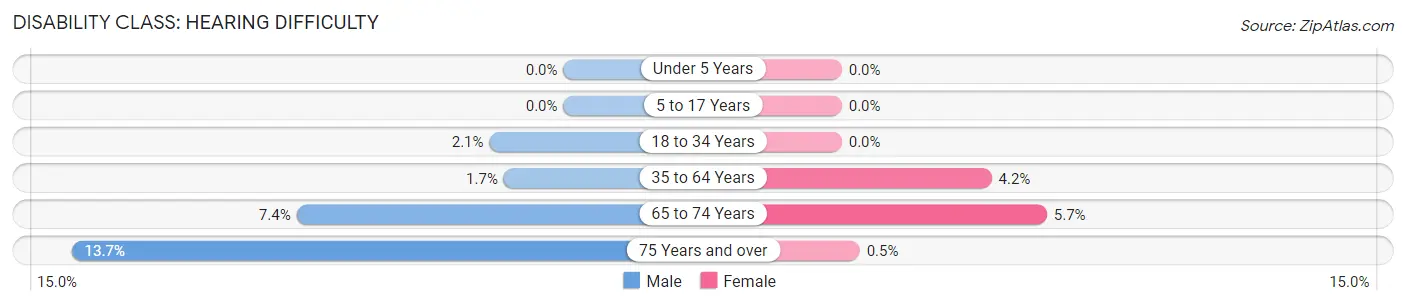
| Age Bracket | Male | Female |
| Under 5 Years | 0 (0.0%) | 0 (0.0%) |
| 5 to 17 Years | 0 (0.0%) | 0 (0.0%) |
| 18 to 34 Years | 14 (2.1%) | 0 (0.0%) |
| 35 to 64 Years | 27 (1.7%) | 69 (4.2%) |
| 65 to 74 Years | 20 (7.4%) | 19 (5.7%) |
| 75 Years and over | 33 (13.7%) | 1 (0.5%) |
Disability Class: Vision Difficulty
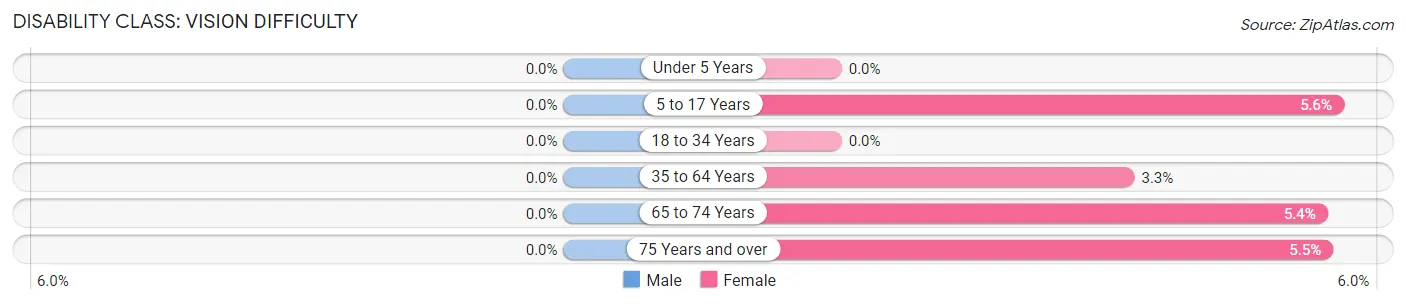
| Age Bracket | Male | Female |
| Under 5 Years | 0 (0.0%) | 0 (0.0%) |
| 5 to 17 Years | 0 (0.0%) | 46 (5.6%) |
| 18 to 34 Years | 0 (0.0%) | 0 (0.0%) |
| 35 to 64 Years | 0 (0.0%) | 54 (3.3%) |
| 65 to 74 Years | 0 (0.0%) | 18 (5.4%) |
| 75 Years and over | 0 (0.0%) | 11 (5.5%) |
Disability Class: Cognitive Difficulty
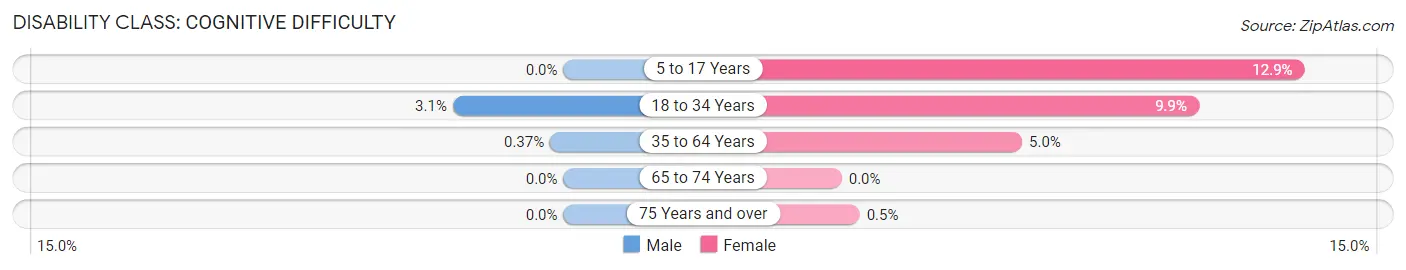
| Age Bracket | Male | Female |
| 5 to 17 Years | 0 (0.0%) | 106 (12.9%) |
| 18 to 34 Years | 21 (3.1%) | 46 (9.9%) |
| 35 to 64 Years | 6 (0.4%) | 83 (5.0%) |
| 65 to 74 Years | 0 (0.0%) | 0 (0.0%) |
| 75 Years and over | 0 (0.0%) | 1 (0.5%) |
Disability Class: Ambulatory Difficulty
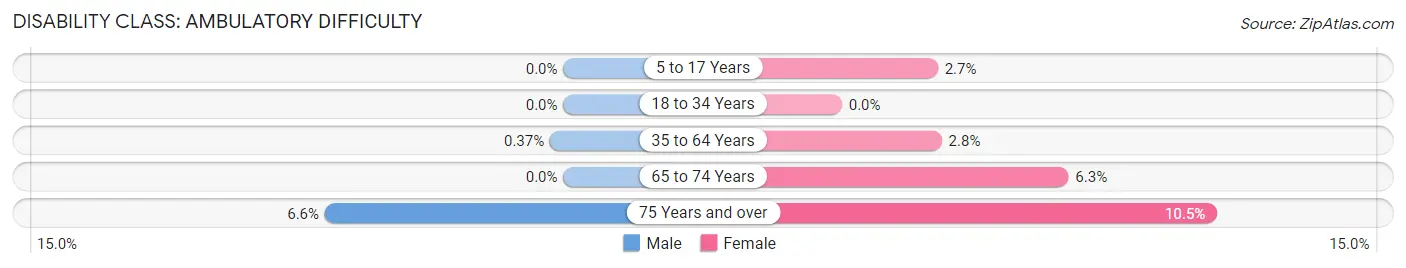
| Age Bracket | Male | Female |
| 5 to 17 Years | 0 (0.0%) | 22 (2.7%) |
| 18 to 34 Years | 0 (0.0%) | 0 (0.0%) |
| 35 to 64 Years | 6 (0.4%) | 46 (2.8%) |
| 65 to 74 Years | 0 (0.0%) | 21 (6.3%) |
| 75 Years and over | 16 (6.6%) | 21 (10.4%) |
Disability Class: Self-Care Difficulty
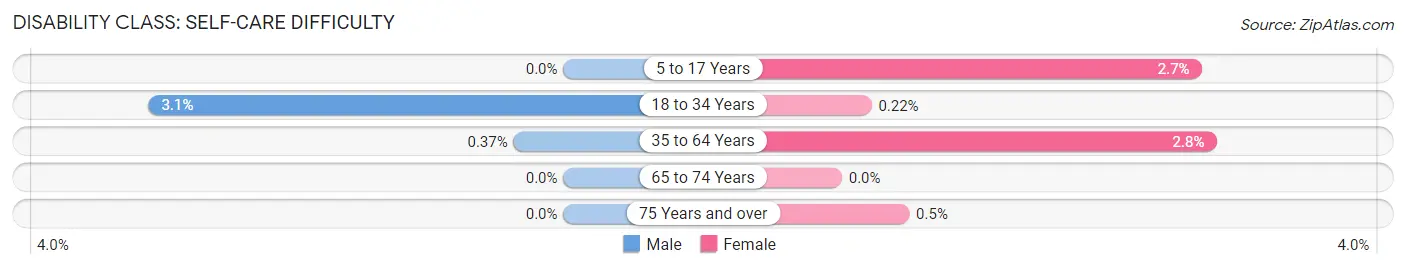
| Age Bracket | Male | Female |
| 5 to 17 Years | 0 (0.0%) | 22 (2.7%) |
| 18 to 34 Years | 21 (3.1%) | 1 (0.2%) |
| 35 to 64 Years | 6 (0.4%) | 46 (2.8%) |
| 65 to 74 Years | 0 (0.0%) | 0 (0.0%) |
| 75 Years and over | 0 (0.0%) | 1 (0.5%) |
Technology Access in Mantua
Computing Device Access in Mantua
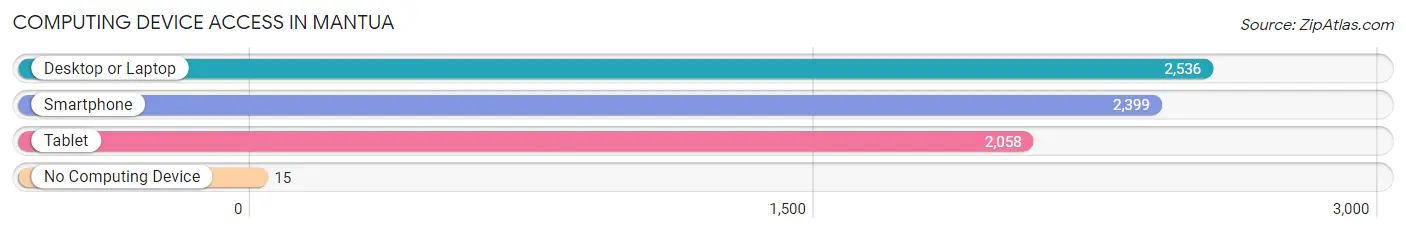
| Device Type | # Households | % Households |
| Desktop or Laptop | 2,536 | 97.9% |
| Smartphone | 2,399 | 92.6% |
| Tablet | 2,058 | 79.4% |
| No Computing Device | 15 | 0.6% |
| Total | 2,591 | 100.0% |
Internet Access in Mantua
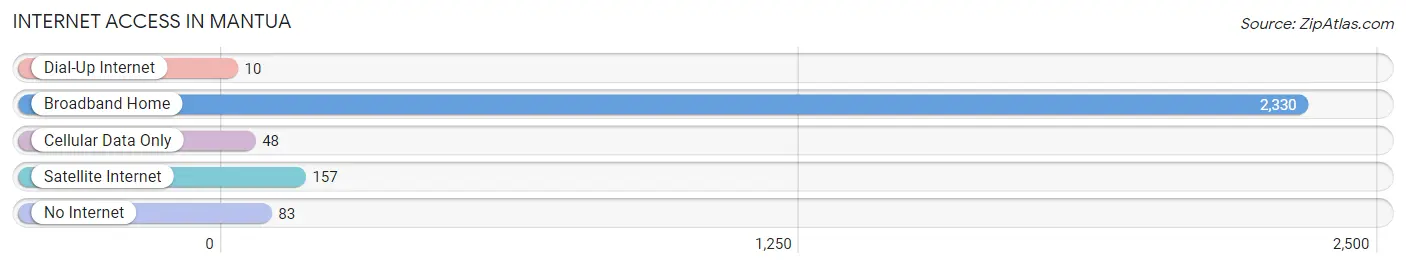
| Internet Type | # Households | % Households |
| Dial-Up Internet | 10 | 0.4% |
| Broadband Home | 2,330 | 89.9% |
| Cellular Data Only | 48 | 1.8% |
| Satellite Internet | 157 | 6.1% |
| No Internet | 83 | 3.2% |
| Total | 2,591 | 100.0% |
Mantua Summary
Mantua, Virginia is a small town located in Prince William County, Virginia. It is situated on the banks of the Occoquan River, about 25 miles southwest of Washington, D.C. The town has a population of approximately 1,000 people and is part of the Washington metropolitan area.
History
Mantua was first settled in the early 1700s by English settlers. The town was originally known as “Mantua”, which is derived from the Latin word for “mantle”. The town was officially incorporated in 1810.
During the Civil War, Mantua was a strategic location for the Confederate Army. The town was the site of several battles, including the Battle of Bristoe Station in 1863. After the war, the town was rebuilt and the economy began to recover.
In the late 19th century, Mantua became a popular summer resort destination for wealthy Washingtonians. The town was known for its beautiful scenery and its proximity to the Occoquan River.
Geography
Mantua is located in Prince William County, Virginia. The town is situated on the banks of the Occoquan River, about 25 miles southwest of Washington, D.C. The town is surrounded by rolling hills and wooded areas.
The climate in Mantua is humid subtropical, with hot, humid summers and mild winters. The average annual temperature is around 60 degrees Fahrenheit.
Economy
Mantua’s economy is largely based on tourism and agriculture. The town is home to several wineries, as well as a number of small businesses. The town also has a small manufacturing sector, which produces a variety of products, including furniture and clothing.
Demographics
As of the 2010 census, Mantua had a population of 1,000 people. The racial makeup of the town was 87.2% White, 8.2% African American, 0.7% Asian, and 3.9% from other races. The median household income was $50,000, and the median age was 37.
Mantua is a small, close-knit community. The town is home to a variety of churches, including Baptist, Methodist, and Episcopal. The town also has a number of parks and recreational facilities, including a public pool and a golf course.
Mantua is a charming, historic town with a rich history and a vibrant economy. The town is a great place to live, work, and play, and is a popular destination for tourists and locals alike.
Common Questions
What is Per Capita Income in Mantua?
Per Capita income in Mantua is $79,318.
What is the Median Family Income in Mantua?
Median Family Income in Mantua is $233,145.
What is the Median Household income in Mantua?
Median Household Income in Mantua is $196,726.
What is Income or Wage Gap in Mantua?
Income or Wage Gap in Mantua is 47.3%.
Women in Mantua earn 52.7 cents for every dollar earned by a man.
What is Inequality or Gini Index in Mantua?
Inequality or Gini Index in Mantua is 0.37.
What is the Total Population of Mantua?
Total Population of Mantua is 7,531.
What is the Total Male Population of Mantua?
Total Male Population of Mantua is 3,756.
What is the Total Female Population of Mantua?
Total Female Population of Mantua is 3,775.
What is the Ratio of Males per 100 Females in Mantua?
There are 99.50 Males per 100 Females in Mantua.
What is the Ratio of Females per 100 Males in Mantua?
There are 100.51 Females per 100 Males in Mantua.
What is the Median Population Age in Mantua?
Median Population Age in Mantua is 40.3 Years.
What is the Average Family Size in Mantua
Average Family Size in Mantua is 3.2 People.
What is the Average Household Size in Mantua
Average Household Size in Mantua is 2.9 People.
How Large is the Labor Force in Mantua?
There are 3,945 People in the Labor Forcein in Mantua.
What is the Percentage of People in the Labor Force in Mantua?
68.8% of People are in the Labor Force in Mantua.
What is the Unemployment Rate in Mantua?
Unemployment Rate in Mantua is 4.7%.