South Riding, VA Map & Demographics
South Riding Map
South Riding Overview
$69,632
PER CAPITA INCOME
$192,654
AVG FAMILY INCOME
$183,056
AVG HOUSEHOLD INCOME
46.8%
WAGE / INCOME GAP [ % ]
53.2¢/ $1
WAGE / INCOME GAP [ $ ]
0.36
INEQUALITY / GINI INDEX
33,358
TOTAL POPULATION
17,060
MALE POPULATION
16,298
FEMALE POPULATION
104.68
MALES / 100 FEMALES
95.53
FEMALES / 100 MALES
37.4
MEDIAN AGE
3.4
AVG FAMILY SIZE
3.2
AVG HOUSEHOLD SIZE
19,520
LABOR FORCE [ PEOPLE ]
79.6%
PERCENT IN LABOR FORCE
4.3%
UNEMPLOYMENT RATE
Income in South Riding
Income Overview in South Riding
Per Capita Income in South Riding is $69,632, while median incomes of families and households are $192,654 and $183,056 respectively.
| Characteristic | Number | Measure |
| Per Capita Income | 33,358 | $69,632 |
| Median Family Income | 9,017 | $192,654 |
| Mean Family Income | 9,017 | $224,317 |
| Median Household Income | 10,410 | $183,056 |
| Mean Household Income | 10,410 | $215,953 |
| Income Deficit | 9,017 | $0 |
| Wage / Income Gap (%) | 33,358 | 46.83% |
| Wage / Income Gap ($) | 33,358 | 53.17¢ per $1 |
| Gini / Inequality Index | 33,358 | 0.36 |
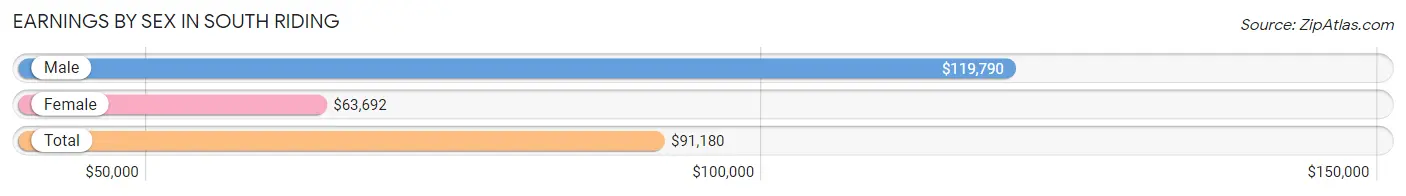
Earnings by Sex in South Riding
Average Earnings in South Riding are $91,180, $119,790 for men and $63,692 for women, a difference of 46.8%.
| Sex | Number | Average Earnings |
| Male | 10,698 (53.5%) | $119,790 |
| Female | 9,290 (46.5%) | $63,692 |
| Total | 19,988 (100.0%) | $91,180 |
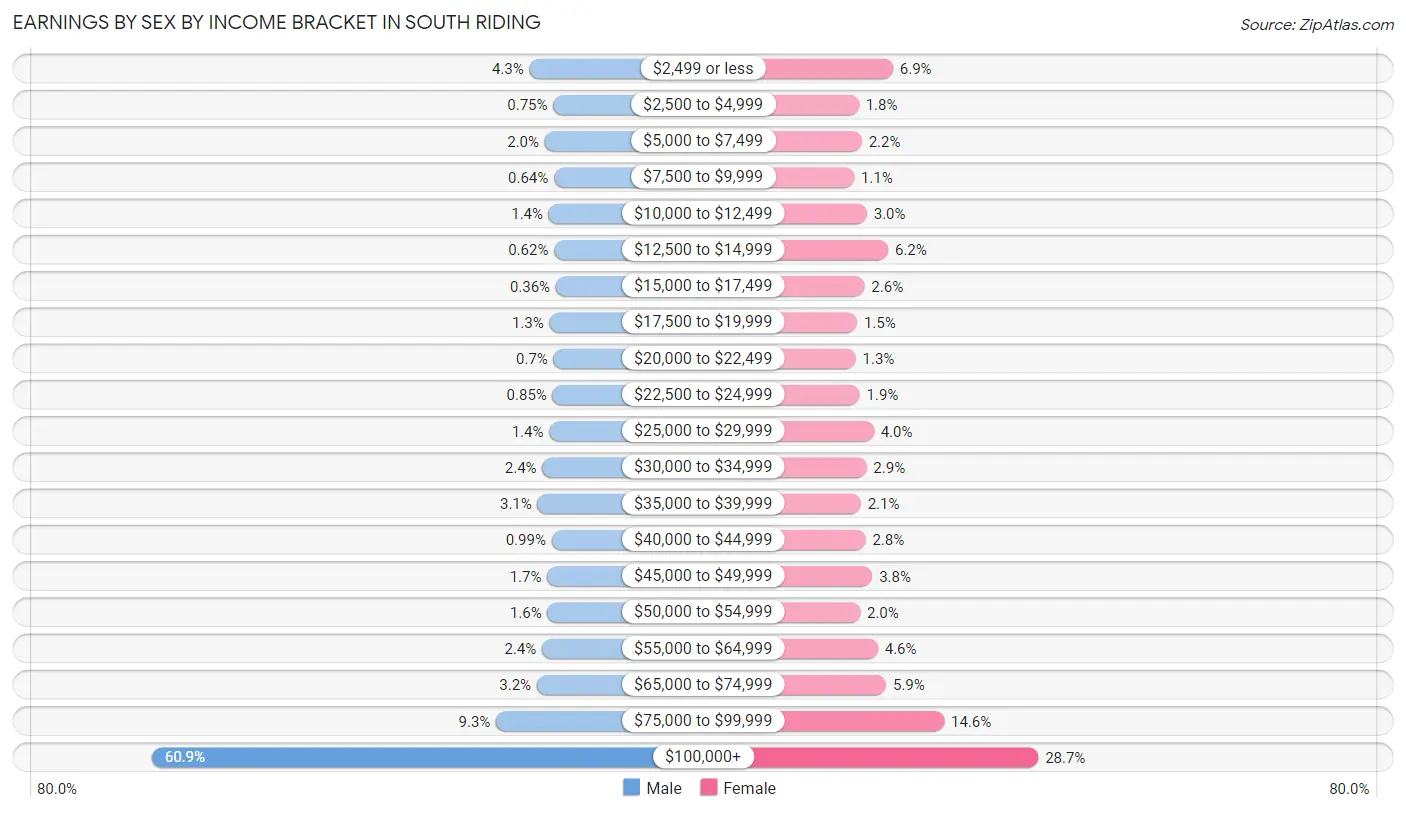
Earnings by Sex by Income Bracket in South Riding
The most common earnings brackets in South Riding are $100,000+ for men (6,518 | 60.9%) and $100,000+ for women (2,665 | 28.7%).
| Income | Male | Female |
| $2,499 or less | 462 (4.3%) | 641 (6.9%) |
| $2,500 to $4,999 | 80 (0.7%) | 165 (1.8%) |
| $5,000 to $7,499 | 216 (2.0%) | 208 (2.2%) |
| $7,500 to $9,999 | 68 (0.6%) | 99 (1.1%) |
| $10,000 to $12,499 | 152 (1.4%) | 279 (3.0%) |
| $12,500 to $14,999 | 66 (0.6%) | 574 (6.2%) |
| $15,000 to $17,499 | 39 (0.4%) | 245 (2.6%) |
| $17,500 to $19,999 | 141 (1.3%) | 142 (1.5%) |
| $20,000 to $22,499 | 75 (0.7%) | 123 (1.3%) |
| $22,500 to $24,999 | 91 (0.9%) | 178 (1.9%) |
| $25,000 to $29,999 | 144 (1.3%) | 374 (4.0%) |
| $30,000 to $34,999 | 256 (2.4%) | 273 (2.9%) |
| $35,000 to $39,999 | 333 (3.1%) | 194 (2.1%) |
| $40,000 to $44,999 | 106 (1.0%) | 260 (2.8%) |
| $45,000 to $49,999 | 178 (1.7%) | 354 (3.8%) |
| $50,000 to $54,999 | 173 (1.6%) | 184 (2.0%) |
| $55,000 to $64,999 | 260 (2.4%) | 431 (4.6%) |
| $65,000 to $74,999 | 343 (3.2%) | 546 (5.9%) |
| $75,000 to $99,999 | 997 (9.3%) | 1,355 (14.6%) |
| $100,000+ | 6,518 (60.9%) | 2,665 (28.7%) |
| Total | 10,698 (100.0%) | 9,290 (100.0%) |
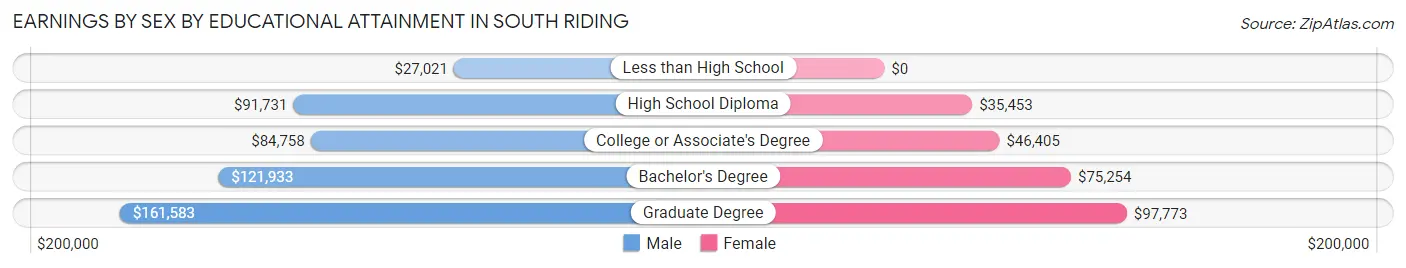
Earnings by Sex by Educational Attainment in South Riding
Average earnings in South Riding are $125,640 for men and $73,105 for women, a difference of 41.8%. Men with an educational attainment of graduate degree enjoy the highest average annual earnings of $161,583, while those with less than high school education earn the least with $27,021. Women with an educational attainment of graduate degree earn the most with the average annual earnings of $97,773, while those with high school diploma education have the smallest earnings of $35,453.
| Educational Attainment | Male Income | Female Income |
| Less than High School | $27,021 | $0 |
| High School Diploma | $91,731 | $35,453 |
| College or Associate's Degree | $84,758 | $46,405 |
| Bachelor's Degree | $121,933 | $75,254 |
| Graduate Degree | $161,583 | $97,773 |
| Total | $125,640 | $73,105 |
Family Income in South Riding
Family Income Brackets in South Riding
According to the South Riding family income data, there are 4,301 families falling into the $200,000+ income range, which is the most common income bracket and makes up 47.7% of all families. Conversely, the $10,000 to $14,999 income bracket is the least frequent group with only 9 families (0.1%) belonging to this category.
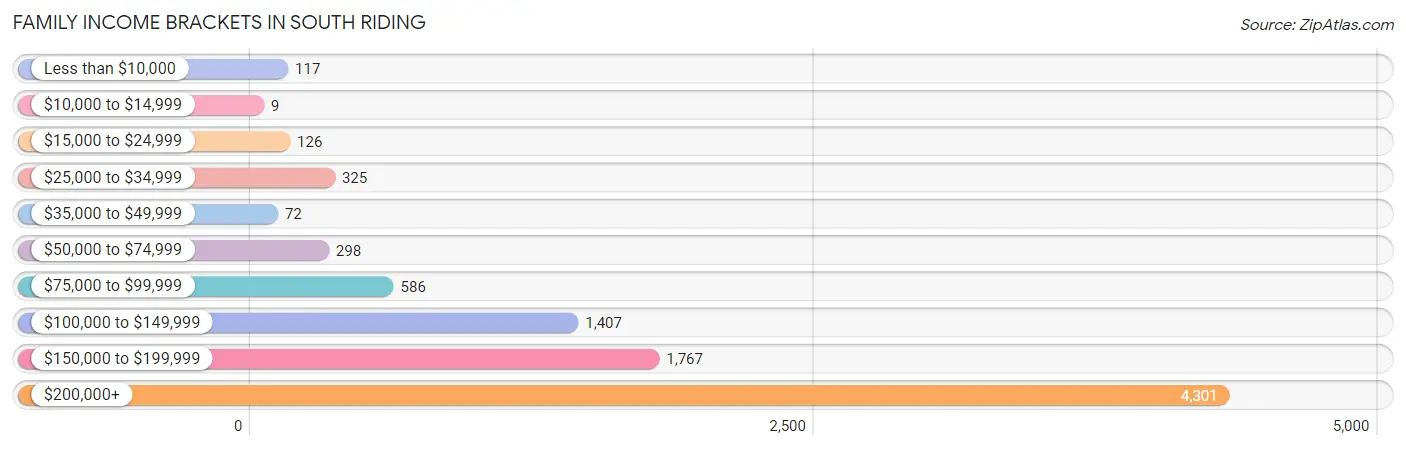
| Income Bracket | # Families | % Families |
| Less than $10,000 | 117 | 1.3% |
| $10,000 to $14,999 | 9 | 0.1% |
| $15,000 to $24,999 | 126 | 1.4% |
| $25,000 to $34,999 | 325 | 3.6% |
| $35,000 to $49,999 | 72 | 0.8% |
| $50,000 to $74,999 | 298 | 3.3% |
| $75,000 to $99,999 | 586 | 6.5% |
| $100,000 to $149,999 | 1,407 | 15.6% |
| $150,000 to $199,999 | 1,767 | 19.6% |
| $200,000+ | 4,301 | 47.7% |
Family Income by Famaliy Size in South Riding
6-person families (216 | 2.4%) account for the highest median family income in South Riding with $242,148 per family, while 2-person families (2,386 | 26.5%) have the highest median income of $91,810 per family member.
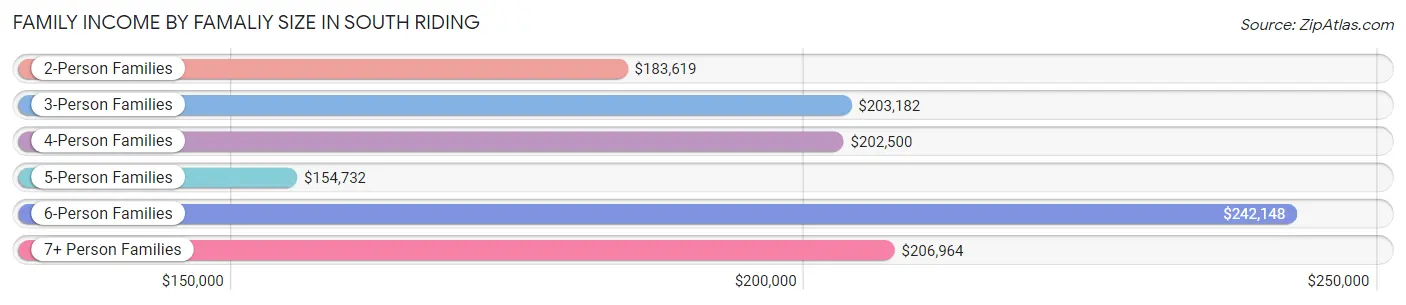
| Income Bracket | # Families | Median Income |
| 2-Person Families | 2,386 (26.5%) | $183,619 |
| 3-Person Families | 2,386 (26.5%) | $203,182 |
| 4-Person Families | 2,942 (32.6%) | $202,500 |
| 5-Person Families | 991 (11.0%) | $154,732 |
| 6-Person Families | 216 (2.4%) | $242,148 |
| 7+ Person Families | 96 (1.1%) | $206,964 |
| Total | 9,017 (100.0%) | $192,654 |
Family Income by Number of Earners in South Riding
The median family income in South Riding is $192,654, with families comprising 3+ earners (1,709) having the highest median family income of $250,001, while families with no earners (305) have the lowest median family income of $55,486, accounting for 19.0% and 3.4% of families, respectively.
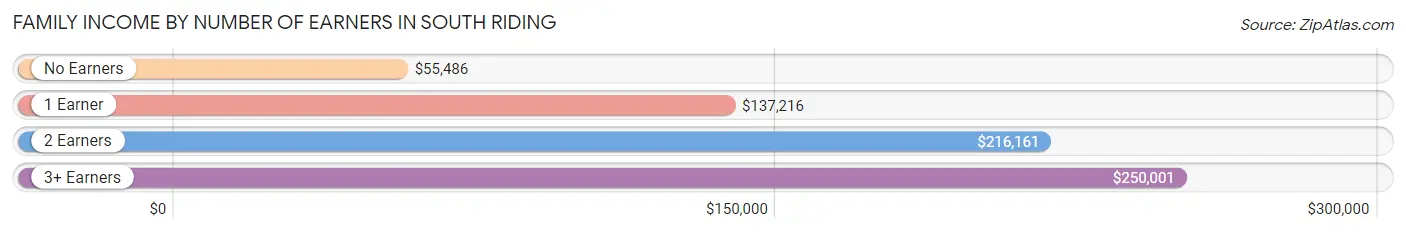
| Number of Earners | # Families | Median Income |
| No Earners | 305 (3.4%) | $55,486 |
| 1 Earner | 2,221 (24.6%) | $137,216 |
| 2 Earners | 4,782 (53.0%) | $216,161 |
| 3+ Earners | 1,709 (19.0%) | $250,001 |
| Total | 9,017 (100.0%) | $192,654 |
Household Income in South Riding
Household Income Brackets in South Riding
With 4,612 households falling in the category, the $200,000+ income range is the most frequent in South Riding, accounting for 44.3% of all households. In contrast, only 10 households (0.1%) fall into the $10,000 to $14,999 income bracket, making it the least populous group.
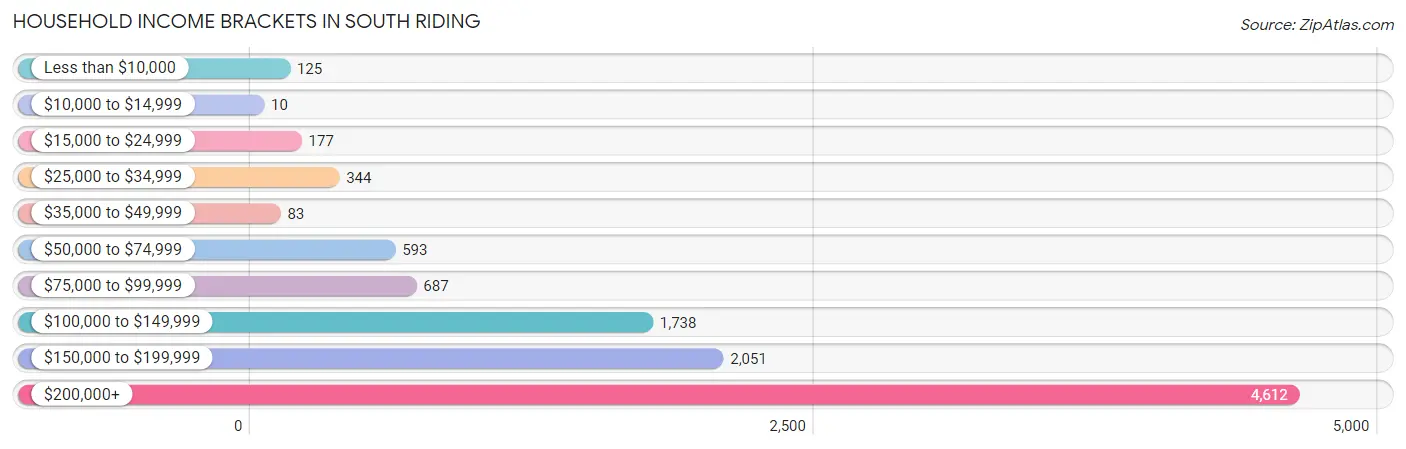
| Income Bracket | # Households | % Households |
| Less than $10,000 | 125 | 1.2% |
| $10,000 to $14,999 | 10 | 0.1% |
| $15,000 to $24,999 | 177 | 1.7% |
| $25,000 to $34,999 | 344 | 3.3% |
| $35,000 to $49,999 | 83 | 0.8% |
| $50,000 to $74,999 | 593 | 5.7% |
| $75,000 to $99,999 | 687 | 6.6% |
| $100,000 to $149,999 | 1,738 | 16.7% |
| $150,000 to $199,999 | 2,051 | 19.7% |
| $200,000+ | 4,612 | 44.3% |
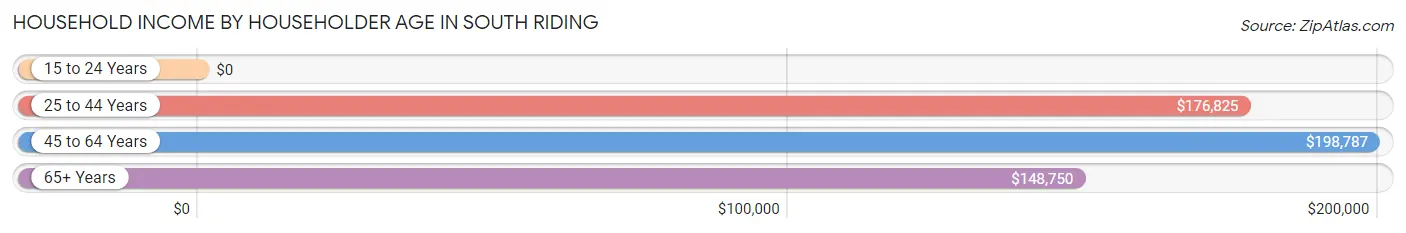
Household Income by Householder Age in South Riding
The median household income in South Riding is $183,056, with the highest median household income of $198,787 found in the 45 to 64 years age bracket for the primary householder. A total of 5,183 households (49.8%) fall into this category. Meanwhile, the 15 to 24 years age bracket for the primary householder has the lowest median household income of $0, with 14 households (0.1%) in this group.
| Income Bracket | # Households | Median Income |
| 15 to 24 Years | 14 (0.1%) | $0 |
| 25 to 44 Years | 4,439 (42.6%) | $176,825 |
| 45 to 64 Years | 5,183 (49.8%) | $198,787 |
| 65+ Years | 774 (7.4%) | $148,750 |
| Total | 10,410 (100.0%) | $183,056 |
Poverty in South Riding
Income Below Poverty by Sex and Age in South Riding
With 3.2% poverty level for males and 4.7% for females among the residents of South Riding, 6 to 11 year old males and 6 to 11 year old females are the most vulnerable to poverty, with 123 males (6.5%) and 192 females (12.2%) in their respective age groups living below the poverty level.
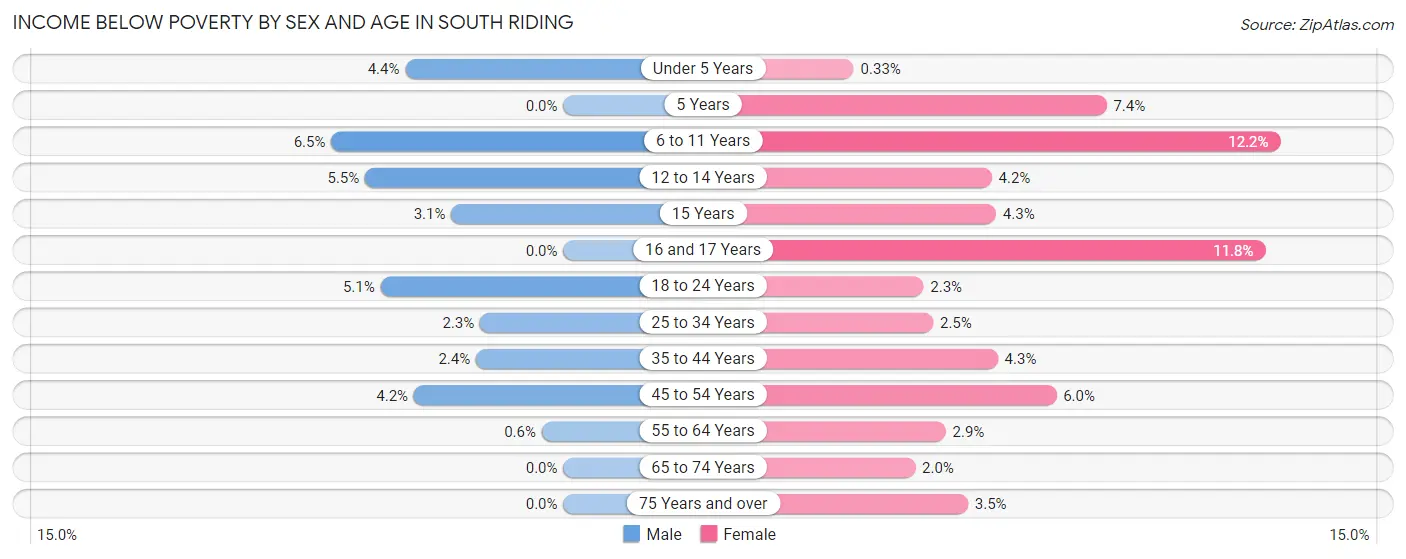
| Age Bracket | Male | Female |
| Under 5 Years | 31 (4.4%) | 4 (0.3%) |
| 5 Years | 0 (0.0%) | 14 (7.4%) |
| 6 to 11 Years | 123 (6.5%) | 192 (12.2%) |
| 12 to 14 Years | 66 (5.5%) | 37 (4.2%) |
| 15 Years | 10 (3.1%) | 12 (4.3%) |
| 16 and 17 Years | 0 (0.0%) | 52 (11.8%) |
| 18 to 24 Years | 46 (5.1%) | 27 (2.3%) |
| 25 to 34 Years | 36 (2.3%) | 49 (2.5%) |
| 35 to 44 Years | 82 (2.4%) | 147 (4.3%) |
| 45 to 54 Years | 144 (4.2%) | 160 (6.0%) |
| 55 to 64 Years | 10 (0.6%) | 46 (2.9%) |
| 65 to 74 Years | 0 (0.0%) | 12 (2.0%) |
| 75 Years and over | 0 (0.0%) | 11 (3.5%) |
| Total | 548 (3.2%) | 763 (4.7%) |
Income Above Poverty by Sex and Age in South Riding
According to the poverty statistics in South Riding, males aged 5 years and females aged under 5 years are the age groups that are most secure financially, with 100.0% of males and 99.7% of females in these age groups living above the poverty line.
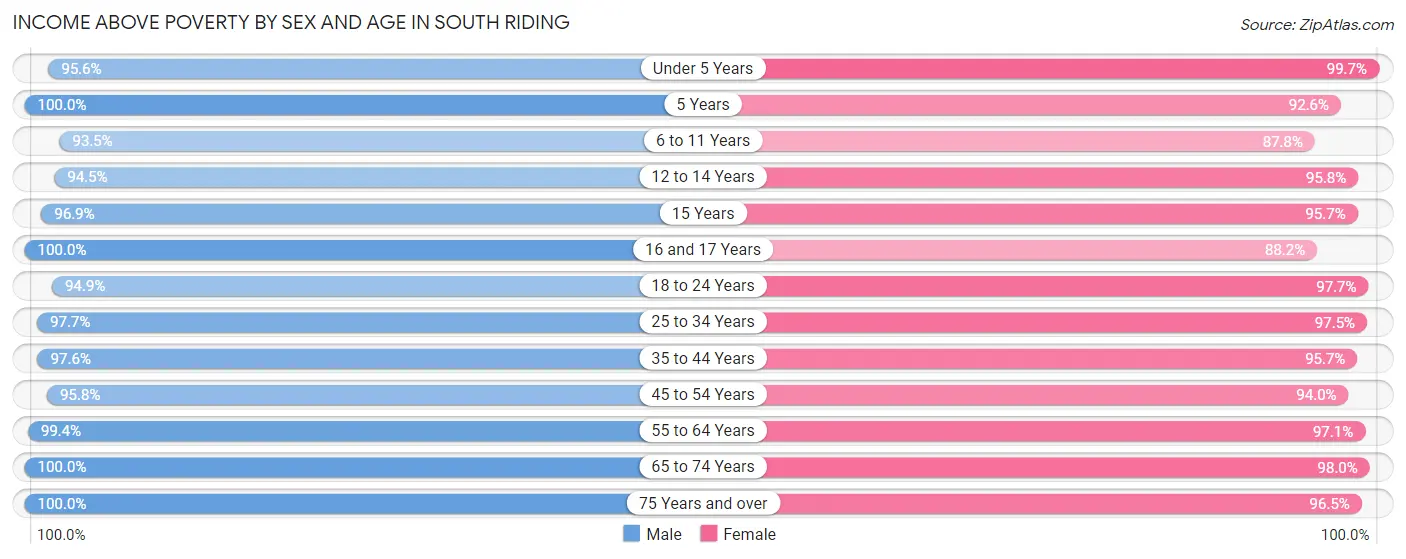
| Age Bracket | Male | Female |
| Under 5 Years | 673 (95.6%) | 1,220 (99.7%) |
| 5 Years | 390 (100.0%) | 176 (92.6%) |
| 6 to 11 Years | 1,782 (93.5%) | 1,381 (87.8%) |
| 12 to 14 Years | 1,129 (94.5%) | 851 (95.8%) |
| 15 Years | 311 (96.9%) | 268 (95.7%) |
| 16 and 17 Years | 558 (100.0%) | 389 (88.2%) |
| 18 to 24 Years | 858 (94.9%) | 1,164 (97.7%) |
| 25 to 34 Years | 1,516 (97.7%) | 1,881 (97.5%) |
| 35 to 44 Years | 3,290 (97.6%) | 3,240 (95.7%) |
| 45 to 54 Years | 3,315 (95.8%) | 2,522 (94.0%) |
| 55 to 64 Years | 1,658 (99.4%) | 1,544 (97.1%) |
| 65 to 74 Years | 612 (100.0%) | 575 (98.0%) |
| 75 Years and over | 276 (100.0%) | 302 (96.5%) |
| Total | 16,368 (96.8%) | 15,513 (95.3%) |
Income Below Poverty Among Married-Couple Families in South Riding
The poverty statistics for married-couple families in South Riding show that 2.4% or 185 of the total 7,802 families live below the poverty line. Families with 3 or 4 children have the highest poverty rate of 10.5%, comprising of 74 families. On the other hand, families with no children have the lowest poverty rate of 0.0%, which includes 0 families.
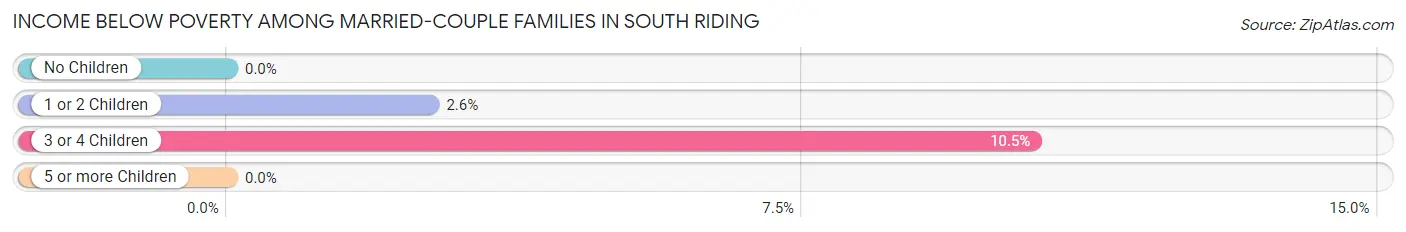
| Children | Above Poverty | Below Poverty |
| No Children | 2,862 (100.0%) | 0 (0.0%) |
| 1 or 2 Children | 4,110 (97.4%) | 111 (2.6%) |
| 3 or 4 Children | 631 (89.5%) | 74 (10.5%) |
| 5 or more Children | 14 (100.0%) | 0 (0.0%) |
| Total | 7,617 (97.6%) | 185 (2.4%) |
Income Below Poverty Among Single-Parent Households in South Riding
According to the poverty data in South Riding, 4.6% or 19 single-father households and 17.5% or 140 single-mother households are living below the poverty line. Among single-father households, those with 1 or 2 children have the highest poverty rate, with 19 households (6.8%) experiencing poverty. Likewise, among single-mother households, those with 1 or 2 children have the highest poverty rate, with 120 households (21.0%) falling below the poverty line.
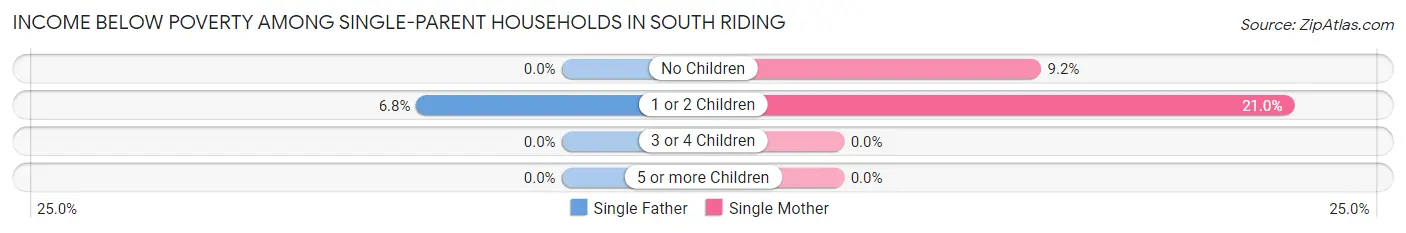
| Children | Single Father | Single Mother |
| No Children | 0 (0.0%) | 20 (9.2%) |
| 1 or 2 Children | 19 (6.8%) | 120 (21.0%) |
| 3 or 4 Children | 0 (0.0%) | 0 (0.0%) |
| 5 or more Children | 0 (0.0%) | 0 (0.0%) |
| Total | 19 (4.6%) | 140 (17.5%) |
Income Below Poverty Among Married-Couple vs Single-Parent Households in South Riding
The poverty data for South Riding shows that 185 of the married-couple family households (2.4%) and 159 of the single-parent households (13.1%) are living below the poverty level. Within the married-couple family households, those with 3 or 4 children have the highest poverty rate, with 74 households (10.5%) falling below the poverty line. Among the single-parent households, those with 1 or 2 children have the highest poverty rate, with 139 household (16.3%) living below poverty.
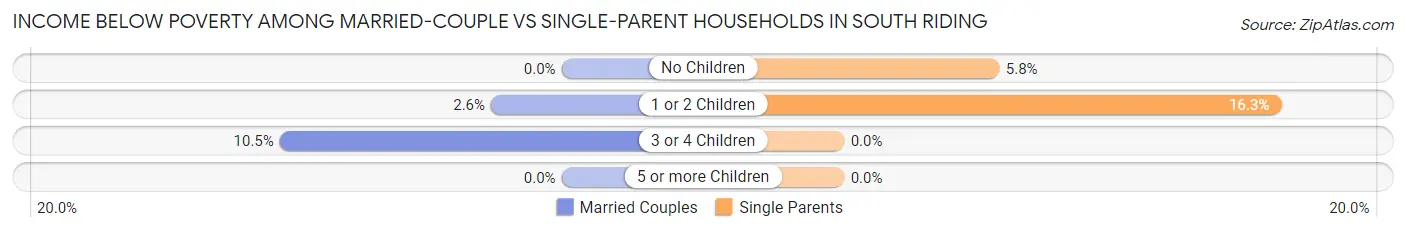
| Children | Married-Couple Families | Single-Parent Households |
| No Children | 0 (0.0%) | 20 (5.8%) |
| 1 or 2 Children | 111 (2.6%) | 139 (16.3%) |
| 3 or 4 Children | 74 (10.5%) | 0 (0.0%) |
| 5 or more Children | 0 (0.0%) | 0 (0.0%) |
| Total | 185 (2.4%) | 159 (13.1%) |
Race in South Riding
The most populous races in South Riding are White / Caucasian (14,239 | 42.7%), Asian (11,553 | 34.6%), and Black / African American (3,268 | 9.8%).
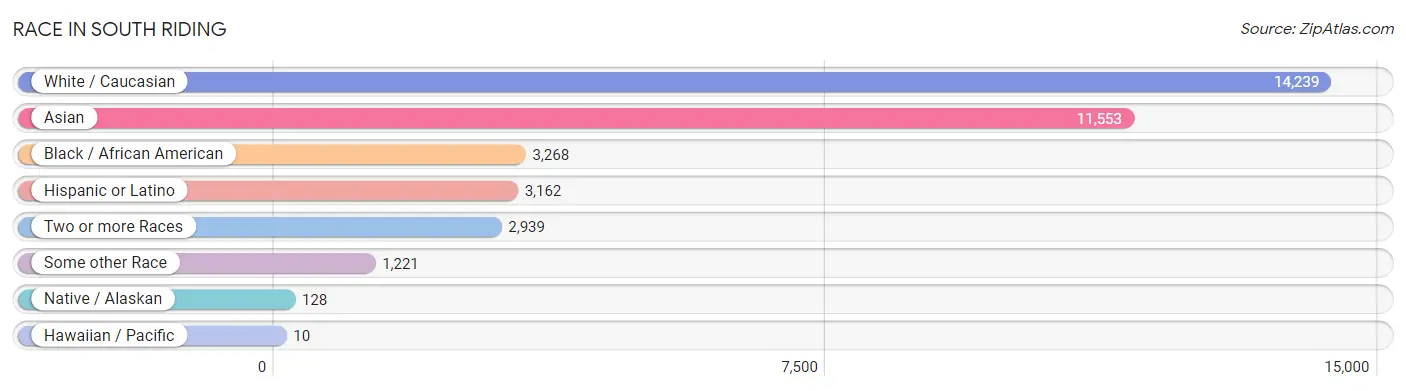
| Race | # Population | % Population |
| Asian | 11,553 | 34.6% |
| Black / African American | 3,268 | 9.8% |
| Hawaiian / Pacific | 10 | 0.0% |
| Hispanic or Latino | 3,162 | 9.5% |
| Native / Alaskan | 128 | 0.4% |
| White / Caucasian | 14,239 | 42.7% |
| Two or more Races | 2,939 | 8.8% |
| Some other Race | 1,221 | 3.7% |
| Total | 33,358 | 100.0% |
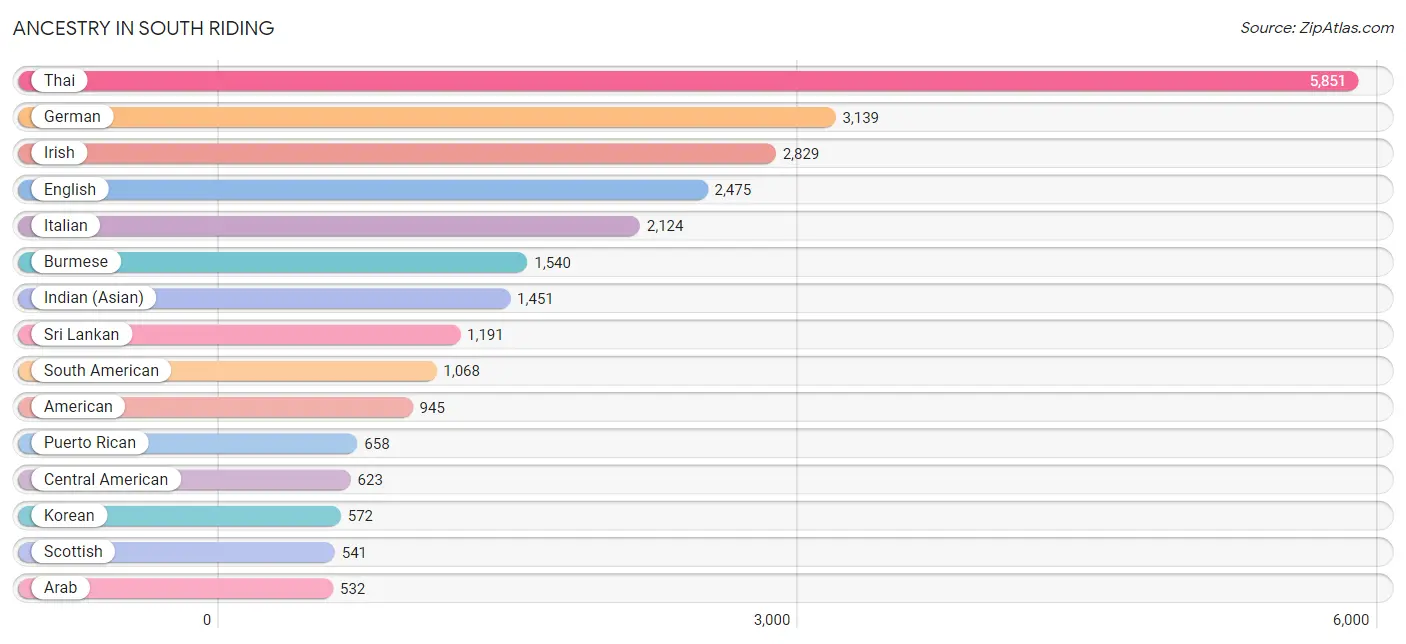
Ancestry in South Riding
The most populous ancestries reported in South Riding are Thai (5,851 | 17.5%), German (3,139 | 9.4%), Irish (2,829 | 8.5%), English (2,475 | 7.4%), and Italian (2,124 | 6.4%), together accounting for 49.2% of all South Riding residents.
| Ancestry | # Population | % Population |
| Afghan | 329 | 1.0% |
| African | 185 | 0.5% |
| American | 945 | 2.8% |
| Apache | 3 | 0.0% |
| Arab | 532 | 1.6% |
| Argentinean | 5 | 0.0% |
| Assyrian / Chaldean / Syriac | 33 | 0.1% |
| Austrian | 150 | 0.4% |
| Bahamian | 12 | 0.0% |
| Belgian | 54 | 0.2% |
| Bhutanese | 447 | 1.3% |
| Bolivian | 405 | 1.2% |
| Brazilian | 68 | 0.2% |
| British | 228 | 0.7% |
| Burmese | 1,540 | 4.6% |
| Cambodian | 18 | 0.1% |
| Canadian | 31 | 0.1% |
| Celtic | 21 | 0.1% |
| Central American | 623 | 1.9% |
| Central American Indian | 31 | 0.1% |
| Cherokee | 42 | 0.1% |
| Chilean | 9 | 0.0% |
| Colombian | 178 | 0.5% |
| Costa Rican | 42 | 0.1% |
| Creek | 10 | 0.0% |
| Croatian | 50 | 0.2% |
| Cuban | 102 | 0.3% |
| Czech | 204 | 0.6% |
| Danish | 106 | 0.3% |
| Dominican | 42 | 0.1% |
| Dutch | 263 | 0.8% |
| Eastern European | 86 | 0.3% |
| Egyptian | 68 | 0.2% |
| English | 2,475 | 7.4% |
| Ethiopian | 34 | 0.1% |
| European | 366 | 1.1% |
| Filipino | 145 | 0.4% |
| French | 444 | 1.3% |
| French Canadian | 126 | 0.4% |
| German | 3,139 | 9.4% |
| Ghanaian | 87 | 0.3% |
| Greek | 265 | 0.8% |
| Guamanian / Chamorro | 40 | 0.1% |
| Guatemalan | 132 | 0.4% |
| Honduran | 172 | 0.5% |
| Hungarian | 127 | 0.4% |
| Indian (Asian) | 1,451 | 4.3% |
| Indonesian | 49 | 0.2% |
| Iranian | 340 | 1.0% |
| Iraqi | 130 | 0.4% |
| Irish | 2,829 | 8.5% |
| Israeli | 15 | 0.0% |
| Italian | 2,124 | 6.4% |
| Japanese | 57 | 0.2% |
| Jordanian | 24 | 0.1% |
| Kenyan | 52 | 0.2% |
| Korean | 572 | 1.7% |
| Laotian | 78 | 0.2% |
| Lebanese | 24 | 0.1% |
| Lithuanian | 68 | 0.2% |
| Lumbee | 25 | 0.1% |
| Malaysian | 51 | 0.2% |
| Mexican | 432 | 1.3% |
| Moroccan | 41 | 0.1% |
| Native Hawaiian | 37 | 0.1% |
| Nicaraguan | 43 | 0.1% |
| Northern European | 113 | 0.3% |
| Norwegian | 143 | 0.4% |
| Pakistani | 91 | 0.3% |
| Panamanian | 80 | 0.2% |
| Pennsylvania German | 3 | 0.0% |
| Peruvian | 342 | 1.0% |
| Polish | 246 | 0.7% |
| Portuguese | 16 | 0.1% |
| Puerto Rican | 658 | 2.0% |
| Romanian | 39 | 0.1% |
| Russian | 116 | 0.4% |
| Salvadoran | 154 | 0.5% |
| Scandinavian | 23 | 0.1% |
| Scotch-Irish | 212 | 0.6% |
| Scottish | 541 | 1.6% |
| Serbian | 3 | 0.0% |
| Sierra Leonean | 51 | 0.2% |
| Slavic | 9 | 0.0% |
| Slovak | 153 | 0.5% |
| South African | 35 | 0.1% |
| South American | 1,068 | 3.2% |
| South American Indian | 130 | 0.4% |
| Spaniard | 73 | 0.2% |
| Spanish | 6 | 0.0% |
| Sri Lankan | 1,191 | 3.6% |
| Subsaharan African | 495 | 1.5% |
| Swedish | 199 | 0.6% |
| Swiss | 85 | 0.3% |
| Syrian | 200 | 0.6% |
| Thai | 5,851 | 17.5% |
| Tongan | 6 | 0.0% |
| Trinidadian and Tobagonian | 50 | 0.2% |
| Turkish | 261 | 0.8% |
| U.S. Virgin Islander | 10 | 0.0% |
| Ukrainian | 25 | 0.1% |
| Venezuelan | 129 | 0.4% |
| Vietnamese | 155 | 0.5% |
| Welsh | 240 | 0.7% |
| West Indian | 72 | 0.2% | View All 105 Rows |
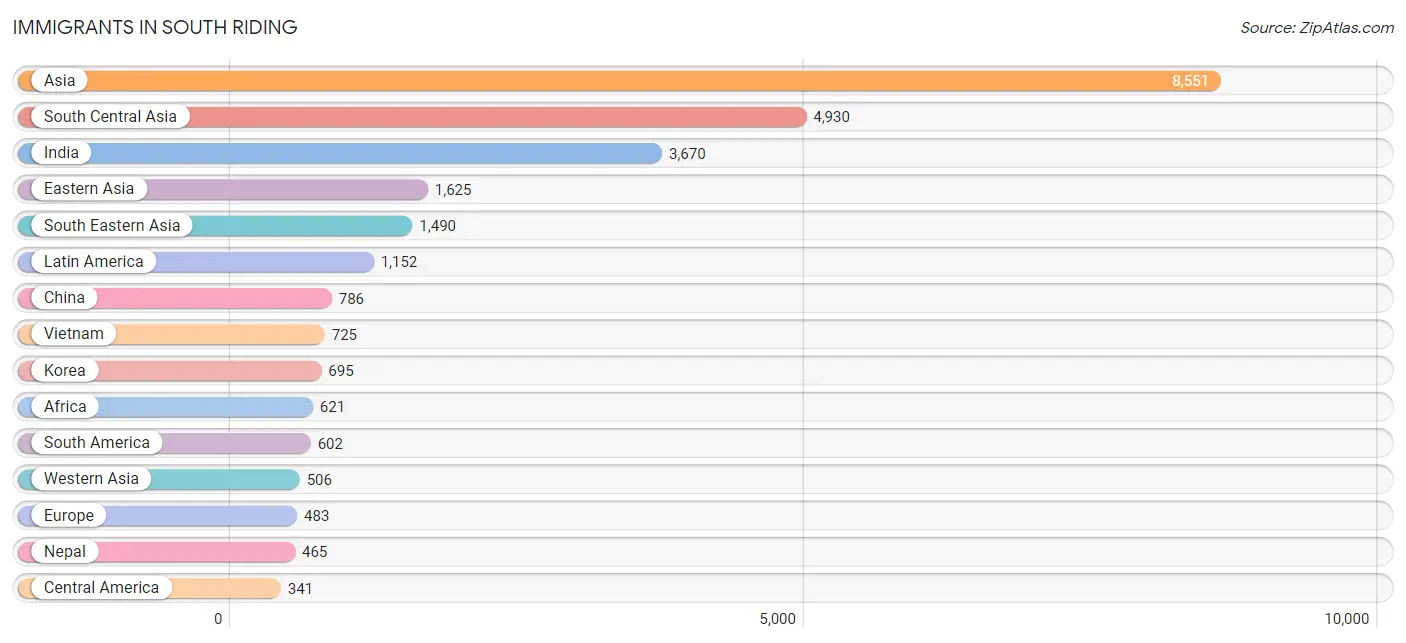
Immigrants in South Riding
The most numerous immigrant groups reported in South Riding came from Asia (8,551 | 25.6%), South Central Asia (4,930 | 14.8%), India (3,670 | 11.0%), Eastern Asia (1,625 | 4.9%), and South Eastern Asia (1,490 | 4.5%), together accounting for 60.7% of all South Riding residents.
| Immigration Origin | # Population | % Population |
| Afghanistan | 174 | 0.5% |
| Africa | 621 | 1.9% |
| Argentina | 5 | 0.0% |
| Asia | 8,551 | 25.6% |
| Austria | 50 | 0.2% |
| Bangladesh | 96 | 0.3% |
| Barbados | 53 | 0.2% |
| Belarus | 18 | 0.1% |
| Belgium | 22 | 0.1% |
| Bolivia | 123 | 0.4% |
| Brazil | 18 | 0.1% |
| Cambodia | 9 | 0.0% |
| Cameroon | 21 | 0.1% |
| Canada | 141 | 0.4% |
| Caribbean | 209 | 0.6% |
| Central America | 341 | 1.0% |
| Chile | 4 | 0.0% |
| China | 786 | 2.4% |
| Colombia | 102 | 0.3% |
| Croatia | 14 | 0.0% |
| Cuba | 34 | 0.1% |
| Czechoslovakia | 40 | 0.1% |
| Eastern Africa | 284 | 0.9% |
| Eastern Asia | 1,625 | 4.9% |
| Eastern Europe | 137 | 0.4% |
| Egypt | 159 | 0.5% |
| England | 51 | 0.2% |
| Ethiopia | 145 | 0.4% |
| Europe | 483 | 1.5% |
| France | 43 | 0.1% |
| Germany | 37 | 0.1% |
| Ghana | 47 | 0.1% |
| Guatemala | 120 | 0.4% |
| Honduras | 93 | 0.3% |
| Hong Kong | 87 | 0.3% |
| Hungary | 12 | 0.0% |
| India | 3,670 | 11.0% |
| Indonesia | 188 | 0.6% |
| Iran | 164 | 0.5% |
| Iraq | 61 | 0.2% |
| Ireland | 38 | 0.1% |
| Japan | 126 | 0.4% |
| Jordan | 47 | 0.1% |
| Kenya | 67 | 0.2% |
| Korea | 695 | 2.1% |
| Laos | 83 | 0.3% |
| Latin America | 1,152 | 3.5% |
| Mexico | 111 | 0.3% |
| Middle Africa | 21 | 0.1% |
| Morocco | 29 | 0.1% |
| Nepal | 465 | 1.4% |
| Nicaragua | 17 | 0.1% |
| Northern Africa | 201 | 0.6% |
| Northern Europe | 121 | 0.4% |
| Oceania | 4 | 0.0% |
| Pakistan | 313 | 0.9% |
| Peru | 183 | 0.5% |
| Philippines | 308 | 0.9% |
| Poland | 5 | 0.0% |
| Romania | 29 | 0.1% |
| Russia | 19 | 0.1% |
| Scotland | 17 | 0.1% |
| Sierra Leone | 51 | 0.2% |
| South Africa | 17 | 0.1% |
| South America | 602 | 1.8% |
| South Central Asia | 4,930 | 14.8% |
| South Eastern Asia | 1,490 | 4.5% |
| Southern Europe | 36 | 0.1% |
| Spain | 36 | 0.1% |
| Sri Lanka | 23 | 0.1% |
| Sudan | 13 | 0.0% |
| Switzerland | 37 | 0.1% |
| Syria | 180 | 0.5% |
| Taiwan | 158 | 0.5% |
| Thailand | 135 | 0.4% |
| Trinidad and Tobago | 103 | 0.3% |
| Turkey | 201 | 0.6% |
| Uganda | 34 | 0.1% |
| Uzbekistan | 25 | 0.1% |
| Venezuela | 130 | 0.4% |
| Vietnam | 725 | 2.2% |
| Western Africa | 98 | 0.3% |
| Western Asia | 506 | 1.5% |
| Western Europe | 189 | 0.6% | View All 84 Rows |
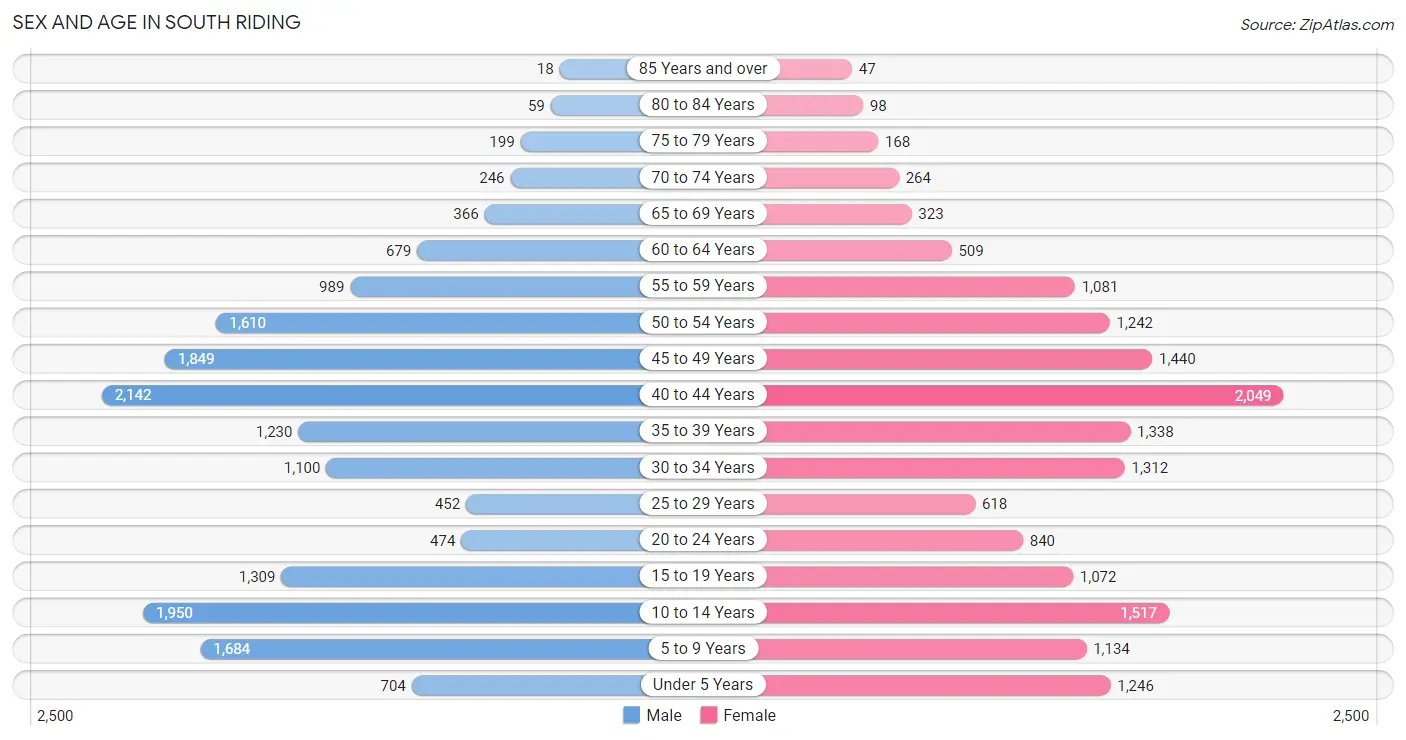
Sex and Age in South Riding
Sex and Age in South Riding
The most populous age groups in South Riding are 40 to 44 Years (2,142 | 12.6%) for men and 40 to 44 Years (2,049 | 12.6%) for women.
| Age Bracket | Male | Female |
| Under 5 Years | 704 (4.1%) | 1,246 (7.6%) |
| 5 to 9 Years | 1,684 (9.9%) | 1,134 (7.0%) |
| 10 to 14 Years | 1,950 (11.4%) | 1,517 (9.3%) |
| 15 to 19 Years | 1,309 (7.7%) | 1,072 (6.6%) |
| 20 to 24 Years | 474 (2.8%) | 840 (5.1%) |
| 25 to 29 Years | 452 (2.6%) | 618 (3.8%) |
| 30 to 34 Years | 1,100 (6.5%) | 1,312 (8.1%) |
| 35 to 39 Years | 1,230 (7.2%) | 1,338 (8.2%) |
| 40 to 44 Years | 2,142 (12.6%) | 2,049 (12.6%) |
| 45 to 49 Years | 1,849 (10.8%) | 1,440 (8.8%) |
| 50 to 54 Years | 1,610 (9.4%) | 1,242 (7.6%) |
| 55 to 59 Years | 989 (5.8%) | 1,081 (6.6%) |
| 60 to 64 Years | 679 (4.0%) | 509 (3.1%) |
| 65 to 69 Years | 366 (2.1%) | 323 (2.0%) |
| 70 to 74 Years | 246 (1.4%) | 264 (1.6%) |
| 75 to 79 Years | 199 (1.2%) | 168 (1.0%) |
| 80 to 84 Years | 59 (0.4%) | 98 (0.6%) |
| 85 Years and over | 18 (0.1%) | 47 (0.3%) |
| Total | 17,060 (100.0%) | 16,298 (100.0%) |
Families and Households in South Riding
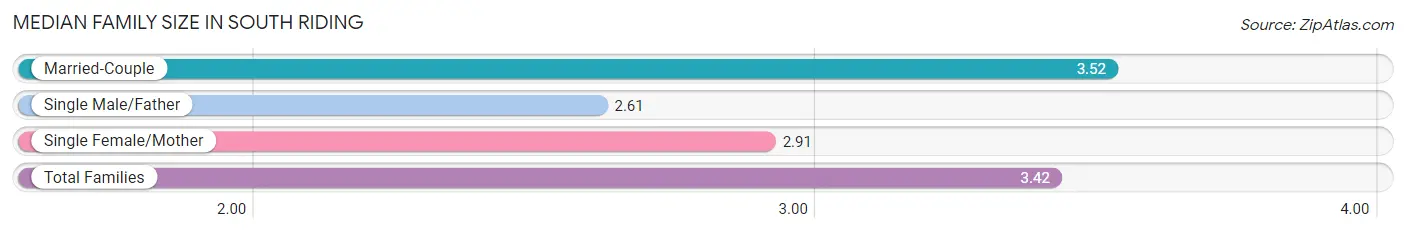
Median Family Size in South Riding
The median family size in South Riding is 3.42 persons per family, with married-couple families (7,802 | 86.5%) accounting for the largest median family size of 3.52 persons per family. On the other hand, single male/father families (414 | 4.6%) represent the smallest median family size with 2.61 persons per family.
| Family Type | # Families | Family Size |
| Married-Couple | 7,802 (86.5%) | 3.52 |
| Single Male/Father | 414 (4.6%) | 2.61 |
| Single Female/Mother | 801 (8.9%) | 2.91 |
| Total Families | 9,017 (100.0%) | 3.42 |
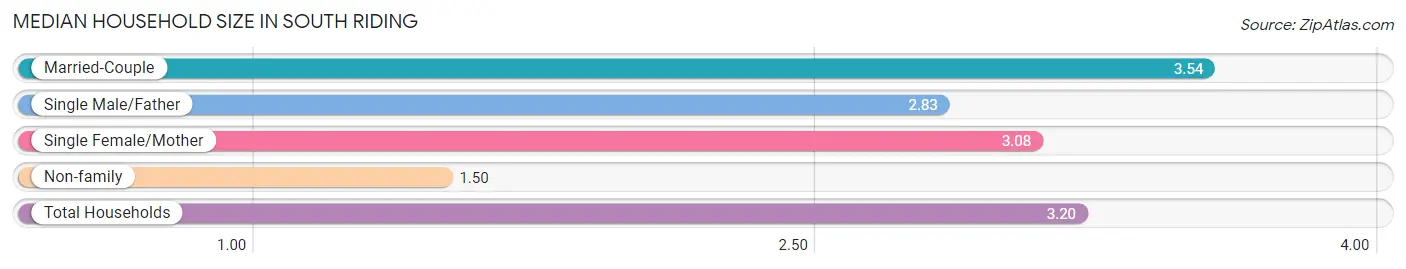
Median Household Size in South Riding
The median household size in South Riding is 3.20 persons per household, with married-couple households (7,802 | 75.0%) accounting for the largest median household size of 3.54 persons per household. non-family households (1,393 | 13.4%) represent the smallest median household size with 1.50 persons per household.
| Household Type | # Households | Household Size |
| Married-Couple | 7,802 (75.0%) | 3.54 |
| Single Male/Father | 414 (4.0%) | 2.83 |
| Single Female/Mother | 801 (7.7%) | 3.08 |
| Non-family | 1,393 (13.4%) | 1.50 |
| Total Households | 10,410 (100.0%) | 3.20 |
Household Size by Marriage Status in South Riding
Out of a total of 10,410 households in South Riding, 9,017 (86.6%) are family households, while 1,393 (13.4%) are nonfamily households. The most numerous type of family households are 4-person households, comprising 2,973, and the most common type of nonfamily households are 1-person households, comprising 1,072.
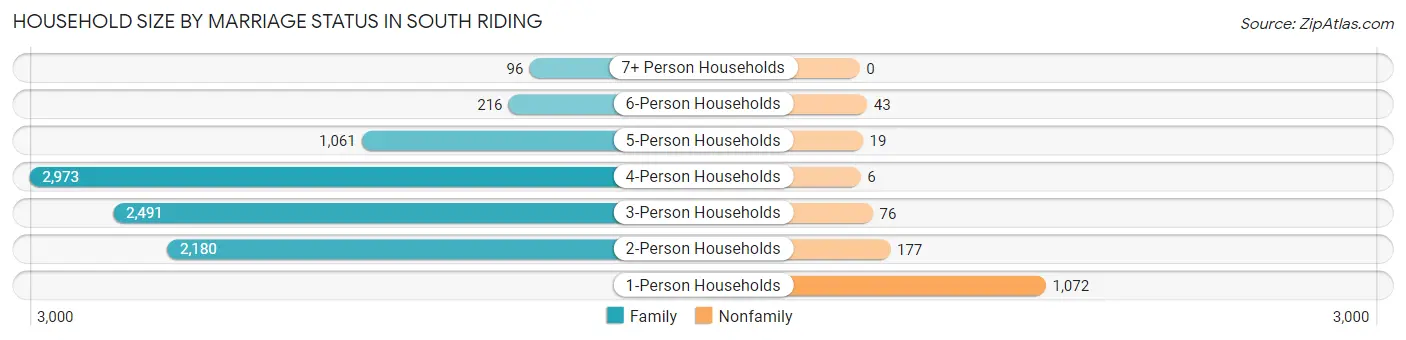
| Household Size | Family Households | Nonfamily Households |
| 1-Person Households | - | 1,072 (10.3%) |
| 2-Person Households | 2,180 (20.9%) | 177 (1.7%) |
| 3-Person Households | 2,491 (23.9%) | 76 (0.7%) |
| 4-Person Households | 2,973 (28.6%) | 6 (0.1%) |
| 5-Person Households | 1,061 (10.2%) | 19 (0.2%) |
| 6-Person Households | 216 (2.1%) | 43 (0.4%) |
| 7+ Person Households | 96 (0.9%) | 0 (0.0%) |
| Total | 9,017 (86.6%) | 1,393 (13.4%) |
Female Fertility in South Riding
Fertility by Age in South Riding
Average fertility rate in South Riding is 38.0 births per 1,000 women. Women in the age bracket of 20 to 34 years have the highest fertility rate with 69.0 births per 1,000 women. Women in the age bracket of 20 to 34 years acount for 55.6% of all women with births.
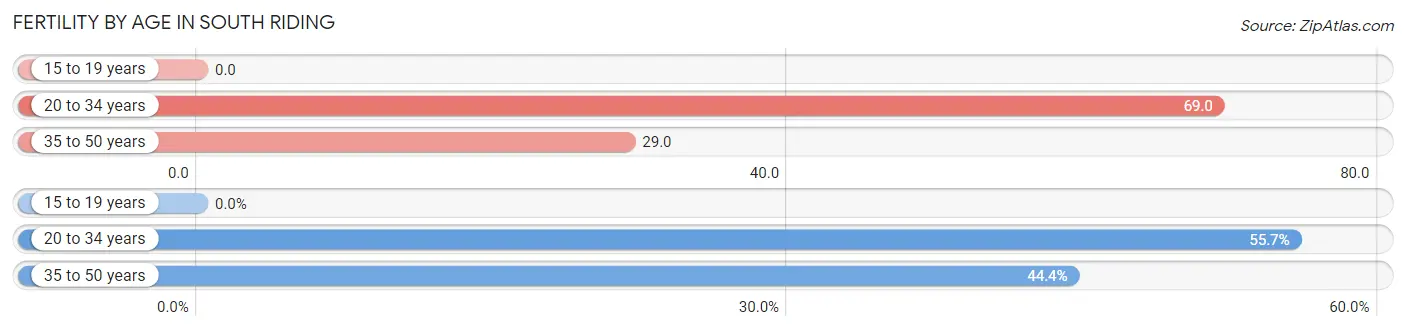
| Age Bracket | Women with Births | Births / 1,000 Women |
| 15 to 19 years | 0 (0.0%) | 0.0 |
| 20 to 34 years | 192 (55.6%) | 69.0 |
| 35 to 50 years | 153 (44.4%) | 29.0 |
| Total | 345 (100.0%) | 38.0 |
Fertility by Age by Marriage Status in South Riding
88.4% of women with births (345) in South Riding are married. The highest percentage of unmarried women with births falls into 20 to 34 years age bracket with 20.8% of them unmarried at the time of birth, while the lowest percentage of unmarried women with births belong to 35 to 50 years age bracket with 0.0% of them unmarried.
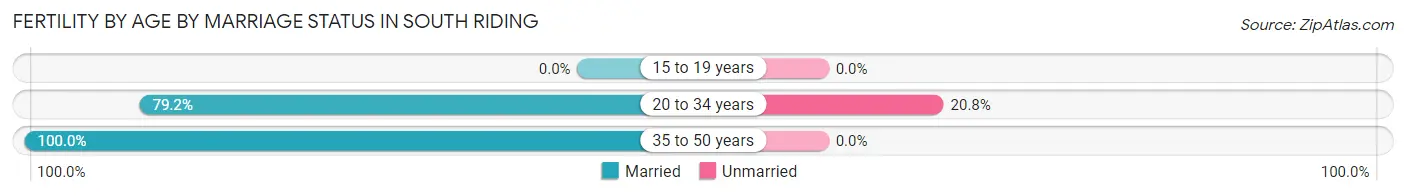
| Age Bracket | Married | Unmarried |
| 15 to 19 years | 0 (0.0%) | 0 (0.0%) |
| 20 to 34 years | 152 (79.2%) | 40 (20.8%) |
| 35 to 50 years | 153 (100.0%) | 0 (0.0%) |
| Total | 305 (88.4%) | 40 (11.6%) |
Fertility by Education in South Riding
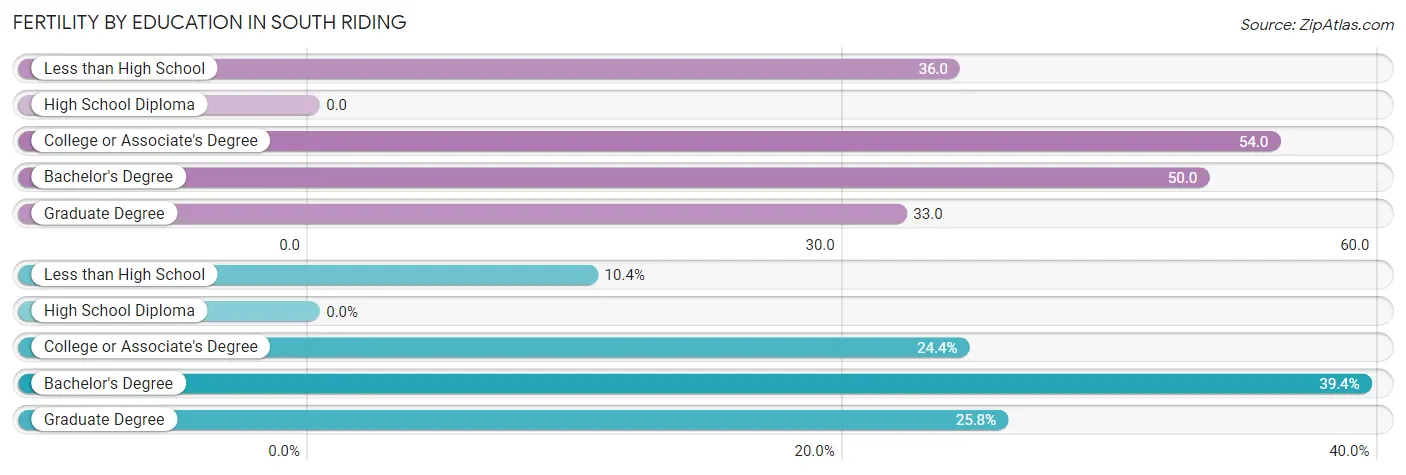
| Educational Attainment | Women with Births | Births / 1,000 Women |
| Less than High School | 36 (10.4%) | 36.0 |
| High School Diploma | 0 (0.0%) | 0.0 |
| College or Associate's Degree | 84 (24.3%) | 54.0 |
| Bachelor's Degree | 136 (39.4%) | 50.0 |
| Graduate Degree | 89 (25.8%) | 33.0 |
| Total | 345 (100.0%) | 38.0 |
Fertility by Education by Marriage Status in South Riding
11.6% of women with births in South Riding are unmarried. Women with the educational attainment of less than high school are most likely to be married with 100.0% of them married at childbirth, while women with the educational attainment of college or associate's degree are least likely to be married with 41.7% of them unmarried at childbirth.
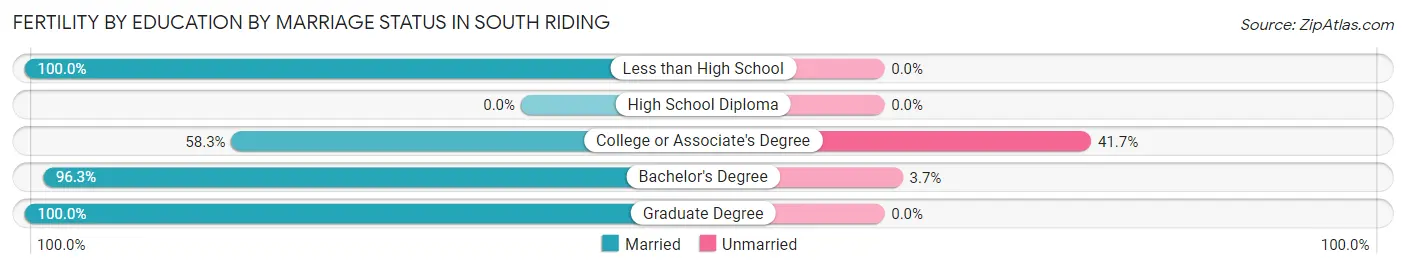
| Educational Attainment | Married | Unmarried |
| Less than High School | 36 (100.0%) | 0 (0.0%) |
| High School Diploma | 0 (0.0%) | 0 (0.0%) |
| College or Associate's Degree | 49 (58.3%) | 35 (41.7%) |
| Bachelor's Degree | 131 (96.3%) | 5 (3.7%) |
| Graduate Degree | 89 (100.0%) | 0 (0.0%) |
| Total | 305 (88.4%) | 40 (11.6%) |
Employment Characteristics in South Riding
Employment by Class of Employer in South Riding
Among the 18,534 employed individuals in South Riding, private company employees (11,808 | 63.7%), federal government employees (2,451 | 13.2%), and local government employees (1,330 | 7.2%) make up the most common classes of employment.
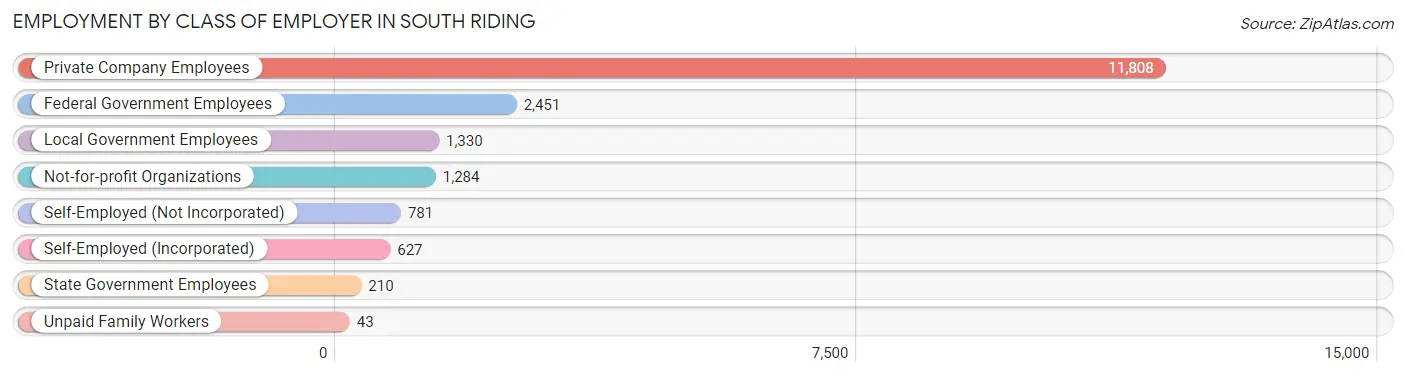
| Employer Class | # Employees | % Employees |
| Private Company Employees | 11,808 | 63.7% |
| Self-Employed (Incorporated) | 627 | 3.4% |
| Self-Employed (Not Incorporated) | 781 | 4.2% |
| Not-for-profit Organizations | 1,284 | 6.9% |
| Local Government Employees | 1,330 | 7.2% |
| State Government Employees | 210 | 1.1% |
| Federal Government Employees | 2,451 | 13.2% |
| Unpaid Family Workers | 43 | 0.2% |
| Total | 18,534 | 100.0% |
Employment Status by Age in South Riding
According to the labor force statistics for South Riding, out of the total population over 16 years of age (24,522), 79.6% or 19,520 individuals are in the labor force, with 4.3% or 839 of them unemployed. The age group with the highest labor force participation rate is 45 to 54 years, with 91.7% or 5,631 individuals in the labor force. Within the labor force, the 20 to 24 years age range has the highest percentage of unemployed individuals, with 8.8% or 88 of them being unemployed.
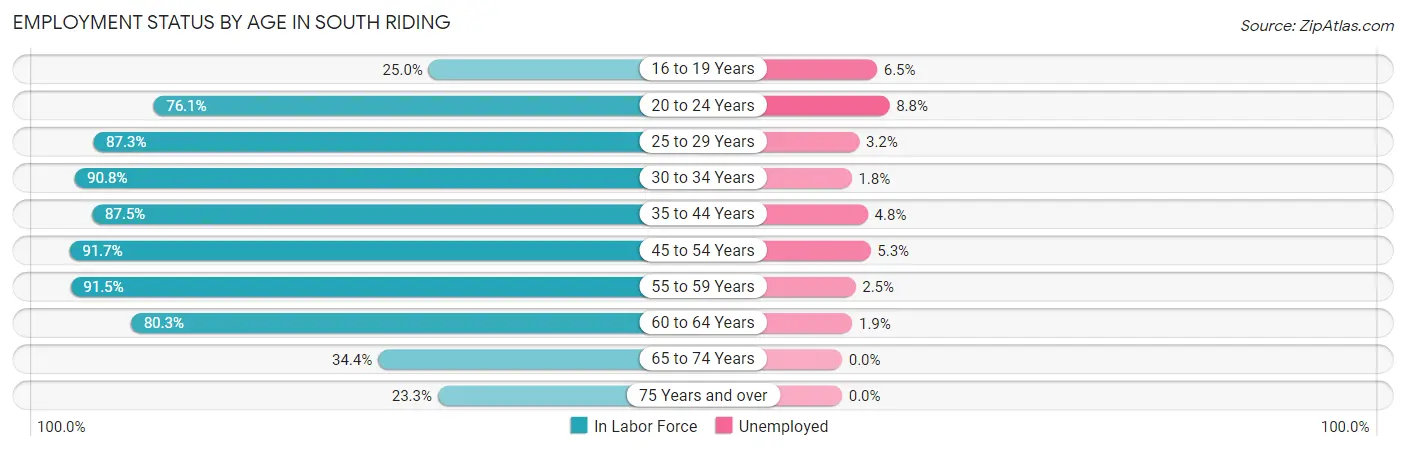
| Age Bracket | In Labor Force | Unemployed |
| 16 to 19 Years | 445 (25.0%) | 29 (6.5%) |
| 20 to 24 Years | 1,000 (76.1%) | 88 (8.8%) |
| 25 to 29 Years | 934 (87.3%) | 30 (3.2%) |
| 30 to 34 Years | 2,190 (90.8%) | 39 (1.8%) |
| 35 to 44 Years | 5,914 (87.5%) | 284 (4.8%) |
| 45 to 54 Years | 5,631 (91.7%) | 298 (5.3%) |
| 55 to 59 Years | 1,894 (91.5%) | 47 (2.5%) |
| 60 to 64 Years | 954 (80.3%) | 18 (1.9%) |
| 65 to 74 Years | 412 (34.4%) | 0 (0.0%) |
| 75 Years and over | 137 (23.3%) | 0 (0.0%) |
| Total | 19,520 (79.6%) | 839 (4.3%) |
Employment Status by Educational Attainment in South Riding
According to labor force statistics for South Riding, 89.2% of individuals (17,519) out of the total population between 25 and 64 years of age (19,640) are in the labor force, with 4.1% or 718 of them being unemployed. The group with the highest labor force participation rate are those with the educational attainment of bachelor's degree or higher, with 91.8% or 12,597 individuals in the labor force. Within the labor force, individuals with college / associate degree education have the highest percentage of unemployment, with 9.3% or 263 of them being unemployed.
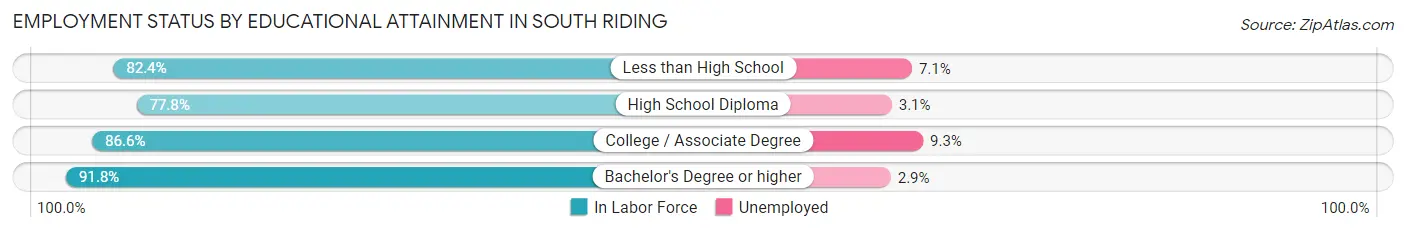
| Educational Attainment | In Labor Force | Unemployed |
| Less than High School | 535 (82.4%) | 46 (7.1%) |
| High School Diploma | 1,559 (77.8%) | 62 (3.1%) |
| College / Associate Degree | 2,827 (86.6%) | 304 (9.3%) |
| Bachelor's Degree or higher | 12,597 (91.8%) | 398 (2.9%) |
| Total | 17,519 (89.2%) | 805 (4.1%) |
Employment Occupations by Sex in South Riding
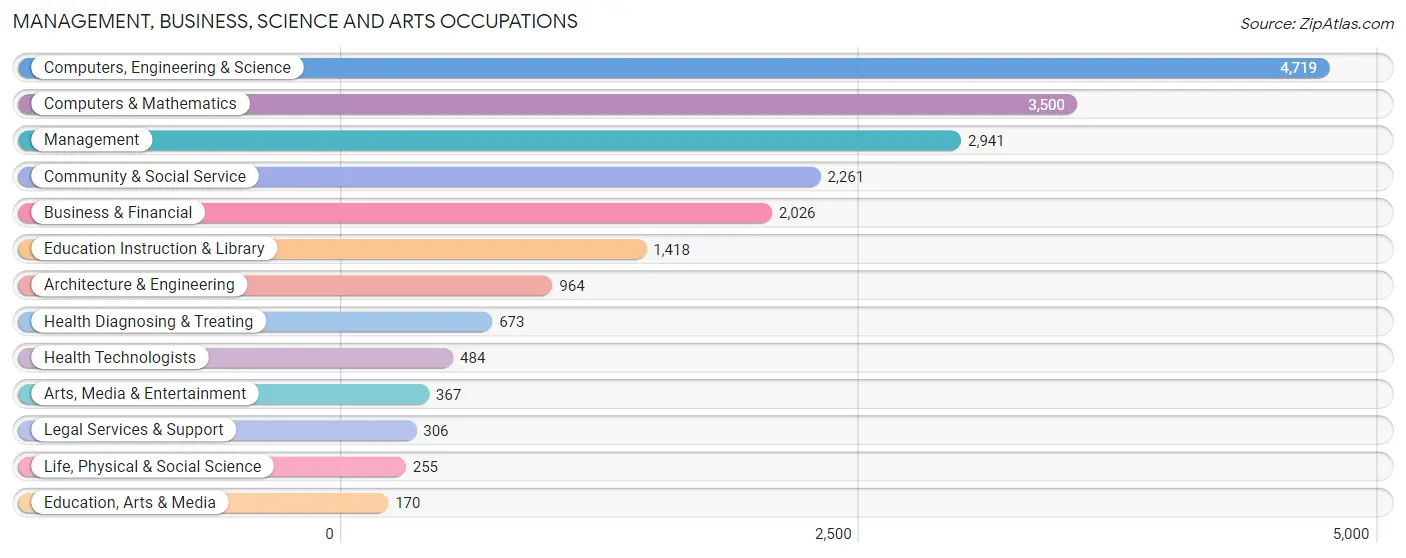
Management, Business, Science and Arts Occupations
The most common Management, Business, Science and Arts occupations in South Riding are Computers, Engineering & Science (4,719 | 25.6%), Computers & Mathematics (3,500 | 19.0%), Management (2,941 | 16.0%), Community & Social Service (2,261 | 12.3%), and Business & Financial (2,026 | 11.0%).
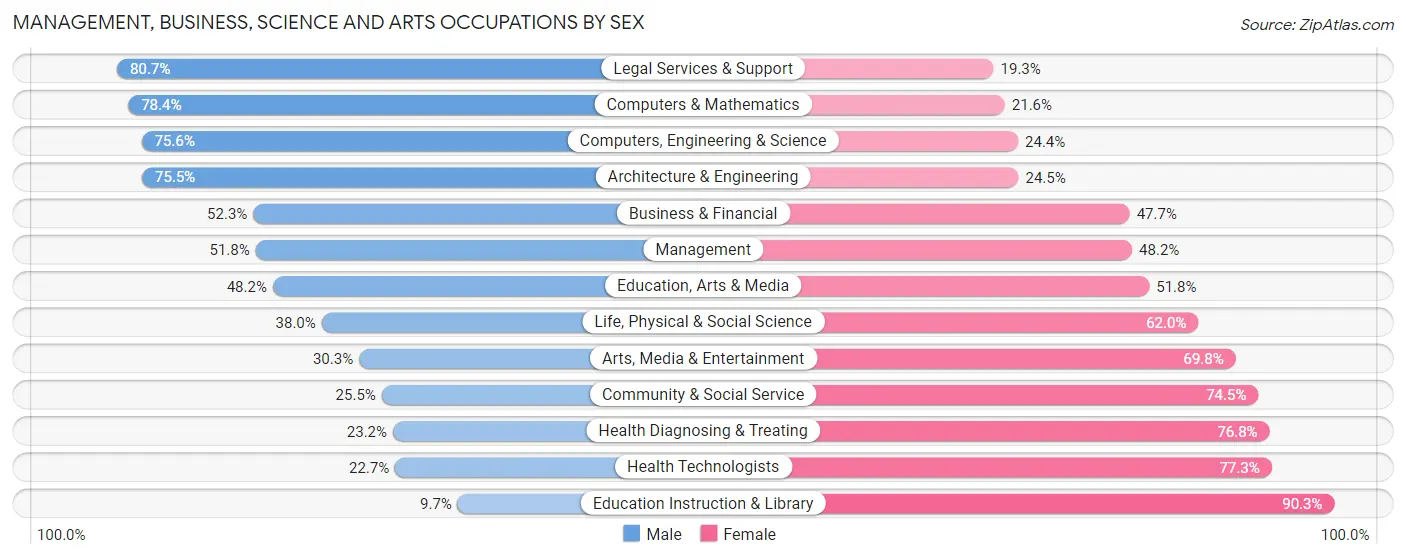
Management, Business, Science and Arts Occupations by Sex
Within the Management, Business, Science and Arts occupations in South Riding, the most male-oriented occupations are Legal Services & Support (80.7%), Computers & Mathematics (78.4%), and Computers, Engineering & Science (75.6%), while the most female-oriented occupations are Education Instruction & Library (90.3%), Health Technologists (77.3%), and Health Diagnosing & Treating (76.8%).
| Occupation | Male | Female |
| Management | 1,524 (51.8%) | 1,417 (48.2%) |
| Business & Financial | 1,060 (52.3%) | 966 (47.7%) |
| Computers, Engineering & Science | 3,568 (75.6%) | 1,151 (24.4%) |
| Computers & Mathematics | 2,743 (78.4%) | 757 (21.6%) |
| Architecture & Engineering | 728 (75.5%) | 236 (24.5%) |
| Life, Physical & Social Science | 97 (38.0%) | 158 (62.0%) |
| Community & Social Service | 577 (25.5%) | 1,684 (74.5%) |
| Education, Arts & Media | 82 (48.2%) | 88 (51.8%) |
| Legal Services & Support | 247 (80.7%) | 59 (19.3%) |
| Education Instruction & Library | 137 (9.7%) | 1,281 (90.3%) |
| Arts, Media & Entertainment | 111 (30.2%) | 256 (69.8%) |
| Health Diagnosing & Treating | 156 (23.2%) | 517 (76.8%) |
| Health Technologists | 110 (22.7%) | 374 (77.3%) |
| Total (Category) | 6,885 (54.6%) | 5,735 (45.4%) |
| Total (Overall) | 9,837 (53.4%) | 8,585 (46.6%) |
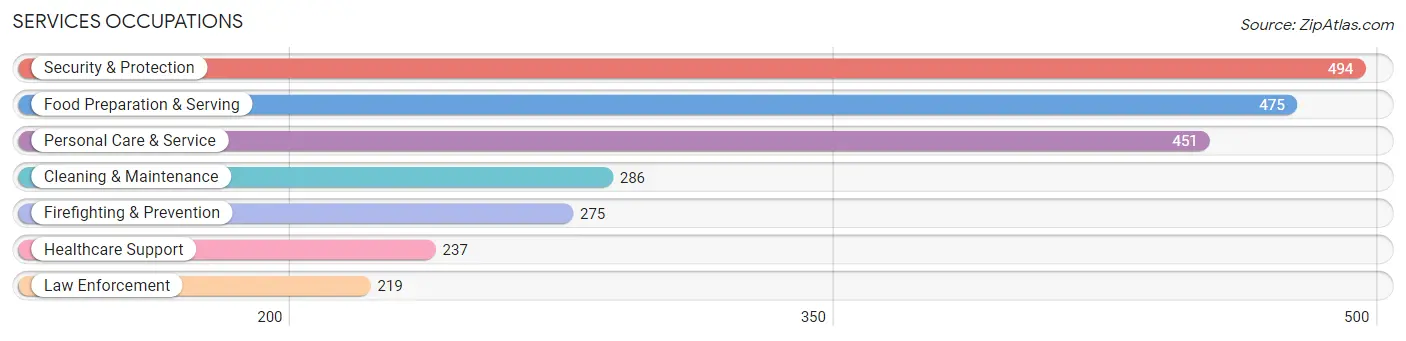
Services Occupations
The most common Services occupations in South Riding are Security & Protection (494 | 2.7%), Food Preparation & Serving (475 | 2.6%), Personal Care & Service (451 | 2.5%), Cleaning & Maintenance (286 | 1.5%), and Firefighting & Prevention (275 | 1.5%).
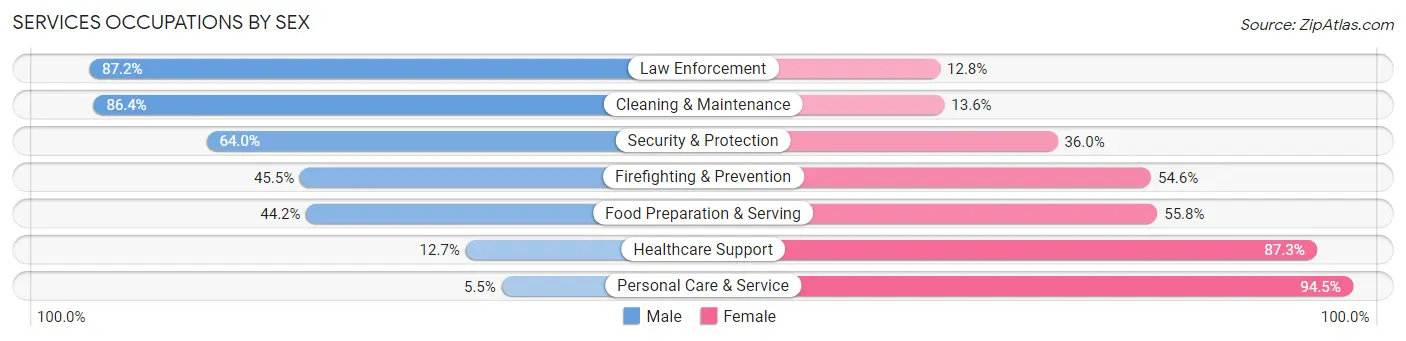
Services Occupations by Sex
Within the Services occupations in South Riding, the most male-oriented occupations are Law Enforcement (87.2%), Cleaning & Maintenance (86.4%), and Security & Protection (64.0%), while the most female-oriented occupations are Personal Care & Service (94.5%), Healthcare Support (87.3%), and Food Preparation & Serving (55.8%).
| Occupation | Male | Female |
| Healthcare Support | 30 (12.7%) | 207 (87.3%) |
| Security & Protection | 316 (64.0%) | 178 (36.0%) |
| Firefighting & Prevention | 125 (45.5%) | 150 (54.5%) |
| Law Enforcement | 191 (87.2%) | 28 (12.8%) |
| Food Preparation & Serving | 210 (44.2%) | 265 (55.8%) |
| Cleaning & Maintenance | 247 (86.4%) | 39 (13.6%) |
| Personal Care & Service | 25 (5.5%) | 426 (94.5%) |
| Total (Category) | 828 (42.6%) | 1,115 (57.4%) |
| Total (Overall) | 9,837 (53.4%) | 8,585 (46.6%) |
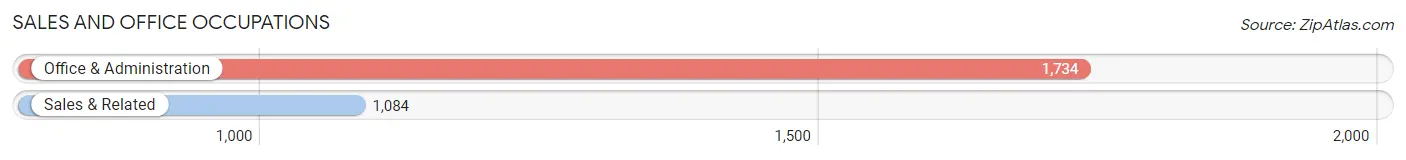
Sales and Office Occupations
The most common Sales and Office occupations in South Riding are Office & Administration (1,734 | 9.4%), and Sales & Related (1,084 | 5.9%).
Sales and Office Occupations by Sex
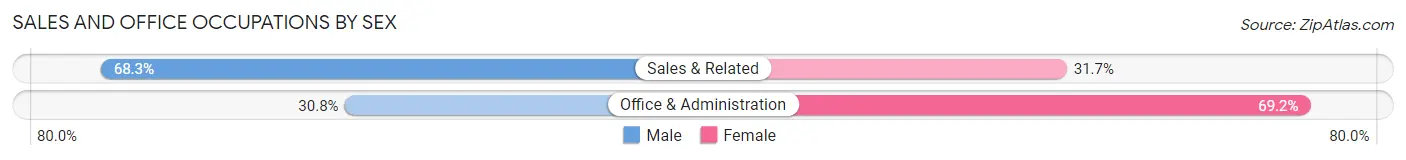
| Occupation | Male | Female |
| Sales & Related | 740 (68.3%) | 344 (31.7%) |
| Office & Administration | 534 (30.8%) | 1,200 (69.2%) |
| Total (Category) | 1,274 (45.2%) | 1,544 (54.8%) |
| Total (Overall) | 9,837 (53.4%) | 8,585 (46.6%) |
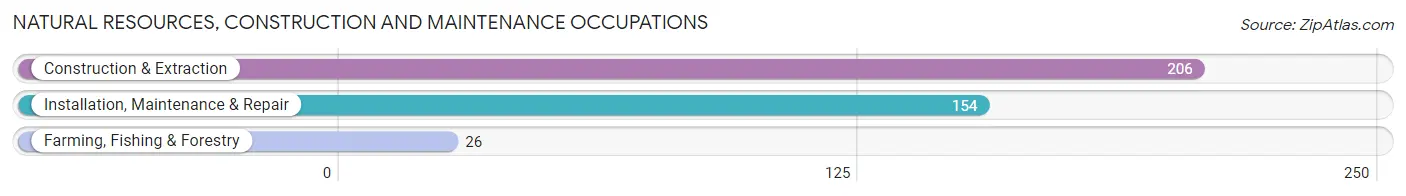
Natural Resources, Construction and Maintenance Occupations
The most common Natural Resources, Construction and Maintenance occupations in South Riding are Construction & Extraction (206 | 1.1%), Installation, Maintenance & Repair (154 | 0.8%), and Farming, Fishing & Forestry (26 | 0.1%).
Natural Resources, Construction and Maintenance Occupations by Sex
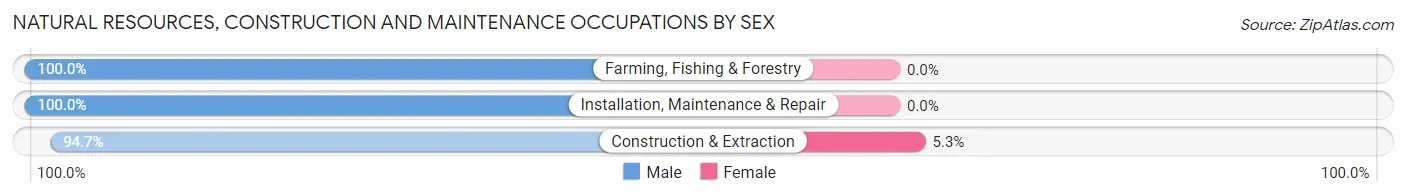
| Occupation | Male | Female |
| Farming, Fishing & Forestry | 26 (100.0%) | 0 (0.0%) |
| Construction & Extraction | 195 (94.7%) | 11 (5.3%) |
| Installation, Maintenance & Repair | 154 (100.0%) | 0 (0.0%) |
| Total (Category) | 375 (97.2%) | 11 (2.9%) |
| Total (Overall) | 9,837 (53.4%) | 8,585 (46.6%) |
Production, Transportation and Moving Occupations
The most common Production, Transportation and Moving occupations in South Riding are Production (316 | 1.7%), Transportation (311 | 1.7%), and Material Moving (28 | 0.2%).
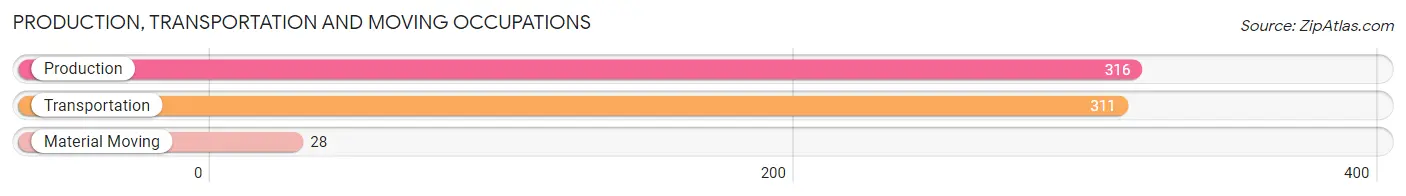
Production, Transportation and Moving Occupations by Sex
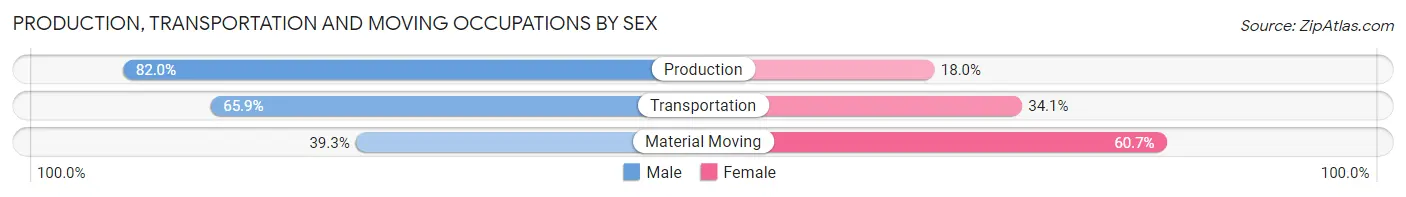
| Occupation | Male | Female |
| Production | 259 (82.0%) | 57 (18.0%) |
| Transportation | 205 (65.9%) | 106 (34.1%) |
| Material Moving | 11 (39.3%) | 17 (60.7%) |
| Total (Category) | 475 (72.5%) | 180 (27.5%) |
| Total (Overall) | 9,837 (53.4%) | 8,585 (46.6%) |
Employment Industries by Sex in South Riding
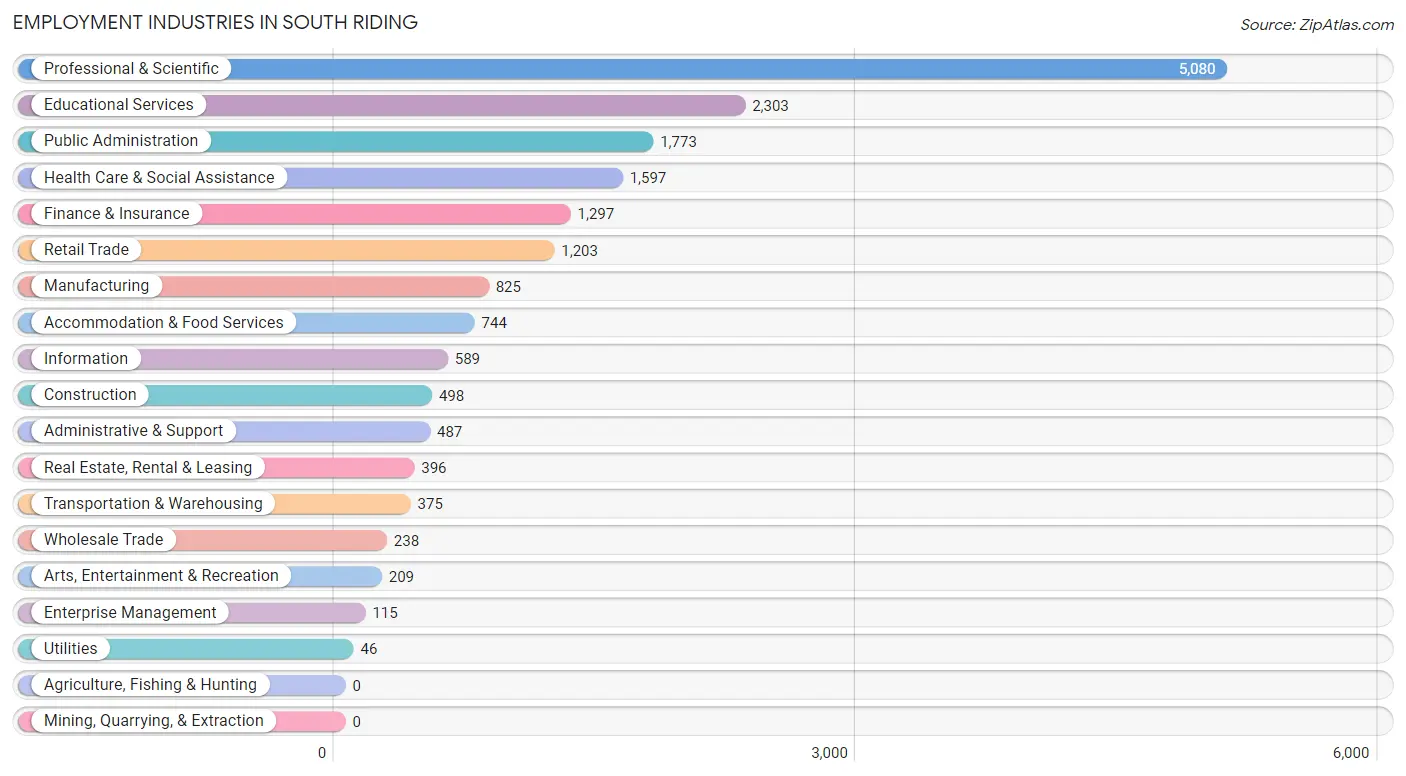
Employment Industries in South Riding
The major employment industries in South Riding include Professional & Scientific (5,080 | 27.6%), Educational Services (2,303 | 12.5%), Public Administration (1,773 | 9.6%), Health Care & Social Assistance (1,597 | 8.7%), and Finance & Insurance (1,297 | 7.0%).
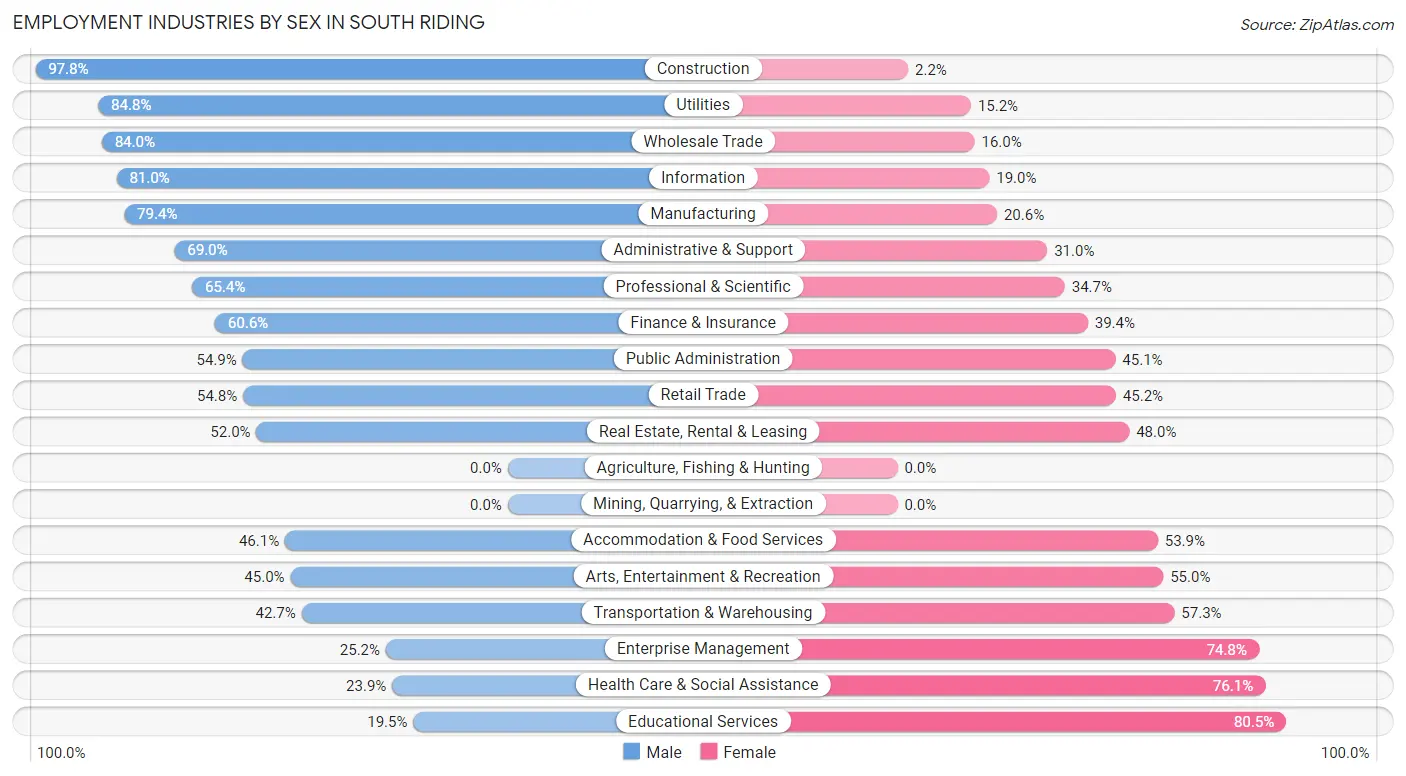
Employment Industries by Sex in South Riding
The South Riding industries that see more men than women are Construction (97.8%), Utilities (84.8%), and Wholesale Trade (84.0%), whereas the industries that tend to have a higher number of women are Educational Services (80.5%), Health Care & Social Assistance (76.1%), and Enterprise Management (74.8%).
| Industry | Male | Female |
| Agriculture, Fishing & Hunting | 0 (0.0%) | 0 (0.0%) |
| Mining, Quarrying, & Extraction | 0 (0.0%) | 0 (0.0%) |
| Construction | 487 (97.8%) | 11 (2.2%) |
| Manufacturing | 655 (79.4%) | 170 (20.6%) |
| Wholesale Trade | 200 (84.0%) | 38 (16.0%) |
| Retail Trade | 659 (54.8%) | 544 (45.2%) |
| Transportation & Warehousing | 160 (42.7%) | 215 (57.3%) |
| Utilities | 39 (84.8%) | 7 (15.2%) |
| Information | 477 (81.0%) | 112 (19.0%) |
| Finance & Insurance | 786 (60.6%) | 511 (39.4%) |
| Real Estate, Rental & Leasing | 206 (52.0%) | 190 (48.0%) |
| Professional & Scientific | 3,320 (65.3%) | 1,760 (34.6%) |
| Enterprise Management | 29 (25.2%) | 86 (74.8%) |
| Administrative & Support | 336 (69.0%) | 151 (31.0%) |
| Educational Services | 450 (19.5%) | 1,853 (80.5%) |
| Health Care & Social Assistance | 382 (23.9%) | 1,215 (76.1%) |
| Arts, Entertainment & Recreation | 94 (45.0%) | 115 (55.0%) |
| Accommodation & Food Services | 343 (46.1%) | 401 (53.9%) |
| Public Administration | 973 (54.9%) | 800 (45.1%) |
| Total | 9,837 (53.4%) | 8,585 (46.6%) |
Education in South Riding
School Enrollment in South Riding
The most common levels of schooling among the 10,917 students in South Riding are middle school (2,736 | 25.1%), elementary school (2,317 | 21.2%), and high school (2,289 | 21.0%).
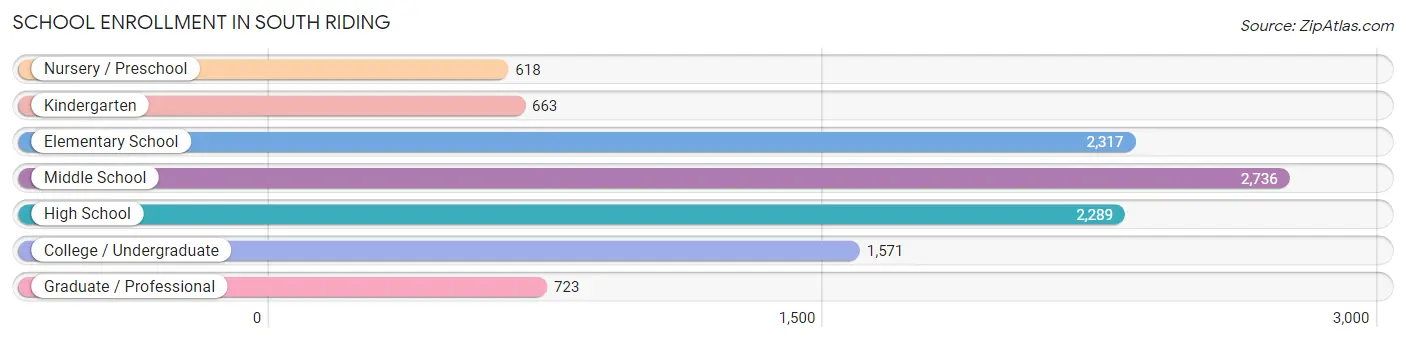
| School Level | # Students | % Students |
| Nursery / Preschool | 618 | 5.7% |
| Kindergarten | 663 | 6.1% |
| Elementary School | 2,317 | 21.2% |
| Middle School | 2,736 | 25.1% |
| High School | 2,289 | 21.0% |
| College / Undergraduate | 1,571 | 14.4% |
| Graduate / Professional | 723 | 6.6% |
| Total | 10,917 | 100.0% |
School Enrollment by Age by Funding Source in South Riding
Out of a total of 10,917 students who are enrolled in schools in South Riding, 1,758 (16.1%) attend a private institution, while the remaining 9,159 (83.9%) are enrolled in public schools. The age group of 3 to 4 year olds has the highest likelihood of being enrolled in private schools, with 404 (74.5% in the age bracket) enrolled. Conversely, the age group of 10 to 14 year olds has the lowest likelihood of being enrolled in a private school, with 3,236 (93.3% in the age bracket) attending a public institution.
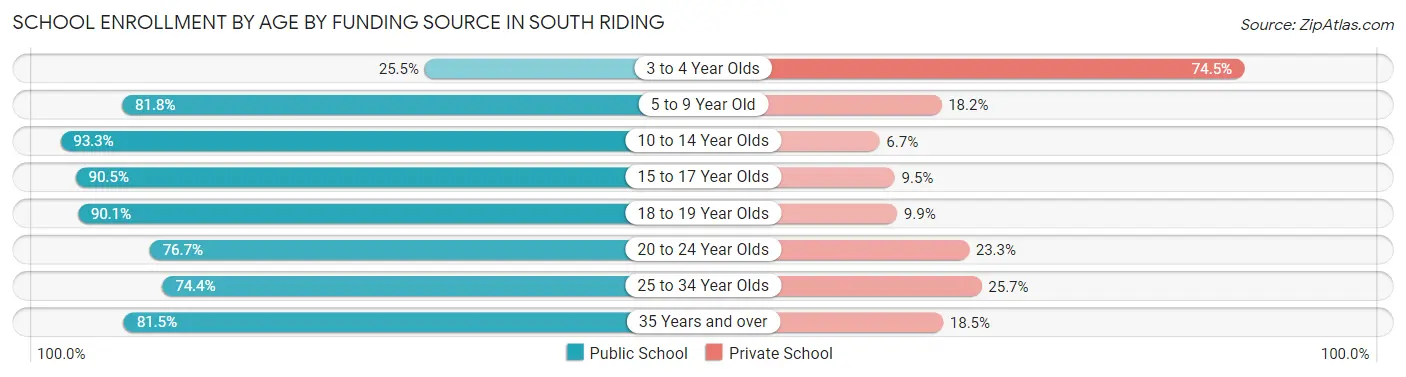
| Age Bracket | Public School | Private School |
| 3 to 4 Year Olds | 138 (25.5%) | 404 (74.5%) |
| 5 to 9 Year Old | 2,221 (81.8%) | 493 (18.2%) |
| 10 to 14 Year Olds | 3,236 (93.3%) | 231 (6.7%) |
| 15 to 17 Year Olds | 1,430 (90.5%) | 150 (9.5%) |
| 18 to 19 Year Olds | 672 (90.1%) | 74 (9.9%) |
| 20 to 24 Year Olds | 566 (76.7%) | 172 (23.3%) |
| 25 to 34 Year Olds | 313 (74.4%) | 108 (25.7%) |
| 35 Years and over | 578 (81.5%) | 131 (18.5%) |
| Total | 9,159 (83.9%) | 1,758 (16.1%) |
Educational Attainment by Field of Study in South Riding
Business (2,835 | 17.9%), engineering (2,461 | 15.5%), computers & mathematics (2,297 | 14.5%), social sciences (1,963 | 12.4%), and education (895 | 5.7%) are the most common fields of study among 15,825 individuals in South Riding who have obtained a bachelor's degree or higher.
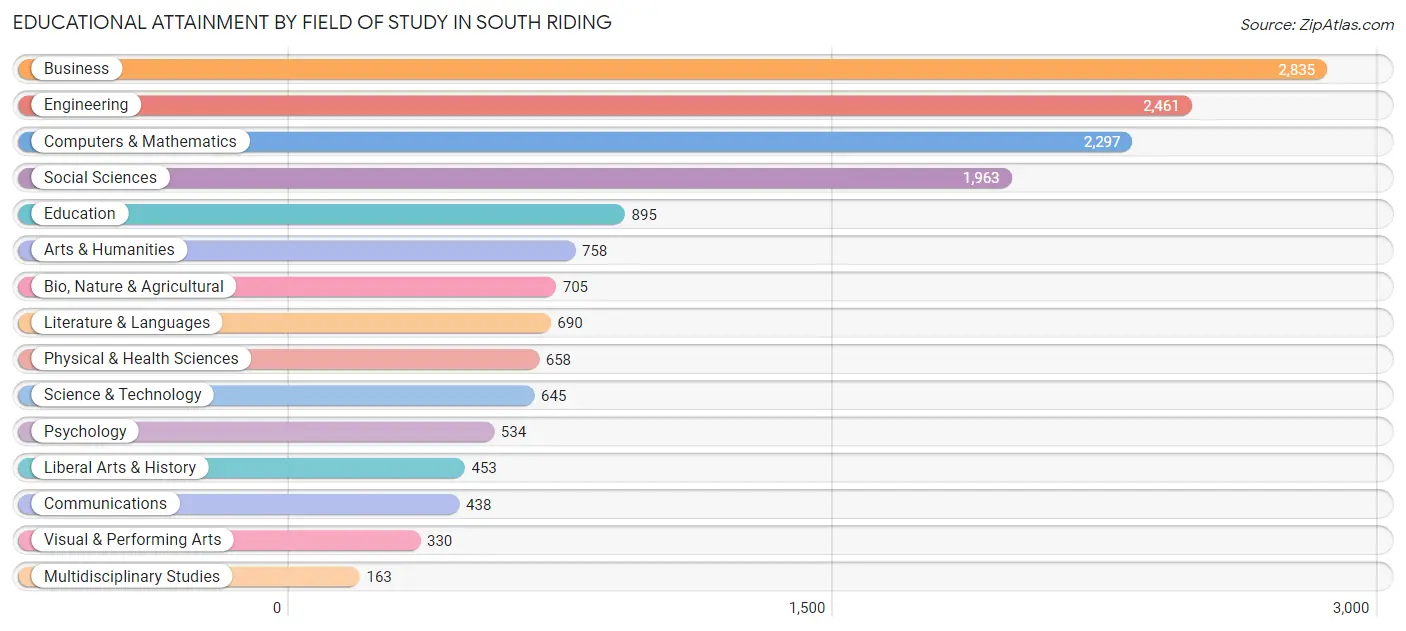
| Field of Study | # Graduates | % Graduates |
| Computers & Mathematics | 2,297 | 14.5% |
| Bio, Nature & Agricultural | 705 | 4.4% |
| Physical & Health Sciences | 658 | 4.2% |
| Psychology | 534 | 3.4% |
| Social Sciences | 1,963 | 12.4% |
| Engineering | 2,461 | 15.5% |
| Multidisciplinary Studies | 163 | 1.0% |
| Science & Technology | 645 | 4.1% |
| Business | 2,835 | 17.9% |
| Education | 895 | 5.7% |
| Literature & Languages | 690 | 4.4% |
| Liberal Arts & History | 453 | 2.9% |
| Visual & Performing Arts | 330 | 2.1% |
| Communications | 438 | 2.8% |
| Arts & Humanities | 758 | 4.8% |
| Total | 15,825 | 100.0% |
Transportation & Commute in South Riding
Vehicle Availability by Sex in South Riding
The most prevalent vehicle ownership categories in South Riding are males with 2 vehicles (5,228, accounting for 52.1%) and females with 2 vehicles (4,137, making up 61.6%).
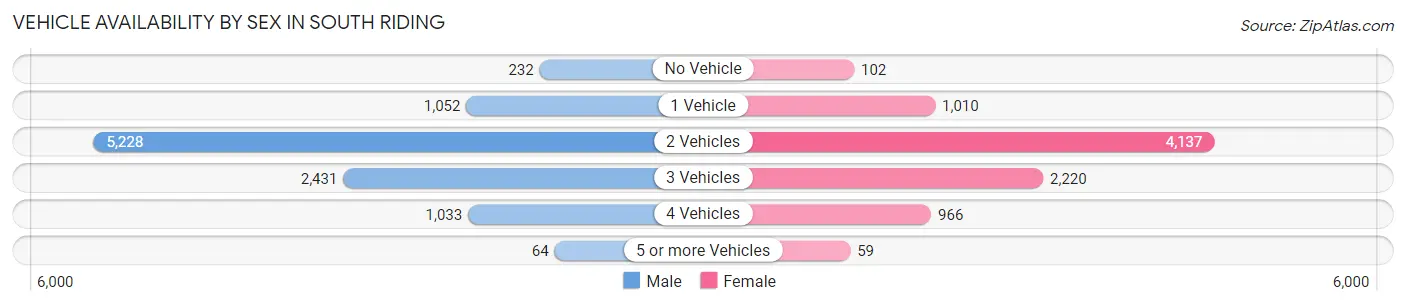
| Vehicles Available | Male | Female |
| No Vehicle | 232 (2.3%) | 102 (1.2%) |
| 1 Vehicle | 1,052 (10.5%) | 1,010 (11.9%) |
| 2 Vehicles | 5,228 (52.1%) | 4,137 (48.7%) |
| 3 Vehicles | 2,431 (24.2%) | 2,220 (26.1%) |
| 4 Vehicles | 1,033 (10.3%) | 966 (11.4%) |
| 5 or more Vehicles | 64 (0.6%) | 59 (0.7%) |
| Total | 10,040 (100.0%) | 8,494 (100.0%) |
Commute Time in South Riding
The most frequently occuring commute durations in South Riding are 60 to 89 minutes (2,005 commuters, 14.1%), 30 to 34 minutes (2,004 commuters, 14.1%), and 45 to 59 minutes (1,873 commuters, 13.2%).
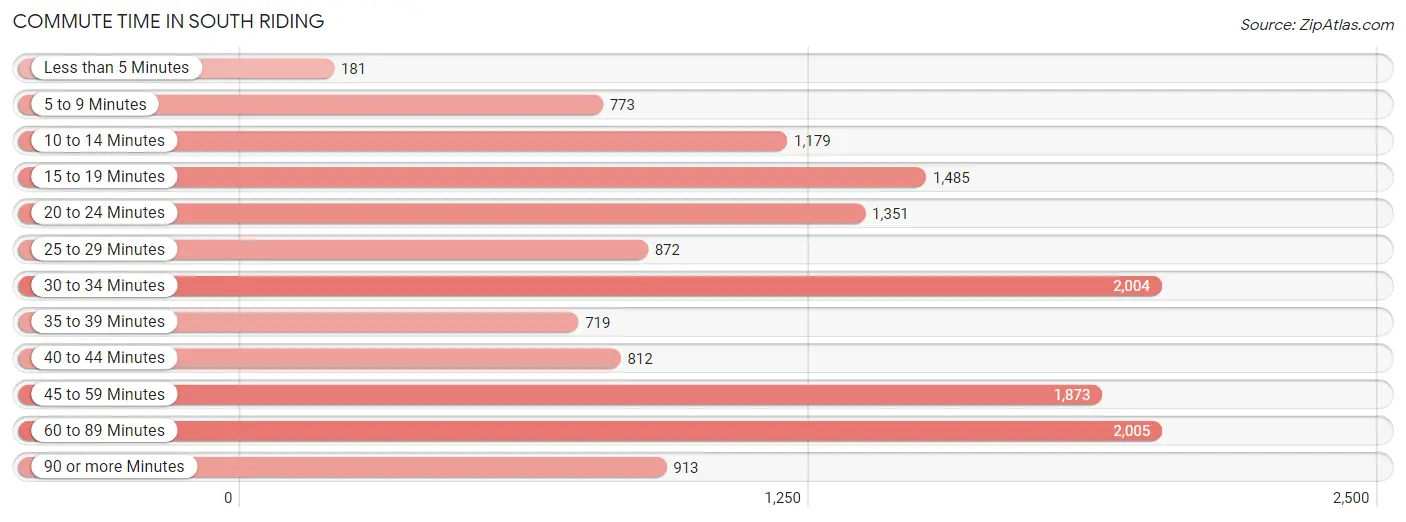
| Commute Time | # Commuters | % Commuters |
| Less than 5 Minutes | 181 | 1.3% |
| 5 to 9 Minutes | 773 | 5.5% |
| 10 to 14 Minutes | 1,179 | 8.3% |
| 15 to 19 Minutes | 1,485 | 10.5% |
| 20 to 24 Minutes | 1,351 | 9.5% |
| 25 to 29 Minutes | 872 | 6.2% |
| 30 to 34 Minutes | 2,004 | 14.1% |
| 35 to 39 Minutes | 719 | 5.1% |
| 40 to 44 Minutes | 812 | 5.7% |
| 45 to 59 Minutes | 1,873 | 13.2% |
| 60 to 89 Minutes | 2,005 | 14.1% |
| 90 or more Minutes | 913 | 6.4% |
Commute Time by Sex in South Riding
The most common commute times in South Riding are 60 to 89 minutes (1,280 commuters, 16.6%) for males and 30 to 34 minutes (1,087 commuters, 16.8%) for females.
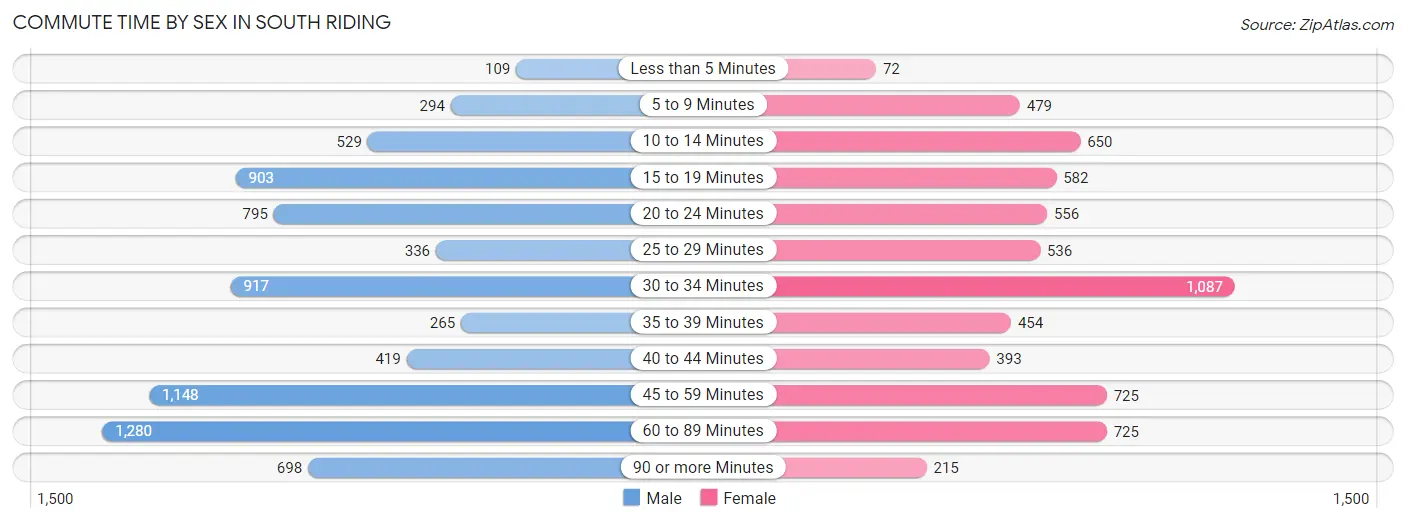
| Commute Time | Male | Female |
| Less than 5 Minutes | 109 (1.4%) | 72 (1.1%) |
| 5 to 9 Minutes | 294 (3.8%) | 479 (7.4%) |
| 10 to 14 Minutes | 529 (6.9%) | 650 (10.0%) |
| 15 to 19 Minutes | 903 (11.7%) | 582 (9.0%) |
| 20 to 24 Minutes | 795 (10.3%) | 556 (8.6%) |
| 25 to 29 Minutes | 336 (4.4%) | 536 (8.3%) |
| 30 to 34 Minutes | 917 (11.9%) | 1,087 (16.8%) |
| 35 to 39 Minutes | 265 (3.4%) | 454 (7.0%) |
| 40 to 44 Minutes | 419 (5.4%) | 393 (6.1%) |
| 45 to 59 Minutes | 1,148 (14.9%) | 725 (11.2%) |
| 60 to 89 Minutes | 1,280 (16.6%) | 725 (11.2%) |
| 90 or more Minutes | 698 (9.1%) | 215 (3.3%) |
Time of Departure to Work by Sex in South Riding
The most frequent times of departure to work in South Riding are 7:00 AM to 7:29 AM (1,101, 14.3%) for males and 7:00 AM to 7:29 AM (1,167, 18.0%) for females.
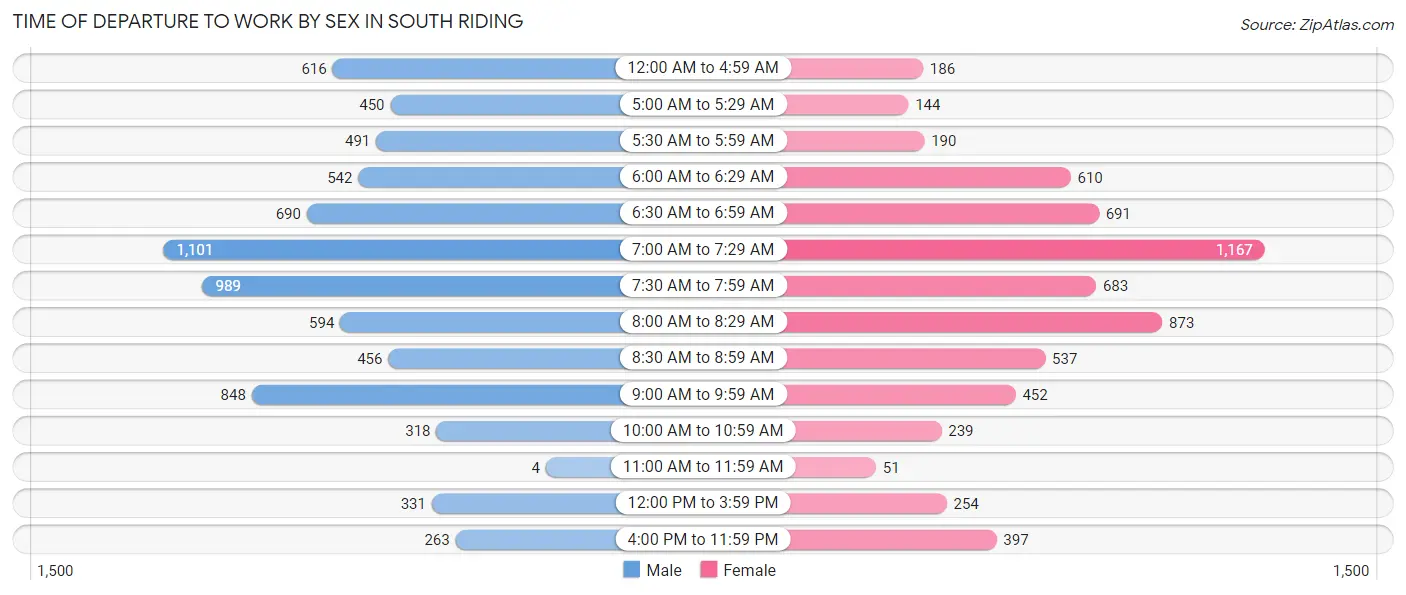
| Time of Departure | Male | Female |
| 12:00 AM to 4:59 AM | 616 (8.0%) | 186 (2.9%) |
| 5:00 AM to 5:29 AM | 450 (5.9%) | 144 (2.2%) |
| 5:30 AM to 5:59 AM | 491 (6.4%) | 190 (2.9%) |
| 6:00 AM to 6:29 AM | 542 (7.0%) | 610 (9.4%) |
| 6:30 AM to 6:59 AM | 690 (9.0%) | 691 (10.7%) |
| 7:00 AM to 7:29 AM | 1,101 (14.3%) | 1,167 (18.0%) |
| 7:30 AM to 7:59 AM | 989 (12.9%) | 683 (10.5%) |
| 8:00 AM to 8:29 AM | 594 (7.7%) | 873 (13.5%) |
| 8:30 AM to 8:59 AM | 456 (5.9%) | 537 (8.3%) |
| 9:00 AM to 9:59 AM | 848 (11.0%) | 452 (7.0%) |
| 10:00 AM to 10:59 AM | 318 (4.1%) | 239 (3.7%) |
| 11:00 AM to 11:59 AM | 4 (0.1%) | 51 (0.8%) |
| 12:00 PM to 3:59 PM | 331 (4.3%) | 254 (3.9%) |
| 4:00 PM to 11:59 PM | 263 (3.4%) | 397 (6.1%) |
| Total | 7,693 (100.0%) | 6,474 (100.0%) |
Housing Occupancy in South Riding
Occupancy by Ownership in South Riding
Of the total 10,410 dwellings in South Riding, owner-occupied units account for 8,707 (83.6%), while renter-occupied units make up 1,703 (16.4%).
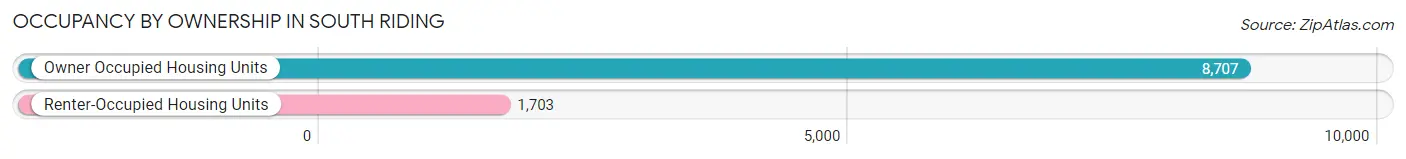
| Occupancy | # Housing Units | % Housing Units |
| Owner Occupied Housing Units | 8,707 | 83.6% |
| Renter-Occupied Housing Units | 1,703 | 16.4% |
| Total Occupied Housing Units | 10,410 | 100.0% |
Occupancy by Household Size in South Riding
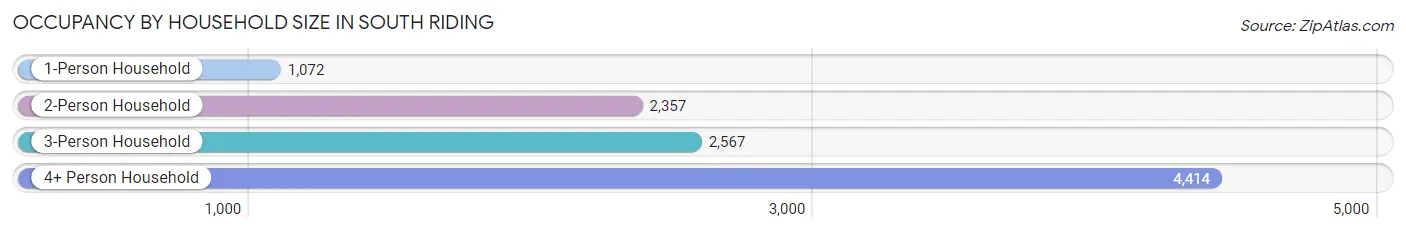
| Household Size | # Housing Units | % Housing Units |
| 1-Person Household | 1,072 | 10.3% |
| 2-Person Household | 2,357 | 22.6% |
| 3-Person Household | 2,567 | 24.7% |
| 4+ Person Household | 4,414 | 42.4% |
| Total Housing Units | 10,410 | 100.0% |
Occupancy by Ownership by Household Size in South Riding
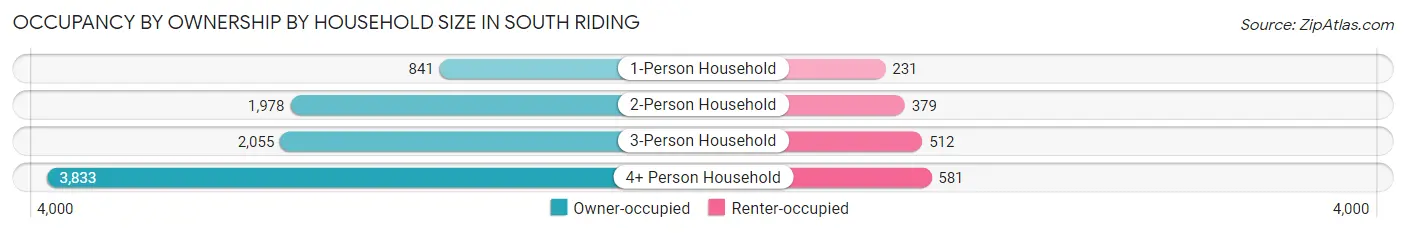
| Household Size | Owner-occupied | Renter-occupied |
| 1-Person Household | 841 (78.4%) | 231 (21.5%) |
| 2-Person Household | 1,978 (83.9%) | 379 (16.1%) |
| 3-Person Household | 2,055 (80.0%) | 512 (20.0%) |
| 4+ Person Household | 3,833 (86.8%) | 581 (13.2%) |
| Total Housing Units | 8,707 (83.6%) | 1,703 (16.4%) |
Occupancy by Educational Attainment in South Riding
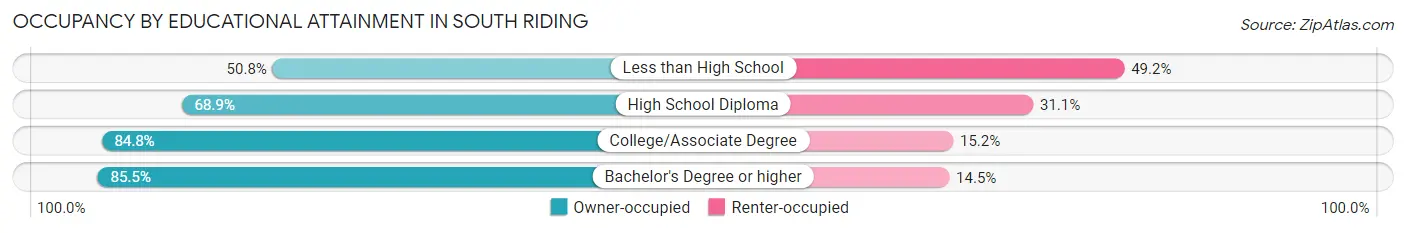
| Household Size | Owner-occupied | Renter-occupied |
| Less than High School | 62 (50.8%) | 60 (49.2%) |
| High School Diploma | 589 (68.9%) | 266 (31.1%) |
| College/Associate Degree | 1,313 (84.8%) | 236 (15.2%) |
| Bachelor's Degree or higher | 6,743 (85.5%) | 1,141 (14.5%) |
Occupancy by Age of Householder in South Riding
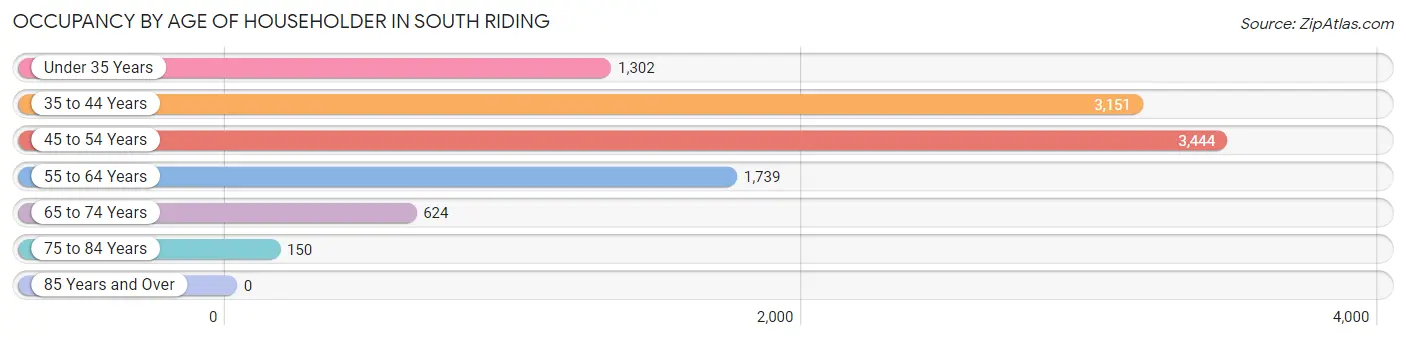
| Age Bracket | # Households | % Households |
| Under 35 Years | 1,302 | 12.5% |
| 35 to 44 Years | 3,151 | 30.3% |
| 45 to 54 Years | 3,444 | 33.1% |
| 55 to 64 Years | 1,739 | 16.7% |
| 65 to 74 Years | 624 | 6.0% |
| 75 to 84 Years | 150 | 1.4% |
| 85 Years and Over | 0 | 0.0% |
| Total | 10,410 | 100.0% |
Housing Finances in South Riding
Median Income by Occupancy in South Riding
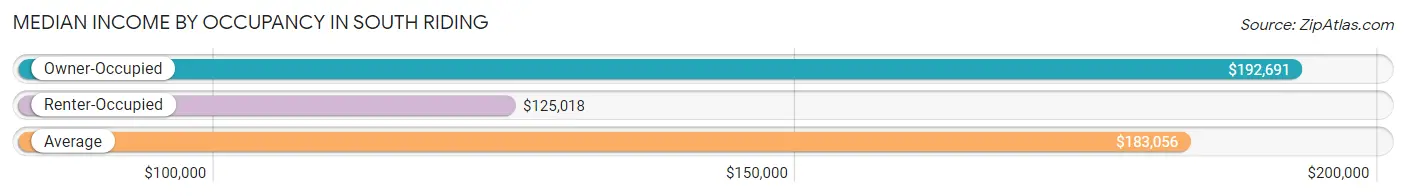
| Occupancy Type | # Households | Median Income |
| Owner-Occupied | 8,707 (83.6%) | $192,691 |
| Renter-Occupied | 1,703 (16.4%) | $125,018 |
| Average | 10,410 (100.0%) | $183,056 |
Occupancy by Householder Income Bracket in South Riding
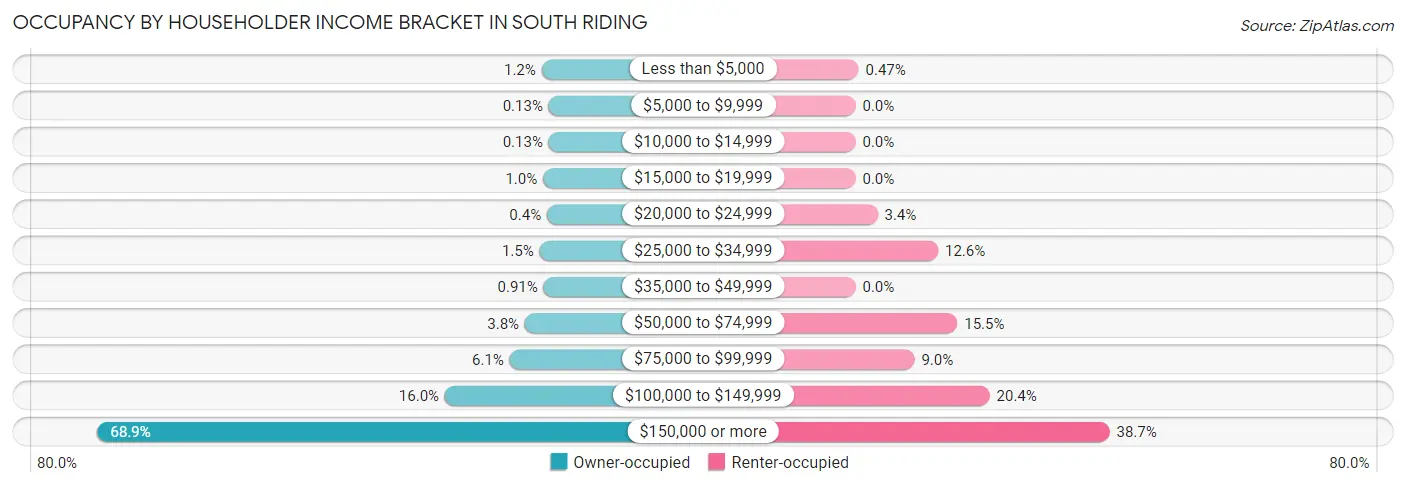
| Income Bracket | Owner-occupied | Renter-occupied |
| Less than $5,000 | 106 (1.2%) | 8 (0.5%) |
| $5,000 to $9,999 | 11 (0.1%) | 0 (0.0%) |
| $10,000 to $14,999 | 11 (0.1%) | 0 (0.0%) |
| $15,000 to $19,999 | 87 (1.0%) | 0 (0.0%) |
| $20,000 to $24,999 | 35 (0.4%) | 57 (3.4%) |
| $25,000 to $34,999 | 133 (1.5%) | 214 (12.6%) |
| $35,000 to $49,999 | 79 (0.9%) | 0 (0.0%) |
| $50,000 to $74,999 | 327 (3.8%) | 264 (15.5%) |
| $75,000 to $99,999 | 529 (6.1%) | 153 (9.0%) |
| $100,000 to $149,999 | 1,389 (16.0%) | 348 (20.4%) |
| $150,000 or more | 6,000 (68.9%) | 659 (38.7%) |
| Total | 8,707 (100.0%) | 1,703 (100.0%) |
Monthly Housing Cost Tiers in South Riding
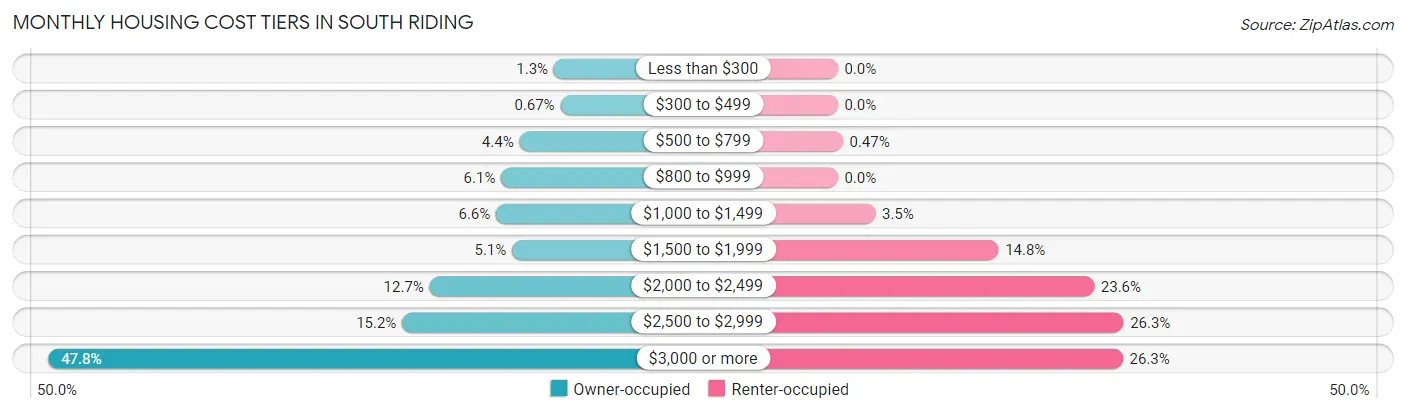
| Monthly Cost | Owner-occupied | Renter-occupied |
| Less than $300 | 111 (1.3%) | 0 (0.0%) |
| $300 to $499 | 58 (0.7%) | 0 (0.0%) |
| $500 to $799 | 387 (4.4%) | 8 (0.5%) |
| $800 to $999 | 533 (6.1%) | 0 (0.0%) |
| $1,000 to $1,499 | 574 (6.6%) | 59 (3.5%) |
| $1,500 to $1,999 | 446 (5.1%) | 252 (14.8%) |
| $2,000 to $2,499 | 1,107 (12.7%) | 402 (23.6%) |
| $2,500 to $2,999 | 1,327 (15.2%) | 448 (26.3%) |
| $3,000 or more | 4,164 (47.8%) | 447 (26.3%) |
| Total | 8,707 (100.0%) | 1,703 (100.0%) |
Physical Housing Characteristics in South Riding
Housing Structures in South Riding
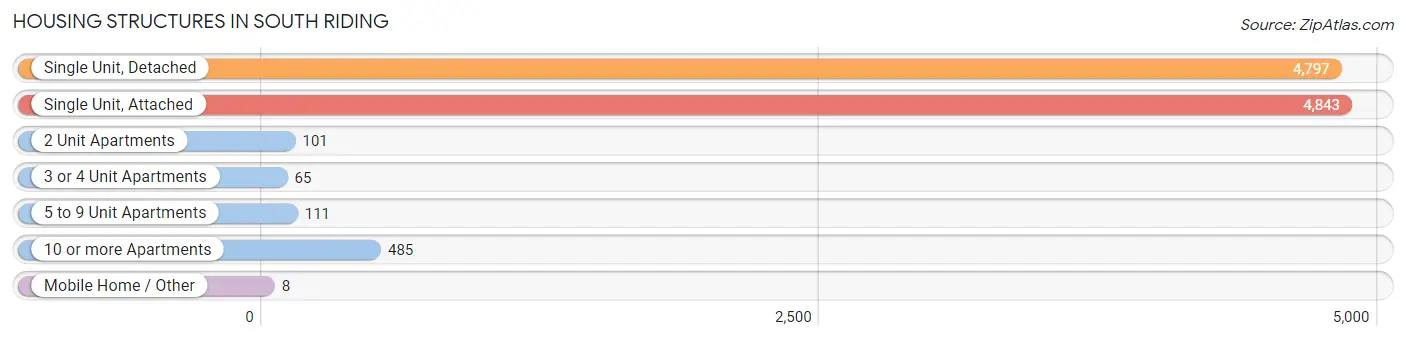
| Structure Type | # Housing Units | % Housing Units |
| Single Unit, Detached | 4,797 | 46.1% |
| Single Unit, Attached | 4,843 | 46.5% |
| 2 Unit Apartments | 101 | 1.0% |
| 3 or 4 Unit Apartments | 65 | 0.6% |
| 5 to 9 Unit Apartments | 111 | 1.1% |
| 10 or more Apartments | 485 | 4.7% |
| Mobile Home / Other | 8 | 0.1% |
| Total | 10,410 | 100.0% |
Housing Structures by Occupancy in South Riding
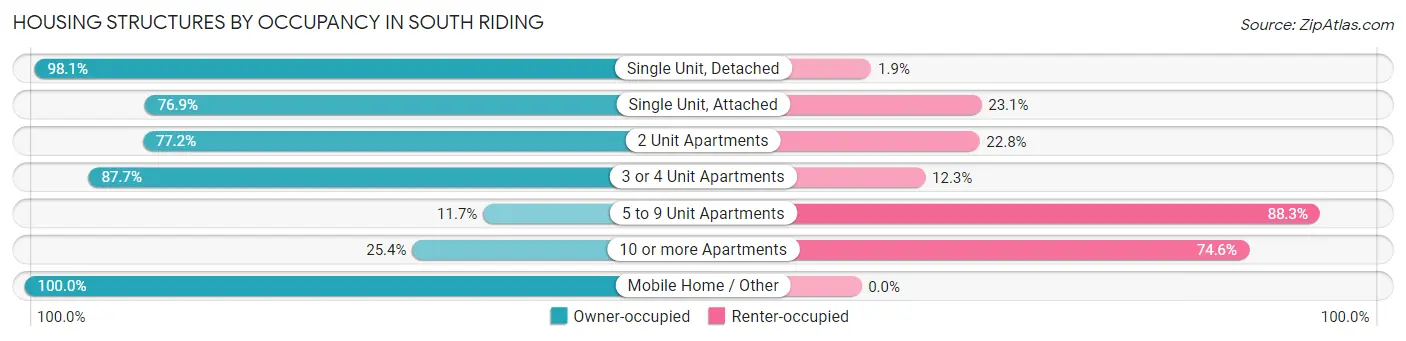
| Structure Type | Owner-occupied | Renter-occupied |
| Single Unit, Detached | 4,705 (98.1%) | 92 (1.9%) |
| Single Unit, Attached | 3,723 (76.9%) | 1,120 (23.1%) |
| 2 Unit Apartments | 78 (77.2%) | 23 (22.8%) |
| 3 or 4 Unit Apartments | 57 (87.7%) | 8 (12.3%) |
| 5 to 9 Unit Apartments | 13 (11.7%) | 98 (88.3%) |
| 10 or more Apartments | 123 (25.4%) | 362 (74.6%) |
| Mobile Home / Other | 8 (100.0%) | 0 (0.0%) |
| Total | 8,707 (83.6%) | 1,703 (16.4%) |
Housing Structures by Number of Rooms in South Riding
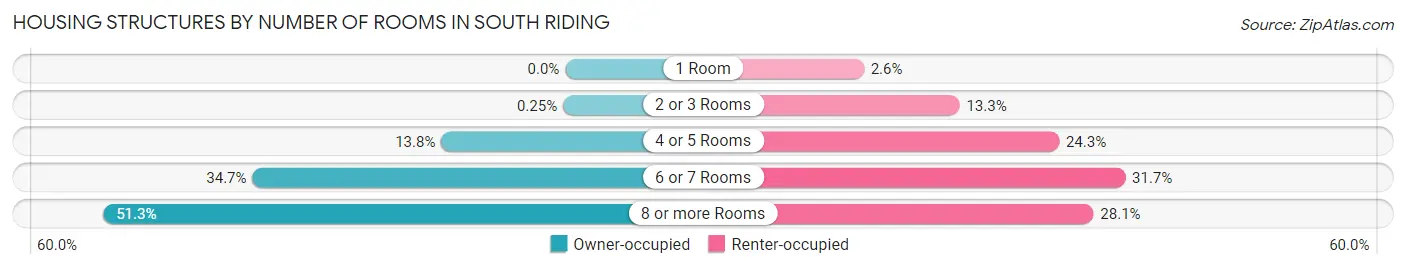
| Number of Rooms | Owner-occupied | Renter-occupied |
| 1 Room | 0 (0.0%) | 45 (2.6%) |
| 2 or 3 Rooms | 22 (0.3%) | 226 (13.3%) |
| 4 or 5 Rooms | 1,198 (13.8%) | 414 (24.3%) |
| 6 or 7 Rooms | 3,023 (34.7%) | 539 (31.7%) |
| 8 or more Rooms | 4,464 (51.3%) | 479 (28.1%) |
| Total | 8,707 (100.0%) | 1,703 (100.0%) |
Housing Structure by Heating Type in South Riding
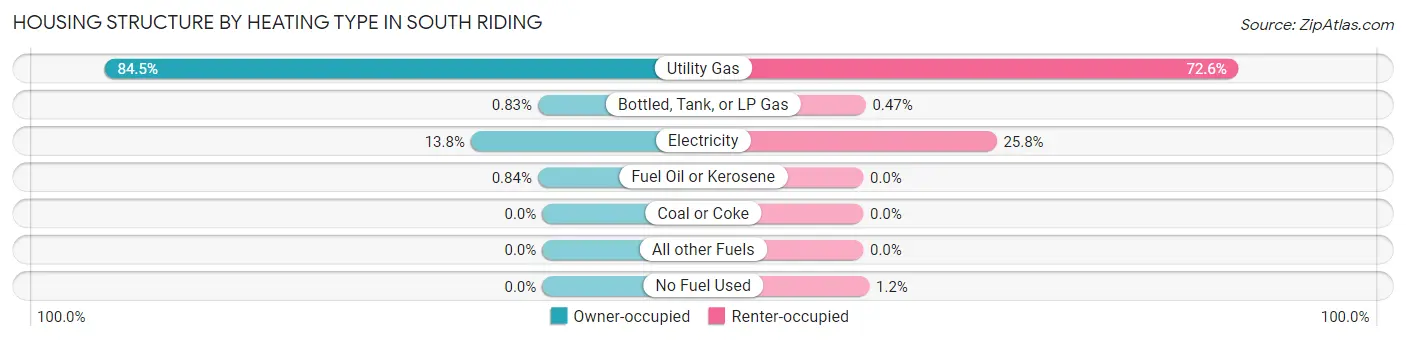
| Heating Type | Owner-occupied | Renter-occupied |
| Utility Gas | 7,361 (84.5%) | 1,236 (72.6%) |
| Bottled, Tank, or LP Gas | 72 (0.8%) | 8 (0.5%) |
| Electricity | 1,201 (13.8%) | 439 (25.8%) |
| Fuel Oil or Kerosene | 73 (0.8%) | 0 (0.0%) |
| Coal or Coke | 0 (0.0%) | 0 (0.0%) |
| All other Fuels | 0 (0.0%) | 0 (0.0%) |
| No Fuel Used | 0 (0.0%) | 20 (1.2%) |
| Total | 8,707 (100.0%) | 1,703 (100.0%) |
Household Vehicle Usage in South Riding
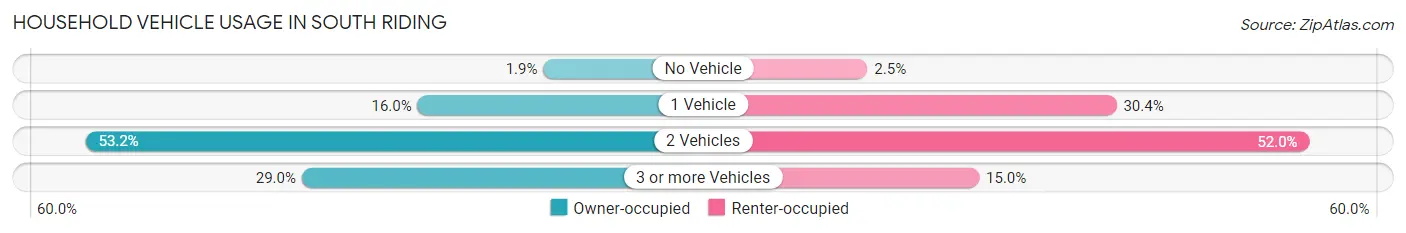
| Vehicles per Household | Owner-occupied | Renter-occupied |
| No Vehicle | 165 (1.9%) | 43 (2.5%) |
| 1 Vehicle | 1,391 (16.0%) | 518 (30.4%) |
| 2 Vehicles | 4,630 (53.2%) | 886 (52.0%) |
| 3 or more Vehicles | 2,521 (28.9%) | 256 (15.0%) |
| Total | 8,707 (100.0%) | 1,703 (100.0%) |
Real Estate & Mortgages in South Riding
Real Estate and Mortgage Overview in South Riding
| Characteristic | Without Mortgage | With Mortgage |
| Housing Units | 1,272 | 7,435 |
| Median Property Value | $598,300 | $660,600 |
| Median Household Income | $183,558 | $5,207 |
| Monthly Housing Costs | $876 | $4,156 |
| Real Estate Taxes | $5,703 | $96 |
Property Value by Mortgage Status in South Riding
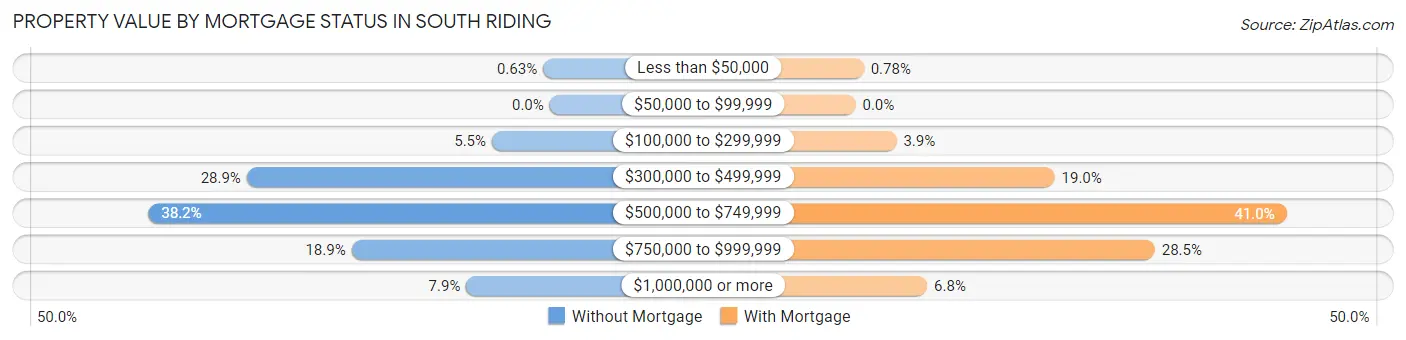
| Property Value | Without Mortgage | With Mortgage |
| Less than $50,000 | 8 (0.6%) | 58 (0.8%) |
| $50,000 to $99,999 | 0 (0.0%) | 0 (0.0%) |
| $100,000 to $299,999 | 70 (5.5%) | 290 (3.9%) |
| $300,000 to $499,999 | 367 (28.8%) | 1,410 (19.0%) |
| $500,000 to $749,999 | 486 (38.2%) | 3,051 (41.0%) |
| $750,000 to $999,999 | 240 (18.9%) | 2,119 (28.5%) |
| $1,000,000 or more | 101 (7.9%) | 507 (6.8%) |
| Total | 1,272 (100.0%) | 7,435 (100.0%) |
Household Income by Mortgage Status in South Riding
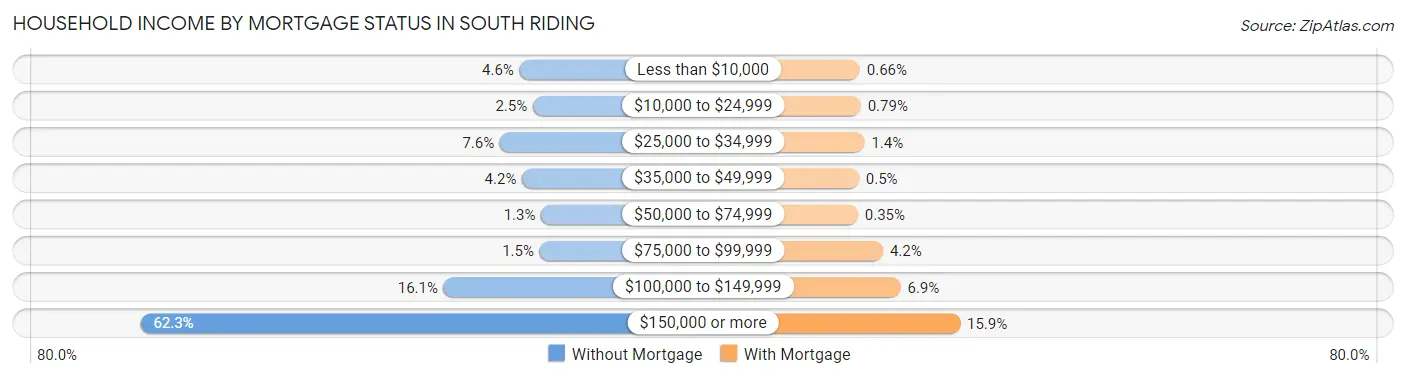
| Household Income | Without Mortgage | With Mortgage |
| Less than $10,000 | 58 (4.6%) | 49 (0.7%) |
| $10,000 to $24,999 | 32 (2.5%) | 59 (0.8%) |
| $25,000 to $34,999 | 96 (7.5%) | 101 (1.4%) |
| $35,000 to $49,999 | 53 (4.2%) | 37 (0.5%) |
| $50,000 to $74,999 | 16 (1.3%) | 26 (0.4%) |
| $75,000 to $99,999 | 19 (1.5%) | 311 (4.2%) |
| $100,000 to $149,999 | 205 (16.1%) | 510 (6.9%) |
| $150,000 or more | 793 (62.3%) | 1,184 (15.9%) |
| Total | 1,272 (100.0%) | 7,435 (100.0%) |
Property Value to Household Income Ratio in South Riding
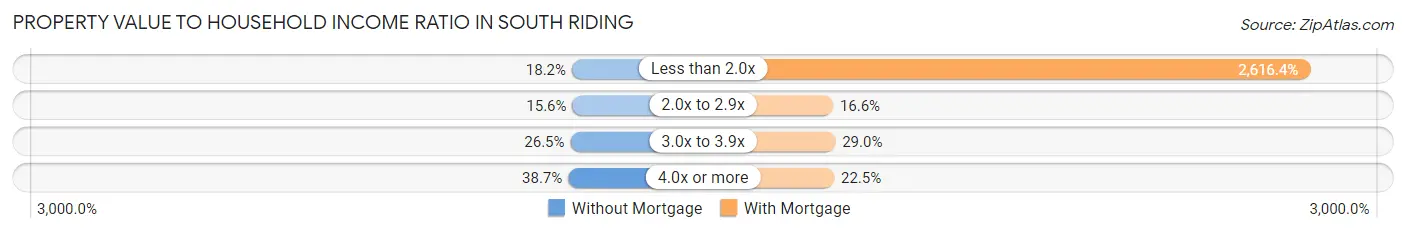
| Value-to-Income Ratio | Without Mortgage | With Mortgage |
| Less than 2.0x | 232 (18.2%) | 194,530 (2,616.4%) |
| 2.0x to 2.9x | 199 (15.6%) | 1,233 (16.6%) |
| 3.0x to 3.9x | 337 (26.5%) | 2,155 (29.0%) |
| 4.0x or more | 492 (38.7%) | 1,672 (22.5%) |
| Total | 1,272 (100.0%) | 7,435 (100.0%) |
Real Estate Taxes by Mortgage Status in South Riding
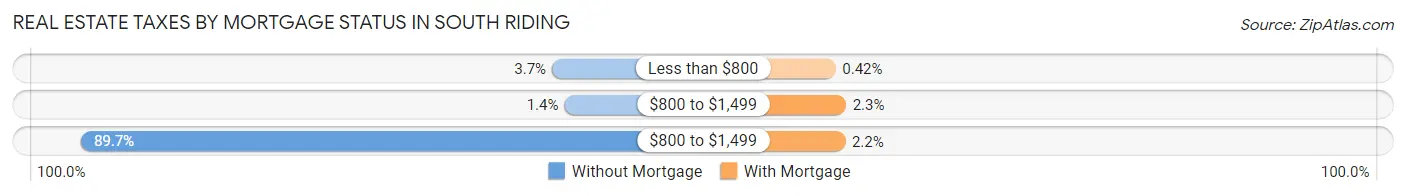
| Property Taxes | Without Mortgage | With Mortgage |
| Less than $800 | 47 (3.7%) | 31 (0.4%) |
| $800 to $1,499 | 18 (1.4%) | 172 (2.3%) |
| $800 to $1,499 | 1,141 (89.7%) | 162 (2.2%) |
| Total | 1,272 (100.0%) | 7,435 (100.0%) |
Health & Disability in South Riding
Health Insurance Coverage by Age in South Riding
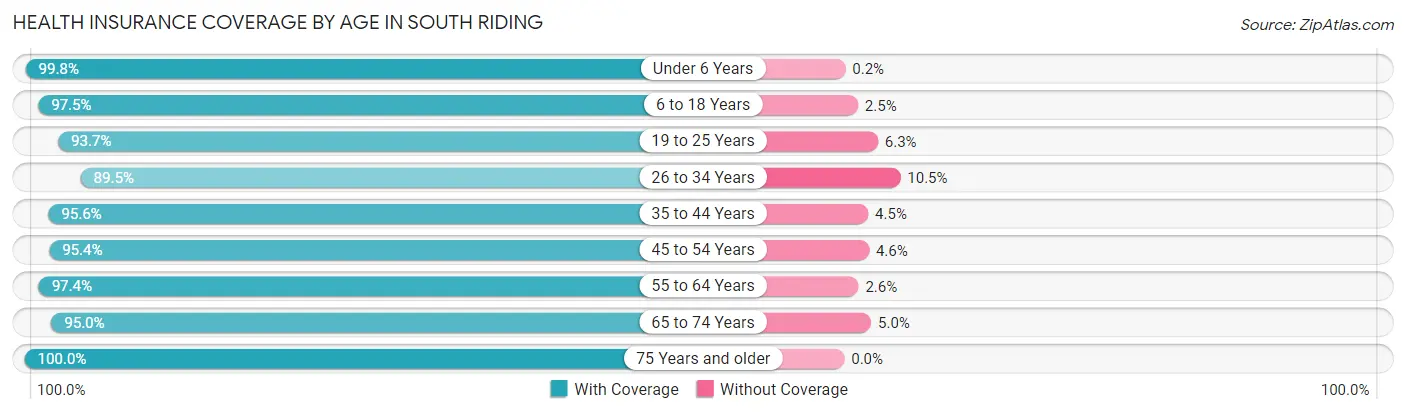
| Age Bracket | With Coverage | Without Coverage |
| Under 6 Years | 2,525 (99.8%) | 5 (0.2%) |
| 6 to 18 Years | 7,535 (97.5%) | 196 (2.5%) |
| 19 to 25 Years | 1,722 (93.7%) | 115 (6.3%) |
| 26 to 34 Years | 2,875 (89.5%) | 336 (10.5%) |
| 35 to 44 Years | 6,311 (95.6%) | 294 (4.4%) |
| 45 to 54 Years | 5,848 (95.4%) | 282 (4.6%) |
| 55 to 64 Years | 3,172 (97.4%) | 86 (2.6%) |
| 65 to 74 Years | 1,139 (95.0%) | 60 (5.0%) |
| 75 Years and older | 589 (100.0%) | 0 (0.0%) |
| Total | 31,716 (95.9%) | 1,374 (4.2%) |
Health Insurance Coverage by Citizenship Status in South Riding
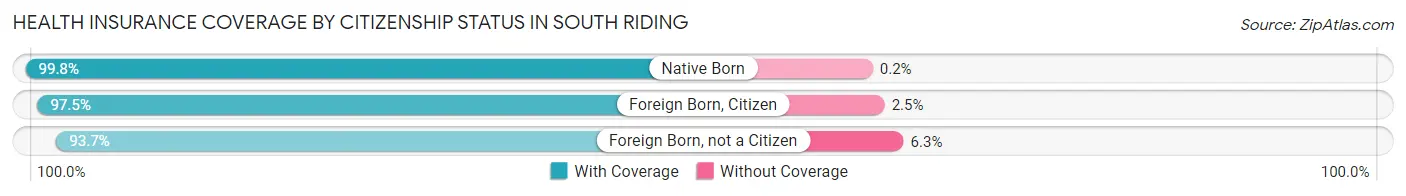
| Citizenship Status | With Coverage | Without Coverage |
| Native Born | 2,525 (99.8%) | 5 (0.2%) |
| Foreign Born, Citizen | 7,535 (97.5%) | 196 (2.5%) |
| Foreign Born, not a Citizen | 1,722 (93.7%) | 115 (6.3%) |
Health Insurance Coverage by Household Income in South Riding
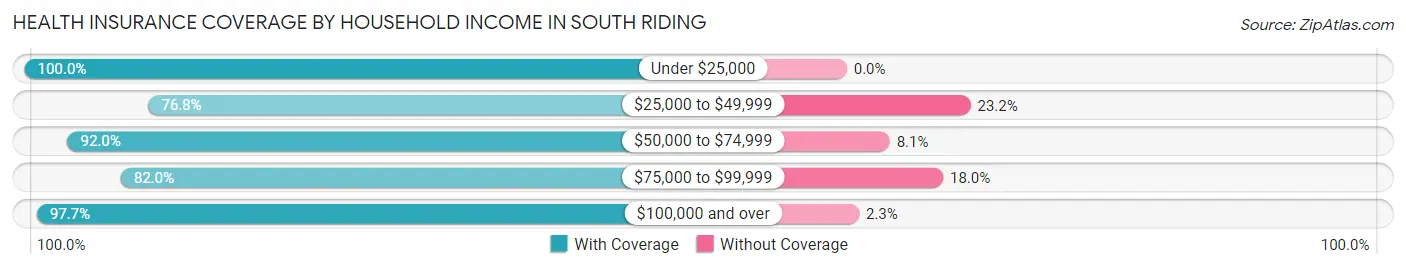
| Household Income | With Coverage | Without Coverage |
| Under $25,000 | 822 (100.0%) | 0 (0.0%) |
| $25,000 to $49,999 | 881 (76.8%) | 266 (23.2%) |
| $50,000 to $74,999 | 1,279 (91.9%) | 112 (8.1%) |
| $75,000 to $99,999 | 1,646 (82.0%) | 362 (18.0%) |
| $100,000 and over | 27,088 (97.7%) | 634 (2.3%) |
Public vs Private Health Insurance Coverage by Age in South Riding
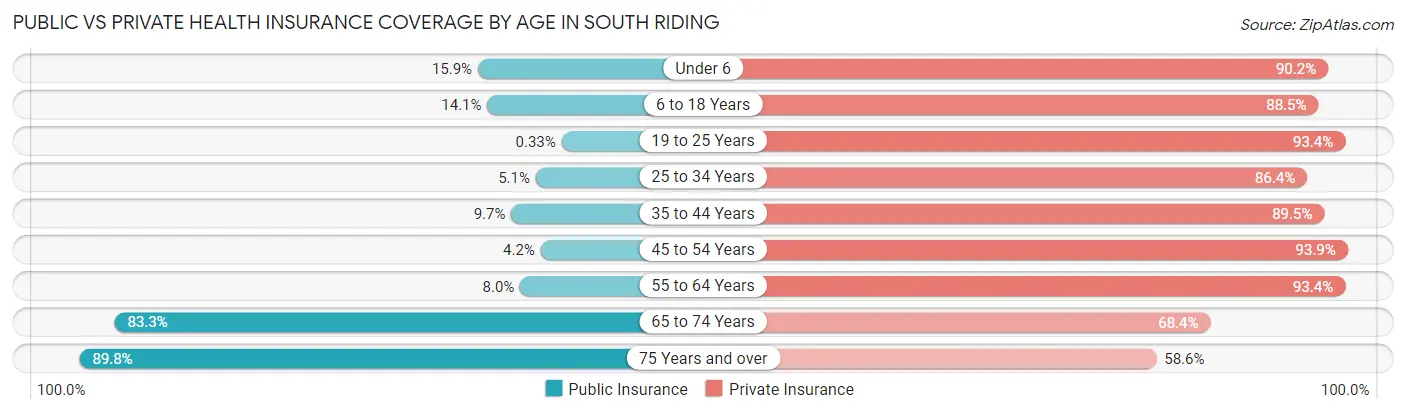
| Age Bracket | Public Insurance | Private Insurance |
| Under 6 | 401 (15.9%) | 2,283 (90.2%) |
| 6 to 18 Years | 1,090 (14.1%) | 6,838 (88.4%) |
| 19 to 25 Years | 6 (0.3%) | 1,716 (93.4%) |
| 25 to 34 Years | 164 (5.1%) | 2,773 (86.4%) |
| 35 to 44 Years | 638 (9.7%) | 5,914 (89.5%) |
| 45 to 54 Years | 258 (4.2%) | 5,755 (93.9%) |
| 55 to 64 Years | 261 (8.0%) | 3,043 (93.4%) |
| 65 to 74 Years | 999 (83.3%) | 820 (68.4%) |
| 75 Years and over | 529 (89.8%) | 345 (58.6%) |
| Total | 4,346 (13.1%) | 29,487 (89.1%) |
Disability Status by Sex by Age in South Riding
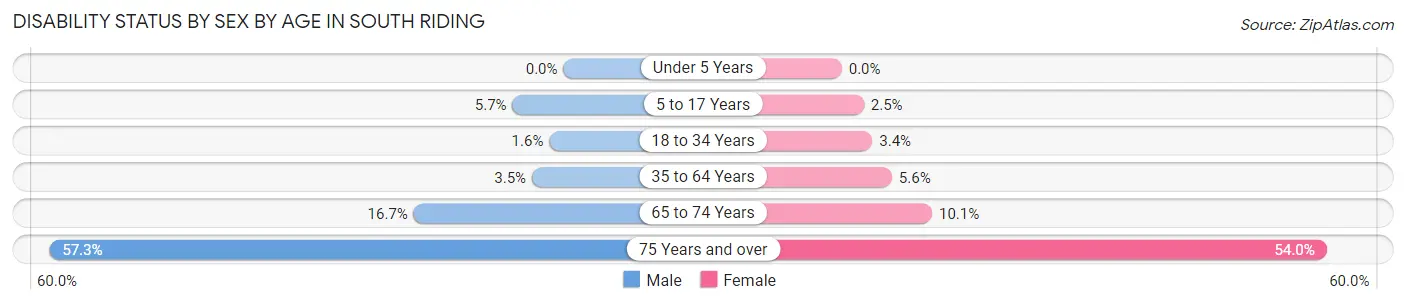
| Age Bracket | Male | Female |
| Under 5 Years | 0 (0.0%) | 0 (0.0%) |
| 5 to 17 Years | 256 (5.7%) | 83 (2.5%) |
| 18 to 34 Years | 37 (1.6%) | 106 (3.4%) |
| 35 to 64 Years | 292 (3.5%) | 427 (5.6%) |
| 65 to 74 Years | 102 (16.7%) | 59 (10.1%) |
| 75 Years and over | 158 (57.3%) | 169 (54.0%) |
Disability Class by Sex by Age in South Riding
Disability Class: Hearing Difficulty
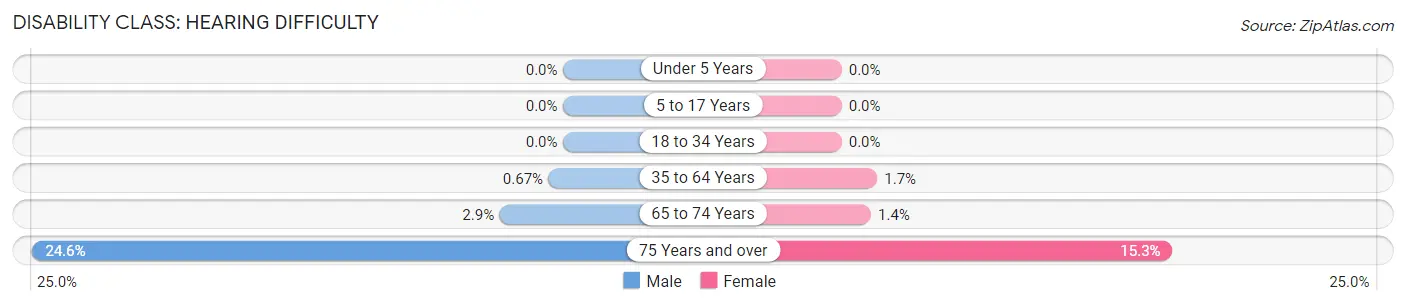
| Age Bracket | Male | Female |
| Under 5 Years | 0 (0.0%) | 0 (0.0%) |
| 5 to 17 Years | 0 (0.0%) | 0 (0.0%) |
| 18 to 34 Years | 0 (0.0%) | 0 (0.0%) |
| 35 to 64 Years | 56 (0.7%) | 126 (1.7%) |
| 65 to 74 Years | 18 (2.9%) | 8 (1.4%) |
| 75 Years and over | 68 (24.6%) | 48 (15.3%) |
Disability Class: Vision Difficulty
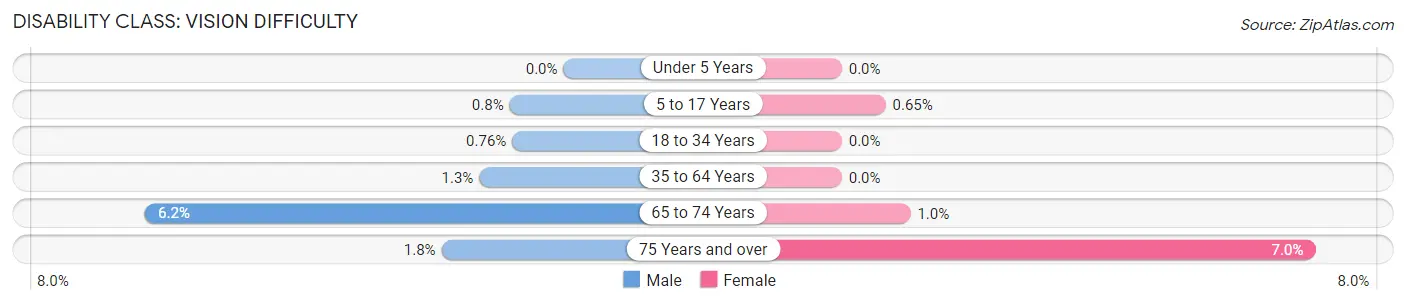
| Age Bracket | Male | Female |
| Under 5 Years | 0 (0.0%) | 0 (0.0%) |
| 5 to 17 Years | 36 (0.8%) | 22 (0.6%) |
| 18 to 34 Years | 18 (0.8%) | 0 (0.0%) |
| 35 to 64 Years | 104 (1.3%) | 0 (0.0%) |
| 65 to 74 Years | 38 (6.2%) | 6 (1.0%) |
| 75 Years and over | 5 (1.8%) | 22 (7.0%) |
Disability Class: Cognitive Difficulty
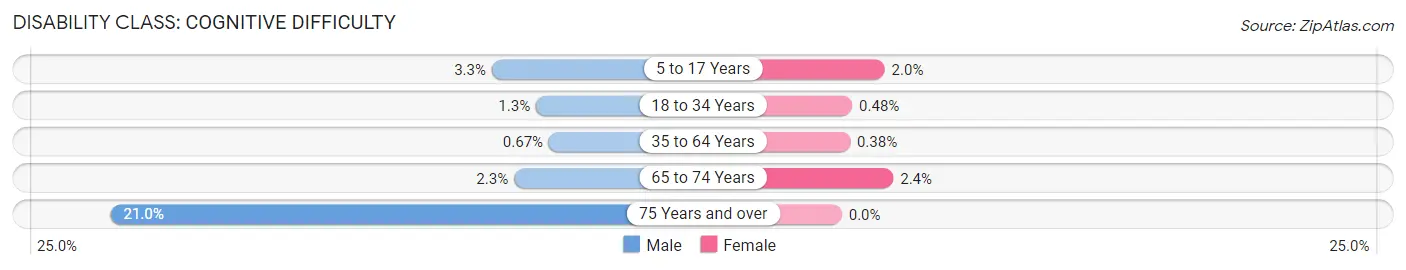
| Age Bracket | Male | Female |
| 5 to 17 Years | 150 (3.3%) | 67 (2.0%) |
| 18 to 34 Years | 30 (1.3%) | 15 (0.5%) |
| 35 to 64 Years | 56 (0.7%) | 29 (0.4%) |
| 65 to 74 Years | 14 (2.3%) | 14 (2.4%) |
| 75 Years and over | 58 (21.0%) | 0 (0.0%) |
Disability Class: Ambulatory Difficulty
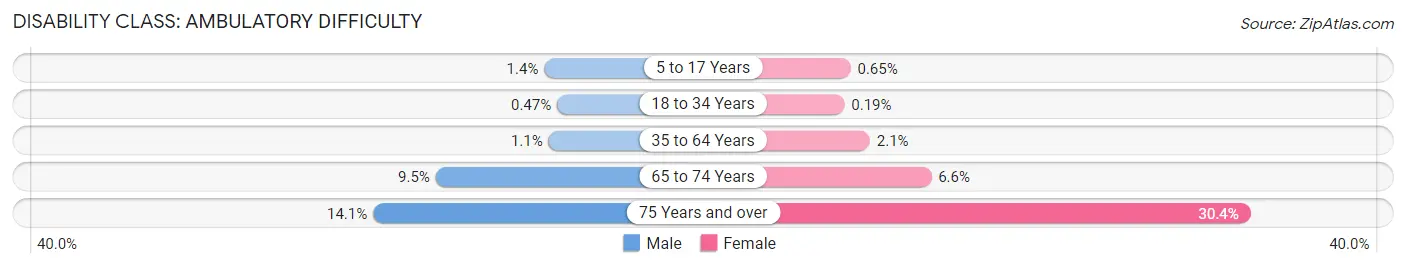
| Age Bracket | Male | Female |
| 5 to 17 Years | 64 (1.4%) | 22 (0.6%) |
| 18 to 34 Years | 11 (0.5%) | 6 (0.2%) |
| 35 to 64 Years | 92 (1.1%) | 159 (2.1%) |
| 65 to 74 Years | 58 (9.5%) | 39 (6.6%) |
| 75 Years and over | 39 (14.1%) | 95 (30.3%) |
Disability Class: Self-Care Difficulty
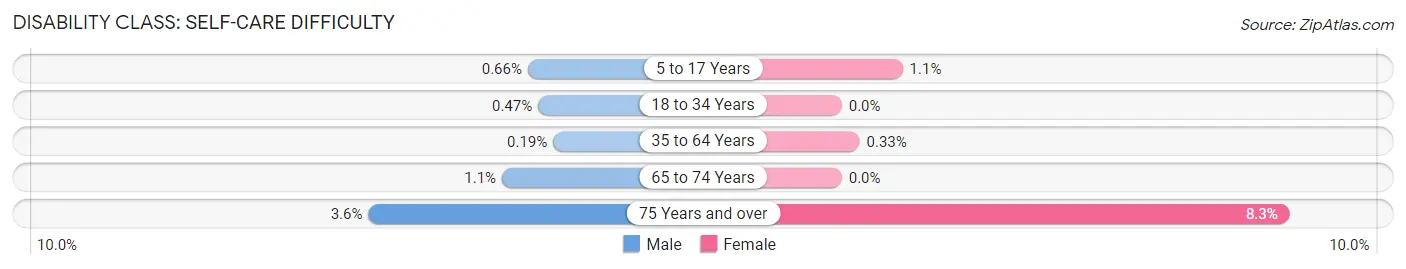
| Age Bracket | Male | Female |
| 5 to 17 Years | 30 (0.7%) | 38 (1.1%) |
| 18 to 34 Years | 11 (0.5%) | 0 (0.0%) |
| 35 to 64 Years | 16 (0.2%) | 25 (0.3%) |
| 65 to 74 Years | 7 (1.1%) | 0 (0.0%) |
| 75 Years and over | 10 (3.6%) | 26 (8.3%) |
Technology Access in South Riding
Computing Device Access in South Riding
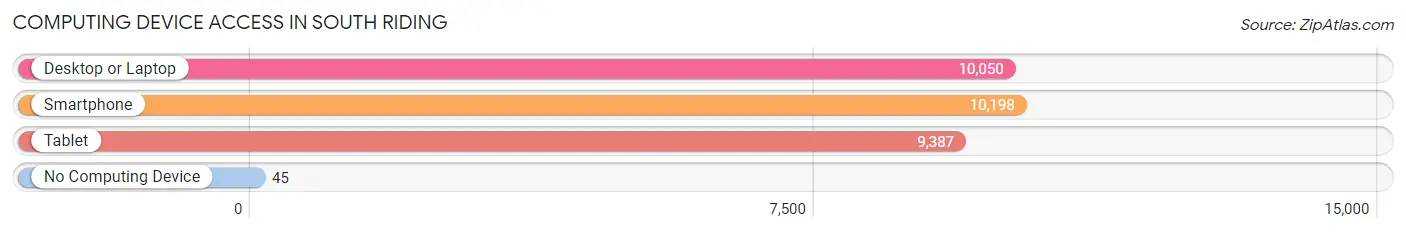
| Device Type | # Households | % Households |
| Desktop or Laptop | 10,050 | 96.5% |
| Smartphone | 10,198 | 98.0% |
| Tablet | 9,387 | 90.2% |
| No Computing Device | 45 | 0.4% |
| Total | 10,410 | 100.0% |
Internet Access in South Riding
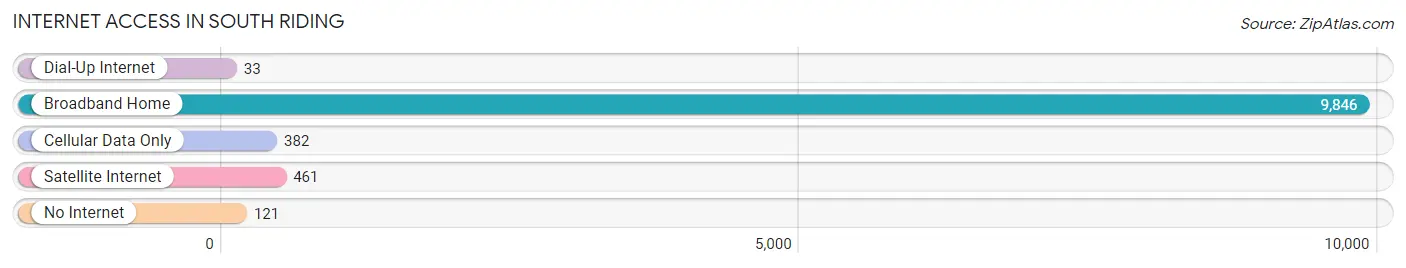
| Internet Type | # Households | % Households |
| Dial-Up Internet | 33 | 0.3% |
| Broadband Home | 9,846 | 94.6% |
| Cellular Data Only | 382 | 3.7% |
| Satellite Internet | 461 | 4.4% |
| No Internet | 121 | 1.2% |
| Total | 10,410 | 100.0% |
South Riding Summary
History
South Riding is an unincorporated community located in Loudoun County, Virginia. It is situated in the eastern part of the county, approximately 25 miles west of Washington, D.C. The area was first settled in the late 1700s by Quakers and German immigrants. The community was originally known as “South Riding of Fairfax” and was part of Fairfax County until Loudoun County was formed in 1757.
The area was primarily agricultural until the late 19th century, when the Washington and Old Dominion Railroad (W&OD) was built through the area. This allowed for the development of a small commercial district along the railroad line. The area was also home to several small farms and orchards.
In the early 20th century, the area began to experience rapid growth as Washington, D.C.’s suburbs expanded. The area was annexed by the Town of Herndon in the 1950s and was later incorporated as the Town of South Riding in 1975.
Geography
South Riding is located in eastern Loudoun County, Virginia. It is situated approximately 25 miles west of Washington, D.C. The area is bordered by the Town of Herndon to the north, the Town of Sterling to the east, and the Town of Chantilly to the south.
The area is primarily composed of rolling hills and valleys. The terrain is generally flat, with some areas of higher elevation. The area is drained by several small creeks, including Goose Creek, Broad Run, and Difficult Run.
Economy
South Riding’s economy is primarily based on the service industry. The area is home to several large employers, including the Dulles Technology Corridor, which is home to many technology and defense contractors. The area is also home to several retail establishments, including a Walmart Supercenter, a Target, and a Costco.
The area is also home to several wineries and breweries, as well as several small businesses. The area is also home to several corporate headquarters, including the headquarters of the National Rural Electric Cooperative Association.
Demographics
As of the 2010 census, South Riding had a population of 24,256. The racial makeup of the area was 75.3% White, 11.2% Asian, 8.2% African American, and 5.3% Hispanic or Latino.
The median household income in South Riding was $117,837, and the median family income was $133,837. The per capita income was $50,837. The unemployment rate was 3.2%.
The area is served by the Loudoun County Public Schools system. The area is also home to several private schools, including the South Riding Montessori School and the South Riding Christian Academy.
Common Questions
What is Per Capita Income in South Riding?
Per Capita income in South Riding is $69,632.
What is the Median Family Income in South Riding?
Median Family Income in South Riding is $192,654.
What is the Median Household income in South Riding?
Median Household Income in South Riding is $183,056.
What is Income or Wage Gap in South Riding?
Income or Wage Gap in South Riding is 46.8%.
Women in South Riding earn 53.2 cents for every dollar earned by a man.
What is Inequality or Gini Index in South Riding?
Inequality or Gini Index in South Riding is 0.36.
What is the Total Population of South Riding?
Total Population of South Riding is 33,358.
What is the Total Male Population of South Riding?
Total Male Population of South Riding is 17,060.
What is the Total Female Population of South Riding?
Total Female Population of South Riding is 16,298.
What is the Ratio of Males per 100 Females in South Riding?
There are 104.68 Males per 100 Females in South Riding.
What is the Ratio of Females per 100 Males in South Riding?
There are 95.53 Females per 100 Males in South Riding.
What is the Median Population Age in South Riding?
Median Population Age in South Riding is 37.4 Years.
What is the Average Family Size in South Riding
Average Family Size in South Riding is 3.4 People.
What is the Average Household Size in South Riding
Average Household Size in South Riding is 3.2 People.
How Large is the Labor Force in South Riding?
There are 19,520 People in the Labor Forcein in South Riding.
What is the Percentage of People in the Labor Force in South Riding?
79.6% of People are in the Labor Force in South Riding.
What is the Unemployment Rate in South Riding?
Unemployment Rate in South Riding is 4.3%.