Cities with the Most Births per 1,000 Women Over the Age of 35 in Virginia
RELATED REPORTS & OPTIONS
Highest Birth Rate | Women 35+
Virginia
Compare Cities
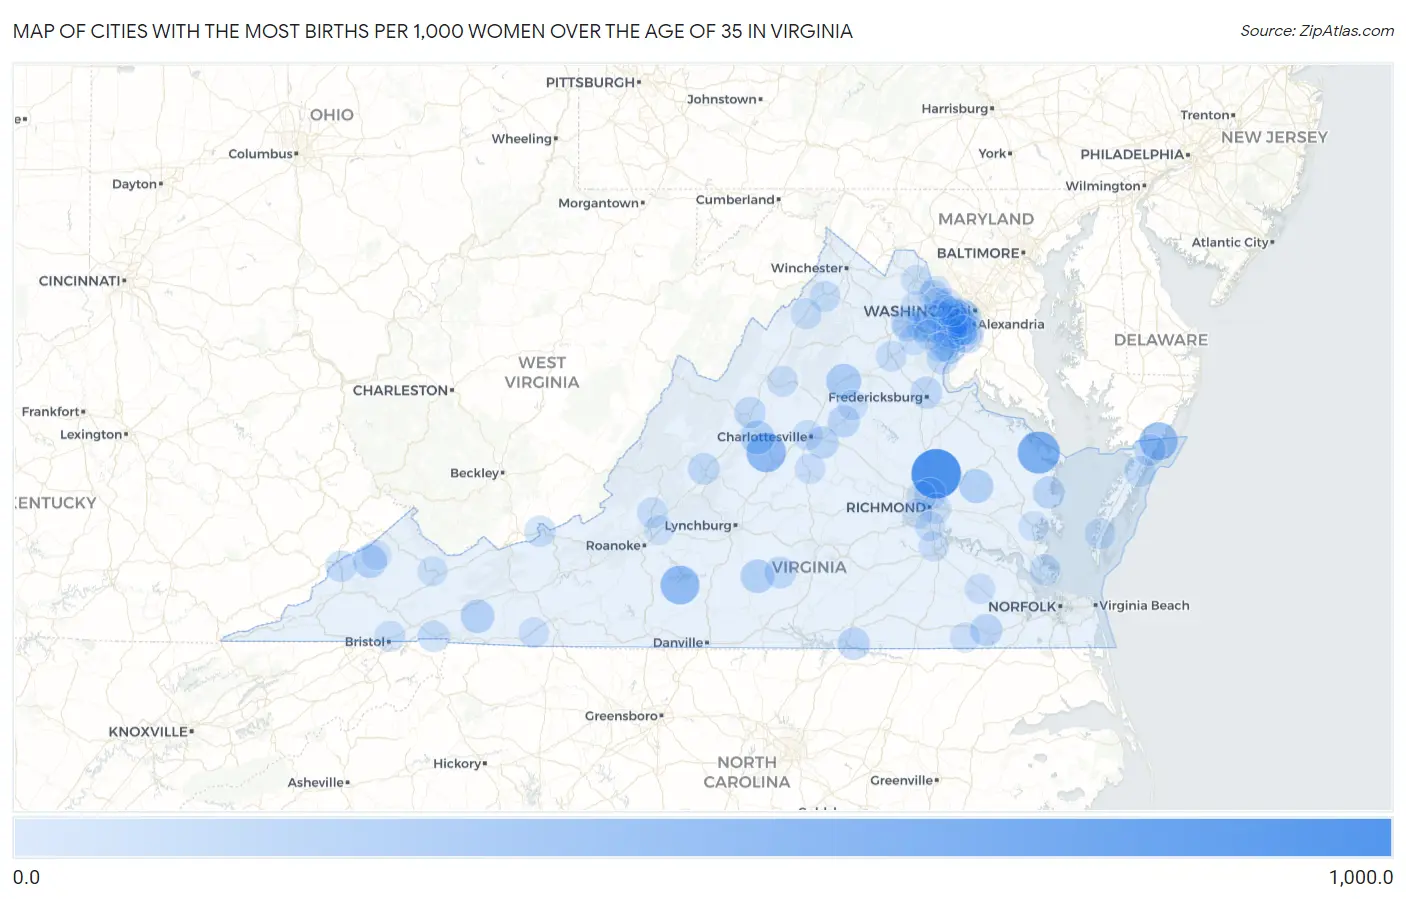
Map of Cities with the Most Births per 1,000 Women Over the Age of 35 in Virginia
0.0
1,000.0
Cities with the Most Births per 1,000 Women Over the Age of 35 in Virginia
| City | Births / 1,000 Women | vs State | vs National | |
| 1. | Hanover | 1,000.0 | 32.0(+968)#1 | 32.0(+968)#33 |
| 2. | Heathsville | 625.0 | 32.0(+593)#2 | 32.0(+593)#95 |
| 3. | Weems | 543.0 | 32.0(+511)#3 | 32.0(+511)#114 |
| 4. | Nellysford | 492.0 | 32.0(+460)#4 | 32.0(+460)#153 |
| 5. | Penhook | 462.0 | 32.0(+430)#5 | 32.0(+430)#167 |
| 6. | Captains Cove | 421.0 | 32.0(+389)#6 | 32.0(+389)#201 |
| 7. | Brightwood | 276.0 | 32.0(+244)#7 | 32.0(+244)#389 |
| 8. | King William | 227.0 | 32.0(+195)#8 | 32.0(+195)#557 |
| 9. | Lyndhurst | 221.0 | 32.0(+189)#9 | 32.0(+189)#592 |
| 10. | Brookneal | 213.0 | 32.0(+181)#10 | 32.0(+181)#623 |
| 11. | Sugar Grove | 209.0 | 32.0(+177)#11 | 32.0(+177)#652 |
| 12. | Clinchco | 203.0 | 32.0(+171)#12 | 32.0(+171)#679 |
| 13. | Bailey S Crossroads | 162.0 | 32.0(+130)#13 | 32.0(+130)#946 |
| 14. | Bracey | 150.0 | 32.0(+118)#14 | 32.0(+118)#1,061 |
| 15. | Gordonsville | 149.0 | 32.0(+117)#15 | 32.0(+117)#1,080 |
| 16. | Franklin | 148.0 | 32.0(+116)#16 | 32.0(+116)#1,085 |
| 17. | Rivanna | 148.0 | 32.0(+116)#17 | 32.0(+116)#1,091 |
| 18. | White Stone | 143.0 | 32.0(+111)#18 | 32.0(+111)#1,155 |
| 19. | East Lexington | 130.0 | 32.0(+98.0)#19 | 32.0(+98.0)#1,336 |
| 20. | Chamberlayne | 129.0 | 32.0(+97.0)#20 | 32.0(+97.0)#1,347 |
| 21. | Falmouth | 125.0 | 32.0(+93.0)#21 | 32.0(+93.0)#1,398 |
| 22. | Phenix | 125.0 | 32.0(+93.0)#22 | 32.0(+93.0)#1,411 |
| 23. | Seven Corners | 124.0 | 32.0(+92.0)#23 | 32.0(+92.0)#1,436 |
| 24. | Verona | 118.0 | 32.0(+86.0)#24 | 32.0(+86.0)#1,520 |
| 25. | Wattsville | 118.0 | 32.0(+86.0)#25 | 32.0(+86.0)#1,525 |
| 26. | Gargatha | 117.0 | 32.0(+85.0)#26 | 32.0(+85.0)#1,560 |
| 27. | Sudley | 112.0 | 32.0(+80.0)#27 | 32.0(+80.0)#1,643 |
| 28. | Mount Vernon | 112.0 | 32.0(+80.0)#28 | 32.0(+80.0)#1,646 |
| 29. | Goose Creek | 108.0 | 32.0(+76.0)#29 | 32.0(+76.0)#1,754 |
| 30. | Pound | 108.0 | 32.0(+76.0)#30 | 32.0(+76.0)#1,765 |
| 31. | Damascus | 107.0 | 32.0(+75.0)#31 | 32.0(+75.0)#1,792 |
| 32. | Crosspointe | 105.0 | 32.0(+73.0)#32 | 32.0(+73.0)#1,819 |
| 33. | Yorkshire | 103.0 | 32.0(+71.0)#33 | 32.0(+71.0)#1,872 |
| 34. | Glen Lyn | 100.0 | 32.0(+68.0)#34 | 32.0(+68.0)#1,967 |
| 35. | Dumfries | 99.0 | 32.0(+67.0)#35 | 32.0(+67.0)#1,977 |
| 36. | Bethel Manor | 99.0 | 32.0(+67.0)#36 | 32.0(+67.0)#1,979 |
| 37. | Strasburg | 90.0 | 32.0(+58.0)#37 | 32.0(+58.0)#2,233 |
| 38. | Hutchison | 86.0 | 32.0(+54.0)#38 | 32.0(+54.0)#2,351 |
| 39. | Groveton | 85.0 | 32.0(+53.0)#39 | 32.0(+53.0)#2,380 |
| 40. | Massanutten | 85.0 | 32.0(+53.0)#40 | 32.0(+53.0)#2,392 |
| 41. | Leesylvania | 83.0 | 32.0(+51.0)#41 | 32.0(+51.0)#2,430 |
| 42. | Fincastle | 83.0 | 32.0(+51.0)#42 | 32.0(+51.0)#2,456 |
| 43. | Eastville | 83.0 | 32.0(+51.0)#43 | 32.0(+51.0)#2,468 |
| 44. | Haymarket | 81.0 | 32.0(+49.0)#44 | 32.0(+49.0)#2,536 |
| 45. | Woodstock | 80.0 | 32.0(+48.0)#45 | 32.0(+48.0)#2,553 |
| 46. | Bristol | 78.0 | 32.0(+46.0)#46 | 32.0(+46.0)#2,617 |
| 47. | Sugarland Run | 76.0 | 32.0(+44.0)#47 | 32.0(+44.0)#2,713 |
| 48. | Fairfax | 75.0 | 32.0(+43.0)#48 | 32.0(+43.0)#2,750 |
| 49. | West Falls Church | 73.0 | 32.0(+41.0)#49 | 32.0(+41.0)#2,846 |
| 50. | Newington | 73.0 | 32.0(+41.0)#50 | 32.0(+41.0)#2,854 |
| 51. | Braddock | 73.0 | 32.0(+41.0)#51 | 32.0(+41.0)#2,866 |
| 52. | Bealeton | 73.0 | 32.0(+41.0)#52 | 32.0(+41.0)#2,870 |
| 53. | Scottsville | 69.0 | 32.0(+37.0)#53 | 32.0(+37.0)#3,086 |
| 54. | Ravensworth | 68.0 | 32.0(+36.0)#54 | 32.0(+36.0)#3,118 |
| 55. | South Run | 67.0 | 32.0(+35.0)#55 | 32.0(+35.0)#3,153 |
| 56. | Orange | 67.0 | 32.0(+35.0)#56 | 32.0(+35.0)#3,155 |
| 57. | Colonial Heights | 66.0 | 32.0(+34.0)#57 | 32.0(+34.0)#3,210 |
| 58. | Wolf Trap | 66.0 | 32.0(+34.0)#58 | 32.0(+34.0)#3,212 |
| 59. | University Of Virginia | 66.0 | 32.0(+34.0)#59 | 32.0(+34.0)#3,220 |
| 60. | Woodbridge | 64.0 | 32.0(+32.0)#60 | 32.0(+32.0)#3,318 |
| 61. | Gainesville | 63.0 | 32.0(+31.0)#61 | 32.0(+31.0)#3,377 |
| 62. | Fort Belvoir | 63.0 | 32.0(+31.0)#62 | 32.0(+31.0)#3,387 |
| 63. | Kings Park | 63.0 | 32.0(+31.0)#63 | 32.0(+31.0)#3,401 |
| 64. | Wakefield | 63.0 | 32.0(+31.0)#64 | 32.0(+31.0)#3,427 |
| 65. | Sterling | 62.0 | 32.0(+30.0)#65 | 32.0(+30.0)#3,454 |
| 66. | Galax | 62.0 | 32.0(+30.0)#66 | 32.0(+30.0)#3,471 |
| 67. | Montrose | 61.0 | 32.0(+29.0)#67 | 32.0(+29.0)#3,522 |
| 68. | Rio | 61.0 | 32.0(+29.0)#68 | 32.0(+29.0)#3,560 |
| 69. | Clifton | 61.0 | 32.0(+29.0)#69 | 32.0(+29.0)#3,574 |
| 70. | Hayfield | 59.0 | 32.0(+27.0)#70 | 32.0(+27.0)#3,684 |
| 71. | Union Mill | 59.0 | 32.0(+27.0)#71 | 32.0(+27.0)#3,686 |
| 72. | Annandale | 56.0 | 32.0(+24.0)#72 | 32.0(+24.0)#3,858 |
| 73. | Nokesville | 56.0 | 32.0(+24.0)#73 | 32.0(+24.0)#3,903 |
| 74. | Fair Oaks | 55.0 | 32.0(+23.0)#74 | 32.0(+23.0)#3,947 |
| 75. | West Springfield | 55.0 | 32.0(+23.0)#75 | 32.0(+23.0)#3,952 |
| 76. | Stone Ridge | 55.0 | 32.0(+23.0)#76 | 32.0(+23.0)#3,959 |
| 77. | Manchester | 55.0 | 32.0(+23.0)#77 | 32.0(+23.0)#3,965 |
| 78. | Centreville | 54.0 | 32.0(+22.0)#78 | 32.0(+22.0)#4,020 |
| 79. | Merrifield | 54.0 | 32.0(+22.0)#79 | 32.0(+22.0)#4,030 |
| 80. | Newington Forest | 54.0 | 32.0(+22.0)#80 | 32.0(+22.0)#4,040 |
| 81. | Richlands | 54.0 | 32.0(+22.0)#81 | 32.0(+22.0)#4,063 |
| 82. | Woodlawn Cdp Fairfax County | 53.0 | 32.0(+21.0)#82 | 32.0(+21.0)#4,134 |
| 83. | North Springfield | 53.0 | 32.0(+21.0)#83 | 32.0(+21.0)#4,168 |
| 84. | Potomac Mills | 53.0 | 32.0(+21.0)#84 | 32.0(+21.0)#4,171 |
| 85. | Leesburg | 52.0 | 32.0(+20.0)#85 | 32.0(+20.0)#4,232 |
| 86. | Lincolnia | 52.0 | 32.0(+20.0)#86 | 32.0(+20.0)#4,249 |
| 87. | Bellwood | 52.0 | 32.0(+20.0)#87 | 32.0(+20.0)#4,270 |
| 88. | Gloucester Courthouse | 52.0 | 32.0(+20.0)#88 | 32.0(+20.0)#4,284 |
| 89. | Haysi | 51.0 | 32.0(+19.0)#89 | 32.0(+19.0)#4,399 |
| 90. | Oakton | 50.0 | 32.0(+18.0)#90 | 32.0(+18.0)#4,416 |
| 91. | Newsoms | 50.0 | 32.0(+18.0)#91 | 32.0(+18.0)#4,499 |
| 92. | Reston | 49.0 | 32.0(+17.0)#92 | 32.0(+17.0)#4,512 |
| 93. | Blue Ridge | 49.0 | 32.0(+17.0)#93 | 32.0(+17.0)#4,566 |
| 94. | Difficult Run | 48.0 | 32.0(+16.0)#94 | 32.0(+16.0)#4,650 |
| 95. | Dumbarton | 48.0 | 32.0(+16.0)#95 | 32.0(+16.0)#4,657 |
| 96. | Buckhall | 47.0 | 32.0(+15.0)#96 | 32.0(+15.0)#4,750 |
| 97. | Kingstowne | 47.0 | 32.0(+15.0)#97 | 32.0(+15.0)#4,751 |
| 98. | Earlysville | 47.0 | 32.0(+15.0)#98 | 32.0(+15.0)#4,813 |
| 99. | Dale City | 46.0 | 32.0(+14.0)#99 | 32.0(+14.0)#4,835 |
| 100. | Dunn Loring | 46.0 | 32.0(+14.0)#100 | 32.0(+14.0)#4,871 |
Common Questions
What are the Top 10 Cities with the Most Births per 1,000 Women Over the Age of 35 in Virginia?
Top 10 Cities with the Most Births per 1,000 Women Over the Age of 35 in Virginia are:
#1
1,000.0
#2
625.0
#3
492.0
#4
462.0
#5
421.0
#6
276.0
#7
227.0
#8
221.0
#9
213.0
#10
209.0
What city has the Most Births per 1,000 Women Over the Age of 35 in Virginia?
Hanover has the Most Births per 1,000 Women Over the Age of 35 in Virginia with 1,000.0.
What is the Number of Births per 1,000 Women Over the Age of 35 in the State of Virginia?
Number of Births per 1,000 Women Over the Age of 35 in Virginia is 32.0.
What is the Number of Births per 1,000 Women Over the Age of 35 in the United States?
Number of Births per 1,000 Women Over the Age of 35 in the United States is 32.0.