Zip Codes with the Highest Percentage of Population Employed in Architecture & Engineering in Chesapeake, VA
RELATED REPORTS & OPTIONS
Architecture & Engineering
Chesapeake
Compare Zip Codes
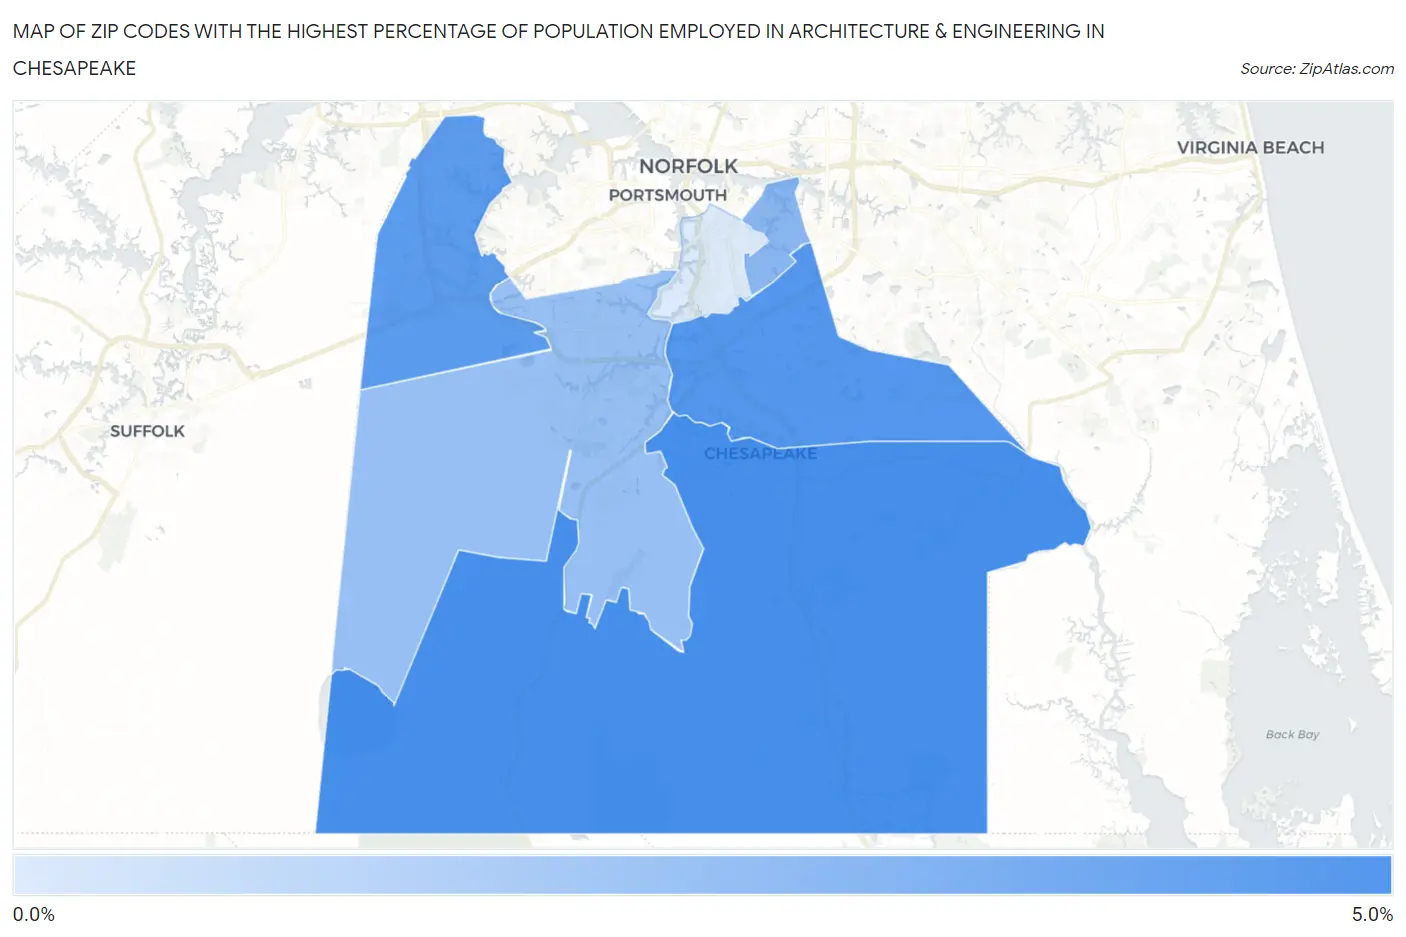
Map of Zip Codes with the Highest Percentage of Population Employed in Architecture & Engineering in Chesapeake
0.81%
4.2%
Zip Codes with the Highest Percentage of Population Employed in Architecture & Engineering in Chesapeake, VA
| Zip Code | % Employed | vs State | vs National | |
| 1. | 23322 | 4.2% | 2.3%(+1.88)#79 | 2.1%(+2.03)#2,512 |
| 2. | 23320 | 3.8% | 2.3%(+1.54)#91 | 2.1%(+1.70)#3,009 |
| 3. | 23321 | 3.7% | 2.3%(+1.41)#103 | 2.1%(+1.57)#3,258 |
| 4. | 23325 | 2.7% | 2.3%(+0.372)#185 | 2.1%(+0.528)#6,257 |
| 5. | 23323 | 2.4% | 2.3%(+0.074)#224 | 2.1%(+0.230)#7,573 |
| 6. | 23324 | 0.81% | 2.3%(-1.49)#484 | 2.1%(-1.34)#18,037 |
1
Common Questions
What are the Top 5 Zip Codes with the Highest Percentage of Population Employed in Architecture & Engineering in Chesapeake, VA?
Top 5 Zip Codes with the Highest Percentage of Population Employed in Architecture & Engineering in Chesapeake, VA are:
What zip code has the Highest Percentage of Population Employed in Architecture & Engineering in Chesapeake, VA?
23322 has the Highest Percentage of Population Employed in Architecture & Engineering in Chesapeake, VA with 4.2%.
What is the Percentage of Population Employed in Architecture & Engineering in Chesapeake, VA?
Percentage of Population Employed in Architecture & Engineering in Chesapeake is 3.3%.
What is the Percentage of Population Employed in Architecture & Engineering in Virginia?
Percentage of Population Employed in Architecture & Engineering in Virginia is 2.3%.
What is the Percentage of Population Employed in Architecture & Engineering in the United States?
Percentage of Population Employed in Architecture & Engineering in the United States is 2.1%.