Purcellville, VA Map & Demographics
Purcellville Map
Purcellville Overview
$56,856
PER CAPITA INCOME
$166,508
AVG FAMILY INCOME
$150,333
AVG HOUSEHOLD INCOME
43.6%
WAGE / INCOME GAP [ % ]
56.4¢/ $1
WAGE / INCOME GAP [ $ ]
0.35
INEQUALITY / GINI INDEX
8,928
TOTAL POPULATION
4,446
MALE POPULATION
4,482
FEMALE POPULATION
99.20
MALES / 100 FEMALES
100.81
FEMALES / 100 MALES
35.5
MEDIAN AGE
3.3
AVG FAMILY SIZE
3.2
AVG HOUSEHOLD SIZE
4,923
LABOR FORCE [ PEOPLE ]
72.8%
PERCENT IN LABOR FORCE
2.0%
UNEMPLOYMENT RATE
Purcellville Zip Codes
Purcellville Area Codes
Income in Purcellville
Income Overview in Purcellville
Per Capita Income in Purcellville is $56,856, while median incomes of families and households are $166,508 and $150,333 respectively.
| Characteristic | Number | Measure |
| Per Capita Income | 8,928 | $56,856 |
| Median Family Income | 2,338 | $166,508 |
| Mean Family Income | 2,338 | $191,724 |
| Median Household Income | 2,734 | $150,333 |
| Mean Household Income | 2,734 | $179,747 |
| Income Deficit | 2,338 | $0 |
| Wage / Income Gap (%) | 8,928 | 43.57% |
| Wage / Income Gap ($) | 8,928 | 56.43¢ per $1 |
| Gini / Inequality Index | 8,928 | 0.35 |
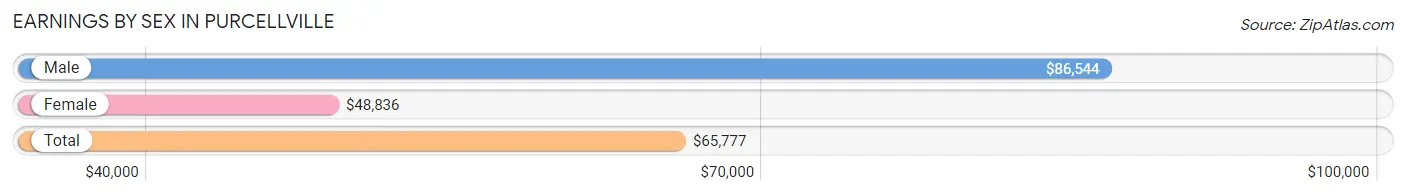
Earnings by Sex in Purcellville
Average Earnings in Purcellville are $65,777, $86,544 for men and $48,836 for women, a difference of 43.6%.
| Sex | Number | Average Earnings |
| Male | 2,876 (55.8%) | $86,544 |
| Female | 2,278 (44.2%) | $48,836 |
| Total | 5,154 (100.0%) | $65,777 |
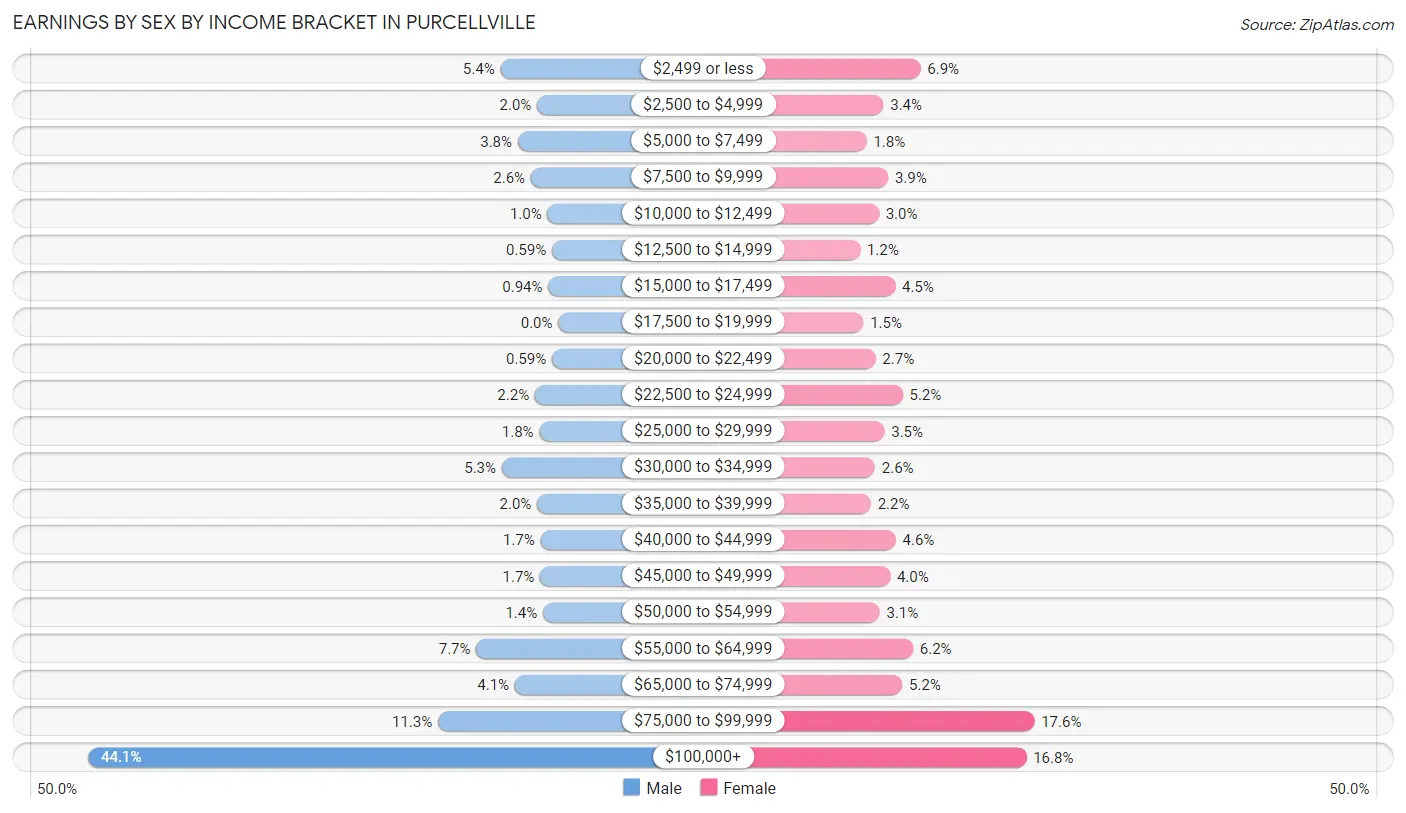
Earnings by Sex by Income Bracket in Purcellville
The most common earnings brackets in Purcellville are $100,000+ for men (1,267 | 44.1%) and $75,000 to $99,999 for women (400 | 17.6%).
| Income | Male | Female |
| $2,499 or less | 156 (5.4%) | 157 (6.9%) |
| $2,500 to $4,999 | 57 (2.0%) | 78 (3.4%) |
| $5,000 to $7,499 | 109 (3.8%) | 42 (1.8%) |
| $7,500 to $9,999 | 74 (2.6%) | 88 (3.9%) |
| $10,000 to $12,499 | 29 (1.0%) | 68 (3.0%) |
| $12,500 to $14,999 | 17 (0.6%) | 28 (1.2%) |
| $15,000 to $17,499 | 27 (0.9%) | 103 (4.5%) |
| $17,500 to $19,999 | 0 (0.0%) | 35 (1.5%) |
| $20,000 to $22,499 | 17 (0.6%) | 61 (2.7%) |
| $22,500 to $24,999 | 63 (2.2%) | 119 (5.2%) |
| $25,000 to $29,999 | 51 (1.8%) | 80 (3.5%) |
| $30,000 to $34,999 | 152 (5.3%) | 60 (2.6%) |
| $35,000 to $39,999 | 57 (2.0%) | 51 (2.2%) |
| $40,000 to $44,999 | 48 (1.7%) | 104 (4.6%) |
| $45,000 to $49,999 | 49 (1.7%) | 92 (4.0%) |
| $50,000 to $54,999 | 41 (1.4%) | 70 (3.1%) |
| $55,000 to $64,999 | 221 (7.7%) | 141 (6.2%) |
| $65,000 to $74,999 | 117 (4.1%) | 118 (5.2%) |
| $75,000 to $99,999 | 324 (11.3%) | 400 (17.6%) |
| $100,000+ | 1,267 (44.1%) | 383 (16.8%) |
| Total | 2,876 (100.0%) | 2,278 (100.0%) |
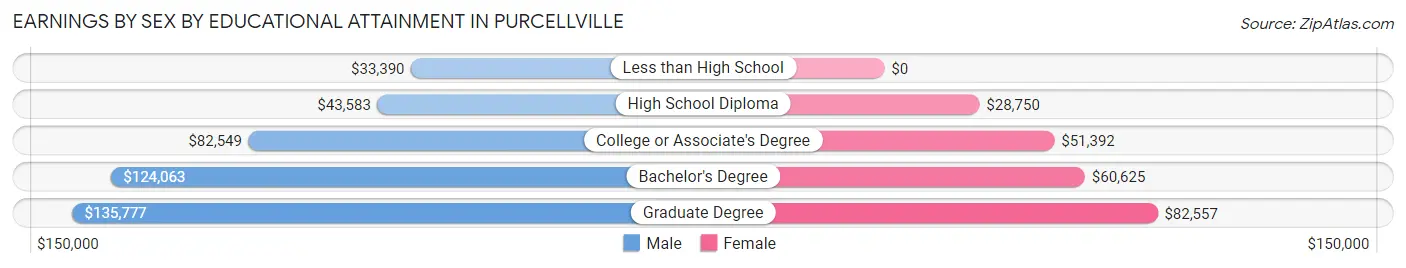
Earnings by Sex by Educational Attainment in Purcellville
Average earnings in Purcellville are $104,375 for men and $62,098 for women, a difference of 40.5%. Men with an educational attainment of graduate degree enjoy the highest average annual earnings of $135,777, while those with less than high school education earn the least with $33,390. Women with an educational attainment of graduate degree earn the most with the average annual earnings of $82,557, while those with high school diploma education have the smallest earnings of $28,750.
| Educational Attainment | Male Income | Female Income |
| Less than High School | $33,390 | $0 |
| High School Diploma | $43,583 | $28,750 |
| College or Associate's Degree | $82,549 | $51,392 |
| Bachelor's Degree | $124,063 | $60,625 |
| Graduate Degree | $135,777 | $82,557 |
| Total | $104,375 | $62,098 |
Family Income in Purcellville
Family Income Brackets in Purcellville
According to the Purcellville family income data, there are 823 families falling into the $200,000+ income range, which is the most common income bracket and makes up 35.2% of all families. Conversely, the $15,000 to $24,999 income bracket is the least frequent group with only 5 families (0.2%) belonging to this category.
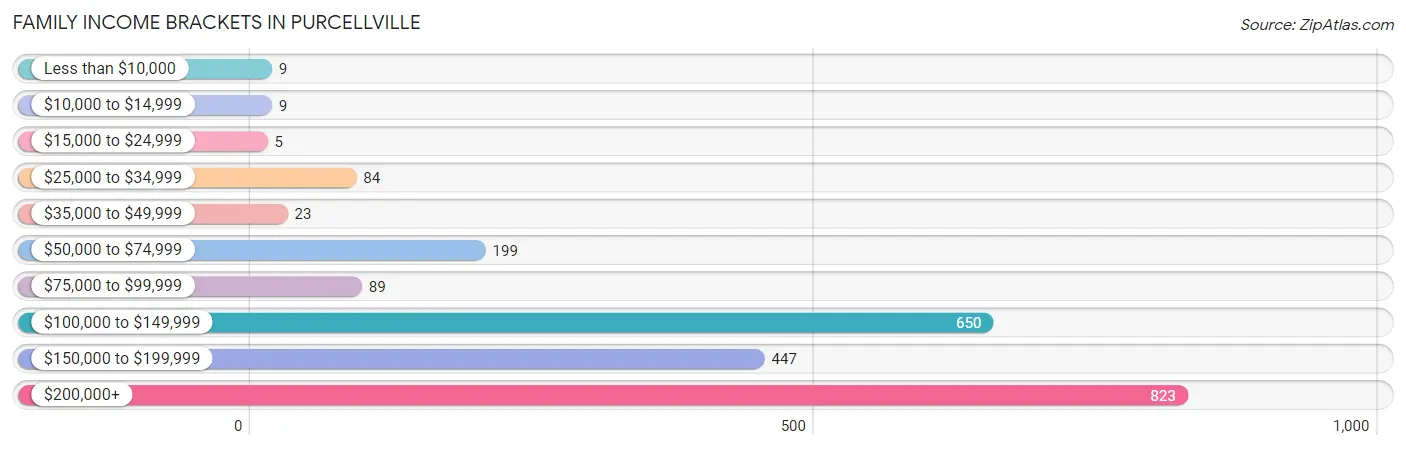
| Income Bracket | # Families | % Families |
| Less than $10,000 | 9 | 0.4% |
| $10,000 to $14,999 | 9 | 0.4% |
| $15,000 to $24,999 | 5 | 0.2% |
| $25,000 to $34,999 | 84 | 3.6% |
| $35,000 to $49,999 | 23 | 1.0% |
| $50,000 to $74,999 | 199 | 8.5% |
| $75,000 to $99,999 | 89 | 3.8% |
| $100,000 to $149,999 | 650 | 27.8% |
| $150,000 to $199,999 | 447 | 19.1% |
| $200,000+ | 823 | 35.2% |
Family Income by Famaliy Size in Purcellville
6-person families (51 | 2.2%) account for the highest median family income in Purcellville with $193,516 per family, while 2-person families (804 | 34.4%) have the highest median income of $74,584 per family member.
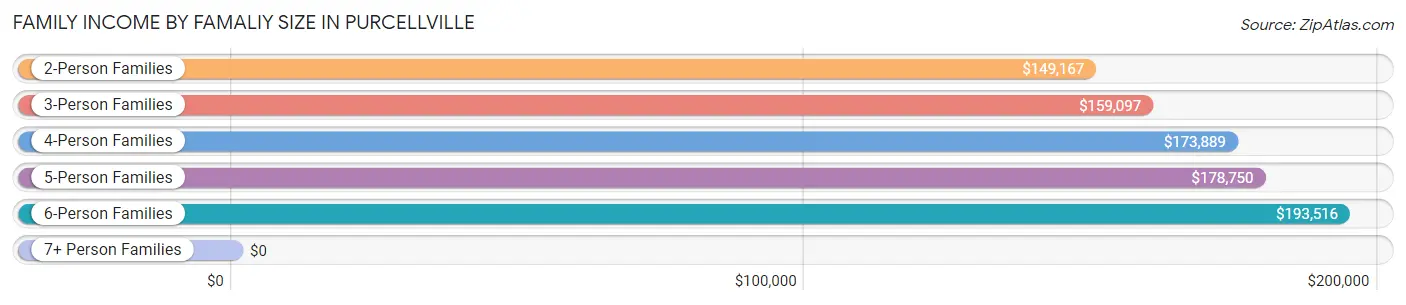
| Income Bracket | # Families | Median Income |
| 2-Person Families | 804 (34.4%) | $149,167 |
| 3-Person Families | 615 (26.3%) | $159,097 |
| 4-Person Families | 622 (26.6%) | $173,889 |
| 5-Person Families | 246 (10.5%) | $178,750 |
| 6-Person Families | 51 (2.2%) | $193,516 |
| 7+ Person Families | 0 (0.0%) | $0 |
| Total | 2,338 (100.0%) | $166,508 |
Family Income by Number of Earners in Purcellville
The median family income in Purcellville is $166,508, with families comprising 3+ earners (357) having the highest median family income of $204,018, while families with no earners (75) have the lowest median family income of $95,208, accounting for 15.3% and 3.2% of families, respectively.
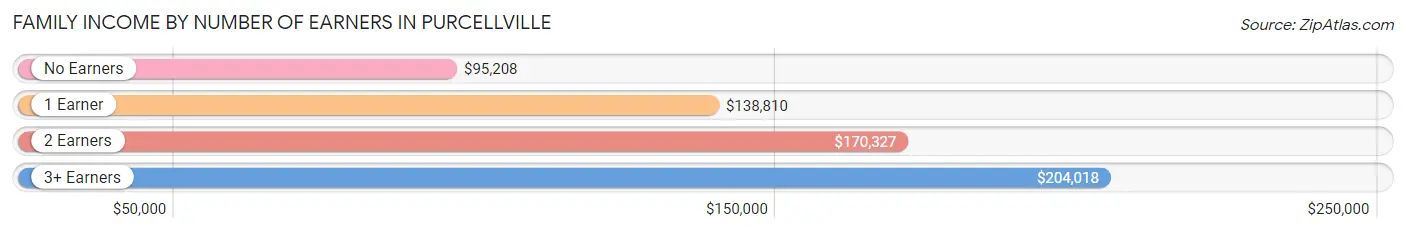
| Number of Earners | # Families | Median Income |
| No Earners | 75 (3.2%) | $95,208 |
| 1 Earner | 745 (31.9%) | $138,810 |
| 2 Earners | 1,161 (49.7%) | $170,327 |
| 3+ Earners | 357 (15.3%) | $204,018 |
| Total | 2,338 (100.0%) | $166,508 |
Household Income in Purcellville
Household Income Brackets in Purcellville
With 861 households falling in the category, the $200,000+ income range is the most frequent in Purcellville, accounting for 31.5% of all households. In contrast, only 11 households (0.4%) fall into the $10,000 to $14,999 income bracket, making it the least populous group.
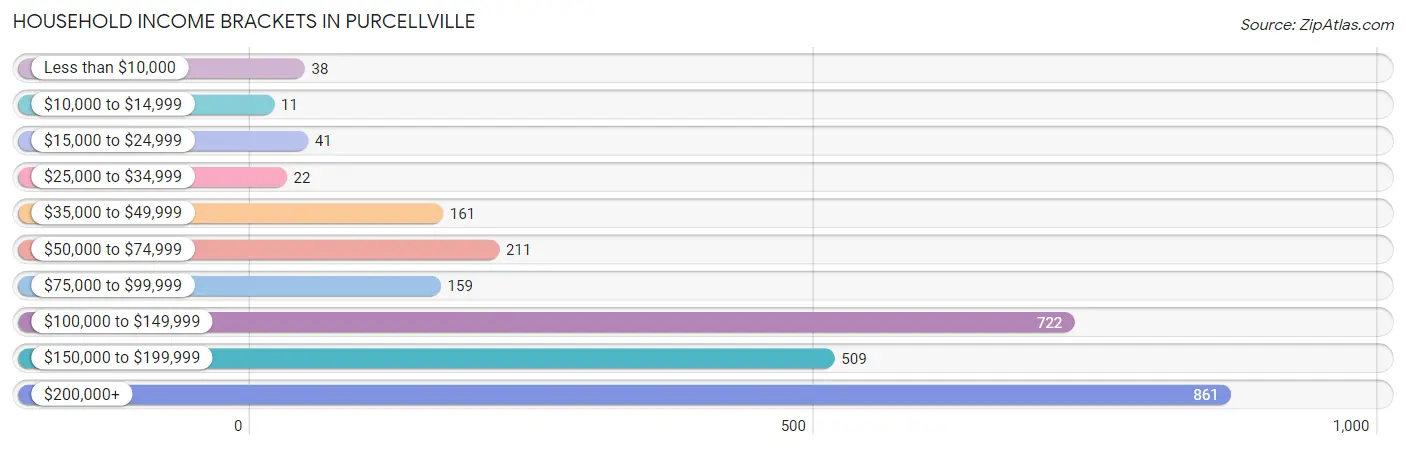
| Income Bracket | # Households | % Households |
| Less than $10,000 | 38 | 1.4% |
| $10,000 to $14,999 | 11 | 0.4% |
| $15,000 to $24,999 | 41 | 1.5% |
| $25,000 to $34,999 | 22 | 0.8% |
| $35,000 to $49,999 | 161 | 5.9% |
| $50,000 to $74,999 | 211 | 7.7% |
| $75,000 to $99,999 | 159 | 5.8% |
| $100,000 to $149,999 | 722 | 26.4% |
| $150,000 to $199,999 | 509 | 18.6% |
| $200,000+ | 861 | 31.5% |
Household Income by Householder Age in Purcellville
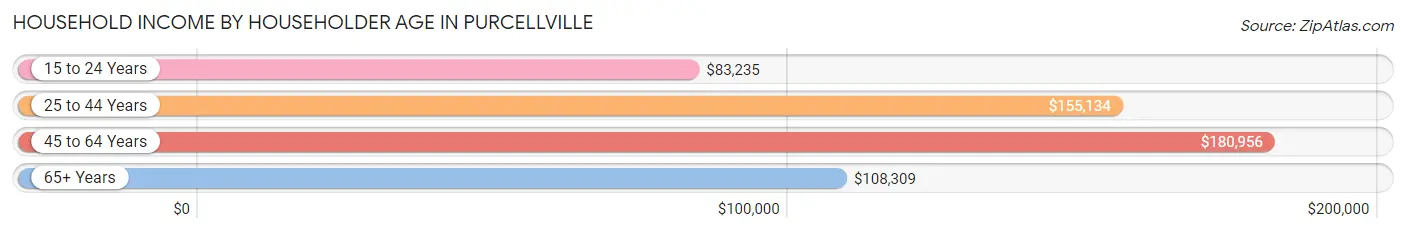
The median household income in Purcellville is $150,333, with the highest median household income of $180,956 found in the 45 to 64 years age bracket for the primary householder. A total of 1,272 households (46.5%) fall into this category. Meanwhile, the 15 to 24 years age bracket for the primary householder has the lowest median household income of $83,235, with 56 households (2.1%) in this group.
| Income Bracket | # Households | Median Income |
| 15 to 24 Years | 56 (2.1%) | $83,235 |
| 25 to 44 Years | 909 (33.3%) | $155,134 |
| 45 to 64 Years | 1,272 (46.5%) | $180,956 |
| 65+ Years | 497 (18.2%) | $108,309 |
| Total | 2,734 (100.0%) | $150,333 |
Poverty in Purcellville
Income Below Poverty by Sex and Age in Purcellville
With 3.3% poverty level for males and 4.8% for females among the residents of Purcellville, 18 to 24 year old males and 5 year old females are the most vulnerable to poverty, with 89 males (31.7%) and 12 females (41.4%) in their respective age groups living below the poverty level.
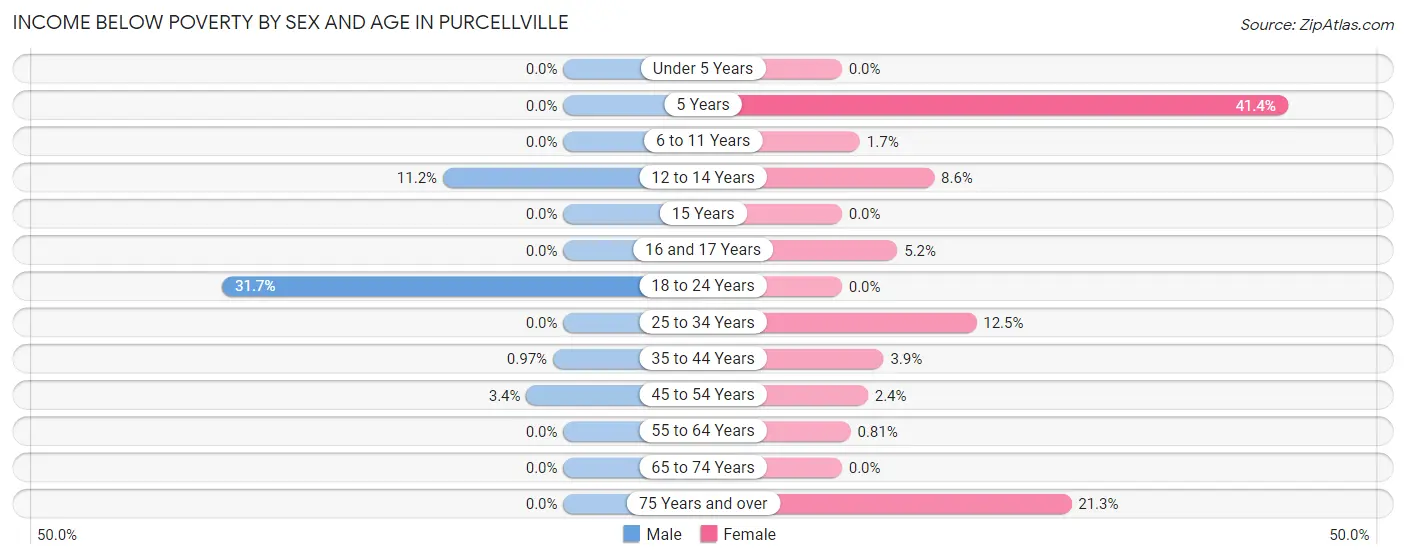
| Age Bracket | Male | Female |
| Under 5 Years | 0 (0.0%) | 0 (0.0%) |
| 5 Years | 0 (0.0%) | 12 (41.4%) |
| 6 to 11 Years | 0 (0.0%) | 5 (1.7%) |
| 12 to 14 Years | 18 (11.2%) | 21 (8.6%) |
| 15 Years | 0 (0.0%) | 0 (0.0%) |
| 16 and 17 Years | 0 (0.0%) | 7 (5.1%) |
| 18 to 24 Years | 89 (31.7%) | 0 (0.0%) |
| 25 to 34 Years | 0 (0.0%) | 68 (12.5%) |
| 35 to 44 Years | 5 (1.0%) | 22 (3.9%) |
| 45 to 54 Years | 29 (3.4%) | 17 (2.4%) |
| 55 to 64 Years | 0 (0.0%) | 4 (0.8%) |
| 65 to 74 Years | 0 (0.0%) | 0 (0.0%) |
| 75 Years and over | 0 (0.0%) | 49 (21.3%) |
| Total | 141 (3.3%) | 205 (4.8%) |
Income Above Poverty by Sex and Age in Purcellville
According to the poverty statistics in Purcellville, males aged under 5 years and females aged under 5 years are the age groups that are most secure financially, with 100.0% of males and 100.0% of females in these age groups living above the poverty line.
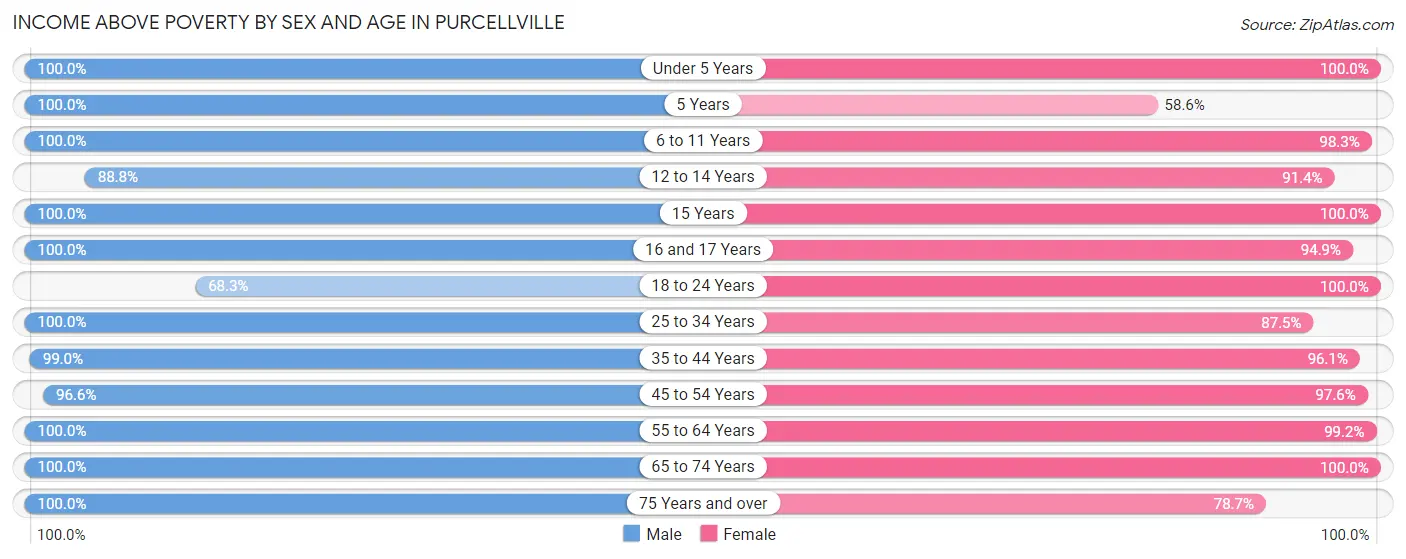
| Age Bracket | Male | Female |
| Under 5 Years | 260 (100.0%) | 370 (100.0%) |
| 5 Years | 22 (100.0%) | 17 (58.6%) |
| 6 to 11 Years | 499 (100.0%) | 293 (98.3%) |
| 12 to 14 Years | 143 (88.8%) | 224 (91.4%) |
| 15 Years | 94 (100.0%) | 65 (100.0%) |
| 16 and 17 Years | 165 (100.0%) | 129 (94.9%) |
| 18 to 24 Years | 192 (68.3%) | 317 (100.0%) |
| 25 to 34 Years | 520 (100.0%) | 477 (87.5%) |
| 35 to 44 Years | 508 (99.0%) | 547 (96.1%) |
| 45 to 54 Years | 817 (96.6%) | 688 (97.6%) |
| 55 to 64 Years | 571 (100.0%) | 489 (99.2%) |
| 65 to 74 Years | 173 (100.0%) | 242 (100.0%) |
| 75 Years and over | 214 (100.0%) | 181 (78.7%) |
| Total | 4,178 (96.7%) | 4,039 (95.2%) |
Income Below Poverty Among Married-Couple Families in Purcellville
The poverty statistics for married-couple families in Purcellville show that 0.7% or 15 of the total 2,095 families live below the poverty line. Families with 3 or 4 children have the highest poverty rate of 2.8%, comprising of 5 families. On the other hand, families with 1 or 2 children have the lowest poverty rate of 0.0%, which includes 0 families.
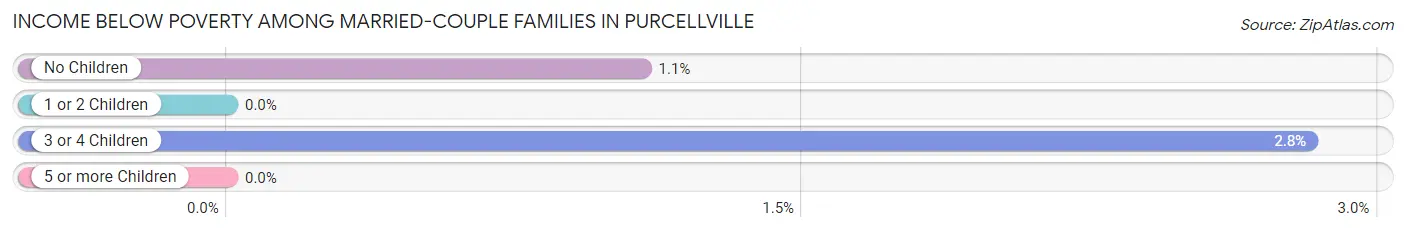
| Children | Above Poverty | Below Poverty |
| No Children | 915 (98.9%) | 10 (1.1%) |
| 1 or 2 Children | 993 (100.0%) | 0 (0.0%) |
| 3 or 4 Children | 172 (97.2%) | 5 (2.8%) |
| 5 or more Children | 0 (0.0%) | 0 (0.0%) |
| Total | 2,080 (99.3%) | 15 (0.7%) |
Income Below Poverty Among Single-Parent Households in Purcellville
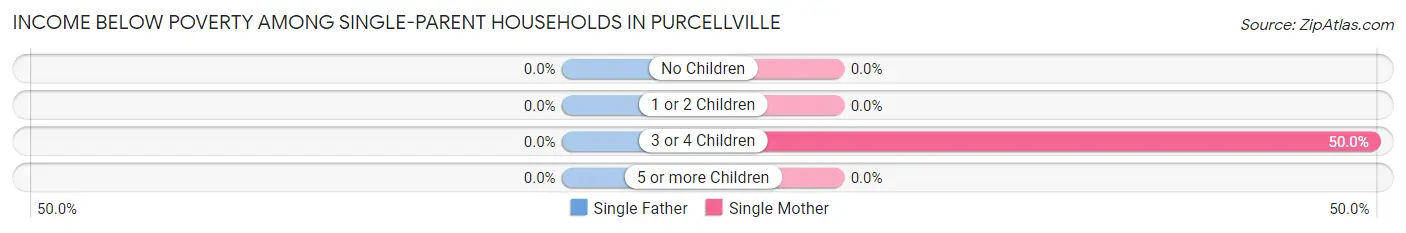
| Children | Single Father | Single Mother |
| No Children | 0 (0.0%) | 0 (0.0%) |
| 1 or 2 Children | 0 (0.0%) | 0 (0.0%) |
| 3 or 4 Children | 0 (0.0%) | 9 (50.0%) |
| 5 or more Children | 0 (0.0%) | 0 (0.0%) |
| Total | 0 (0.0%) | 9 (4.3%) |
Income Below Poverty Among Married-Couple vs Single-Parent Households in Purcellville
The poverty data for Purcellville shows that 15 of the married-couple family households (0.7%) and 9 of the single-parent households (3.7%) are living below the poverty level. Within the married-couple family households, those with 3 or 4 children have the highest poverty rate, with 5 households (2.8%) falling below the poverty line. Among the single-parent households, those with 3 or 4 children have the highest poverty rate, with 9 household (50.0%) living below poverty.
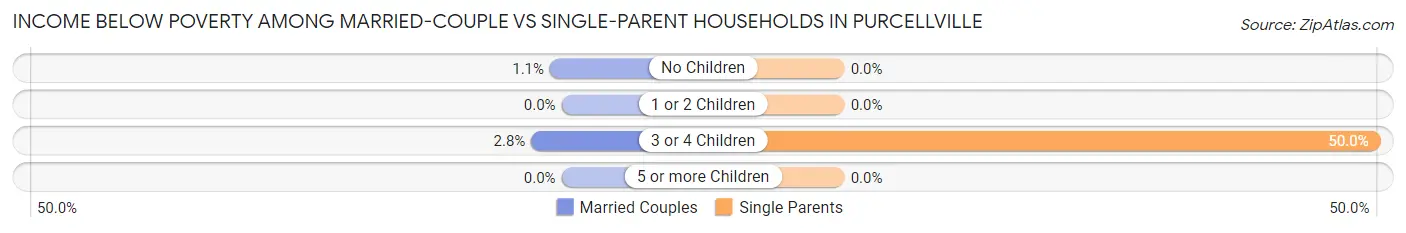
| Children | Married-Couple Families | Single-Parent Households |
| No Children | 10 (1.1%) | 0 (0.0%) |
| 1 or 2 Children | 0 (0.0%) | 0 (0.0%) |
| 3 or 4 Children | 5 (2.8%) | 9 (50.0%) |
| 5 or more Children | 0 (0.0%) | 0 (0.0%) |
| Total | 15 (0.7%) | 9 (3.7%) |
Race in Purcellville
The most populous races in Purcellville are White / Caucasian (6,754 | 75.6%), Hispanic or Latino (1,163 | 13.0%), and Two or more Races (909 | 10.2%).
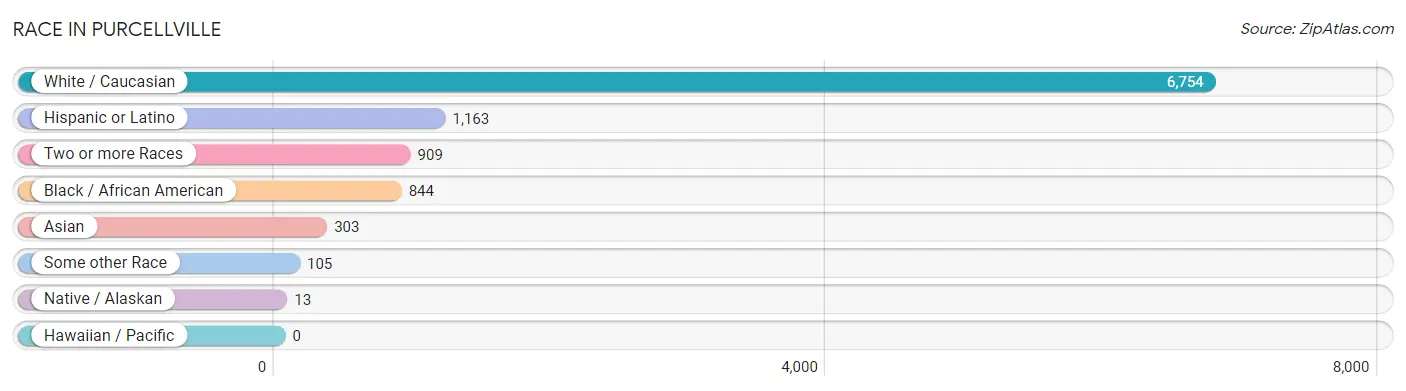
| Race | # Population | % Population |
| Asian | 303 | 3.4% |
| Black / African American | 844 | 9.5% |
| Hawaiian / Pacific | 0 | 0.0% |
| Hispanic or Latino | 1,163 | 13.0% |
| Native / Alaskan | 13 | 0.2% |
| White / Caucasian | 6,754 | 75.6% |
| Two or more Races | 909 | 10.2% |
| Some other Race | 105 | 1.2% |
| Total | 8,928 | 100.0% |
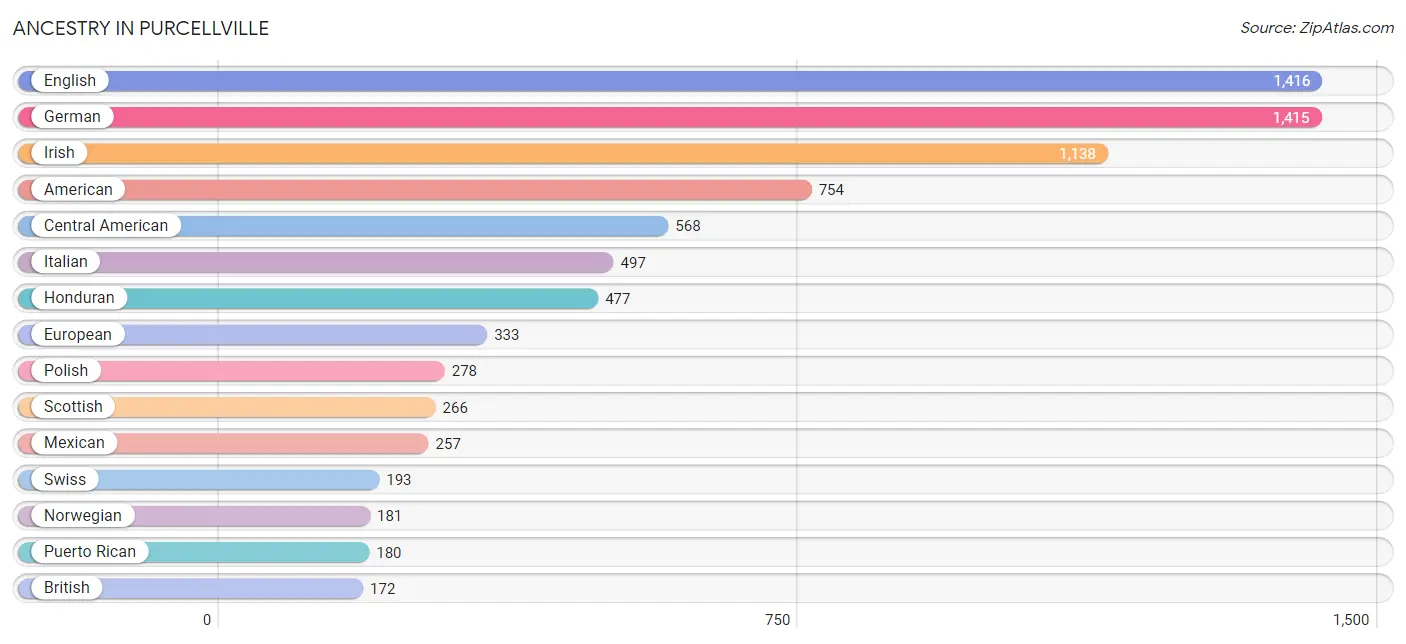
Ancestry in Purcellville
The most populous ancestries reported in Purcellville are English (1,416 | 15.9%), German (1,415 | 15.9%), Irish (1,138 | 12.8%), American (754 | 8.5%), and Central American (568 | 6.4%), together accounting for 59.3% of all Purcellville residents.
| Ancestry | # Population | % Population |
| African | 29 | 0.3% |
| Albanian | 47 | 0.5% |
| American | 754 | 8.5% |
| Austrian | 47 | 0.5% |
| Bhutanese | 92 | 1.0% |
| British | 172 | 1.9% |
| Bulgarian | 3 | 0.0% |
| Burmese | 17 | 0.2% |
| Canadian | 44 | 0.5% |
| Central American | 568 | 6.4% |
| Central American Indian | 14 | 0.2% |
| Cherokee | 10 | 0.1% |
| Colombian | 6 | 0.1% |
| Cuban | 28 | 0.3% |
| Czech | 8 | 0.1% |
| Danish | 35 | 0.4% |
| Dutch | 36 | 0.4% |
| Eastern European | 17 | 0.2% |
| Ecuadorian | 16 | 0.2% |
| English | 1,416 | 15.9% |
| European | 333 | 3.7% |
| Filipino | 5 | 0.1% |
| French | 133 | 1.5% |
| French Canadian | 110 | 1.2% |
| German | 1,415 | 15.9% |
| Ghanaian | 8 | 0.1% |
| Greek | 56 | 0.6% |
| Honduran | 477 | 5.3% |
| Indian (Asian) | 55 | 0.6% |
| Iranian | 38 | 0.4% |
| Irish | 1,138 | 12.8% |
| Italian | 497 | 5.6% |
| Korean | 94 | 1.1% |
| Laotian | 16 | 0.2% |
| Mexican | 257 | 2.9% |
| Native Hawaiian | 8 | 0.1% |
| Navajo | 5 | 0.1% |
| New Zealander | 4 | 0.0% |
| Nicaraguan | 31 | 0.4% |
| Northern European | 26 | 0.3% |
| Norwegian | 181 | 2.0% |
| Pakistani | 8 | 0.1% |
| Peruvian | 44 | 0.5% |
| Polish | 278 | 3.1% |
| Puerto Rican | 180 | 2.0% |
| Romanian | 3 | 0.0% |
| Russian | 125 | 1.4% |
| Salvadoran | 60 | 0.7% |
| Scandinavian | 28 | 0.3% |
| Scotch-Irish | 124 | 1.4% |
| Scottish | 266 | 3.0% |
| Seminole | 5 | 0.1% |
| Slovak | 82 | 0.9% |
| South American | 66 | 0.7% |
| Spanish | 64 | 0.7% |
| Sri Lankan | 103 | 1.1% |
| Subsaharan African | 37 | 0.4% |
| Swedish | 96 | 1.1% |
| Swiss | 193 | 2.2% |
| Thai | 116 | 1.3% |
| Turkish | 12 | 0.1% |
| Ukrainian | 105 | 1.2% |
| Welsh | 65 | 0.7% |
| West Indian | 76 | 0.9% | View All 64 Rows |
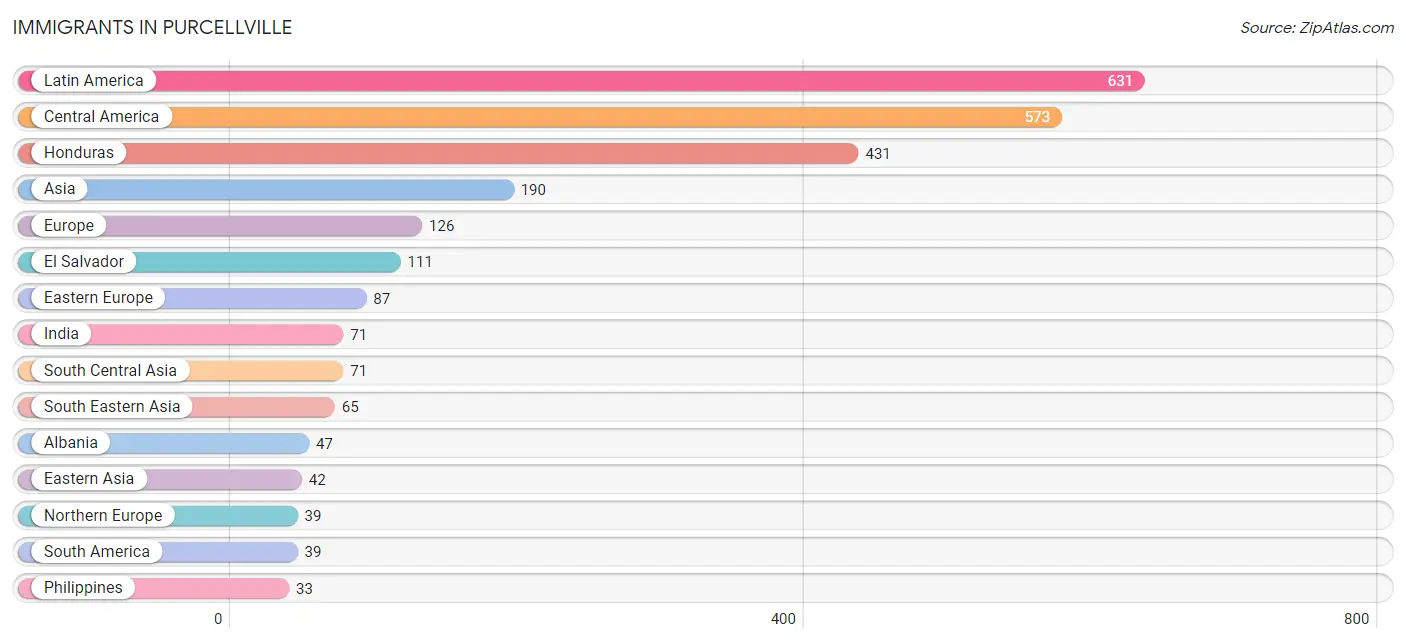
Immigrants in Purcellville
The most numerous immigrant groups reported in Purcellville came from Latin America (631 | 7.1%), Central America (573 | 6.4%), Honduras (431 | 4.8%), Asia (190 | 2.1%), and Europe (126 | 1.4%), together accounting for 21.9% of all Purcellville residents.
| Immigration Origin | # Population | % Population |
| Africa | 13 | 0.2% |
| Albania | 47 | 0.5% |
| Asia | 190 | 2.1% |
| Canada | 17 | 0.2% |
| Caribbean | 19 | 0.2% |
| Central America | 573 | 6.4% |
| China | 7 | 0.1% |
| Cuba | 19 | 0.2% |
| Czechoslovakia | 9 | 0.1% |
| Eastern Asia | 42 | 0.5% |
| Eastern Europe | 87 | 1.0% |
| Ecuador | 16 | 0.2% |
| El Salvador | 111 | 1.2% |
| England | 10 | 0.1% |
| Europe | 126 | 1.4% |
| Ghana | 13 | 0.2% |
| Honduras | 431 | 4.8% |
| India | 71 | 0.8% |
| Ireland | 19 | 0.2% |
| Japan | 11 | 0.1% |
| Korea | 24 | 0.3% |
| Latin America | 631 | 7.1% |
| Mexico | 14 | 0.2% |
| Nicaragua | 17 | 0.2% |
| Northern Europe | 39 | 0.4% |
| Oceania | 4 | 0.0% |
| Peru | 23 | 0.3% |
| Philippines | 33 | 0.4% |
| Russia | 13 | 0.2% |
| South America | 39 | 0.4% |
| South Central Asia | 71 | 0.8% |
| South Eastern Asia | 65 | 0.7% |
| Turkey | 12 | 0.1% |
| Vietnam | 32 | 0.4% |
| Western Africa | 13 | 0.2% |
| Western Asia | 12 | 0.1% | View All 36 Rows |
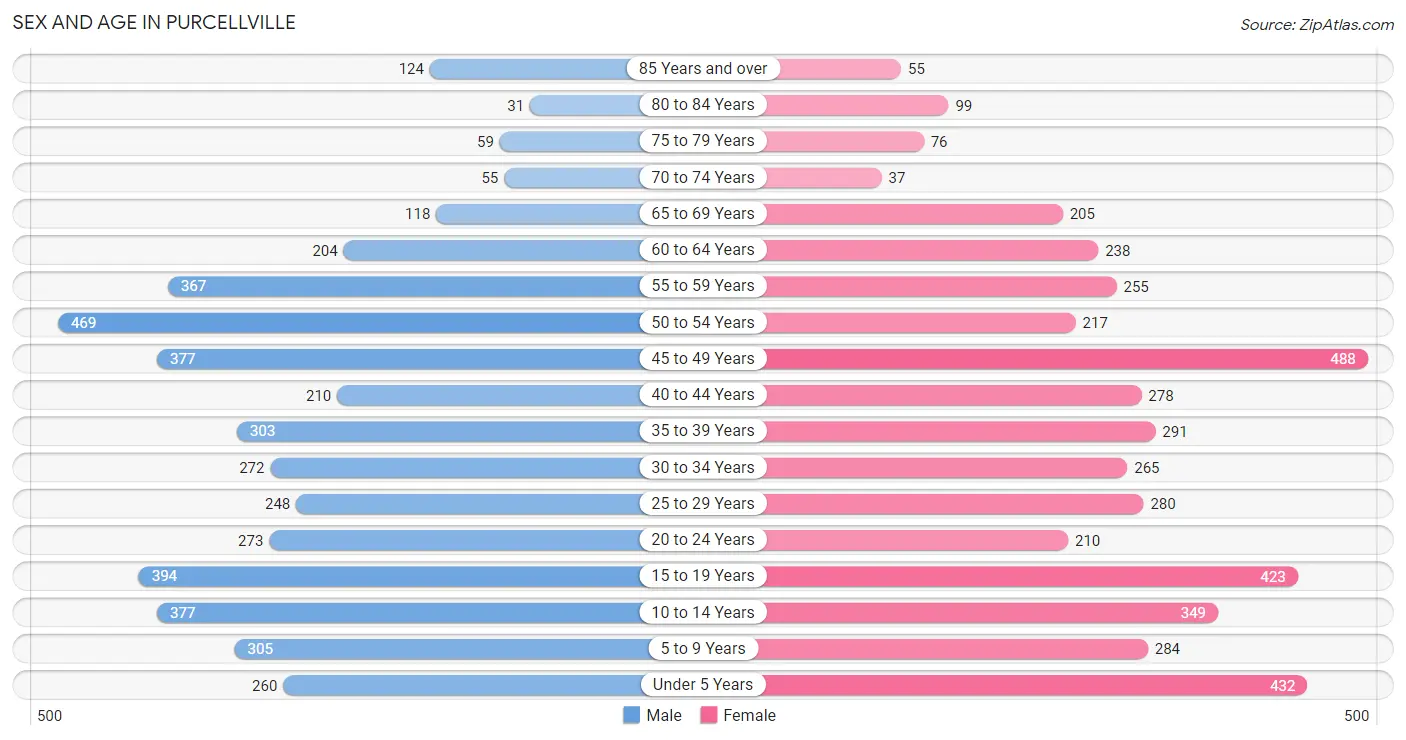
Sex and Age in Purcellville
Sex and Age in Purcellville
The most populous age groups in Purcellville are 50 to 54 Years (469 | 10.5%) for men and 45 to 49 Years (488 | 10.9%) for women.
| Age Bracket | Male | Female |
| Under 5 Years | 260 (5.9%) | 432 (9.6%) |
| 5 to 9 Years | 305 (6.9%) | 284 (6.3%) |
| 10 to 14 Years | 377 (8.5%) | 349 (7.8%) |
| 15 to 19 Years | 394 (8.9%) | 423 (9.4%) |
| 20 to 24 Years | 273 (6.1%) | 210 (4.7%) |
| 25 to 29 Years | 248 (5.6%) | 280 (6.2%) |
| 30 to 34 Years | 272 (6.1%) | 265 (5.9%) |
| 35 to 39 Years | 303 (6.8%) | 291 (6.5%) |
| 40 to 44 Years | 210 (4.7%) | 278 (6.2%) |
| 45 to 49 Years | 377 (8.5%) | 488 (10.9%) |
| 50 to 54 Years | 469 (10.5%) | 217 (4.8%) |
| 55 to 59 Years | 367 (8.3%) | 255 (5.7%) |
| 60 to 64 Years | 204 (4.6%) | 238 (5.3%) |
| 65 to 69 Years | 118 (2.6%) | 205 (4.6%) |
| 70 to 74 Years | 55 (1.2%) | 37 (0.8%) |
| 75 to 79 Years | 59 (1.3%) | 76 (1.7%) |
| 80 to 84 Years | 31 (0.7%) | 99 (2.2%) |
| 85 Years and over | 124 (2.8%) | 55 (1.2%) |
| Total | 4,446 (100.0%) | 4,482 (100.0%) |
Families and Households in Purcellville
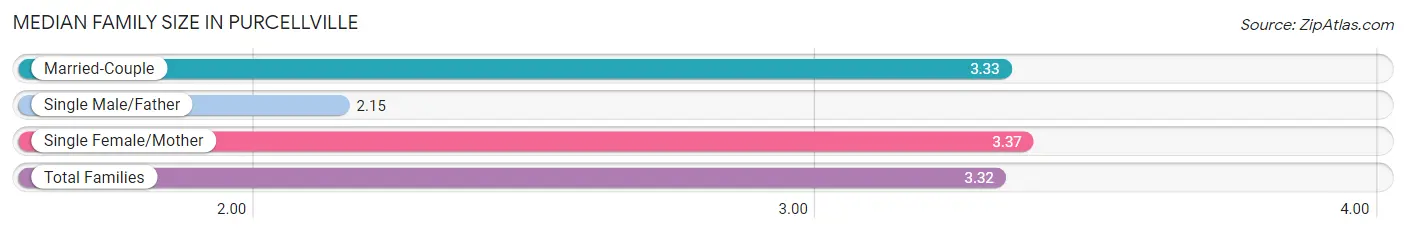
Median Family Size in Purcellville
The median family size in Purcellville is 3.32 persons per family, with single female/mother families (209 | 8.9%) accounting for the largest median family size of 3.37 persons per family. On the other hand, single male/father families (34 | 1.5%) represent the smallest median family size with 2.15 persons per family.
| Family Type | # Families | Family Size |
| Married-Couple | 2,095 (89.6%) | 3.33 |
| Single Male/Father | 34 (1.5%) | 2.15 |
| Single Female/Mother | 209 (8.9%) | 3.37 |
| Total Families | 2,338 (100.0%) | 3.32 |
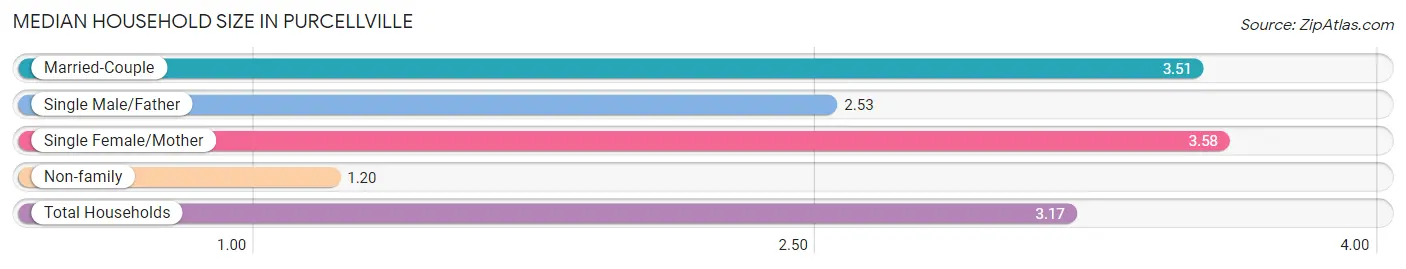
Median Household Size in Purcellville
The median household size in Purcellville is 3.17 persons per household, with single female/mother households (209 | 7.6%) accounting for the largest median household size of 3.58 persons per household. non-family households (396 | 14.5%) represent the smallest median household size with 1.20 persons per household.
| Household Type | # Households | Household Size |
| Married-Couple | 2,095 (76.6%) | 3.51 |
| Single Male/Father | 34 (1.2%) | 2.53 |
| Single Female/Mother | 209 (7.6%) | 3.58 |
| Non-family | 396 (14.5%) | 1.20 |
| Total Households | 2,734 (100.0%) | 3.17 |
Household Size by Marriage Status in Purcellville
Out of a total of 2,734 households in Purcellville, 2,338 (85.5%) are family households, while 396 (14.5%) are nonfamily households. The most numerous type of family households are 2-person households, comprising 783, and the most common type of nonfamily households are 1-person households, comprising 327.
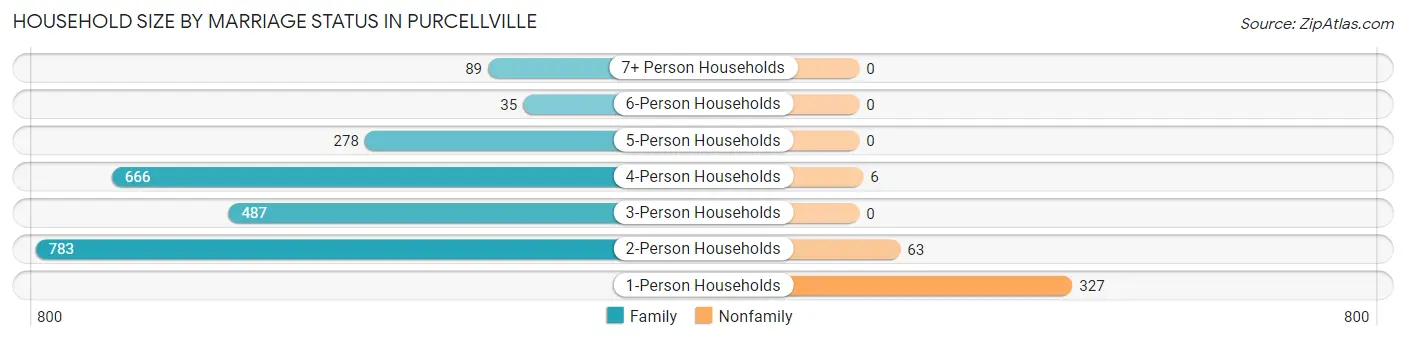
| Household Size | Family Households | Nonfamily Households |
| 1-Person Households | - | 327 (12.0%) |
| 2-Person Households | 783 (28.6%) | 63 (2.3%) |
| 3-Person Households | 487 (17.8%) | 0 (0.0%) |
| 4-Person Households | 666 (24.4%) | 6 (0.2%) |
| 5-Person Households | 278 (10.2%) | 0 (0.0%) |
| 6-Person Households | 35 (1.3%) | 0 (0.0%) |
| 7+ Person Households | 89 (3.3%) | 0 (0.0%) |
| Total | 2,338 (85.5%) | 396 (14.5%) |
Female Fertility in Purcellville
Fertility by Age in Purcellville
Average fertility rate in Purcellville is 66.0 births per 1,000 women. Women in the age bracket of 20 to 34 years have the highest fertility rate with 163.0 births per 1,000 women. Women in the age bracket of 20 to 34 years acount for 81.5% of all women with births.
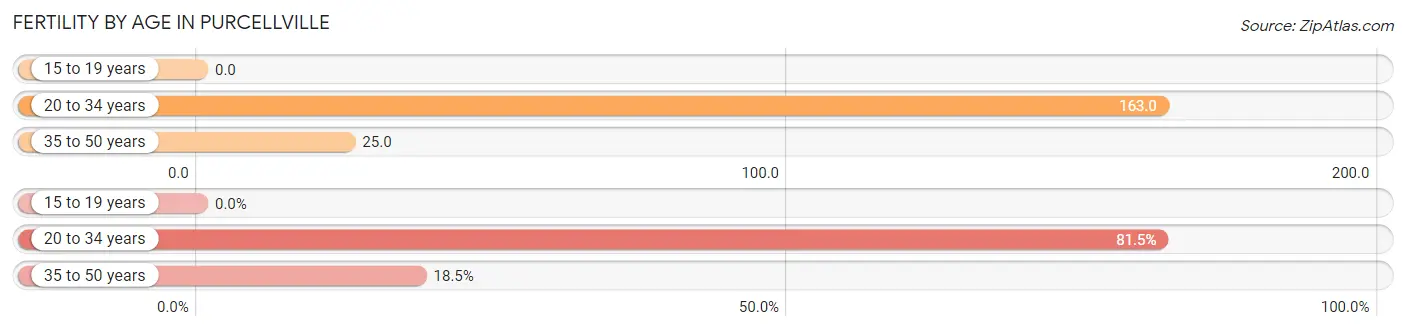
| Age Bracket | Women with Births | Births / 1,000 Women |
| 15 to 19 years | 0 (0.0%) | 0.0 |
| 20 to 34 years | 123 (81.5%) | 163.0 |
| 35 to 50 years | 28 (18.5%) | 25.0 |
| Total | 151 (100.0%) | 66.0 |
Fertility by Age by Marriage Status in Purcellville
47.7% of women with births (151) in Purcellville are married. The highest percentage of unmarried women with births falls into 20 to 34 years age bracket with 64.2% of them unmarried at the time of birth, while the lowest percentage of unmarried women with births belong to 35 to 50 years age bracket with 0.0% of them unmarried.
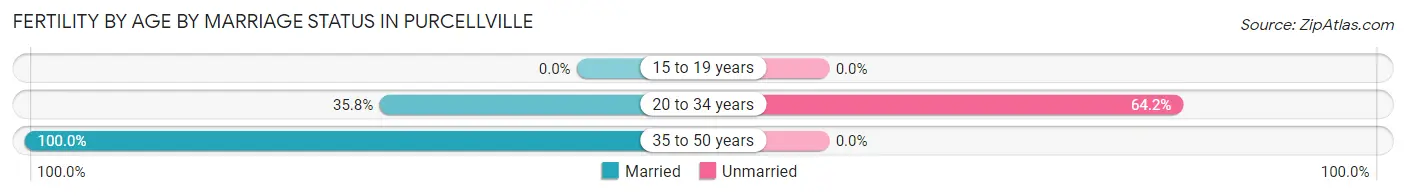
| Age Bracket | Married | Unmarried |
| 15 to 19 years | 0 (0.0%) | 0 (0.0%) |
| 20 to 34 years | 44 (35.8%) | 79 (64.2%) |
| 35 to 50 years | 28 (100.0%) | 0 (0.0%) |
| Total | 72 (47.7%) | 79 (52.3%) |
Fertility by Education in Purcellville
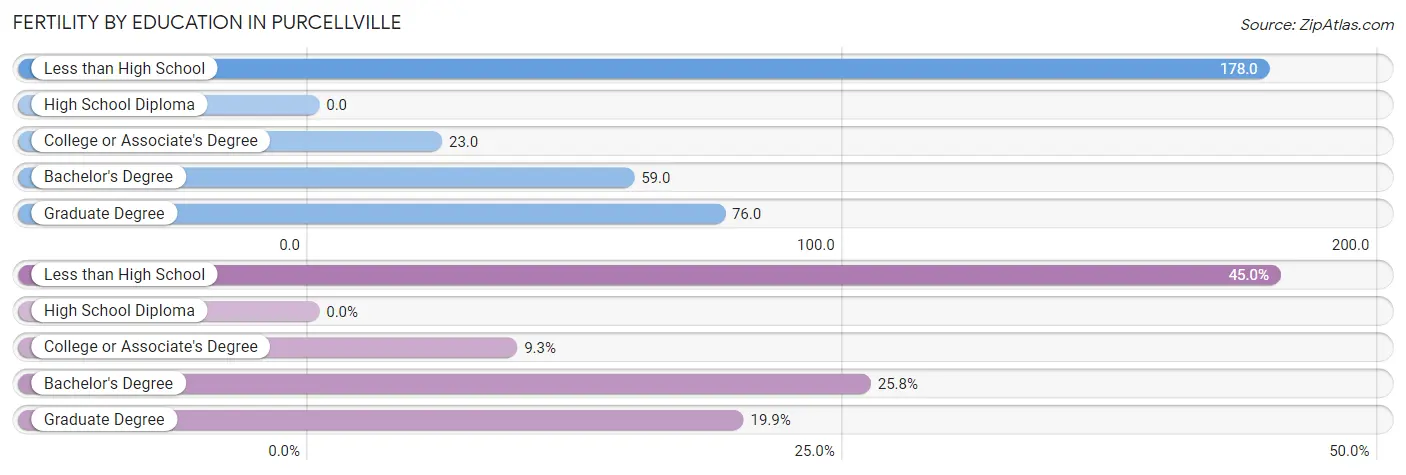
| Educational Attainment | Women with Births | Births / 1,000 Women |
| Less than High School | 68 (45.0%) | 178.0 |
| High School Diploma | 0 (0.0%) | 0.0 |
| College or Associate's Degree | 14 (9.3%) | 23.0 |
| Bachelor's Degree | 39 (25.8%) | 59.0 |
| Graduate Degree | 30 (19.9%) | 76.0 |
| Total | 151 (100.0%) | 66.0 |
Fertility by Education by Marriage Status in Purcellville
52.3% of women with births in Purcellville are unmarried. Women with the educational attainment of college or associate's degree are most likely to be married with 100.0% of them married at childbirth, while women with the educational attainment of less than high school are least likely to be married with 100.0% of them unmarried at childbirth.
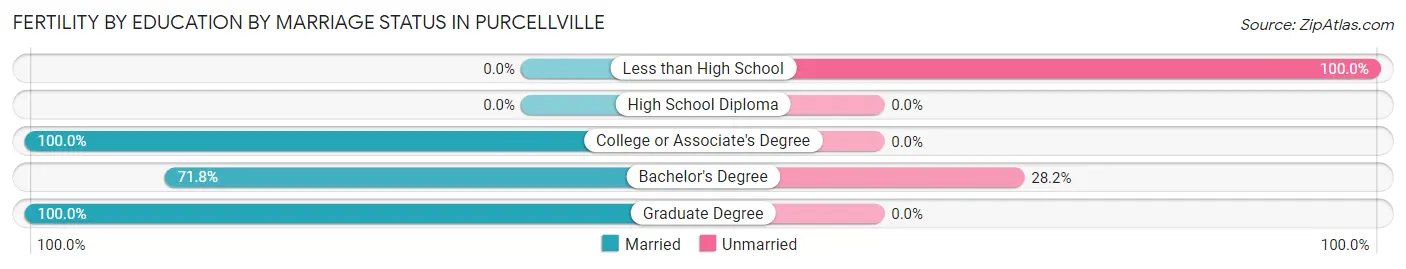
| Educational Attainment | Married | Unmarried |
| Less than High School | 0 (0.0%) | 68 (100.0%) |
| High School Diploma | 0 (0.0%) | 0 (0.0%) |
| College or Associate's Degree | 14 (100.0%) | 0 (0.0%) |
| Bachelor's Degree | 28 (71.8%) | 11 (28.2%) |
| Graduate Degree | 30 (100.0%) | 0 (0.0%) |
| Total | 72 (47.7%) | 79 (52.3%) |
Employment Characteristics in Purcellville
Employment by Class of Employer in Purcellville
Among the 4,605 employed individuals in Purcellville, private company employees (3,050 | 66.2%), not-for-profit organizations (569 | 12.4%), and local government employees (420 | 9.1%) make up the most common classes of employment.
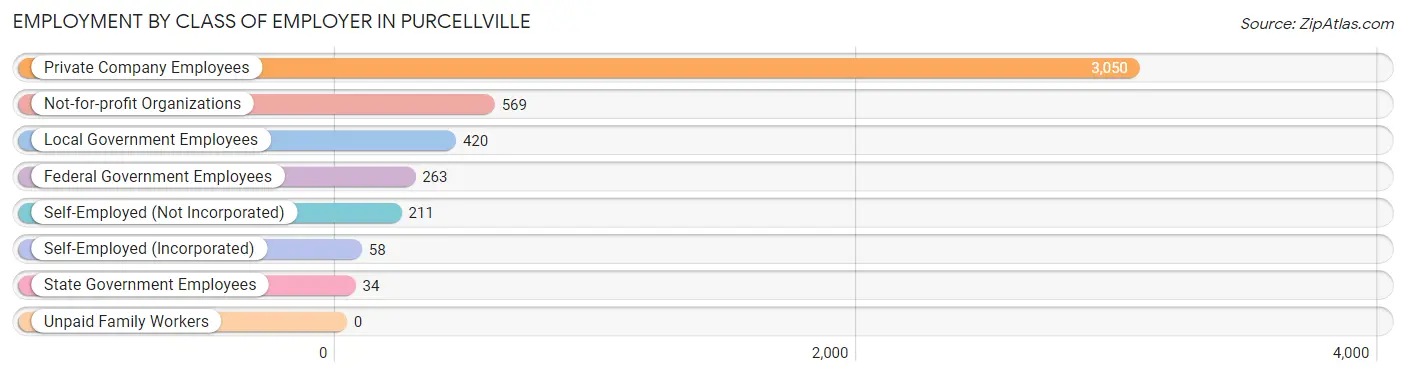
| Employer Class | # Employees | % Employees |
| Private Company Employees | 3,050 | 66.2% |
| Self-Employed (Incorporated) | 58 | 1.3% |
| Self-Employed (Not Incorporated) | 211 | 4.6% |
| Not-for-profit Organizations | 569 | 12.4% |
| Local Government Employees | 420 | 9.1% |
| State Government Employees | 34 | 0.7% |
| Federal Government Employees | 263 | 5.7% |
| Unpaid Family Workers | 0 | 0.0% |
| Total | 4,605 | 100.0% |
Employment Status by Age in Purcellville
According to the labor force statistics for Purcellville, out of the total population over 16 years of age (6,762), 72.8% or 4,923 individuals are in the labor force, with 2.0% or 98 of them unemployed. The age group with the highest labor force participation rate is 30 to 34 years, with 90.3% or 485 individuals in the labor force. Within the labor force, the 45 to 54 years age range has the highest percentage of unemployed individuals, with 5.0% or 60 of them being unemployed.
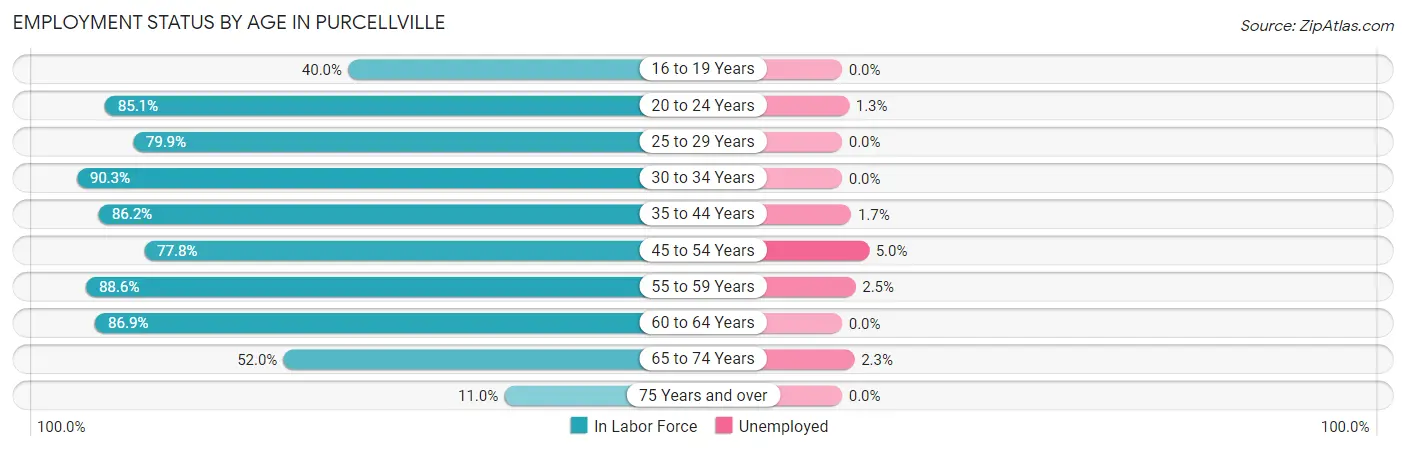
| Age Bracket | In Labor Force | Unemployed |
| 16 to 19 Years | 263 (40.0%) | 0 (0.0%) |
| 20 to 24 Years | 411 (85.1%) | 5 (1.3%) |
| 25 to 29 Years | 422 (79.9%) | 0 (0.0%) |
| 30 to 34 Years | 485 (90.3%) | 0 (0.0%) |
| 35 to 44 Years | 933 (86.2%) | 16 (1.7%) |
| 45 to 54 Years | 1,207 (77.8%) | 60 (5.0%) |
| 55 to 59 Years | 551 (88.6%) | 14 (2.5%) |
| 60 to 64 Years | 384 (86.9%) | 0 (0.0%) |
| 65 to 74 Years | 216 (52.0%) | 5 (2.3%) |
| 75 Years and over | 49 (11.0%) | 0 (0.0%) |
| Total | 4,923 (72.8%) | 98 (2.0%) |
Employment Status by Educational Attainment in Purcellville
According to labor force statistics for Purcellville, 83.6% of individuals (3,981) out of the total population between 25 and 64 years of age (4,762) are in the labor force, with 2.3% or 92 of them being unemployed. The group with the highest labor force participation rate are those with the educational attainment of bachelor's degree or higher, with 86.7% or 2,477 individuals in the labor force. Within the labor force, individuals with bachelor's degree or higher education have the highest percentage of unemployment, with 2.9% or 72 of them being unemployed.
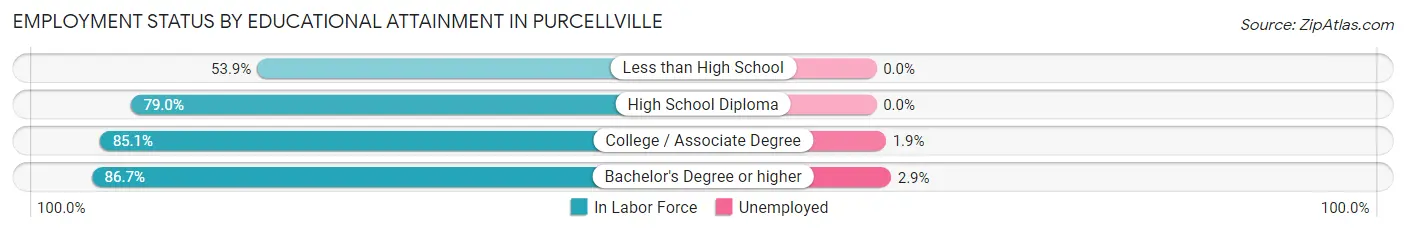
| Educational Attainment | In Labor Force | Unemployed |
| Less than High School | 159 (53.9%) | 0 (0.0%) |
| High School Diploma | 328 (79.0%) | 0 (0.0%) |
| College / Associate Degree | 1,017 (85.1%) | 23 (1.9%) |
| Bachelor's Degree or higher | 2,477 (86.7%) | 83 (2.9%) |
| Total | 3,981 (83.6%) | 110 (2.3%) |
Employment Occupations by Sex in Purcellville
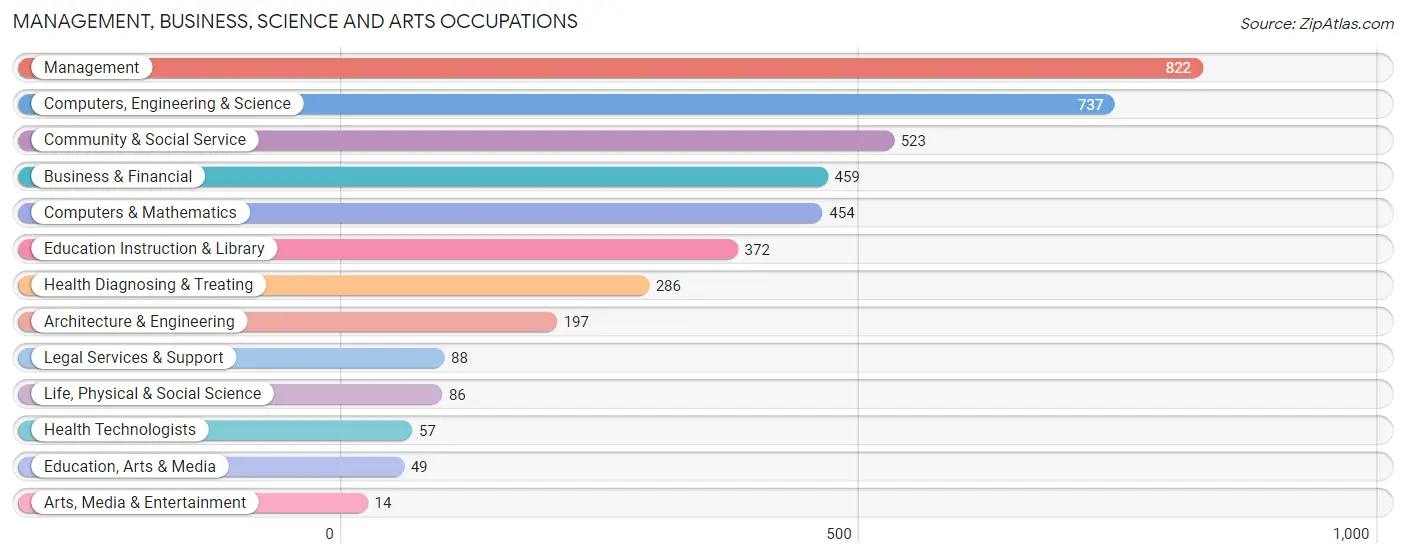
Management, Business, Science and Arts Occupations
The most common Management, Business, Science and Arts occupations in Purcellville are Management (822 | 17.1%), Computers, Engineering & Science (737 | 15.3%), Community & Social Service (523 | 10.9%), Business & Financial (459 | 9.5%), and Computers & Mathematics (454 | 9.4%).
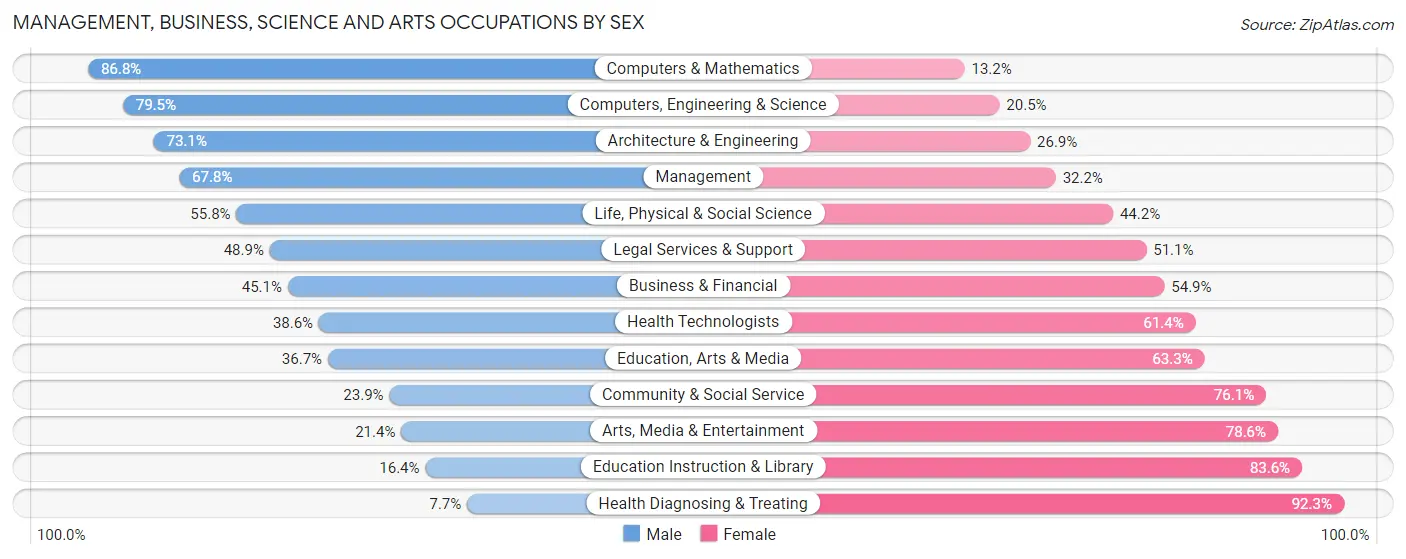
Management, Business, Science and Arts Occupations by Sex
Within the Management, Business, Science and Arts occupations in Purcellville, the most male-oriented occupations are Computers & Mathematics (86.8%), Computers, Engineering & Science (79.5%), and Architecture & Engineering (73.1%), while the most female-oriented occupations are Health Diagnosing & Treating (92.3%), Education Instruction & Library (83.6%), and Arts, Media & Entertainment (78.6%).
| Occupation | Male | Female |
| Management | 557 (67.8%) | 265 (32.2%) |
| Business & Financial | 207 (45.1%) | 252 (54.9%) |
| Computers, Engineering & Science | 586 (79.5%) | 151 (20.5%) |
| Computers & Mathematics | 394 (86.8%) | 60 (13.2%) |
| Architecture & Engineering | 144 (73.1%) | 53 (26.9%) |
| Life, Physical & Social Science | 48 (55.8%) | 38 (44.2%) |
| Community & Social Service | 125 (23.9%) | 398 (76.1%) |
| Education, Arts & Media | 18 (36.7%) | 31 (63.3%) |
| Legal Services & Support | 43 (48.9%) | 45 (51.1%) |
| Education Instruction & Library | 61 (16.4%) | 311 (83.6%) |
| Arts, Media & Entertainment | 3 (21.4%) | 11 (78.6%) |
| Health Diagnosing & Treating | 22 (7.7%) | 264 (92.3%) |
| Health Technologists | 22 (38.6%) | 35 (61.4%) |
| Total (Category) | 1,497 (52.9%) | 1,330 (47.0%) |
| Total (Overall) | 2,737 (56.9%) | 2,073 (43.1%) |
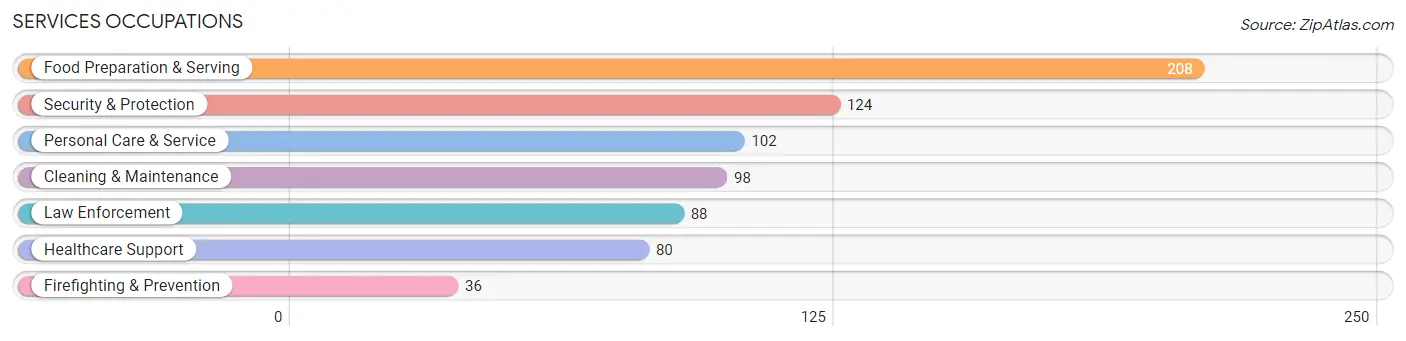
Services Occupations
The most common Services occupations in Purcellville are Food Preparation & Serving (208 | 4.3%), Security & Protection (124 | 2.6%), Personal Care & Service (102 | 2.1%), Cleaning & Maintenance (98 | 2.0%), and Law Enforcement (88 | 1.8%).
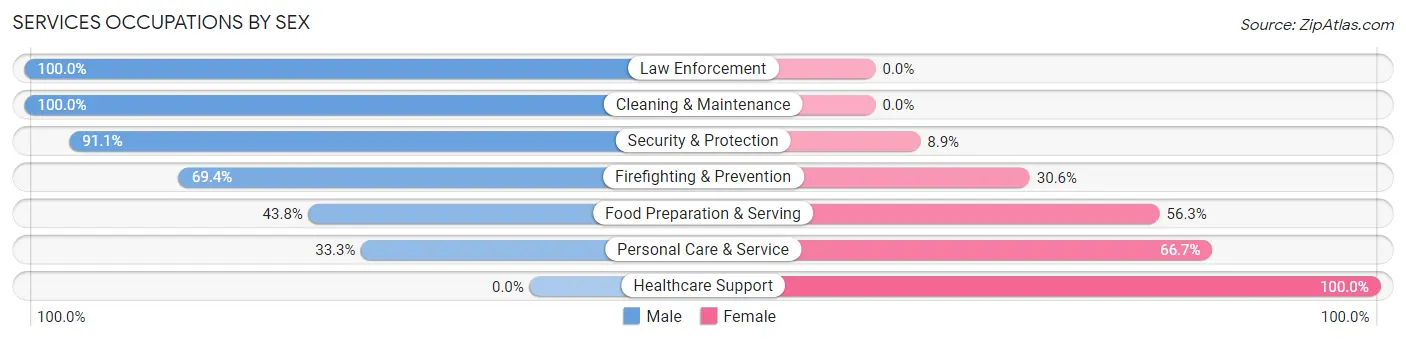
Services Occupations by Sex
Within the Services occupations in Purcellville, the most male-oriented occupations are Law Enforcement (100.0%), Cleaning & Maintenance (100.0%), and Security & Protection (91.1%), while the most female-oriented occupations are Healthcare Support (100.0%), Personal Care & Service (66.7%), and Food Preparation & Serving (56.2%).
| Occupation | Male | Female |
| Healthcare Support | 0 (0.0%) | 80 (100.0%) |
| Security & Protection | 113 (91.1%) | 11 (8.9%) |
| Firefighting & Prevention | 25 (69.4%) | 11 (30.6%) |
| Law Enforcement | 88 (100.0%) | 0 (0.0%) |
| Food Preparation & Serving | 91 (43.8%) | 117 (56.2%) |
| Cleaning & Maintenance | 98 (100.0%) | 0 (0.0%) |
| Personal Care & Service | 34 (33.3%) | 68 (66.7%) |
| Total (Category) | 336 (54.9%) | 276 (45.1%) |
| Total (Overall) | 2,737 (56.9%) | 2,073 (43.1%) |
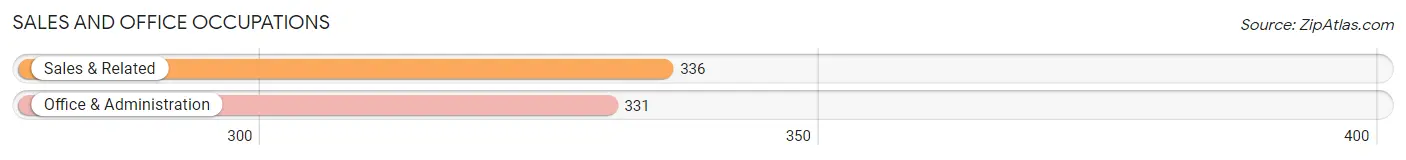
Sales and Office Occupations
The most common Sales and Office occupations in Purcellville are Sales & Related (336 | 7.0%), and Office & Administration (331 | 6.9%).
Sales and Office Occupations by Sex
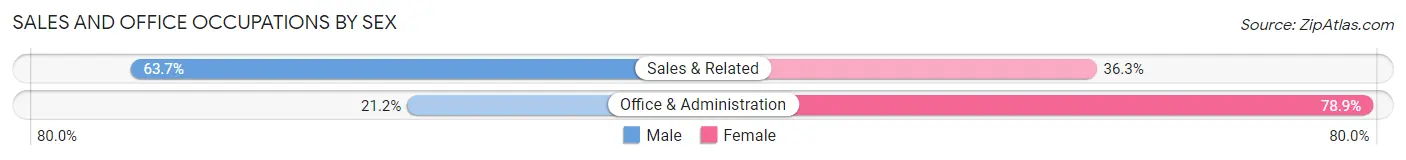
| Occupation | Male | Female |
| Sales & Related | 214 (63.7%) | 122 (36.3%) |
| Office & Administration | 70 (21.1%) | 261 (78.8%) |
| Total (Category) | 284 (42.6%) | 383 (57.4%) |
| Total (Overall) | 2,737 (56.9%) | 2,073 (43.1%) |
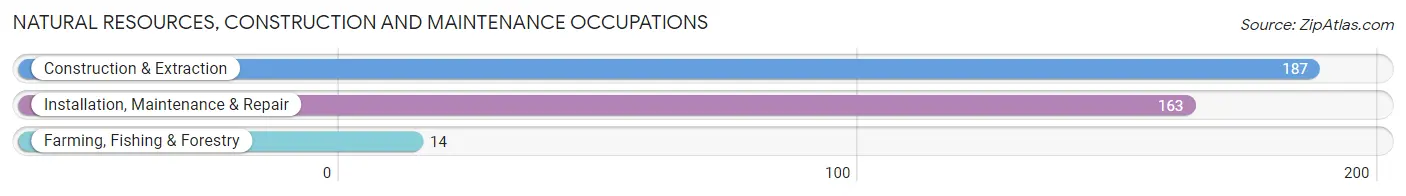
Natural Resources, Construction and Maintenance Occupations
The most common Natural Resources, Construction and Maintenance occupations in Purcellville are Construction & Extraction (187 | 3.9%), Installation, Maintenance & Repair (163 | 3.4%), and Farming, Fishing & Forestry (14 | 0.3%).
Natural Resources, Construction and Maintenance Occupations by Sex
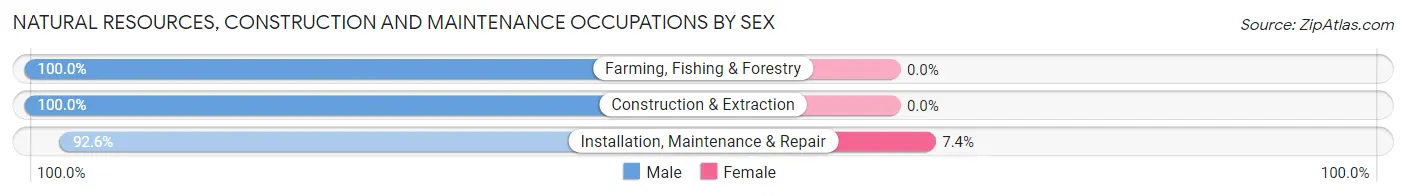
| Occupation | Male | Female |
| Farming, Fishing & Forestry | 14 (100.0%) | 0 (0.0%) |
| Construction & Extraction | 187 (100.0%) | 0 (0.0%) |
| Installation, Maintenance & Repair | 151 (92.6%) | 12 (7.4%) |
| Total (Category) | 352 (96.7%) | 12 (3.3%) |
| Total (Overall) | 2,737 (56.9%) | 2,073 (43.1%) |
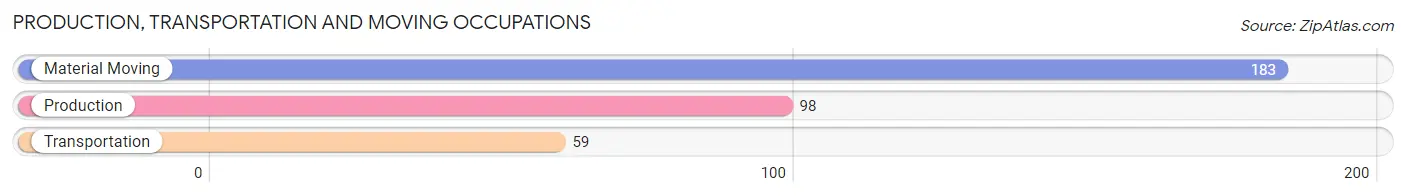
Production, Transportation and Moving Occupations
The most common Production, Transportation and Moving occupations in Purcellville are Material Moving (183 | 3.8%), Production (98 | 2.0%), and Transportation (59 | 1.2%).
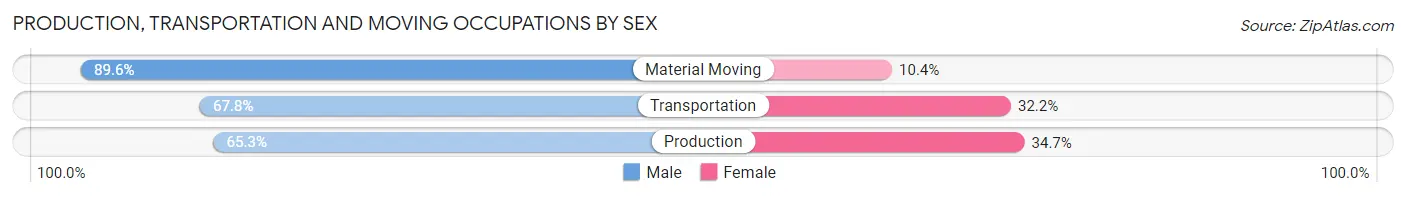
Production, Transportation and Moving Occupations by Sex
| Occupation | Male | Female |
| Production | 64 (65.3%) | 34 (34.7%) |
| Transportation | 40 (67.8%) | 19 (32.2%) |
| Material Moving | 164 (89.6%) | 19 (10.4%) |
| Total (Category) | 268 (78.8%) | 72 (21.2%) |
| Total (Overall) | 2,737 (56.9%) | 2,073 (43.1%) |
Employment Industries by Sex in Purcellville
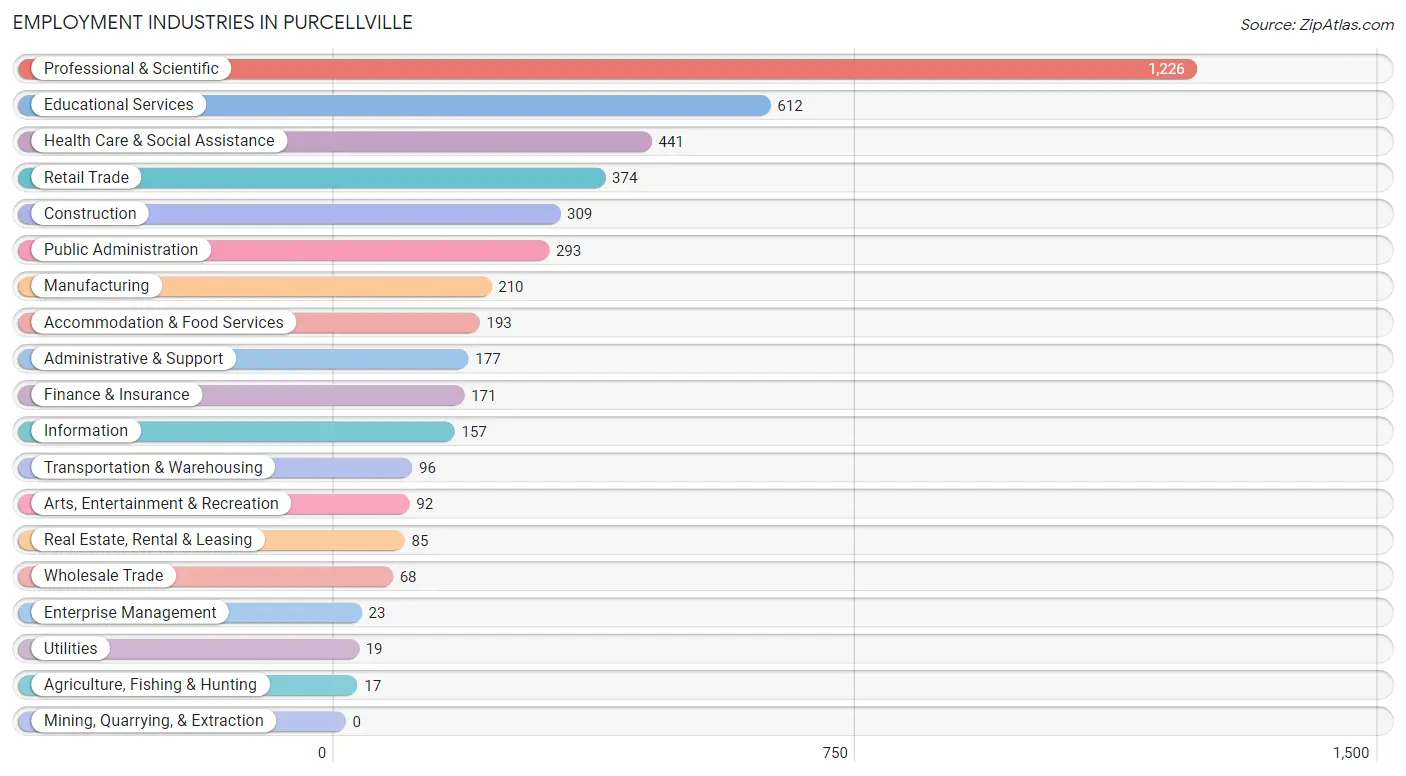
Employment Industries in Purcellville
The major employment industries in Purcellville include Professional & Scientific (1,226 | 25.5%), Educational Services (612 | 12.7%), Health Care & Social Assistance (441 | 9.2%), Retail Trade (374 | 7.8%), and Construction (309 | 6.4%).
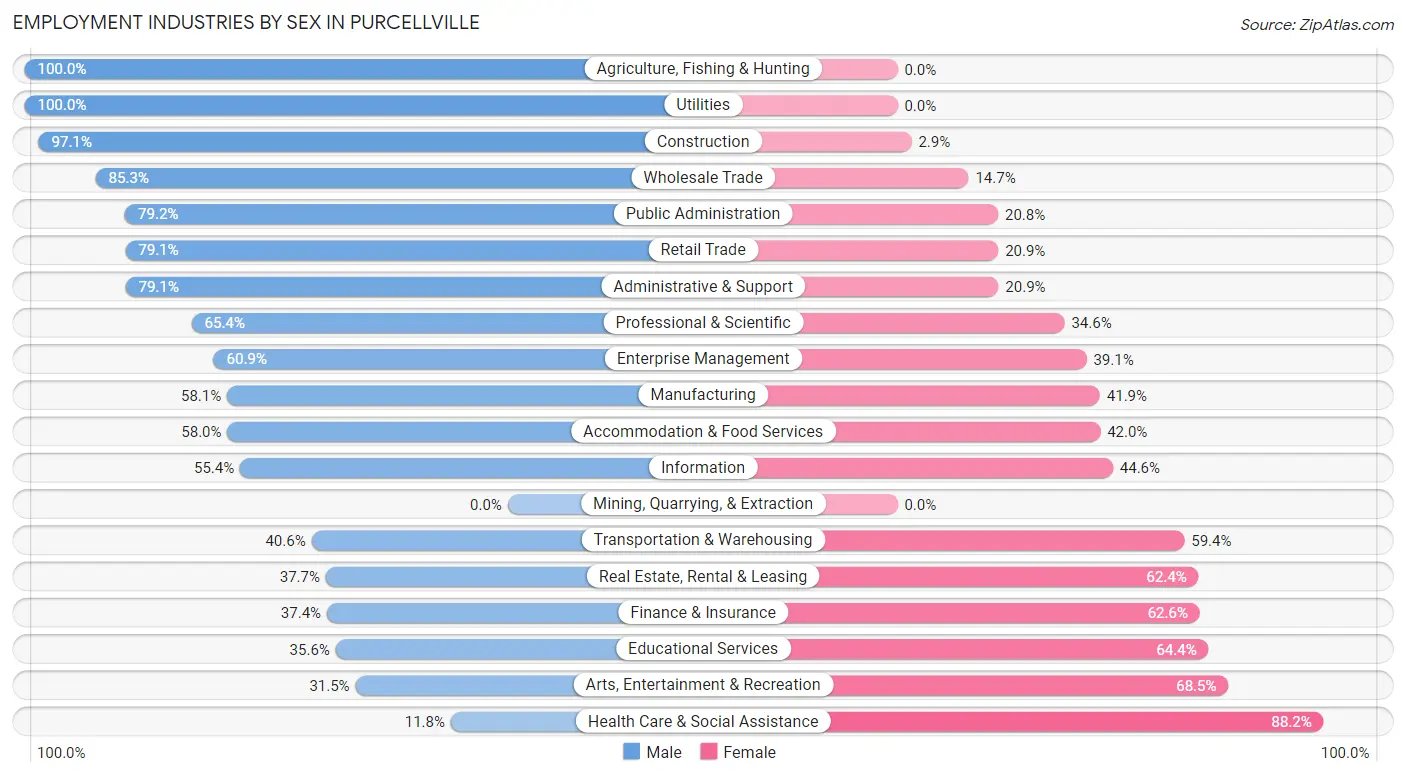
Employment Industries by Sex in Purcellville
The Purcellville industries that see more men than women are Agriculture, Fishing & Hunting (100.0%), Utilities (100.0%), and Construction (97.1%), whereas the industries that tend to have a higher number of women are Health Care & Social Assistance (88.2%), Arts, Entertainment & Recreation (68.5%), and Educational Services (64.4%).
| Industry | Male | Female |
| Agriculture, Fishing & Hunting | 17 (100.0%) | 0 (0.0%) |
| Mining, Quarrying, & Extraction | 0 (0.0%) | 0 (0.0%) |
| Construction | 300 (97.1%) | 9 (2.9%) |
| Manufacturing | 122 (58.1%) | 88 (41.9%) |
| Wholesale Trade | 58 (85.3%) | 10 (14.7%) |
| Retail Trade | 296 (79.1%) | 78 (20.9%) |
| Transportation & Warehousing | 39 (40.6%) | 57 (59.4%) |
| Utilities | 19 (100.0%) | 0 (0.0%) |
| Information | 87 (55.4%) | 70 (44.6%) |
| Finance & Insurance | 64 (37.4%) | 107 (62.6%) |
| Real Estate, Rental & Leasing | 32 (37.7%) | 53 (62.4%) |
| Professional & Scientific | 802 (65.4%) | 424 (34.6%) |
| Enterprise Management | 14 (60.9%) | 9 (39.1%) |
| Administrative & Support | 140 (79.1%) | 37 (20.9%) |
| Educational Services | 218 (35.6%) | 394 (64.4%) |
| Health Care & Social Assistance | 52 (11.8%) | 389 (88.2%) |
| Arts, Entertainment & Recreation | 29 (31.5%) | 63 (68.5%) |
| Accommodation & Food Services | 112 (58.0%) | 81 (42.0%) |
| Public Administration | 232 (79.2%) | 61 (20.8%) |
| Total | 2,737 (56.9%) | 2,073 (43.1%) |
Education in Purcellville
School Enrollment in Purcellville
The most common levels of schooling among the 2,530 students in Purcellville are high school (592 | 23.4%), elementary school (566 | 22.4%), and college / undergraduate (510 | 20.2%).
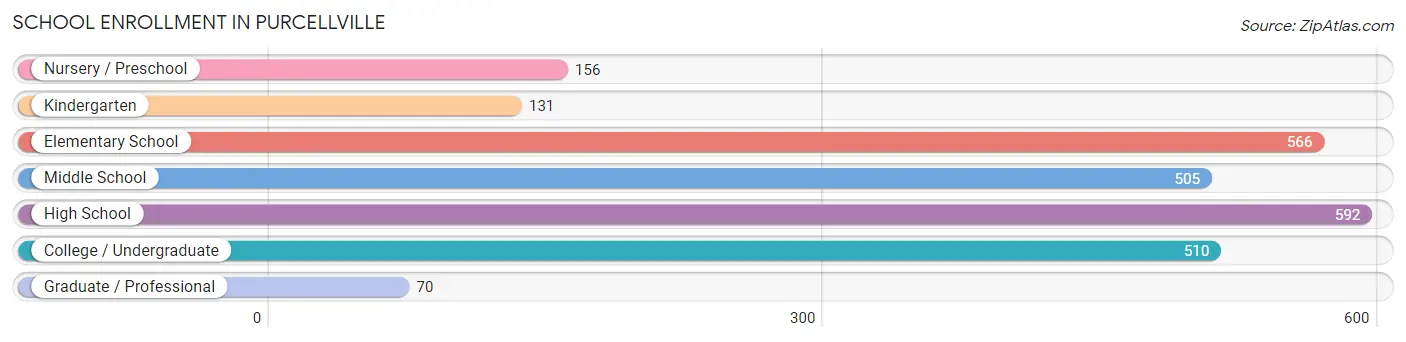
| School Level | # Students | % Students |
| Nursery / Preschool | 156 | 6.2% |
| Kindergarten | 131 | 5.2% |
| Elementary School | 566 | 22.4% |
| Middle School | 505 | 20.0% |
| High School | 592 | 23.4% |
| College / Undergraduate | 510 | 20.2% |
| Graduate / Professional | 70 | 2.8% |
| Total | 2,530 | 100.0% |
School Enrollment by Age by Funding Source in Purcellville
Out of a total of 2,530 students who are enrolled in schools in Purcellville, 321 (12.7%) attend a private institution, while the remaining 2,209 (87.3%) are enrolled in public schools. The age group of 20 to 24 year olds has the highest likelihood of being enrolled in private schools, with 102 (48.1% in the age bracket) enrolled. Conversely, the age group of 25 to 34 year olds has the lowest likelihood of being enrolled in a private school, with 39 (100.0% in the age bracket) attending a public institution.
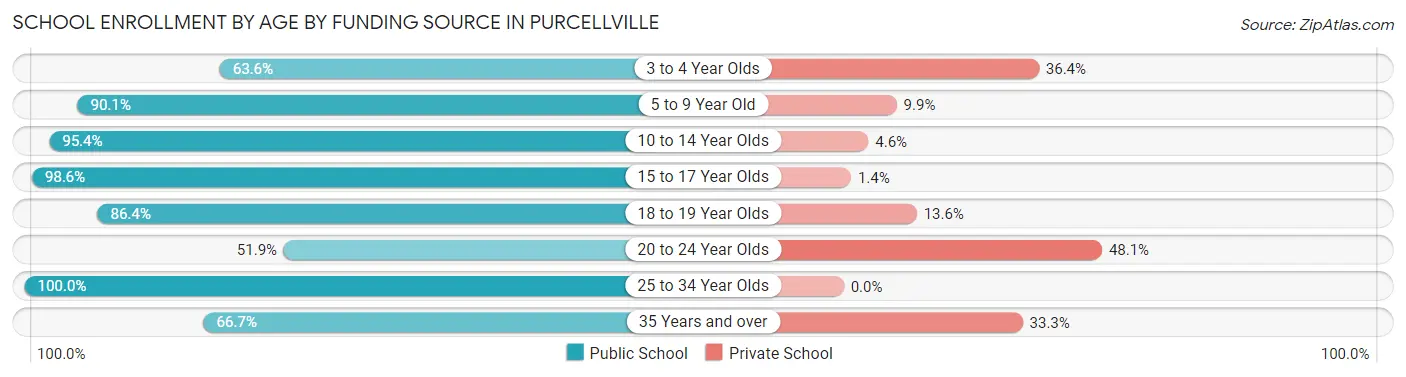
| Age Bracket | Public School | Private School |
| 3 to 4 Year Olds | 84 (63.6%) | 48 (36.4%) |
| 5 to 9 Year Old | 502 (90.1%) | 55 (9.9%) |
| 10 to 14 Year Olds | 685 (95.4%) | 33 (4.6%) |
| 15 to 17 Year Olds | 436 (98.6%) | 6 (1.4%) |
| 18 to 19 Year Olds | 286 (86.4%) | 45 (13.6%) |
| 20 to 24 Year Olds | 110 (51.9%) | 102 (48.1%) |
| 25 to 34 Year Olds | 39 (100.0%) | 0 (0.0%) |
| 35 Years and over | 66 (66.7%) | 33 (33.3%) |
| Total | 2,209 (87.3%) | 321 (12.7%) |
Educational Attainment by Field of Study in Purcellville
Business (625 | 17.6%), visual & performing arts (369 | 10.4%), education (327 | 9.2%), psychology (321 | 9.0%), and social sciences (287 | 8.1%) are the most common fields of study among 3,560 individuals in Purcellville who have obtained a bachelor's degree or higher.
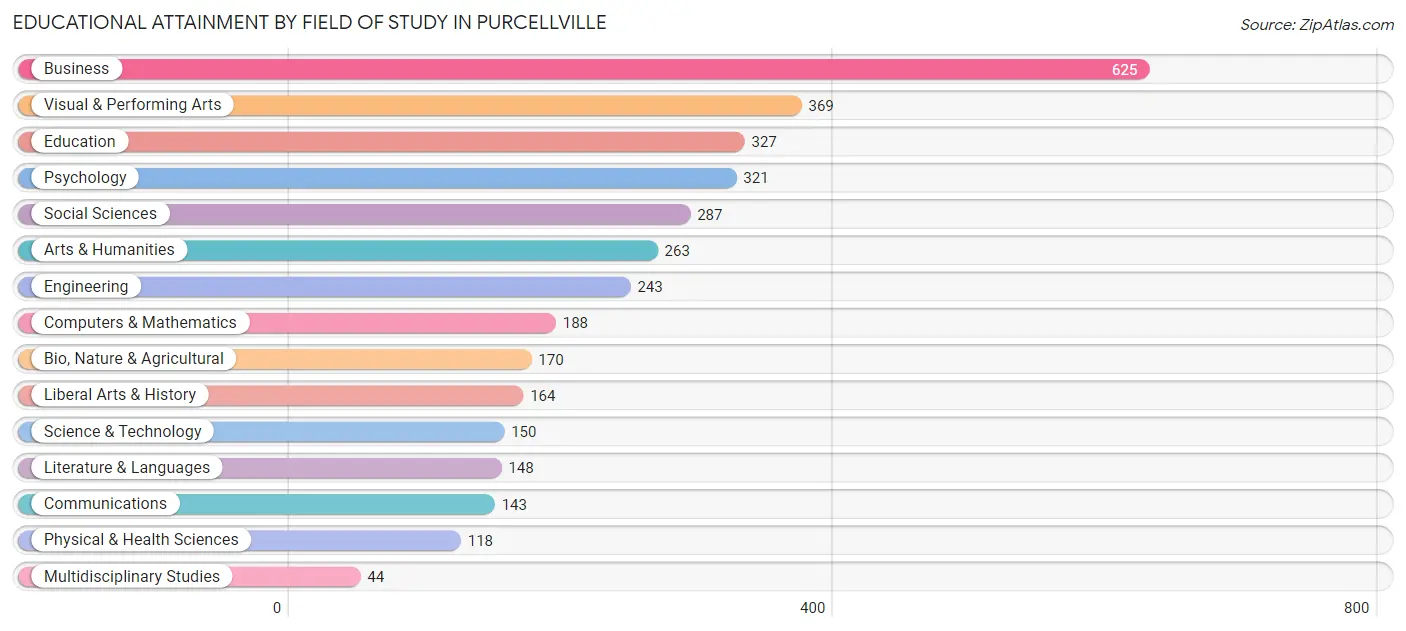
| Field of Study | # Graduates | % Graduates |
| Computers & Mathematics | 188 | 5.3% |
| Bio, Nature & Agricultural | 170 | 4.8% |
| Physical & Health Sciences | 118 | 3.3% |
| Psychology | 321 | 9.0% |
| Social Sciences | 287 | 8.1% |
| Engineering | 243 | 6.8% |
| Multidisciplinary Studies | 44 | 1.2% |
| Science & Technology | 150 | 4.2% |
| Business | 625 | 17.6% |
| Education | 327 | 9.2% |
| Literature & Languages | 148 | 4.2% |
| Liberal Arts & History | 164 | 4.6% |
| Visual & Performing Arts | 369 | 10.4% |
| Communications | 143 | 4.0% |
| Arts & Humanities | 263 | 7.4% |
| Total | 3,560 | 100.0% |
Transportation & Commute in Purcellville
Vehicle Availability by Sex in Purcellville
The most prevalent vehicle ownership categories in Purcellville are males with 2 vehicles (1,355, accounting for 53.2%) and females with 2 vehicles (849, making up 68.8%).
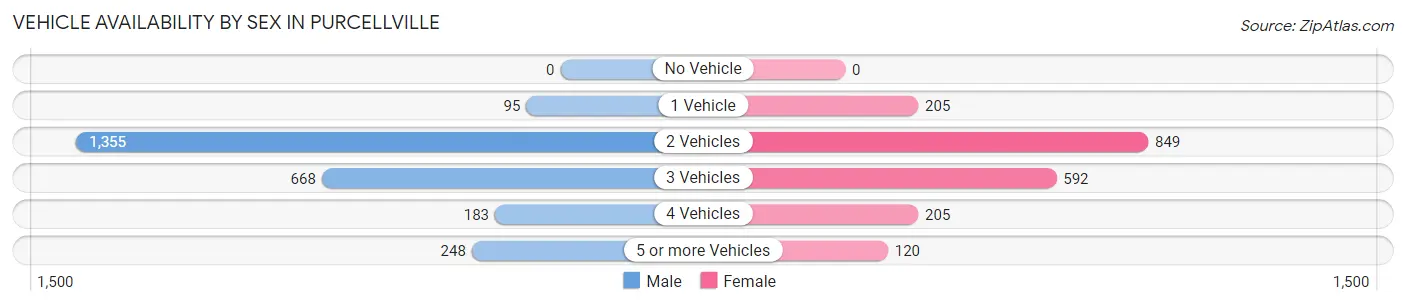
| Vehicles Available | Male | Female |
| No Vehicle | 0 (0.0%) | 0 (0.0%) |
| 1 Vehicle | 95 (3.7%) | 205 (10.4%) |
| 2 Vehicles | 1,355 (53.2%) | 849 (43.1%) |
| 3 Vehicles | 668 (26.2%) | 592 (30.0%) |
| 4 Vehicles | 183 (7.2%) | 205 (10.4%) |
| 5 or more Vehicles | 248 (9.7%) | 120 (6.1%) |
| Total | 2,549 (100.0%) | 1,971 (100.0%) |
Commute Time in Purcellville
The most frequently occuring commute durations in Purcellville are 60 to 89 minutes (486 commuters, 13.6%), 5 to 9 minutes (478 commuters, 13.3%), and 45 to 59 minutes (409 commuters, 11.4%).
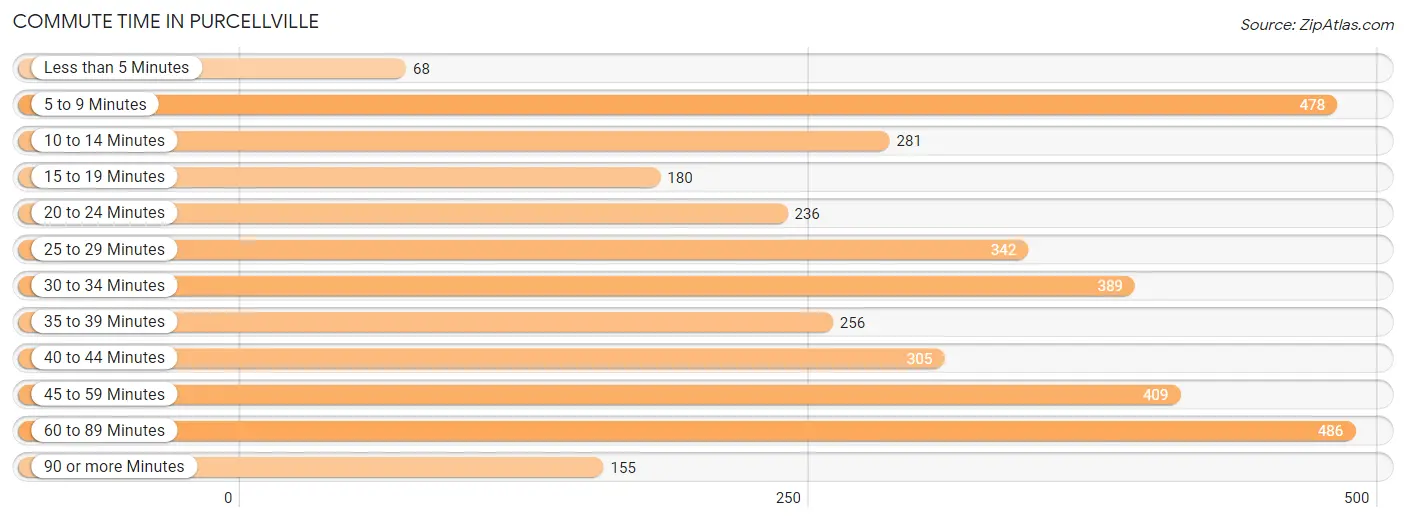
| Commute Time | # Commuters | % Commuters |
| Less than 5 Minutes | 68 | 1.9% |
| 5 to 9 Minutes | 478 | 13.3% |
| 10 to 14 Minutes | 281 | 7.8% |
| 15 to 19 Minutes | 180 | 5.0% |
| 20 to 24 Minutes | 236 | 6.6% |
| 25 to 29 Minutes | 342 | 9.5% |
| 30 to 34 Minutes | 389 | 10.8% |
| 35 to 39 Minutes | 256 | 7.1% |
| 40 to 44 Minutes | 305 | 8.5% |
| 45 to 59 Minutes | 409 | 11.4% |
| 60 to 89 Minutes | 486 | 13.6% |
| 90 or more Minutes | 155 | 4.3% |
Commute Time by Sex in Purcellville
The most common commute times in Purcellville are 60 to 89 minutes (355 commuters, 17.1%) for males and 5 to 9 minutes (235 commuters, 15.6%) for females.
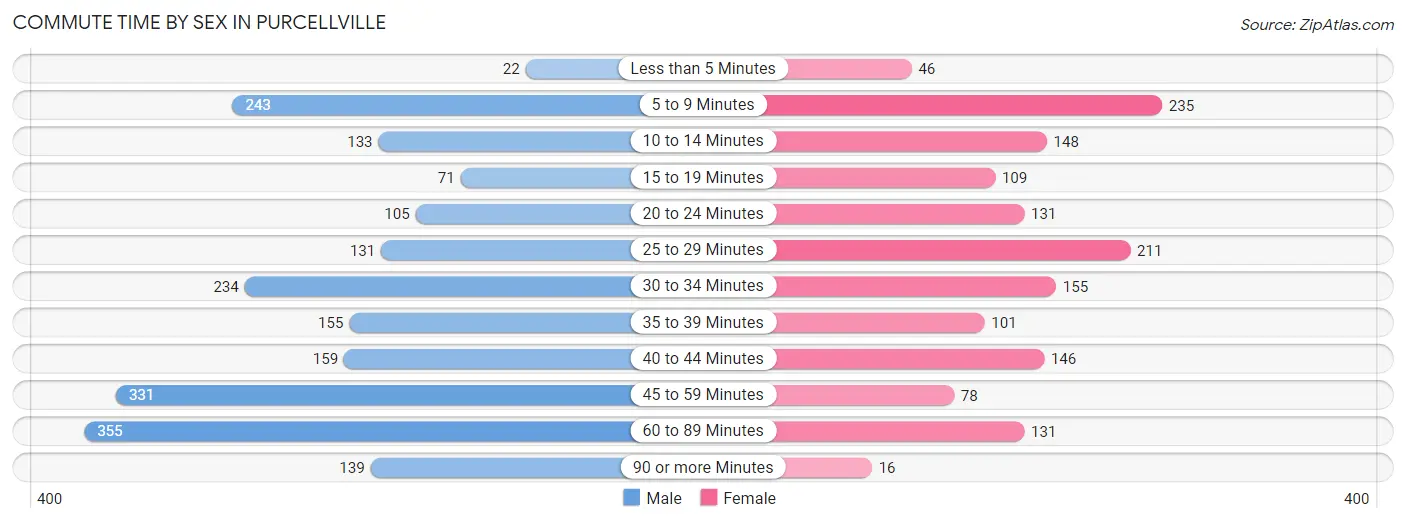
| Commute Time | Male | Female |
| Less than 5 Minutes | 22 (1.1%) | 46 (3.0%) |
| 5 to 9 Minutes | 243 (11.7%) | 235 (15.6%) |
| 10 to 14 Minutes | 133 (6.4%) | 148 (9.8%) |
| 15 to 19 Minutes | 71 (3.4%) | 109 (7.2%) |
| 20 to 24 Minutes | 105 (5.1%) | 131 (8.7%) |
| 25 to 29 Minutes | 131 (6.3%) | 211 (14.0%) |
| 30 to 34 Minutes | 234 (11.3%) | 155 (10.3%) |
| 35 to 39 Minutes | 155 (7.5%) | 101 (6.7%) |
| 40 to 44 Minutes | 159 (7.6%) | 146 (9.7%) |
| 45 to 59 Minutes | 331 (15.9%) | 78 (5.2%) |
| 60 to 89 Minutes | 355 (17.1%) | 131 (8.7%) |
| 90 or more Minutes | 139 (6.7%) | 16 (1.1%) |
Time of Departure to Work by Sex in Purcellville
The most frequent times of departure to work in Purcellville are 6:00 AM to 6:29 AM (331, 15.9%) for males and 7:30 AM to 7:59 AM (334, 22.2%) for females.
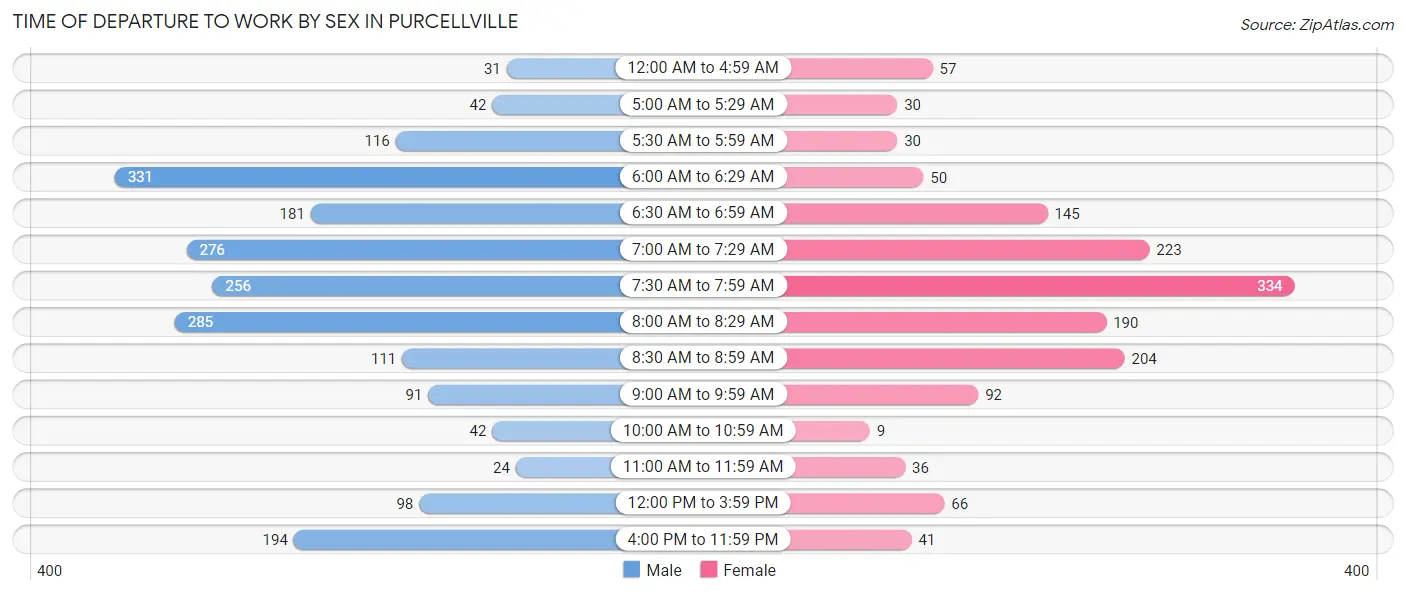
| Time of Departure | Male | Female |
| 12:00 AM to 4:59 AM | 31 (1.5%) | 57 (3.8%) |
| 5:00 AM to 5:29 AM | 42 (2.0%) | 30 (2.0%) |
| 5:30 AM to 5:59 AM | 116 (5.6%) | 30 (2.0%) |
| 6:00 AM to 6:29 AM | 331 (15.9%) | 50 (3.3%) |
| 6:30 AM to 6:59 AM | 181 (8.7%) | 145 (9.6%) |
| 7:00 AM to 7:29 AM | 276 (13.3%) | 223 (14.8%) |
| 7:30 AM to 7:59 AM | 256 (12.3%) | 334 (22.2%) |
| 8:00 AM to 8:29 AM | 285 (13.7%) | 190 (12.6%) |
| 8:30 AM to 8:59 AM | 111 (5.3%) | 204 (13.5%) |
| 9:00 AM to 9:59 AM | 91 (4.4%) | 92 (6.1%) |
| 10:00 AM to 10:59 AM | 42 (2.0%) | 9 (0.6%) |
| 11:00 AM to 11:59 AM | 24 (1.1%) | 36 (2.4%) |
| 12:00 PM to 3:59 PM | 98 (4.7%) | 66 (4.4%) |
| 4:00 PM to 11:59 PM | 194 (9.3%) | 41 (2.7%) |
| Total | 2,078 (100.0%) | 1,507 (100.0%) |
Housing Occupancy in Purcellville
Occupancy by Ownership in Purcellville
Of the total 2,734 dwellings in Purcellville, owner-occupied units account for 2,379 (87.0%), while renter-occupied units make up 355 (13.0%).
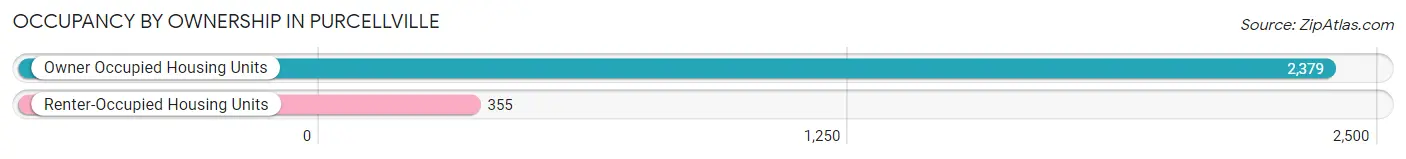
| Occupancy | # Housing Units | % Housing Units |
| Owner Occupied Housing Units | 2,379 | 87.0% |
| Renter-Occupied Housing Units | 355 | 13.0% |
| Total Occupied Housing Units | 2,734 | 100.0% |
Occupancy by Household Size in Purcellville
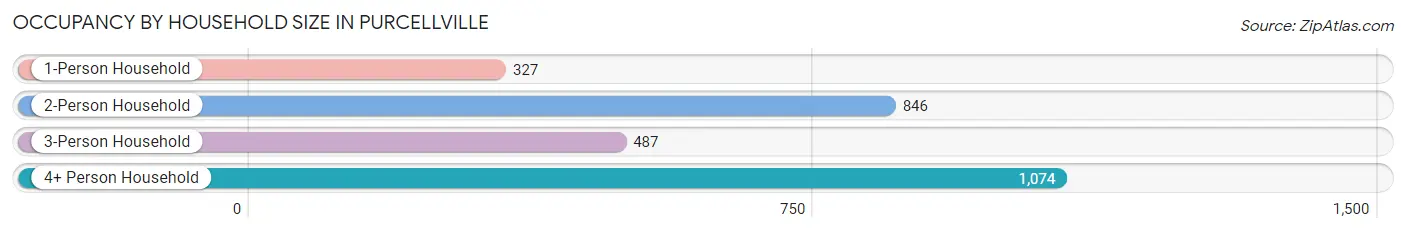
| Household Size | # Housing Units | % Housing Units |
| 1-Person Household | 327 | 12.0% |
| 2-Person Household | 846 | 30.9% |
| 3-Person Household | 487 | 17.8% |
| 4+ Person Household | 1,074 | 39.3% |
| Total Housing Units | 2,734 | 100.0% |
Occupancy by Ownership by Household Size in Purcellville
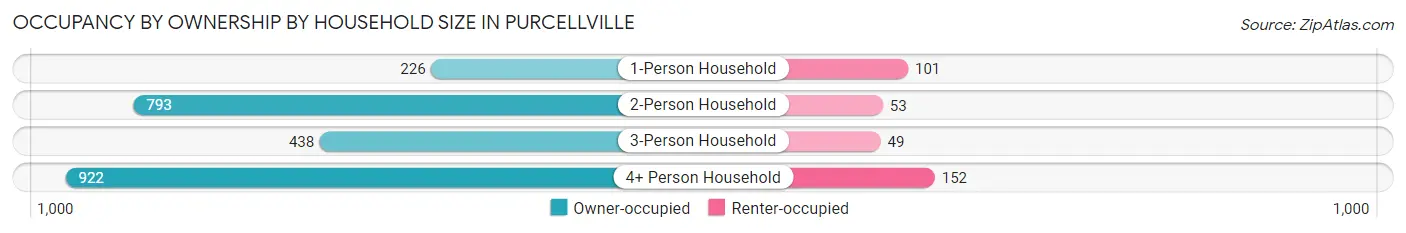
| Household Size | Owner-occupied | Renter-occupied |
| 1-Person Household | 226 (69.1%) | 101 (30.9%) |
| 2-Person Household | 793 (93.7%) | 53 (6.3%) |
| 3-Person Household | 438 (89.9%) | 49 (10.1%) |
| 4+ Person Household | 922 (85.9%) | 152 (14.1%) |
| Total Housing Units | 2,379 (87.0%) | 355 (13.0%) |
Occupancy by Educational Attainment in Purcellville
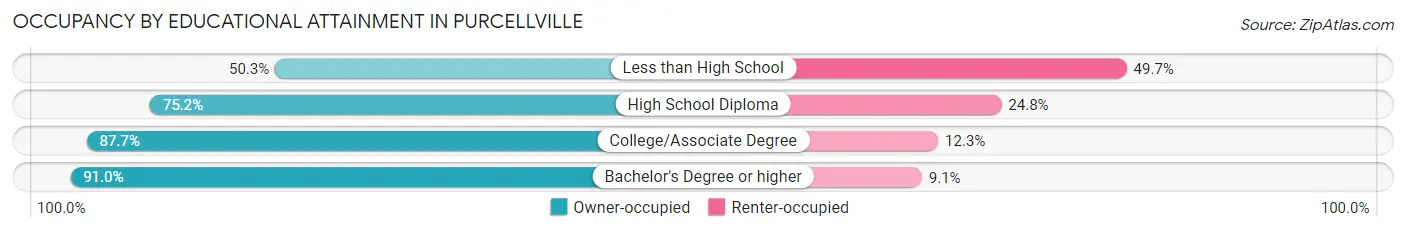
| Household Size | Owner-occupied | Renter-occupied |
| Less than High School | 74 (50.3%) | 73 (49.7%) |
| High School Diploma | 109 (75.2%) | 36 (24.8%) |
| College/Associate Degree | 678 (87.7%) | 95 (12.3%) |
| Bachelor's Degree or higher | 1,518 (90.9%) | 151 (9.0%) |
Occupancy by Age of Householder in Purcellville
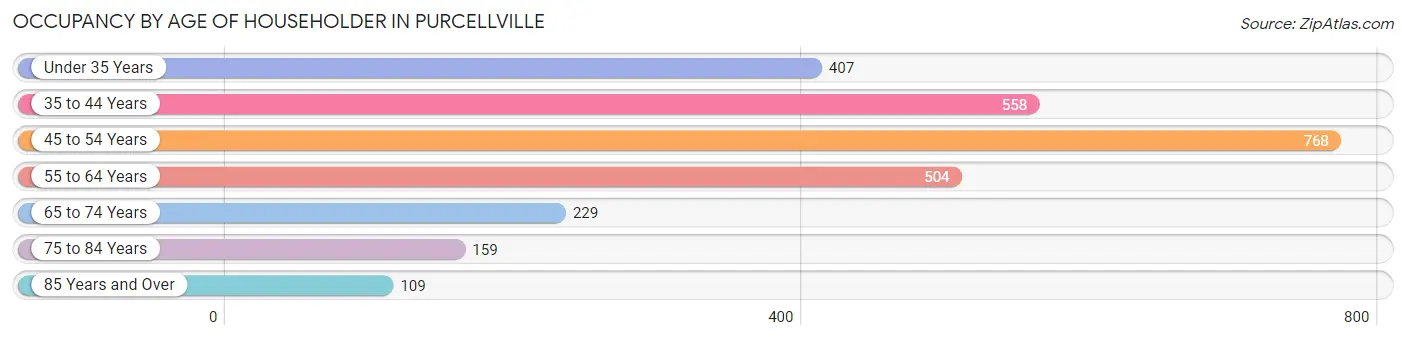
| Age Bracket | # Households | % Households |
| Under 35 Years | 407 | 14.9% |
| 35 to 44 Years | 558 | 20.4% |
| 45 to 54 Years | 768 | 28.1% |
| 55 to 64 Years | 504 | 18.4% |
| 65 to 74 Years | 229 | 8.4% |
| 75 to 84 Years | 159 | 5.8% |
| 85 Years and Over | 109 | 4.0% |
| Total | 2,734 | 100.0% |
Housing Finances in Purcellville
Median Income by Occupancy in Purcellville
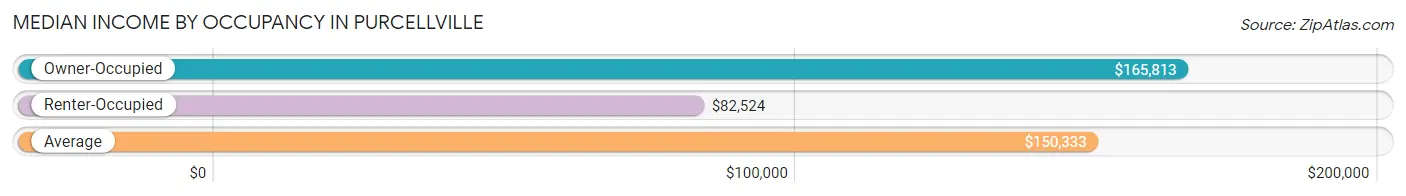
| Occupancy Type | # Households | Median Income |
| Owner-Occupied | 2,379 (87.0%) | $165,813 |
| Renter-Occupied | 355 (13.0%) | $82,524 |
| Average | 2,734 (100.0%) | $150,333 |
Occupancy by Householder Income Bracket in Purcellville
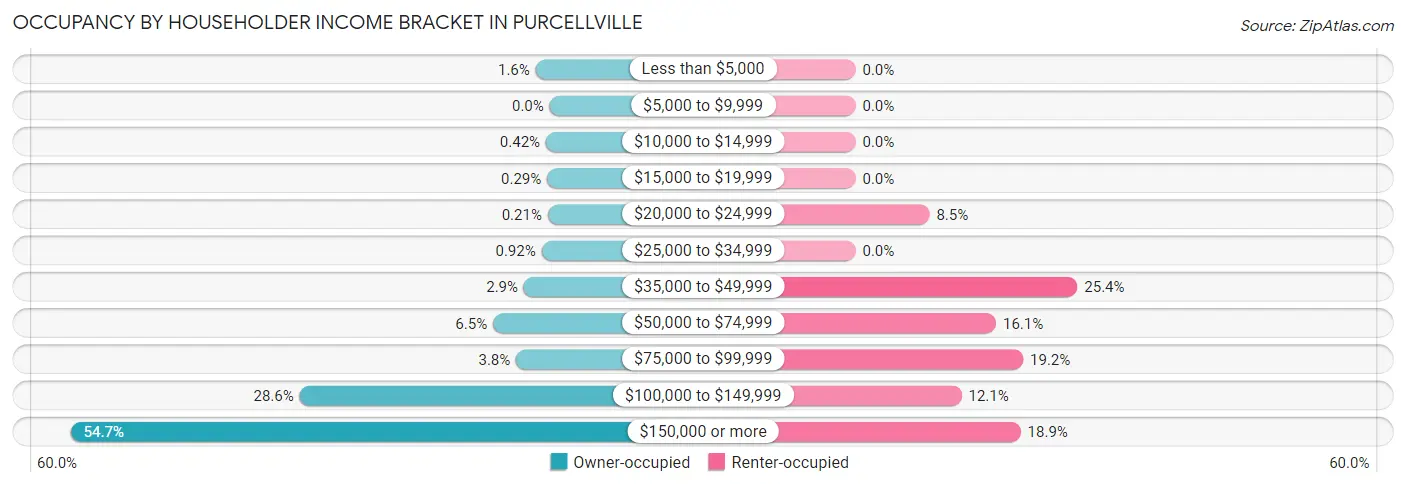
| Income Bracket | Owner-occupied | Renter-occupied |
| Less than $5,000 | 38 (1.6%) | 0 (0.0%) |
| $5,000 to $9,999 | 0 (0.0%) | 0 (0.0%) |
| $10,000 to $14,999 | 10 (0.4%) | 0 (0.0%) |
| $15,000 to $19,999 | 7 (0.3%) | 0 (0.0%) |
| $20,000 to $24,999 | 5 (0.2%) | 30 (8.5%) |
| $25,000 to $34,999 | 22 (0.9%) | 0 (0.0%) |
| $35,000 to $49,999 | 70 (2.9%) | 90 (25.4%) |
| $50,000 to $74,999 | 154 (6.5%) | 57 (16.1%) |
| $75,000 to $99,999 | 91 (3.8%) | 68 (19.2%) |
| $100,000 to $149,999 | 680 (28.6%) | 43 (12.1%) |
| $150,000 or more | 1,302 (54.7%) | 67 (18.9%) |
| Total | 2,379 (100.0%) | 355 (100.0%) |
Monthly Housing Cost Tiers in Purcellville
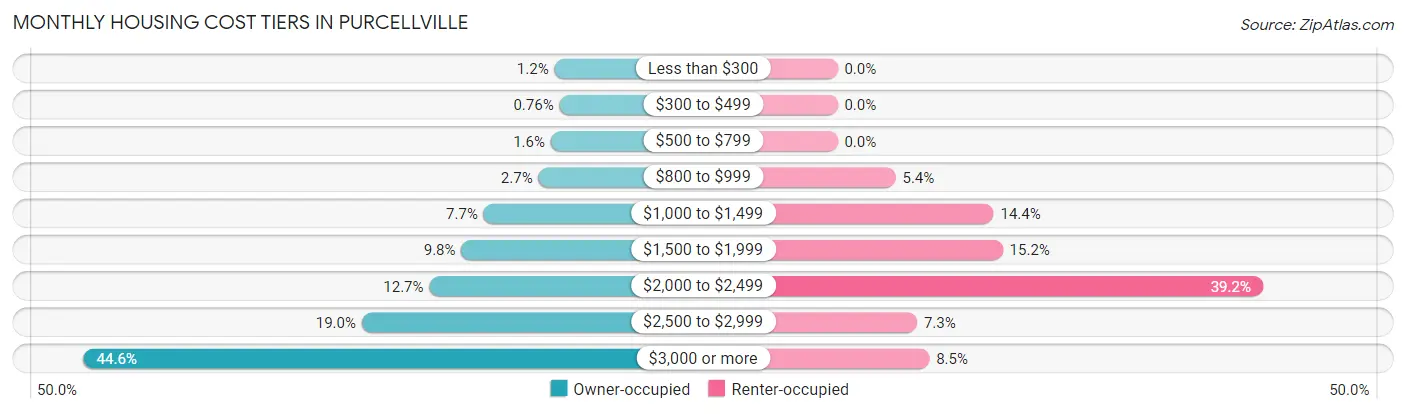
| Monthly Cost | Owner-occupied | Renter-occupied |
| Less than $300 | 29 (1.2%) | 0 (0.0%) |
| $300 to $499 | 18 (0.8%) | 0 (0.0%) |
| $500 to $799 | 37 (1.6%) | 0 (0.0%) |
| $800 to $999 | 64 (2.7%) | 19 (5.3%) |
| $1,000 to $1,499 | 184 (7.7%) | 51 (14.4%) |
| $1,500 to $1,999 | 233 (9.8%) | 54 (15.2%) |
| $2,000 to $2,499 | 303 (12.7%) | 139 (39.2%) |
| $2,500 to $2,999 | 451 (19.0%) | 26 (7.3%) |
| $3,000 or more | 1,060 (44.6%) | 30 (8.5%) |
| Total | 2,379 (100.0%) | 355 (100.0%) |
Physical Housing Characteristics in Purcellville
Housing Structures in Purcellville
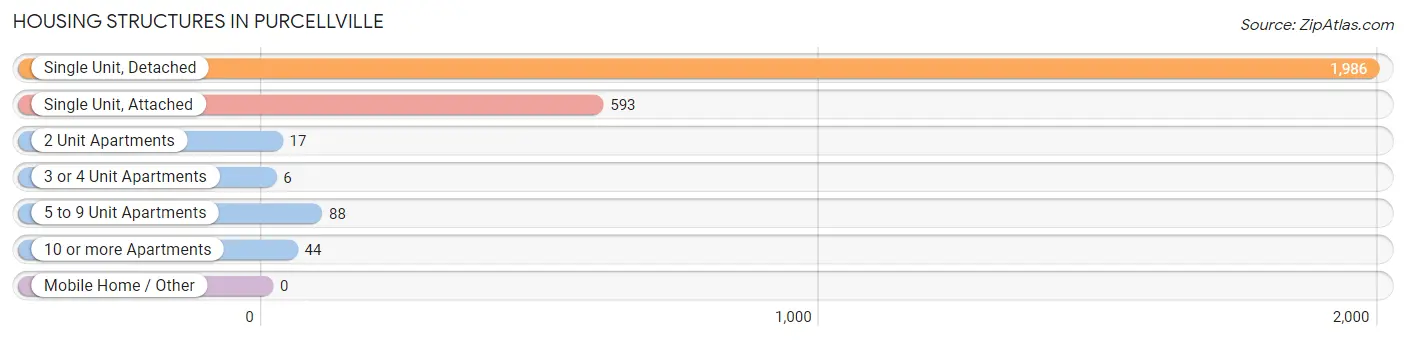
| Structure Type | # Housing Units | % Housing Units |
| Single Unit, Detached | 1,986 | 72.6% |
| Single Unit, Attached | 593 | 21.7% |
| 2 Unit Apartments | 17 | 0.6% |
| 3 or 4 Unit Apartments | 6 | 0.2% |
| 5 to 9 Unit Apartments | 88 | 3.2% |
| 10 or more Apartments | 44 | 1.6% |
| Mobile Home / Other | 0 | 0.0% |
| Total | 2,734 | 100.0% |
Housing Structures by Occupancy in Purcellville
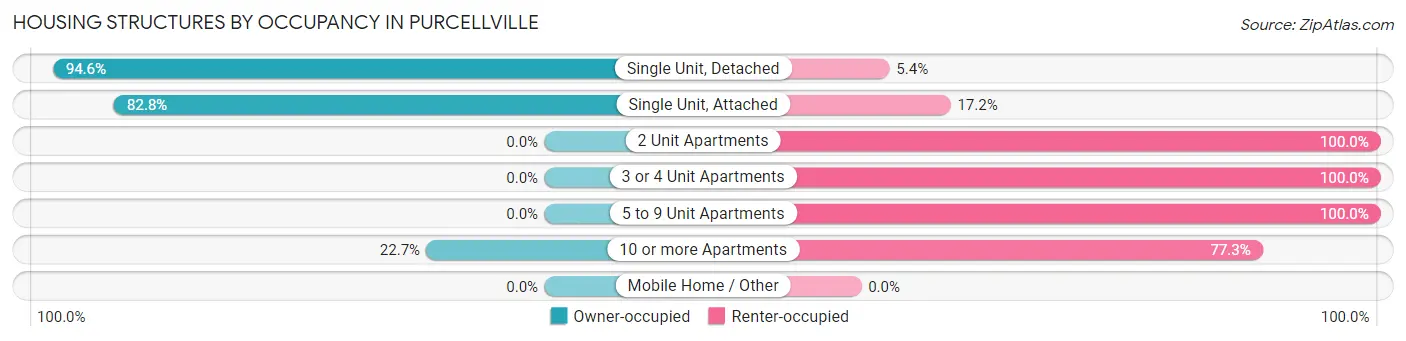
| Structure Type | Owner-occupied | Renter-occupied |
| Single Unit, Detached | 1,878 (94.6%) | 108 (5.4%) |
| Single Unit, Attached | 491 (82.8%) | 102 (17.2%) |
| 2 Unit Apartments | 0 (0.0%) | 17 (100.0%) |
| 3 or 4 Unit Apartments | 0 (0.0%) | 6 (100.0%) |
| 5 to 9 Unit Apartments | 0 (0.0%) | 88 (100.0%) |
| 10 or more Apartments | 10 (22.7%) | 34 (77.3%) |
| Mobile Home / Other | 0 (0.0%) | 0 (0.0%) |
| Total | 2,379 (87.0%) | 355 (13.0%) |
Housing Structures by Number of Rooms in Purcellville
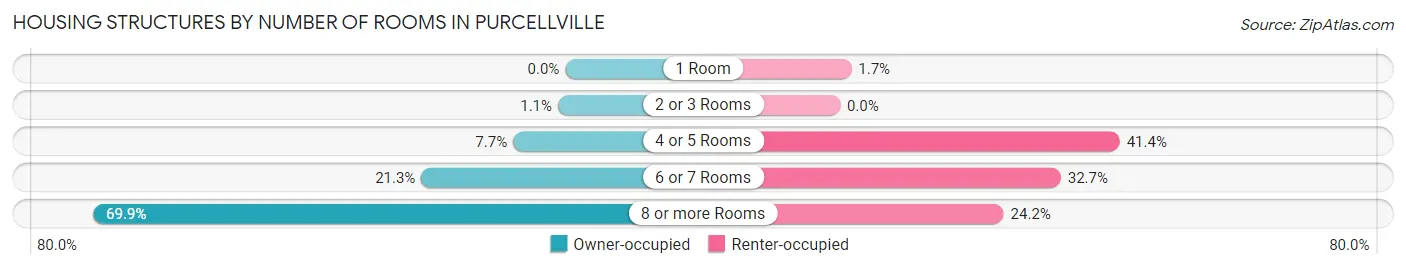
| Number of Rooms | Owner-occupied | Renter-occupied |
| 1 Room | 0 (0.0%) | 6 (1.7%) |
| 2 or 3 Rooms | 26 (1.1%) | 0 (0.0%) |
| 4 or 5 Rooms | 184 (7.7%) | 147 (41.4%) |
| 6 or 7 Rooms | 507 (21.3%) | 116 (32.7%) |
| 8 or more Rooms | 1,662 (69.9%) | 86 (24.2%) |
| Total | 2,379 (100.0%) | 355 (100.0%) |
Housing Structure by Heating Type in Purcellville
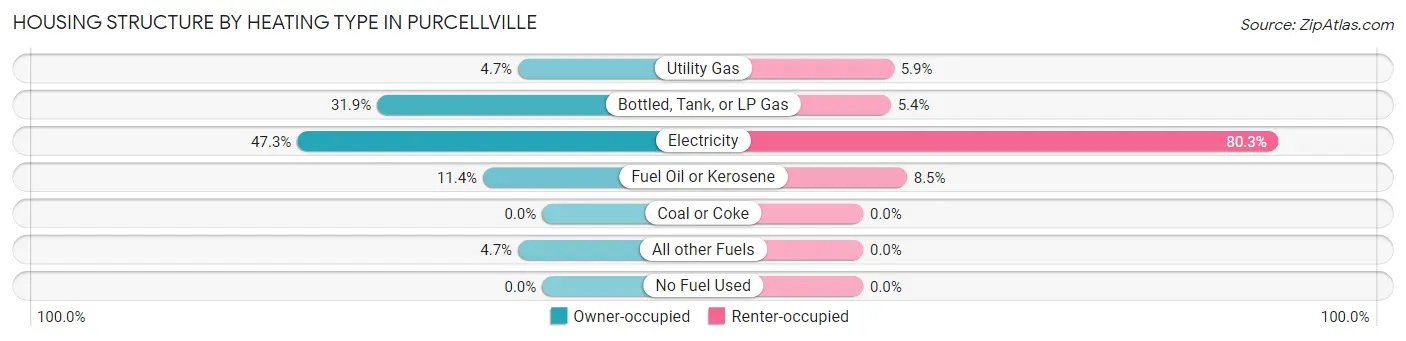
| Heating Type | Owner-occupied | Renter-occupied |
| Utility Gas | 111 (4.7%) | 21 (5.9%) |
| Bottled, Tank, or LP Gas | 759 (31.9%) | 19 (5.3%) |
| Electricity | 1,126 (47.3%) | 285 (80.3%) |
| Fuel Oil or Kerosene | 272 (11.4%) | 30 (8.5%) |
| Coal or Coke | 0 (0.0%) | 0 (0.0%) |
| All other Fuels | 111 (4.7%) | 0 (0.0%) |
| No Fuel Used | 0 (0.0%) | 0 (0.0%) |
| Total | 2,379 (100.0%) | 355 (100.0%) |
Household Vehicle Usage in Purcellville
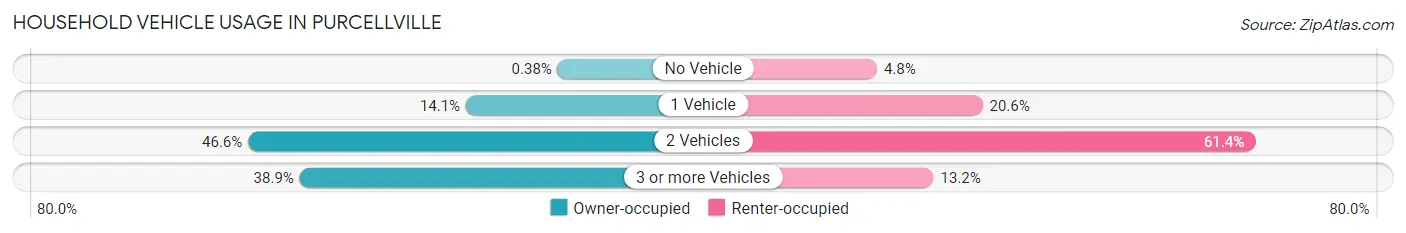
| Vehicles per Household | Owner-occupied | Renter-occupied |
| No Vehicle | 9 (0.4%) | 17 (4.8%) |
| 1 Vehicle | 335 (14.1%) | 73 (20.6%) |
| 2 Vehicles | 1,109 (46.6%) | 218 (61.4%) |
| 3 or more Vehicles | 926 (38.9%) | 47 (13.2%) |
| Total | 2,379 (100.0%) | 355 (100.0%) |
Real Estate & Mortgages in Purcellville
Real Estate and Mortgage Overview in Purcellville
| Characteristic | Without Mortgage | With Mortgage |
| Housing Units | 249 | 2,130 |
| Median Property Value | $557,600 | $572,000 |
| Median Household Income | $120,469 | $1,190 |
| Monthly Housing Costs | $959 | $1,060 |
| Real Estate Taxes | $5,907 | $117 |
Property Value by Mortgage Status in Purcellville
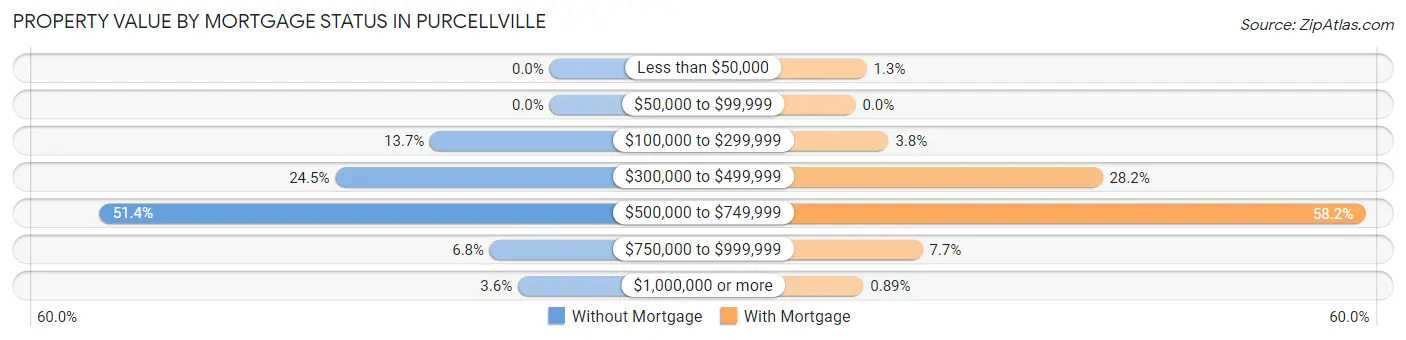
| Property Value | Without Mortgage | With Mortgage |
| Less than $50,000 | 0 (0.0%) | 27 (1.3%) |
| $50,000 to $99,999 | 0 (0.0%) | 0 (0.0%) |
| $100,000 to $299,999 | 34 (13.7%) | 80 (3.8%) |
| $300,000 to $499,999 | 61 (24.5%) | 601 (28.2%) |
| $500,000 to $749,999 | 128 (51.4%) | 1,240 (58.2%) |
| $750,000 to $999,999 | 17 (6.8%) | 163 (7.6%) |
| $1,000,000 or more | 9 (3.6%) | 19 (0.9%) |
| Total | 249 (100.0%) | 2,130 (100.0%) |
Household Income by Mortgage Status in Purcellville
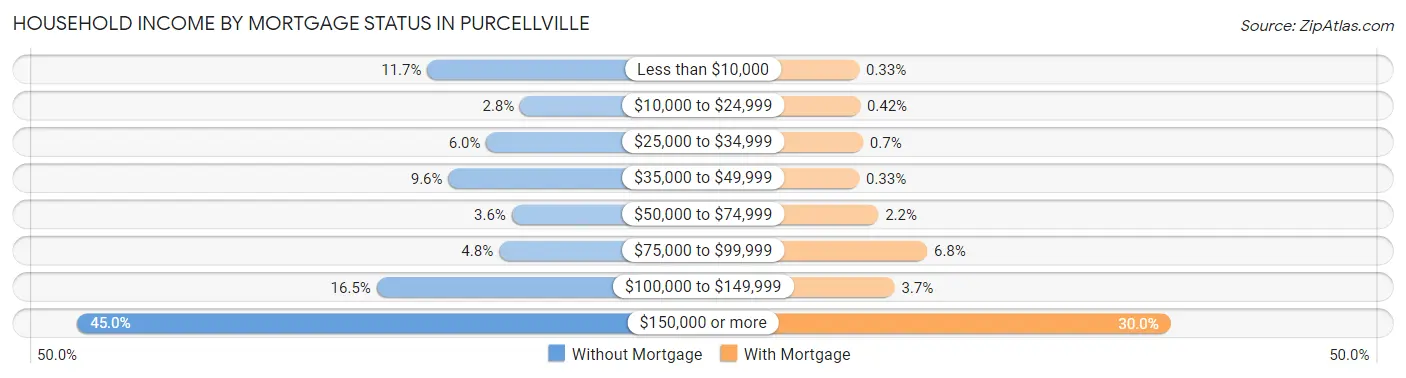
| Household Income | Without Mortgage | With Mortgage |
| Less than $10,000 | 29 (11.7%) | 7 (0.3%) |
| $10,000 to $24,999 | 7 (2.8%) | 9 (0.4%) |
| $25,000 to $34,999 | 15 (6.0%) | 15 (0.7%) |
| $35,000 to $49,999 | 24 (9.6%) | 7 (0.3%) |
| $50,000 to $74,999 | 9 (3.6%) | 46 (2.2%) |
| $75,000 to $99,999 | 12 (4.8%) | 145 (6.8%) |
| $100,000 to $149,999 | 41 (16.5%) | 79 (3.7%) |
| $150,000 or more | 112 (45.0%) | 639 (30.0%) |
| Total | 249 (100.0%) | 2,130 (100.0%) |
Property Value to Household Income Ratio in Purcellville
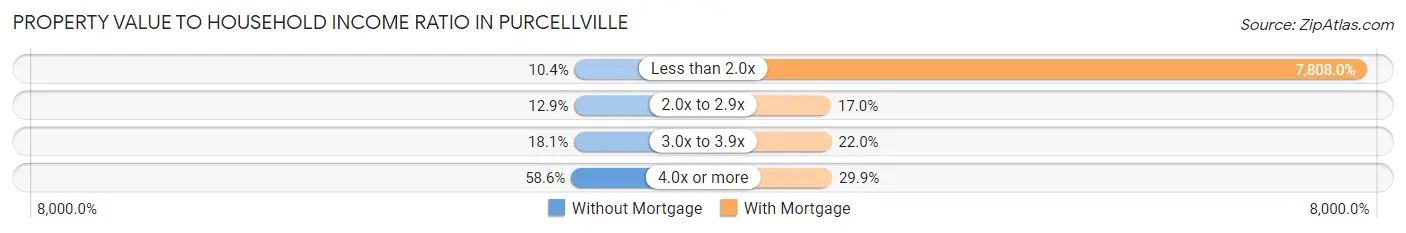
| Value-to-Income Ratio | Without Mortgage | With Mortgage |
| Less than 2.0x | 26 (10.4%) | 166,310 (7,808.0%) |
| 2.0x to 2.9x | 32 (12.9%) | 362 (17.0%) |
| 3.0x to 3.9x | 45 (18.1%) | 469 (22.0%) |
| 4.0x or more | 146 (58.6%) | 636 (29.9%) |
| Total | 249 (100.0%) | 2,130 (100.0%) |
Real Estate Taxes by Mortgage Status in Purcellville
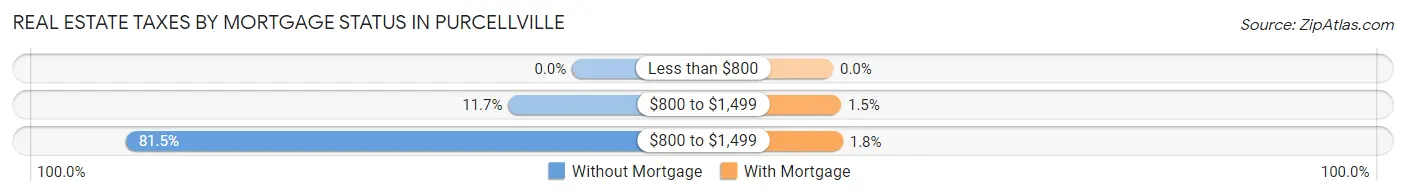
| Property Taxes | Without Mortgage | With Mortgage |
| Less than $800 | 0 (0.0%) | 0 (0.0%) |
| $800 to $1,499 | 29 (11.7%) | 31 (1.5%) |
| $800 to $1,499 | 203 (81.5%) | 38 (1.8%) |
| Total | 249 (100.0%) | 2,130 (100.0%) |
Health & Disability in Purcellville
Health Insurance Coverage by Age in Purcellville
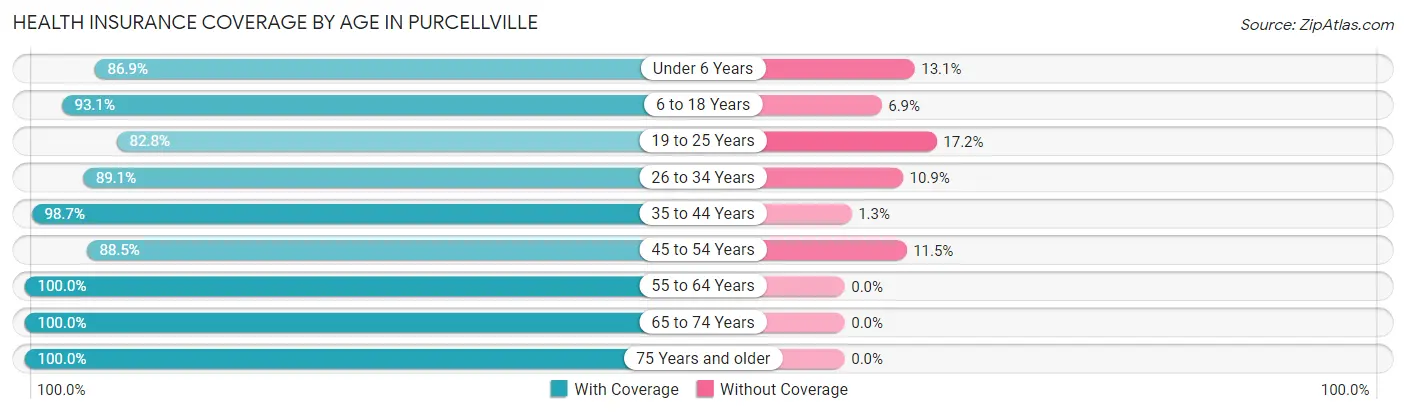
| Age Bracket | With Coverage | Without Coverage |
| Under 6 Years | 646 (86.9%) | 97 (13.1%) |
| 6 to 18 Years | 1,808 (93.1%) | 134 (6.9%) |
| 19 to 25 Years | 603 (82.8%) | 125 (17.2%) |
| 26 to 34 Years | 845 (89.1%) | 103 (10.9%) |
| 35 to 44 Years | 1,068 (98.7%) | 14 (1.3%) |
| 45 to 54 Years | 1,372 (88.5%) | 179 (11.5%) |
| 55 to 64 Years | 1,064 (100.0%) | 0 (0.0%) |
| 65 to 74 Years | 415 (100.0%) | 0 (0.0%) |
| 75 Years and older | 444 (100.0%) | 0 (0.0%) |
| Total | 8,265 (92.7%) | 652 (7.3%) |
Health Insurance Coverage by Citizenship Status in Purcellville
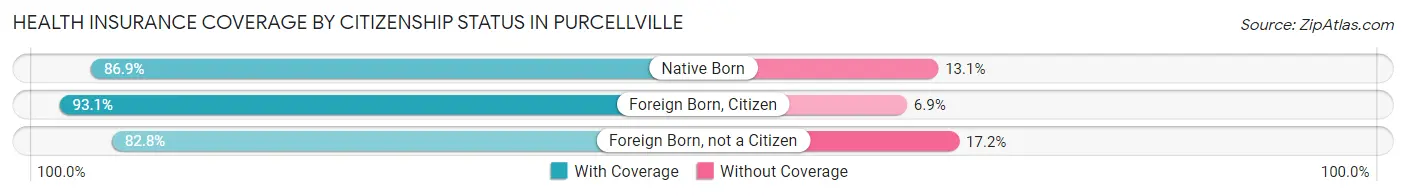
| Citizenship Status | With Coverage | Without Coverage |
| Native Born | 646 (86.9%) | 97 (13.1%) |
| Foreign Born, Citizen | 1,808 (93.1%) | 134 (6.9%) |
| Foreign Born, not a Citizen | 603 (82.8%) | 125 (17.2%) |
Health Insurance Coverage by Household Income in Purcellville
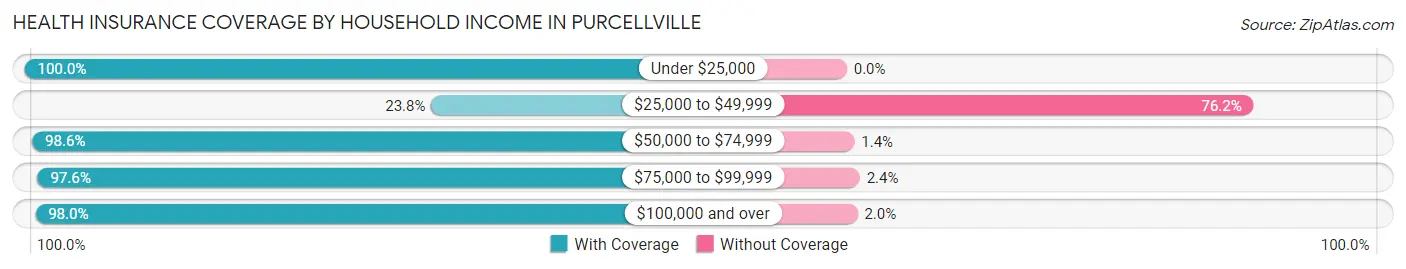
| Household Income | With Coverage | Without Coverage |
| Under $25,000 | 169 (100.0%) | 0 (0.0%) |
| $25,000 to $49,999 | 149 (23.8%) | 477 (76.2%) |
| $50,000 to $74,999 | 418 (98.6%) | 6 (1.4%) |
| $75,000 to $99,999 | 443 (97.6%) | 11 (2.4%) |
| $100,000 and over | 6,846 (98.0%) | 140 (2.0%) |
Public vs Private Health Insurance Coverage by Age in Purcellville
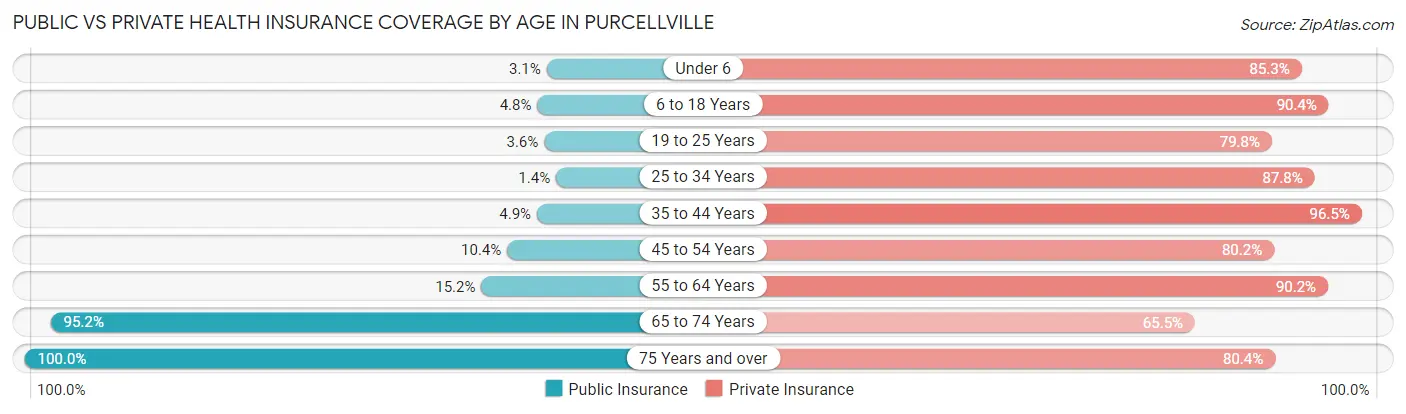
| Age Bracket | Public Insurance | Private Insurance |
| Under 6 | 23 (3.1%) | 634 (85.3%) |
| 6 to 18 Years | 94 (4.8%) | 1,755 (90.4%) |
| 19 to 25 Years | 26 (3.6%) | 581 (79.8%) |
| 25 to 34 Years | 13 (1.4%) | 832 (87.8%) |
| 35 to 44 Years | 53 (4.9%) | 1,044 (96.5%) |
| 45 to 54 Years | 162 (10.4%) | 1,244 (80.2%) |
| 55 to 64 Years | 162 (15.2%) | 960 (90.2%) |
| 65 to 74 Years | 395 (95.2%) | 272 (65.5%) |
| 75 Years and over | 444 (100.0%) | 357 (80.4%) |
| Total | 1,372 (15.4%) | 7,679 (86.1%) |
Disability Status by Sex by Age in Purcellville
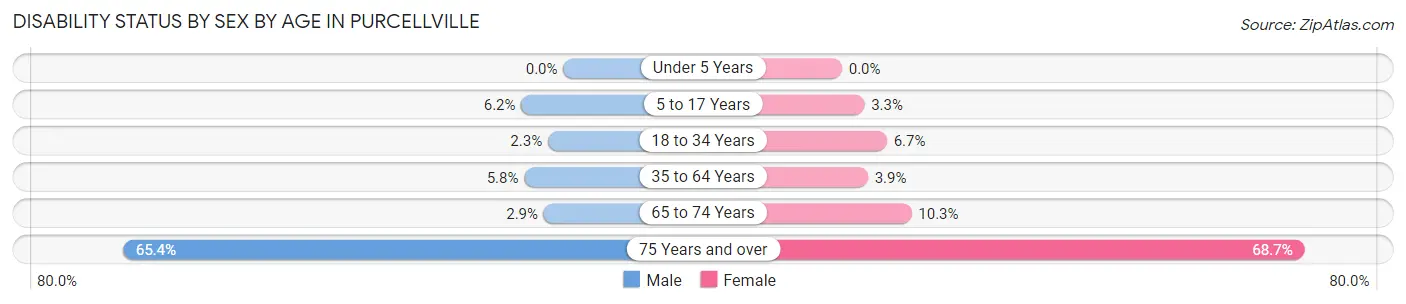
| Age Bracket | Male | Female |
| Under 5 Years | 0 (0.0%) | 0 (0.0%) |
| 5 to 17 Years | 59 (6.2%) | 28 (3.3%) |
| 18 to 34 Years | 21 (2.3%) | 64 (6.7%) |
| 35 to 64 Years | 112 (5.8%) | 68 (3.8%) |
| 65 to 74 Years | 5 (2.9%) | 25 (10.3%) |
| 75 Years and over | 140 (65.4%) | 158 (68.7%) |
Disability Class by Sex by Age in Purcellville
Disability Class: Hearing Difficulty
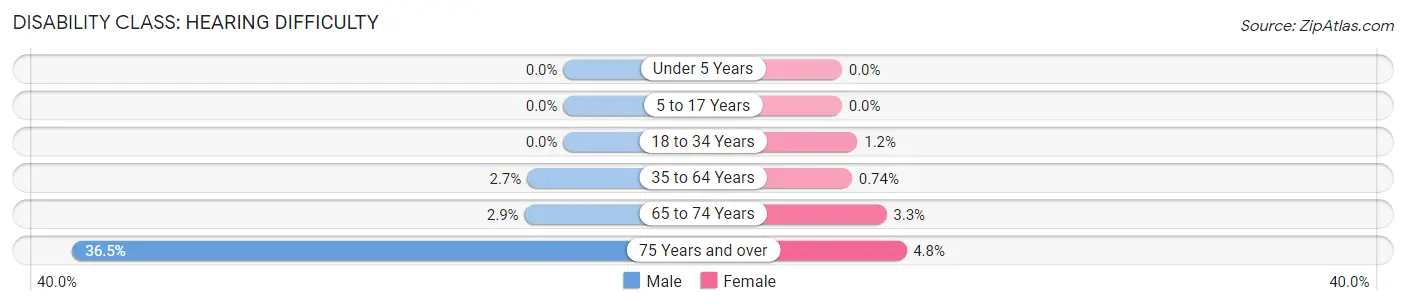
| Age Bracket | Male | Female |
| Under 5 Years | 0 (0.0%) | 0 (0.0%) |
| 5 to 17 Years | 0 (0.0%) | 0 (0.0%) |
| 18 to 34 Years | 0 (0.0%) | 11 (1.1%) |
| 35 to 64 Years | 52 (2.7%) | 13 (0.7%) |
| 65 to 74 Years | 5 (2.9%) | 8 (3.3%) |
| 75 Years and over | 78 (36.4%) | 11 (4.8%) |
Disability Class: Vision Difficulty
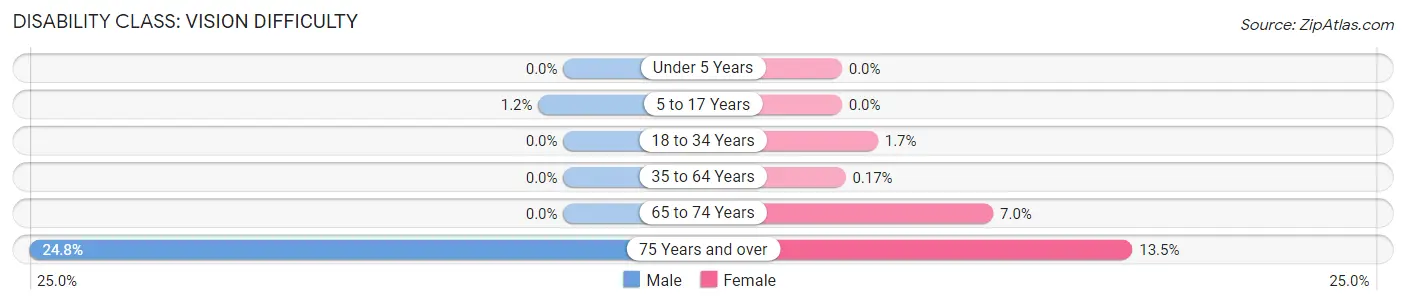
| Age Bracket | Male | Female |
| Under 5 Years | 0 (0.0%) | 0 (0.0%) |
| 5 to 17 Years | 11 (1.2%) | 0 (0.0%) |
| 18 to 34 Years | 0 (0.0%) | 16 (1.7%) |
| 35 to 64 Years | 0 (0.0%) | 3 (0.2%) |
| 65 to 74 Years | 0 (0.0%) | 17 (7.0%) |
| 75 Years and over | 53 (24.8%) | 31 (13.5%) |
Disability Class: Cognitive Difficulty
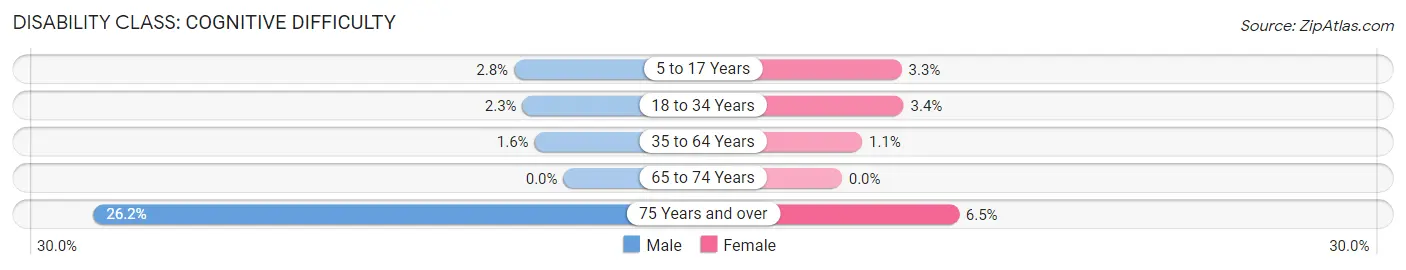
| Age Bracket | Male | Female |
| 5 to 17 Years | 26 (2.8%) | 28 (3.3%) |
| 18 to 34 Years | 21 (2.3%) | 33 (3.4%) |
| 35 to 64 Years | 31 (1.6%) | 20 (1.1%) |
| 65 to 74 Years | 0 (0.0%) | 0 (0.0%) |
| 75 Years and over | 56 (26.2%) | 15 (6.5%) |
Disability Class: Ambulatory Difficulty
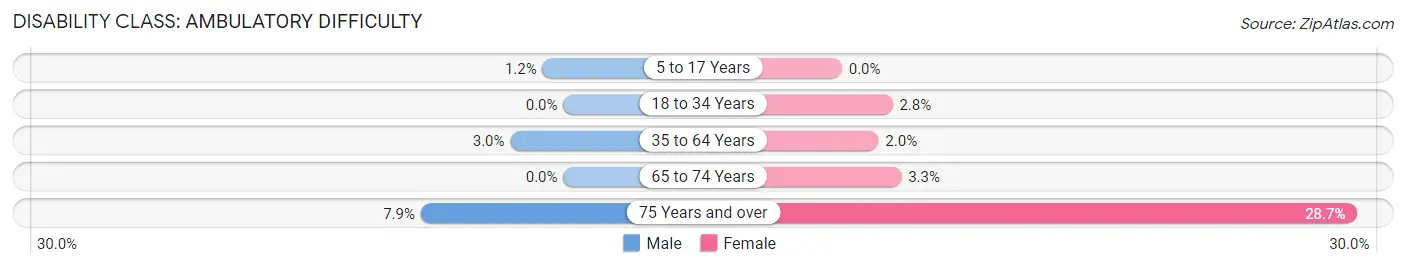
| Age Bracket | Male | Female |
| 5 to 17 Years | 11 (1.2%) | 0 (0.0%) |
| 18 to 34 Years | 0 (0.0%) | 27 (2.8%) |
| 35 to 64 Years | 57 (2.9%) | 36 (2.0%) |
| 65 to 74 Years | 0 (0.0%) | 8 (3.3%) |
| 75 Years and over | 17 (7.9%) | 66 (28.7%) |
Disability Class: Self-Care Difficulty
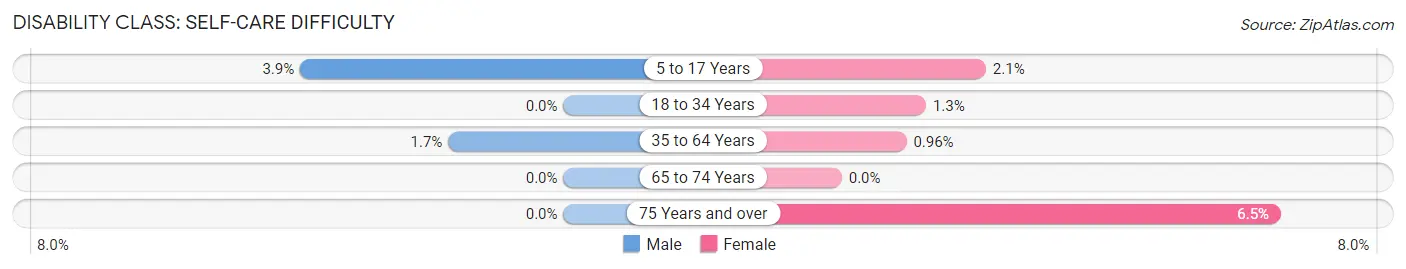
| Age Bracket | Male | Female |
| 5 to 17 Years | 37 (3.9%) | 18 (2.1%) |
| 18 to 34 Years | 0 (0.0%) | 12 (1.3%) |
| 35 to 64 Years | 33 (1.7%) | 17 (1.0%) |
| 65 to 74 Years | 0 (0.0%) | 0 (0.0%) |
| 75 Years and over | 0 (0.0%) | 15 (6.5%) |
Technology Access in Purcellville
Computing Device Access in Purcellville
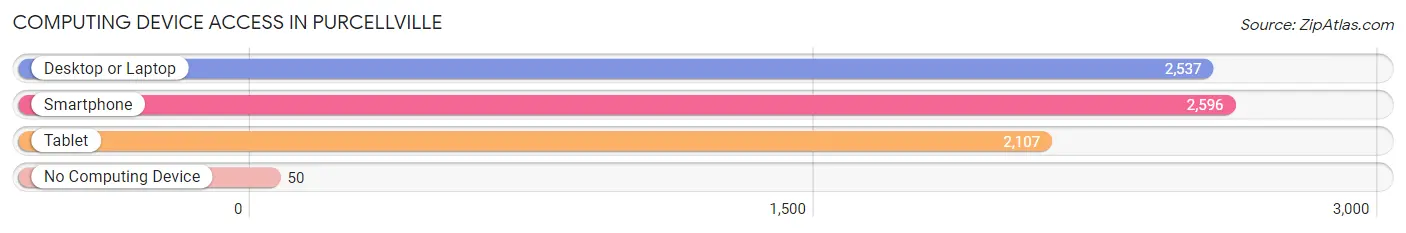
| Device Type | # Households | % Households |
| Desktop or Laptop | 2,537 | 92.8% |
| Smartphone | 2,596 | 95.0% |
| Tablet | 2,107 | 77.1% |
| No Computing Device | 50 | 1.8% |
| Total | 2,734 | 100.0% |
Internet Access in Purcellville
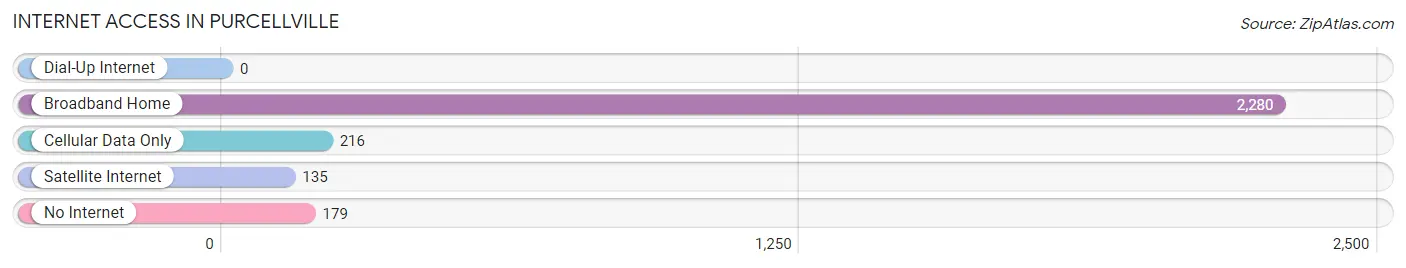
| Internet Type | # Households | % Households |
| Dial-Up Internet | 0 | 0.0% |
| Broadband Home | 2,280 | 83.4% |
| Cellular Data Only | 216 | 7.9% |
| Satellite Internet | 135 | 4.9% |
| No Internet | 179 | 6.6% |
| Total | 2,734 | 100.0% |
Purcellville Summary
Purcellville, Virginia is a small town located in the northern part of Loudoun County, Virginia. It is situated in the foothills of the Blue Ridge Mountains, approximately 40 miles west of Washington, D.C. The town is known for its rural charm and historic buildings, and is home to a variety of businesses, restaurants, and shops.
History
Purcellville was founded in 1853 by Joseph Purcell, a local farmer and businessman. The town was named after him and was incorporated in 1892. The town was originally a small agricultural community, but it grew rapidly in the late 19th and early 20th centuries. The town was home to several mills, including a flour mill, a sawmill, and a gristmill. The town also had a railroad station, which connected it to the rest of the county.
In the early 20th century, Purcellville began to attract more visitors, as it was a popular destination for weekend trips and summer vacations. The town was also home to a number of resorts, including the Purcellville Hotel and the Purcellville Inn.
Geography
Purcellville is located in the northern part of Loudoun County, Virginia. It is situated in the foothills of the Blue Ridge Mountains, approximately 40 miles west of Washington, D.C. The town is bordered by the towns of Hamilton, Round Hill, and Waterford. The town is located on the banks of the Catoctin Creek, which flows through the town and into the Potomac River.
The town has a total area of 2.2 square miles, all of which is land. The town has a humid subtropical climate, with hot, humid summers and cold, wet winters.
Economy
Purcellville is a small town with a population of approximately 7,000 people. The town is home to a variety of businesses, including restaurants, shops, and professional services. The town is also home to a number of wineries, breweries, and distilleries.
The town is home to several large employers, including the Purcellville Medical Center, the Purcellville Public Library, and the Purcellville Fire Department. The town is also home to a number of small businesses, including restaurants, shops, and professional services.
Demographics
As of the 2010 census, Purcellville had a population of 7,727 people. The racial makeup of the town was 87.3% White, 5.3% African American, 0.3% Native American, 2.2% Asian, 0.1% Pacific Islander, 2.2% from other races, and 2.6% from two or more races. Hispanic or Latino of any race were 6.2% of the population.
The median income for a household in the town was $76,945, and the median income for a family was $90,945. The per capita income for the town was $35,945. About 4.3% of families and 5.7% of the population were below the poverty line, including 6.3% of those under age 18 and 4.2% of those age 65 or over.
Common Questions
What is Per Capita Income in Purcellville?
Per Capita income in Purcellville is $56,856.
What is the Median Family Income in Purcellville?
Median Family Income in Purcellville is $166,508.
What is the Median Household income in Purcellville?
Median Household Income in Purcellville is $150,333.
What is Income or Wage Gap in Purcellville?
Income or Wage Gap in Purcellville is 43.6%.
Women in Purcellville earn 56.4 cents for every dollar earned by a man.
What is Inequality or Gini Index in Purcellville?
Inequality or Gini Index in Purcellville is 0.35.
What is the Total Population of Purcellville?
Total Population of Purcellville is 8,928.
What is the Total Male Population of Purcellville?
Total Male Population of Purcellville is 4,446.
What is the Total Female Population of Purcellville?
Total Female Population of Purcellville is 4,482.
What is the Ratio of Males per 100 Females in Purcellville?
There are 99.20 Males per 100 Females in Purcellville.
What is the Ratio of Females per 100 Males in Purcellville?
There are 100.81 Females per 100 Males in Purcellville.
What is the Median Population Age in Purcellville?
Median Population Age in Purcellville is 35.5 Years.
What is the Average Family Size in Purcellville
Average Family Size in Purcellville is 3.3 People.
What is the Average Household Size in Purcellville
Average Household Size in Purcellville is 3.2 People.
How Large is the Labor Force in Purcellville?
There are 4,923 People in the Labor Forcein in Purcellville.
What is the Percentage of People in the Labor Force in Purcellville?
72.8% of People are in the Labor Force in Purcellville.
What is the Unemployment Rate in Purcellville?
Unemployment Rate in Purcellville is 2.0%.