Merrimac, VA Map & Demographics
Merrimac Map
Merrimac Overview
$37,769
PER CAPITA INCOME
$54,904
AVG FAMILY INCOME
$52,612
AVG HOUSEHOLD INCOME
24.1%
WAGE / INCOME GAP [ % ]
75.9¢/ $1
WAGE / INCOME GAP [ $ ]
0.44
INEQUALITY / GINI INDEX
2,719
TOTAL POPULATION
1,338
MALE POPULATION
1,381
FEMALE POPULATION
96.89
MALES / 100 FEMALES
103.21
FEMALES / 100 MALES
43.9
MEDIAN AGE
2.8
AVG FAMILY SIZE
1.8
AVG HOUSEHOLD SIZE
1,183
LABOR FORCE [ PEOPLE ]
47.8%
PERCENT IN LABOR FORCE
5.7%
UNEMPLOYMENT RATE
Income in Merrimac
Income Overview in Merrimac
Per Capita Income in Merrimac is $37,769, while median incomes of families and households are $54,904 and $52,612 respectively.
| Characteristic | Number | Measure |
| Per Capita Income | 2,719 | $37,769 |
| Median Family Income | 417 | $54,904 |
| Mean Family Income | 417 | $94,281 |
| Median Household Income | 1,461 | $52,612 |
| Mean Household Income | 1,461 | $70,100 |
| Income Deficit | 417 | $0 |
| Wage / Income Gap (%) | 2,719 | 24.09% |
| Wage / Income Gap ($) | 2,719 | 75.91¢ per $1 |
| Gini / Inequality Index | 2,719 | 0.44 |
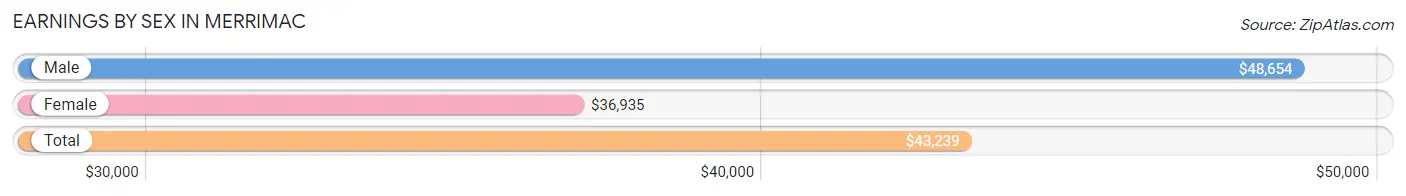
Earnings by Sex in Merrimac
Average Earnings in Merrimac are $43,239, $48,654 for men and $36,935 for women, a difference of 24.1%.
| Sex | Number | Average Earnings |
| Male | 708 (60.6%) | $48,654 |
| Female | 460 (39.4%) | $36,935 |
| Total | 1,168 (100.0%) | $43,239 |
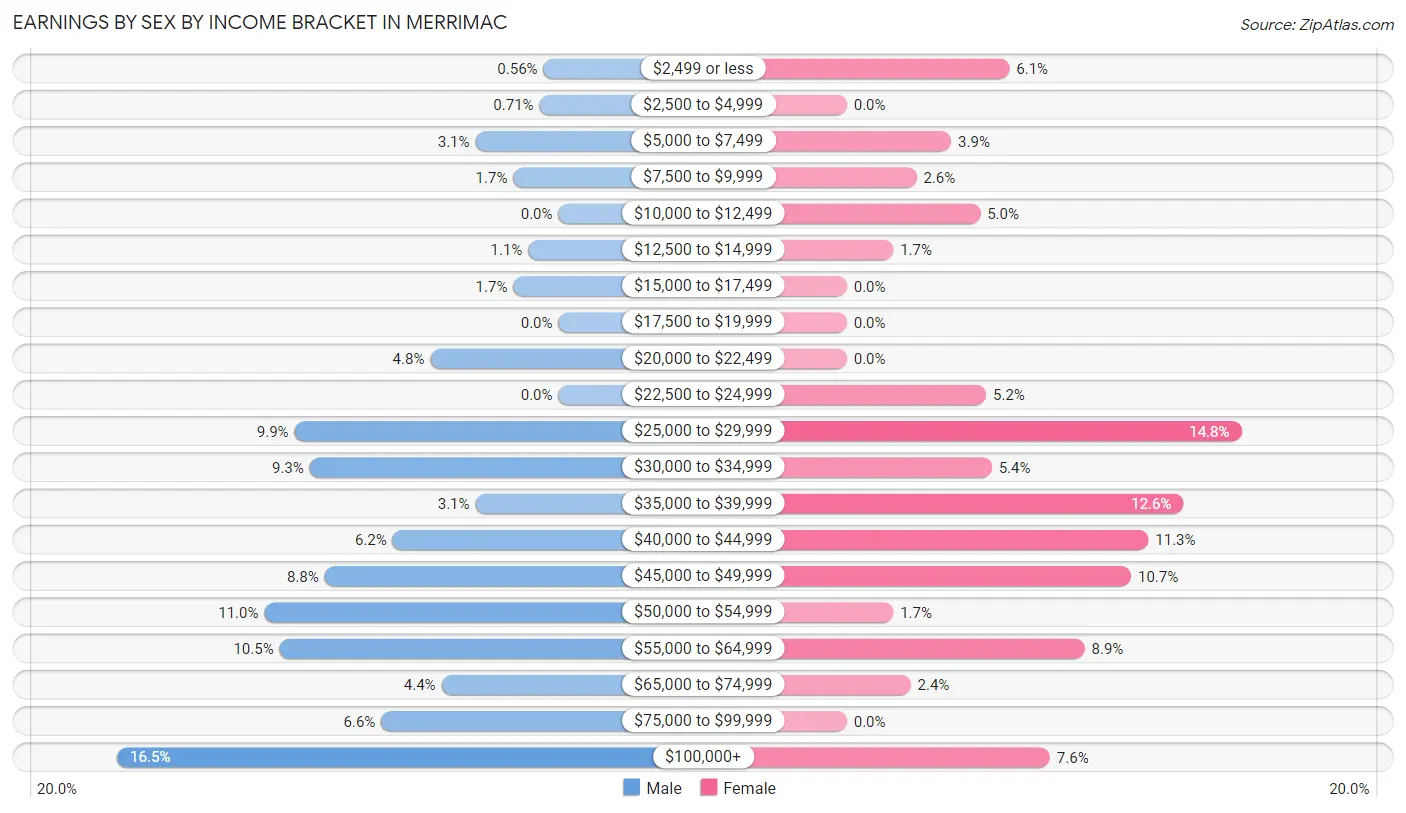
Earnings by Sex by Income Bracket in Merrimac
The most common earnings brackets in Merrimac are $100,000+ for men (117 | 16.5%) and $25,000 to $29,999 for women (68 | 14.8%).
| Income | Male | Female |
| $2,499 or less | 4 (0.6%) | 28 (6.1%) |
| $2,500 to $4,999 | 5 (0.7%) | 0 (0.0%) |
| $5,000 to $7,499 | 22 (3.1%) | 18 (3.9%) |
| $7,500 to $9,999 | 12 (1.7%) | 12 (2.6%) |
| $10,000 to $12,499 | 0 (0.0%) | 23 (5.0%) |
| $12,500 to $14,999 | 8 (1.1%) | 8 (1.7%) |
| $15,000 to $17,499 | 12 (1.7%) | 0 (0.0%) |
| $17,500 to $19,999 | 0 (0.0%) | 0 (0.0%) |
| $20,000 to $22,499 | 34 (4.8%) | 0 (0.0%) |
| $22,500 to $24,999 | 0 (0.0%) | 24 (5.2%) |
| $25,000 to $29,999 | 70 (9.9%) | 68 (14.8%) |
| $30,000 to $34,999 | 66 (9.3%) | 25 (5.4%) |
| $35,000 to $39,999 | 22 (3.1%) | 58 (12.6%) |
| $40,000 to $44,999 | 44 (6.2%) | 52 (11.3%) |
| $45,000 to $49,999 | 62 (8.8%) | 49 (10.6%) |
| $50,000 to $54,999 | 78 (11.0%) | 8 (1.7%) |
| $55,000 to $64,999 | 74 (10.4%) | 41 (8.9%) |
| $65,000 to $74,999 | 31 (4.4%) | 11 (2.4%) |
| $75,000 to $99,999 | 47 (6.6%) | 0 (0.0%) |
| $100,000+ | 117 (16.5%) | 35 (7.6%) |
| Total | 708 (100.0%) | 460 (100.0%) |
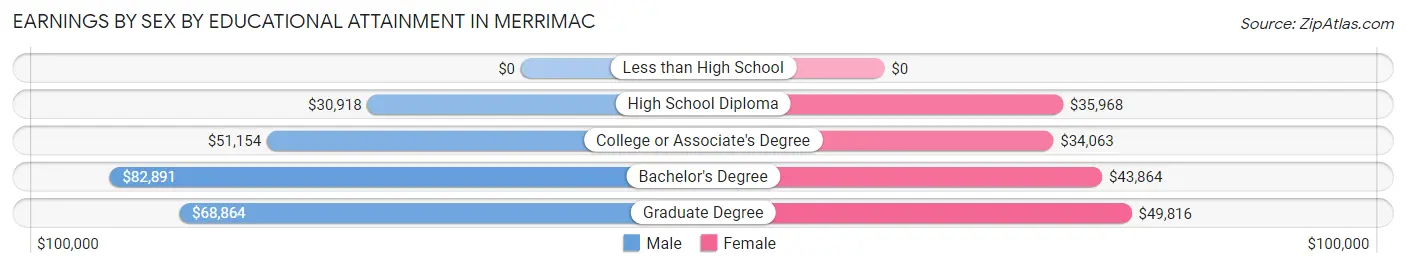
Earnings by Sex by Educational Attainment in Merrimac
Average earnings in Merrimac are $50,641 for men and $41,111 for women, a difference of 18.8%. Men with an educational attainment of bachelor's degree enjoy the highest average annual earnings of $82,891, while those with high school diploma education earn the least with $30,918. Women with an educational attainment of graduate degree earn the most with the average annual earnings of $49,816, while those with college or associate's degree education have the smallest earnings of $34,063.
| Educational Attainment | Male Income | Female Income |
| Less than High School | - | - |
| High School Diploma | $30,918 | $35,968 |
| College or Associate's Degree | $51,154 | $34,063 |
| Bachelor's Degree | $82,891 | $43,864 |
| Graduate Degree | $68,864 | $49,816 |
| Total | $50,641 | $41,111 |
Family Income in Merrimac
Family Income Brackets in Merrimac
According to the Merrimac family income data, there are 98 families falling into the $35,000 to $49,999 income range, which is the most common income bracket and makes up 23.5% of all families. Conversely, the less than $10,000 income bracket is the least frequent group with only 8 families (1.9%) belonging to this category.
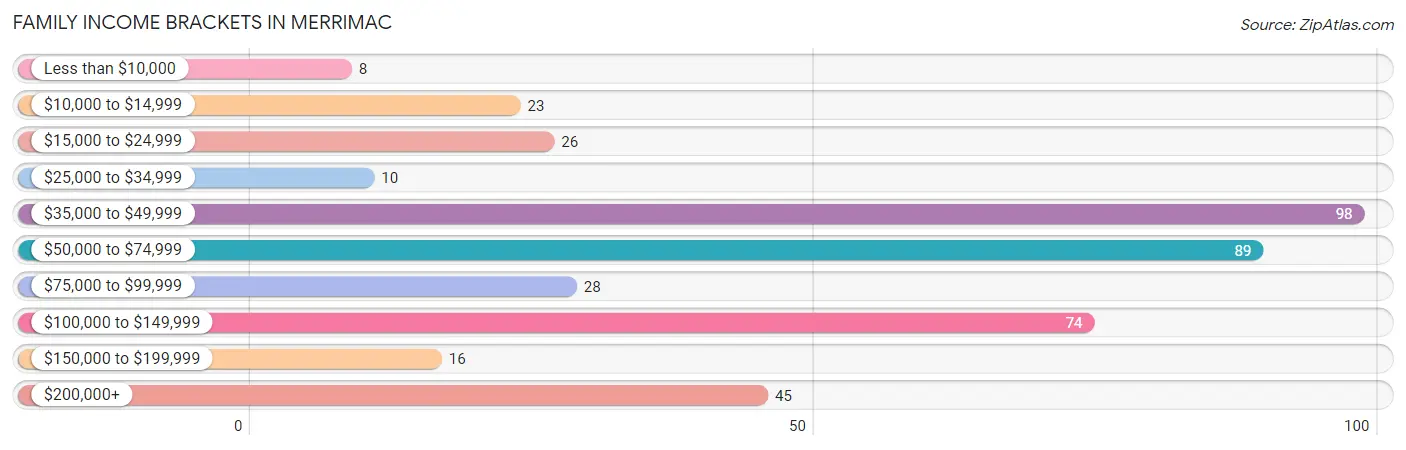
| Income Bracket | # Families | % Families |
| Less than $10,000 | 8 | 1.9% |
| $10,000 to $14,999 | 23 | 5.5% |
| $15,000 to $24,999 | 26 | 6.2% |
| $25,000 to $34,999 | 10 | 2.4% |
| $35,000 to $49,999 | 98 | 23.5% |
| $50,000 to $74,999 | 89 | 21.3% |
| $75,000 to $99,999 | 28 | 6.7% |
| $100,000 to $149,999 | 74 | 17.7% |
| $150,000 to $199,999 | 16 | 3.8% |
| $200,000+ | 45 | 10.8% |
Family Income by Famaliy Size in Merrimac
2-person families (244 | 58.5%) account for the highest median family income in Merrimac with $50,417 per family, while 2-person families (244 | 58.5%) have the highest median income of $25,208 per family member.
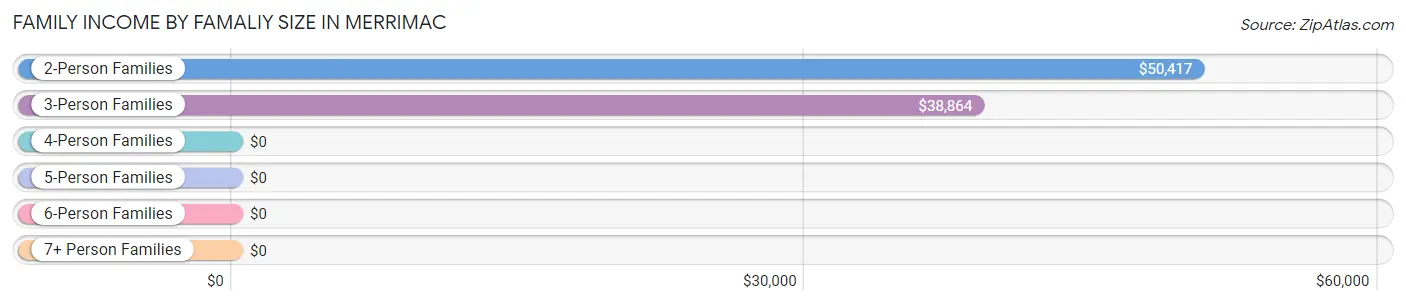
| Income Bracket | # Families | Median Income |
| 2-Person Families | 244 (58.5%) | $50,417 |
| 3-Person Families | 30 (7.2%) | $38,864 |
| 4-Person Families | 93 (22.3%) | $0 |
| 5-Person Families | 50 (12.0%) | $0 |
| 6-Person Families | 0 (0.0%) | $0 |
| 7+ Person Families | 0 (0.0%) | $0 |
| Total | 417 (100.0%) | $54,904 |
Family Income by Number of Earners in Merrimac
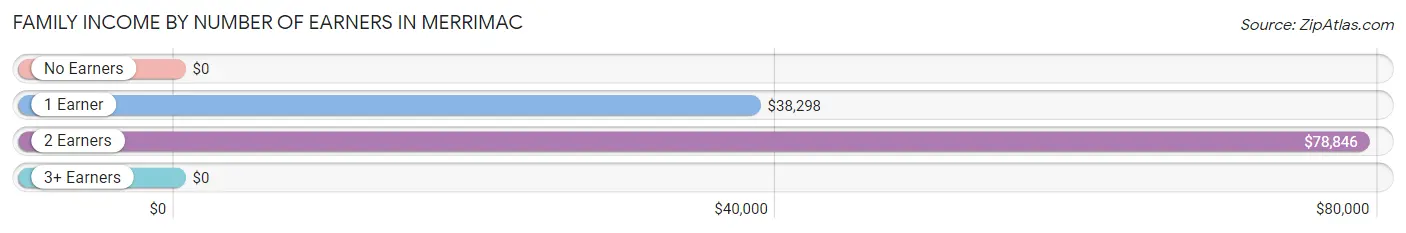
| Number of Earners | # Families | Median Income |
| No Earners | 125 (30.0%) | $0 |
| 1 Earner | 94 (22.5%) | $38,298 |
| 2 Earners | 150 (36.0%) | $78,846 |
| 3+ Earners | 48 (11.5%) | $0 |
| Total | 417 (100.0%) | $54,904 |
Household Income in Merrimac
Household Income Brackets in Merrimac
With 308 households falling in the category, the $100,000 to $149,999 income range is the most frequent in Merrimac, accounting for 21.1% of all households. In contrast, only 16 households (1.1%) fall into the $150,000 to $199,999 income bracket, making it the least populous group.
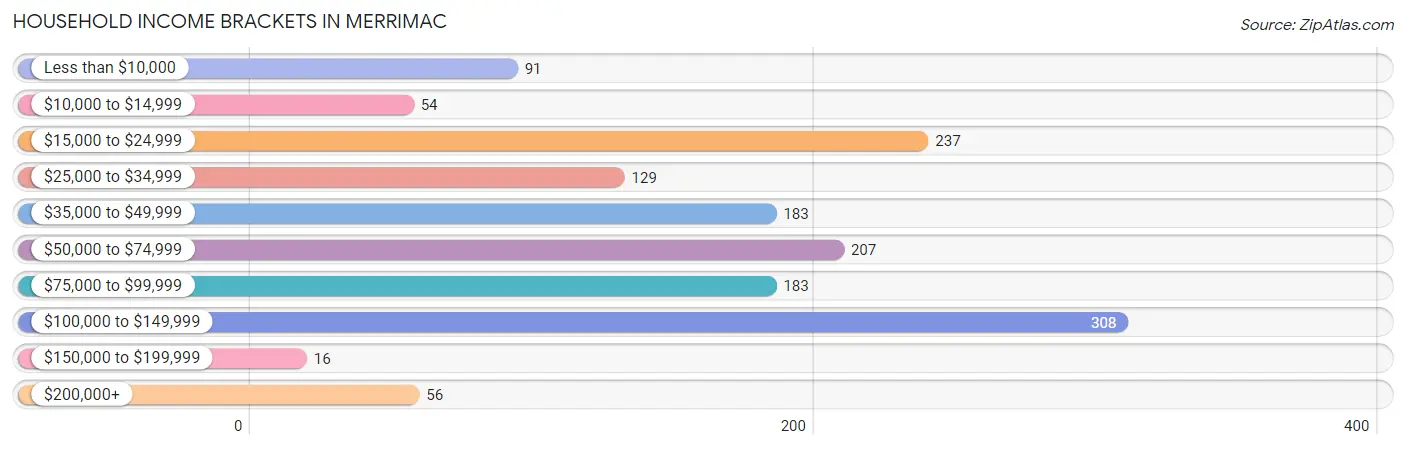
| Income Bracket | # Households | % Households |
| Less than $10,000 | 91 | 6.2% |
| $10,000 to $14,999 | 54 | 3.7% |
| $15,000 to $24,999 | 237 | 16.2% |
| $25,000 to $34,999 | 129 | 8.8% |
| $35,000 to $49,999 | 183 | 12.5% |
| $50,000 to $74,999 | 207 | 14.2% |
| $75,000 to $99,999 | 183 | 12.5% |
| $100,000 to $149,999 | 308 | 21.1% |
| $150,000 to $199,999 | 16 | 1.1% |
| $200,000+ | 56 | 3.8% |
Household Income by Householder Age in Merrimac
The median household income in Merrimac is $52,612, with the highest median household income of $77,500 found in the 25 to 44 years age bracket for the primary householder. A total of 634 households (43.4%) fall into this category. Meanwhile, the 45 to 64 years age bracket for the primary householder has the lowest median household income of $34,269, with 209 households (14.3%) in this group.
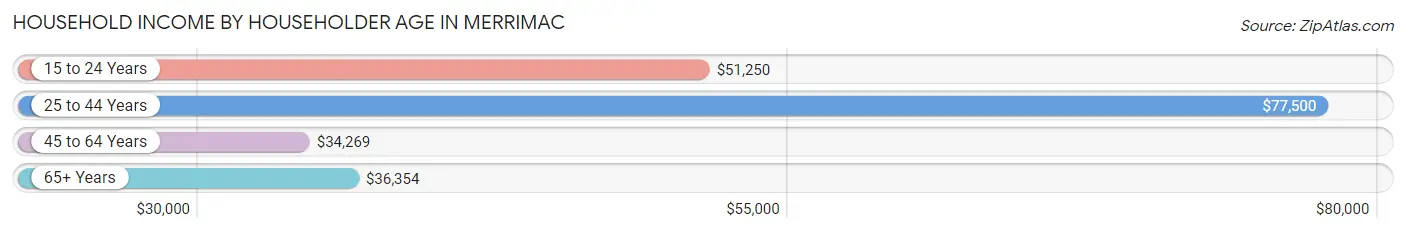
| Income Bracket | # Households | Median Income |
| 15 to 24 Years | 81 (5.5%) | $51,250 |
| 25 to 44 Years | 634 (43.4%) | $77,500 |
| 45 to 64 Years | 209 (14.3%) | $34,269 |
| 65+ Years | 537 (36.8%) | $36,354 |
| Total | 1,461 (100.0%) | $52,612 |
Poverty in Merrimac
Income Below Poverty by Sex and Age in Merrimac
With 12.6% poverty level for males and 14.8% for females among the residents of Merrimac, 16 and 17 year old males and 18 to 24 year old females are the most vulnerable to poverty, with 6 males (100.0%) and 55 females (47.4%) in their respective age groups living below the poverty level.
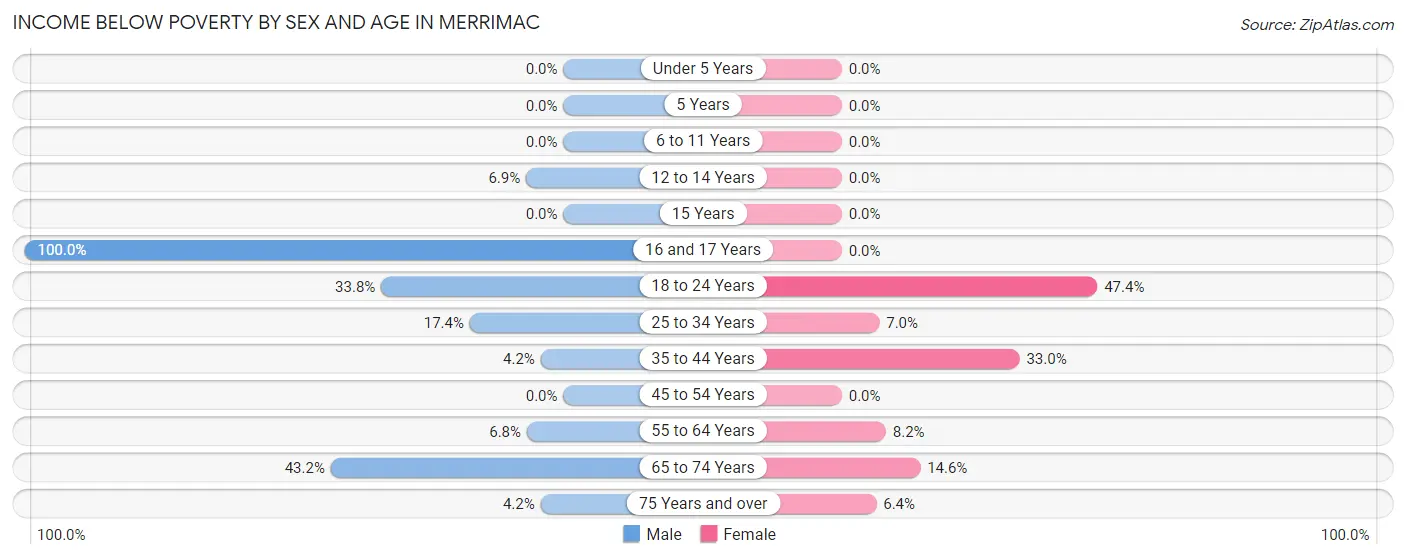
| Age Bracket | Male | Female |
| Under 5 Years | 0 (0.0%) | 0 (0.0%) |
| 5 Years | 0 (0.0%) | 0 (0.0%) |
| 6 to 11 Years | 0 (0.0%) | 0 (0.0%) |
| 12 to 14 Years | 7 (6.9%) | 0 (0.0%) |
| 15 Years | 0 (0.0%) | 0 (0.0%) |
| 16 and 17 Years | 6 (100.0%) | 0 (0.0%) |
| 18 to 24 Years | 46 (33.8%) | 55 (47.4%) |
| 25 to 34 Years | 63 (17.4%) | 11 (7.0%) |
| 35 to 44 Years | 8 (4.2%) | 63 (33.0%) |
| 45 to 54 Years | 0 (0.0%) | 0 (0.0%) |
| 55 to 64 Years | 9 (6.8%) | 9 (8.2%) |
| 65 to 74 Years | 19 (43.2%) | 32 (14.5%) |
| 75 Years and over | 8 (4.2%) | 16 (6.4%) |
| Total | 166 (12.6%) | 186 (14.8%) |
Income Above Poverty by Sex and Age in Merrimac
According to the poverty statistics in Merrimac, males aged under 5 years and females aged under 5 years are the age groups that are most secure financially, with 100.0% of males and 100.0% of females in these age groups living above the poverty line.
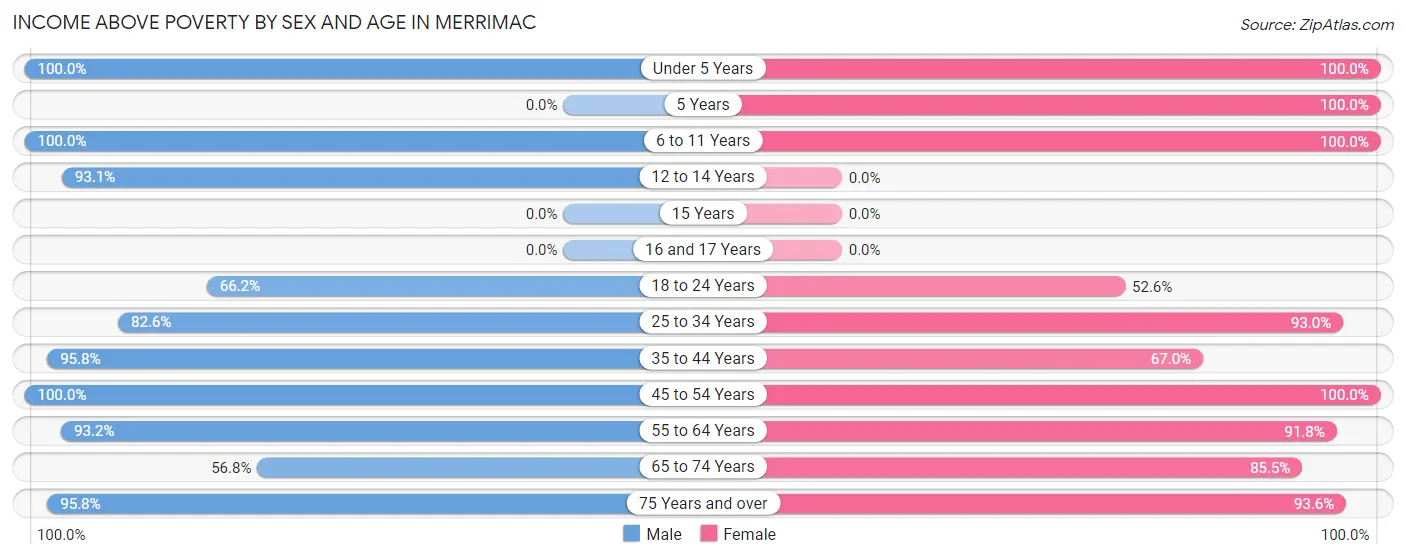
| Age Bracket | Male | Female |
| Under 5 Years | 35 (100.0%) | 33 (100.0%) |
| 5 Years | 0 (0.0%) | 31 (100.0%) |
| 6 to 11 Years | 23 (100.0%) | 21 (100.0%) |
| 12 to 14 Years | 94 (93.1%) | 0 (0.0%) |
| 15 Years | 0 (0.0%) | 0 (0.0%) |
| 16 and 17 Years | 0 (0.0%) | 0 (0.0%) |
| 18 to 24 Years | 90 (66.2%) | 61 (52.6%) |
| 25 to 34 Years | 300 (82.6%) | 147 (93.0%) |
| 35 to 44 Years | 182 (95.8%) | 128 (67.0%) |
| 45 to 54 Years | 93 (100.0%) | 126 (100.0%) |
| 55 to 64 Years | 124 (93.2%) | 101 (91.8%) |
| 65 to 74 Years | 25 (56.8%) | 188 (85.5%) |
| 75 Years and over | 181 (95.8%) | 234 (93.6%) |
| Total | 1,147 (87.4%) | 1,070 (85.2%) |
Income Below Poverty Among Married-Couple Families in Merrimac
The poverty statistics for married-couple families in Merrimac show that 3.4% or 8 of the total 238 families live below the poverty line. Families with no children have the highest poverty rate of 5.9%, comprising of 8 families. On the other hand, families with 1 or 2 children have the lowest poverty rate of 0.0%, which includes 0 families.
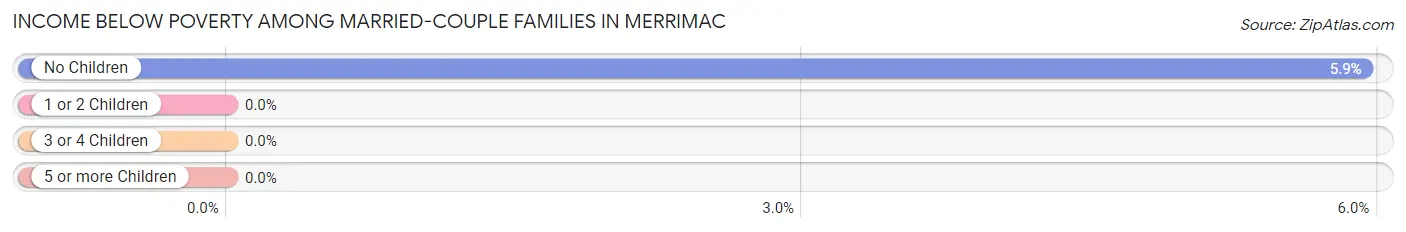
| Children | Above Poverty | Below Poverty |
| No Children | 127 (94.1%) | 8 (5.9%) |
| 1 or 2 Children | 92 (100.0%) | 0 (0.0%) |
| 3 or 4 Children | 11 (100.0%) | 0 (0.0%) |
| 5 or more Children | 0 (0.0%) | 0 (0.0%) |
| Total | 230 (96.6%) | 8 (3.4%) |
Income Below Poverty Among Single-Parent Households in Merrimac
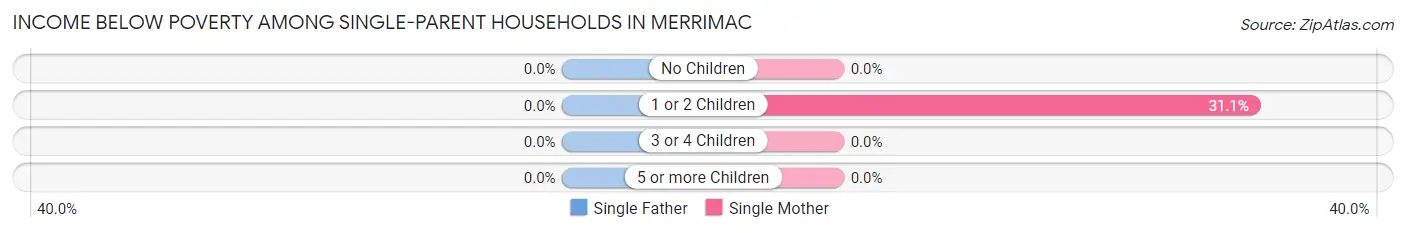
| Children | Single Father | Single Mother |
| No Children | 0 (0.0%) | 0 (0.0%) |
| 1 or 2 Children | 0 (0.0%) | 32 (31.1%) |
| 3 or 4 Children | 0 (0.0%) | 0 (0.0%) |
| 5 or more Children | 0 (0.0%) | 0 (0.0%) |
| Total | 0 (0.0%) | 32 (24.6%) |
Income Below Poverty Among Married-Couple vs Single-Parent Households in Merrimac
The poverty data for Merrimac shows that 8 of the married-couple family households (3.4%) and 32 of the single-parent households (17.9%) are living below the poverty level. Within the married-couple family households, those with no children have the highest poverty rate, with 8 households (5.9%) falling below the poverty line. Among the single-parent households, those with 1 or 2 children have the highest poverty rate, with 32 household (31.1%) living below poverty.
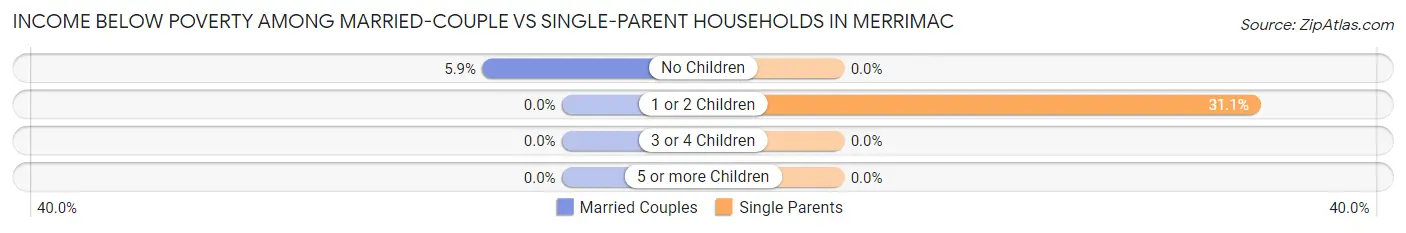
| Children | Married-Couple Families | Single-Parent Households |
| No Children | 8 (5.9%) | 0 (0.0%) |
| 1 or 2 Children | 0 (0.0%) | 32 (31.1%) |
| 3 or 4 Children | 0 (0.0%) | 0 (0.0%) |
| 5 or more Children | 0 (0.0%) | 0 (0.0%) |
| Total | 8 (3.4%) | 32 (17.9%) |
Race in Merrimac
The most populous races in Merrimac are White / Caucasian (2,067 | 76.0%), Hispanic or Latino (228 | 8.4%), and Two or more Races (187 | 6.9%).
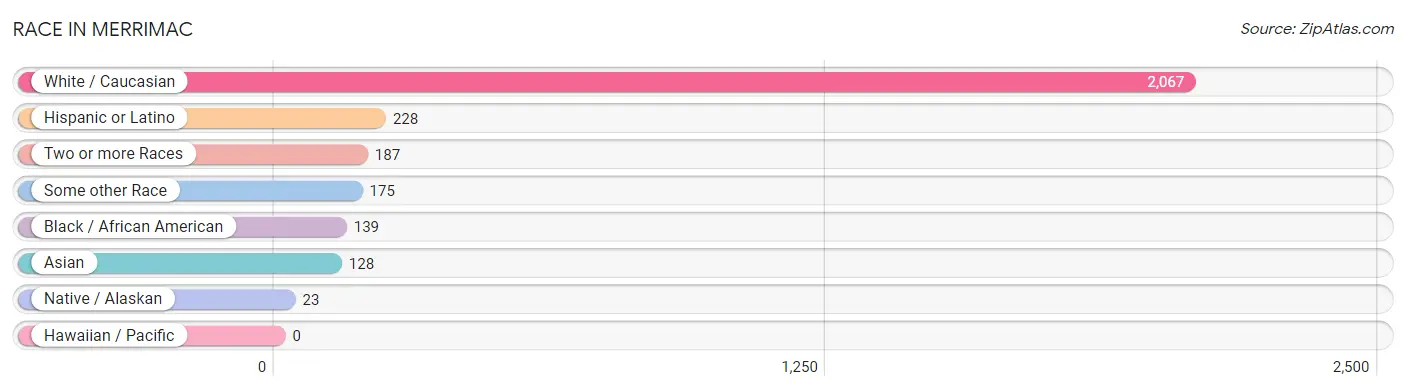
| Race | # Population | % Population |
| Asian | 128 | 4.7% |
| Black / African American | 139 | 5.1% |
| Hawaiian / Pacific | 0 | 0.0% |
| Hispanic or Latino | 228 | 8.4% |
| Native / Alaskan | 23 | 0.9% |
| White / Caucasian | 2,067 | 76.0% |
| Two or more Races | 187 | 6.9% |
| Some other Race | 175 | 6.4% |
| Total | 2,719 | 100.0% |
Ancestry in Merrimac
The most populous ancestries reported in Merrimac are American (291 | 10.7%), English (274 | 10.1%), German (247 | 9.1%), Mexican (166 | 6.1%), and Irish (108 | 4.0%), together accounting for 39.9% of all Merrimac residents.
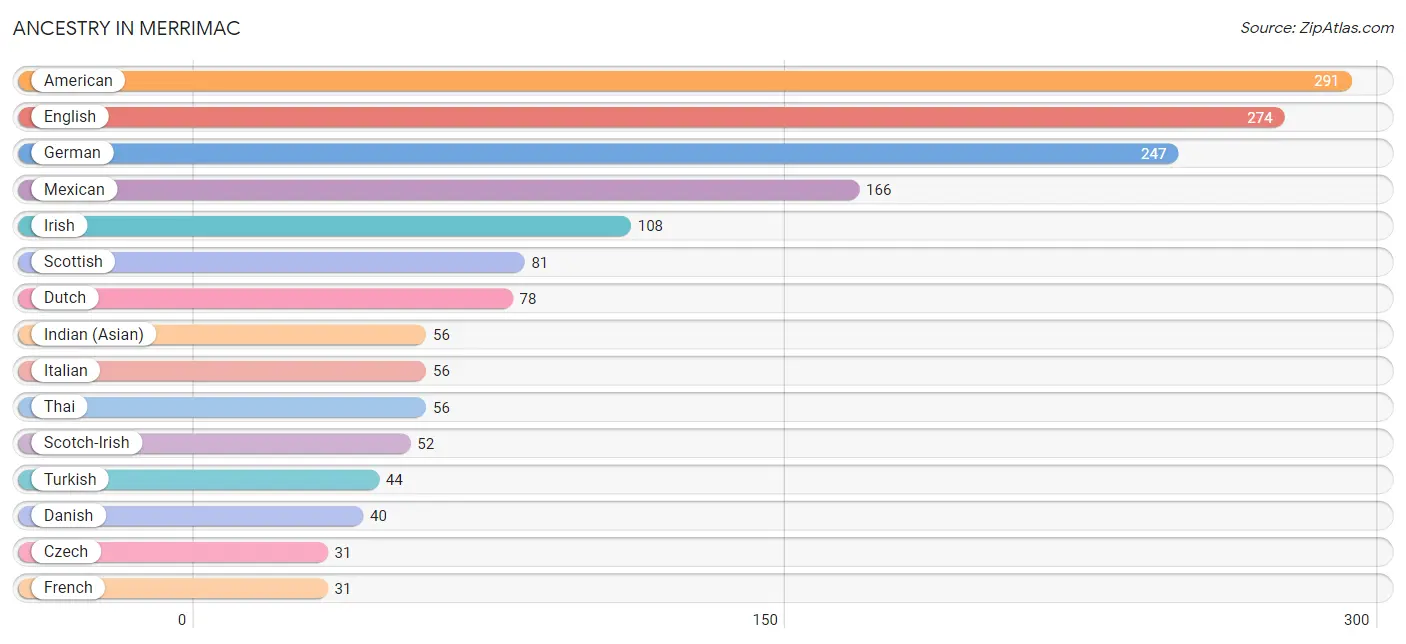
| Ancestry | # Population | % Population |
| American | 291 | 10.7% |
| Arab | 24 | 0.9% |
| Bhutanese | 16 | 0.6% |
| Blackfeet | 29 | 1.1% |
| Canadian | 5 | 0.2% |
| Central American | 22 | 0.8% |
| Czech | 31 | 1.1% |
| Czechoslovakian | 12 | 0.4% |
| Danish | 40 | 1.5% |
| Dutch | 78 | 2.9% |
| English | 274 | 10.1% |
| European | 26 | 1.0% |
| Finnish | 22 | 0.8% |
| French | 31 | 1.1% |
| German | 247 | 9.1% |
| Honduran | 5 | 0.2% |
| Indian (Asian) | 56 | 2.1% |
| Irish | 108 | 4.0% |
| Italian | 56 | 2.1% |
| Korean | 3 | 0.1% |
| Mexican | 166 | 6.1% |
| Norwegian | 16 | 0.6% |
| Polish | 9 | 0.3% |
| Puerto Rican | 19 | 0.7% |
| Russian | 8 | 0.3% |
| Salvadoran | 17 | 0.6% |
| Scotch-Irish | 52 | 1.9% |
| Scottish | 81 | 3.0% |
| Spaniard | 21 | 0.8% |
| Swedish | 8 | 0.3% |
| Thai | 56 | 2.1% |
| Turkish | 44 | 1.6% | View All 32 Rows |
Immigrants in Merrimac
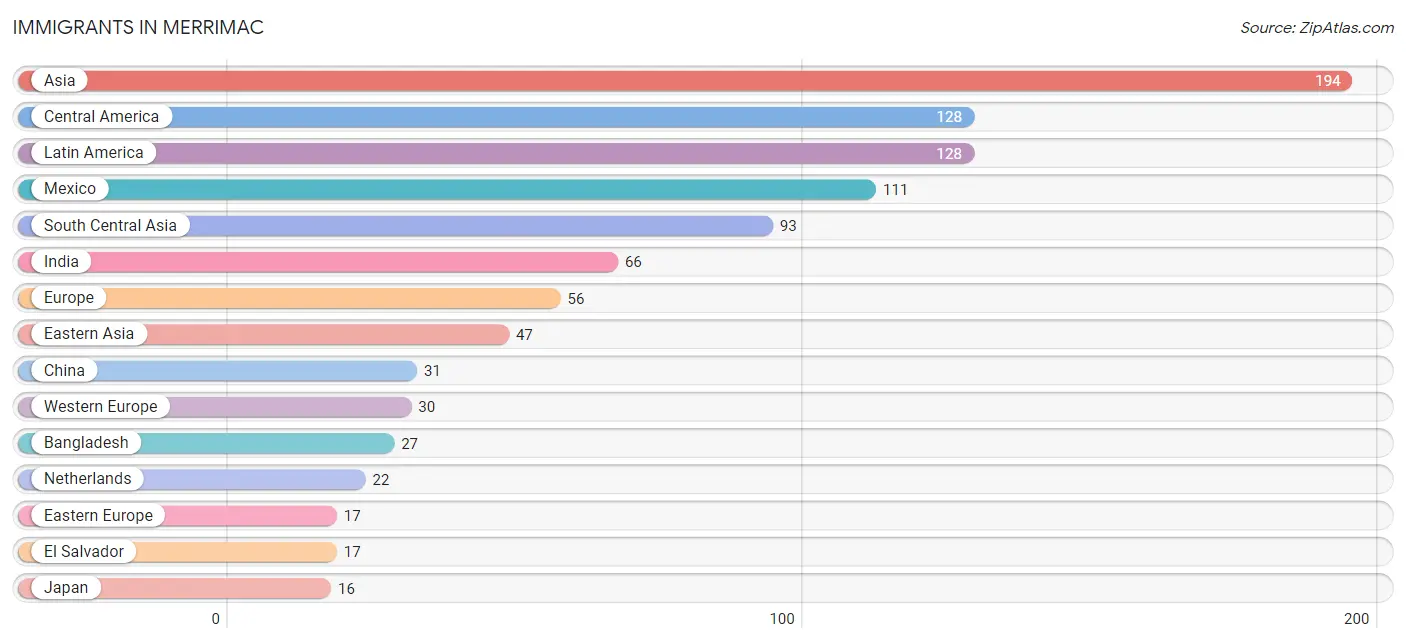
The most numerous immigrant groups reported in Merrimac came from Asia (194 | 7.1%), Central America (128 | 4.7%), Latin America (128 | 4.7%), Mexico (111 | 4.1%), and South Central Asia (93 | 3.4%), together accounting for 24.1% of all Merrimac residents.
| Immigration Origin | # Population | % Population |
| Asia | 194 | 7.1% |
| Bangladesh | 27 | 1.0% |
| Central America | 128 | 4.7% |
| China | 31 | 1.1% |
| Czechoslovakia | 9 | 0.3% |
| Eastern Asia | 47 | 1.7% |
| Eastern Europe | 17 | 0.6% |
| El Salvador | 17 | 0.6% |
| Europe | 56 | 2.1% |
| Germany | 8 | 0.3% |
| India | 66 | 2.4% |
| Japan | 16 | 0.6% |
| Kuwait | 5 | 0.2% |
| Latin America | 128 | 4.7% |
| Mexico | 111 | 4.1% |
| Netherlands | 22 | 0.8% |
| Northern Europe | 9 | 0.3% |
| Russia | 8 | 0.3% |
| South Central Asia | 93 | 3.4% |
| Western Asia | 5 | 0.2% |
| Western Europe | 30 | 1.1% | View All 21 Rows |
Sex and Age in Merrimac
Sex and Age in Merrimac
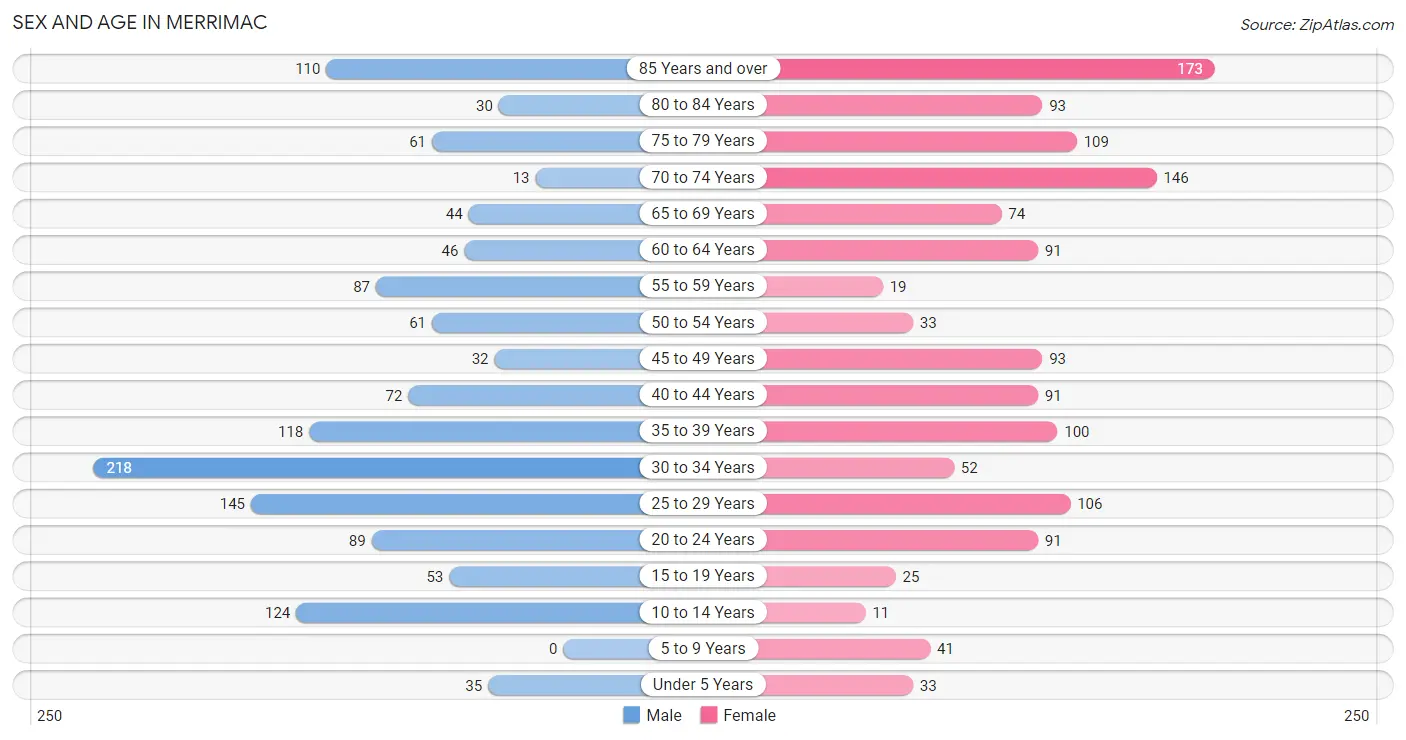
The most populous age groups in Merrimac are 30 to 34 Years (218 | 16.3%) for men and 85 Years and over (173 | 12.5%) for women.
| Age Bracket | Male | Female |
| Under 5 Years | 35 (2.6%) | 33 (2.4%) |
| 5 to 9 Years | 0 (0.0%) | 41 (3.0%) |
| 10 to 14 Years | 124 (9.3%) | 11 (0.8%) |
| 15 to 19 Years | 53 (4.0%) | 25 (1.8%) |
| 20 to 24 Years | 89 (6.7%) | 91 (6.6%) |
| 25 to 29 Years | 145 (10.8%) | 106 (7.7%) |
| 30 to 34 Years | 218 (16.3%) | 52 (3.8%) |
| 35 to 39 Years | 118 (8.8%) | 100 (7.2%) |
| 40 to 44 Years | 72 (5.4%) | 91 (6.6%) |
| 45 to 49 Years | 32 (2.4%) | 93 (6.7%) |
| 50 to 54 Years | 61 (4.6%) | 33 (2.4%) |
| 55 to 59 Years | 87 (6.5%) | 19 (1.4%) |
| 60 to 64 Years | 46 (3.4%) | 91 (6.6%) |
| 65 to 69 Years | 44 (3.3%) | 74 (5.4%) |
| 70 to 74 Years | 13 (1.0%) | 146 (10.6%) |
| 75 to 79 Years | 61 (4.6%) | 109 (7.9%) |
| 80 to 84 Years | 30 (2.2%) | 93 (6.7%) |
| 85 Years and over | 110 (8.2%) | 173 (12.5%) |
| Total | 1,338 (100.0%) | 1,381 (100.0%) |
Families and Households in Merrimac
Median Family Size in Merrimac
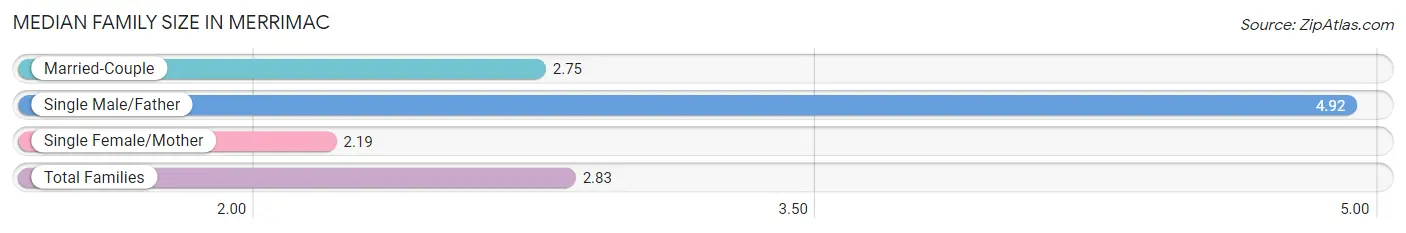
The median family size in Merrimac is 2.83 persons per family, with single male/father families (49 | 11.7%) accounting for the largest median family size of 4.92 persons per family. On the other hand, single female/mother families (130 | 31.2%) represent the smallest median family size with 2.19 persons per family.
| Family Type | # Families | Family Size |
| Married-Couple | 238 (57.1%) | 2.75 |
| Single Male/Father | 49 (11.7%) | 4.92 |
| Single Female/Mother | 130 (31.2%) | 2.19 |
| Total Families | 417 (100.0%) | 2.83 |
Median Household Size in Merrimac
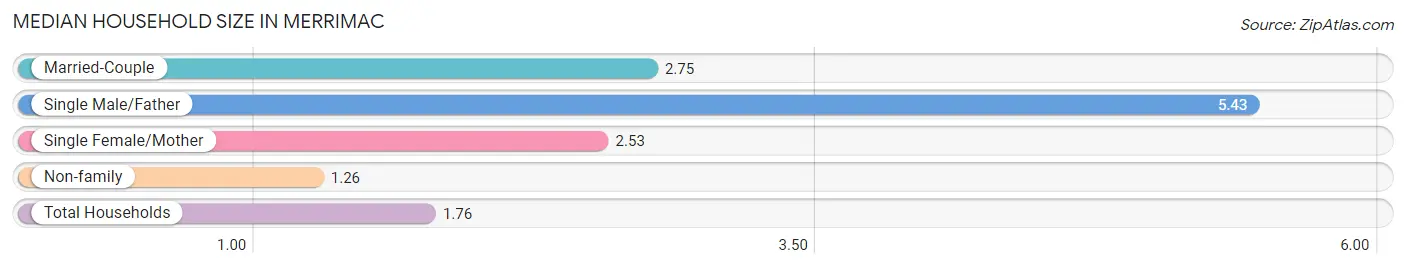
The median household size in Merrimac is 1.76 persons per household, with single male/father households (49 | 3.4%) accounting for the largest median household size of 5.43 persons per household. non-family households (1,044 | 71.5%) represent the smallest median household size with 1.26 persons per household.
| Household Type | # Households | Household Size |
| Married-Couple | 238 (16.3%) | 2.75 |
| Single Male/Father | 49 (3.4%) | 5.43 |
| Single Female/Mother | 130 (8.9%) | 2.53 |
| Non-family | 1,044 (71.5%) | 1.26 |
| Total Households | 1,461 (100.0%) | 1.76 |
Household Size by Marriage Status in Merrimac
Out of a total of 1,461 households in Merrimac, 417 (28.5%) are family households, while 1,044 (71.5%) are nonfamily households. The most numerous type of family households are 2-person households, comprising 221, and the most common type of nonfamily households are 1-person households, comprising 756.
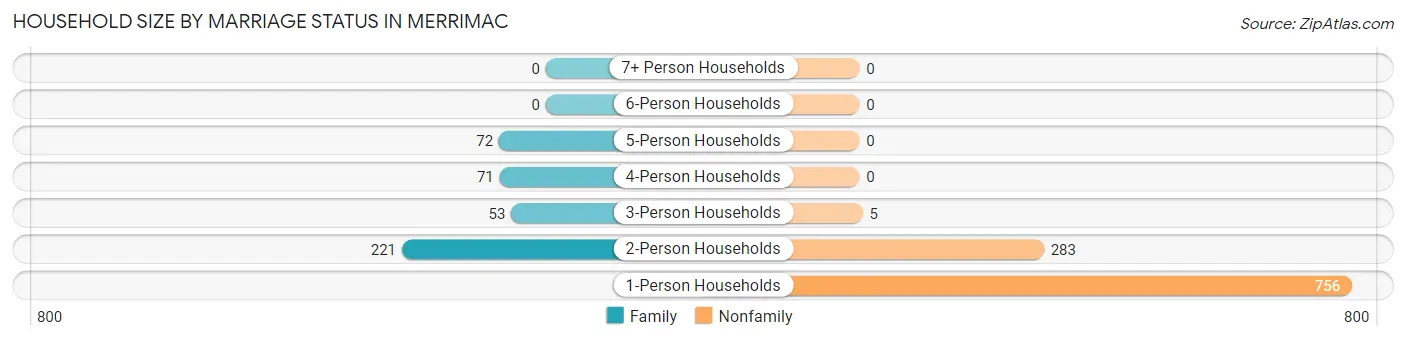
| Household Size | Family Households | Nonfamily Households |
| 1-Person Households | - | 756 (51.7%) |
| 2-Person Households | 221 (15.1%) | 283 (19.4%) |
| 3-Person Households | 53 (3.6%) | 5 (0.3%) |
| 4-Person Households | 71 (4.9%) | 0 (0.0%) |
| 5-Person Households | 72 (4.9%) | 0 (0.0%) |
| 6-Person Households | 0 (0.0%) | 0 (0.0%) |
| 7+ Person Households | 0 (0.0%) | 0 (0.0%) |
| Total | 417 (28.5%) | 1,044 (71.5%) |
Female Fertility in Merrimac
Fertility by Age in Merrimac
Average fertility rate in Merrimac is 42.0 births per 1,000 women. Women in the age bracket of 20 to 34 years have the highest fertility rate with 52.0 births per 1,000 women. Women in the age bracket of 20 to 34 years acount for 54.2% of all women with births.
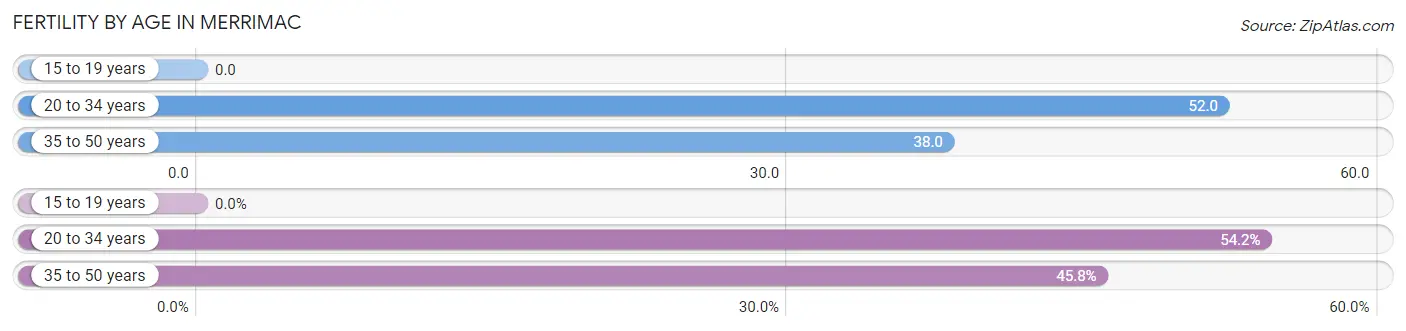
| Age Bracket | Women with Births | Births / 1,000 Women |
| 15 to 19 years | 0 (0.0%) | 0.0 |
| 20 to 34 years | 13 (54.2%) | 52.0 |
| 35 to 50 years | 11 (45.8%) | 38.0 |
| Total | 24 (100.0%) | 42.0 |
Fertility by Age by Marriage Status in Merrimac
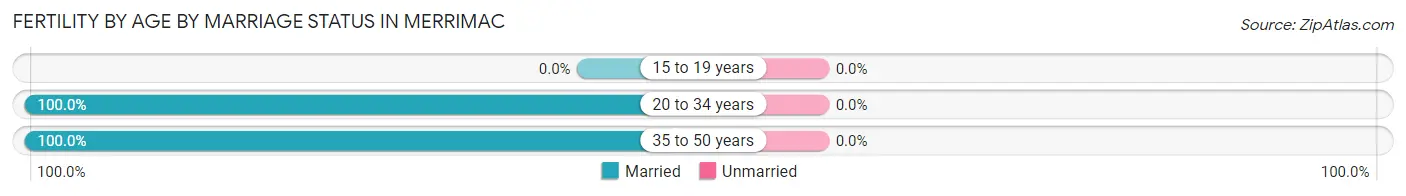
| Age Bracket | Married | Unmarried |
| 15 to 19 years | 0 (0.0%) | 0 (0.0%) |
| 20 to 34 years | 13 (100.0%) | 0 (0.0%) |
| 35 to 50 years | 11 (100.0%) | 0 (0.0%) |
| Total | 24 (100.0%) | 0 (0.0%) |
Fertility by Education in Merrimac
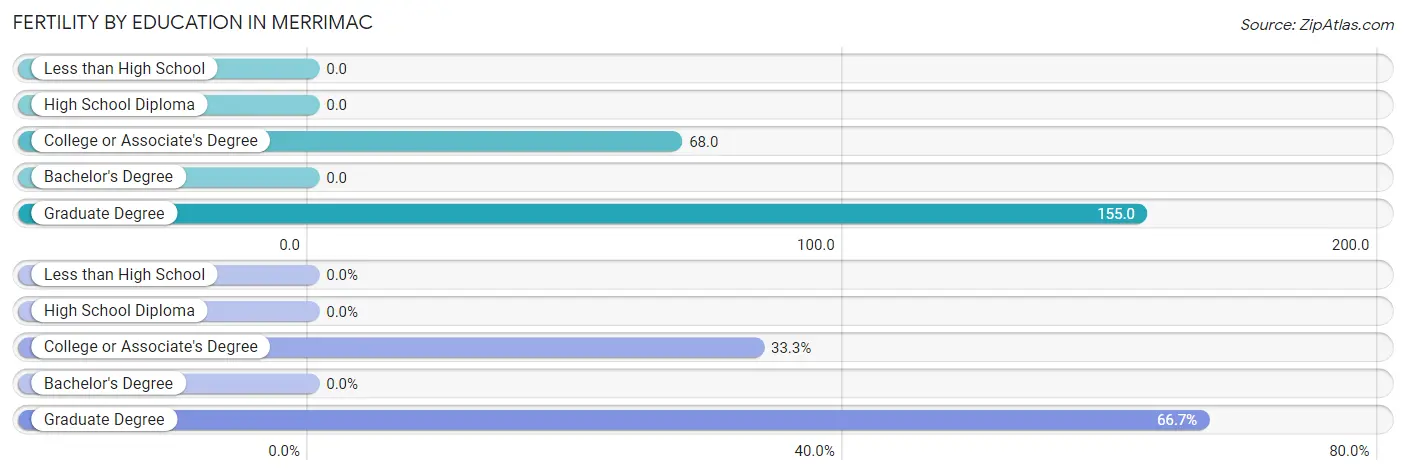
| Educational Attainment | Women with Births | Births / 1,000 Women |
| Less than High School | 0 (0.0%) | 0.0 |
| High School Diploma | 0 (0.0%) | 0.0 |
| College or Associate's Degree | 8 (33.3%) | 68.0 |
| Bachelor's Degree | 0 (0.0%) | 0.0 |
| Graduate Degree | 16 (66.7%) | 155.0 |
| Total | 24 (100.0%) | 42.0 |
Fertility by Education by Marriage Status in Merrimac
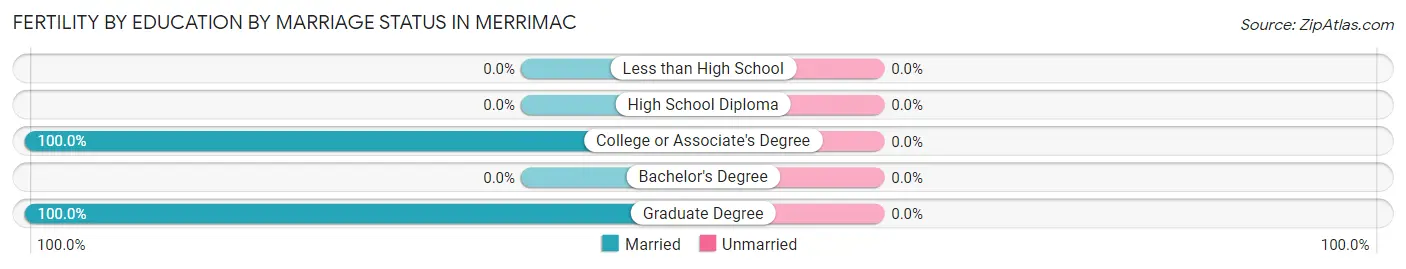
| Educational Attainment | Married | Unmarried |
| Less than High School | 0 (0.0%) | 0 (0.0%) |
| High School Diploma | 0 (0.0%) | 0 (0.0%) |
| College or Associate's Degree | 8 (100.0%) | 0 (0.0%) |
| Bachelor's Degree | 0 (0.0%) | 0 (0.0%) |
| Graduate Degree | 16 (100.0%) | 0 (0.0%) |
| Total | 24 (100.0%) | 0 (0.0%) |
Employment Characteristics in Merrimac
Employment by Class of Employer in Merrimac
Among the 1,107 employed individuals in Merrimac, private company employees (774 | 69.9%), state government employees (120 | 10.8%), and self-employed (not incorporated) (93 | 8.4%) make up the most common classes of employment.
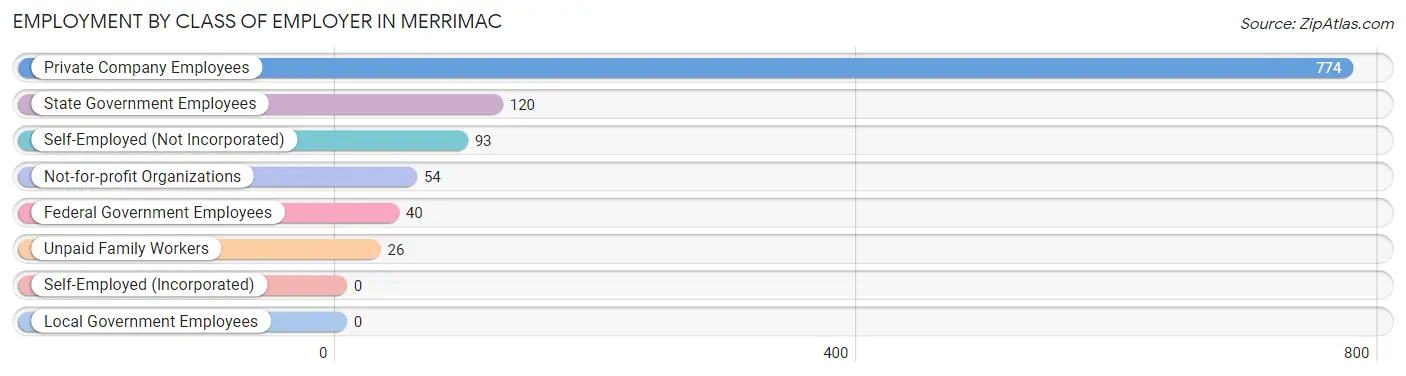
| Employer Class | # Employees | % Employees |
| Private Company Employees | 774 | 69.9% |
| Self-Employed (Incorporated) | 0 | 0.0% |
| Self-Employed (Not Incorporated) | 93 | 8.4% |
| Not-for-profit Organizations | 54 | 4.9% |
| Local Government Employees | 0 | 0.0% |
| State Government Employees | 120 | 10.8% |
| Federal Government Employees | 40 | 3.6% |
| Unpaid Family Workers | 26 | 2.4% |
| Total | 1,107 | 100.0% |
Employment Status by Age in Merrimac
According to the labor force statistics for Merrimac, out of the total population over 16 years of age (2,475), 47.8% or 1,183 individuals are in the labor force, with 5.7% or 67 of them unemployed. The age group with the highest labor force participation rate is 30 to 34 years, with 83.7% or 226 individuals in the labor force. Within the labor force, the 55 to 59 years age range has the highest percentage of unemployed individuals, with 76.6% or 59 of them being unemployed.
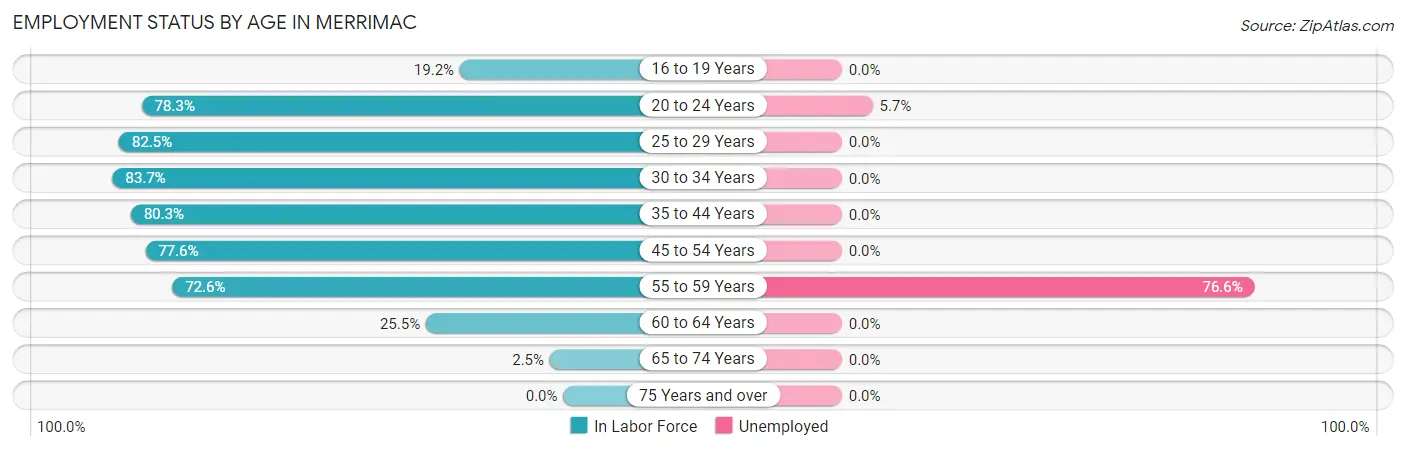
| Age Bracket | In Labor Force | Unemployed |
| 16 to 19 Years | 15 (19.2%) | 0 (0.0%) |
| 20 to 24 Years | 141 (78.3%) | 8 (5.7%) |
| 25 to 29 Years | 207 (82.5%) | 0 (0.0%) |
| 30 to 34 Years | 226 (83.7%) | 0 (0.0%) |
| 35 to 44 Years | 306 (80.3%) | 0 (0.0%) |
| 45 to 54 Years | 170 (77.6%) | 0 (0.0%) |
| 55 to 59 Years | 77 (72.6%) | 59 (76.6%) |
| 60 to 64 Years | 35 (25.5%) | 0 (0.0%) |
| 65 to 74 Years | 7 (2.5%) | 0 (0.0%) |
| 75 Years and over | 0 (0.0%) | 0 (0.0%) |
| Total | 1,183 (47.8%) | 67 (5.7%) |
Employment Status by Educational Attainment in Merrimac
According to labor force statistics for Merrimac, 74.9% of individuals (1,022) out of the total population between 25 and 64 years of age (1,364) are in the labor force, with 5.8% or 59 of them being unemployed. The group with the highest labor force participation rate are those with the educational attainment of bachelor's degree or higher, with 93.1% or 489 individuals in the labor force. Within the labor force, individuals with less than high school education have the highest percentage of unemployment, with 19.5% or 17 of them being unemployed.
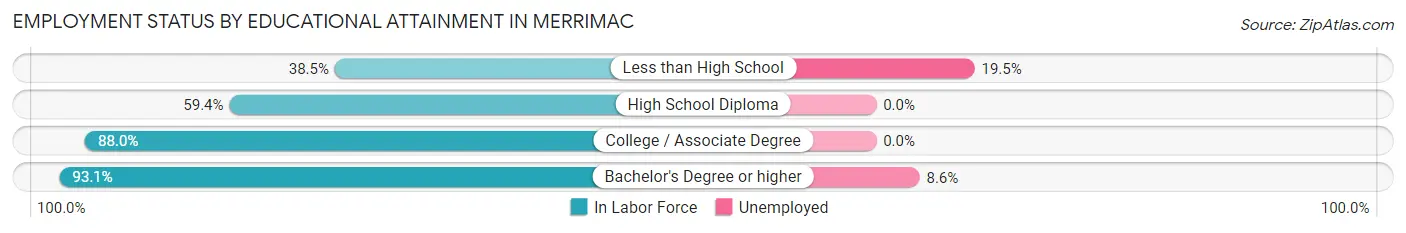
| Educational Attainment | In Labor Force | Unemployed |
| Less than High School | 87 (38.5%) | 44 (19.5%) |
| High School Diploma | 196 (59.4%) | 0 (0.0%) |
| College / Associate Degree | 249 (88.0%) | 0 (0.0%) |
| Bachelor's Degree or higher | 489 (93.1%) | 45 (8.6%) |
| Total | 1,022 (74.9%) | 79 (5.8%) |
Employment Occupations by Sex in Merrimac
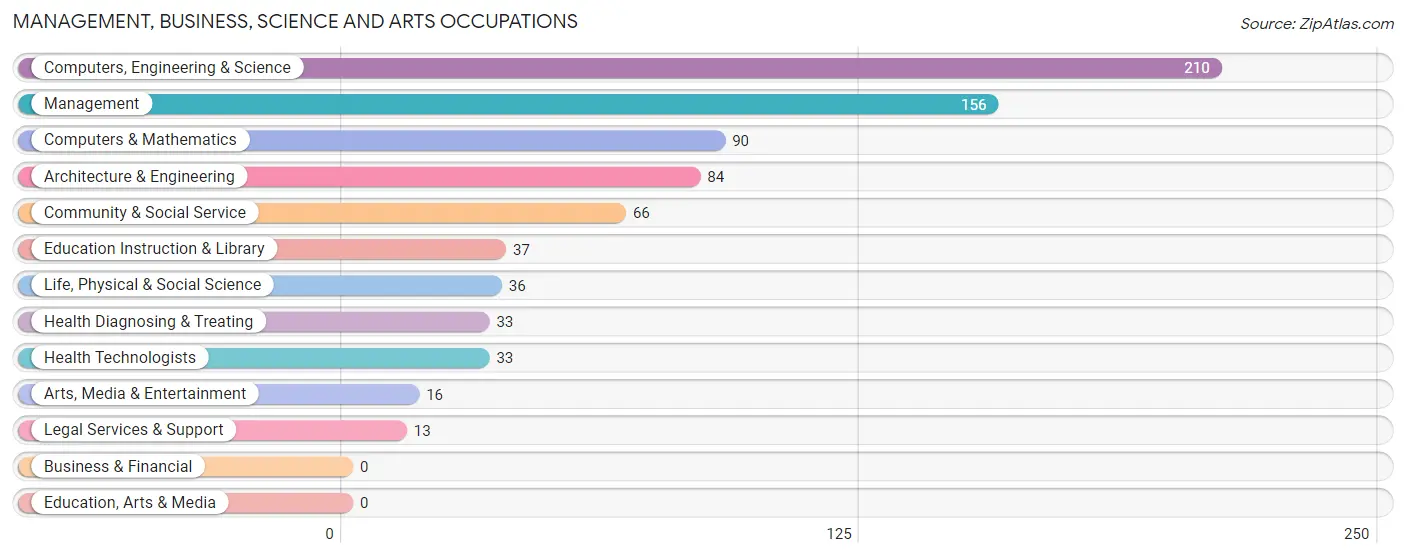
Management, Business, Science and Arts Occupations
The most common Management, Business, Science and Arts occupations in Merrimac are Computers, Engineering & Science (210 | 18.8%), Management (156 | 14.0%), Computers & Mathematics (90 | 8.1%), Architecture & Engineering (84 | 7.5%), and Community & Social Service (66 | 5.9%).
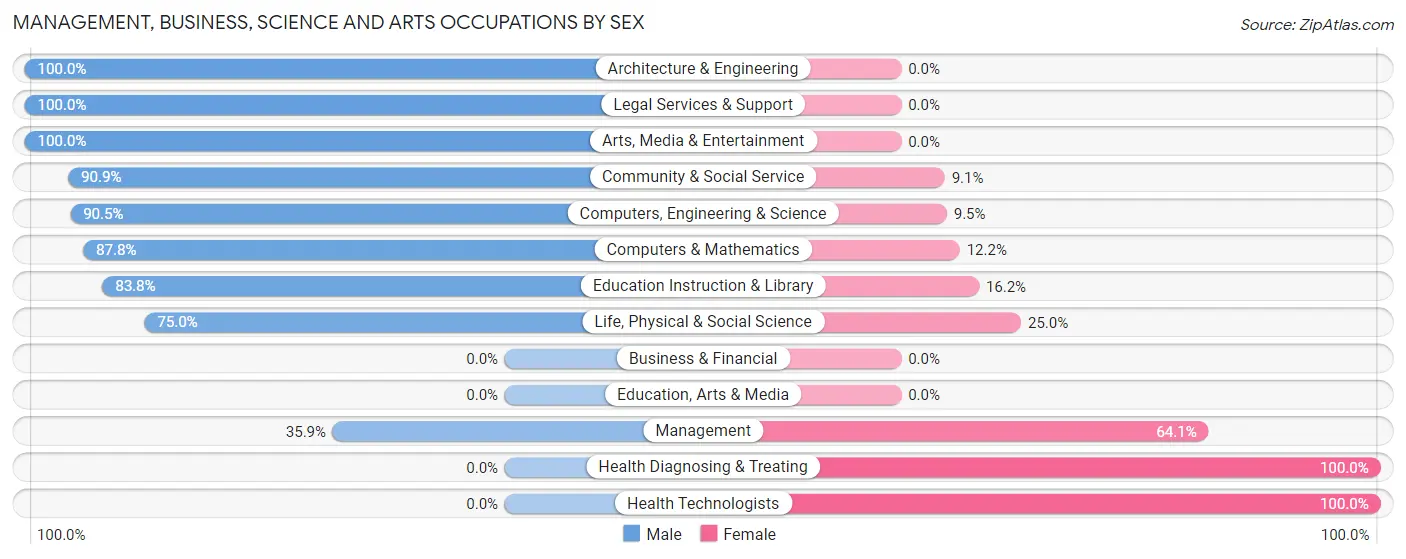
Management, Business, Science and Arts Occupations by Sex
Within the Management, Business, Science and Arts occupations in Merrimac, the most male-oriented occupations are Architecture & Engineering (100.0%), Legal Services & Support (100.0%), and Arts, Media & Entertainment (100.0%), while the most female-oriented occupations are Health Diagnosing & Treating (100.0%), Health Technologists (100.0%), and Management (64.1%).
| Occupation | Male | Female |
| Management | 56 (35.9%) | 100 (64.1%) |
| Business & Financial | 0 (0.0%) | 0 (0.0%) |
| Computers, Engineering & Science | 190 (90.5%) | 20 (9.5%) |
| Computers & Mathematics | 79 (87.8%) | 11 (12.2%) |
| Architecture & Engineering | 84 (100.0%) | 0 (0.0%) |
| Life, Physical & Social Science | 27 (75.0%) | 9 (25.0%) |
| Community & Social Service | 60 (90.9%) | 6 (9.1%) |
| Education, Arts & Media | 0 (0.0%) | 0 (0.0%) |
| Legal Services & Support | 13 (100.0%) | 0 (0.0%) |
| Education Instruction & Library | 31 (83.8%) | 6 (16.2%) |
| Arts, Media & Entertainment | 16 (100.0%) | 0 (0.0%) |
| Health Diagnosing & Treating | 0 (0.0%) | 33 (100.0%) |
| Health Technologists | 0 (0.0%) | 33 (100.0%) |
| Total (Category) | 306 (65.8%) | 159 (34.2%) |
| Total (Overall) | 678 (60.7%) | 439 (39.3%) |
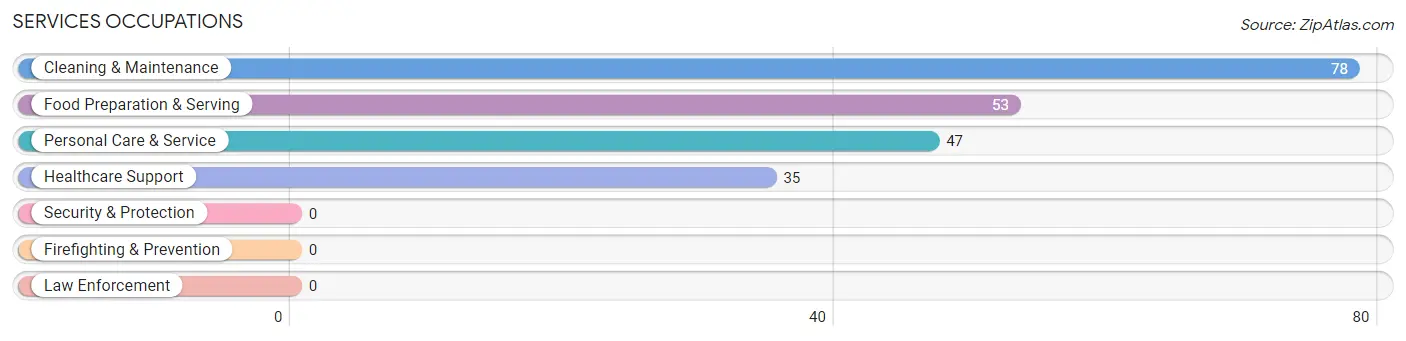
Services Occupations
The most common Services occupations in Merrimac are Cleaning & Maintenance (78 | 7.0%), Food Preparation & Serving (53 | 4.7%), Personal Care & Service (47 | 4.2%), and Healthcare Support (35 | 3.1%).
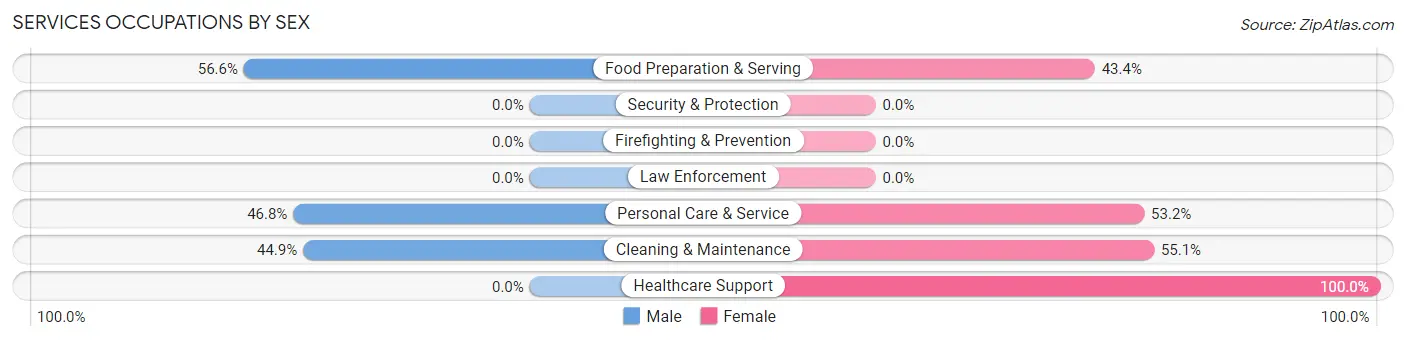
Services Occupations by Sex
Within the Services occupations in Merrimac, the most male-oriented occupations are Food Preparation & Serving (56.6%), Personal Care & Service (46.8%), and Cleaning & Maintenance (44.9%), while the most female-oriented occupations are Healthcare Support (100.0%), Cleaning & Maintenance (55.1%), and Personal Care & Service (53.2%).
| Occupation | Male | Female |
| Healthcare Support | 0 (0.0%) | 35 (100.0%) |
| Security & Protection | 0 (0.0%) | 0 (0.0%) |
| Firefighting & Prevention | 0 (0.0%) | 0 (0.0%) |
| Law Enforcement | 0 (0.0%) | 0 (0.0%) |
| Food Preparation & Serving | 30 (56.6%) | 23 (43.4%) |
| Cleaning & Maintenance | 35 (44.9%) | 43 (55.1%) |
| Personal Care & Service | 22 (46.8%) | 25 (53.2%) |
| Total (Category) | 87 (40.8%) | 126 (59.2%) |
| Total (Overall) | 678 (60.7%) | 439 (39.3%) |
Sales and Office Occupations
The most common Sales and Office occupations in Merrimac are Sales & Related (122 | 10.9%), and Office & Administration (51 | 4.6%).
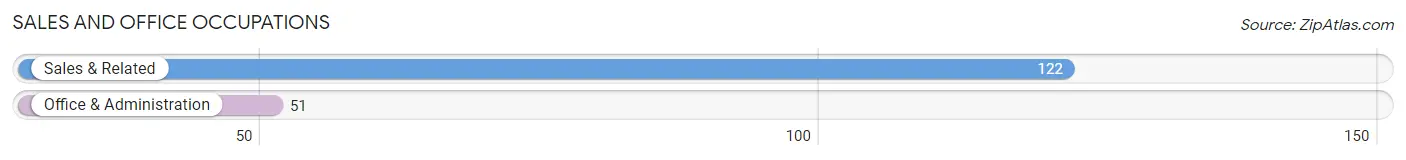
Sales and Office Occupations by Sex
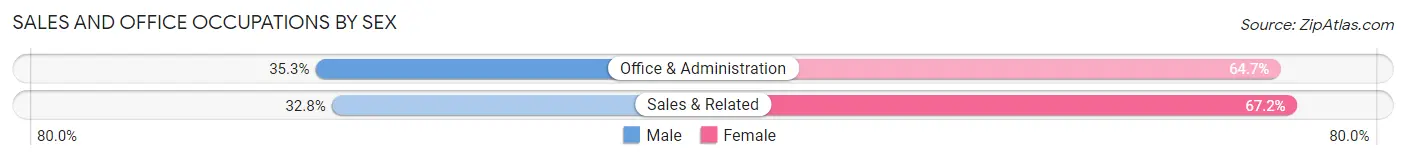
| Occupation | Male | Female |
| Sales & Related | 40 (32.8%) | 82 (67.2%) |
| Office & Administration | 18 (35.3%) | 33 (64.7%) |
| Total (Category) | 58 (33.5%) | 115 (66.5%) |
| Total (Overall) | 678 (60.7%) | 439 (39.3%) |
Natural Resources, Construction and Maintenance Occupations
The most common Natural Resources, Construction and Maintenance occupations in Merrimac are Construction & Extraction (134 | 12.0%), and Installation, Maintenance & Repair (18 | 1.6%).
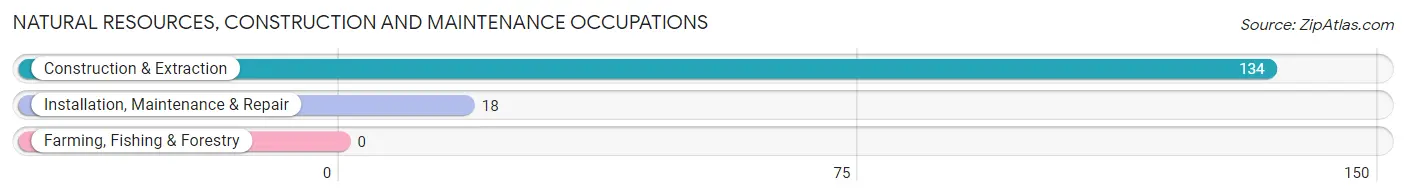
Natural Resources, Construction and Maintenance Occupations by Sex
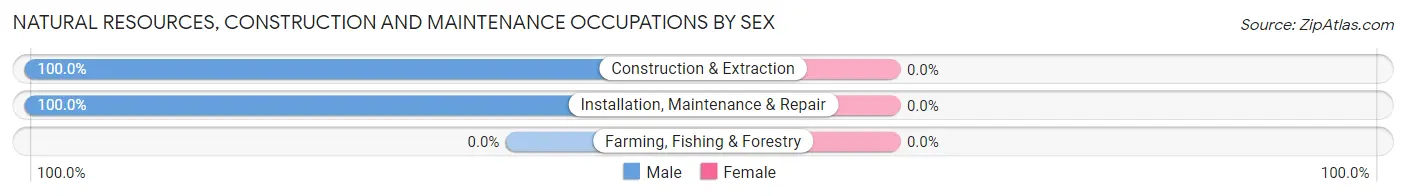
| Occupation | Male | Female |
| Farming, Fishing & Forestry | 0 (0.0%) | 0 (0.0%) |
| Construction & Extraction | 134 (100.0%) | 0 (0.0%) |
| Installation, Maintenance & Repair | 18 (100.0%) | 0 (0.0%) |
| Total (Category) | 152 (100.0%) | 0 (0.0%) |
| Total (Overall) | 678 (60.7%) | 439 (39.3%) |
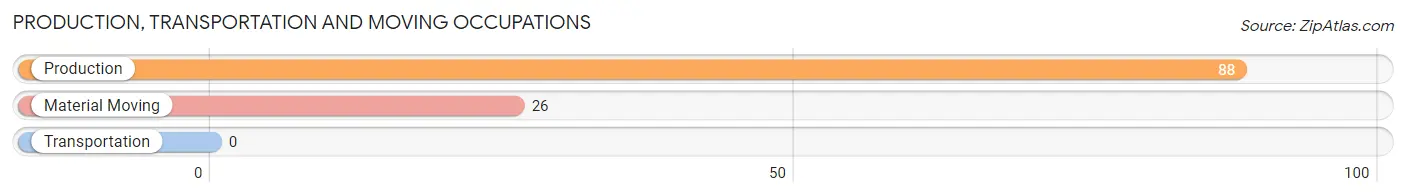
Production, Transportation and Moving Occupations
The most common Production, Transportation and Moving occupations in Merrimac are Production (88 | 7.9%), and Material Moving (26 | 2.3%).
Production, Transportation and Moving Occupations by Sex
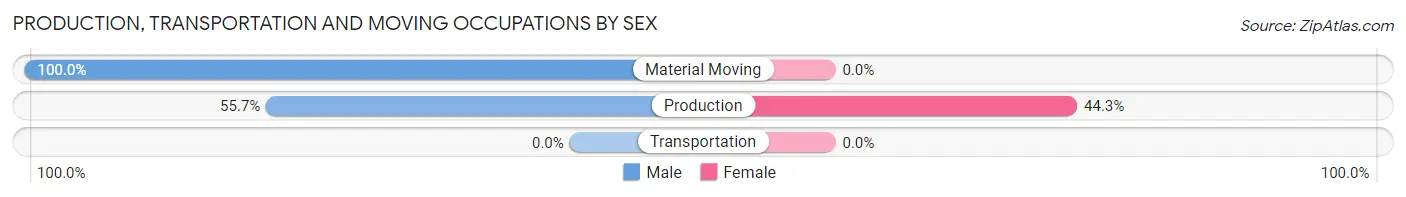
| Occupation | Male | Female |
| Production | 49 (55.7%) | 39 (44.3%) |
| Transportation | 0 (0.0%) | 0 (0.0%) |
| Material Moving | 26 (100.0%) | 0 (0.0%) |
| Total (Category) | 75 (65.8%) | 39 (34.2%) |
| Total (Overall) | 678 (60.7%) | 439 (39.3%) |
Employment Industries by Sex in Merrimac
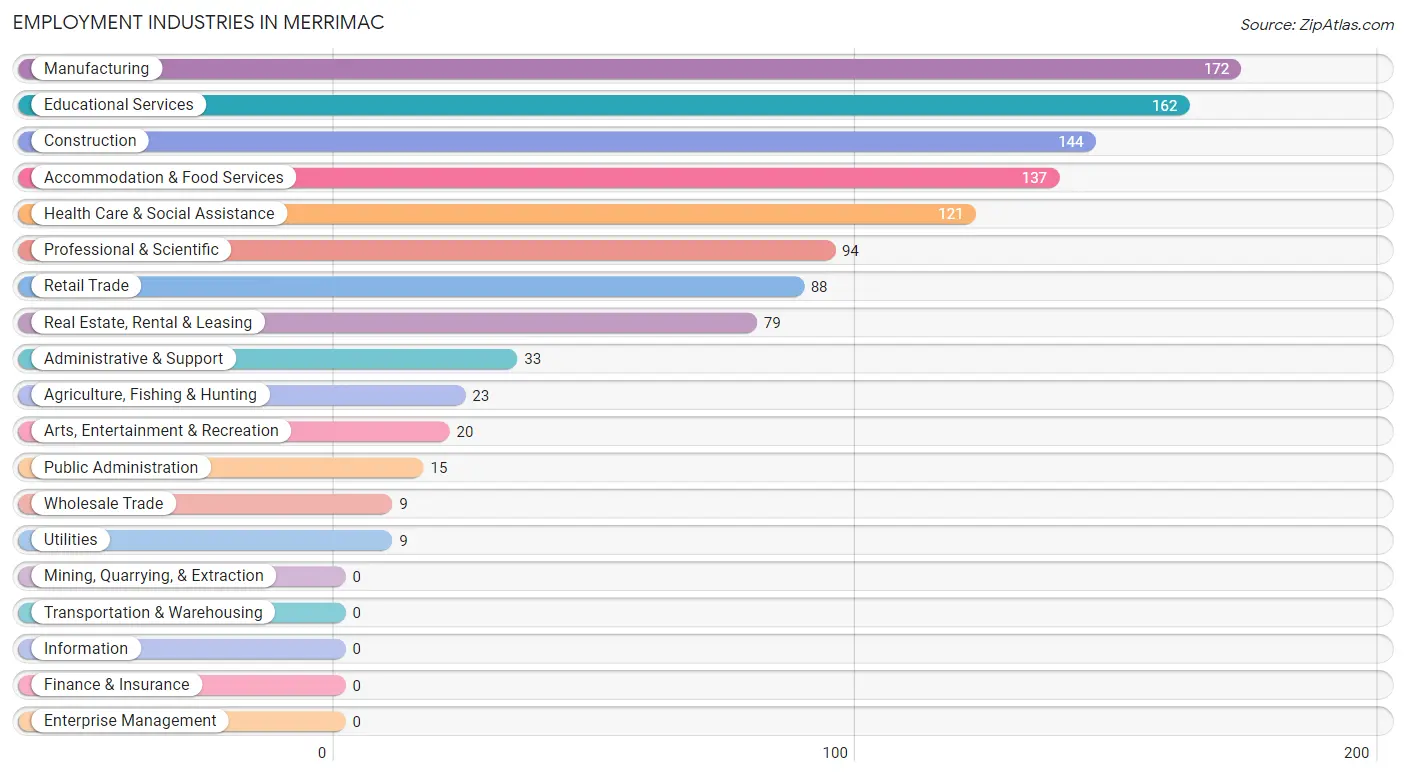
Employment Industries in Merrimac
The major employment industries in Merrimac include Manufacturing (172 | 15.4%), Educational Services (162 | 14.5%), Construction (144 | 12.9%), Accommodation & Food Services (137 | 12.3%), and Health Care & Social Assistance (121 | 10.8%).
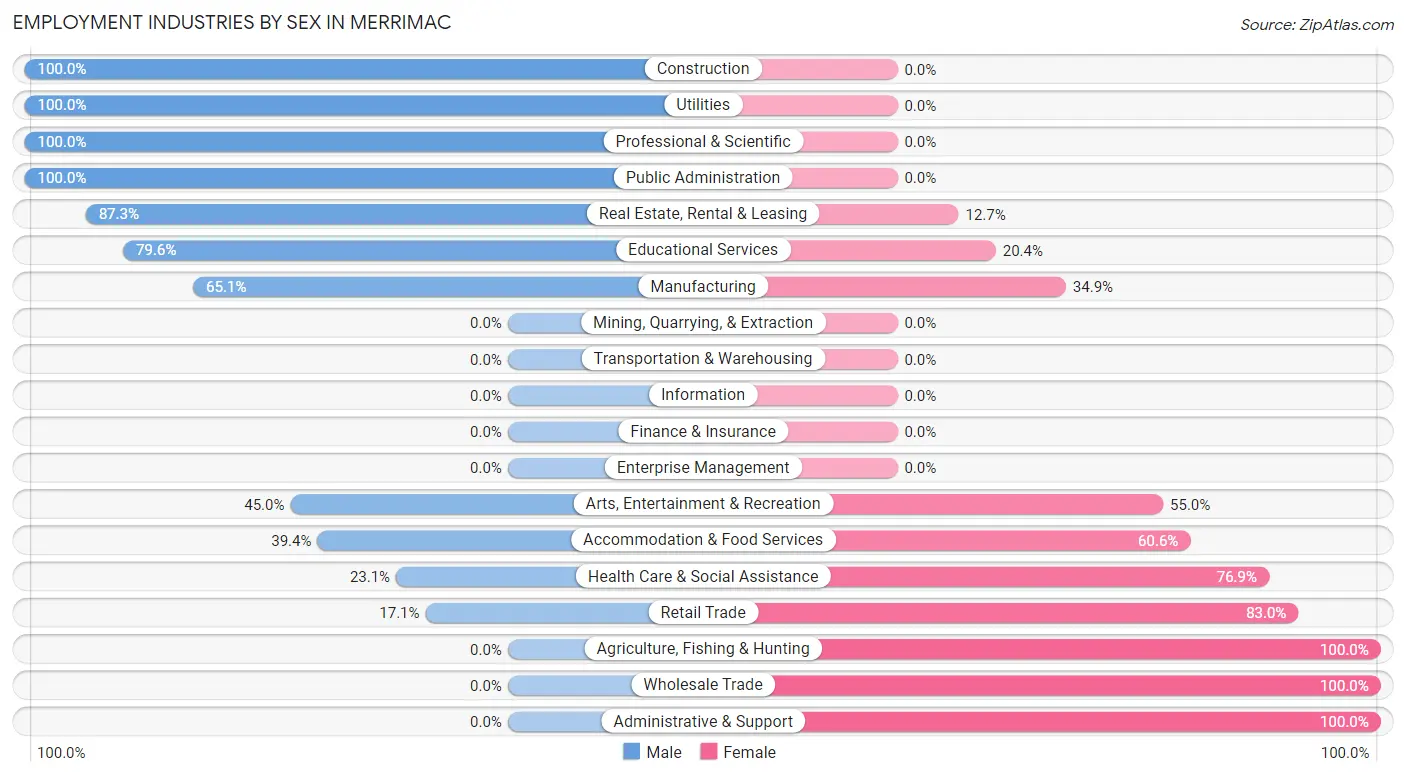
Employment Industries by Sex in Merrimac
The Merrimac industries that see more men than women are Construction (100.0%), Utilities (100.0%), and Professional & Scientific (100.0%), whereas the industries that tend to have a higher number of women are Agriculture, Fishing & Hunting (100.0%), Wholesale Trade (100.0%), and Administrative & Support (100.0%).
| Industry | Male | Female |
| Agriculture, Fishing & Hunting | 0 (0.0%) | 23 (100.0%) |
| Mining, Quarrying, & Extraction | 0 (0.0%) | 0 (0.0%) |
| Construction | 144 (100.0%) | 0 (0.0%) |
| Manufacturing | 112 (65.1%) | 60 (34.9%) |
| Wholesale Trade | 0 (0.0%) | 9 (100.0%) |
| Retail Trade | 15 (17.1%) | 73 (83.0%) |
| Transportation & Warehousing | 0 (0.0%) | 0 (0.0%) |
| Utilities | 9 (100.0%) | 0 (0.0%) |
| Information | 0 (0.0%) | 0 (0.0%) |
| Finance & Insurance | 0 (0.0%) | 0 (0.0%) |
| Real Estate, Rental & Leasing | 69 (87.3%) | 10 (12.7%) |
| Professional & Scientific | 94 (100.0%) | 0 (0.0%) |
| Enterprise Management | 0 (0.0%) | 0 (0.0%) |
| Administrative & Support | 0 (0.0%) | 33 (100.0%) |
| Educational Services | 129 (79.6%) | 33 (20.4%) |
| Health Care & Social Assistance | 28 (23.1%) | 93 (76.9%) |
| Arts, Entertainment & Recreation | 9 (45.0%) | 11 (55.0%) |
| Accommodation & Food Services | 54 (39.4%) | 83 (60.6%) |
| Public Administration | 15 (100.0%) | 0 (0.0%) |
| Total | 678 (60.7%) | 439 (39.3%) |
Education in Merrimac
School Enrollment in Merrimac
The most common levels of schooling among the 330 students in Merrimac are college / undergraduate (110 | 33.3%), graduate / professional (88 | 26.7%), and middle school (62 | 18.8%).
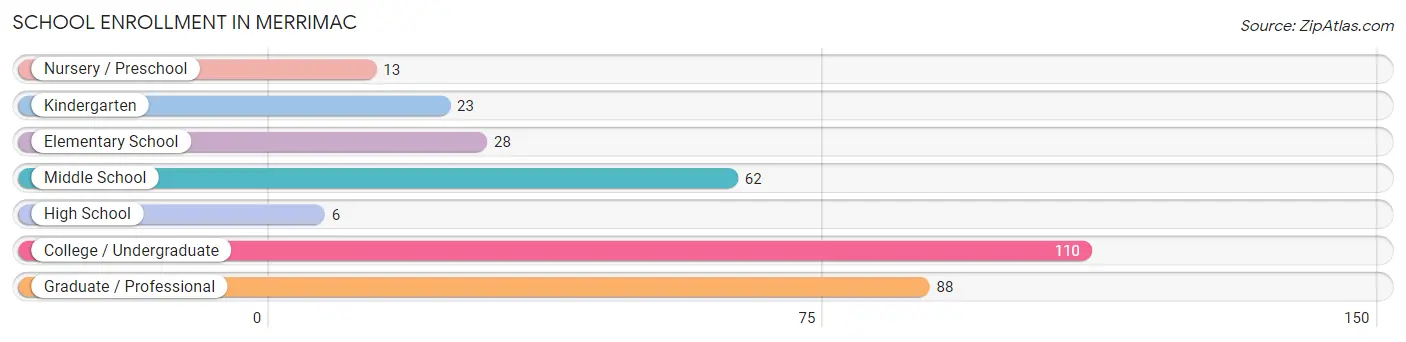
| School Level | # Students | % Students |
| Nursery / Preschool | 13 | 3.9% |
| Kindergarten | 23 | 7.0% |
| Elementary School | 28 | 8.5% |
| Middle School | 62 | 18.8% |
| High School | 6 | 1.8% |
| College / Undergraduate | 110 | 33.3% |
| Graduate / Professional | 88 | 26.7% |
| Total | 330 | 100.0% |
School Enrollment by Age by Funding Source in Merrimac
Out of a total of 330 students who are enrolled in schools in Merrimac, 3 (0.9%) attend a private institution, while the remaining 327 (99.1%) are enrolled in public schools. The age group of 25 to 34 year olds has the highest likelihood of being enrolled in private schools, with 3 (3.3% in the age bracket) enrolled. Conversely, the age group of 3 to 4 year olds has the lowest likelihood of being enrolled in a private school, with 23 (100.0% in the age bracket) attending a public institution.
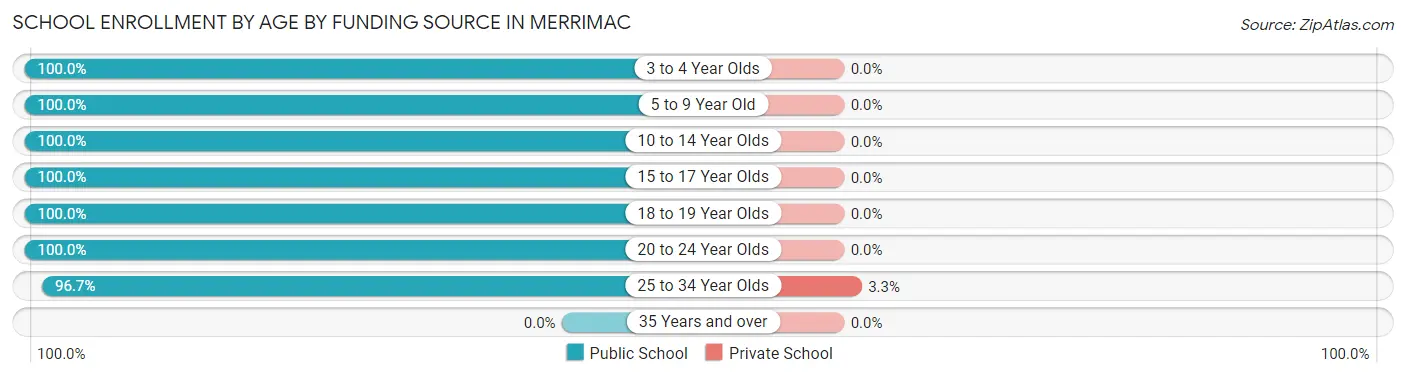
| Age Bracket | Public School | Private School |
| 3 to 4 Year Olds | 23 (100.0%) | 0 (0.0%) |
| 5 to 9 Year Old | 41 (100.0%) | 0 (0.0%) |
| 10 to 14 Year Olds | 62 (100.0%) | 0 (0.0%) |
| 15 to 17 Year Olds | 6 (100.0%) | 0 (0.0%) |
| 18 to 19 Year Olds | 72 (100.0%) | 0 (0.0%) |
| 20 to 24 Year Olds | 34 (100.0%) | 0 (0.0%) |
| 25 to 34 Year Olds | 89 (96.7%) | 3 (3.3%) |
| 35 Years and over | 0 (0.0%) | 0 (0.0%) |
| Total | 327 (99.1%) | 3 (0.9%) |
Educational Attainment by Field of Study in Merrimac
Engineering (202 | 21.5%), science & technology (116 | 12.3%), computers & mathematics (103 | 11.0%), business (101 | 10.8%), and physical & health sciences (79 | 8.4%) are the most common fields of study among 939 individuals in Merrimac who have obtained a bachelor's degree or higher.
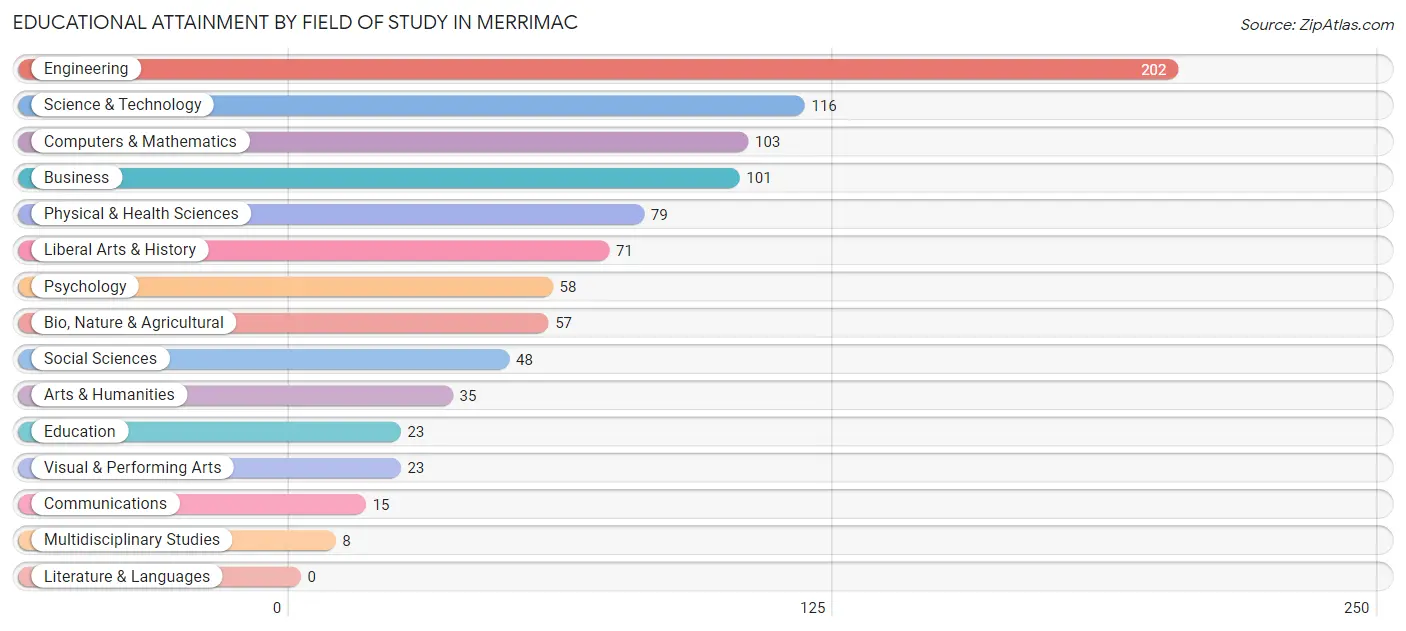
| Field of Study | # Graduates | % Graduates |
| Computers & Mathematics | 103 | 11.0% |
| Bio, Nature & Agricultural | 57 | 6.1% |
| Physical & Health Sciences | 79 | 8.4% |
| Psychology | 58 | 6.2% |
| Social Sciences | 48 | 5.1% |
| Engineering | 202 | 21.5% |
| Multidisciplinary Studies | 8 | 0.9% |
| Science & Technology | 116 | 12.3% |
| Business | 101 | 10.8% |
| Education | 23 | 2.5% |
| Literature & Languages | 0 | 0.0% |
| Liberal Arts & History | 71 | 7.6% |
| Visual & Performing Arts | 23 | 2.5% |
| Communications | 15 | 1.6% |
| Arts & Humanities | 35 | 3.7% |
| Total | 939 | 100.0% |
Transportation & Commute in Merrimac
Vehicle Availability by Sex in Merrimac
The most prevalent vehicle ownership categories in Merrimac are males with 2 vehicles (410, accounting for 61.4%) and females with 2 vehicles (253, making up 93.4%).
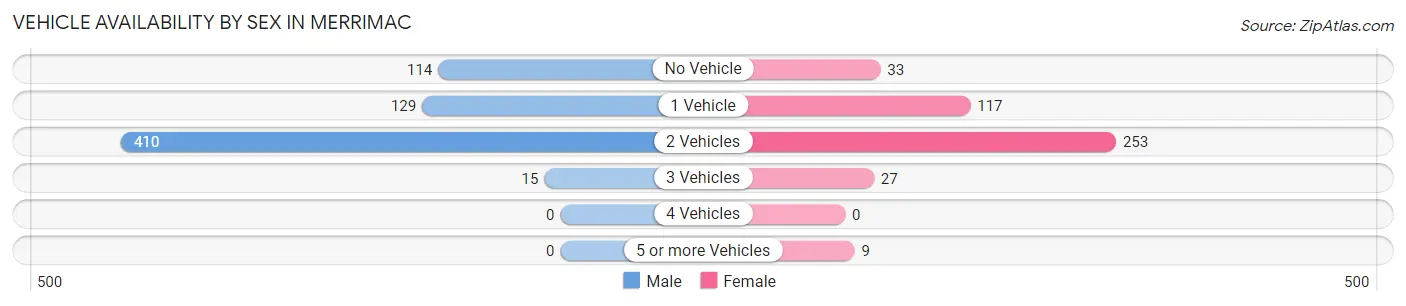
| Vehicles Available | Male | Female |
| No Vehicle | 114 (17.1%) | 33 (7.5%) |
| 1 Vehicle | 129 (19.3%) | 117 (26.7%) |
| 2 Vehicles | 410 (61.4%) | 253 (57.6%) |
| 3 Vehicles | 15 (2.2%) | 27 (6.1%) |
| 4 Vehicles | 0 (0.0%) | 0 (0.0%) |
| 5 or more Vehicles | 0 (0.0%) | 9 (2.1%) |
| Total | 668 (100.0%) | 439 (100.0%) |
Commute Time in Merrimac
The most frequently occuring commute durations in Merrimac are 10 to 14 minutes (398 commuters, 38.0%), 5 to 9 minutes (308 commuters, 29.4%), and 15 to 19 minutes (148 commuters, 14.1%).
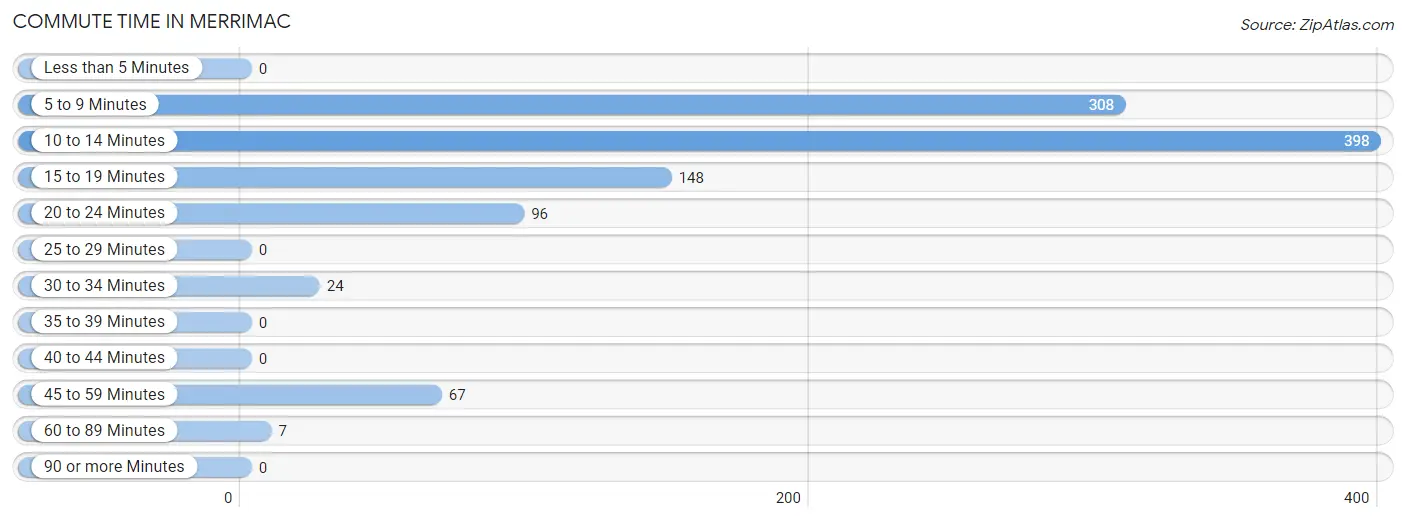
| Commute Time | # Commuters | % Commuters |
| Less than 5 Minutes | 0 | 0.0% |
| 5 to 9 Minutes | 308 | 29.4% |
| 10 to 14 Minutes | 398 | 38.0% |
| 15 to 19 Minutes | 148 | 14.1% |
| 20 to 24 Minutes | 96 | 9.2% |
| 25 to 29 Minutes | 0 | 0.0% |
| 30 to 34 Minutes | 24 | 2.3% |
| 35 to 39 Minutes | 0 | 0.0% |
| 40 to 44 Minutes | 0 | 0.0% |
| 45 to 59 Minutes | 67 | 6.4% |
| 60 to 89 Minutes | 7 | 0.7% |
| 90 or more Minutes | 0 | 0.0% |
Commute Time by Sex in Merrimac
The most common commute times in Merrimac are 10 to 14 minutes (269 commuters, 42.2%) for males and 10 to 14 minutes (129 commuters, 31.5%) for females.
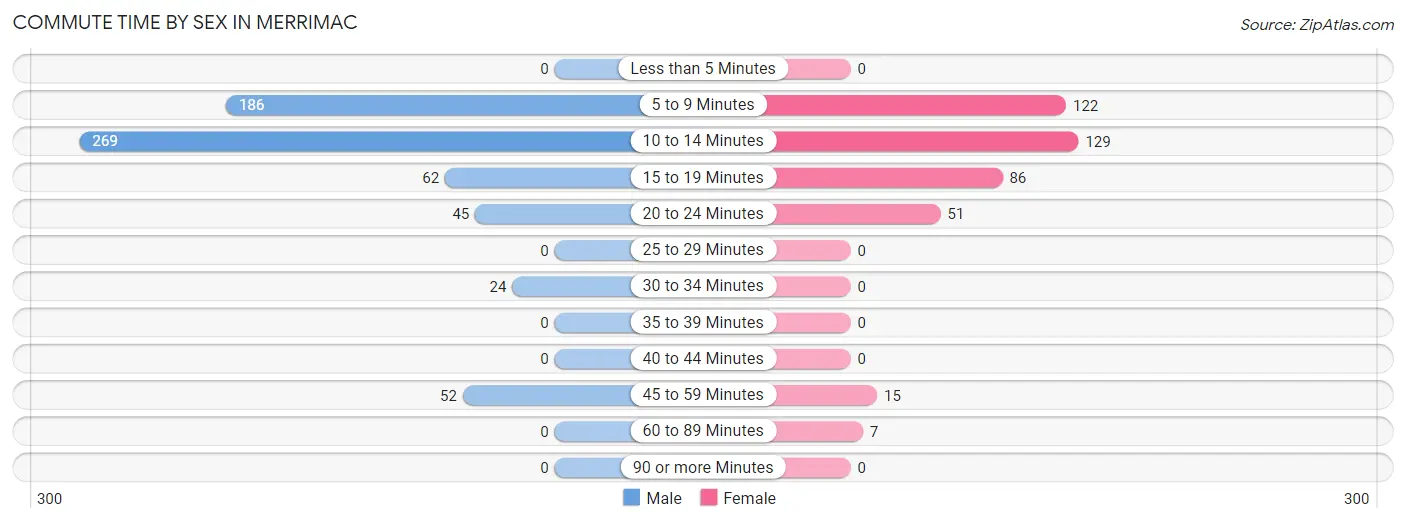
| Commute Time | Male | Female |
| Less than 5 Minutes | 0 (0.0%) | 0 (0.0%) |
| 5 to 9 Minutes | 186 (29.1%) | 122 (29.8%) |
| 10 to 14 Minutes | 269 (42.2%) | 129 (31.5%) |
| 15 to 19 Minutes | 62 (9.7%) | 86 (21.0%) |
| 20 to 24 Minutes | 45 (7.0%) | 51 (12.4%) |
| 25 to 29 Minutes | 0 (0.0%) | 0 (0.0%) |
| 30 to 34 Minutes | 24 (3.8%) | 0 (0.0%) |
| 35 to 39 Minutes | 0 (0.0%) | 0 (0.0%) |
| 40 to 44 Minutes | 0 (0.0%) | 0 (0.0%) |
| 45 to 59 Minutes | 52 (8.2%) | 15 (3.7%) |
| 60 to 89 Minutes | 0 (0.0%) | 7 (1.7%) |
| 90 or more Minutes | 0 (0.0%) | 0 (0.0%) |
Time of Departure to Work by Sex in Merrimac
The most frequent times of departure to work in Merrimac are 8:00 AM to 8:29 AM (150, 23.5%) for males and 8:00 AM to 8:29 AM (133, 32.4%) for females.
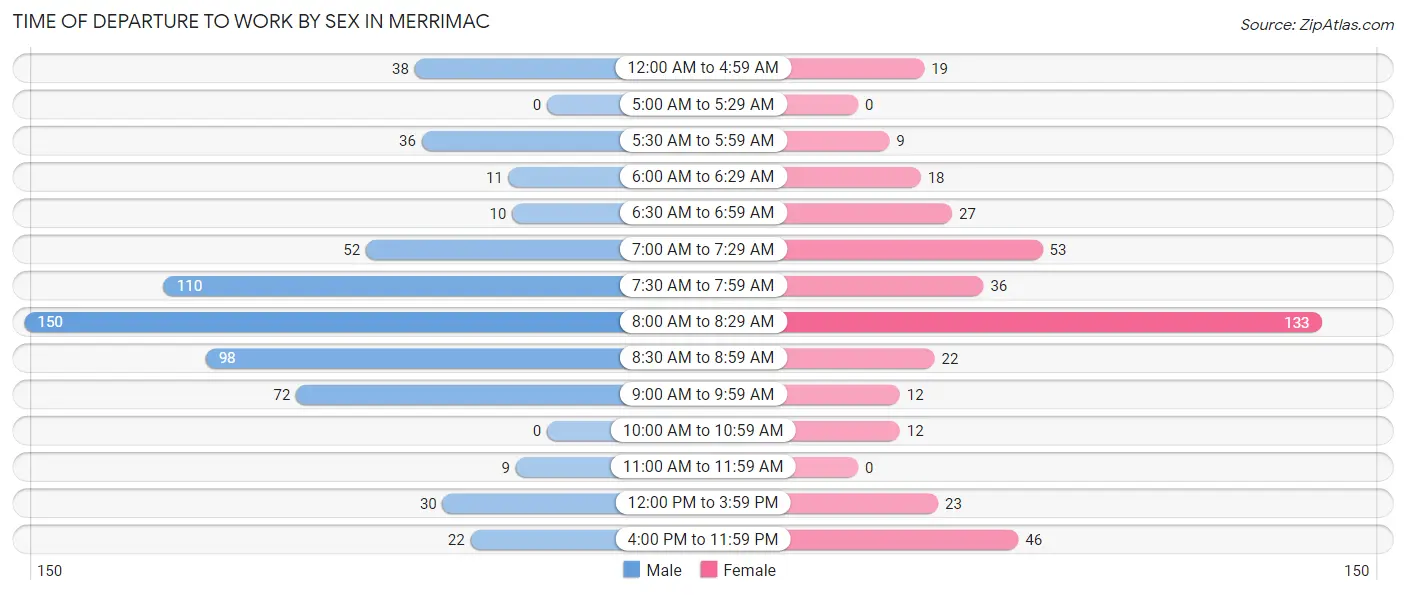
| Time of Departure | Male | Female |
| 12:00 AM to 4:59 AM | 38 (6.0%) | 19 (4.6%) |
| 5:00 AM to 5:29 AM | 0 (0.0%) | 0 (0.0%) |
| 5:30 AM to 5:59 AM | 36 (5.6%) | 9 (2.2%) |
| 6:00 AM to 6:29 AM | 11 (1.7%) | 18 (4.4%) |
| 6:30 AM to 6:59 AM | 10 (1.6%) | 27 (6.6%) |
| 7:00 AM to 7:29 AM | 52 (8.2%) | 53 (12.9%) |
| 7:30 AM to 7:59 AM | 110 (17.2%) | 36 (8.8%) |
| 8:00 AM to 8:29 AM | 150 (23.5%) | 133 (32.4%) |
| 8:30 AM to 8:59 AM | 98 (15.4%) | 22 (5.4%) |
| 9:00 AM to 9:59 AM | 72 (11.3%) | 12 (2.9%) |
| 10:00 AM to 10:59 AM | 0 (0.0%) | 12 (2.9%) |
| 11:00 AM to 11:59 AM | 9 (1.4%) | 0 (0.0%) |
| 12:00 PM to 3:59 PM | 30 (4.7%) | 23 (5.6%) |
| 4:00 PM to 11:59 PM | 22 (3.5%) | 46 (11.2%) |
| Total | 638 (100.0%) | 410 (100.0%) |
Housing Occupancy in Merrimac
Occupancy by Ownership in Merrimac
Of the total 1,461 dwellings in Merrimac, owner-occupied units account for 476 (32.6%), while renter-occupied units make up 985 (67.4%).
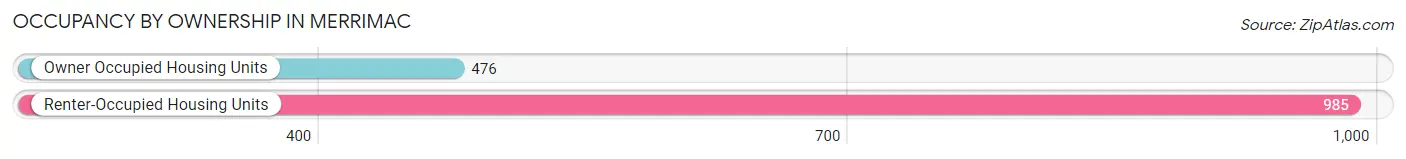
| Occupancy | # Housing Units | % Housing Units |
| Owner Occupied Housing Units | 476 | 32.6% |
| Renter-Occupied Housing Units | 985 | 67.4% |
| Total Occupied Housing Units | 1,461 | 100.0% |
Occupancy by Household Size in Merrimac
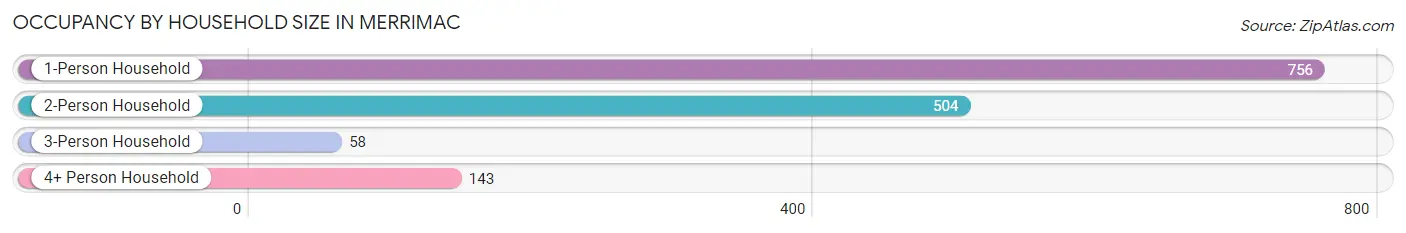
| Household Size | # Housing Units | % Housing Units |
| 1-Person Household | 756 | 51.7% |
| 2-Person Household | 504 | 34.5% |
| 3-Person Household | 58 | 4.0% |
| 4+ Person Household | 143 | 9.8% |
| Total Housing Units | 1,461 | 100.0% |
Occupancy by Ownership by Household Size in Merrimac
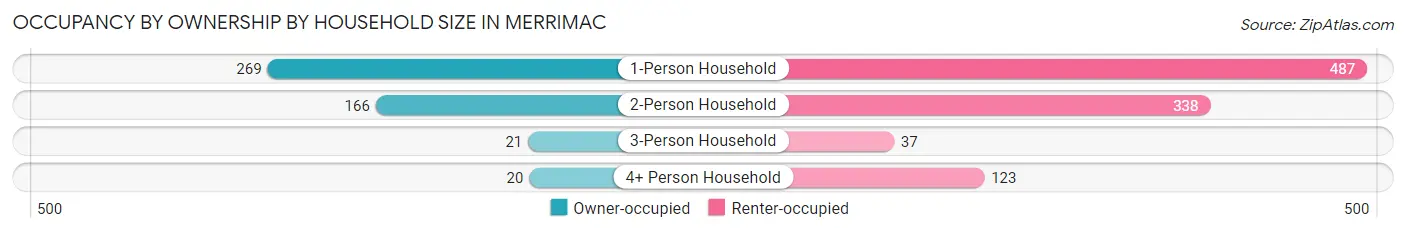
| Household Size | Owner-occupied | Renter-occupied |
| 1-Person Household | 269 (35.6%) | 487 (64.4%) |
| 2-Person Household | 166 (32.9%) | 338 (67.1%) |
| 3-Person Household | 21 (36.2%) | 37 (63.8%) |
| 4+ Person Household | 20 (14.0%) | 123 (86.0%) |
| Total Housing Units | 476 (32.6%) | 985 (67.4%) |
Occupancy by Educational Attainment in Merrimac
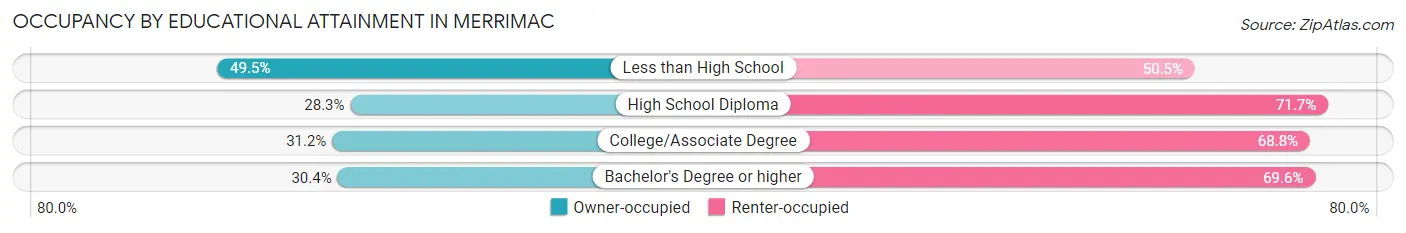
| Household Size | Owner-occupied | Renter-occupied |
| Less than High School | 92 (49.5%) | 94 (50.5%) |
| High School Diploma | 85 (28.3%) | 215 (71.7%) |
| College/Associate Degree | 108 (31.2%) | 238 (68.8%) |
| Bachelor's Degree or higher | 191 (30.4%) | 438 (69.6%) |
Occupancy by Age of Householder in Merrimac
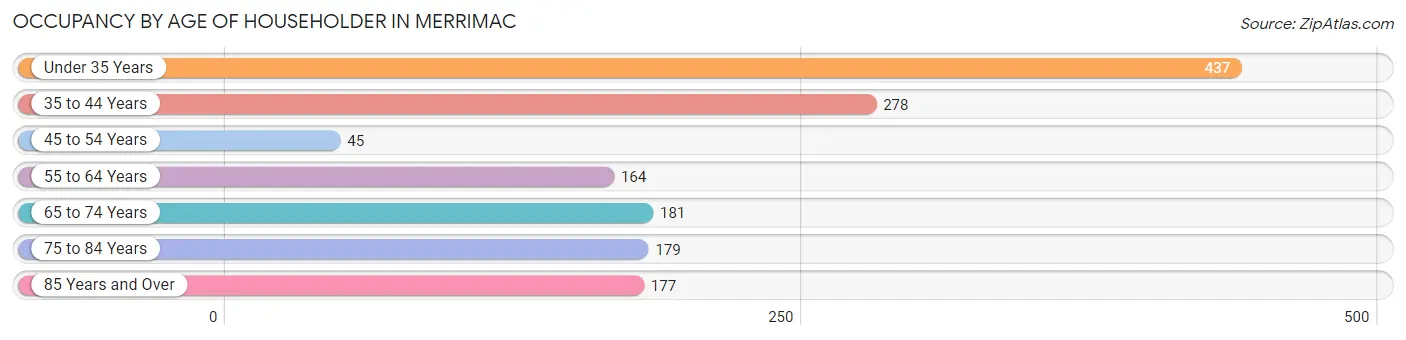
| Age Bracket | # Households | % Households |
| Under 35 Years | 437 | 29.9% |
| 35 to 44 Years | 278 | 19.0% |
| 45 to 54 Years | 45 | 3.1% |
| 55 to 64 Years | 164 | 11.2% |
| 65 to 74 Years | 181 | 12.4% |
| 75 to 84 Years | 179 | 12.2% |
| 85 Years and Over | 177 | 12.1% |
| Total | 1,461 | 100.0% |
Housing Finances in Merrimac
Median Income by Occupancy in Merrimac
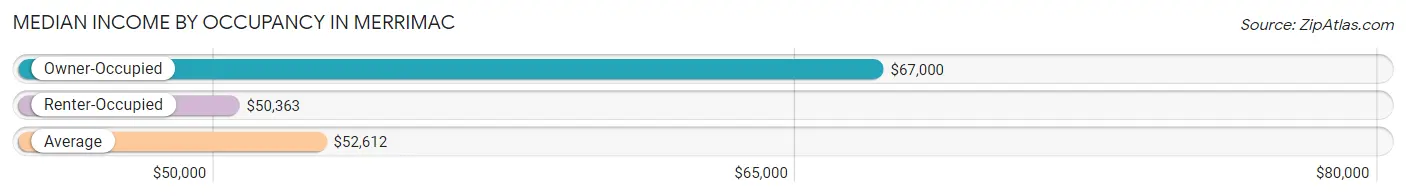
| Occupancy Type | # Households | Median Income |
| Owner-Occupied | 476 (32.6%) | $67,000 |
| Renter-Occupied | 985 (67.4%) | $50,363 |
| Average | 1,461 (100.0%) | $52,612 |
Occupancy by Householder Income Bracket in Merrimac
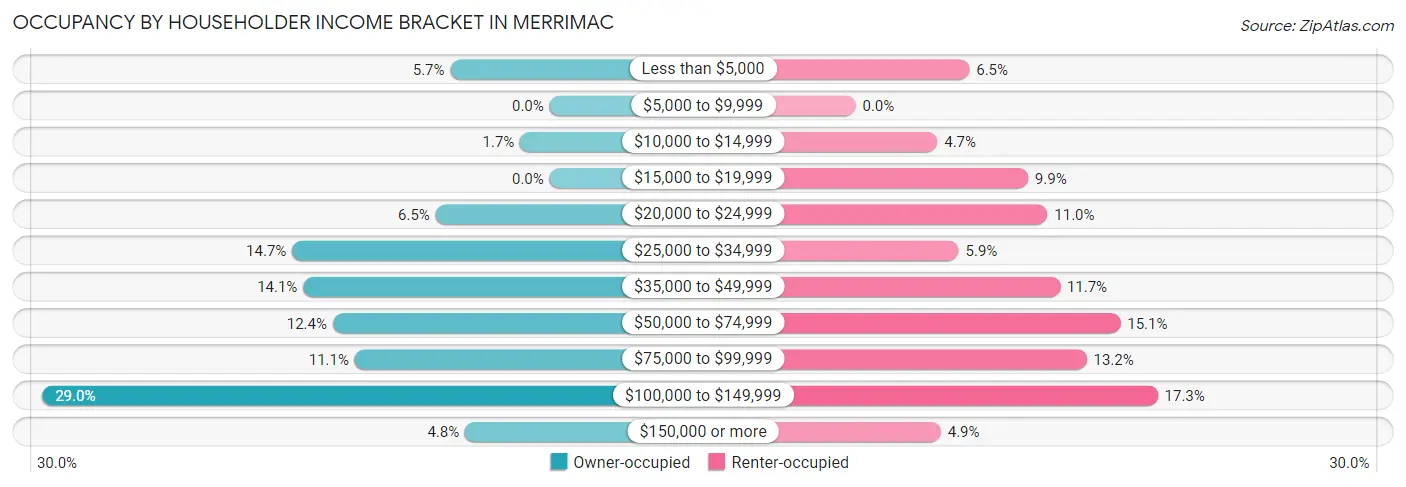
| Income Bracket | Owner-occupied | Renter-occupied |
| Less than $5,000 | 27 (5.7%) | 64 (6.5%) |
| $5,000 to $9,999 | 0 (0.0%) | 0 (0.0%) |
| $10,000 to $14,999 | 8 (1.7%) | 46 (4.7%) |
| $15,000 to $19,999 | 0 (0.0%) | 97 (9.9%) |
| $20,000 to $24,999 | 31 (6.5%) | 108 (11.0%) |
| $25,000 to $34,999 | 70 (14.7%) | 58 (5.9%) |
| $35,000 to $49,999 | 67 (14.1%) | 115 (11.7%) |
| $50,000 to $74,999 | 59 (12.4%) | 149 (15.1%) |
| $75,000 to $99,999 | 53 (11.1%) | 130 (13.2%) |
| $100,000 to $149,999 | 138 (29.0%) | 170 (17.3%) |
| $150,000 or more | 23 (4.8%) | 48 (4.9%) |
| Total | 476 (100.0%) | 985 (100.0%) |
Monthly Housing Cost Tiers in Merrimac
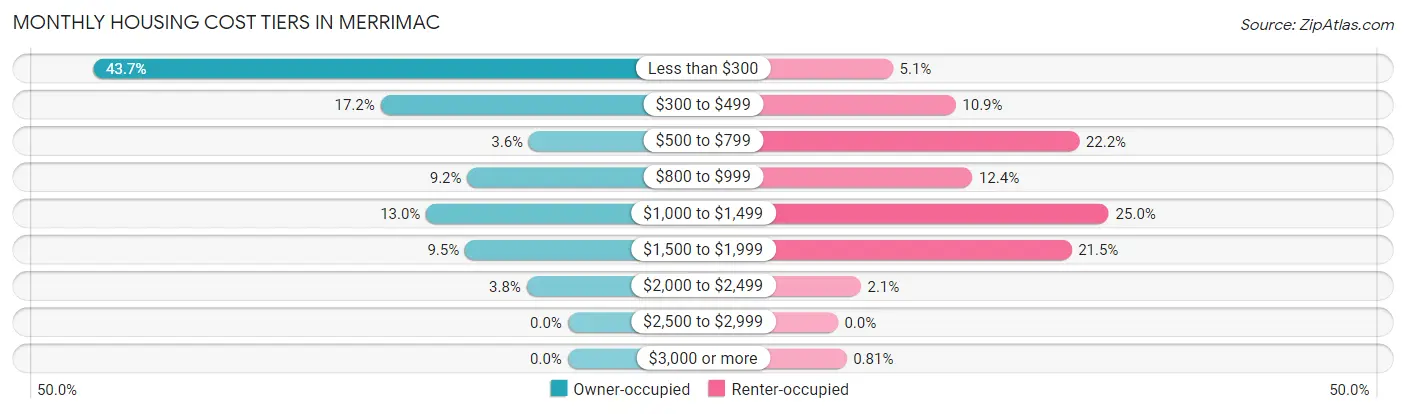
| Monthly Cost | Owner-occupied | Renter-occupied |
| Less than $300 | 208 (43.7%) | 50 (5.1%) |
| $300 to $499 | 82 (17.2%) | 107 (10.9%) |
| $500 to $799 | 17 (3.6%) | 219 (22.2%) |
| $800 to $999 | 44 (9.2%) | 122 (12.4%) |
| $1,000 to $1,499 | 62 (13.0%) | 246 (25.0%) |
| $1,500 to $1,999 | 45 (9.5%) | 212 (21.5%) |
| $2,000 to $2,499 | 18 (3.8%) | 21 (2.1%) |
| $2,500 to $2,999 | 0 (0.0%) | 0 (0.0%) |
| $3,000 or more | 0 (0.0%) | 8 (0.8%) |
| Total | 476 (100.0%) | 985 (100.0%) |
Physical Housing Characteristics in Merrimac
Housing Structures in Merrimac
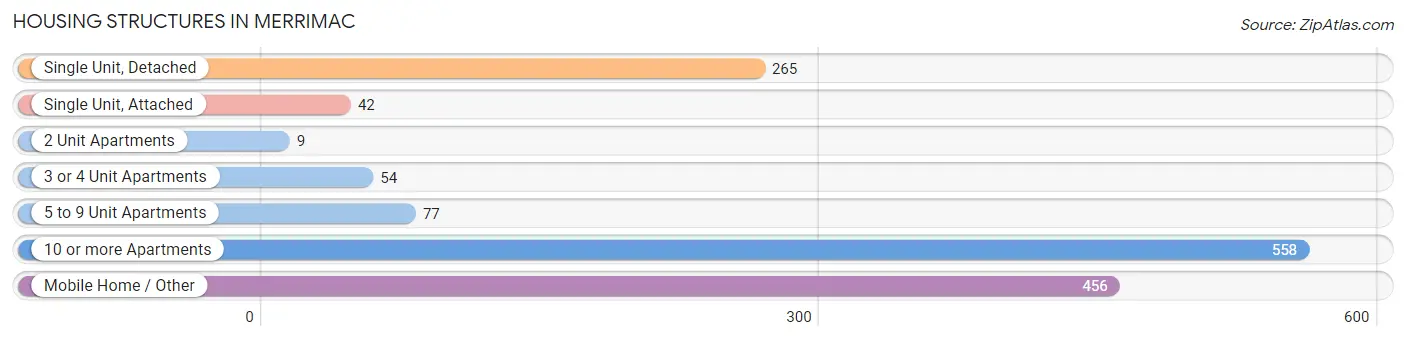
| Structure Type | # Housing Units | % Housing Units |
| Single Unit, Detached | 265 | 18.1% |
| Single Unit, Attached | 42 | 2.9% |
| 2 Unit Apartments | 9 | 0.6% |
| 3 or 4 Unit Apartments | 54 | 3.7% |
| 5 to 9 Unit Apartments | 77 | 5.3% |
| 10 or more Apartments | 558 | 38.2% |
| Mobile Home / Other | 456 | 31.2% |
| Total | 1,461 | 100.0% |
Housing Structures by Occupancy in Merrimac
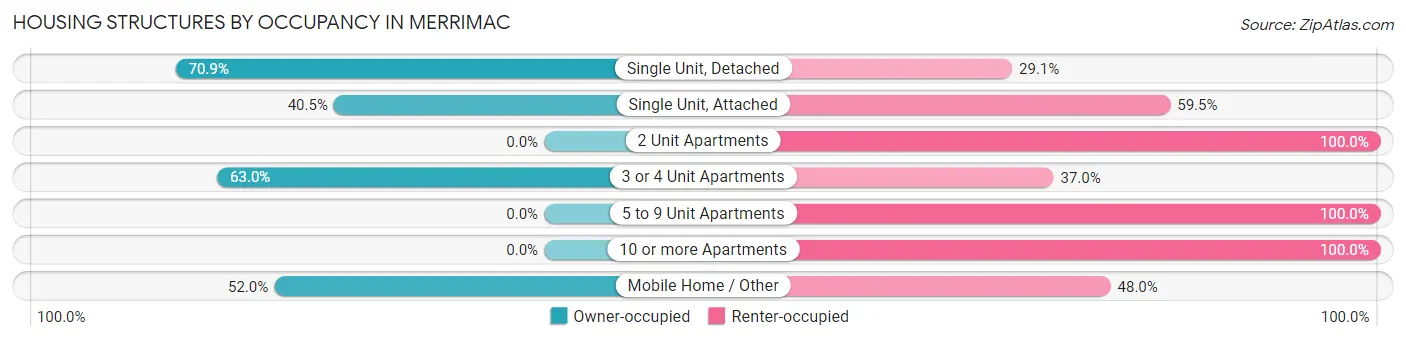
| Structure Type | Owner-occupied | Renter-occupied |
| Single Unit, Detached | 188 (70.9%) | 77 (29.1%) |
| Single Unit, Attached | 17 (40.5%) | 25 (59.5%) |
| 2 Unit Apartments | 0 (0.0%) | 9 (100.0%) |
| 3 or 4 Unit Apartments | 34 (63.0%) | 20 (37.0%) |
| 5 to 9 Unit Apartments | 0 (0.0%) | 77 (100.0%) |
| 10 or more Apartments | 0 (0.0%) | 558 (100.0%) |
| Mobile Home / Other | 237 (52.0%) | 219 (48.0%) |
| Total | 476 (32.6%) | 985 (67.4%) |
Housing Structures by Number of Rooms in Merrimac
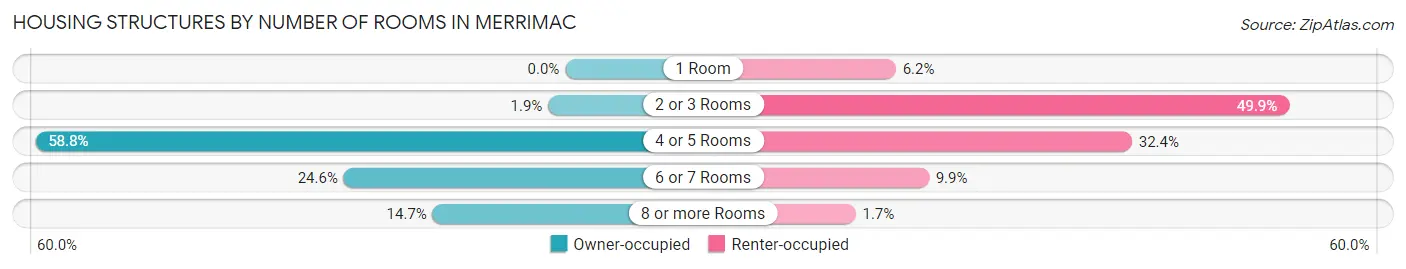
| Number of Rooms | Owner-occupied | Renter-occupied |
| 1 Room | 0 (0.0%) | 61 (6.2%) |
| 2 or 3 Rooms | 9 (1.9%) | 491 (49.8%) |
| 4 or 5 Rooms | 280 (58.8%) | 319 (32.4%) |
| 6 or 7 Rooms | 117 (24.6%) | 97 (9.9%) |
| 8 or more Rooms | 70 (14.7%) | 17 (1.7%) |
| Total | 476 (100.0%) | 985 (100.0%) |
Housing Structure by Heating Type in Merrimac
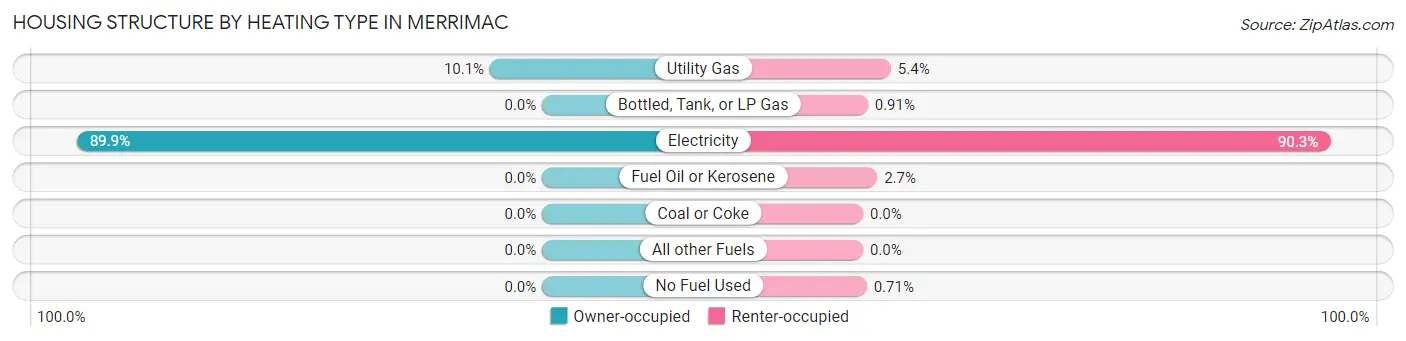
| Heating Type | Owner-occupied | Renter-occupied |
| Utility Gas | 48 (10.1%) | 53 (5.4%) |
| Bottled, Tank, or LP Gas | 0 (0.0%) | 9 (0.9%) |
| Electricity | 428 (89.9%) | 889 (90.2%) |
| Fuel Oil or Kerosene | 0 (0.0%) | 27 (2.7%) |
| Coal or Coke | 0 (0.0%) | 0 (0.0%) |
| All other Fuels | 0 (0.0%) | 0 (0.0%) |
| No Fuel Used | 0 (0.0%) | 7 (0.7%) |
| Total | 476 (100.0%) | 985 (100.0%) |
Household Vehicle Usage in Merrimac
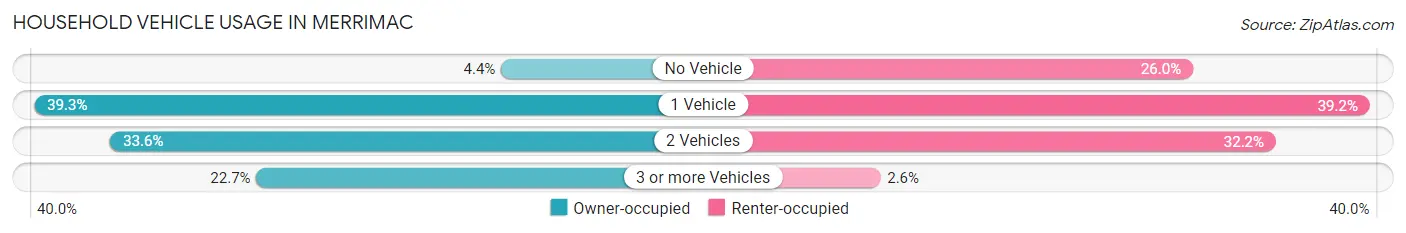
| Vehicles per Household | Owner-occupied | Renter-occupied |
| No Vehicle | 21 (4.4%) | 256 (26.0%) |
| 1 Vehicle | 187 (39.3%) | 386 (39.2%) |
| 2 Vehicles | 160 (33.6%) | 317 (32.2%) |
| 3 or more Vehicles | 108 (22.7%) | 26 (2.6%) |
| Total | 476 (100.0%) | 985 (100.0%) |
Real Estate & Mortgages in Merrimac
Real Estate and Mortgage Overview in Merrimac
| Characteristic | Without Mortgage | With Mortgage |
| Housing Units | 414 | 62 |
| Median Property Value | - | - |
| Median Household Income | $65,600 | $16 |
| Monthly Housing Costs | $299 | $0 |
| Real Estate Taxes | $1,040 | $0 |
Property Value by Mortgage Status in Merrimac
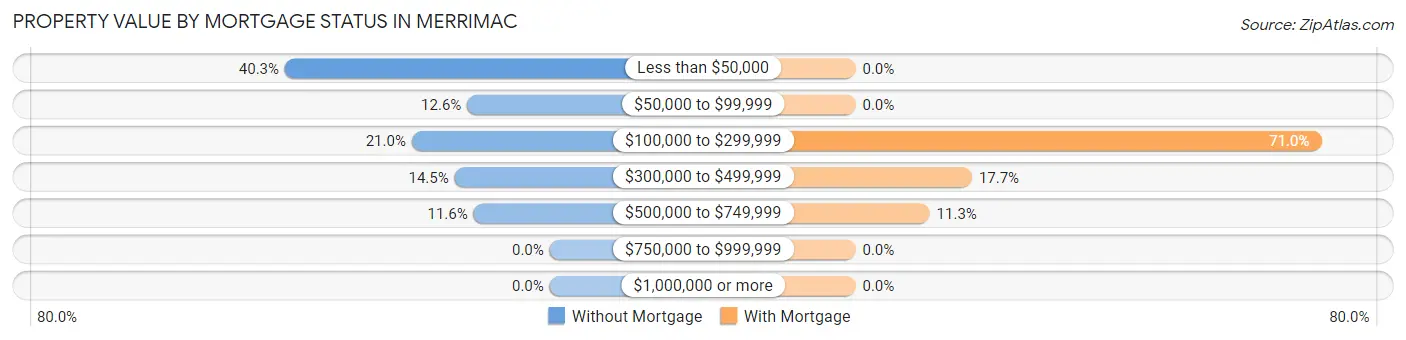
| Property Value | Without Mortgage | With Mortgage |
| Less than $50,000 | 167 (40.3%) | 0 (0.0%) |
| $50,000 to $99,999 | 52 (12.6%) | 0 (0.0%) |
| $100,000 to $299,999 | 87 (21.0%) | 44 (71.0%) |
| $300,000 to $499,999 | 60 (14.5%) | 11 (17.7%) |
| $500,000 to $749,999 | 48 (11.6%) | 7 (11.3%) |
| $750,000 to $999,999 | 0 (0.0%) | 0 (0.0%) |
| $1,000,000 or more | 0 (0.0%) | 0 (0.0%) |
| Total | 414 (100.0%) | 62 (100.0%) |
Household Income by Mortgage Status in Merrimac
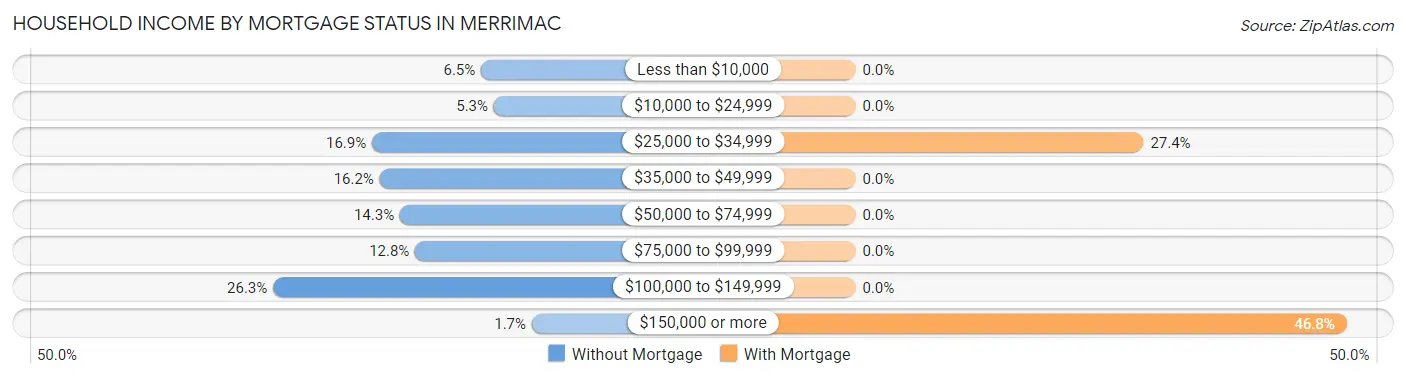
| Household Income | Without Mortgage | With Mortgage |
| Less than $10,000 | 27 (6.5%) | 0 (0.0%) |
| $10,000 to $24,999 | 22 (5.3%) | 0 (0.0%) |
| $25,000 to $34,999 | 70 (16.9%) | 17 (27.4%) |
| $35,000 to $49,999 | 67 (16.2%) | 0 (0.0%) |
| $50,000 to $74,999 | 59 (14.2%) | 0 (0.0%) |
| $75,000 to $99,999 | 53 (12.8%) | 0 (0.0%) |
| $100,000 to $149,999 | 109 (26.3%) | 0 (0.0%) |
| $150,000 or more | 7 (1.7%) | 29 (46.8%) |
| Total | 414 (100.0%) | 62 (100.0%) |
Property Value to Household Income Ratio in Merrimac
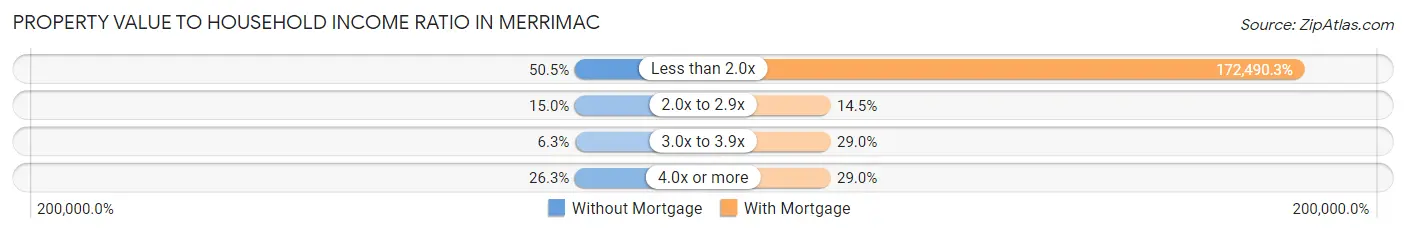
| Value-to-Income Ratio | Without Mortgage | With Mortgage |
| Less than 2.0x | 209 (50.5%) | 106,944 (172,490.3%) |
| 2.0x to 2.9x | 62 (15.0%) | 9 (14.5%) |
| 3.0x to 3.9x | 26 (6.3%) | 18 (29.0%) |
| 4.0x or more | 109 (26.3%) | 18 (29.0%) |
| Total | 414 (100.0%) | 62 (100.0%) |
Real Estate Taxes by Mortgage Status in Merrimac
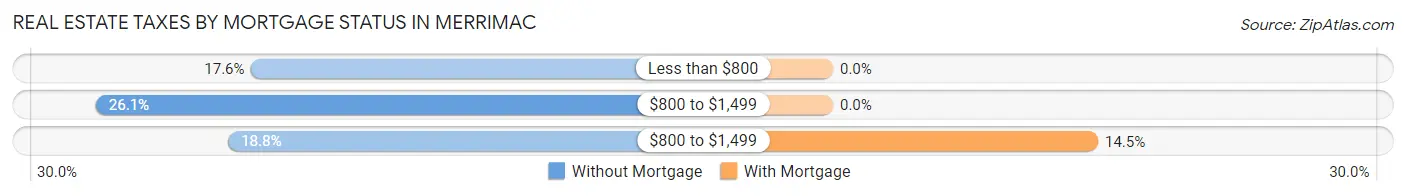
| Property Taxes | Without Mortgage | With Mortgage |
| Less than $800 | 73 (17.6%) | 0 (0.0%) |
| $800 to $1,499 | 108 (26.1%) | 0 (0.0%) |
| $800 to $1,499 | 78 (18.8%) | 9 (14.5%) |
| Total | 414 (100.0%) | 62 (100.0%) |
Health & Disability in Merrimac
Health Insurance Coverage by Age in Merrimac
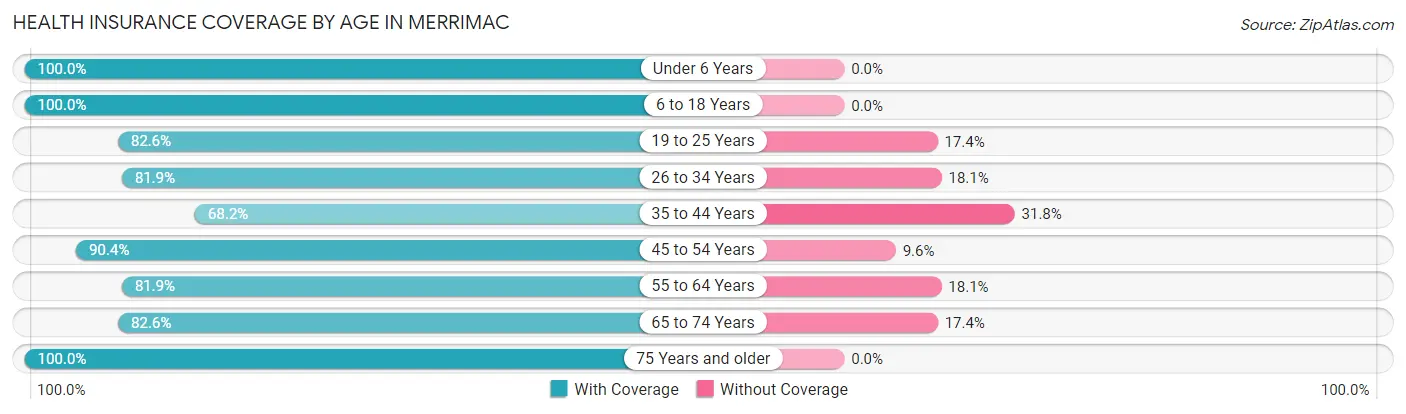
| Age Bracket | With Coverage | Without Coverage |
| Under 6 Years | 99 (100.0%) | 0 (0.0%) |
| 6 to 18 Years | 151 (100.0%) | 0 (0.0%) |
| 19 to 25 Years | 233 (82.6%) | 49 (17.4%) |
| 26 to 34 Years | 402 (81.9%) | 89 (18.1%) |
| 35 to 44 Years | 260 (68.2%) | 121 (31.8%) |
| 45 to 54 Years | 198 (90.4%) | 21 (9.6%) |
| 55 to 64 Years | 199 (81.9%) | 44 (18.1%) |
| 65 to 74 Years | 218 (82.6%) | 46 (17.4%) |
| 75 Years and older | 439 (100.0%) | 0 (0.0%) |
| Total | 2,199 (85.6%) | 370 (14.4%) |
Health Insurance Coverage by Citizenship Status in Merrimac
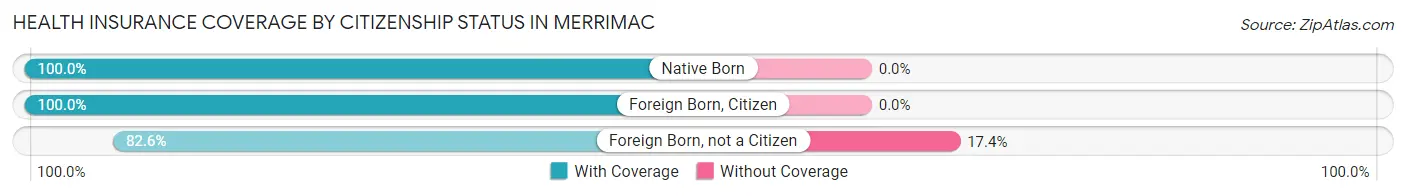
| Citizenship Status | With Coverage | Without Coverage |
| Native Born | 99 (100.0%) | 0 (0.0%) |
| Foreign Born, Citizen | 151 (100.0%) | 0 (0.0%) |
| Foreign Born, not a Citizen | 233 (82.6%) | 49 (17.4%) |
Health Insurance Coverage by Household Income in Merrimac
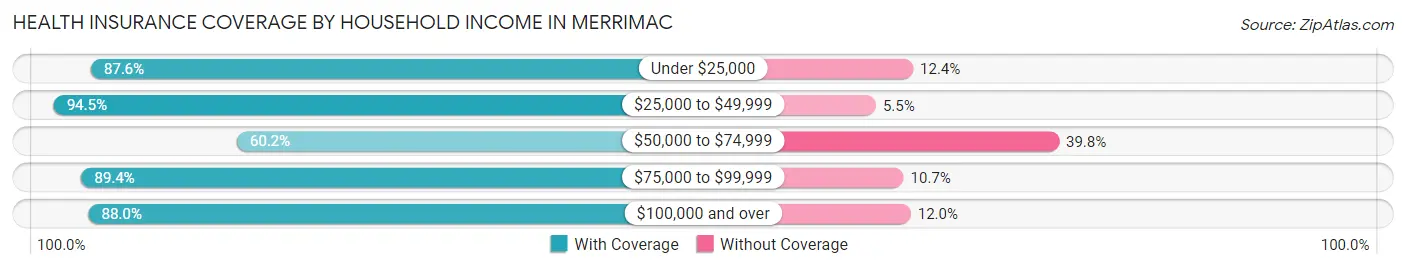
| Household Income | With Coverage | Without Coverage |
| Under $25,000 | 437 (87.6%) | 62 (12.4%) |
| $25,000 to $49,999 | 467 (94.5%) | 27 (5.5%) |
| $50,000 to $74,999 | 212 (60.2%) | 140 (39.8%) |
| $75,000 to $99,999 | 386 (89.3%) | 46 (10.6%) |
| $100,000 and over | 697 (88.0%) | 95 (12.0%) |
Public vs Private Health Insurance Coverage by Age in Merrimac
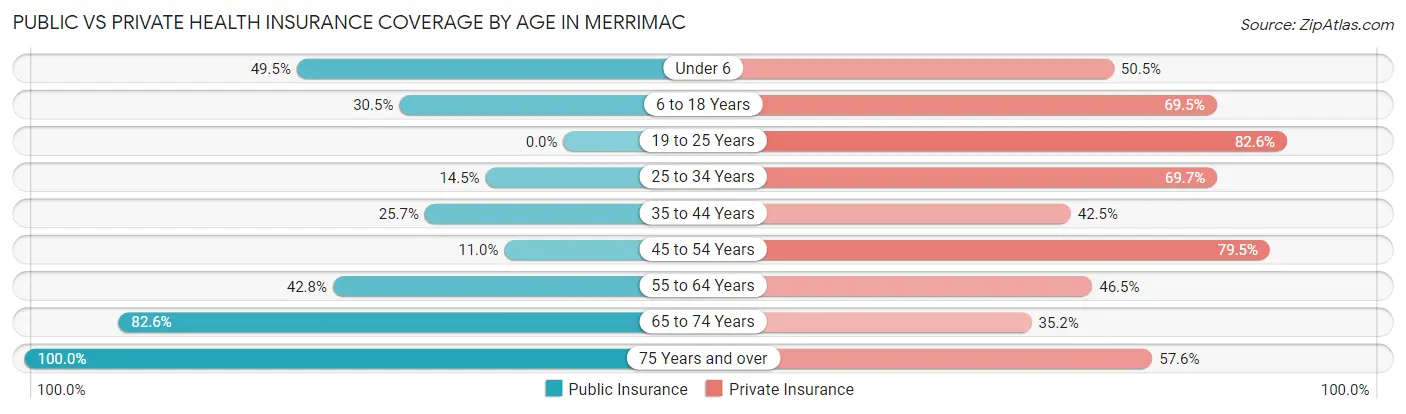
| Age Bracket | Public Insurance | Private Insurance |
| Under 6 | 49 (49.5%) | 50 (50.5%) |
| 6 to 18 Years | 46 (30.5%) | 105 (69.5%) |
| 19 to 25 Years | 0 (0.0%) | 233 (82.6%) |
| 25 to 34 Years | 71 (14.5%) | 342 (69.7%) |
| 35 to 44 Years | 98 (25.7%) | 162 (42.5%) |
| 45 to 54 Years | 24 (11.0%) | 174 (79.4%) |
| 55 to 64 Years | 104 (42.8%) | 113 (46.5%) |
| 65 to 74 Years | 218 (82.6%) | 93 (35.2%) |
| 75 Years and over | 439 (100.0%) | 253 (57.6%) |
| Total | 1,049 (40.8%) | 1,525 (59.4%) |
Disability Status by Sex by Age in Merrimac
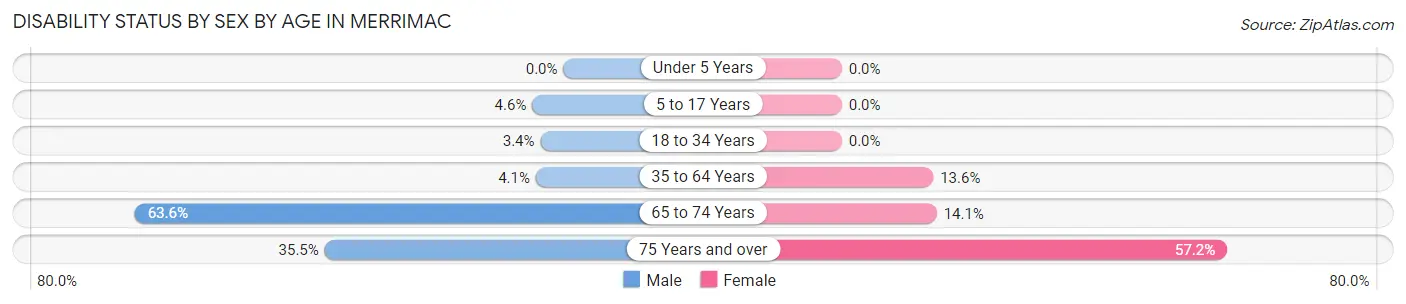
| Age Bracket | Male | Female |
| Under 5 Years | 0 (0.0%) | 0 (0.0%) |
| 5 to 17 Years | 6 (4.6%) | 0 (0.0%) |
| 18 to 34 Years | 17 (3.4%) | 0 (0.0%) |
| 35 to 64 Years | 17 (4.1%) | 58 (13.6%) |
| 65 to 74 Years | 28 (63.6%) | 31 (14.1%) |
| 75 Years and over | 67 (35.4%) | 143 (57.2%) |
Disability Class by Sex by Age in Merrimac
Disability Class: Hearing Difficulty
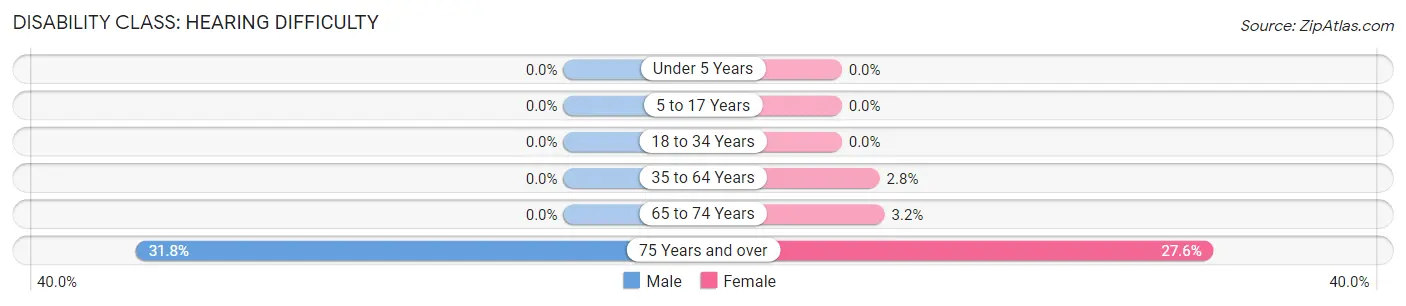
| Age Bracket | Male | Female |
| Under 5 Years | 0 (0.0%) | 0 (0.0%) |
| 5 to 17 Years | 0 (0.0%) | 0 (0.0%) |
| 18 to 34 Years | 0 (0.0%) | 0 (0.0%) |
| 35 to 64 Years | 0 (0.0%) | 12 (2.8%) |
| 65 to 74 Years | 0 (0.0%) | 7 (3.2%) |
| 75 Years and over | 60 (31.8%) | 69 (27.6%) |
Disability Class: Vision Difficulty
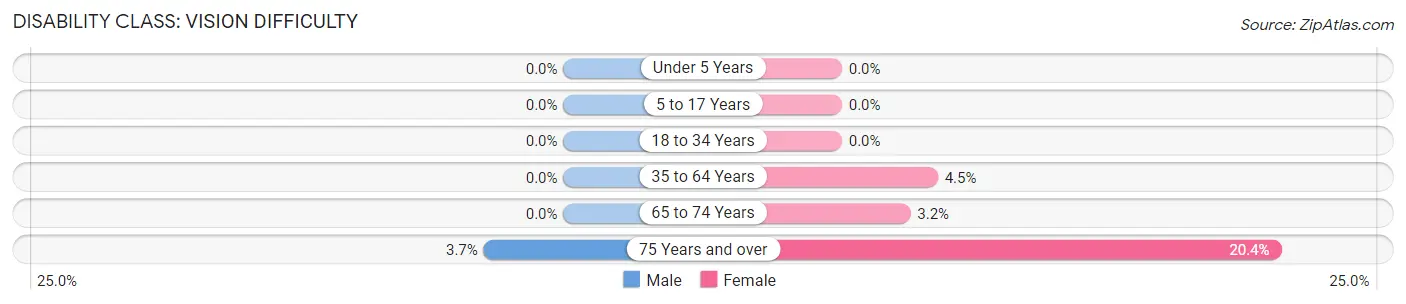
| Age Bracket | Male | Female |
| Under 5 Years | 0 (0.0%) | 0 (0.0%) |
| 5 to 17 Years | 0 (0.0%) | 0 (0.0%) |
| 18 to 34 Years | 0 (0.0%) | 0 (0.0%) |
| 35 to 64 Years | 0 (0.0%) | 19 (4.4%) |
| 65 to 74 Years | 0 (0.0%) | 7 (3.2%) |
| 75 Years and over | 7 (3.7%) | 51 (20.4%) |
Disability Class: Cognitive Difficulty
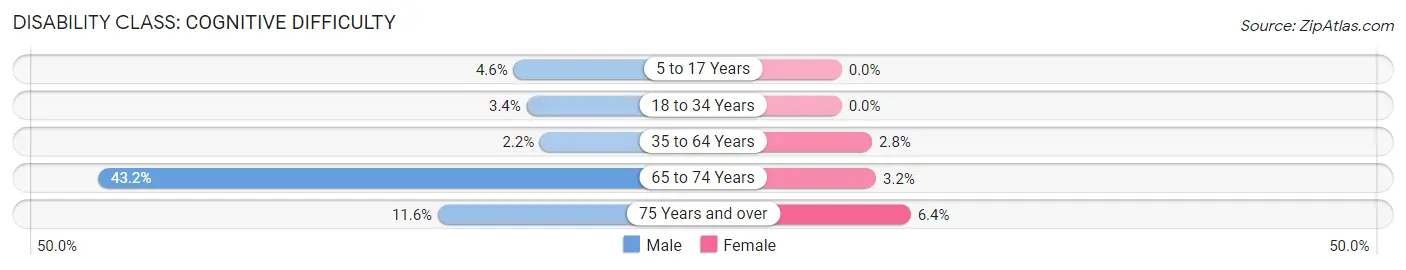
| Age Bracket | Male | Female |
| 5 to 17 Years | 6 (4.6%) | 0 (0.0%) |
| 18 to 34 Years | 17 (3.4%) | 0 (0.0%) |
| 35 to 64 Years | 9 (2.2%) | 12 (2.8%) |
| 65 to 74 Years | 19 (43.2%) | 7 (3.2%) |
| 75 Years and over | 22 (11.6%) | 16 (6.4%) |
Disability Class: Ambulatory Difficulty
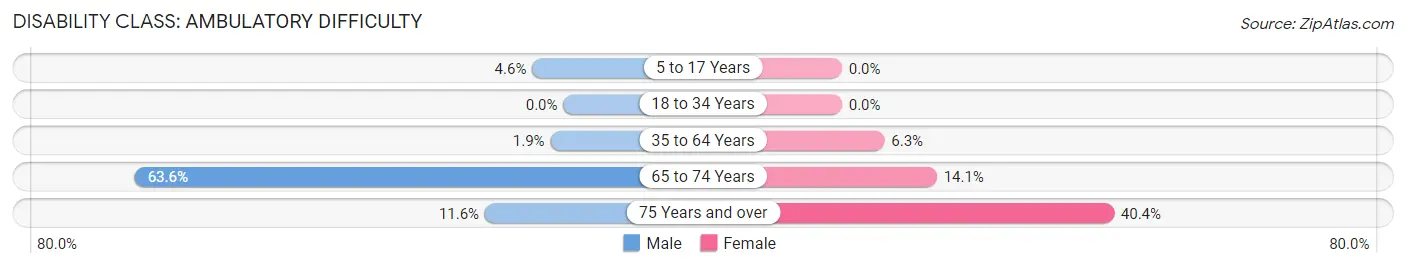
| Age Bracket | Male | Female |
| 5 to 17 Years | 6 (4.6%) | 0 (0.0%) |
| 18 to 34 Years | 0 (0.0%) | 0 (0.0%) |
| 35 to 64 Years | 8 (1.9%) | 27 (6.3%) |
| 65 to 74 Years | 28 (63.6%) | 31 (14.1%) |
| 75 Years and over | 22 (11.6%) | 101 (40.4%) |
Disability Class: Self-Care Difficulty
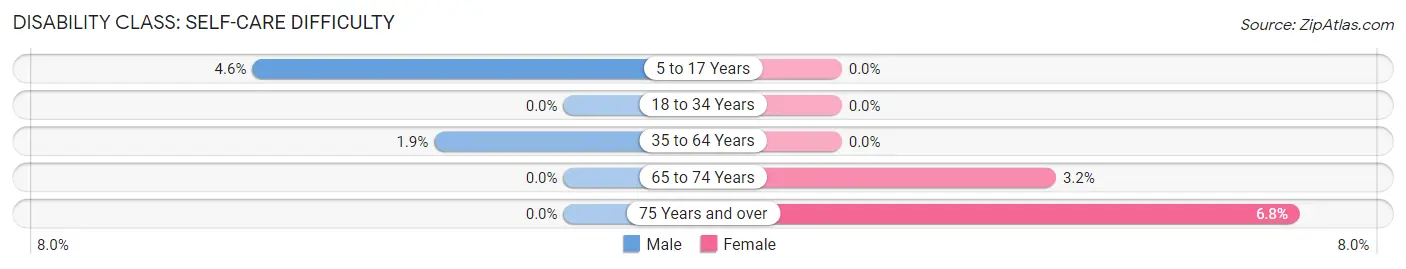
| Age Bracket | Male | Female |
| 5 to 17 Years | 6 (4.6%) | 0 (0.0%) |
| 18 to 34 Years | 0 (0.0%) | 0 (0.0%) |
| 35 to 64 Years | 8 (1.9%) | 0 (0.0%) |
| 65 to 74 Years | 0 (0.0%) | 7 (3.2%) |
| 75 Years and over | 0 (0.0%) | 17 (6.8%) |
Technology Access in Merrimac
Computing Device Access in Merrimac
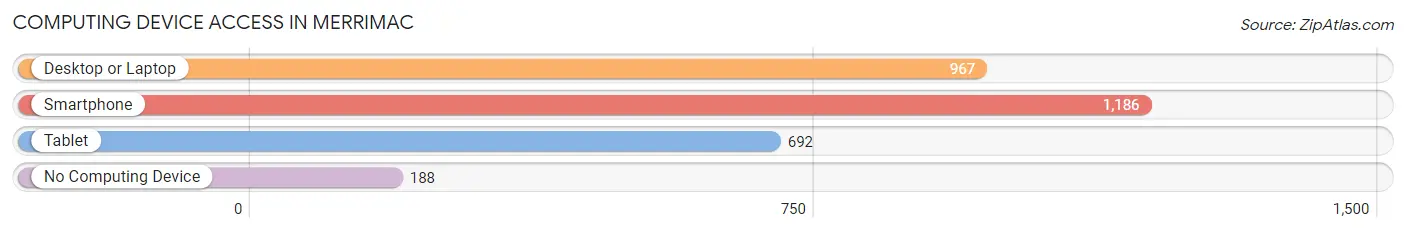
| Device Type | # Households | % Households |
| Desktop or Laptop | 967 | 66.2% |
| Smartphone | 1,186 | 81.2% |
| Tablet | 692 | 47.4% |
| No Computing Device | 188 | 12.9% |
| Total | 1,461 | 100.0% |
Internet Access in Merrimac
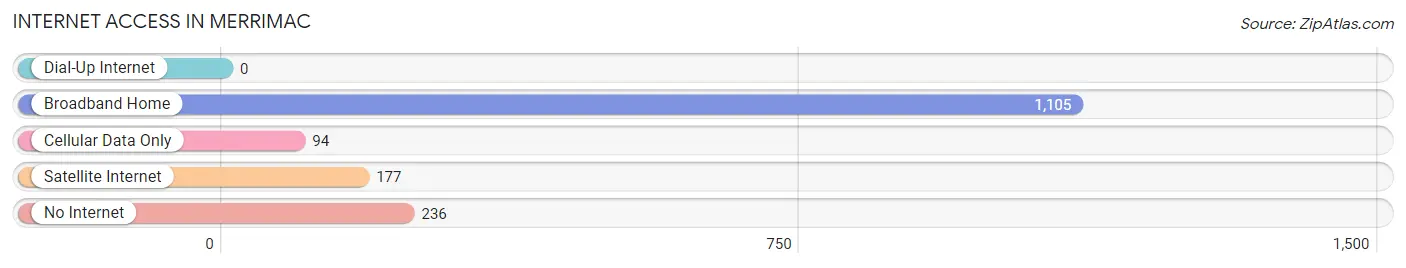
| Internet Type | # Households | % Households |
| Dial-Up Internet | 0 | 0.0% |
| Broadband Home | 1,105 | 75.6% |
| Cellular Data Only | 94 | 6.4% |
| Satellite Internet | 177 | 12.1% |
| No Internet | 236 | 16.2% |
| Total | 1,461 | 100.0% |
Merrimac Summary
Merrimac, Virginia is a small town located in the southeastern corner of the state, near the border of North Carolina. It is part of the Hampton Roads metropolitan area and is situated on the banks of the Elizabeth River. The town has a population of just over 1,000 people and is known for its small-town charm and rural atmosphere.
History
Merrimac was first settled in the early 1700s by English colonists. The town was named after the Merrimack River in Massachusetts, which was named after the Native American tribe that lived in the area. The town was originally part of Nansemond County, but in 1790 it became part of Isle of Wight County. In 1810, the town was officially incorporated as Merrimac.
During the Civil War, Merrimac was the site of several battles, including the Battle of Great Bridge in 1862. The town was also the site of the first Confederate ironclad warship, the CSS Virginia. After the war, the town experienced a period of growth and prosperity, with the establishment of several businesses and industries.
Geography
Merrimac is located in southeastern Virginia, near the border of North Carolina. It is part of the Hampton Roads metropolitan area and is situated on the banks of the Elizabeth River. The town has a total area of 1.2 square miles, all of which is land. The town is located in a humid subtropical climate zone, with hot, humid summers and mild winters.
Economy
The economy of Merrimac is largely based on agriculture and tourism. The town is home to several farms, which produce a variety of crops, including corn, soybeans, and wheat. The town is also home to several small businesses, including restaurants, shops, and other services. Tourism is also an important part of the local economy, with visitors coming to the area to enjoy the town’s rural atmosphere and small-town charm.
Demographics
As of the 2010 census, Merrimac had a population of 1,072 people. The racial makeup of the town was 94.3% White, 2.7% African American, 0.3% Native American, 0.7% Asian, 0.1% Pacific Islander, and 1.9% from other races. The median household income was $41,250, and the median family income was $50,000. The per capita income was $20,945.
Merrimac is a small town with a rich history and a unique atmosphere. The town is home to a diverse population and a thriving economy, making it an ideal place to live and visit.
Common Questions
What is Per Capita Income in Merrimac?
Per Capita income in Merrimac is $37,769.
What is the Median Family Income in Merrimac?
Median Family Income in Merrimac is $54,904.
What is the Median Household income in Merrimac?
Median Household Income in Merrimac is $52,612.
What is Income or Wage Gap in Merrimac?
Income or Wage Gap in Merrimac is 24.1%.
Women in Merrimac earn 75.9 cents for every dollar earned by a man.
What is Inequality or Gini Index in Merrimac?
Inequality or Gini Index in Merrimac is 0.44.
What is the Total Population of Merrimac?
Total Population of Merrimac is 2,719.
What is the Total Male Population of Merrimac?
Total Male Population of Merrimac is 1,338.
What is the Total Female Population of Merrimac?
Total Female Population of Merrimac is 1,381.
What is the Ratio of Males per 100 Females in Merrimac?
There are 96.89 Males per 100 Females in Merrimac.
What is the Ratio of Females per 100 Males in Merrimac?
There are 103.21 Females per 100 Males in Merrimac.
What is the Median Population Age in Merrimac?
Median Population Age in Merrimac is 43.9 Years.
What is the Average Family Size in Merrimac
Average Family Size in Merrimac is 2.8 People.
What is the Average Household Size in Merrimac
Average Household Size in Merrimac is 1.8 People.
How Large is the Labor Force in Merrimac?
There are 1,183 People in the Labor Forcein in Merrimac.
What is the Percentage of People in the Labor Force in Merrimac?
47.8% of People are in the Labor Force in Merrimac.
What is the Unemployment Rate in Merrimac?
Unemployment Rate in Merrimac is 5.7%.