Horse Pasture, VA Map & Demographics
Horse Pasture Map
Horse Pasture Overview
$23,472
PER CAPITA INCOME
$55,736
AVG FAMILY INCOME
$50,094
AVG HOUSEHOLD INCOME
8.3%
WAGE / INCOME GAP [ % ]
91.7¢/ $1
WAGE / INCOME GAP [ $ ]
0.39
INEQUALITY / GINI INDEX
2,291
TOTAL POPULATION
1,196
MALE POPULATION
1,095
FEMALE POPULATION
109.22
MALES / 100 FEMALES
91.56
FEMALES / 100 MALES
53.3
MEDIAN AGE
3.3
AVG FAMILY SIZE
2.5
AVG HOUSEHOLD SIZE
792
LABOR FORCE [ PEOPLE ]
41.8%
PERCENT IN LABOR FORCE
4.3%
UNEMPLOYMENT RATE
Income in Horse Pasture
Income Overview in Horse Pasture
Per Capita Income in Horse Pasture is $23,472, while median incomes of families and households are $55,736 and $50,094 respectively.
| Characteristic | Number | Measure |
| Per Capita Income | 2,291 | $23,472 |
| Median Family Income | 475 | $55,736 |
| Mean Family Income | 475 | $68,861 |
| Median Household Income | 882 | $50,094 |
| Mean Household Income | 882 | $55,356 |
| Income Deficit | 475 | $0 |
| Wage / Income Gap (%) | 2,291 | 8.32% |
| Wage / Income Gap ($) | 2,291 | 91.68¢ per $1 |
| Gini / Inequality Index | 2,291 | 0.39 |
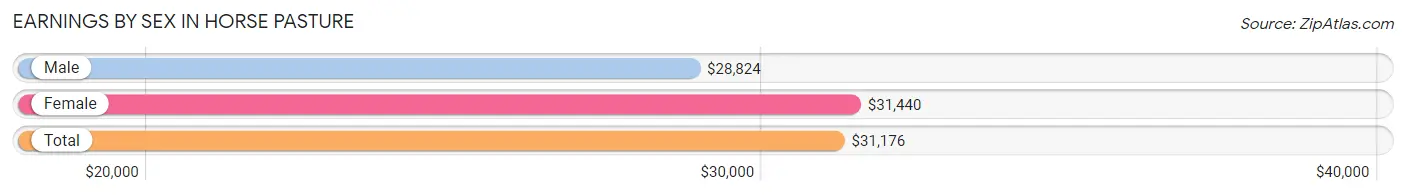
Earnings by Sex in Horse Pasture
Average Earnings in Horse Pasture are $31,176, $28,824 for men and $31,440 for women, a difference of 8.3%.
| Sex | Number | Average Earnings |
| Male | 444 (49.1%) | $28,824 |
| Female | 461 (50.9%) | $31,440 |
| Total | 905 (100.0%) | $31,176 |
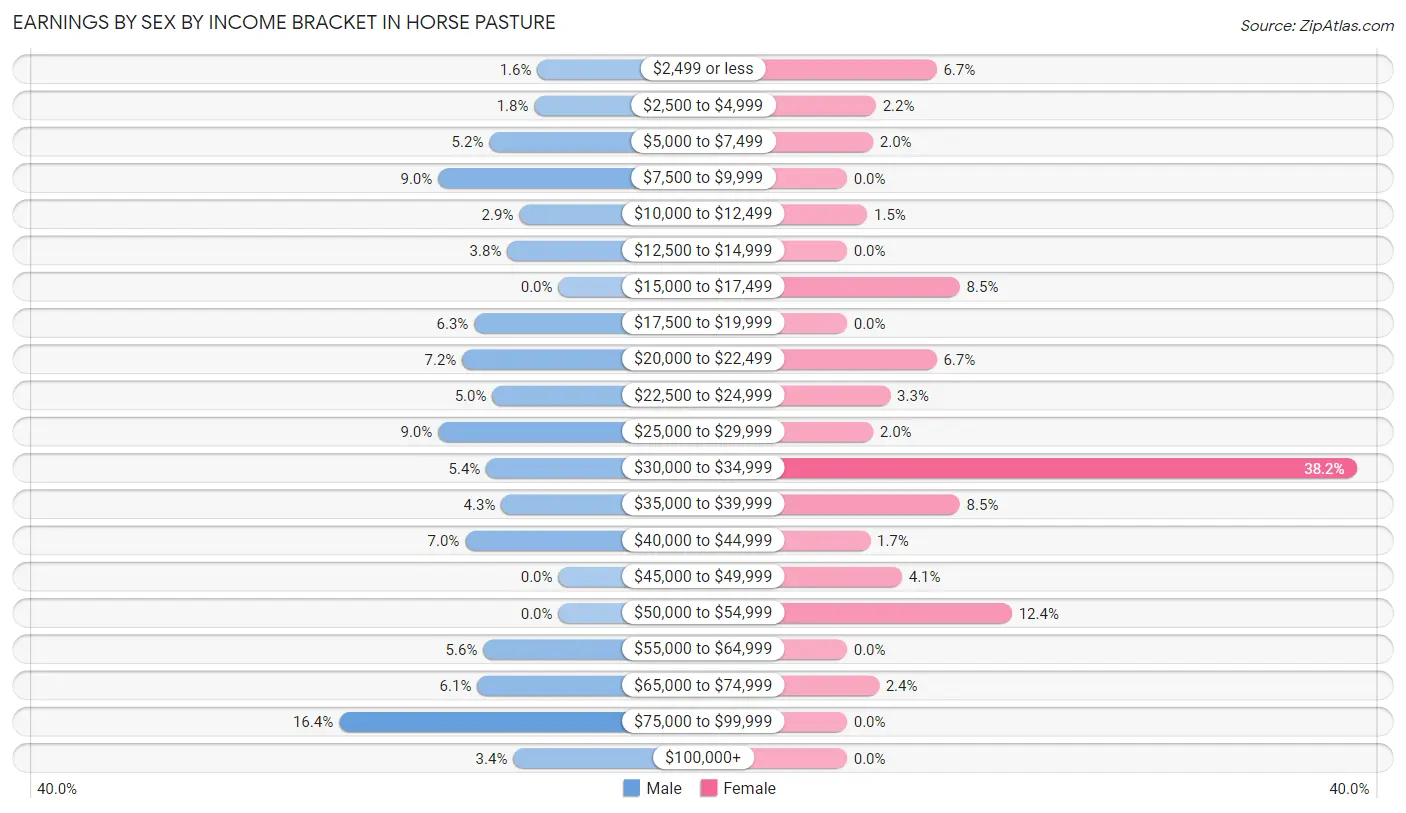
Earnings by Sex by Income Bracket in Horse Pasture
The most common earnings brackets in Horse Pasture are $75,000 to $99,999 for men (73 | 16.4%) and $30,000 to $34,999 for women (176 | 38.2%).
| Income | Male | Female |
| $2,499 or less | 7 (1.6%) | 31 (6.7%) |
| $2,500 to $4,999 | 8 (1.8%) | 10 (2.2%) |
| $5,000 to $7,499 | 23 (5.2%) | 9 (1.9%) |
| $7,500 to $9,999 | 40 (9.0%) | 0 (0.0%) |
| $10,000 to $12,499 | 13 (2.9%) | 7 (1.5%) |
| $12,500 to $14,999 | 17 (3.8%) | 0 (0.0%) |
| $15,000 to $17,499 | 0 (0.0%) | 39 (8.5%) |
| $17,500 to $19,999 | 28 (6.3%) | 0 (0.0%) |
| $20,000 to $22,499 | 32 (7.2%) | 31 (6.7%) |
| $22,500 to $24,999 | 22 (5.0%) | 15 (3.3%) |
| $25,000 to $29,999 | 40 (9.0%) | 9 (1.9%) |
| $30,000 to $34,999 | 24 (5.4%) | 176 (38.2%) |
| $35,000 to $39,999 | 19 (4.3%) | 39 (8.5%) |
| $40,000 to $44,999 | 31 (7.0%) | 8 (1.7%) |
| $45,000 to $49,999 | 0 (0.0%) | 19 (4.1%) |
| $50,000 to $54,999 | 0 (0.0%) | 57 (12.4%) |
| $55,000 to $64,999 | 25 (5.6%) | 0 (0.0%) |
| $65,000 to $74,999 | 27 (6.1%) | 11 (2.4%) |
| $75,000 to $99,999 | 73 (16.4%) | 0 (0.0%) |
| $100,000+ | 15 (3.4%) | 0 (0.0%) |
| Total | 444 (100.0%) | 461 (100.0%) |
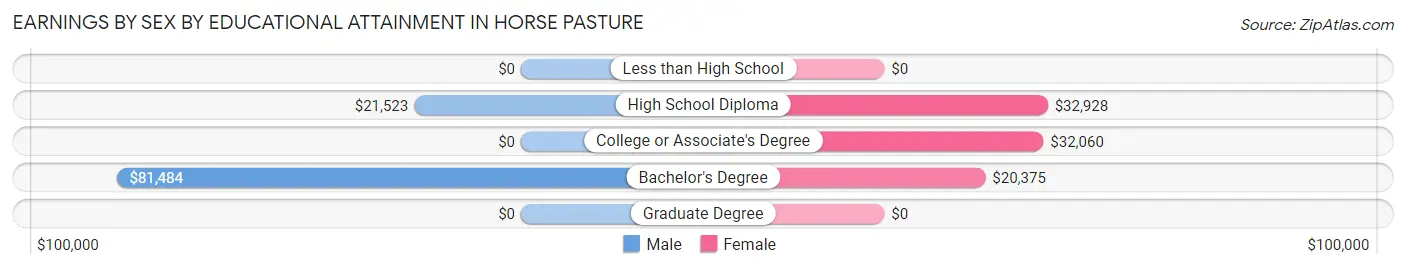
Earnings by Sex by Educational Attainment in Horse Pasture
Average earnings in Horse Pasture are $31,339 for men and $31,761 for women, a difference of 1.3%. Men with an educational attainment of bachelor's degree enjoy the highest average annual earnings of $81,484, while those with high school diploma education earn the least with $21,523. Women with an educational attainment of high school diploma earn the most with the average annual earnings of $32,928, while those with bachelor's degree education have the smallest earnings of $20,375.
| Educational Attainment | Male Income | Female Income |
| Less than High School | - | - |
| High School Diploma | $21,523 | $32,928 |
| College or Associate's Degree | - | - |
| Bachelor's Degree | $81,484 | $20,375 |
| Graduate Degree | - | - |
| Total | $31,339 | $31,761 |
Family Income in Horse Pasture
Family Income Brackets in Horse Pasture
According to the Horse Pasture family income data, there are 128 families falling into the $50,000 to $74,999 income range, which is the most common income bracket and makes up 27.0% of all families.
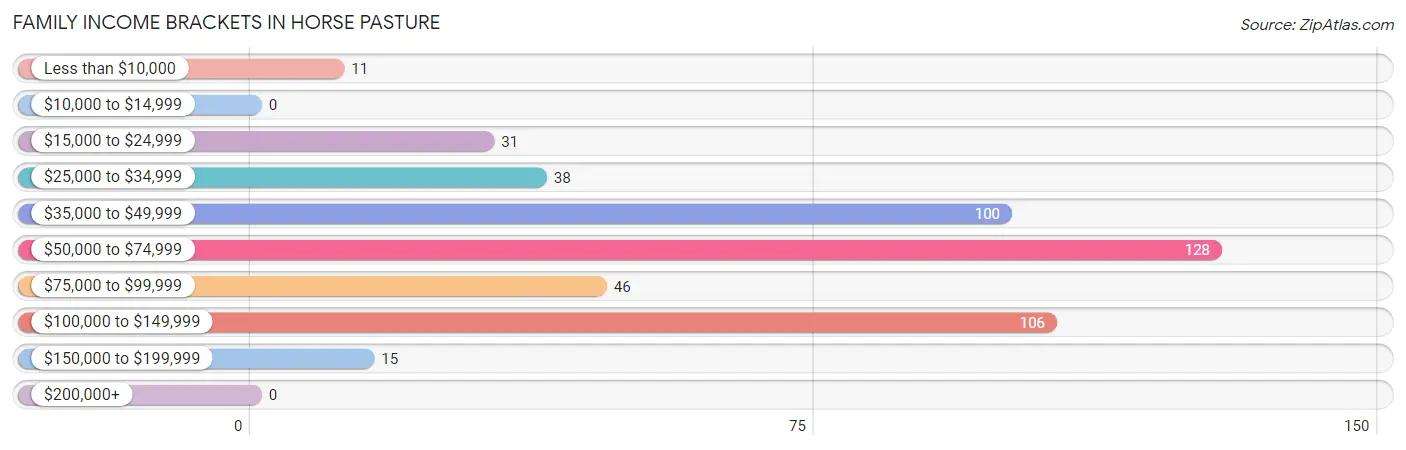
| Income Bracket | # Families | % Families |
| Less than $10,000 | 11 | 2.3% |
| $10,000 to $14,999 | 0 | 0.0% |
| $15,000 to $24,999 | 31 | 6.5% |
| $25,000 to $34,999 | 38 | 8.0% |
| $35,000 to $49,999 | 100 | 21.1% |
| $50,000 to $74,999 | 128 | 26.9% |
| $75,000 to $99,999 | 46 | 9.7% |
| $100,000 to $149,999 | 106 | 22.3% |
| $150,000 to $199,999 | 15 | 3.2% |
| $200,000+ | 0 | 0.0% |
Family Income by Famaliy Size in Horse Pasture
6-person families (71 | 14.9%) account for the highest median family income in Horse Pasture with $50,605 per family, while 2-person families (298 | 62.7%) have the highest median income of $22,084 per family member.
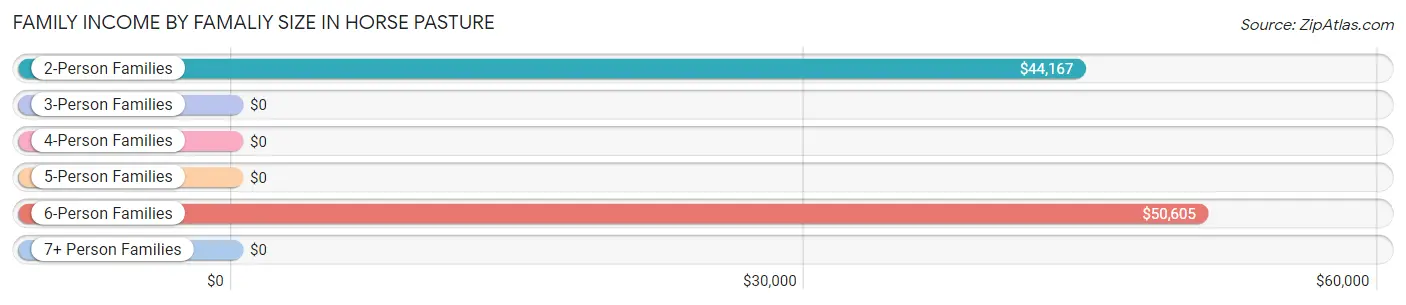
| Income Bracket | # Families | Median Income |
| 2-Person Families | 298 (62.7%) | $44,167 |
| 3-Person Families | 74 (15.6%) | $0 |
| 4-Person Families | 32 (6.7%) | $0 |
| 5-Person Families | 0 (0.0%) | $0 |
| 6-Person Families | 71 (14.9%) | $50,605 |
| 7+ Person Families | 0 (0.0%) | $0 |
| Total | 475 (100.0%) | $55,736 |
Family Income by Number of Earners in Horse Pasture
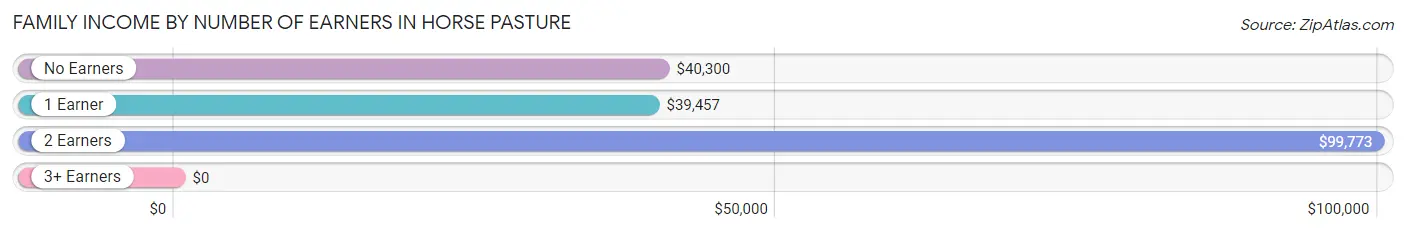
| Number of Earners | # Families | Median Income |
| No Earners | 140 (29.5%) | $40,300 |
| 1 Earner | 132 (27.8%) | $39,457 |
| 2 Earners | 192 (40.4%) | $99,773 |
| 3+ Earners | 11 (2.3%) | $0 |
| Total | 475 (100.0%) | $55,736 |
Household Income in Horse Pasture
Household Income Brackets in Horse Pasture
With 223 households falling in the category, the $50,000 to $74,999 income range is the most frequent in Horse Pasture, accounting for 25.3% of all households.
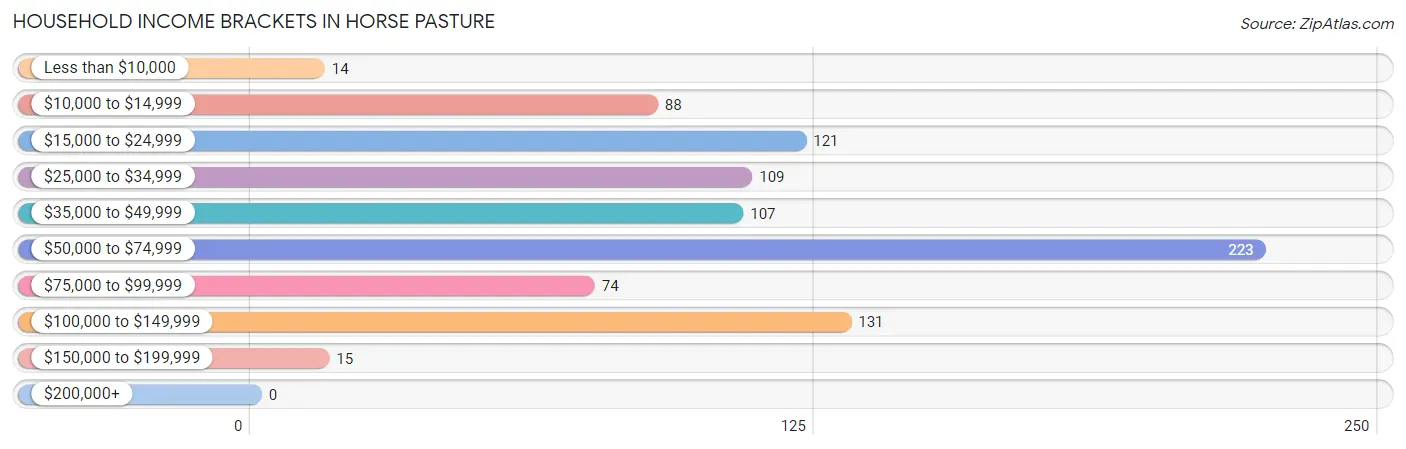
| Income Bracket | # Households | % Households |
| Less than $10,000 | 14 | 1.6% |
| $10,000 to $14,999 | 88 | 10.0% |
| $15,000 to $24,999 | 121 | 13.7% |
| $25,000 to $34,999 | 109 | 12.4% |
| $35,000 to $49,999 | 107 | 12.1% |
| $50,000 to $74,999 | 223 | 25.3% |
| $75,000 to $99,999 | 74 | 8.4% |
| $100,000 to $149,999 | 131 | 14.9% |
| $150,000 to $199,999 | 15 | 1.7% |
| $200,000+ | 0 | 0.0% |
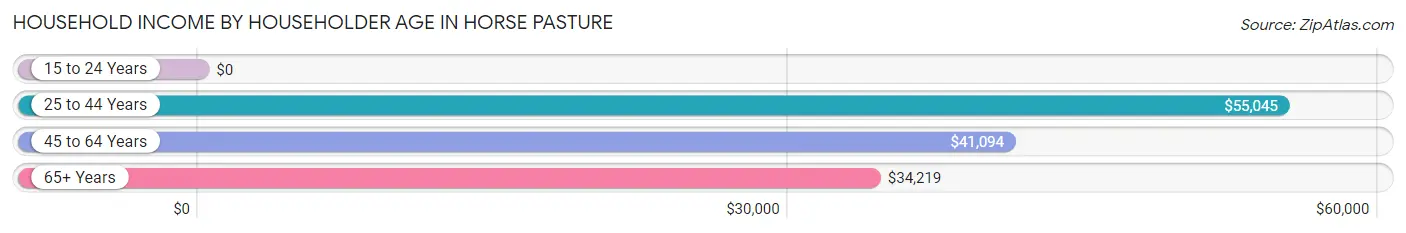
Household Income by Householder Age in Horse Pasture
The median household income in Horse Pasture is $50,094, with the highest median household income of $55,045 found in the 25 to 44 years age bracket for the primary householder. A total of 172 households (19.5%) fall into this category. Meanwhile, the 15 to 24 years age bracket for the primary householder has the lowest median household income of $0, with 50 households (5.7%) in this group.
| Income Bracket | # Households | Median Income |
| 15 to 24 Years | 50 (5.7%) | $0 |
| 25 to 44 Years | 172 (19.5%) | $55,045 |
| 45 to 64 Years | 241 (27.3%) | $41,094 |
| 65+ Years | 419 (47.5%) | $34,219 |
| Total | 882 (100.0%) | $50,094 |
Poverty in Horse Pasture
Income Below Poverty by Sex and Age in Horse Pasture
With 18.7% poverty level for males and 21.4% for females among the residents of Horse Pasture, 6 to 11 year old males and 15 year old females are the most vulnerable to poverty, with 81 males (69.2%) and 22 females (100.0%) in their respective age groups living below the poverty level.
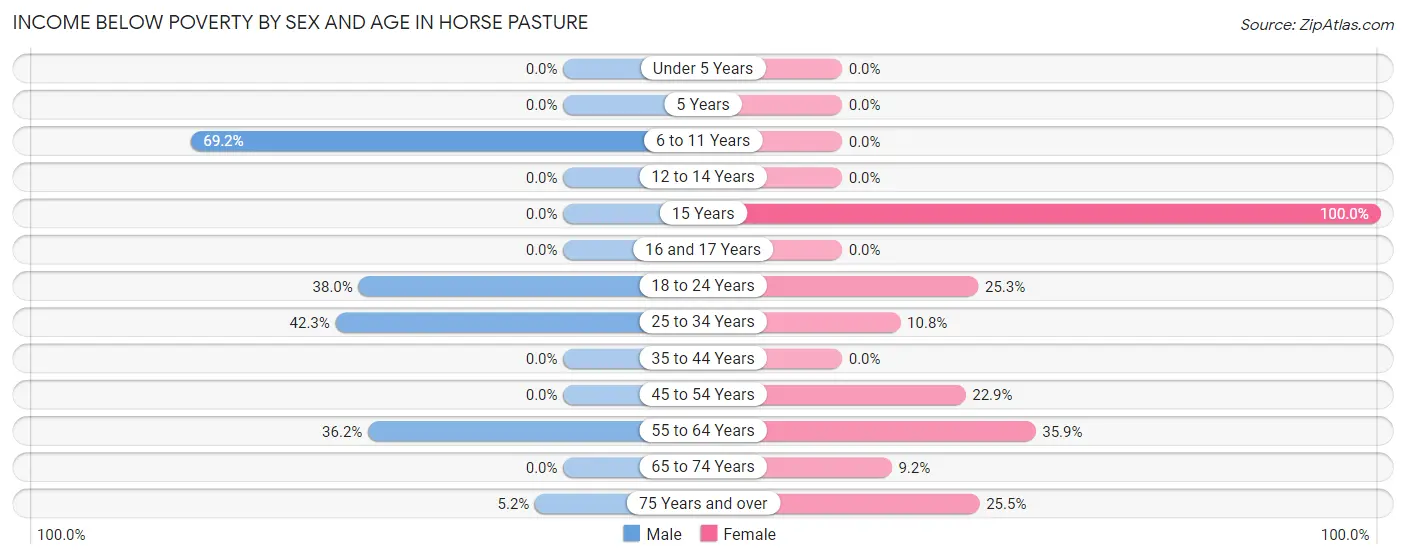
| Age Bracket | Male | Female |
| Under 5 Years | 0 (0.0%) | 0 (0.0%) |
| 5 Years | 0 (0.0%) | 0 (0.0%) |
| 6 to 11 Years | 81 (69.2%) | 0 (0.0%) |
| 12 to 14 Years | 0 (0.0%) | 0 (0.0%) |
| 15 Years | 0 (0.0%) | 22 (100.0%) |
| 16 and 17 Years | 0 (0.0%) | 0 (0.0%) |
| 18 to 24 Years | 19 (38.0%) | 22 (25.3%) |
| 25 to 34 Years | 41 (42.3%) | 17 (10.8%) |
| 35 to 44 Years | 0 (0.0%) | 0 (0.0%) |
| 45 to 54 Years | 0 (0.0%) | 11 (22.9%) |
| 55 to 64 Years | 50 (36.2%) | 93 (35.9%) |
| 65 to 74 Years | 0 (0.0%) | 19 (9.2%) |
| 75 Years and over | 9 (5.2%) | 50 (25.5%) |
| Total | 200 (18.7%) | 234 (21.4%) |
Income Above Poverty by Sex and Age in Horse Pasture
According to the poverty statistics in Horse Pasture, males aged under 5 years and females aged under 5 years are the age groups that are most secure financially, with 100.0% of males and 100.0% of females in these age groups living above the poverty line.
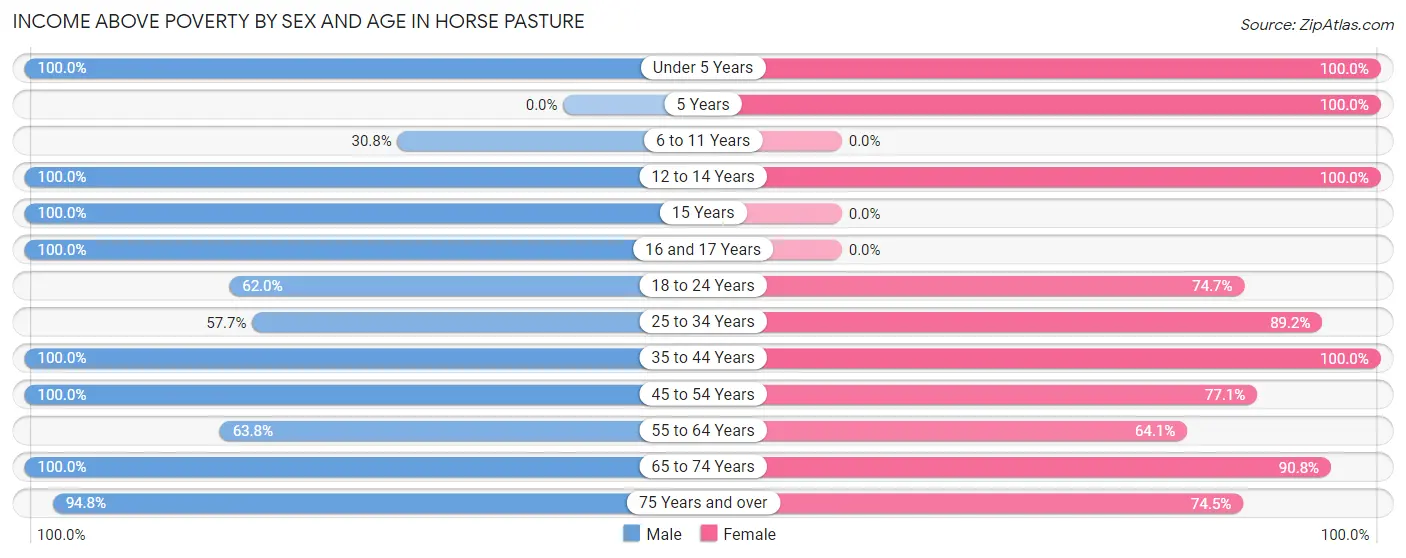
| Age Bracket | Male | Female |
| Under 5 Years | 47 (100.0%) | 87 (100.0%) |
| 5 Years | 0 (0.0%) | 11 (100.0%) |
| 6 to 11 Years | 36 (30.8%) | 0 (0.0%) |
| 12 to 14 Years | 72 (100.0%) | 11 (100.0%) |
| 15 Years | 30 (100.0%) | 0 (0.0%) |
| 16 and 17 Years | 2 (100.0%) | 0 (0.0%) |
| 18 to 24 Years | 31 (62.0%) | 65 (74.7%) |
| 25 to 34 Years | 56 (57.7%) | 140 (89.2%) |
| 35 to 44 Years | 117 (100.0%) | 11 (100.0%) |
| 45 to 54 Years | 101 (100.0%) | 37 (77.1%) |
| 55 to 64 Years | 88 (63.8%) | 166 (64.1%) |
| 65 to 74 Years | 124 (100.0%) | 187 (90.8%) |
| 75 Years and over | 163 (94.8%) | 146 (74.5%) |
| Total | 867 (81.3%) | 861 (78.6%) |
Income Below Poverty Among Married-Couple Families in Horse Pasture
The poverty statistics for married-couple families in Horse Pasture show that 7.5% or 28 of the total 374 families live below the poverty line. Families with 3 or 4 children have the highest poverty rate of 100.0%, comprising of 28 families. On the other hand, families with no children have the lowest poverty rate of 0.0%, which includes 0 families.
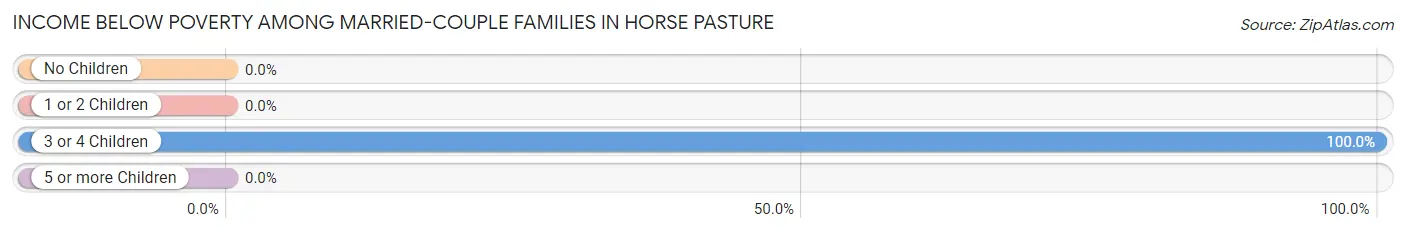
| Children | Above Poverty | Below Poverty |
| No Children | 260 (100.0%) | 0 (0.0%) |
| 1 or 2 Children | 86 (100.0%) | 0 (0.0%) |
| 3 or 4 Children | 0 (0.0%) | 28 (100.0%) |
| 5 or more Children | 0 (0.0%) | 0 (0.0%) |
| Total | 346 (92.5%) | 28 (7.5%) |
Income Below Poverty Among Single-Parent Households in Horse Pasture
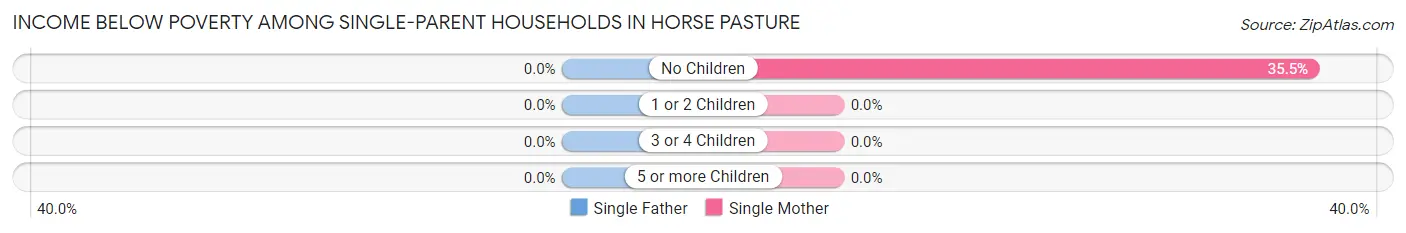
| Children | Single Father | Single Mother |
| No Children | 0 (0.0%) | 11 (35.5%) |
| 1 or 2 Children | 0 (0.0%) | 0 (0.0%) |
| 3 or 4 Children | 0 (0.0%) | 0 (0.0%) |
| 5 or more Children | 0 (0.0%) | 0 (0.0%) |
| Total | 0 (0.0%) | 11 (17.7%) |
Income Below Poverty Among Married-Couple vs Single-Parent Households in Horse Pasture
The poverty data for Horse Pasture shows that 28 of the married-couple family households (7.5%) and 11 of the single-parent households (10.9%) are living below the poverty level. Within the married-couple family households, those with 3 or 4 children have the highest poverty rate, with 28 households (100.0%) falling below the poverty line. Among the single-parent households, those with no children have the highest poverty rate, with 11 household (16.9%) living below poverty.
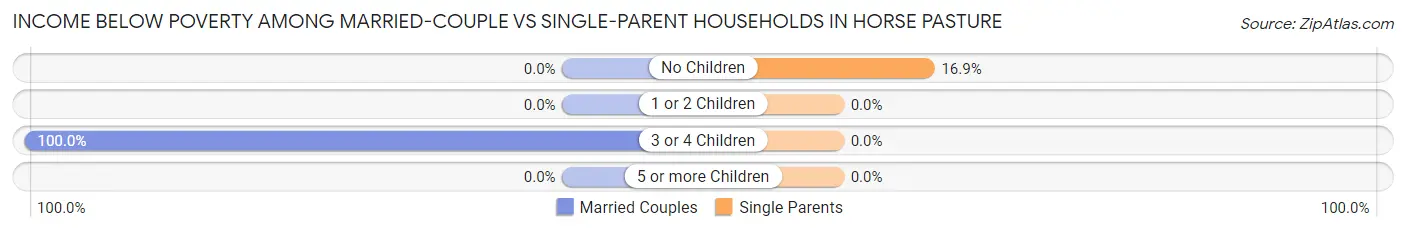
| Children | Married-Couple Families | Single-Parent Households |
| No Children | 0 (0.0%) | 11 (16.9%) |
| 1 or 2 Children | 0 (0.0%) | 0 (0.0%) |
| 3 or 4 Children | 28 (100.0%) | 0 (0.0%) |
| 5 or more Children | 0 (0.0%) | 0 (0.0%) |
| Total | 28 (7.5%) | 11 (10.9%) |
Race in Horse Pasture
The most populous races in Horse Pasture are White / Caucasian (1,610 | 70.3%), Black / African American (603 | 26.3%), and Hispanic or Latino (64 | 2.8%).
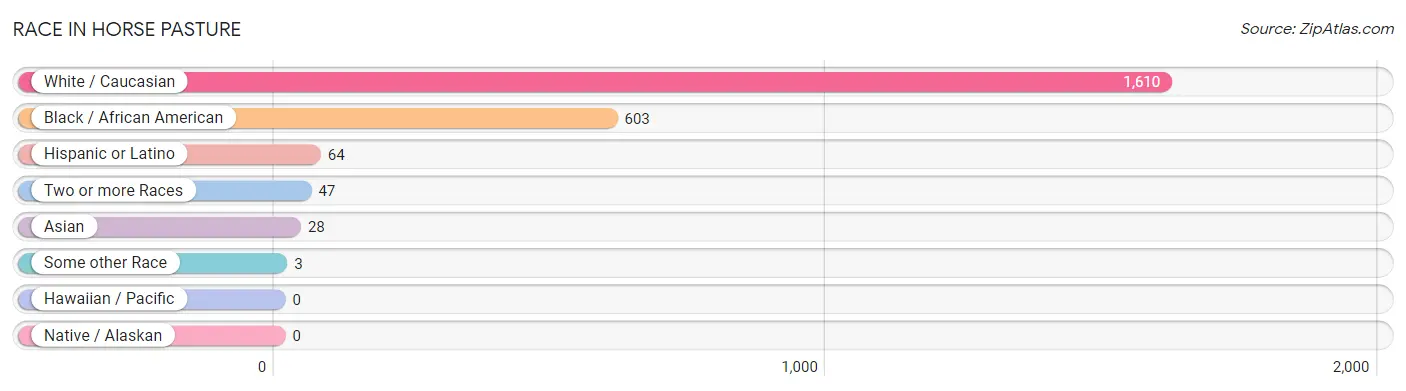
| Race | # Population | % Population |
| Asian | 28 | 1.2% |
| Black / African American | 603 | 26.3% |
| Hawaiian / Pacific | 0 | 0.0% |
| Hispanic or Latino | 64 | 2.8% |
| Native / Alaskan | 0 | 0.0% |
| White / Caucasian | 1,610 | 70.3% |
| Two or more Races | 47 | 2.1% |
| Some other Race | 3 | 0.1% |
| Total | 2,291 | 100.0% |
Ancestry in Horse Pasture
The most populous ancestries reported in Horse Pasture are American (859 | 37.5%), English (174 | 7.6%), Irish (119 | 5.2%), Scotch-Irish (117 | 5.1%), and Italian (101 | 4.4%), together accounting for 59.8% of all Horse Pasture residents.
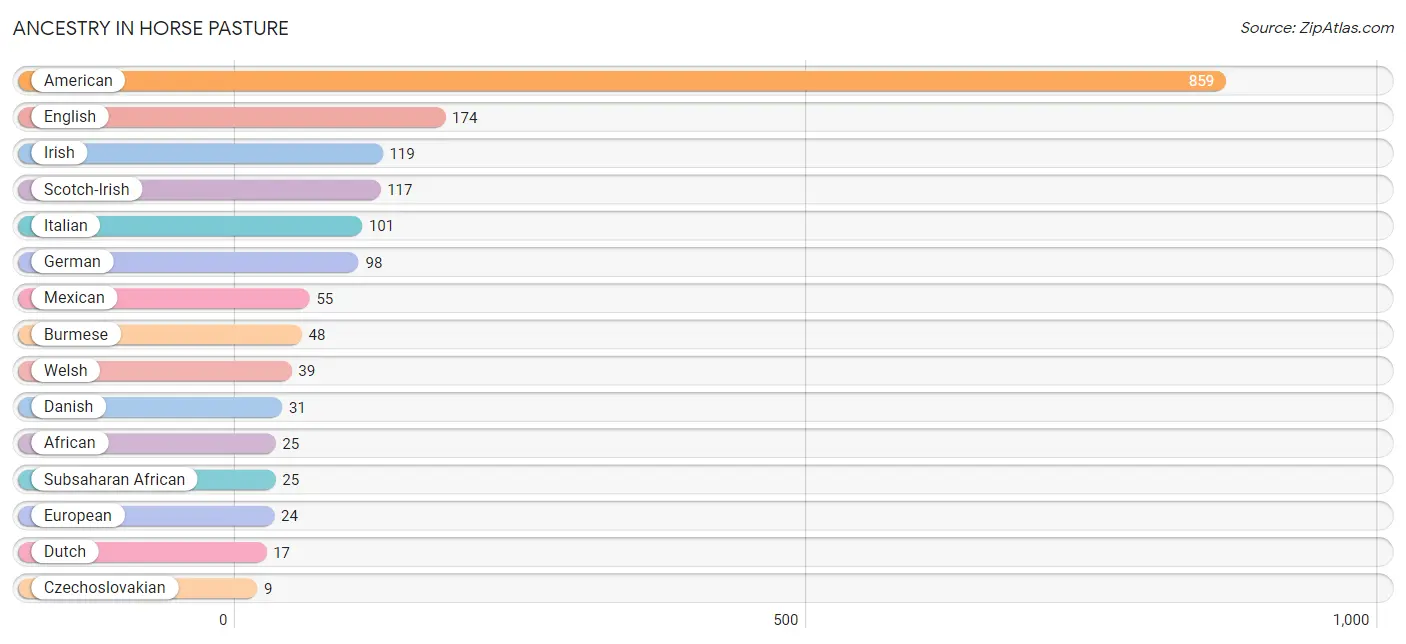
| Ancestry | # Population | % Population |
| African | 25 | 1.1% |
| American | 859 | 37.5% |
| Barbadian | 5 | 0.2% |
| Burmese | 48 | 2.1% |
| Cuban | 3 | 0.1% |
| Czechoslovakian | 9 | 0.4% |
| Danish | 31 | 1.3% |
| Dutch | 17 | 0.7% |
| English | 174 | 7.6% |
| European | 24 | 1.1% |
| French | 7 | 0.3% |
| German | 98 | 4.3% |
| Irish | 119 | 5.2% |
| Italian | 101 | 4.4% |
| Mexican | 55 | 2.4% |
| Polish | 7 | 0.3% |
| Puerto Rican | 6 | 0.3% |
| Russian | 7 | 0.3% |
| Scotch-Irish | 117 | 5.1% |
| Subsaharan African | 25 | 1.1% |
| Welsh | 39 | 1.7% | View All 21 Rows |
Immigrants in Horse Pasture
The most numerous immigrant groups reported in Horse Pasture came from Asia (28 | 1.2%), Eastern Asia (28 | 1.2%), Europe (28 | 1.2%), Korea (28 | 1.2%), and Western Europe (28 | 1.2%), together accounting for 6.1% of all Horse Pasture residents.
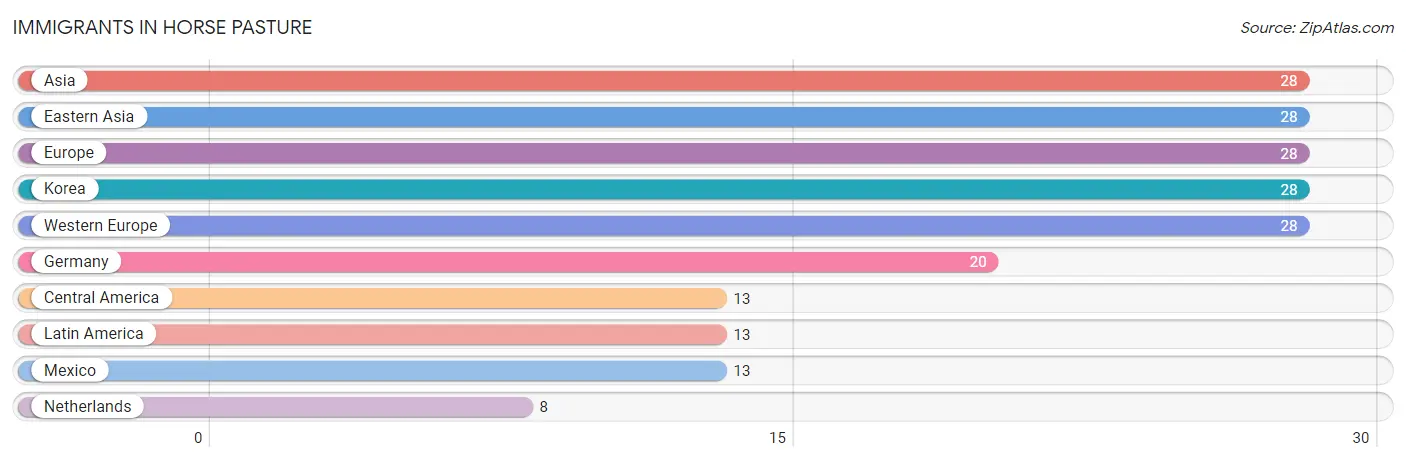
| Immigration Origin | # Population | % Population |
| Asia | 28 | 1.2% |
| Central America | 13 | 0.6% |
| Eastern Asia | 28 | 1.2% |
| Europe | 28 | 1.2% |
| Germany | 20 | 0.9% |
| Korea | 28 | 1.2% |
| Latin America | 13 | 0.6% |
| Mexico | 13 | 0.6% |
| Netherlands | 8 | 0.4% |
| Western Europe | 28 | 1.2% | View All 10 Rows |
Sex and Age in Horse Pasture
Sex and Age in Horse Pasture
The most populous age groups in Horse Pasture are 10 to 14 Years (147 | 12.3%) for men and 55 to 59 Years (165 | 15.1%) for women.
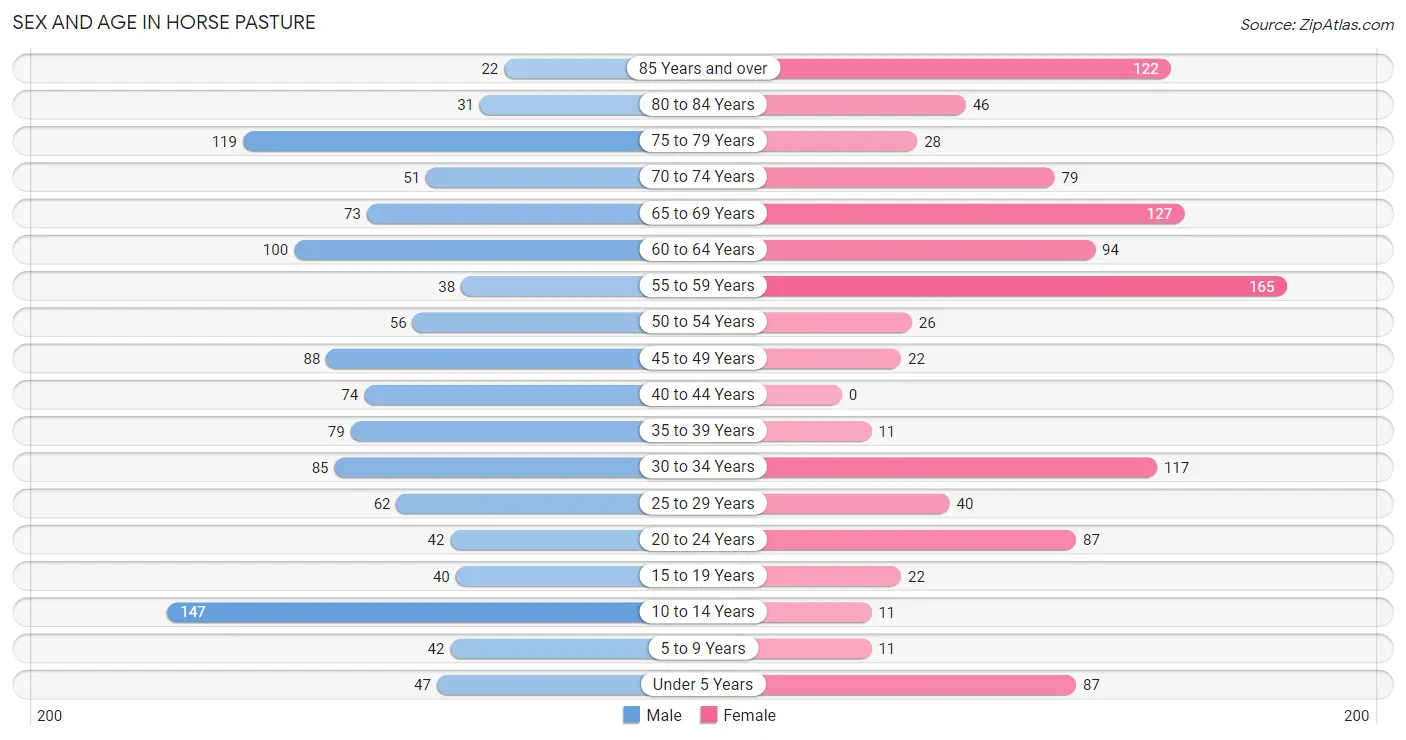
| Age Bracket | Male | Female |
| Under 5 Years | 47 (3.9%) | 87 (8.0%) |
| 5 to 9 Years | 42 (3.5%) | 11 (1.0%) |
| 10 to 14 Years | 147 (12.3%) | 11 (1.0%) |
| 15 to 19 Years | 40 (3.3%) | 22 (2.0%) |
| 20 to 24 Years | 42 (3.5%) | 87 (8.0%) |
| 25 to 29 Years | 62 (5.2%) | 40 (3.6%) |
| 30 to 34 Years | 85 (7.1%) | 117 (10.7%) |
| 35 to 39 Years | 79 (6.6%) | 11 (1.0%) |
| 40 to 44 Years | 74 (6.2%) | 0 (0.0%) |
| 45 to 49 Years | 88 (7.4%) | 22 (2.0%) |
| 50 to 54 Years | 56 (4.7%) | 26 (2.4%) |
| 55 to 59 Years | 38 (3.2%) | 165 (15.1%) |
| 60 to 64 Years | 100 (8.4%) | 94 (8.6%) |
| 65 to 69 Years | 73 (6.1%) | 127 (11.6%) |
| 70 to 74 Years | 51 (4.3%) | 79 (7.2%) |
| 75 to 79 Years | 119 (10.0%) | 28 (2.6%) |
| 80 to 84 Years | 31 (2.6%) | 46 (4.2%) |
| 85 Years and over | 22 (1.8%) | 122 (11.1%) |
| Total | 1,196 (100.0%) | 1,095 (100.0%) |
Families and Households in Horse Pasture
Median Family Size in Horse Pasture
The median family size in Horse Pasture is 3.34 persons per family, with single female/mother families (62 | 13.1%) accounting for the largest median family size of 5.48 persons per family. On the other hand, single male/father families (39 | 8.2%) represent the smallest median family size with 2.33 persons per family.
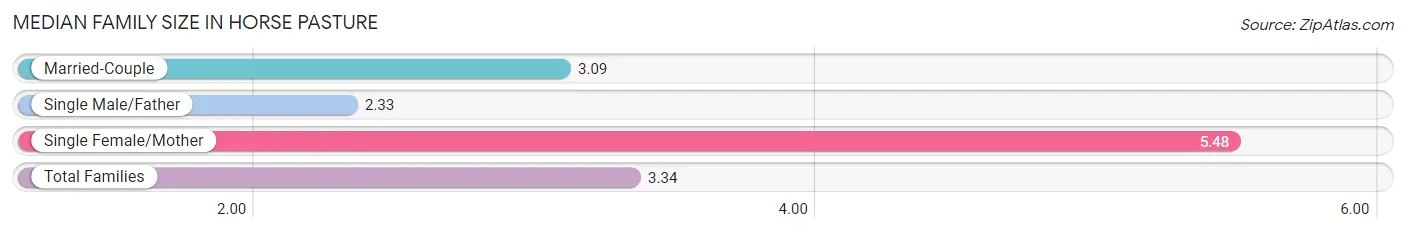
| Family Type | # Families | Family Size |
| Married-Couple | 374 (78.7%) | 3.09 |
| Single Male/Father | 39 (8.2%) | 2.33 |
| Single Female/Mother | 62 (13.1%) | 5.48 |
| Total Families | 475 (100.0%) | 3.34 |
Median Household Size in Horse Pasture
The median household size in Horse Pasture is 2.45 persons per household, with single female/mother households (62 | 7.0%) accounting for the largest median household size of 5.76 persons per household. non-family households (407 | 46.2%) represent the smallest median household size with 1.29 persons per household.
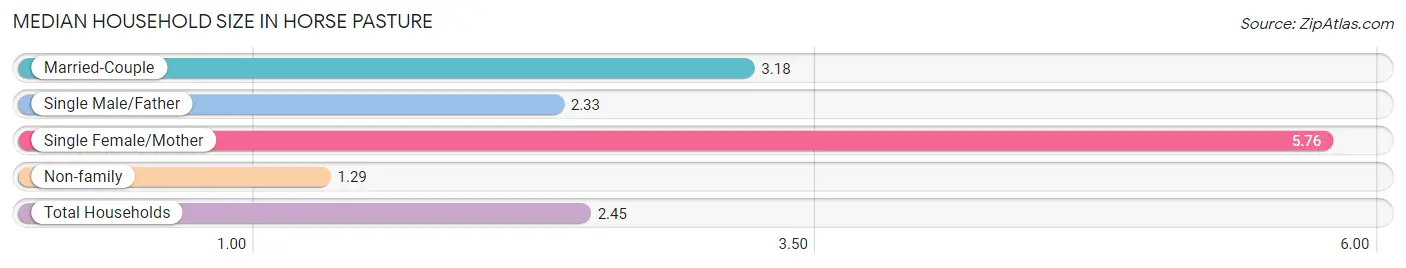
| Household Type | # Households | Household Size |
| Married-Couple | 374 (42.4%) | 3.18 |
| Single Male/Father | 39 (4.4%) | 2.33 |
| Single Female/Mother | 62 (7.0%) | 5.76 |
| Non-family | 407 (46.2%) | 1.29 |
| Total Households | 882 (100.0%) | 2.45 |
Household Size by Marriage Status in Horse Pasture
Out of a total of 882 households in Horse Pasture, 475 (53.8%) are family households, while 407 (46.2%) are nonfamily households. The most numerous type of family households are 2-person households, comprising 275, and the most common type of nonfamily households are 1-person households, comprising 271.
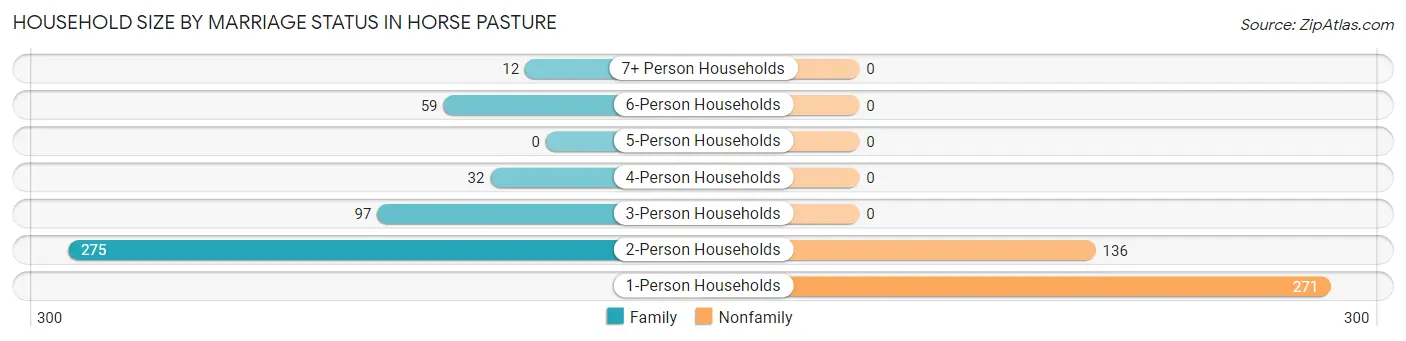
| Household Size | Family Households | Nonfamily Households |
| 1-Person Households | - | 271 (30.7%) |
| 2-Person Households | 275 (31.2%) | 136 (15.4%) |
| 3-Person Households | 97 (11.0%) | 0 (0.0%) |
| 4-Person Households | 32 (3.6%) | 0 (0.0%) |
| 5-Person Households | 0 (0.0%) | 0 (0.0%) |
| 6-Person Households | 59 (6.7%) | 0 (0.0%) |
| 7+ Person Households | 12 (1.4%) | 0 (0.0%) |
| Total | 475 (53.8%) | 407 (46.2%) |
Female Fertility in Horse Pasture
Fertility by Age in Horse Pasture
Average fertility rate in Horse Pasture is 50.0 births per 1,000 women. Women in the age bracket of 20 to 34 years have the highest fertility rate with 61.0 births per 1,000 women. Women in the age bracket of 20 to 34 years acount for 100.0% of all women with births.
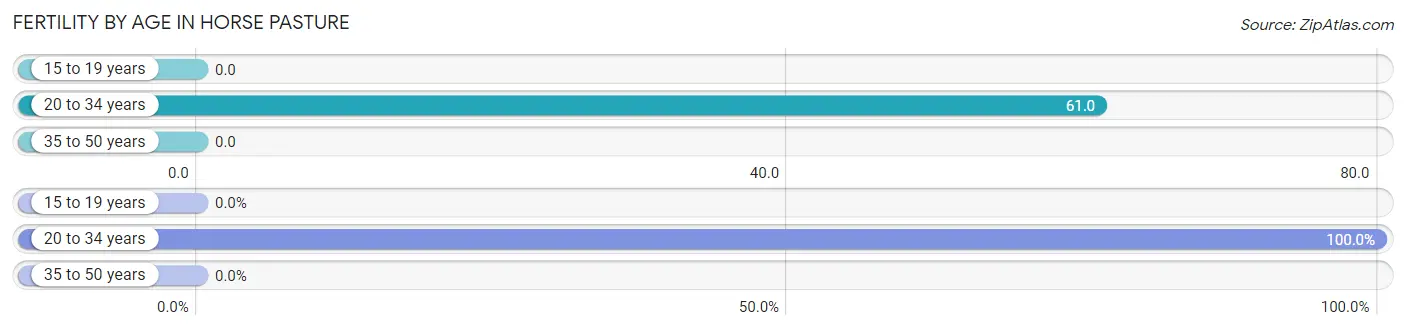
| Age Bracket | Women with Births | Births / 1,000 Women |
| 15 to 19 years | 0 (0.0%) | 0.0 |
| 20 to 34 years | 15 (100.0%) | 61.0 |
| 35 to 50 years | 0 (0.0%) | 0.0 |
| Total | 15 (100.0%) | 50.0 |
Fertility by Age by Marriage Status in Horse Pasture
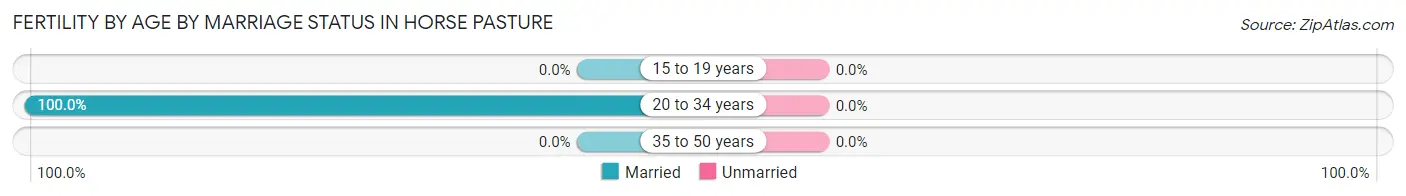
| Age Bracket | Married | Unmarried |
| 15 to 19 years | 0 (0.0%) | 0 (0.0%) |
| 20 to 34 years | 15 (100.0%) | 0 (0.0%) |
| 35 to 50 years | 0 (0.0%) | 0 (0.0%) |
| Total | 15 (100.0%) | 0 (0.0%) |
Fertility by Education in Horse Pasture
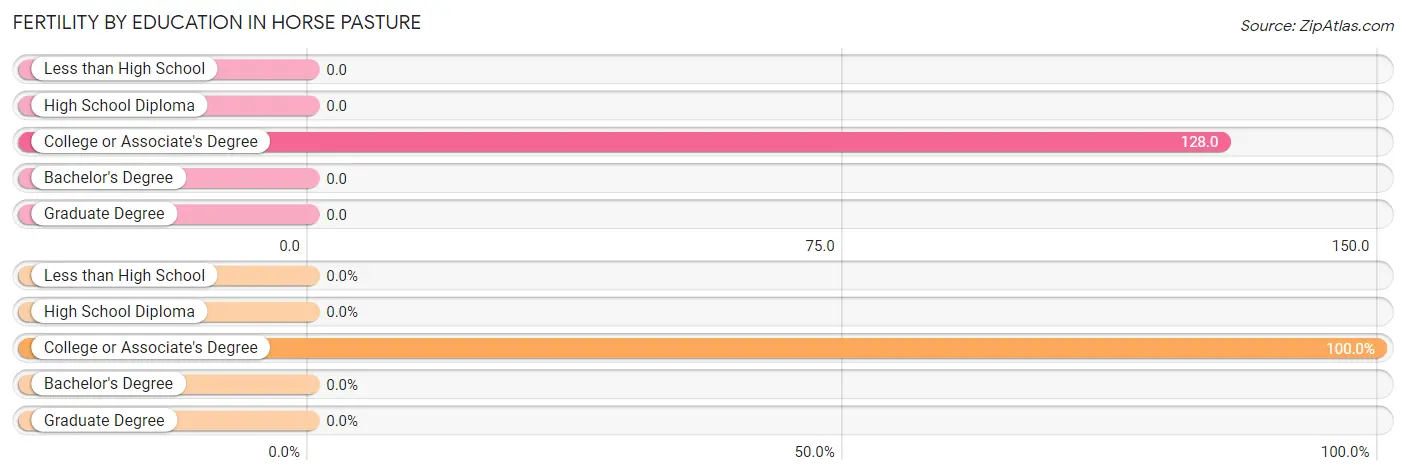
| Educational Attainment | Women with Births | Births / 1,000 Women |
| Less than High School | 0 (0.0%) | 0.0 |
| High School Diploma | 0 (0.0%) | 0.0 |
| College or Associate's Degree | 15 (100.0%) | 128.0 |
| Bachelor's Degree | 0 (0.0%) | 0.0 |
| Graduate Degree | 0 (0.0%) | 0.0 |
| Total | 15 (100.0%) | 50.0 |
Fertility by Education by Marriage Status in Horse Pasture
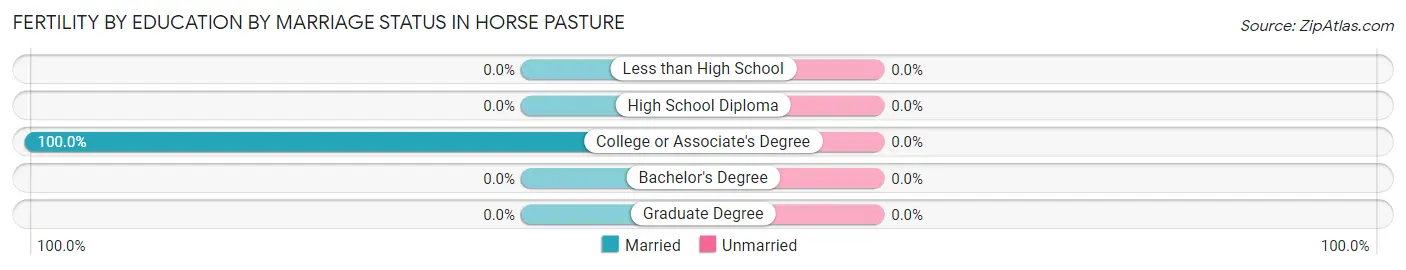
| Educational Attainment | Married | Unmarried |
| Less than High School | 0 (0.0%) | 0 (0.0%) |
| High School Diploma | 0 (0.0%) | 0 (0.0%) |
| College or Associate's Degree | 15 (100.0%) | 0 (0.0%) |
| Bachelor's Degree | 0 (0.0%) | 0 (0.0%) |
| Graduate Degree | 0 (0.0%) | 0 (0.0%) |
| Total | 15 (100.0%) | 0 (0.0%) |
Employment Characteristics in Horse Pasture
Employment by Class of Employer in Horse Pasture
Among the 713 employed individuals in Horse Pasture, private company employees (495 | 69.4%), self-employed (not incorporated) (92 | 12.9%), and local government employees (43 | 6.0%) make up the most common classes of employment.
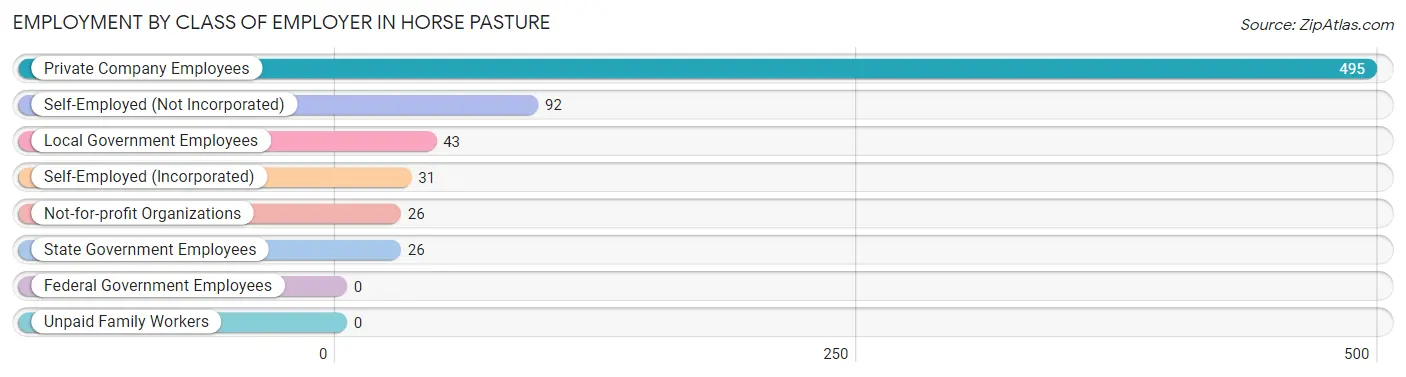
| Employer Class | # Employees | % Employees |
| Private Company Employees | 495 | 69.4% |
| Self-Employed (Incorporated) | 31 | 4.3% |
| Self-Employed (Not Incorporated) | 92 | 12.9% |
| Not-for-profit Organizations | 26 | 3.6% |
| Local Government Employees | 43 | 6.0% |
| State Government Employees | 26 | 3.6% |
| Federal Government Employees | 0 | 0.0% |
| Unpaid Family Workers | 0 | 0.0% |
| Total | 713 | 100.0% |
Employment Status by Age in Horse Pasture
According to the labor force statistics for Horse Pasture, out of the total population over 16 years of age (1,894), 41.8% or 792 individuals are in the labor force, with 4.3% or 34 of them unemployed. The age group with the highest labor force participation rate is 25 to 29 years, with 81.4% or 83 individuals in the labor force. Within the labor force, the 65 to 74 years age range has the highest percentage of unemployed individuals, with 18.9% or 7 of them being unemployed.
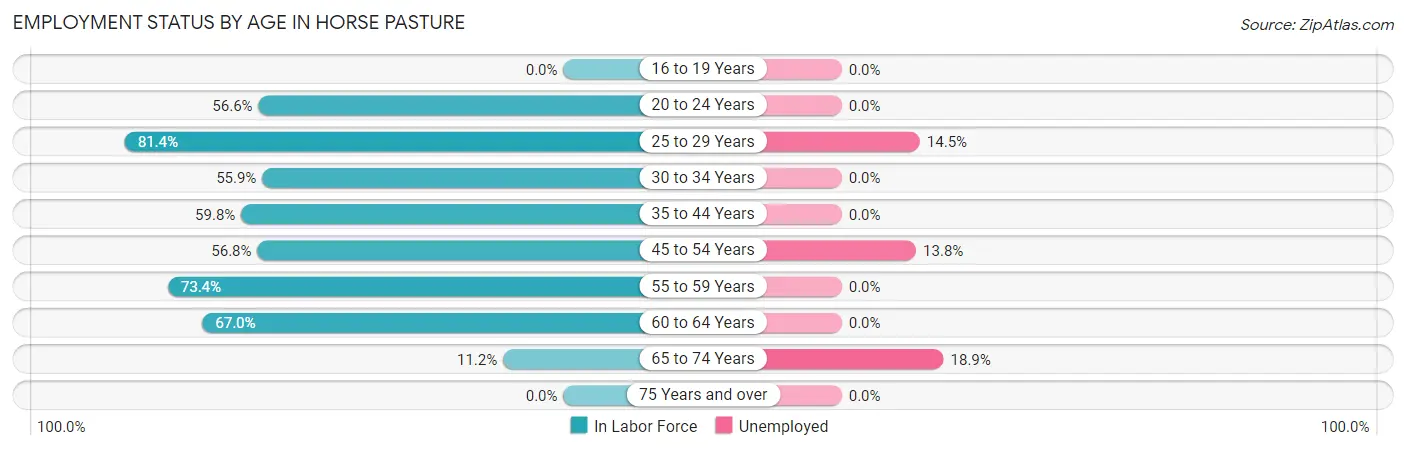
| Age Bracket | In Labor Force | Unemployed |
| 16 to 19 Years | 0 (0.0%) | 0 (0.0%) |
| 20 to 24 Years | 73 (56.6%) | 0 (0.0%) |
| 25 to 29 Years | 83 (81.4%) | 12 (14.5%) |
| 30 to 34 Years | 113 (55.9%) | 0 (0.0%) |
| 35 to 44 Years | 98 (59.8%) | 0 (0.0%) |
| 45 to 54 Years | 109 (56.8%) | 15 (13.8%) |
| 55 to 59 Years | 149 (73.4%) | 0 (0.0%) |
| 60 to 64 Years | 130 (67.0%) | 0 (0.0%) |
| 65 to 74 Years | 37 (11.2%) | 7 (18.9%) |
| 75 Years and over | 0 (0.0%) | 0 (0.0%) |
| Total | 792 (41.8%) | 34 (4.3%) |
Employment Status by Educational Attainment in Horse Pasture
According to labor force statistics for Horse Pasture, 64.5% of individuals (682) out of the total population between 25 and 64 years of age (1,057) are in the labor force, with 4.0% or 27 of them being unemployed. The group with the highest labor force participation rate are those with the educational attainment of bachelor's degree or higher, with 86.0% or 178 individuals in the labor force. Within the labor force, individuals with high school diploma education have the highest percentage of unemployment, with 7.7% or 15 of them being unemployed.
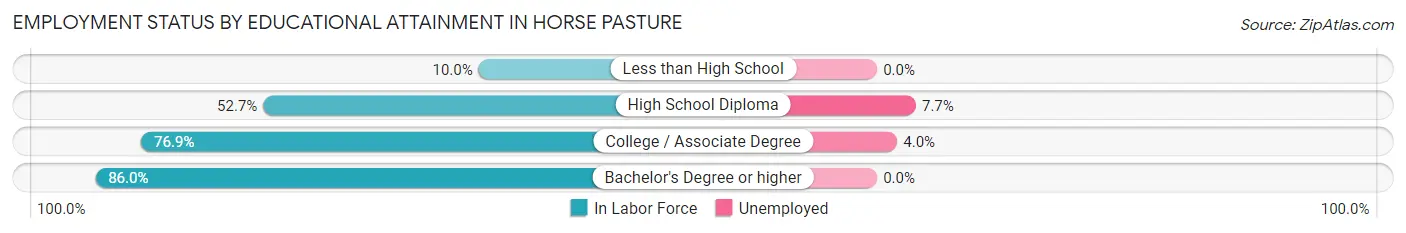
| Educational Attainment | In Labor Force | Unemployed |
| Less than High School | 9 (10.0%) | 0 (0.0%) |
| High School Diploma | 195 (52.7%) | 28 (7.7%) |
| College / Associate Degree | 300 (76.9%) | 16 (4.0%) |
| Bachelor's Degree or higher | 178 (86.0%) | 0 (0.0%) |
| Total | 682 (64.5%) | 42 (4.0%) |
Employment Occupations by Sex in Horse Pasture
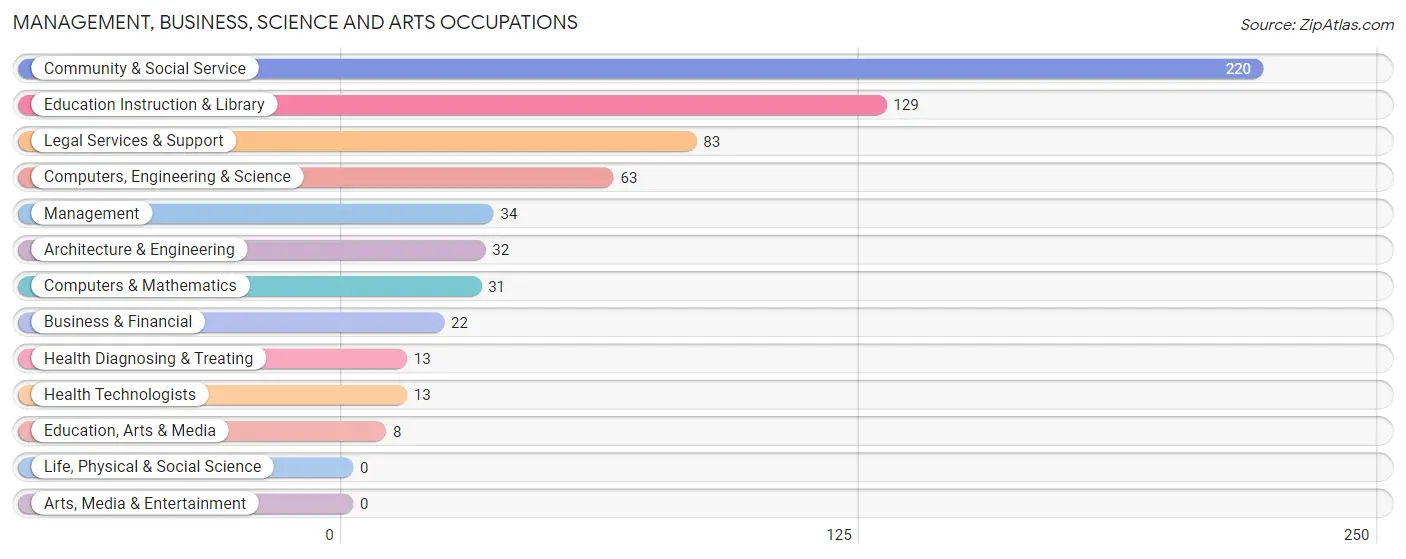
Management, Business, Science and Arts Occupations
The most common Management, Business, Science and Arts occupations in Horse Pasture are Community & Social Service (220 | 29.0%), Education Instruction & Library (129 | 17.0%), Legal Services & Support (83 | 11.0%), Computers, Engineering & Science (63 | 8.3%), and Management (34 | 4.5%).
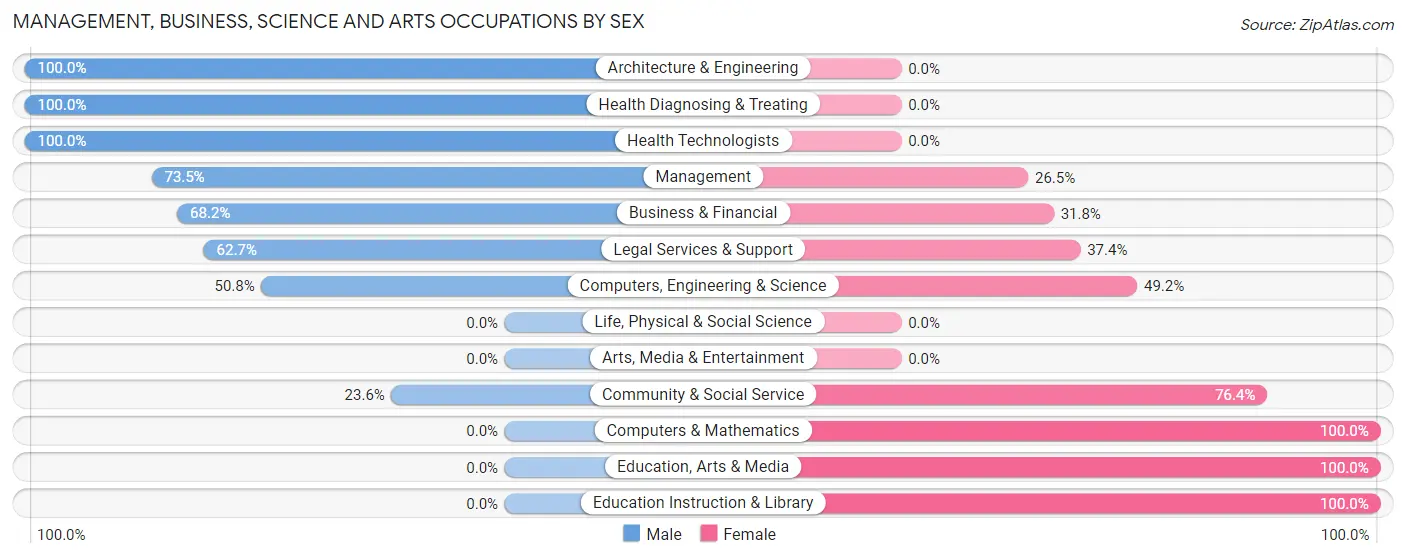
Management, Business, Science and Arts Occupations by Sex
Within the Management, Business, Science and Arts occupations in Horse Pasture, the most male-oriented occupations are Architecture & Engineering (100.0%), Health Diagnosing & Treating (100.0%), and Health Technologists (100.0%), while the most female-oriented occupations are Computers & Mathematics (100.0%), Education, Arts & Media (100.0%), and Education Instruction & Library (100.0%).
| Occupation | Male | Female |
| Management | 25 (73.5%) | 9 (26.5%) |
| Business & Financial | 15 (68.2%) | 7 (31.8%) |
| Computers, Engineering & Science | 32 (50.8%) | 31 (49.2%) |
| Computers & Mathematics | 0 (0.0%) | 31 (100.0%) |
| Architecture & Engineering | 32 (100.0%) | 0 (0.0%) |
| Life, Physical & Social Science | 0 (0.0%) | 0 (0.0%) |
| Community & Social Service | 52 (23.6%) | 168 (76.4%) |
| Education, Arts & Media | 0 (0.0%) | 8 (100.0%) |
| Legal Services & Support | 52 (62.6%) | 31 (37.3%) |
| Education Instruction & Library | 0 (0.0%) | 129 (100.0%) |
| Arts, Media & Entertainment | 0 (0.0%) | 0 (0.0%) |
| Health Diagnosing & Treating | 13 (100.0%) | 0 (0.0%) |
| Health Technologists | 13 (100.0%) | 0 (0.0%) |
| Total (Category) | 137 (38.9%) | 215 (61.1%) |
| Total (Overall) | 312 (41.2%) | 446 (58.8%) |
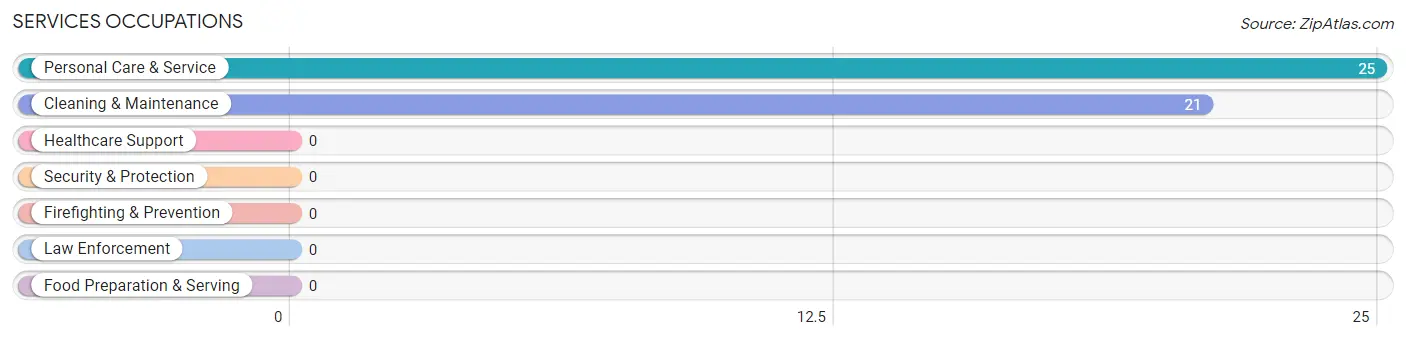
Services Occupations
The most common Services occupations in Horse Pasture are Personal Care & Service (25 | 3.3%), and Cleaning & Maintenance (21 | 2.8%).
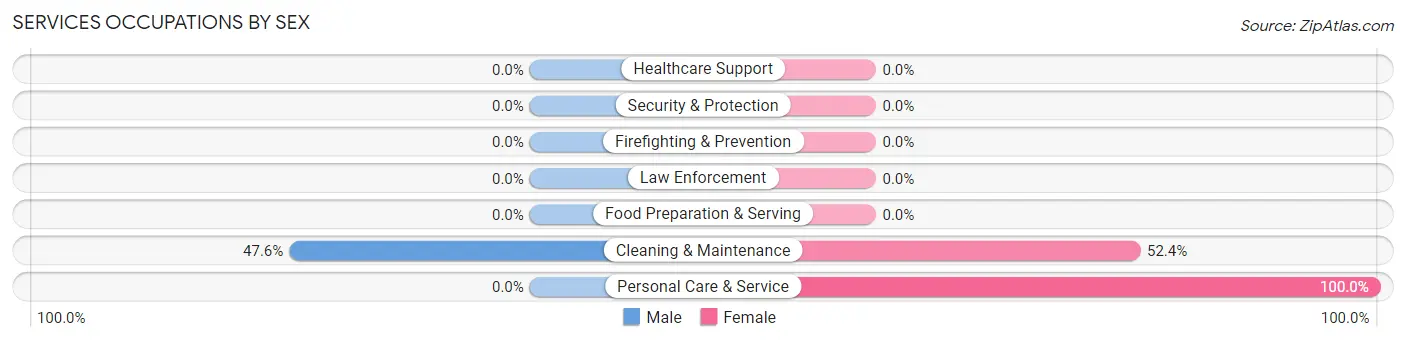
Services Occupations by Sex
| Occupation | Male | Female |
| Healthcare Support | 0 (0.0%) | 0 (0.0%) |
| Security & Protection | 0 (0.0%) | 0 (0.0%) |
| Firefighting & Prevention | 0 (0.0%) | 0 (0.0%) |
| Law Enforcement | 0 (0.0%) | 0 (0.0%) |
| Food Preparation & Serving | 0 (0.0%) | 0 (0.0%) |
| Cleaning & Maintenance | 10 (47.6%) | 11 (52.4%) |
| Personal Care & Service | 0 (0.0%) | 25 (100.0%) |
| Total (Category) | 10 (21.7%) | 36 (78.3%) |
| Total (Overall) | 312 (41.2%) | 446 (58.8%) |
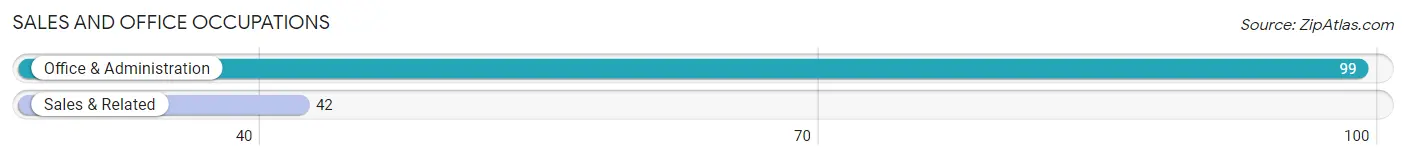
Sales and Office Occupations
The most common Sales and Office occupations in Horse Pasture are Office & Administration (99 | 13.1%), and Sales & Related (42 | 5.5%).
Sales and Office Occupations by Sex
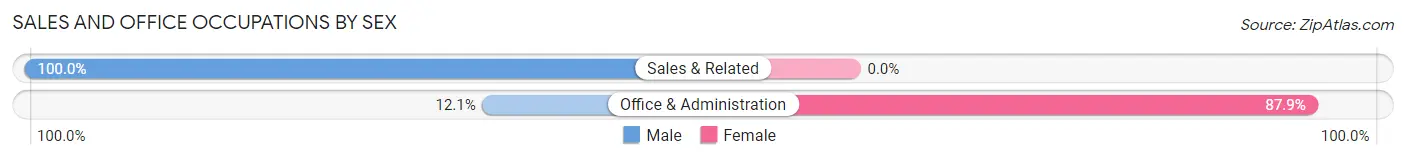
| Occupation | Male | Female |
| Sales & Related | 42 (100.0%) | 0 (0.0%) |
| Office & Administration | 12 (12.1%) | 87 (87.9%) |
| Total (Category) | 54 (38.3%) | 87 (61.7%) |
| Total (Overall) | 312 (41.2%) | 446 (58.8%) |
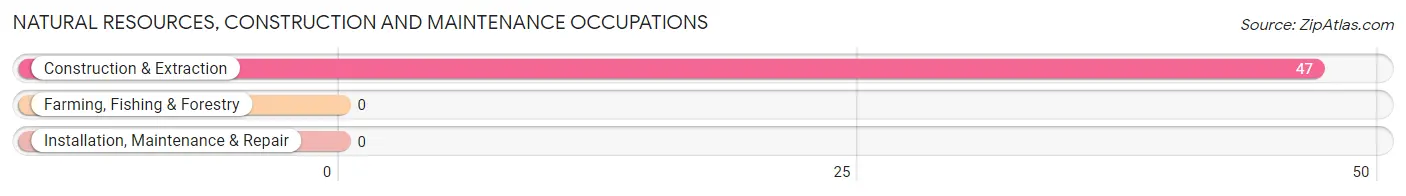
Natural Resources, Construction and Maintenance Occupations
The most common Natural Resources, Construction and Maintenance occupations in Horse Pasture are , and Construction & Extraction (47 | 6.2%).
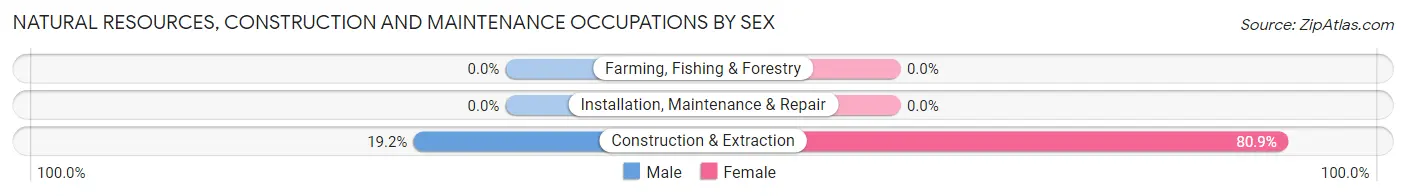
Natural Resources, Construction and Maintenance Occupations by Sex
| Occupation | Male | Female |
| Farming, Fishing & Forestry | 0 (0.0%) | 0 (0.0%) |
| Construction & Extraction | 9 (19.2%) | 38 (80.8%) |
| Installation, Maintenance & Repair | 0 (0.0%) | 0 (0.0%) |
| Total (Category) | 9 (19.2%) | 38 (80.8%) |
| Total (Overall) | 312 (41.2%) | 446 (58.8%) |
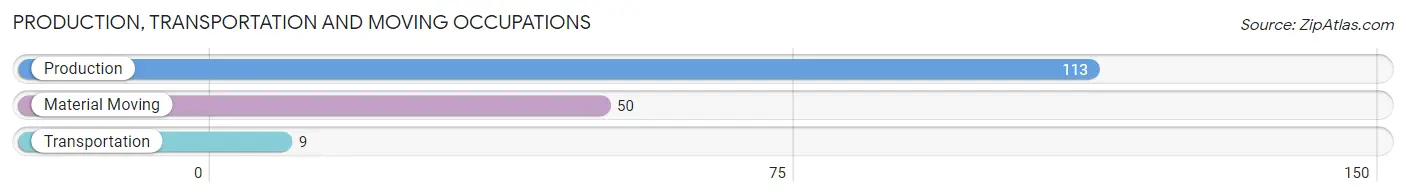
Production, Transportation and Moving Occupations
The most common Production, Transportation and Moving occupations in Horse Pasture are Production (113 | 14.9%), Material Moving (50 | 6.6%), and Transportation (9 | 1.2%).
Production, Transportation and Moving Occupations by Sex
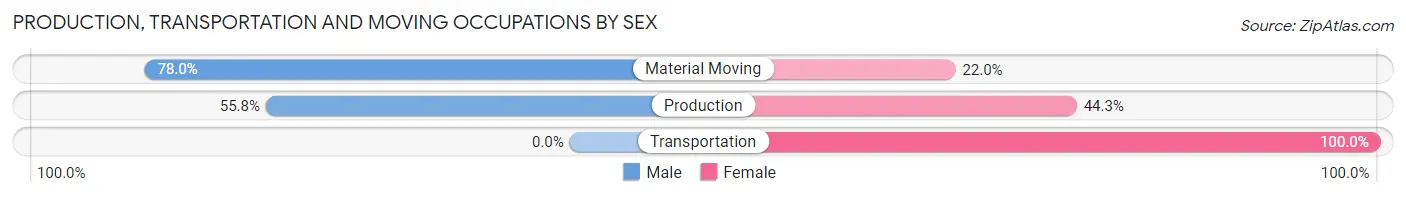
| Occupation | Male | Female |
| Production | 63 (55.7%) | 50 (44.3%) |
| Transportation | 0 (0.0%) | 9 (100.0%) |
| Material Moving | 39 (78.0%) | 11 (22.0%) |
| Total (Category) | 102 (59.3%) | 70 (40.7%) |
| Total (Overall) | 312 (41.2%) | 446 (58.8%) |
Employment Industries by Sex in Horse Pasture
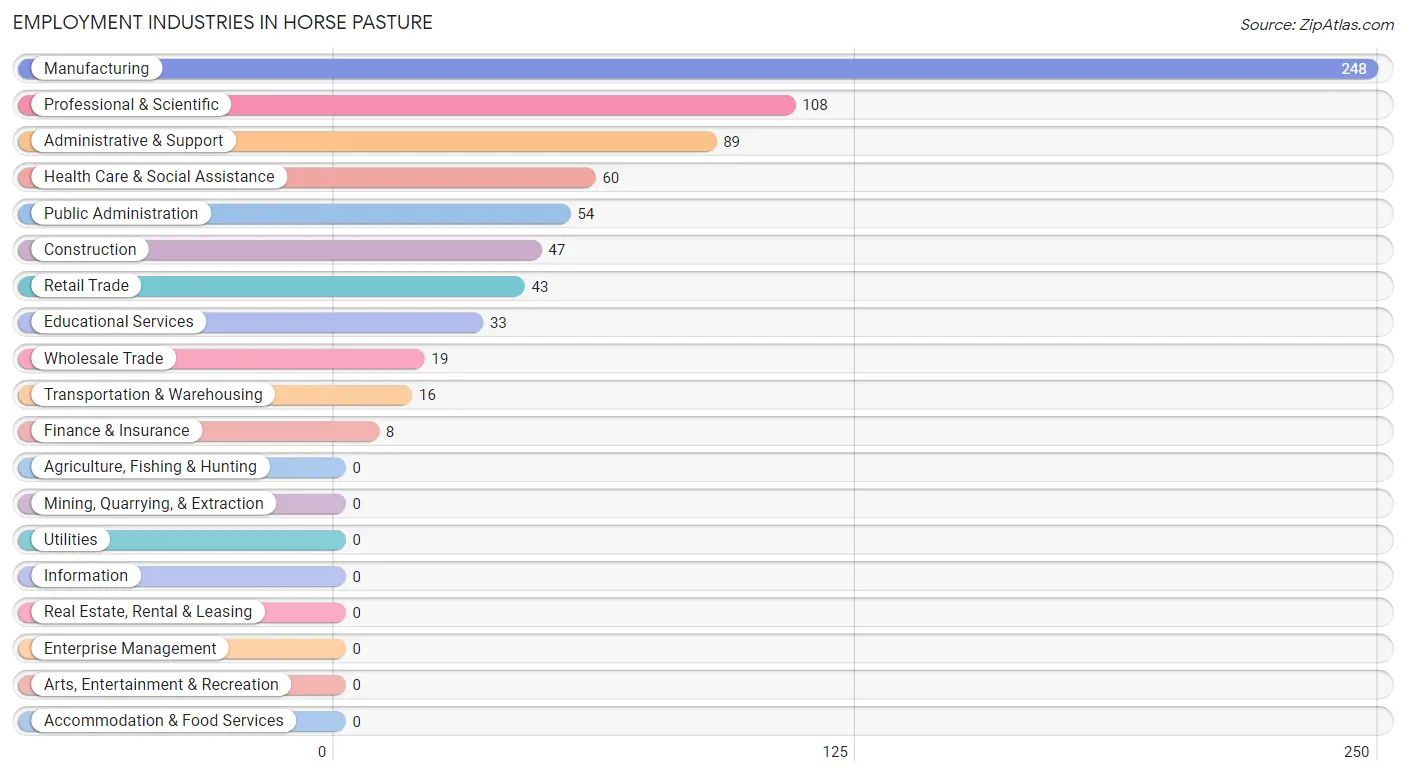
Employment Industries in Horse Pasture
The major employment industries in Horse Pasture include Manufacturing (248 | 32.7%), Professional & Scientific (108 | 14.2%), Administrative & Support (89 | 11.7%), Health Care & Social Assistance (60 | 7.9%), and Public Administration (54 | 7.1%).
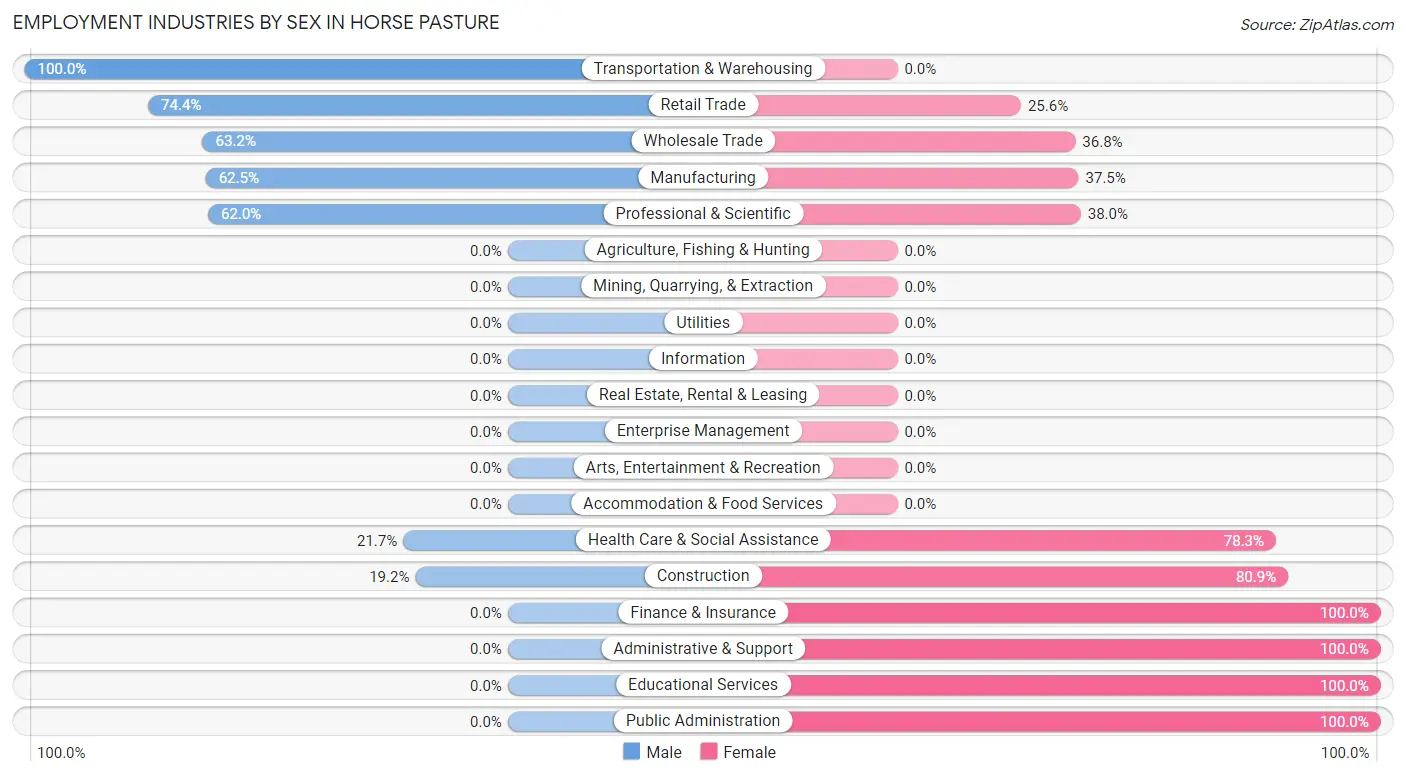
Employment Industries by Sex in Horse Pasture
The Horse Pasture industries that see more men than women are Transportation & Warehousing (100.0%), Retail Trade (74.4%), and Wholesale Trade (63.2%), whereas the industries that tend to have a higher number of women are Finance & Insurance (100.0%), Administrative & Support (100.0%), and Educational Services (100.0%).
| Industry | Male | Female |
| Agriculture, Fishing & Hunting | 0 (0.0%) | 0 (0.0%) |
| Mining, Quarrying, & Extraction | 0 (0.0%) | 0 (0.0%) |
| Construction | 9 (19.2%) | 38 (80.8%) |
| Manufacturing | 155 (62.5%) | 93 (37.5%) |
| Wholesale Trade | 12 (63.2%) | 7 (36.8%) |
| Retail Trade | 32 (74.4%) | 11 (25.6%) |
| Transportation & Warehousing | 16 (100.0%) | 0 (0.0%) |
| Utilities | 0 (0.0%) | 0 (0.0%) |
| Information | 0 (0.0%) | 0 (0.0%) |
| Finance & Insurance | 0 (0.0%) | 8 (100.0%) |
| Real Estate, Rental & Leasing | 0 (0.0%) | 0 (0.0%) |
| Professional & Scientific | 67 (62.0%) | 41 (38.0%) |
| Enterprise Management | 0 (0.0%) | 0 (0.0%) |
| Administrative & Support | 0 (0.0%) | 89 (100.0%) |
| Educational Services | 0 (0.0%) | 33 (100.0%) |
| Health Care & Social Assistance | 13 (21.7%) | 47 (78.3%) |
| Arts, Entertainment & Recreation | 0 (0.0%) | 0 (0.0%) |
| Accommodation & Food Services | 0 (0.0%) | 0 (0.0%) |
| Public Administration | 0 (0.0%) | 54 (100.0%) |
| Total | 312 (41.2%) | 446 (58.8%) |
Education in Horse Pasture
School Enrollment in Horse Pasture
The most common levels of schooling among the 343 students in Horse Pasture are middle school (158 | 46.1%), high school (66 | 19.2%), and college / undergraduate (46 | 13.4%).
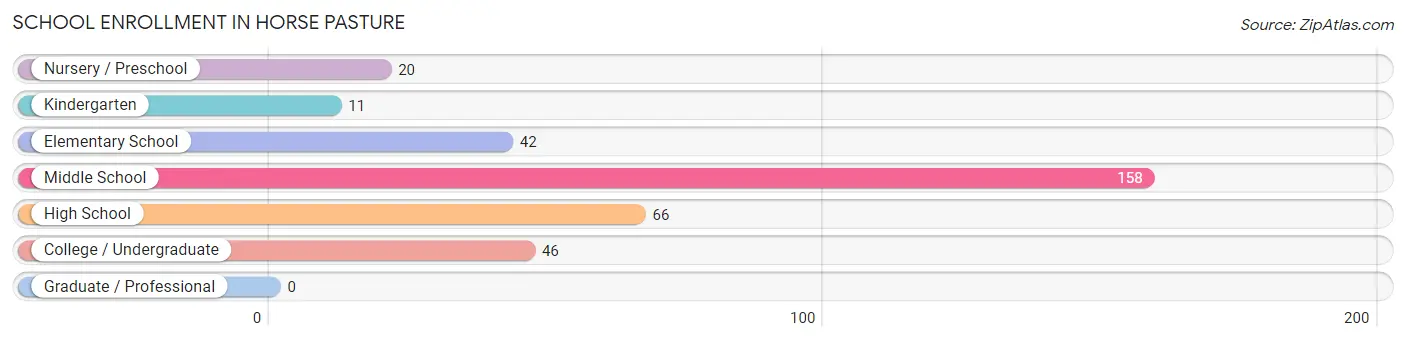
| School Level | # Students | % Students |
| Nursery / Preschool | 20 | 5.8% |
| Kindergarten | 11 | 3.2% |
| Elementary School | 42 | 12.2% |
| Middle School | 158 | 46.1% |
| High School | 66 | 19.2% |
| College / Undergraduate | 46 | 13.4% |
| Graduate / Professional | 0 | 0.0% |
| Total | 343 | 100.0% |
School Enrollment by Age by Funding Source in Horse Pasture
Out of a total of 343 students who are enrolled in schools in Horse Pasture, 158 (46.1%) attend a private institution, while the remaining 185 (53.9%) are enrolled in public schools. The age group of 3 to 4 year olds has the highest likelihood of being enrolled in private schools, with 20 (100.0% in the age bracket) enrolled. Conversely, the age group of 18 to 19 year olds has the lowest likelihood of being enrolled in a private school, with 8 (100.0% in the age bracket) attending a public institution.
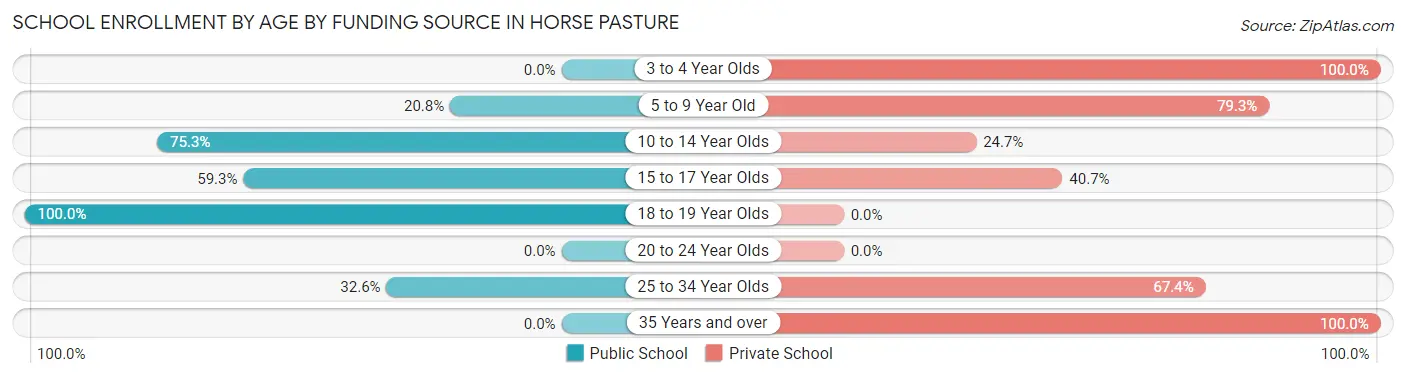
| Age Bracket | Public School | Private School |
| 3 to 4 Year Olds | 0 (0.0%) | 20 (100.0%) |
| 5 to 9 Year Old | 11 (20.7%) | 42 (79.2%) |
| 10 to 14 Year Olds | 119 (75.3%) | 39 (24.7%) |
| 15 to 17 Year Olds | 32 (59.3%) | 22 (40.7%) |
| 18 to 19 Year Olds | 8 (100.0%) | 0 (0.0%) |
| 20 to 24 Year Olds | 0 (0.0%) | 0 (0.0%) |
| 25 to 34 Year Olds | 15 (32.6%) | 31 (67.4%) |
| 35 Years and over | 0 (0.0%) | 4 (100.0%) |
| Total | 185 (53.9%) | 158 (46.1%) |
Educational Attainment by Field of Study in Horse Pasture
Education (80 | 26.9%), social sciences (62 | 20.9%), business (56 | 18.9%), liberal arts & history (22 | 7.4%), and computers & mathematics (21 | 7.1%) are the most common fields of study among 297 individuals in Horse Pasture who have obtained a bachelor's degree or higher.
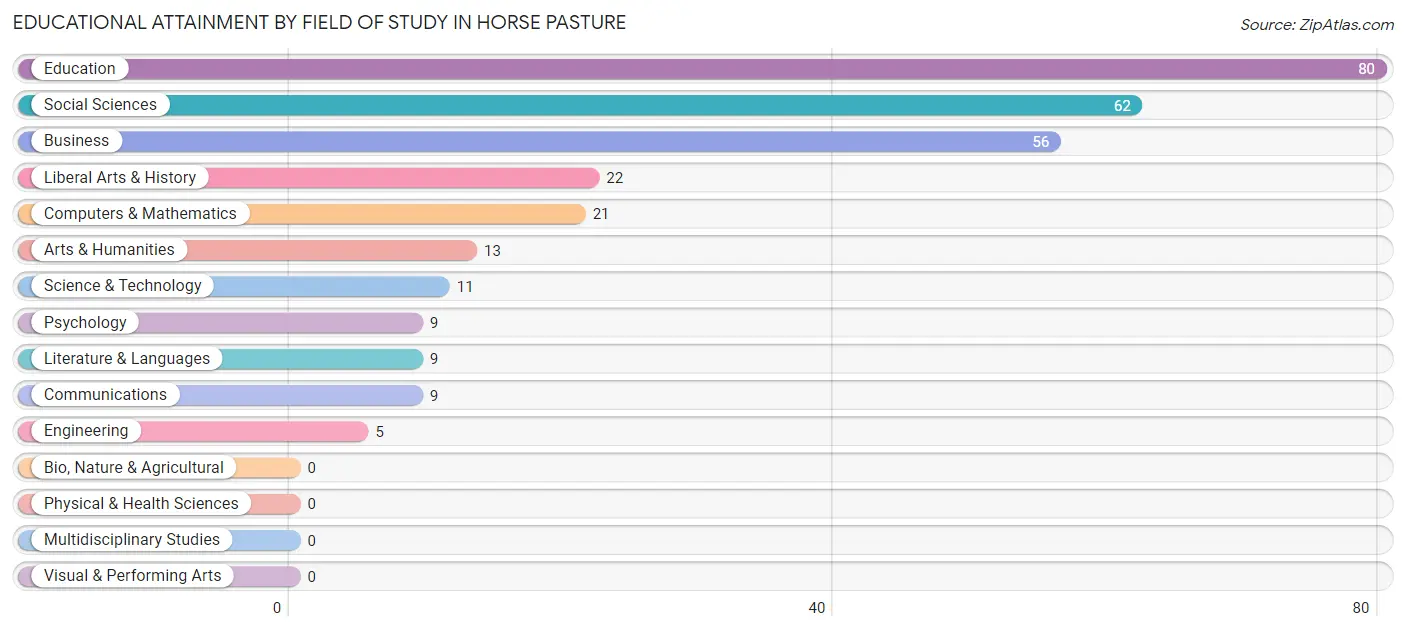
| Field of Study | # Graduates | % Graduates |
| Computers & Mathematics | 21 | 7.1% |
| Bio, Nature & Agricultural | 0 | 0.0% |
| Physical & Health Sciences | 0 | 0.0% |
| Psychology | 9 | 3.0% |
| Social Sciences | 62 | 20.9% |
| Engineering | 5 | 1.7% |
| Multidisciplinary Studies | 0 | 0.0% |
| Science & Technology | 11 | 3.7% |
| Business | 56 | 18.9% |
| Education | 80 | 26.9% |
| Literature & Languages | 9 | 3.0% |
| Liberal Arts & History | 22 | 7.4% |
| Visual & Performing Arts | 0 | 0.0% |
| Communications | 9 | 3.0% |
| Arts & Humanities | 13 | 4.4% |
| Total | 297 | 100.0% |
Transportation & Commute in Horse Pasture
Vehicle Availability by Sex in Horse Pasture
The most prevalent vehicle ownership categories in Horse Pasture are males with 2 vehicles (104, accounting for 35.6%) and females with 2 vehicles (126, making up 24.7%).
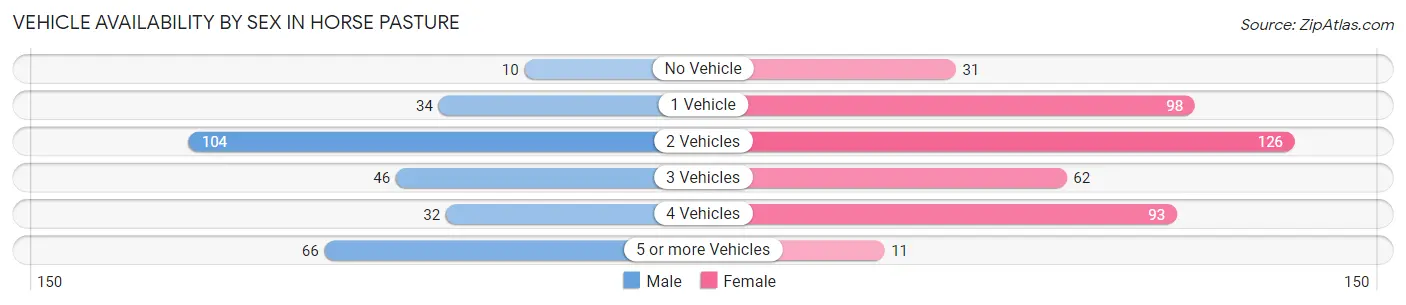
| Vehicles Available | Male | Female |
| No Vehicle | 10 (3.4%) | 31 (7.4%) |
| 1 Vehicle | 34 (11.6%) | 98 (23.3%) |
| 2 Vehicles | 104 (35.6%) | 126 (29.9%) |
| 3 Vehicles | 46 (15.8%) | 62 (14.7%) |
| 4 Vehicles | 32 (11.0%) | 93 (22.1%) |
| 5 or more Vehicles | 66 (22.6%) | 11 (2.6%) |
| Total | 292 (100.0%) | 421 (100.0%) |
Commute Time in Horse Pasture
The most frequently occuring commute durations in Horse Pasture are 20 to 24 minutes (169 commuters, 23.7%), 15 to 19 minutes (157 commuters, 22.0%), and 30 to 34 minutes (83 commuters, 11.6%).
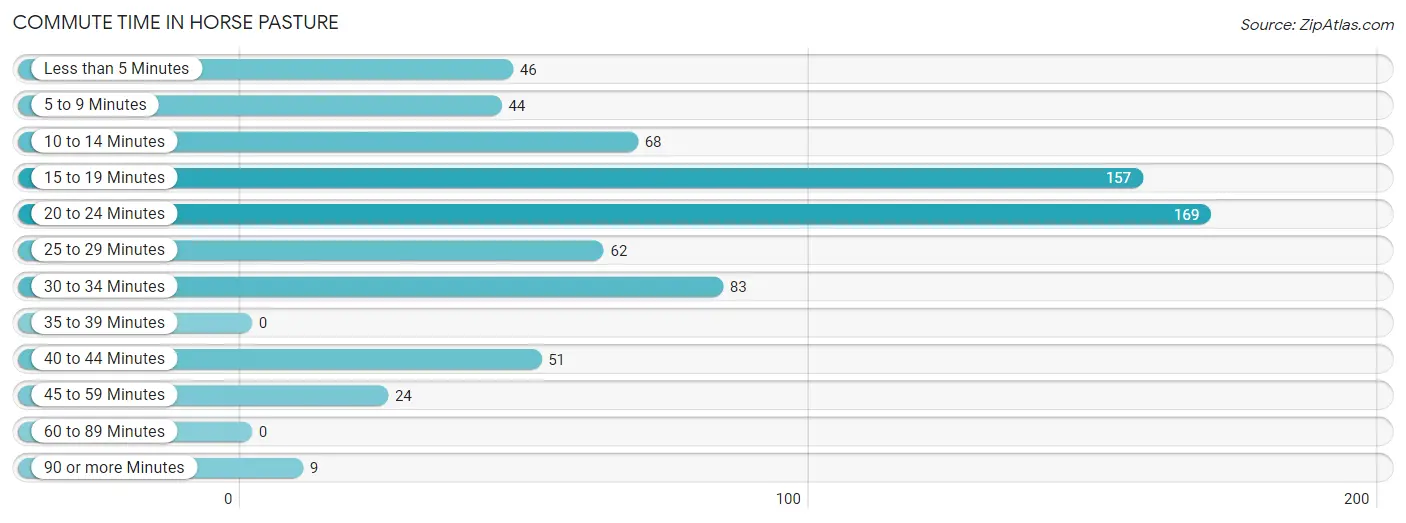
| Commute Time | # Commuters | % Commuters |
| Less than 5 Minutes | 46 | 6.5% |
| 5 to 9 Minutes | 44 | 6.2% |
| 10 to 14 Minutes | 68 | 9.5% |
| 15 to 19 Minutes | 157 | 22.0% |
| 20 to 24 Minutes | 169 | 23.7% |
| 25 to 29 Minutes | 62 | 8.7% |
| 30 to 34 Minutes | 83 | 11.6% |
| 35 to 39 Minutes | 0 | 0.0% |
| 40 to 44 Minutes | 51 | 7.1% |
| 45 to 59 Minutes | 24 | 3.4% |
| 60 to 89 Minutes | 0 | 0.0% |
| 90 or more Minutes | 9 | 1.3% |
Commute Time by Sex in Horse Pasture
The most common commute times in Horse Pasture are 15 to 19 minutes (107 commuters, 36.6%) for males and 20 to 24 minutes (120 commuters, 28.5%) for females.
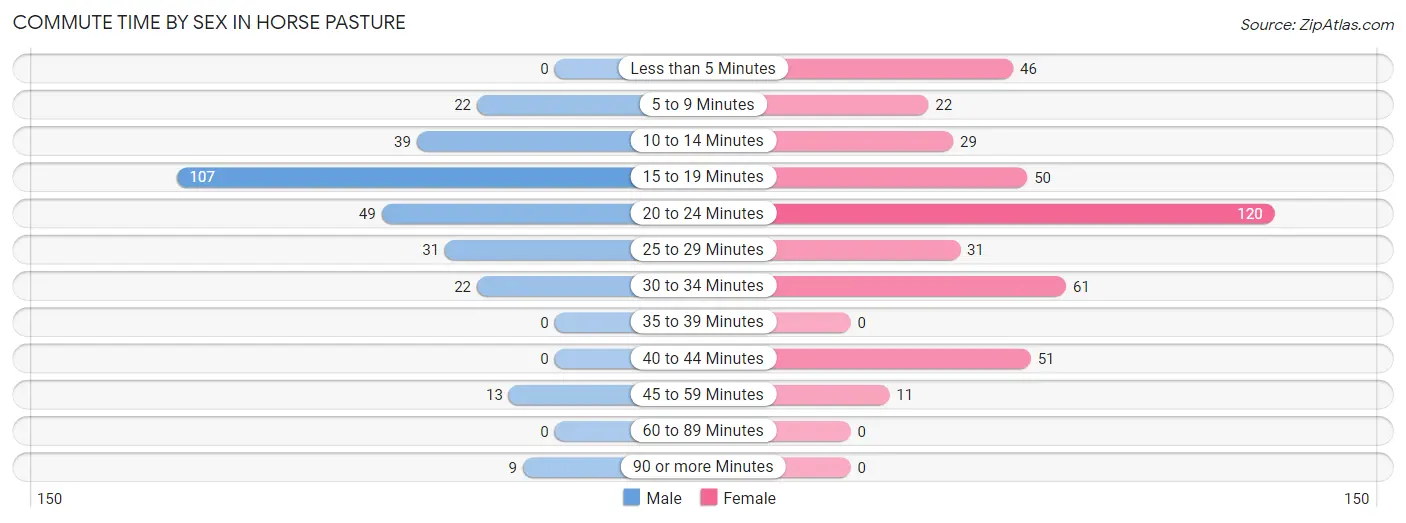
| Commute Time | Male | Female |
| Less than 5 Minutes | 0 (0.0%) | 46 (10.9%) |
| 5 to 9 Minutes | 22 (7.5%) | 22 (5.2%) |
| 10 to 14 Minutes | 39 (13.4%) | 29 (6.9%) |
| 15 to 19 Minutes | 107 (36.6%) | 50 (11.9%) |
| 20 to 24 Minutes | 49 (16.8%) | 120 (28.5%) |
| 25 to 29 Minutes | 31 (10.6%) | 31 (7.4%) |
| 30 to 34 Minutes | 22 (7.5%) | 61 (14.5%) |
| 35 to 39 Minutes | 0 (0.0%) | 0 (0.0%) |
| 40 to 44 Minutes | 0 (0.0%) | 51 (12.1%) |
| 45 to 59 Minutes | 13 (4.4%) | 11 (2.6%) |
| 60 to 89 Minutes | 0 (0.0%) | 0 (0.0%) |
| 90 or more Minutes | 9 (3.1%) | 0 (0.0%) |
Time of Departure to Work by Sex in Horse Pasture
The most frequent times of departure to work in Horse Pasture are 8:00 AM to 8:29 AM (95, 32.5%) for males and 7:00 AM to 7:29 AM (118, 28.0%) for females.
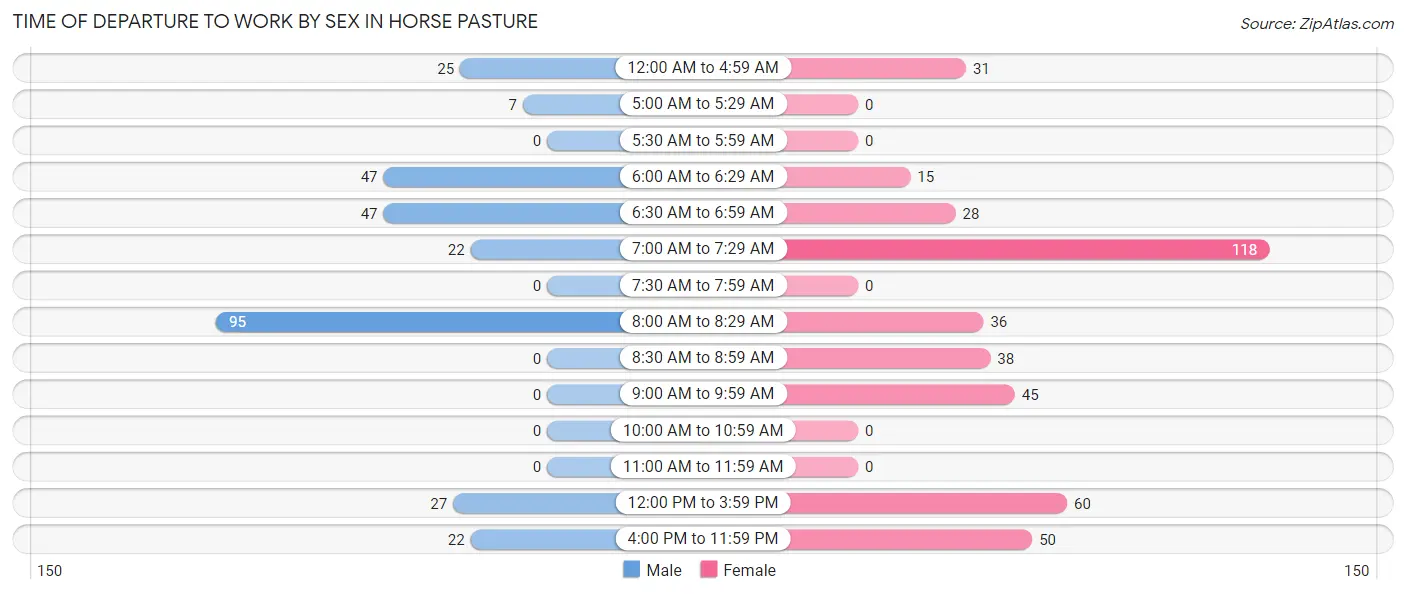
| Time of Departure | Male | Female |
| 12:00 AM to 4:59 AM | 25 (8.6%) | 31 (7.4%) |
| 5:00 AM to 5:29 AM | 7 (2.4%) | 0 (0.0%) |
| 5:30 AM to 5:59 AM | 0 (0.0%) | 0 (0.0%) |
| 6:00 AM to 6:29 AM | 47 (16.1%) | 15 (3.6%) |
| 6:30 AM to 6:59 AM | 47 (16.1%) | 28 (6.7%) |
| 7:00 AM to 7:29 AM | 22 (7.5%) | 118 (28.0%) |
| 7:30 AM to 7:59 AM | 0 (0.0%) | 0 (0.0%) |
| 8:00 AM to 8:29 AM | 95 (32.5%) | 36 (8.6%) |
| 8:30 AM to 8:59 AM | 0 (0.0%) | 38 (9.0%) |
| 9:00 AM to 9:59 AM | 0 (0.0%) | 45 (10.7%) |
| 10:00 AM to 10:59 AM | 0 (0.0%) | 0 (0.0%) |
| 11:00 AM to 11:59 AM | 0 (0.0%) | 0 (0.0%) |
| 12:00 PM to 3:59 PM | 27 (9.2%) | 60 (14.2%) |
| 4:00 PM to 11:59 PM | 22 (7.5%) | 50 (11.9%) |
| Total | 292 (100.0%) | 421 (100.0%) |
Housing Occupancy in Horse Pasture
Occupancy by Ownership in Horse Pasture
Of the total 882 dwellings in Horse Pasture, owner-occupied units account for 655 (74.3%), while renter-occupied units make up 227 (25.7%).
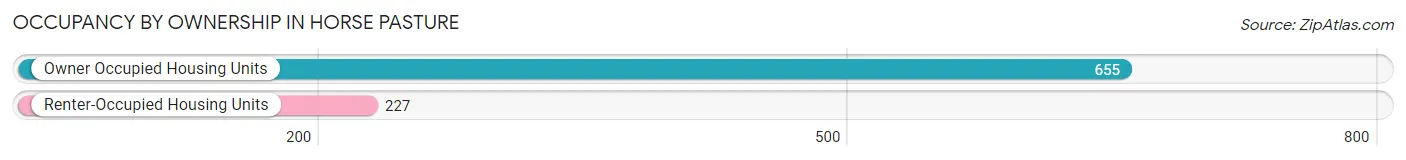
| Occupancy | # Housing Units | % Housing Units |
| Owner Occupied Housing Units | 655 | 74.3% |
| Renter-Occupied Housing Units | 227 | 25.7% |
| Total Occupied Housing Units | 882 | 100.0% |
Occupancy by Household Size in Horse Pasture
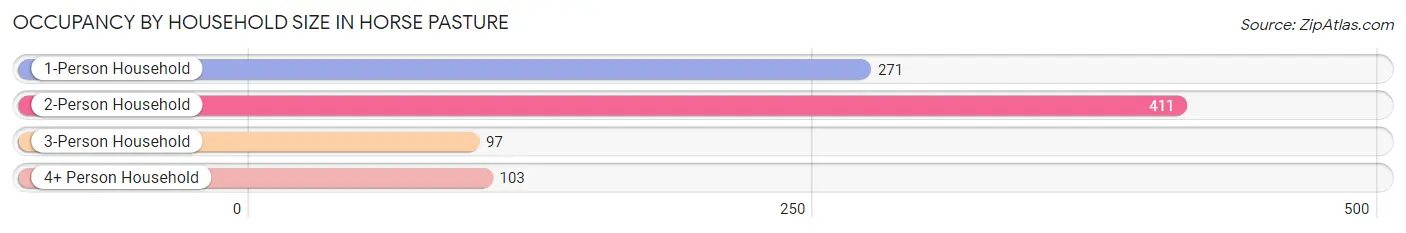
| Household Size | # Housing Units | % Housing Units |
| 1-Person Household | 271 | 30.7% |
| 2-Person Household | 411 | 46.6% |
| 3-Person Household | 97 | 11.0% |
| 4+ Person Household | 103 | 11.7% |
| Total Housing Units | 882 | 100.0% |
Occupancy by Ownership by Household Size in Horse Pasture
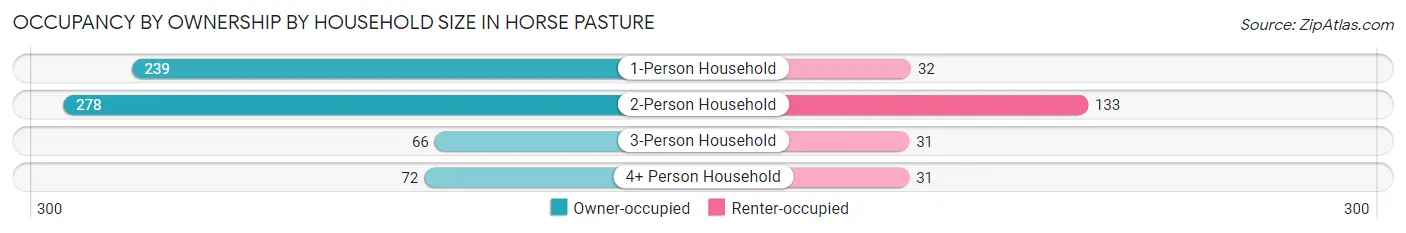
| Household Size | Owner-occupied | Renter-occupied |
| 1-Person Household | 239 (88.2%) | 32 (11.8%) |
| 2-Person Household | 278 (67.6%) | 133 (32.4%) |
| 3-Person Household | 66 (68.0%) | 31 (32.0%) |
| 4+ Person Household | 72 (69.9%) | 31 (30.1%) |
| Total Housing Units | 655 (74.3%) | 227 (25.7%) |
Occupancy by Educational Attainment in Horse Pasture
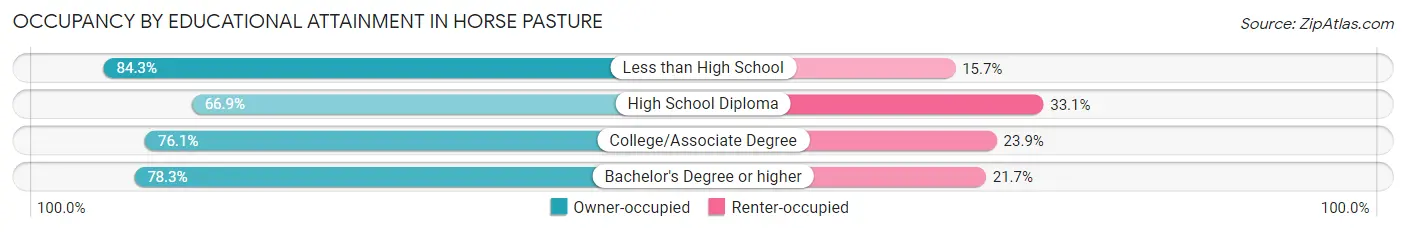
| Household Size | Owner-occupied | Renter-occupied |
| Less than High School | 113 (84.3%) | 21 (15.7%) |
| High School Diploma | 226 (66.9%) | 112 (33.1%) |
| College/Associate Degree | 172 (76.1%) | 54 (23.9%) |
| Bachelor's Degree or higher | 144 (78.3%) | 40 (21.7%) |
Occupancy by Age of Householder in Horse Pasture
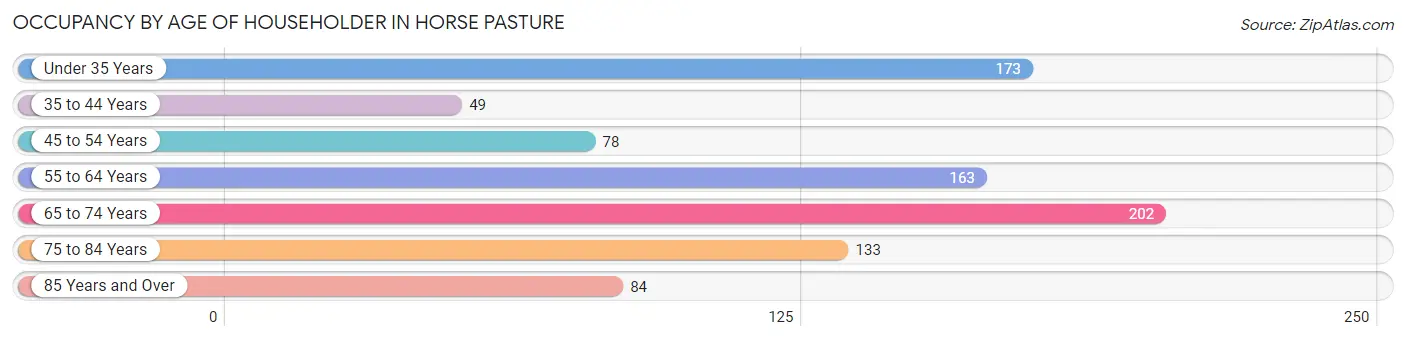
| Age Bracket | # Households | % Households |
| Under 35 Years | 173 | 19.6% |
| 35 to 44 Years | 49 | 5.6% |
| 45 to 54 Years | 78 | 8.8% |
| 55 to 64 Years | 163 | 18.5% |
| 65 to 74 Years | 202 | 22.9% |
| 75 to 84 Years | 133 | 15.1% |
| 85 Years and Over | 84 | 9.5% |
| Total | 882 | 100.0% |
Housing Finances in Horse Pasture
Median Income by Occupancy in Horse Pasture
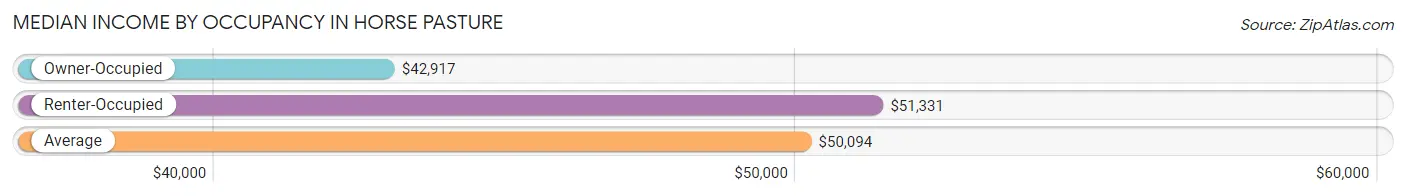
| Occupancy Type | # Households | Median Income |
| Owner-Occupied | 655 (74.3%) | $42,917 |
| Renter-Occupied | 227 (25.7%) | $51,331 |
| Average | 882 (100.0%) | $50,094 |
Occupancy by Householder Income Bracket in Horse Pasture
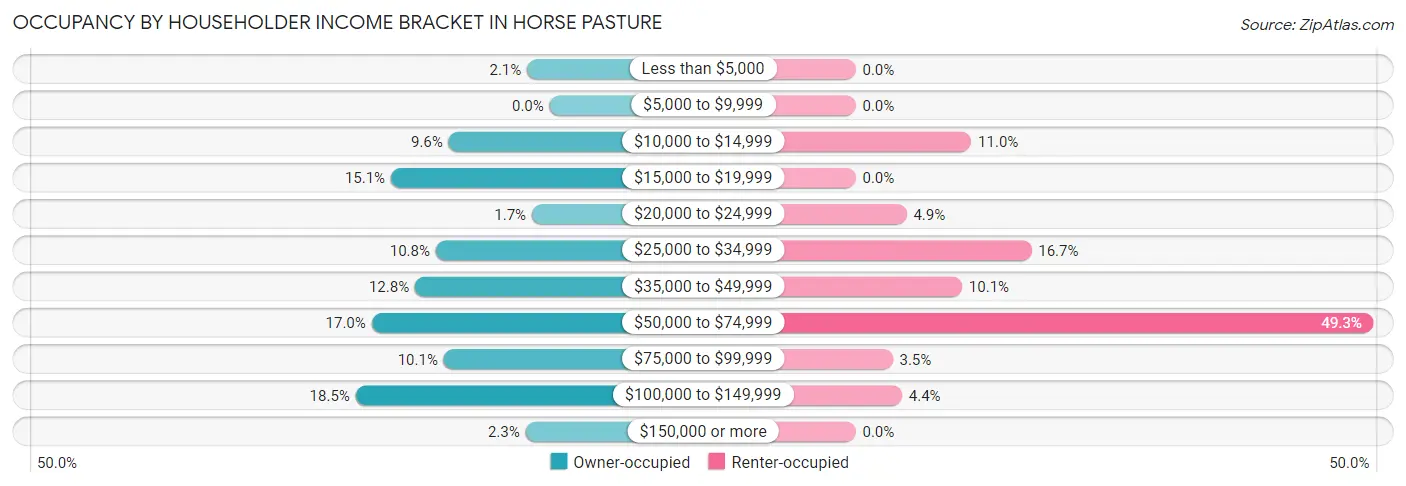
| Income Bracket | Owner-occupied | Renter-occupied |
| Less than $5,000 | 14 (2.1%) | 0 (0.0%) |
| $5,000 to $9,999 | 0 (0.0%) | 0 (0.0%) |
| $10,000 to $14,999 | 63 (9.6%) | 25 (11.0%) |
| $15,000 to $19,999 | 99 (15.1%) | 0 (0.0%) |
| $20,000 to $24,999 | 11 (1.7%) | 11 (4.9%) |
| $25,000 to $34,999 | 71 (10.8%) | 38 (16.7%) |
| $35,000 to $49,999 | 84 (12.8%) | 23 (10.1%) |
| $50,000 to $74,999 | 111 (17.0%) | 112 (49.3%) |
| $75,000 to $99,999 | 66 (10.1%) | 8 (3.5%) |
| $100,000 to $149,999 | 121 (18.5%) | 10 (4.4%) |
| $150,000 or more | 15 (2.3%) | 0 (0.0%) |
| Total | 655 (100.0%) | 227 (100.0%) |
Monthly Housing Cost Tiers in Horse Pasture
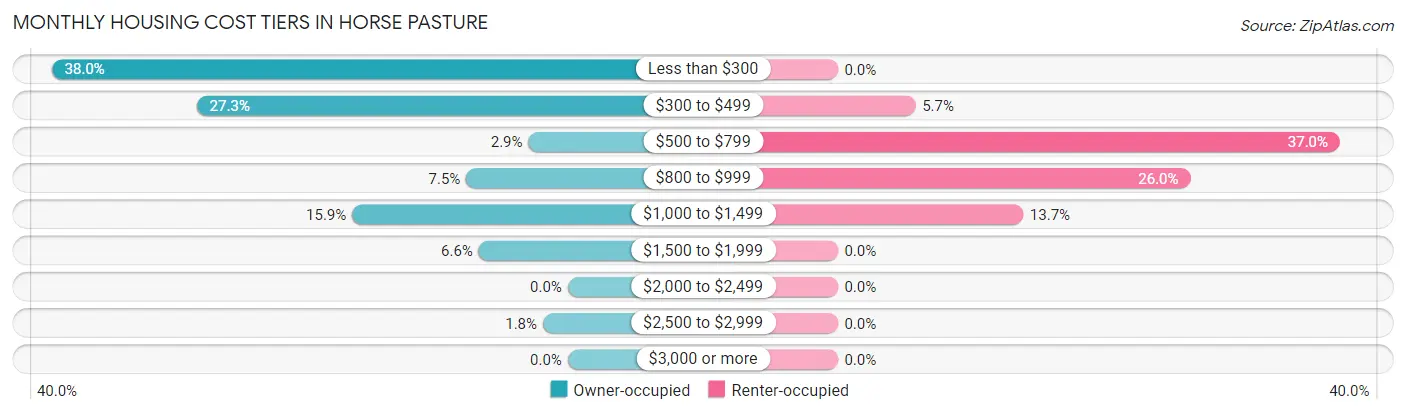
| Monthly Cost | Owner-occupied | Renter-occupied |
| Less than $300 | 249 (38.0%) | 0 (0.0%) |
| $300 to $499 | 179 (27.3%) | 13 (5.7%) |
| $500 to $799 | 19 (2.9%) | 84 (37.0%) |
| $800 to $999 | 49 (7.5%) | 59 (26.0%) |
| $1,000 to $1,499 | 104 (15.9%) | 31 (13.7%) |
| $1,500 to $1,999 | 43 (6.6%) | 0 (0.0%) |
| $2,000 to $2,499 | 0 (0.0%) | 0 (0.0%) |
| $2,500 to $2,999 | 12 (1.8%) | 0 (0.0%) |
| $3,000 or more | 0 (0.0%) | 0 (0.0%) |
| Total | 655 (100.0%) | 227 (100.0%) |
Physical Housing Characteristics in Horse Pasture
Housing Structures in Horse Pasture
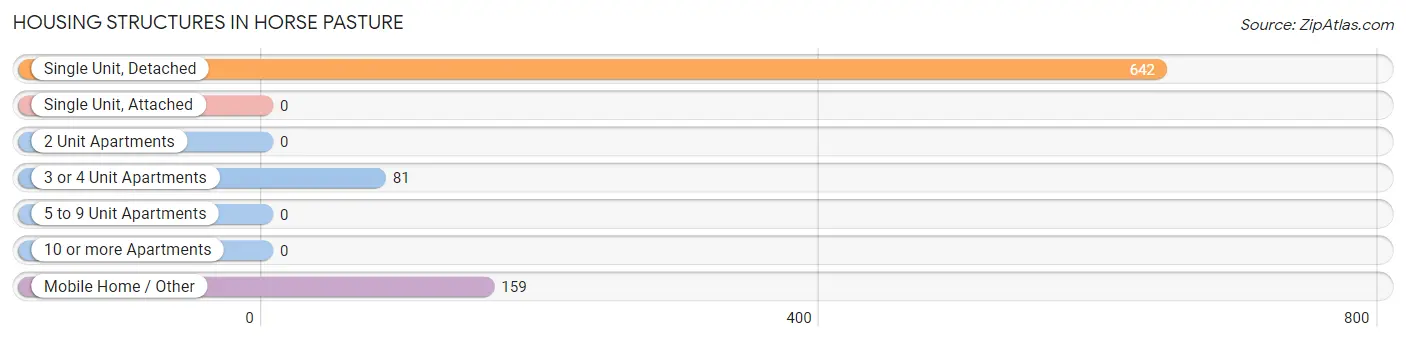
| Structure Type | # Housing Units | % Housing Units |
| Single Unit, Detached | 642 | 72.8% |
| Single Unit, Attached | 0 | 0.0% |
| 2 Unit Apartments | 0 | 0.0% |
| 3 or 4 Unit Apartments | 81 | 9.2% |
| 5 to 9 Unit Apartments | 0 | 0.0% |
| 10 or more Apartments | 0 | 0.0% |
| Mobile Home / Other | 159 | 18.0% |
| Total | 882 | 100.0% |
Housing Structures by Occupancy in Horse Pasture
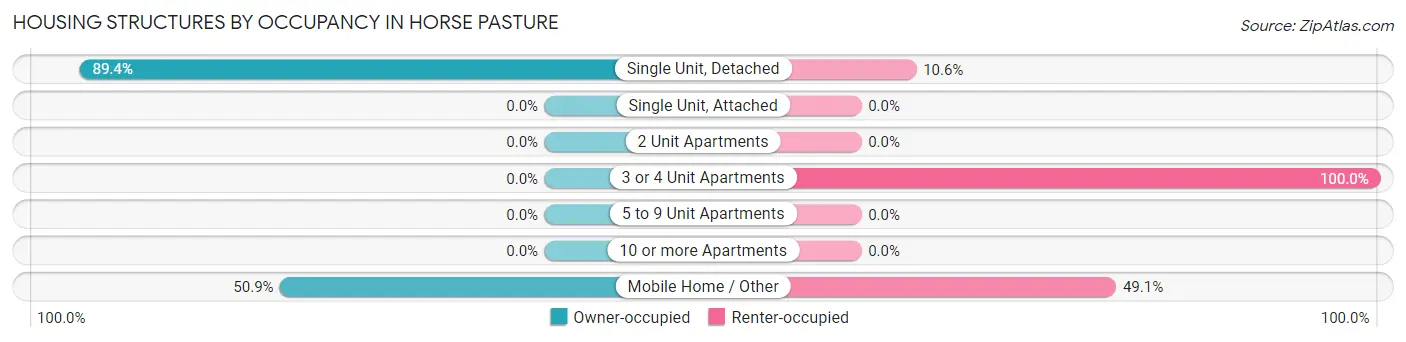
| Structure Type | Owner-occupied | Renter-occupied |
| Single Unit, Detached | 574 (89.4%) | 68 (10.6%) |
| Single Unit, Attached | 0 (0.0%) | 0 (0.0%) |
| 2 Unit Apartments | 0 (0.0%) | 0 (0.0%) |
| 3 or 4 Unit Apartments | 0 (0.0%) | 81 (100.0%) |
| 5 to 9 Unit Apartments | 0 (0.0%) | 0 (0.0%) |
| 10 or more Apartments | 0 (0.0%) | 0 (0.0%) |
| Mobile Home / Other | 81 (50.9%) | 78 (49.1%) |
| Total | 655 (74.3%) | 227 (25.7%) |
Housing Structures by Number of Rooms in Horse Pasture
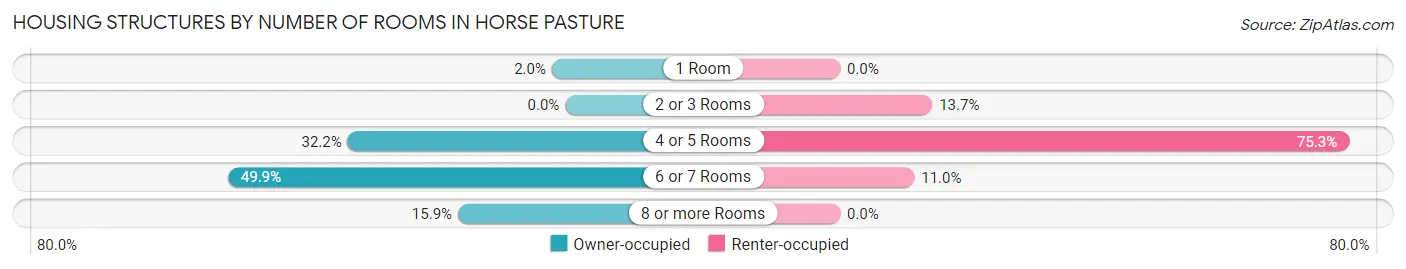
| Number of Rooms | Owner-occupied | Renter-occupied |
| 1 Room | 13 (2.0%) | 0 (0.0%) |
| 2 or 3 Rooms | 0 (0.0%) | 31 (13.7%) |
| 4 or 5 Rooms | 211 (32.2%) | 171 (75.3%) |
| 6 or 7 Rooms | 327 (49.9%) | 25 (11.0%) |
| 8 or more Rooms | 104 (15.9%) | 0 (0.0%) |
| Total | 655 (100.0%) | 227 (100.0%) |
Housing Structure by Heating Type in Horse Pasture
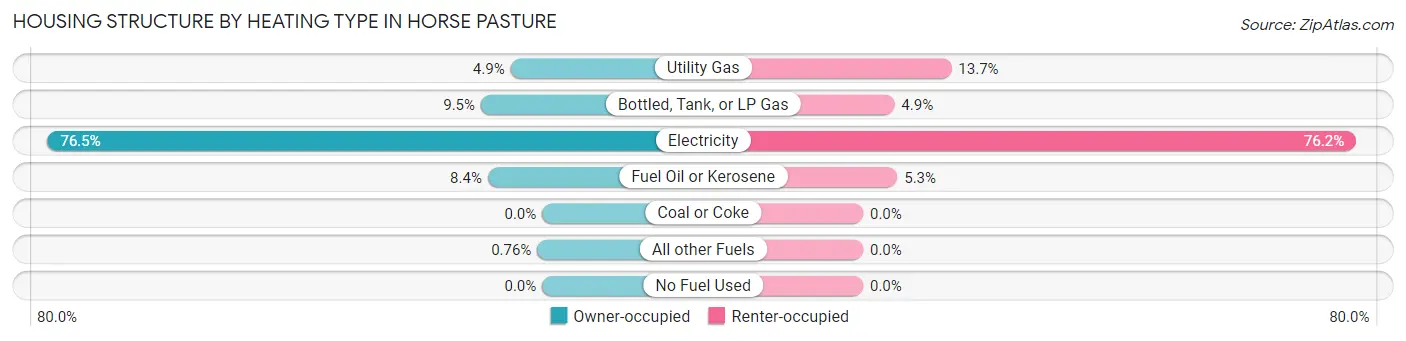
| Heating Type | Owner-occupied | Renter-occupied |
| Utility Gas | 32 (4.9%) | 31 (13.7%) |
| Bottled, Tank, or LP Gas | 62 (9.5%) | 11 (4.9%) |
| Electricity | 501 (76.5%) | 173 (76.2%) |
| Fuel Oil or Kerosene | 55 (8.4%) | 12 (5.3%) |
| Coal or Coke | 0 (0.0%) | 0 (0.0%) |
| All other Fuels | 5 (0.8%) | 0 (0.0%) |
| No Fuel Used | 0 (0.0%) | 0 (0.0%) |
| Total | 655 (100.0%) | 227 (100.0%) |
Household Vehicle Usage in Horse Pasture
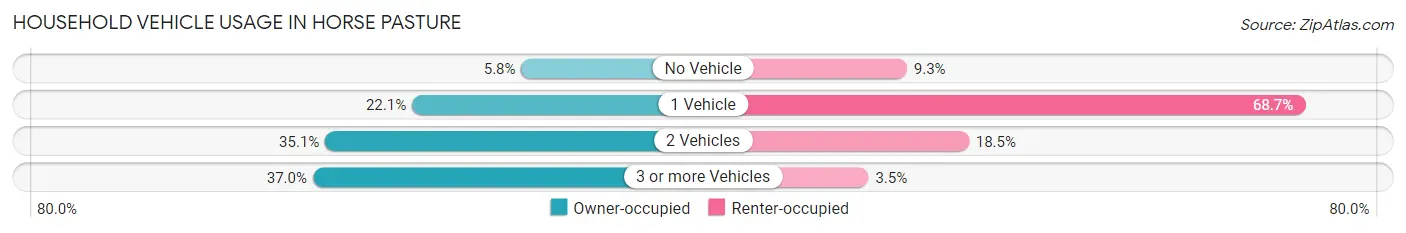
| Vehicles per Household | Owner-occupied | Renter-occupied |
| No Vehicle | 38 (5.8%) | 21 (9.2%) |
| 1 Vehicle | 145 (22.1%) | 156 (68.7%) |
| 2 Vehicles | 230 (35.1%) | 42 (18.5%) |
| 3 or more Vehicles | 242 (36.9%) | 8 (3.5%) |
| Total | 655 (100.0%) | 227 (100.0%) |
Real Estate & Mortgages in Horse Pasture
Real Estate and Mortgage Overview in Horse Pasture
| Characteristic | Without Mortgage | With Mortgage |
| Housing Units | 436 | 219 |
| Median Property Value | $92,900 | $122,400 |
| Median Household Income | $29,118 | $0 |
| Monthly Housing Costs | $282 | $0 |
| Real Estate Taxes | $511 | $32 |
Property Value by Mortgage Status in Horse Pasture
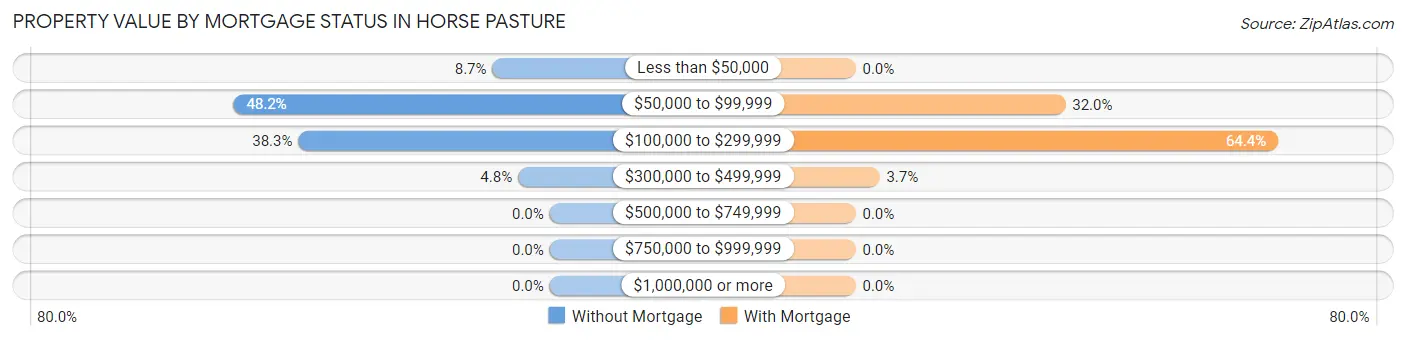
| Property Value | Without Mortgage | With Mortgage |
| Less than $50,000 | 38 (8.7%) | 0 (0.0%) |
| $50,000 to $99,999 | 210 (48.2%) | 70 (32.0%) |
| $100,000 to $299,999 | 167 (38.3%) | 141 (64.4%) |
| $300,000 to $499,999 | 21 (4.8%) | 8 (3.6%) |
| $500,000 to $749,999 | 0 (0.0%) | 0 (0.0%) |
| $750,000 to $999,999 | 0 (0.0%) | 0 (0.0%) |
| $1,000,000 or more | 0 (0.0%) | 0 (0.0%) |
| Total | 436 (100.0%) | 219 (100.0%) |
Household Income by Mortgage Status in Horse Pasture
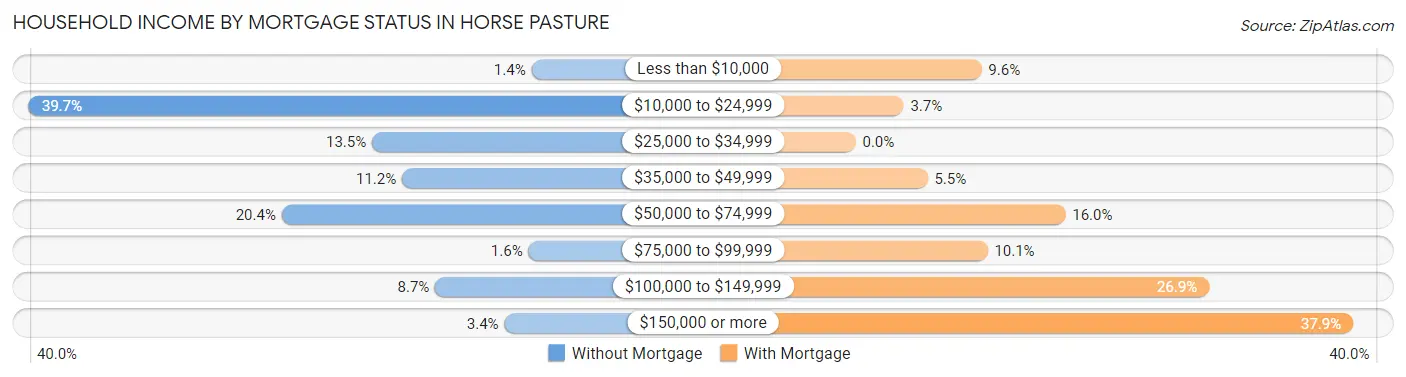
| Household Income | Without Mortgage | With Mortgage |
| Less than $10,000 | 6 (1.4%) | 21 (9.6%) |
| $10,000 to $24,999 | 173 (39.7%) | 8 (3.6%) |
| $25,000 to $34,999 | 59 (13.5%) | 0 (0.0%) |
| $35,000 to $49,999 | 49 (11.2%) | 12 (5.5%) |
| $50,000 to $74,999 | 89 (20.4%) | 35 (16.0%) |
| $75,000 to $99,999 | 7 (1.6%) | 22 (10.1%) |
| $100,000 to $149,999 | 38 (8.7%) | 59 (26.9%) |
| $150,000 or more | 15 (3.4%) | 83 (37.9%) |
| Total | 436 (100.0%) | 219 (100.0%) |
Property Value to Household Income Ratio in Horse Pasture
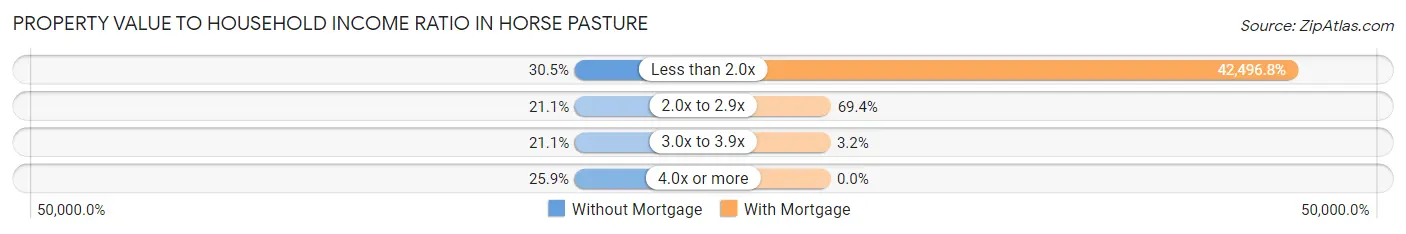
| Value-to-Income Ratio | Without Mortgage | With Mortgage |
| Less than 2.0x | 133 (30.5%) | 93,068 (42,496.8%) |
| 2.0x to 2.9x | 92 (21.1%) | 152 (69.4%) |
| 3.0x to 3.9x | 92 (21.1%) | 7 (3.2%) |
| 4.0x or more | 113 (25.9%) | 0 (0.0%) |
| Total | 436 (100.0%) | 219 (100.0%) |
Real Estate Taxes by Mortgage Status in Horse Pasture
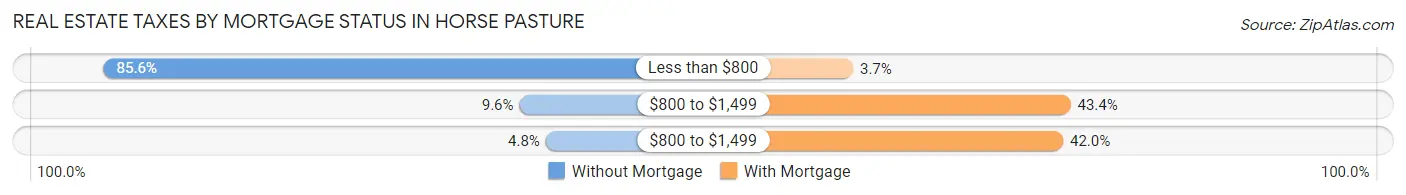
| Property Taxes | Without Mortgage | With Mortgage |
| Less than $800 | 373 (85.6%) | 8 (3.6%) |
| $800 to $1,499 | 42 (9.6%) | 95 (43.4%) |
| $800 to $1,499 | 21 (4.8%) | 92 (42.0%) |
| Total | 436 (100.0%) | 219 (100.0%) |
Health & Disability in Horse Pasture
Health Insurance Coverage by Age in Horse Pasture
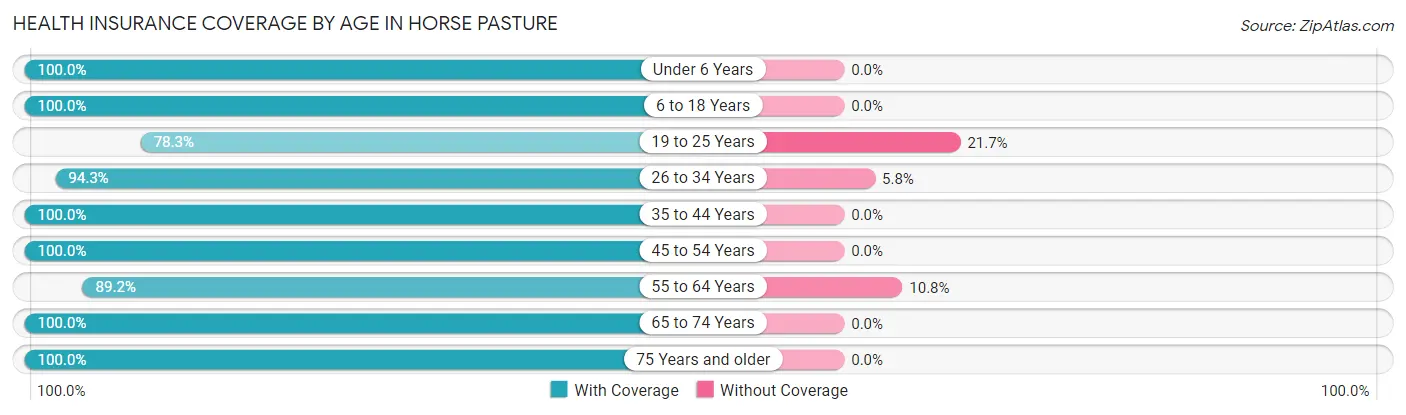
| Age Bracket | With Coverage | Without Coverage |
| Under 6 Years | 145 (100.0%) | 0 (0.0%) |
| 6 to 18 Years | 262 (100.0%) | 0 (0.0%) |
| 19 to 25 Years | 123 (78.3%) | 34 (21.7%) |
| 26 to 34 Years | 213 (94.3%) | 13 (5.8%) |
| 35 to 44 Years | 128 (100.0%) | 0 (0.0%) |
| 45 to 54 Years | 149 (100.0%) | 0 (0.0%) |
| 55 to 64 Years | 354 (89.2%) | 43 (10.8%) |
| 65 to 74 Years | 330 (100.0%) | 0 (0.0%) |
| 75 Years and older | 368 (100.0%) | 0 (0.0%) |
| Total | 2,072 (95.8%) | 90 (4.2%) |
Health Insurance Coverage by Citizenship Status in Horse Pasture
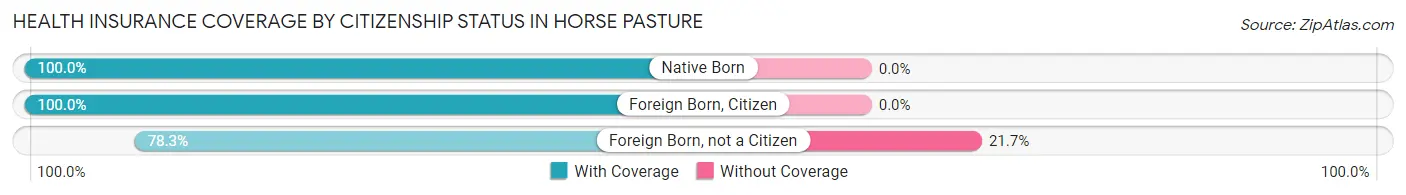
| Citizenship Status | With Coverage | Without Coverage |
| Native Born | 145 (100.0%) | 0 (0.0%) |
| Foreign Born, Citizen | 262 (100.0%) | 0 (0.0%) |
| Foreign Born, not a Citizen | 123 (78.3%) | 34 (21.7%) |
Health Insurance Coverage by Household Income in Horse Pasture
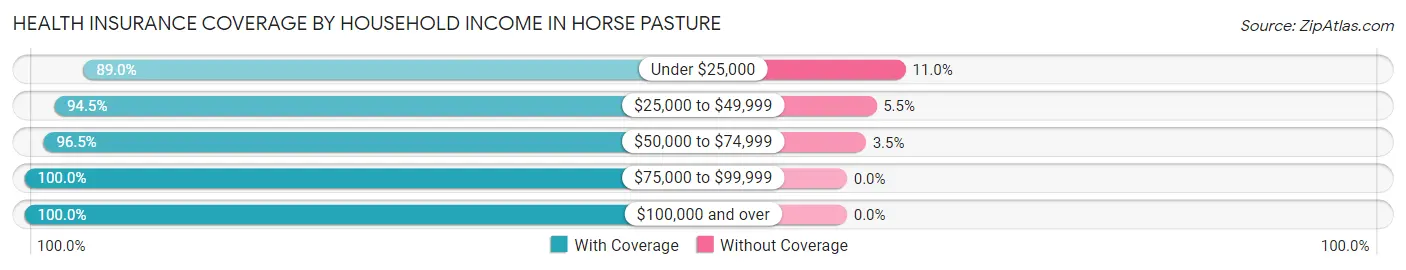
| Household Income | With Coverage | Without Coverage |
| Under $25,000 | 283 (89.0%) | 35 (11.0%) |
| $25,000 to $49,999 | 566 (94.5%) | 33 (5.5%) |
| $50,000 to $74,999 | 599 (96.5%) | 22 (3.5%) |
| $75,000 to $99,999 | 181 (100.0%) | 0 (0.0%) |
| $100,000 and over | 443 (100.0%) | 0 (0.0%) |
Public vs Private Health Insurance Coverage by Age in Horse Pasture
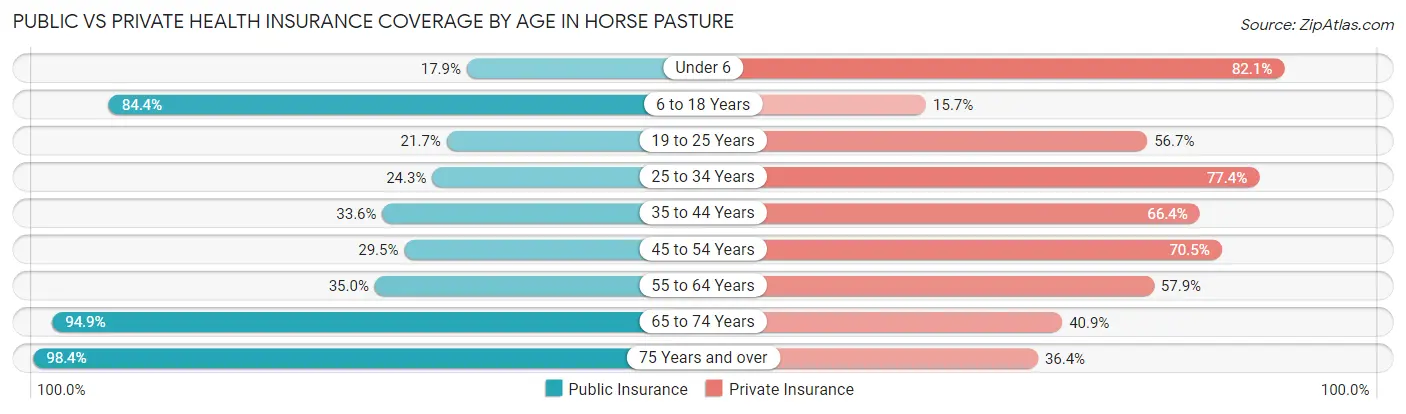
| Age Bracket | Public Insurance | Private Insurance |
| Under 6 | 26 (17.9%) | 119 (82.1%) |
| 6 to 18 Years | 221 (84.4%) | 41 (15.7%) |
| 19 to 25 Years | 34 (21.7%) | 89 (56.7%) |
| 25 to 34 Years | 55 (24.3%) | 175 (77.4%) |
| 35 to 44 Years | 43 (33.6%) | 85 (66.4%) |
| 45 to 54 Years | 44 (29.5%) | 105 (70.5%) |
| 55 to 64 Years | 139 (35.0%) | 230 (57.9%) |
| 65 to 74 Years | 313 (94.9%) | 135 (40.9%) |
| 75 Years and over | 362 (98.4%) | 134 (36.4%) |
| Total | 1,237 (57.2%) | 1,113 (51.5%) |
Disability Status by Sex by Age in Horse Pasture
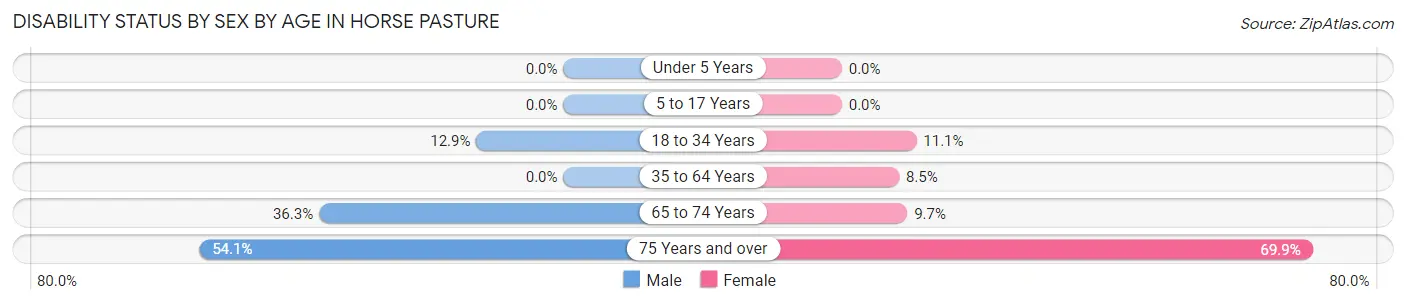
| Age Bracket | Male | Female |
| Under 5 Years | 0 (0.0%) | 0 (0.0%) |
| 5 to 17 Years | 0 (0.0%) | 0 (0.0%) |
| 18 to 34 Years | 19 (12.9%) | 27 (11.1%) |
| 35 to 64 Years | 0 (0.0%) | 27 (8.5%) |
| 65 to 74 Years | 45 (36.3%) | 20 (9.7%) |
| 75 Years and over | 93 (54.1%) | 137 (69.9%) |
Disability Class by Sex by Age in Horse Pasture
Disability Class: Hearing Difficulty
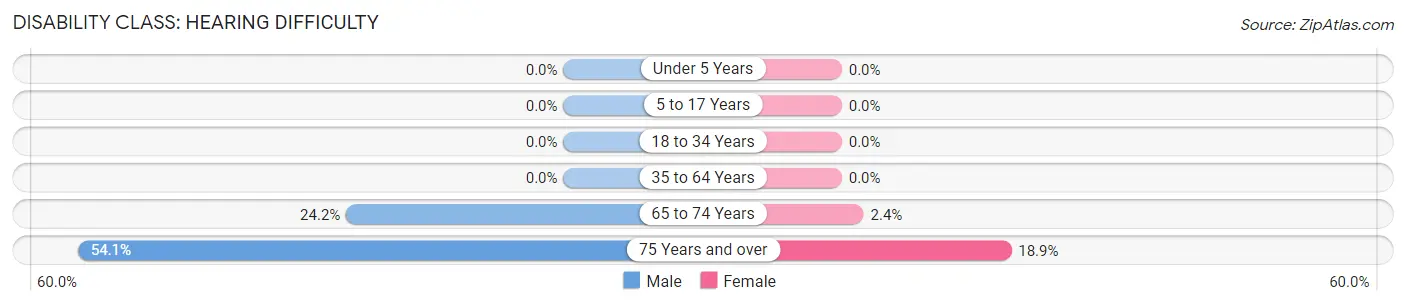
| Age Bracket | Male | Female |
| Under 5 Years | 0 (0.0%) | 0 (0.0%) |
| 5 to 17 Years | 0 (0.0%) | 0 (0.0%) |
| 18 to 34 Years | 0 (0.0%) | 0 (0.0%) |
| 35 to 64 Years | 0 (0.0%) | 0 (0.0%) |
| 65 to 74 Years | 30 (24.2%) | 5 (2.4%) |
| 75 Years and over | 93 (54.1%) | 37 (18.9%) |
Disability Class: Vision Difficulty
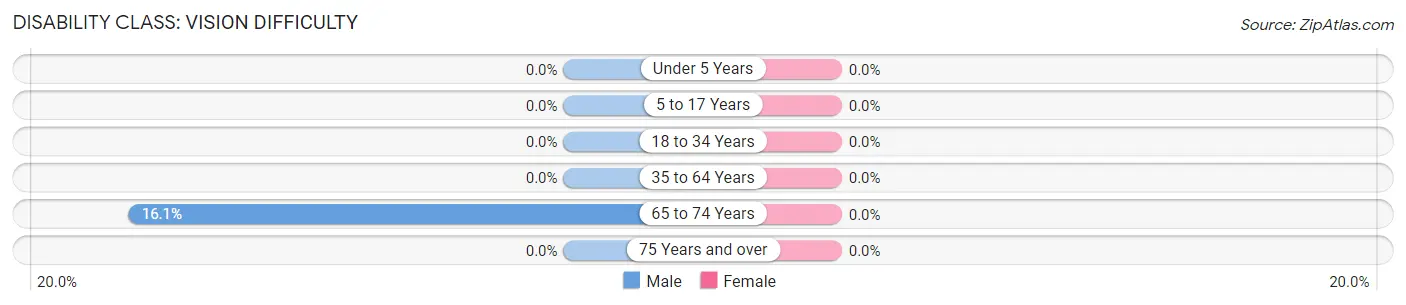
| Age Bracket | Male | Female |
| Under 5 Years | 0 (0.0%) | 0 (0.0%) |
| 5 to 17 Years | 0 (0.0%) | 0 (0.0%) |
| 18 to 34 Years | 0 (0.0%) | 0 (0.0%) |
| 35 to 64 Years | 0 (0.0%) | 0 (0.0%) |
| 65 to 74 Years | 20 (16.1%) | 0 (0.0%) |
| 75 Years and over | 0 (0.0%) | 0 (0.0%) |
Disability Class: Cognitive Difficulty
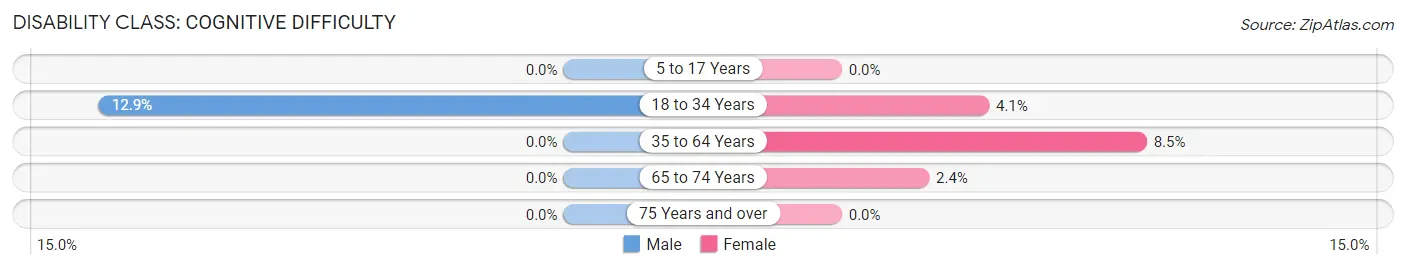
| Age Bracket | Male | Female |
| 5 to 17 Years | 0 (0.0%) | 0 (0.0%) |
| 18 to 34 Years | 19 (12.9%) | 10 (4.1%) |
| 35 to 64 Years | 0 (0.0%) | 27 (8.5%) |
| 65 to 74 Years | 0 (0.0%) | 5 (2.4%) |
| 75 Years and over | 0 (0.0%) | 0 (0.0%) |
Disability Class: Ambulatory Difficulty
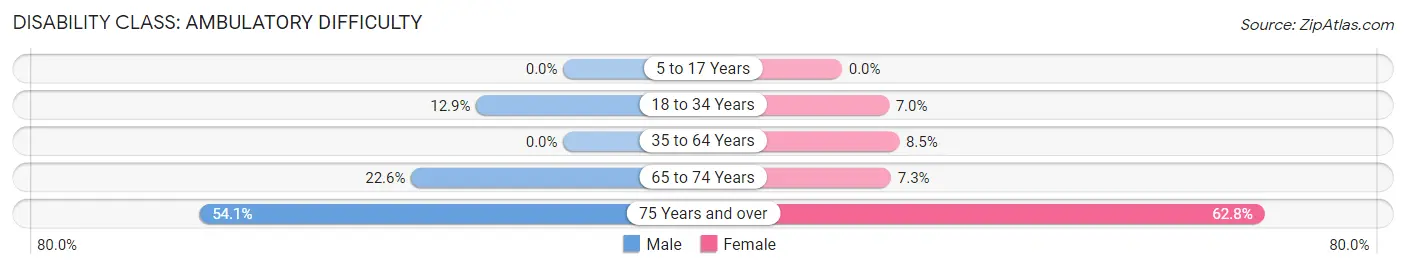
| Age Bracket | Male | Female |
| 5 to 17 Years | 0 (0.0%) | 0 (0.0%) |
| 18 to 34 Years | 19 (12.9%) | 17 (7.0%) |
| 35 to 64 Years | 0 (0.0%) | 27 (8.5%) |
| 65 to 74 Years | 28 (22.6%) | 15 (7.3%) |
| 75 Years and over | 93 (54.1%) | 123 (62.8%) |
Disability Class: Self-Care Difficulty
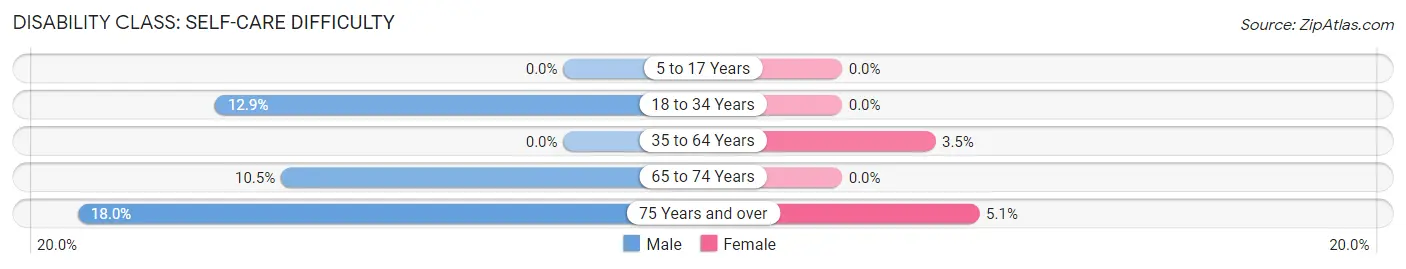
| Age Bracket | Male | Female |
| 5 to 17 Years | 0 (0.0%) | 0 (0.0%) |
| 18 to 34 Years | 19 (12.9%) | 0 (0.0%) |
| 35 to 64 Years | 0 (0.0%) | 11 (3.5%) |
| 65 to 74 Years | 13 (10.5%) | 0 (0.0%) |
| 75 Years and over | 31 (18.0%) | 10 (5.1%) |
Technology Access in Horse Pasture
Computing Device Access in Horse Pasture
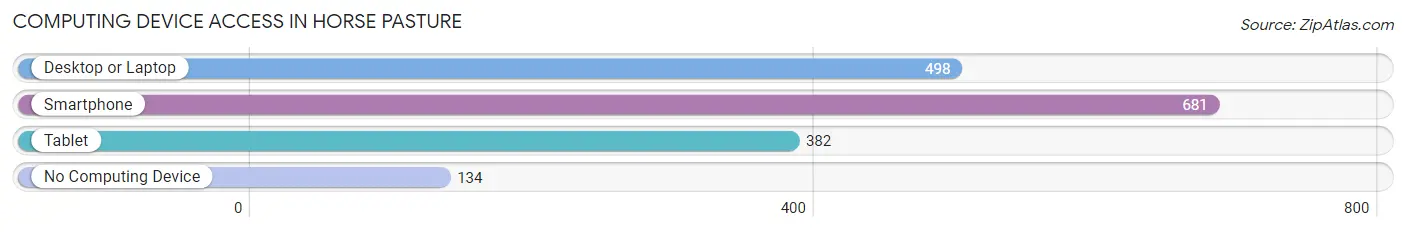
| Device Type | # Households | % Households |
| Desktop or Laptop | 498 | 56.5% |
| Smartphone | 681 | 77.2% |
| Tablet | 382 | 43.3% |
| No Computing Device | 134 | 15.2% |
| Total | 882 | 100.0% |
Internet Access in Horse Pasture
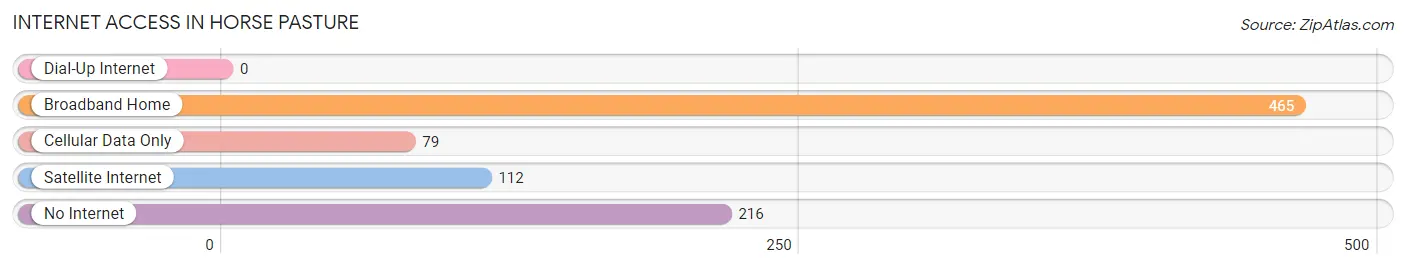
| Internet Type | # Households | % Households |
| Dial-Up Internet | 0 | 0.0% |
| Broadband Home | 465 | 52.7% |
| Cellular Data Only | 79 | 9.0% |
| Satellite Internet | 112 | 12.7% |
| No Internet | 216 | 24.5% |
| Total | 882 | 100.0% |
Horse Pasture Summary
Horse Pasture is an unincorporated community located in Pittsylvania County, Virginia. It is situated in the foothills of the Blue Ridge Mountains, approximately 20 miles south of the city of Danville. The community is named for the horse pastures that were once common in the area.
History
The area that is now Horse Pasture was first settled in the late 1700s by European settlers. The first settlers were primarily of English and German descent. The area was largely agricultural, with the main crops being tobacco, corn, and wheat. The area was also known for its horse breeding and racing.
In the early 1800s, the area was home to several small churches, including the Horse Pasture Baptist Church, which was founded in 1812. The church is still active today and is the oldest church in the area.
In the late 1800s, the area began to experience a period of growth and development. The railroad was extended to the area, and several businesses were established, including a sawmill, a gristmill, and a general store.
Geography
Horse Pasture is located in the foothills of the Blue Ridge Mountains in Pittsylvania County, Virginia. The community is situated along the banks of the Dan River, which flows through the area. The area is mostly rural, with rolling hills and forests. The climate is temperate, with hot summers and cold winters.
Economy
The economy of Horse Pasture is largely based on agriculture. The main crops grown in the area are tobacco, corn, and wheat. The area is also known for its horse breeding and racing. In addition, there are several small businesses in the area, including a sawmill, a gristmill, and a general store.
Demographics
As of the 2010 census, the population of Horse Pasture was 1,845. The racial makeup of the community was 97.3% White, 0.9% African American, 0.3% Native American, 0.2% Asian, and 1.3% from other races. The median household income was $37,917, and the median age was 41.7 years. The majority of the population (90.3%) was born in the United States.
Conclusion
Horse Pasture is an unincorporated community located in Pittsylvania County, Virginia. It is situated in the foothills of the Blue Ridge Mountains, approximately 20 miles south of the city of Danville. The area was first settled in the late 1700s by European settlers, and the economy is largely based on agriculture. As of the 2010 census, the population of Horse Pasture was 1,845. The racial makeup of the community was 97.3% White, 0.9% African American, 0.3% Native American, 0.2% Asian, and 1.3% from other races. The median household income was $37,917, and the median age was 41.7 years. The majority of the population (90.3%) was born in the United States.
Common Questions
What is Per Capita Income in Horse Pasture?
Per Capita income in Horse Pasture is $23,472.
What is the Median Family Income in Horse Pasture?
Median Family Income in Horse Pasture is $55,736.
What is the Median Household income in Horse Pasture?
Median Household Income in Horse Pasture is $50,094.
What is Income or Wage Gap in Horse Pasture?
Income or Wage Gap in Horse Pasture is 8.3%.
Women in Horse Pasture earn 91.7 cents for every dollar earned by a man.
What is Inequality or Gini Index in Horse Pasture?
Inequality or Gini Index in Horse Pasture is 0.39.
What is the Total Population of Horse Pasture?
Total Population of Horse Pasture is 2,291.
What is the Total Male Population of Horse Pasture?
Total Male Population of Horse Pasture is 1,196.
What is the Total Female Population of Horse Pasture?
Total Female Population of Horse Pasture is 1,095.
What is the Ratio of Males per 100 Females in Horse Pasture?
There are 109.22 Males per 100 Females in Horse Pasture.
What is the Ratio of Females per 100 Males in Horse Pasture?
There are 91.56 Females per 100 Males in Horse Pasture.
What is the Median Population Age in Horse Pasture?
Median Population Age in Horse Pasture is 53.3 Years.
What is the Average Family Size in Horse Pasture
Average Family Size in Horse Pasture is 3.3 People.
What is the Average Household Size in Horse Pasture
Average Household Size in Horse Pasture is 2.5 People.
How Large is the Labor Force in Horse Pasture?
There are 792 People in the Labor Forcein in Horse Pasture.
What is the Percentage of People in the Labor Force in Horse Pasture?
41.8% of People are in the Labor Force in Horse Pasture.
What is the Unemployment Rate in Horse Pasture?
Unemployment Rate in Horse Pasture is 4.3%.