Piney Mountain, VA Map & Demographics
Piney Mountain Map
Piney Mountain Overview
$38,869
PER CAPITA INCOME
$115,536
AVG FAMILY INCOME
$122,564
AVG HOUSEHOLD INCOME
17.2%
WAGE / INCOME GAP [ % ]
82.8¢/ $1
WAGE / INCOME GAP [ $ ]
0.29
INEQUALITY / GINI INDEX
2,415
TOTAL POPULATION
1,364
MALE POPULATION
1,051
FEMALE POPULATION
129.78
MALES / 100 FEMALES
77.05
FEMALES / 100 MALES
34.3
MEDIAN AGE
3.7
AVG FAMILY SIZE
3.5
AVG HOUSEHOLD SIZE
1,220
LABOR FORCE [ PEOPLE ]
70.7%
PERCENT IN LABOR FORCE
Income in Piney Mountain
Income Overview in Piney Mountain
Per Capita Income in Piney Mountain is $38,869, while median incomes of families and households are $115,536 and $122,564 respectively.
| Characteristic | Number | Measure |
| Per Capita Income | 2,415 | $38,869 |
| Median Family Income | 528 | $115,536 |
| Mean Family Income | 528 | $116,208 |
| Median Household Income | 684 | $122,564 |
| Mean Household Income | 684 | $126,400 |
| Income Deficit | 528 | $0 |
| Wage / Income Gap (%) | 2,415 | 17.21% |
| Wage / Income Gap ($) | 2,415 | 82.79¢ per $1 |
| Gini / Inequality Index | 2,415 | 0.29 |
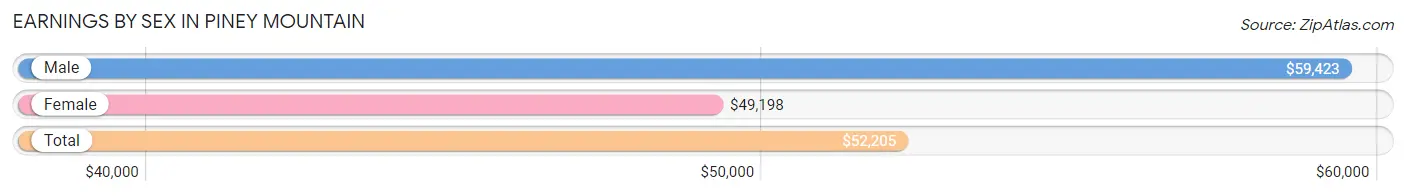
Earnings by Sex in Piney Mountain
Average Earnings in Piney Mountain are $52,205, $59,423 for men and $49,198 for women, a difference of 17.2%.
| Sex | Number | Average Earnings |
| Male | 650 (51.0%) | $59,423 |
| Female | 625 (49.0%) | $49,198 |
| Total | 1,275 (100.0%) | $52,205 |
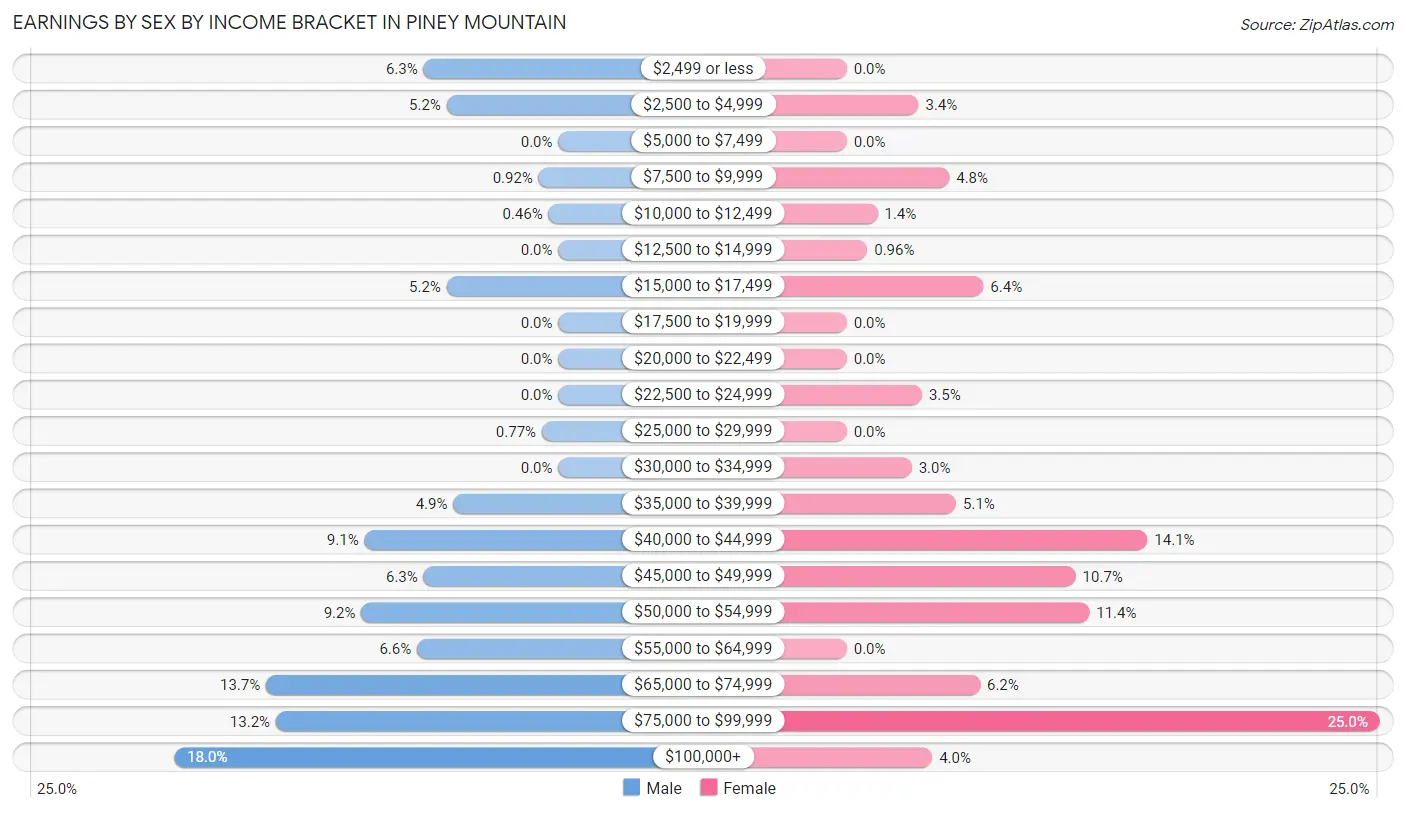
Earnings by Sex by Income Bracket in Piney Mountain
The most common earnings brackets in Piney Mountain are $100,000+ for men (117 | 18.0%) and $75,000 to $99,999 for women (156 | 25.0%).
| Income | Male | Female |
| $2,499 or less | 41 (6.3%) | 0 (0.0%) |
| $2,500 to $4,999 | 34 (5.2%) | 21 (3.4%) |
| $5,000 to $7,499 | 0 (0.0%) | 0 (0.0%) |
| $7,500 to $9,999 | 6 (0.9%) | 30 (4.8%) |
| $10,000 to $12,499 | 3 (0.5%) | 9 (1.4%) |
| $12,500 to $14,999 | 0 (0.0%) | 6 (1.0%) |
| $15,000 to $17,499 | 34 (5.2%) | 40 (6.4%) |
| $17,500 to $19,999 | 0 (0.0%) | 0 (0.0%) |
| $20,000 to $22,499 | 0 (0.0%) | 0 (0.0%) |
| $22,500 to $24,999 | 0 (0.0%) | 22 (3.5%) |
| $25,000 to $29,999 | 5 (0.8%) | 0 (0.0%) |
| $30,000 to $34,999 | 0 (0.0%) | 19 (3.0%) |
| $35,000 to $39,999 | 32 (4.9%) | 32 (5.1%) |
| $40,000 to $44,999 | 59 (9.1%) | 88 (14.1%) |
| $45,000 to $49,999 | 41 (6.3%) | 67 (10.7%) |
| $50,000 to $54,999 | 60 (9.2%) | 71 (11.4%) |
| $55,000 to $64,999 | 43 (6.6%) | 0 (0.0%) |
| $65,000 to $74,999 | 89 (13.7%) | 39 (6.2%) |
| $75,000 to $99,999 | 86 (13.2%) | 156 (25.0%) |
| $100,000+ | 117 (18.0%) | 25 (4.0%) |
| Total | 650 (100.0%) | 625 (100.0%) |
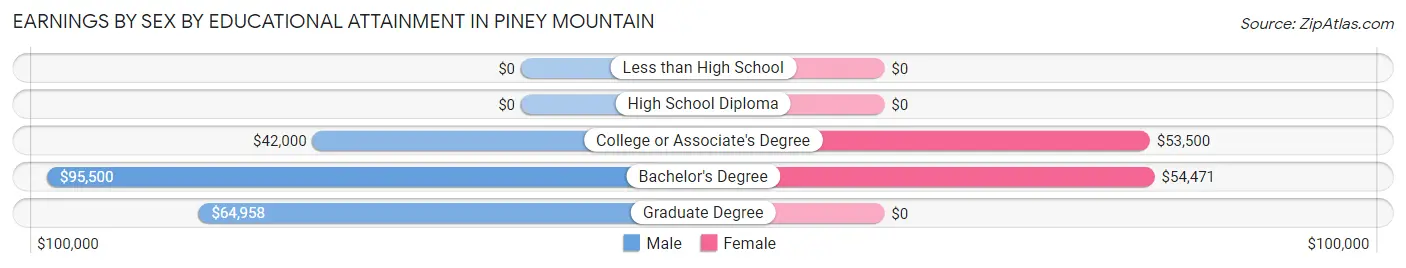
Earnings by Sex by Educational Attainment in Piney Mountain
Average earnings in Piney Mountain are $66,705 for men and $52,000 for women, a difference of 22.0%. Men with an educational attainment of bachelor's degree enjoy the highest average annual earnings of $95,500, while those with college or associate's degree education earn the least with $42,000. Women with an educational attainment of bachelor's degree earn the most with the average annual earnings of $54,471, while those with college or associate's degree education have the smallest earnings of $53,500.
| Educational Attainment | Male Income | Female Income |
| Less than High School | - | - |
| High School Diploma | - | - |
| College or Associate's Degree | $42,000 | $53,500 |
| Bachelor's Degree | $95,500 | $54,471 |
| Graduate Degree | $64,958 | $0 |
| Total | $66,705 | $52,000 |
Family Income in Piney Mountain
Family Income Brackets in Piney Mountain
According to the Piney Mountain family income data, there are 235 families falling into the $100,000 to $149,999 income range, which is the most common income bracket and makes up 44.5% of all families.
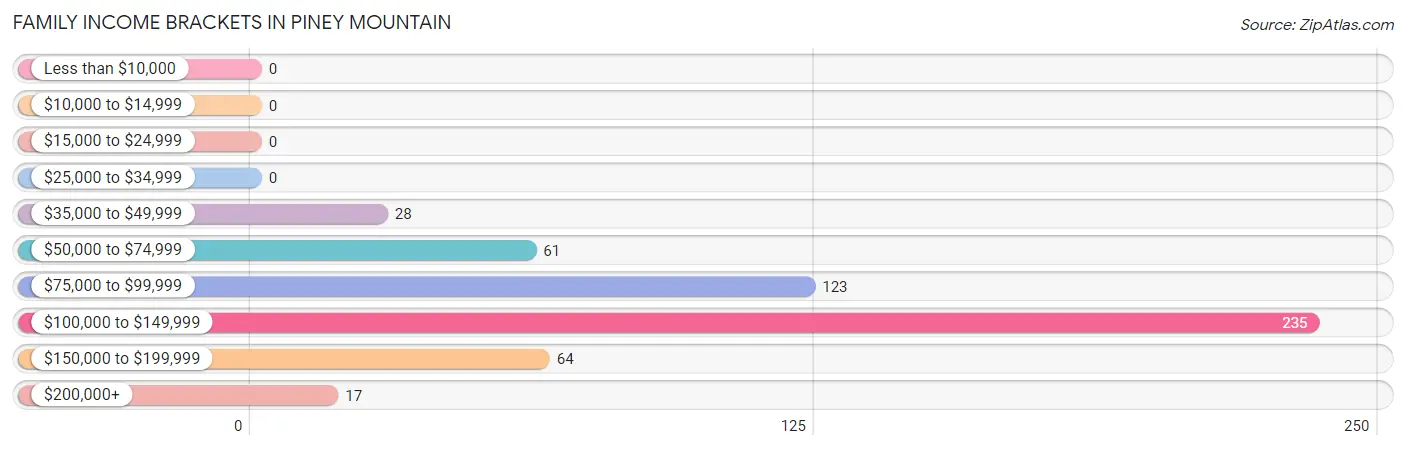
| Income Bracket | # Families | % Families |
| Less than $10,000 | 0 | 0.0% |
| $10,000 to $14,999 | 0 | 0.0% |
| $15,000 to $24,999 | 0 | 0.0% |
| $25,000 to $34,999 | 0 | 0.0% |
| $35,000 to $49,999 | 28 | 5.3% |
| $50,000 to $74,999 | 61 | 11.6% |
| $75,000 to $99,999 | 123 | 23.3% |
| $100,000 to $149,999 | 235 | 44.5% |
| $150,000 to $199,999 | 64 | 12.1% |
| $200,000+ | 17 | 3.2% |
Family Income by Famaliy Size in Piney Mountain
5-person families (84 | 15.9%) account for the highest median family income in Piney Mountain with $121,563 per family, while 2-person families (84 | 15.9%) have the highest median income of $58,572 per family member.
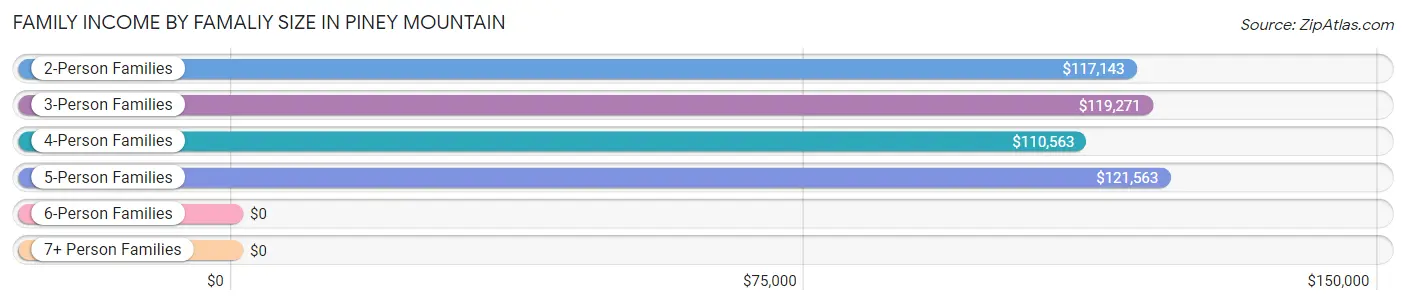
| Income Bracket | # Families | Median Income |
| 2-Person Families | 84 (15.9%) | $117,143 |
| 3-Person Families | 162 (30.7%) | $119,271 |
| 4-Person Families | 198 (37.5%) | $110,563 |
| 5-Person Families | 84 (15.9%) | $121,563 |
| 6-Person Families | 0 (0.0%) | $0 |
| 7+ Person Families | 0 (0.0%) | $0 |
| Total | 528 (100.0%) | $115,536 |
Family Income by Number of Earners in Piney Mountain
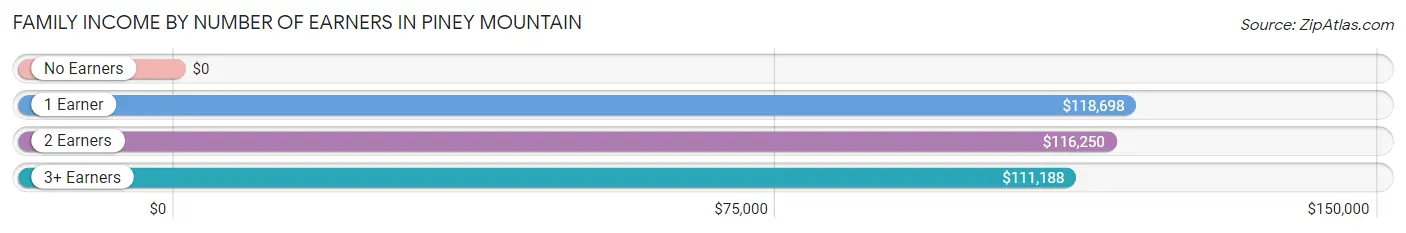
| Number of Earners | # Families | Median Income |
| No Earners | 11 (2.1%) | $0 |
| 1 Earner | 155 (29.4%) | $118,698 |
| 2 Earners | 222 (42.0%) | $116,250 |
| 3+ Earners | 140 (26.5%) | $111,188 |
| Total | 528 (100.0%) | $115,536 |
Household Income in Piney Mountain
Household Income Brackets in Piney Mountain
With 200 households falling in the category, the $100,000 to $149,999 income range is the most frequent in Piney Mountain, accounting for 29.2% of all households.
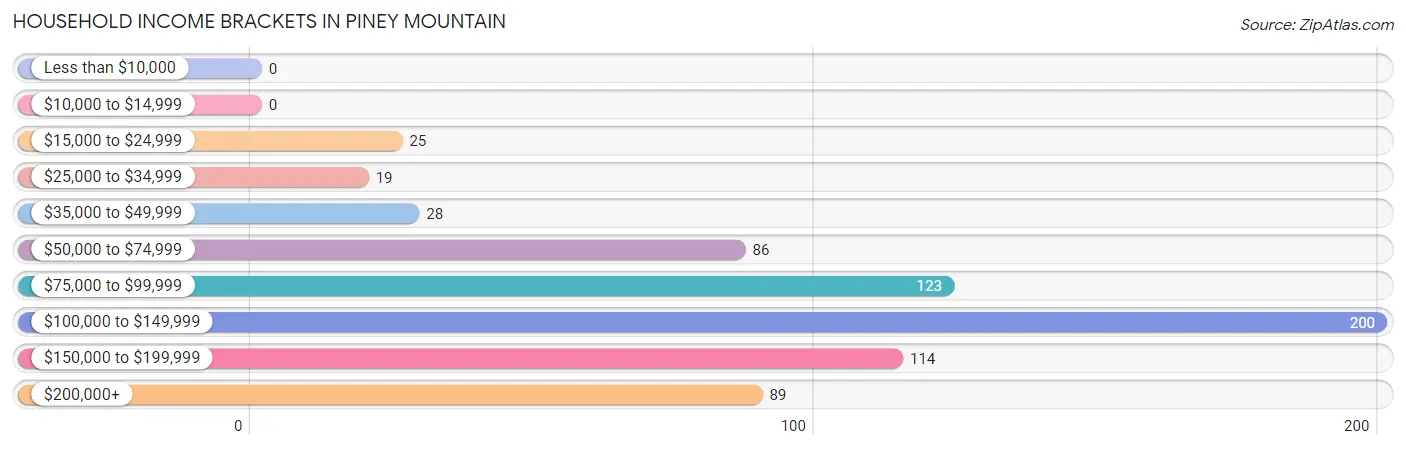
| Income Bracket | # Households | % Households |
| Less than $10,000 | 0 | 0.0% |
| $10,000 to $14,999 | 0 | 0.0% |
| $15,000 to $24,999 | 25 | 3.7% |
| $25,000 to $34,999 | 19 | 2.8% |
| $35,000 to $49,999 | 28 | 4.1% |
| $50,000 to $74,999 | 86 | 12.6% |
| $75,000 to $99,999 | 123 | 18.0% |
| $100,000 to $149,999 | 200 | 29.2% |
| $150,000 to $199,999 | 114 | 16.7% |
| $200,000+ | 89 | 13.0% |
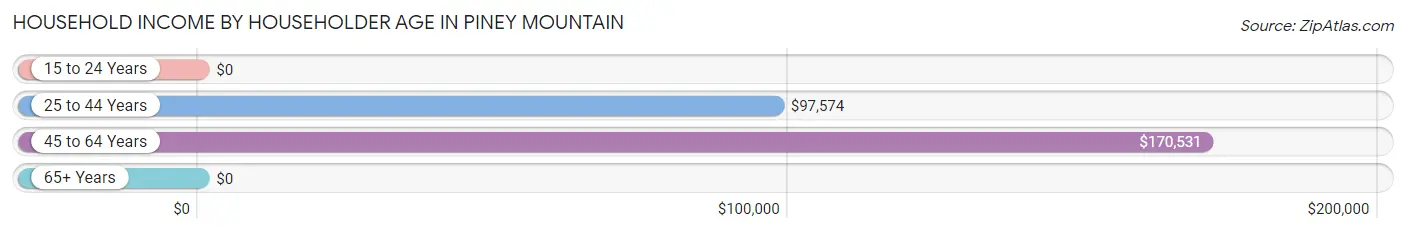
Household Income by Householder Age in Piney Mountain
The median household income in Piney Mountain is $122,564, with the highest median household income of $170,531 found in the 45 to 64 years age bracket for the primary householder. A total of 291 households (42.5%) fall into this category.
| Income Bracket | # Households | Median Income |
| 15 to 24 Years | 0 (0.0%) | $0 |
| 25 to 44 Years | 339 (49.6%) | $97,574 |
| 45 to 64 Years | 291 (42.5%) | $170,531 |
| 65+ Years | 54 (7.9%) | $0 |
| Total | 684 (100.0%) | $122,564 |
Poverty in Piney Mountain
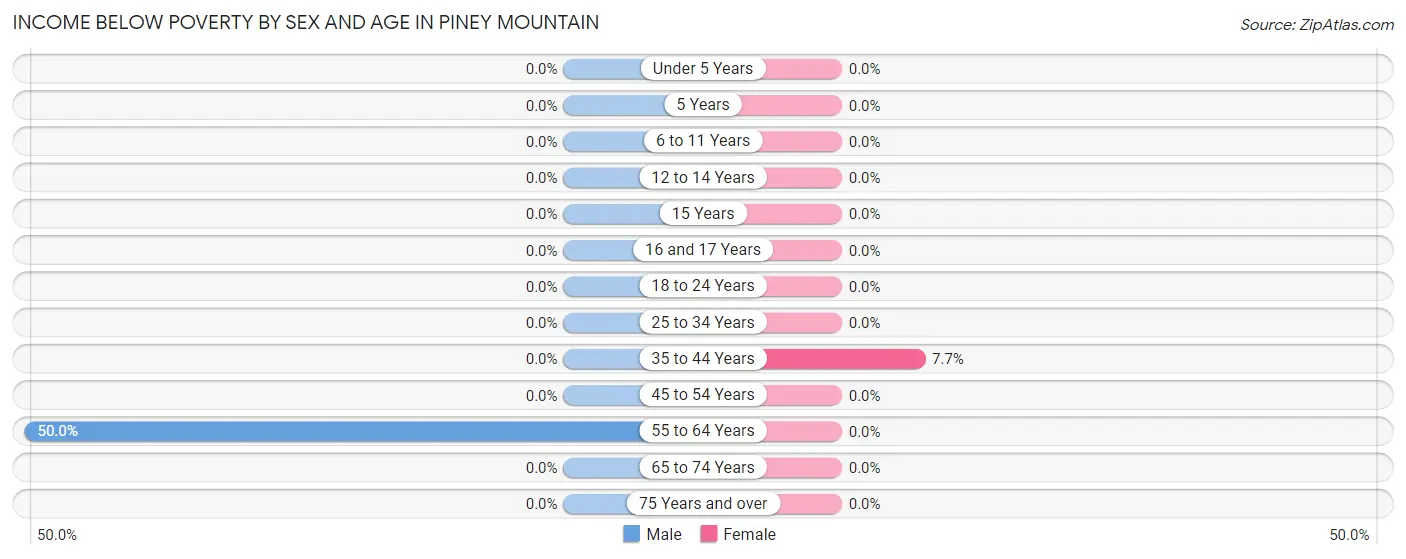
Income Below Poverty by Sex and Age in Piney Mountain
With 5.4% poverty level for males and 1.7% for females among the residents of Piney Mountain, 55 to 64 year old males and 35 to 44 year old females are the most vulnerable to poverty, with 73 males (50.0%) and 18 females (7.7%) in their respective age groups living below the poverty level.
| Age Bracket | Male | Female |
| Under 5 Years | 0 (0.0%) | 0 (0.0%) |
| 5 Years | 0 (0.0%) | 0 (0.0%) |
| 6 to 11 Years | 0 (0.0%) | 0 (0.0%) |
| 12 to 14 Years | 0 (0.0%) | 0 (0.0%) |
| 15 Years | 0 (0.0%) | 0 (0.0%) |
| 16 and 17 Years | 0 (0.0%) | 0 (0.0%) |
| 18 to 24 Years | 0 (0.0%) | 0 (0.0%) |
| 25 to 34 Years | 0 (0.0%) | 0 (0.0%) |
| 35 to 44 Years | 0 (0.0%) | 18 (7.7%) |
| 45 to 54 Years | 0 (0.0%) | 0 (0.0%) |
| 55 to 64 Years | 73 (50.0%) | 0 (0.0%) |
| 65 to 74 Years | 0 (0.0%) | 0 (0.0%) |
| 75 Years and over | 0 (0.0%) | 0 (0.0%) |
| Total | 73 (5.4%) | 18 (1.7%) |
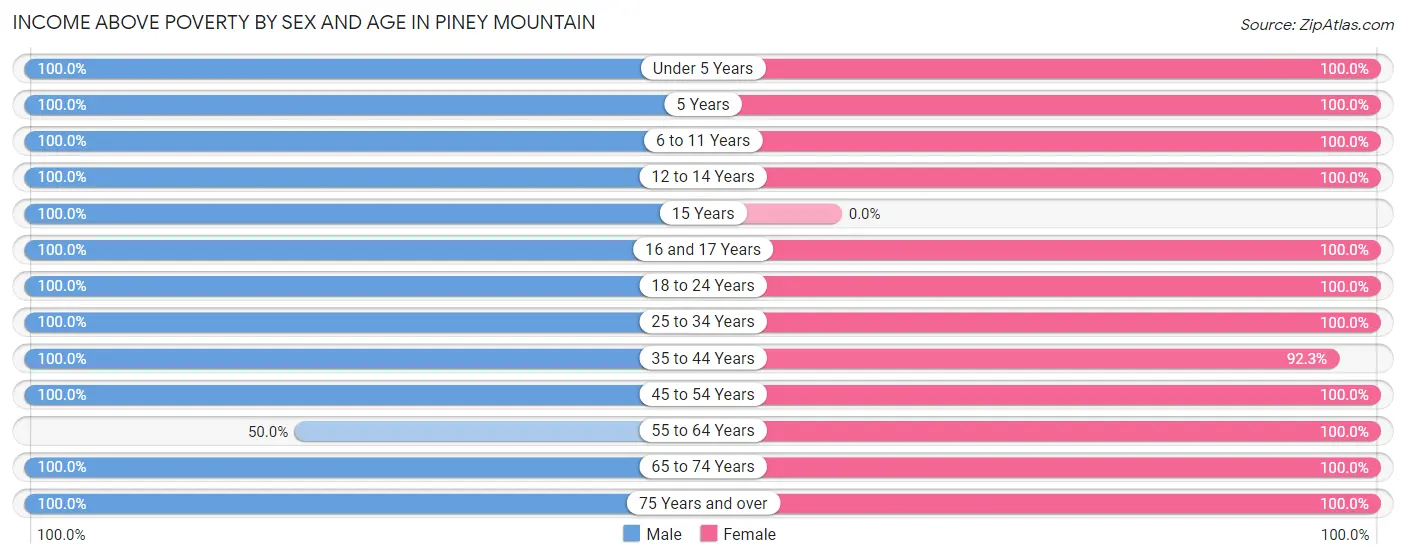
Income Above Poverty by Sex and Age in Piney Mountain
According to the poverty statistics in Piney Mountain, males aged under 5 years and females aged under 5 years are the age groups that are most secure financially, with 100.0% of males and 100.0% of females in these age groups living above the poverty line.
| Age Bracket | Male | Female |
| Under 5 Years | 101 (100.0%) | 153 (100.0%) |
| 5 Years | 5 (100.0%) | 8 (100.0%) |
| 6 to 11 Years | 205 (100.0%) | 78 (100.0%) |
| 12 to 14 Years | 45 (100.0%) | 14 (100.0%) |
| 15 Years | 64 (100.0%) | 0 (0.0%) |
| 16 and 17 Years | 33 (100.0%) | 4 (100.0%) |
| 18 to 24 Years | 136 (100.0%) | 75 (100.0%) |
| 25 to 34 Years | 128 (100.0%) | 165 (100.0%) |
| 35 to 44 Years | 165 (100.0%) | 215 (92.3%) |
| 45 to 54 Years | 211 (100.0%) | 145 (100.0%) |
| 55 to 64 Years | 73 (50.0%) | 71 (100.0%) |
| 65 to 74 Years | 97 (100.0%) | 88 (100.0%) |
| 75 Years and over | 11 (100.0%) | 17 (100.0%) |
| Total | 1,274 (94.6%) | 1,033 (98.3%) |
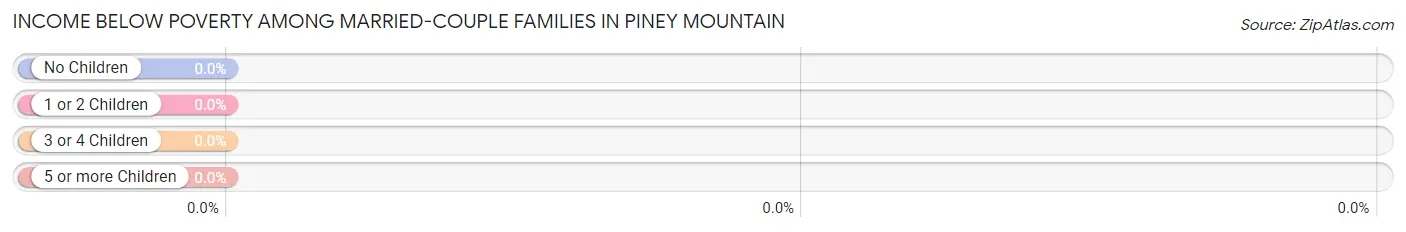
Income Below Poverty Among Married-Couple Families in Piney Mountain
| Children | Above Poverty | Below Poverty |
| No Children | 111 (100.0%) | 0 (0.0%) |
| 1 or 2 Children | 306 (100.0%) | 0 (0.0%) |
| 3 or 4 Children | 51 (100.0%) | 0 (0.0%) |
| 5 or more Children | 0 (0.0%) | 0 (0.0%) |
| Total | 468 (100.0%) | 0 (0.0%) |
Income Below Poverty Among Single-Parent Households in Piney Mountain
| Children | Single Father | Single Mother |
| No Children | 0 (0.0%) | 0 (0.0%) |
| 1 or 2 Children | 0 (0.0%) | 0 (0.0%) |
| 3 or 4 Children | 0 (0.0%) | 0 (0.0%) |
| 5 or more Children | 0 (0.0%) | 0 (0.0%) |
| Total | 0 (0.0%) | 0 (0.0%) |
Income Below Poverty Among Married-Couple vs Single-Parent Households in Piney Mountain
| Children | Married-Couple Families | Single-Parent Households |
| No Children | 0 (0.0%) | 0 (0.0%) |
| 1 or 2 Children | 0 (0.0%) | 0 (0.0%) |
| 3 or 4 Children | 0 (0.0%) | 0 (0.0%) |
| 5 or more Children | 0 (0.0%) | 0 (0.0%) |
| Total | 0 (0.0%) | 0 (0.0%) |
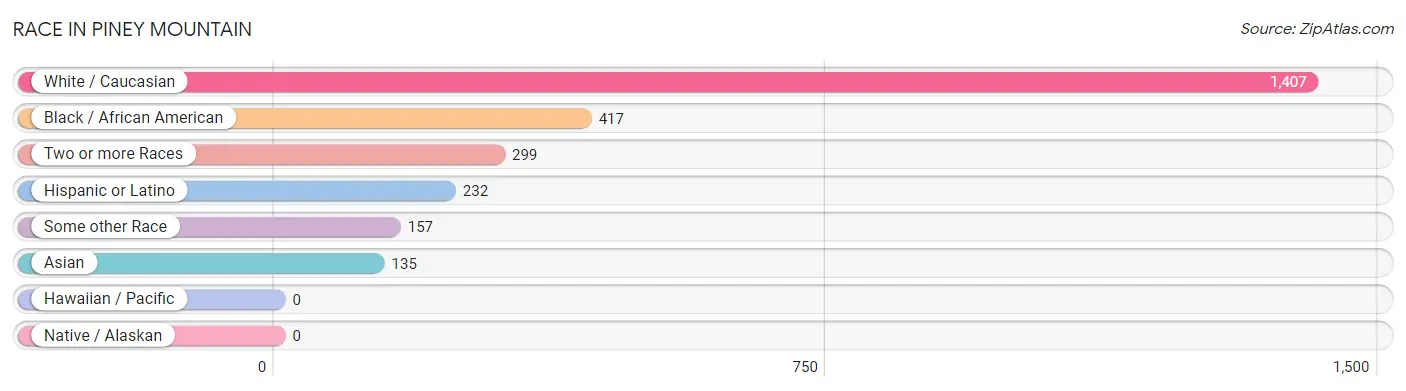
Race in Piney Mountain
The most populous races in Piney Mountain are White / Caucasian (1,407 | 58.3%), Black / African American (417 | 17.3%), and Two or more Races (299 | 12.4%).
| Race | # Population | % Population |
| Asian | 135 | 5.6% |
| Black / African American | 417 | 17.3% |
| Hawaiian / Pacific | 0 | 0.0% |
| Hispanic or Latino | 232 | 9.6% |
| Native / Alaskan | 0 | 0.0% |
| White / Caucasian | 1,407 | 58.3% |
| Two or more Races | 299 | 12.4% |
| Some other Race | 157 | 6.5% |
| Total | 2,415 | 100.0% |
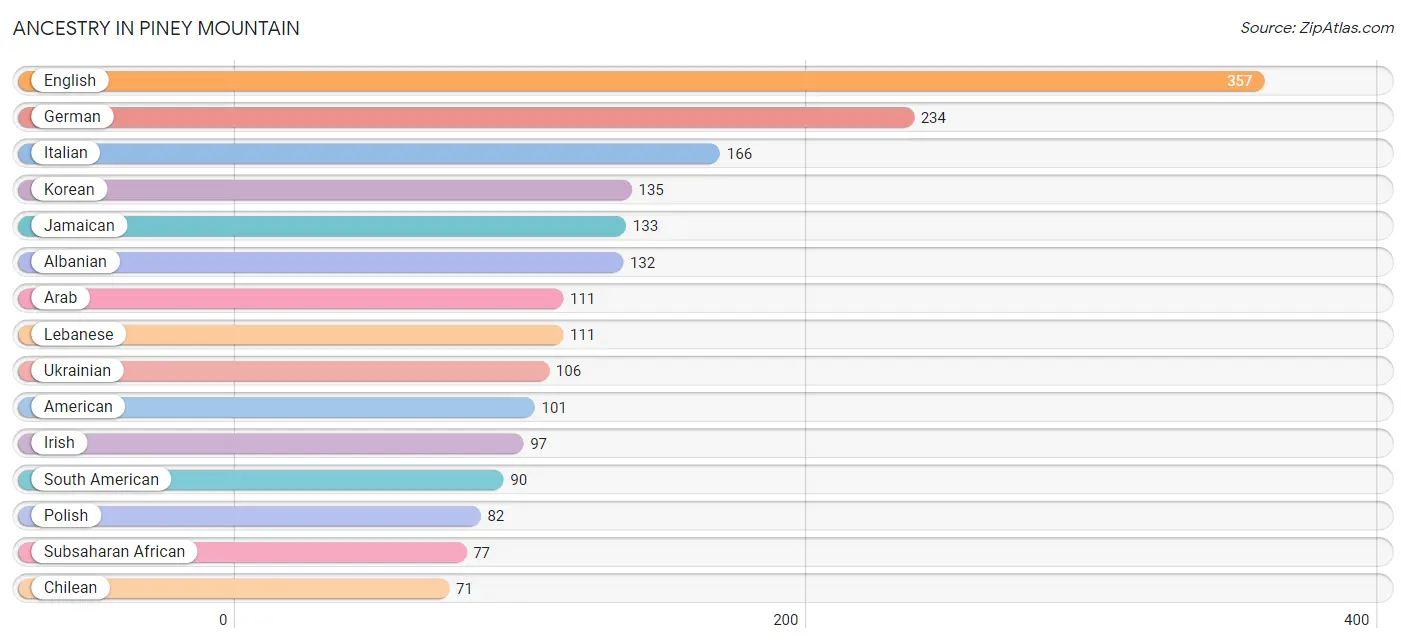
Ancestry in Piney Mountain
The most populous ancestries reported in Piney Mountain are English (357 | 14.8%), German (234 | 9.7%), Italian (166 | 6.9%), Korean (135 | 5.6%), and Jamaican (133 | 5.5%), together accounting for 42.4% of all Piney Mountain residents.
| Ancestry | # Population | % Population |
| African | 34 | 1.4% |
| Albanian | 132 | 5.5% |
| American | 101 | 4.2% |
| Arab | 111 | 4.6% |
| Argentinean | 19 | 0.8% |
| Bulgarian | 19 | 0.8% |
| Burmese | 67 | 2.8% |
| Chilean | 71 | 2.9% |
| Danish | 34 | 1.4% |
| Eastern European | 33 | 1.4% |
| English | 357 | 14.8% |
| European | 7 | 0.3% |
| German | 234 | 9.7% |
| Greek | 10 | 0.4% |
| Irish | 97 | 4.0% |
| Italian | 166 | 6.9% |
| Jamaican | 133 | 5.5% |
| Korean | 135 | 5.6% |
| Laotian | 15 | 0.6% |
| Lebanese | 111 | 4.6% |
| Polish | 82 | 3.4% |
| Puerto Rican | 34 | 1.4% |
| Scandinavian | 33 | 1.4% |
| Scottish | 16 | 0.7% |
| Serbian | 19 | 0.8% |
| South American | 90 | 3.7% |
| Subsaharan African | 77 | 3.2% |
| Ukrainian | 106 | 4.4% | View All 28 Rows |
Immigrants in Piney Mountain
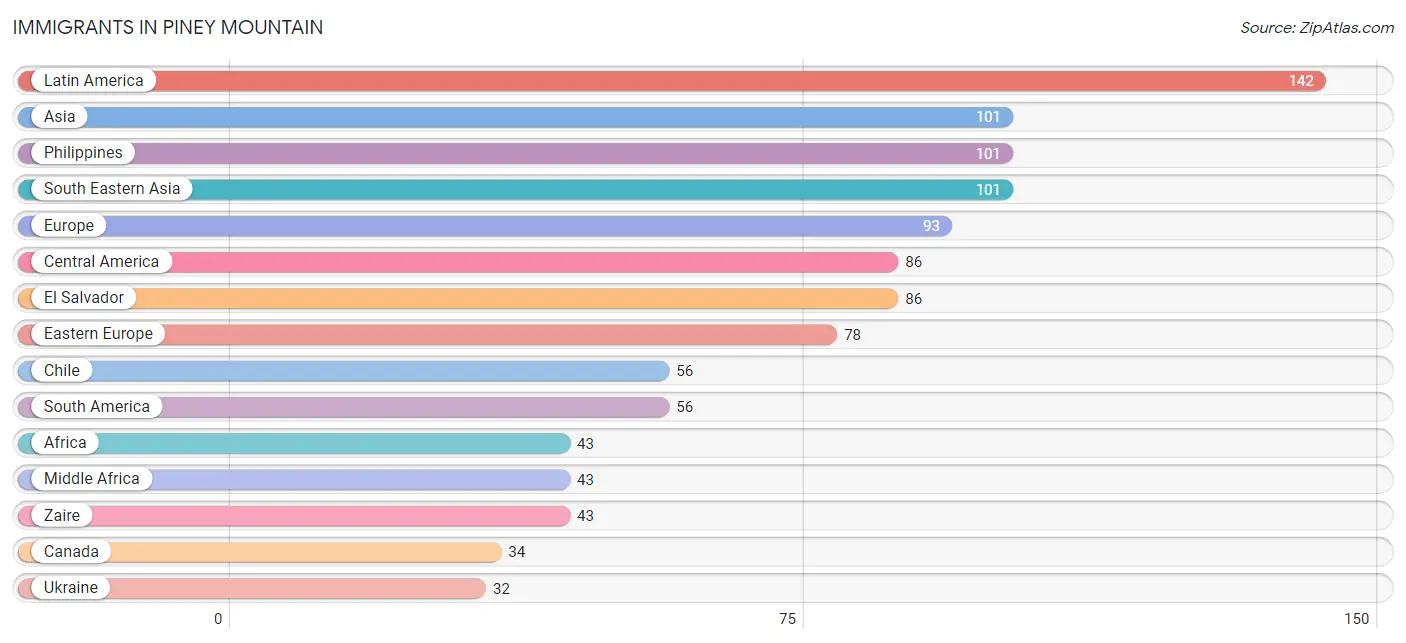
The most numerous immigrant groups reported in Piney Mountain came from Latin America (142 | 5.9%), Asia (101 | 4.2%), Philippines (101 | 4.2%), South Eastern Asia (101 | 4.2%), and Europe (93 | 3.8%), together accounting for 22.3% of all Piney Mountain residents.
| Immigration Origin | # Population | % Population |
| Africa | 43 | 1.8% |
| Asia | 101 | 4.2% |
| Canada | 34 | 1.4% |
| Central America | 86 | 3.6% |
| Chile | 56 | 2.3% |
| Eastern Europe | 78 | 3.2% |
| El Salvador | 86 | 3.6% |
| Europe | 93 | 3.8% |
| Latin America | 142 | 5.9% |
| Middle Africa | 43 | 1.8% |
| Philippines | 101 | 4.2% |
| South America | 56 | 2.3% |
| South Eastern Asia | 101 | 4.2% |
| Southern Europe | 15 | 0.6% |
| Spain | 15 | 0.6% |
| Ukraine | 32 | 1.3% |
| Zaire | 43 | 1.8% | View All 17 Rows |
Sex and Age in Piney Mountain
Sex and Age in Piney Mountain
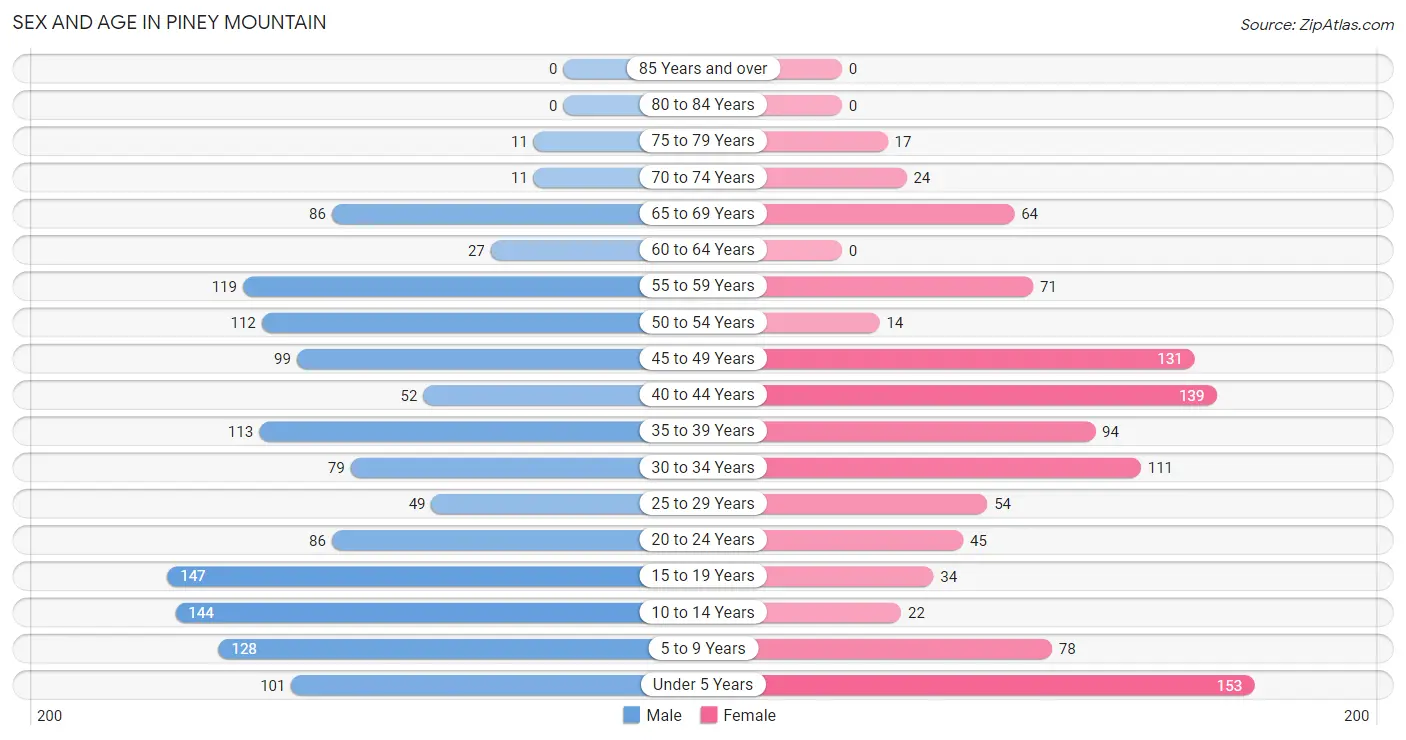
The most populous age groups in Piney Mountain are 15 to 19 Years (147 | 10.8%) for men and Under 5 Years (153 | 14.6%) for women.
| Age Bracket | Male | Female |
| Under 5 Years | 101 (7.4%) | 153 (14.6%) |
| 5 to 9 Years | 128 (9.4%) | 78 (7.4%) |
| 10 to 14 Years | 144 (10.6%) | 22 (2.1%) |
| 15 to 19 Years | 147 (10.8%) | 34 (3.2%) |
| 20 to 24 Years | 86 (6.3%) | 45 (4.3%) |
| 25 to 29 Years | 49 (3.6%) | 54 (5.1%) |
| 30 to 34 Years | 79 (5.8%) | 111 (10.6%) |
| 35 to 39 Years | 113 (8.3%) | 94 (8.9%) |
| 40 to 44 Years | 52 (3.8%) | 139 (13.2%) |
| 45 to 49 Years | 99 (7.3%) | 131 (12.5%) |
| 50 to 54 Years | 112 (8.2%) | 14 (1.3%) |
| 55 to 59 Years | 119 (8.7%) | 71 (6.8%) |
| 60 to 64 Years | 27 (2.0%) | 0 (0.0%) |
| 65 to 69 Years | 86 (6.3%) | 64 (6.1%) |
| 70 to 74 Years | 11 (0.8%) | 24 (2.3%) |
| 75 to 79 Years | 11 (0.8%) | 17 (1.6%) |
| 80 to 84 Years | 0 (0.0%) | 0 (0.0%) |
| 85 Years and over | 0 (0.0%) | 0 (0.0%) |
| Total | 1,364 (100.0%) | 1,051 (100.0%) |
Families and Households in Piney Mountain
Median Family Size in Piney Mountain
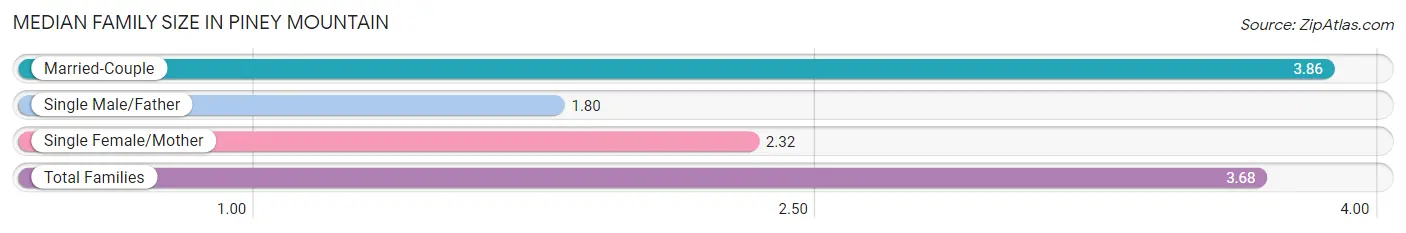
The median family size in Piney Mountain is 3.68 persons per family, with married-couple families (468 | 88.6%) accounting for the largest median family size of 3.86 persons per family. On the other hand, single male/father families (10 | 1.9%) represent the smallest median family size with 1.80 persons per family.
| Family Type | # Families | Family Size |
| Married-Couple | 468 (88.6%) | 3.86 |
| Single Male/Father | 10 (1.9%) | 1.80 |
| Single Female/Mother | 50 (9.5%) | 2.32 |
| Total Families | 528 (100.0%) | 3.68 |
Median Household Size in Piney Mountain
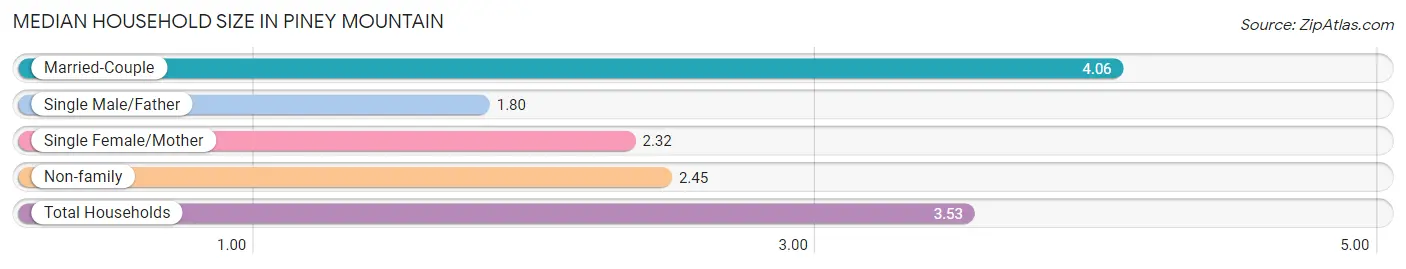
The median household size in Piney Mountain is 3.53 persons per household, with married-couple households (468 | 68.4%) accounting for the largest median household size of 4.06 persons per household. single male/father households (10 | 1.5%) represent the smallest median household size with 1.80 persons per household.
| Household Type | # Households | Household Size |
| Married-Couple | 468 (68.4%) | 4.06 |
| Single Male/Father | 10 (1.5%) | 1.80 |
| Single Female/Mother | 50 (7.3%) | 2.32 |
| Non-family | 156 (22.8%) | 2.45 |
| Total Households | 684 (100.0%) | 3.53 |
Household Size by Marriage Status in Piney Mountain
Out of a total of 684 households in Piney Mountain, 528 (77.2%) are family households, while 156 (22.8%) are nonfamily households. The most numerous type of family households are 4-person households, comprising 168, and the most common type of nonfamily households are 1-person households, comprising 93.
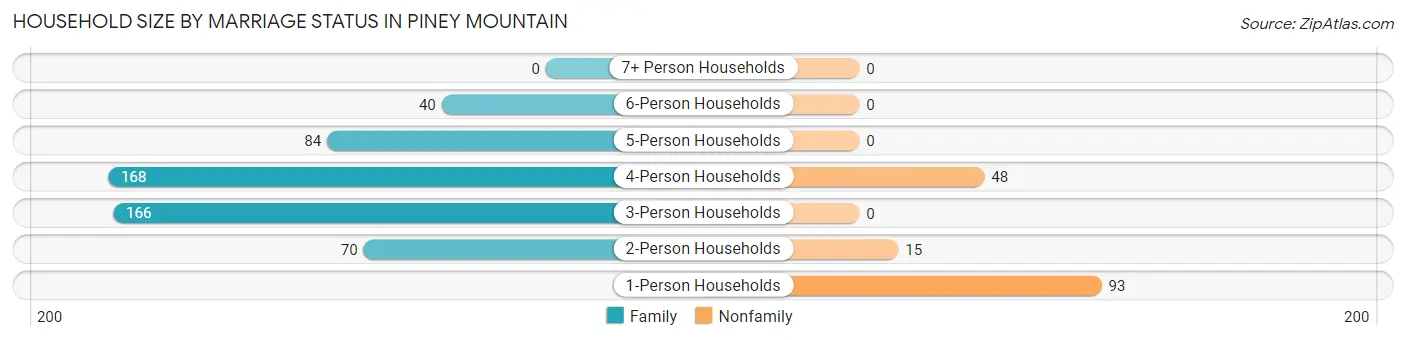
| Household Size | Family Households | Nonfamily Households |
| 1-Person Households | - | 93 (13.6%) |
| 2-Person Households | 70 (10.2%) | 15 (2.2%) |
| 3-Person Households | 166 (24.3%) | 0 (0.0%) |
| 4-Person Households | 168 (24.6%) | 48 (7.0%) |
| 5-Person Households | 84 (12.3%) | 0 (0.0%) |
| 6-Person Households | 40 (5.9%) | 0 (0.0%) |
| 7+ Person Households | 0 (0.0%) | 0 (0.0%) |
| Total | 528 (77.2%) | 156 (22.8%) |
Female Fertility in Piney Mountain
Fertility by Age in Piney Mountain
| Age Bracket | Women with Births | Births / 1,000 Women |
| 15 to 19 years | 0 (0.0%) | 0.0 |
| 20 to 34 years | 0 (0.0%) | 0.0 |
| 35 to 50 years | 0 (0.0%) | 0.0 |
| Total | 0 (0.0%) | 0.0 |
Fertility by Age by Marriage Status in Piney Mountain
| Age Bracket | Married | Unmarried |
| 15 to 19 years | 0 (0.0%) | 0 (0.0%) |
| 20 to 34 years | 0 (0.0%) | 0 (0.0%) |
| 35 to 50 years | 0 (0.0%) | 0 (0.0%) |
| Total | 0 (0.0%) | 0 (0.0%) |
Fertility by Education in Piney Mountain
| Educational Attainment | Women with Births | Births / 1,000 Women |
| Less than High School | 0 (0.0%) | 0.0 |
| High School Diploma | 0 (0.0%) | 0.0 |
| College or Associate's Degree | 0 (0.0%) | 0.0 |
| Bachelor's Degree | 0 (0.0%) | 0.0 |
| Graduate Degree | 0 (0.0%) | 0.0 |
| Total | 0 (0.0%) | 0.0 |
Fertility by Education by Marriage Status in Piney Mountain
| Educational Attainment | Married | Unmarried |
| Less than High School | 0 (0.0%) | 0 (0.0%) |
| High School Diploma | 0 (0.0%) | 0 (0.0%) |
| College or Associate's Degree | 0 (0.0%) | 0 (0.0%) |
| Bachelor's Degree | 0 (0.0%) | 0 (0.0%) |
| Graduate Degree | 0 (0.0%) | 0 (0.0%) |
| Total | 0 (0.0%) | 0 (0.0%) |
Employment Characteristics in Piney Mountain
Employment by Class of Employer in Piney Mountain
Among the 1,189 employed individuals in Piney Mountain, private company employees (817 | 68.7%), not-for-profit organizations (119 | 10.0%), and federal government employees (90 | 7.6%) make up the most common classes of employment.
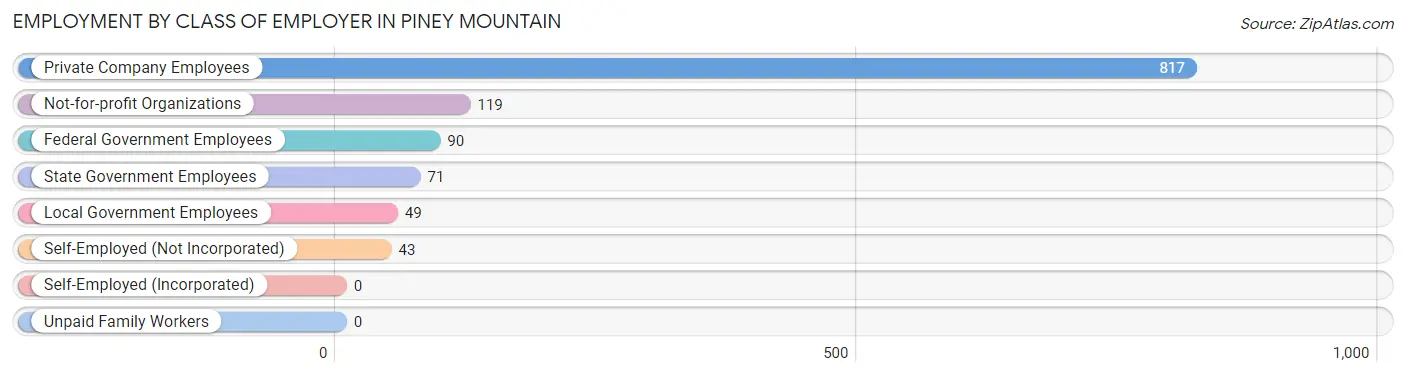
| Employer Class | # Employees | % Employees |
| Private Company Employees | 817 | 68.7% |
| Self-Employed (Incorporated) | 0 | 0.0% |
| Self-Employed (Not Incorporated) | 43 | 3.6% |
| Not-for-profit Organizations | 119 | 10.0% |
| Local Government Employees | 49 | 4.1% |
| State Government Employees | 71 | 6.0% |
| Federal Government Employees | 90 | 7.6% |
| Unpaid Family Workers | 0 | 0.0% |
| Total | 1,189 | 100.0% |
Employment Status by Age in Piney Mountain
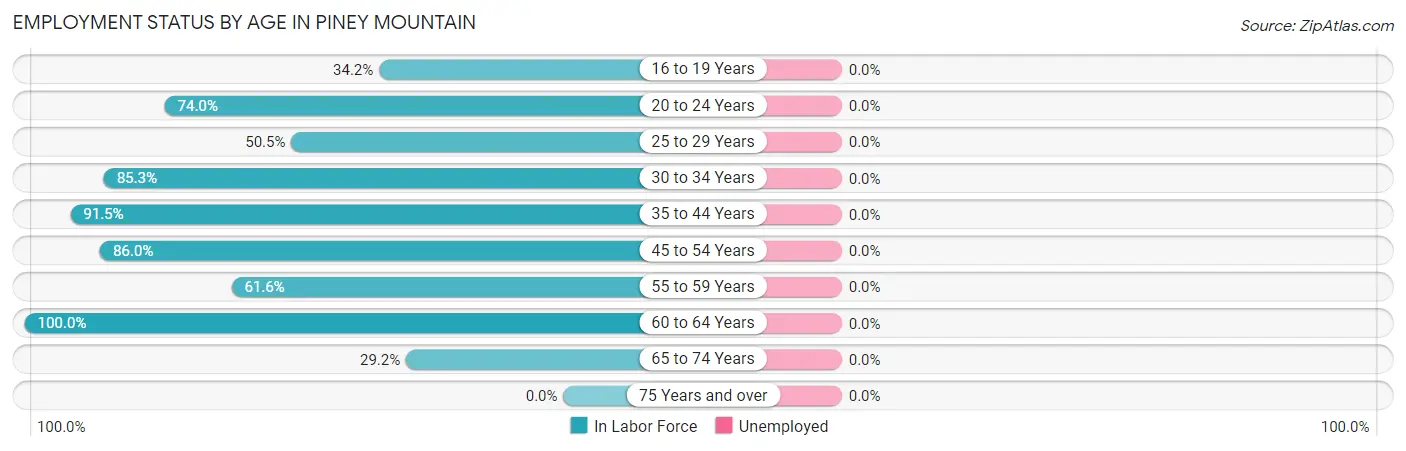
| Age Bracket | In Labor Force | Unemployed |
| 16 to 19 Years | 40 (34.2%) | 0 (0.0%) |
| 20 to 24 Years | 97 (74.0%) | 0 (0.0%) |
| 25 to 29 Years | 52 (50.5%) | 0 (0.0%) |
| 30 to 34 Years | 162 (85.3%) | 0 (0.0%) |
| 35 to 44 Years | 364 (91.5%) | 0 (0.0%) |
| 45 to 54 Years | 306 (86.0%) | 0 (0.0%) |
| 55 to 59 Years | 117 (61.6%) | 0 (0.0%) |
| 60 to 64 Years | 27 (100.0%) | 0 (0.0%) |
| 65 to 74 Years | 54 (29.2%) | 0 (0.0%) |
| 75 Years and over | 0 (0.0%) | 0 (0.0%) |
| Total | 1,220 (70.7%) | 0 (0.0%) |
Employment Status by Educational Attainment in Piney Mountain
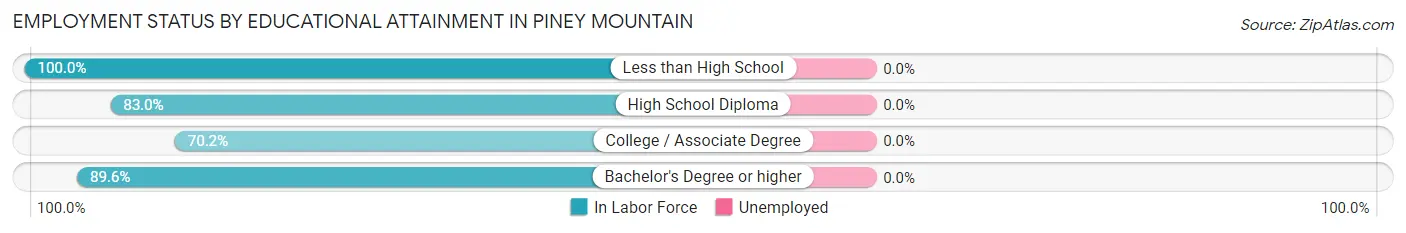
| Educational Attainment | In Labor Force | Unemployed |
| Less than High School | 22 (100.0%) | 0 (0.0%) |
| High School Diploma | 117 (83.0%) | 0 (0.0%) |
| College / Associate Degree | 354 (70.2%) | 0 (0.0%) |
| Bachelor's Degree or higher | 535 (89.6%) | 0 (0.0%) |
| Total | 1,028 (81.3%) | 0 (0.0%) |
Employment Occupations by Sex in Piney Mountain
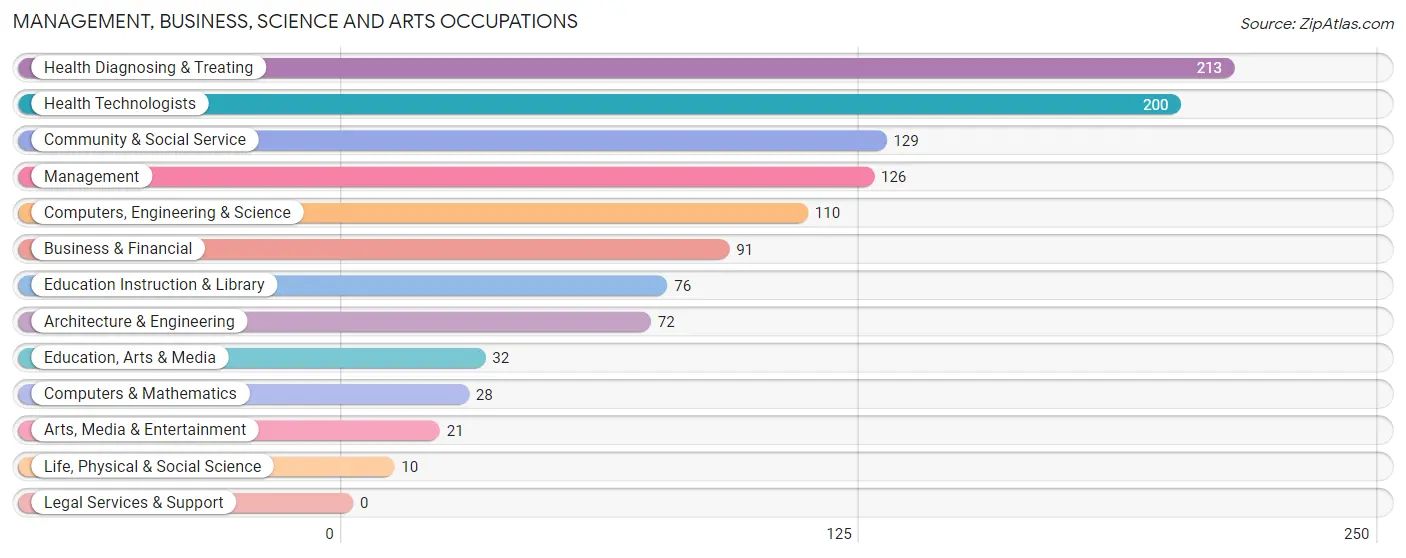
Management, Business, Science and Arts Occupations
The most common Management, Business, Science and Arts occupations in Piney Mountain are Health Diagnosing & Treating (213 | 17.8%), Health Technologists (200 | 16.7%), Community & Social Service (129 | 10.8%), Management (126 | 10.5%), and Computers, Engineering & Science (110 | 9.2%).
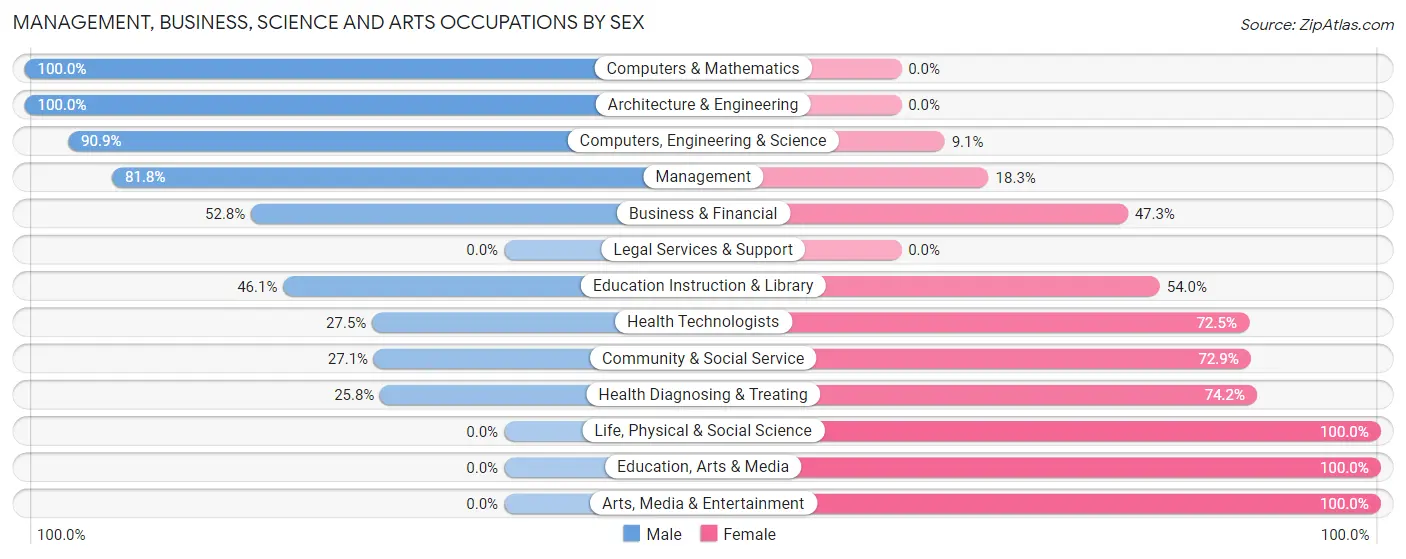
Management, Business, Science and Arts Occupations by Sex
Within the Management, Business, Science and Arts occupations in Piney Mountain, the most male-oriented occupations are Computers & Mathematics (100.0%), Architecture & Engineering (100.0%), and Computers, Engineering & Science (90.9%), while the most female-oriented occupations are Life, Physical & Social Science (100.0%), Education, Arts & Media (100.0%), and Arts, Media & Entertainment (100.0%).
| Occupation | Male | Female |
| Management | 103 (81.8%) | 23 (18.2%) |
| Business & Financial | 48 (52.7%) | 43 (47.2%) |
| Computers, Engineering & Science | 100 (90.9%) | 10 (9.1%) |
| Computers & Mathematics | 28 (100.0%) | 0 (0.0%) |
| Architecture & Engineering | 72 (100.0%) | 0 (0.0%) |
| Life, Physical & Social Science | 0 (0.0%) | 10 (100.0%) |
| Community & Social Service | 35 (27.1%) | 94 (72.9%) |
| Education, Arts & Media | 0 (0.0%) | 32 (100.0%) |
| Legal Services & Support | 0 (0.0%) | 0 (0.0%) |
| Education Instruction & Library | 35 (46.1%) | 41 (53.9%) |
| Arts, Media & Entertainment | 0 (0.0%) | 21 (100.0%) |
| Health Diagnosing & Treating | 55 (25.8%) | 158 (74.2%) |
| Health Technologists | 55 (27.5%) | 145 (72.5%) |
| Total (Category) | 341 (51.0%) | 328 (49.0%) |
| Total (Overall) | 572 (47.8%) | 625 (52.2%) |
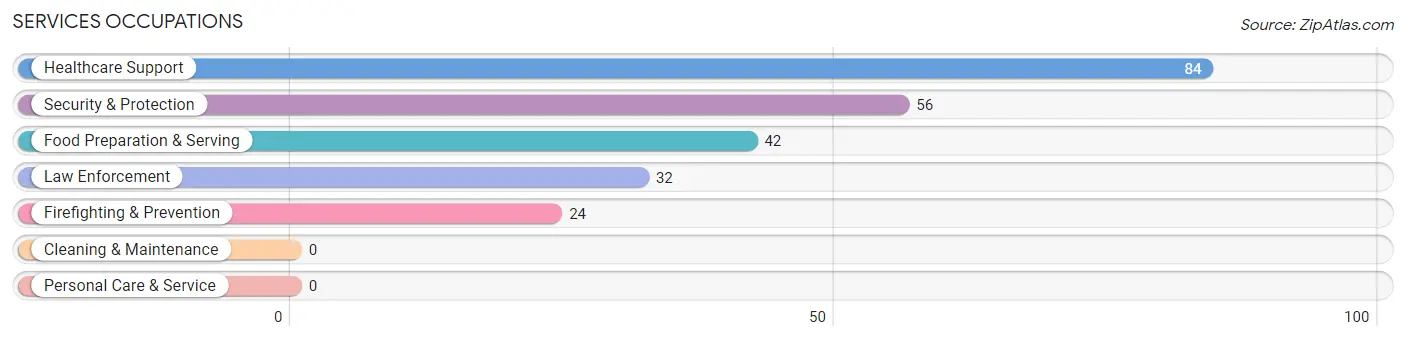
Services Occupations
The most common Services occupations in Piney Mountain are Healthcare Support (84 | 7.0%), Security & Protection (56 | 4.7%), Food Preparation & Serving (42 | 3.5%), Law Enforcement (32 | 2.7%), and Firefighting & Prevention (24 | 2.0%).
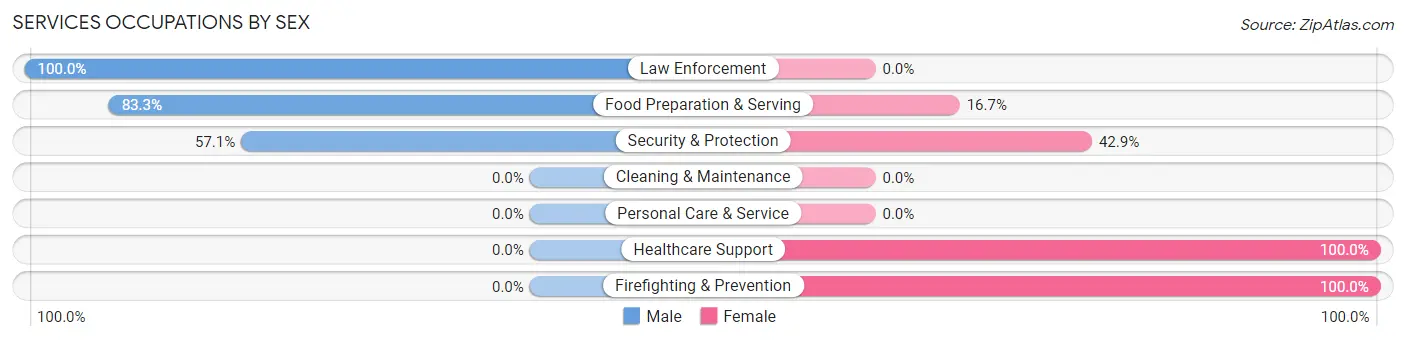
Services Occupations by Sex
Within the Services occupations in Piney Mountain, the most male-oriented occupations are Law Enforcement (100.0%), Food Preparation & Serving (83.3%), and Security & Protection (57.1%), while the most female-oriented occupations are Healthcare Support (100.0%), Firefighting & Prevention (100.0%), and Security & Protection (42.9%).
| Occupation | Male | Female |
| Healthcare Support | 0 (0.0%) | 84 (100.0%) |
| Security & Protection | 32 (57.1%) | 24 (42.9%) |
| Firefighting & Prevention | 0 (0.0%) | 24 (100.0%) |
| Law Enforcement | 32 (100.0%) | 0 (0.0%) |
| Food Preparation & Serving | 35 (83.3%) | 7 (16.7%) |
| Cleaning & Maintenance | 0 (0.0%) | 0 (0.0%) |
| Personal Care & Service | 0 (0.0%) | 0 (0.0%) |
| Total (Category) | 67 (36.8%) | 115 (63.2%) |
| Total (Overall) | 572 (47.8%) | 625 (52.2%) |
Sales and Office Occupations
The most common Sales and Office occupations in Piney Mountain are Office & Administration (183 | 15.3%), and Sales & Related (25 | 2.1%).
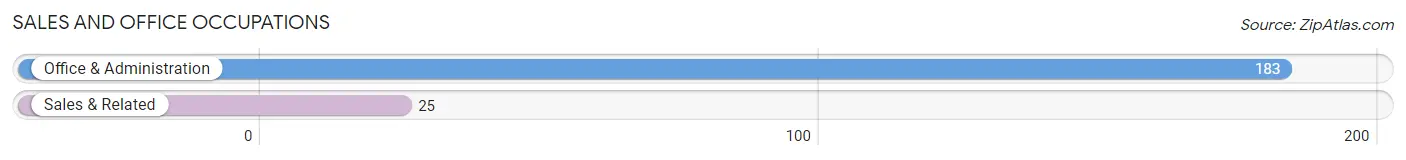
Sales and Office Occupations by Sex
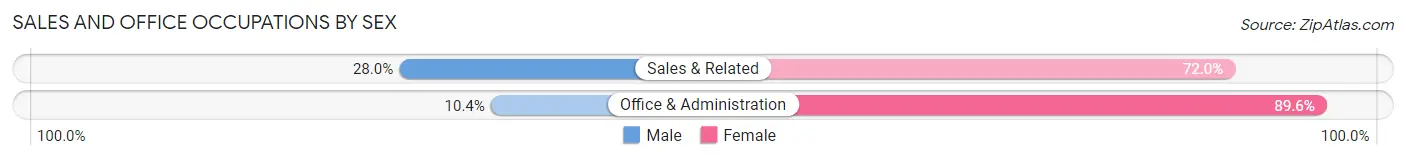
| Occupation | Male | Female |
| Sales & Related | 7 (28.0%) | 18 (72.0%) |
| Office & Administration | 19 (10.4%) | 164 (89.6%) |
| Total (Category) | 26 (12.5%) | 182 (87.5%) |
| Total (Overall) | 572 (47.8%) | 625 (52.2%) |
Natural Resources, Construction and Maintenance Occupations
The most common Natural Resources, Construction and Maintenance occupations in Piney Mountain are , and Installation, Maintenance & Repair (6 | 0.5%).
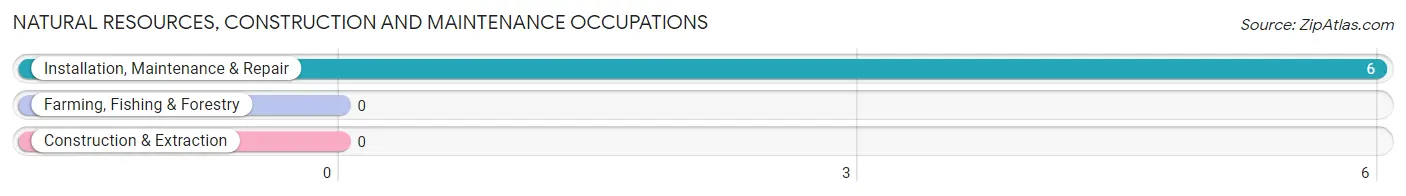
Natural Resources, Construction and Maintenance Occupations by Sex
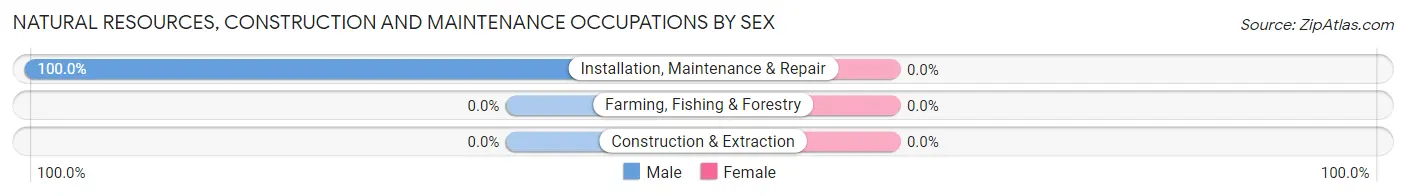
| Occupation | Male | Female |
| Farming, Fishing & Forestry | 0 (0.0%) | 0 (0.0%) |
| Construction & Extraction | 0 (0.0%) | 0 (0.0%) |
| Installation, Maintenance & Repair | 6 (100.0%) | 0 (0.0%) |
| Total (Category) | 6 (100.0%) | 0 (0.0%) |
| Total (Overall) | 572 (47.8%) | 625 (52.2%) |
Production, Transportation and Moving Occupations
The most common Production, Transportation and Moving occupations in Piney Mountain are Transportation (70 | 5.9%), Production (43 | 3.6%), and Material Moving (19 | 1.6%).
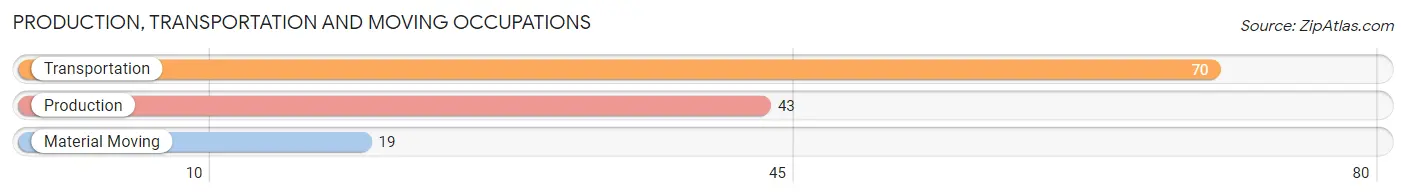
Production, Transportation and Moving Occupations by Sex
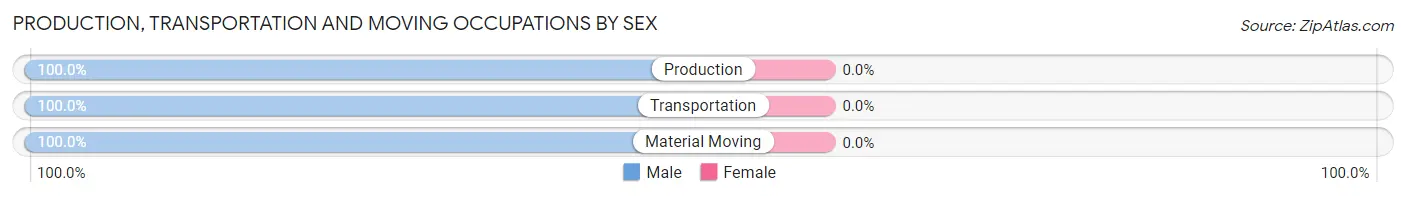
| Occupation | Male | Female |
| Production | 43 (100.0%) | 0 (0.0%) |
| Transportation | 70 (100.0%) | 0 (0.0%) |
| Material Moving | 19 (100.0%) | 0 (0.0%) |
| Total (Category) | 132 (100.0%) | 0 (0.0%) |
| Total (Overall) | 572 (47.8%) | 625 (52.2%) |
Employment Industries by Sex in Piney Mountain
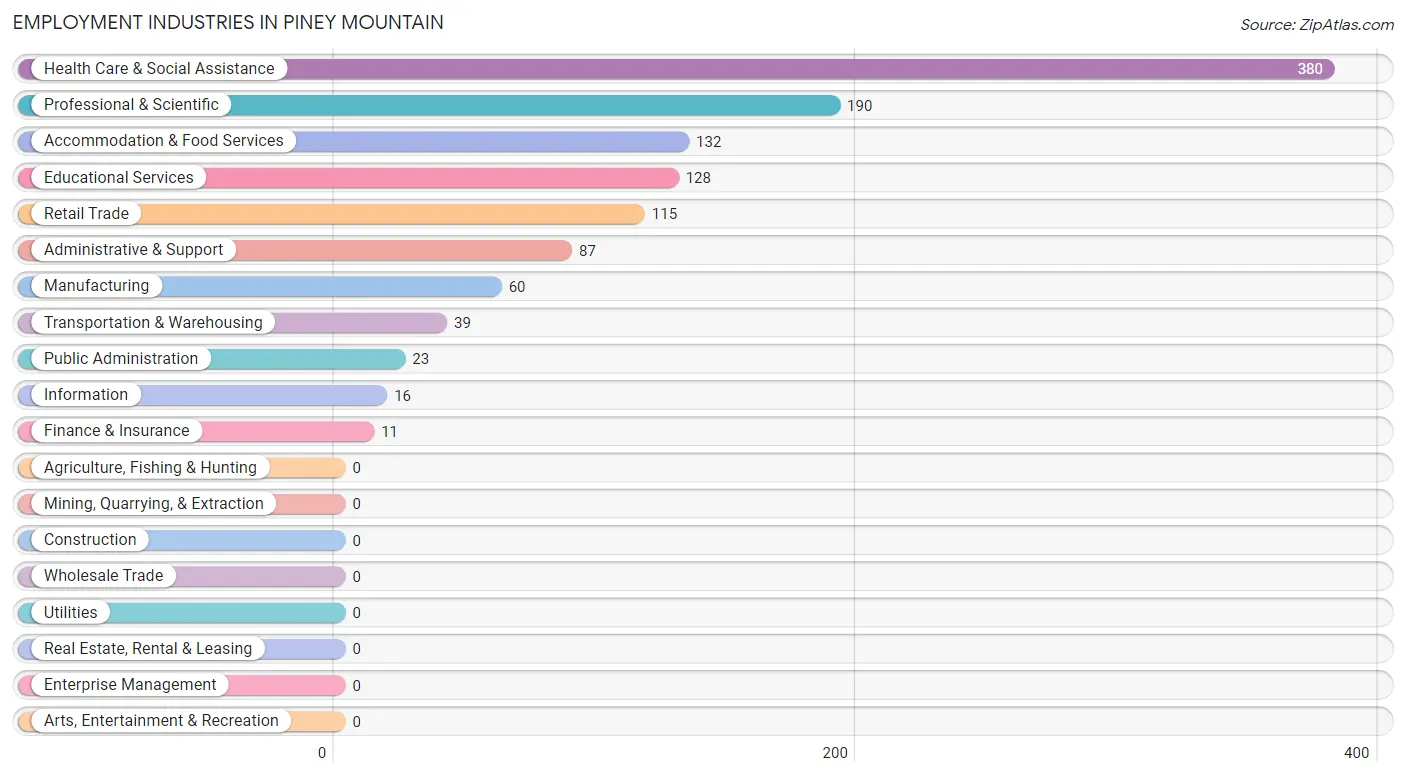
Employment Industries in Piney Mountain
The major employment industries in Piney Mountain include Health Care & Social Assistance (380 | 31.8%), Professional & Scientific (190 | 15.9%), Accommodation & Food Services (132 | 11.0%), Educational Services (128 | 10.7%), and Retail Trade (115 | 9.6%).
Employment Industries by Sex in Piney Mountain
The Piney Mountain industries that see more men than women are Manufacturing (100.0%), Information (100.0%), and Finance & Insurance (100.0%), whereas the industries that tend to have a higher number of women are Health Care & Social Assistance (80.3%), Educational Services (58.6%), and Administrative & Support (57.5%).
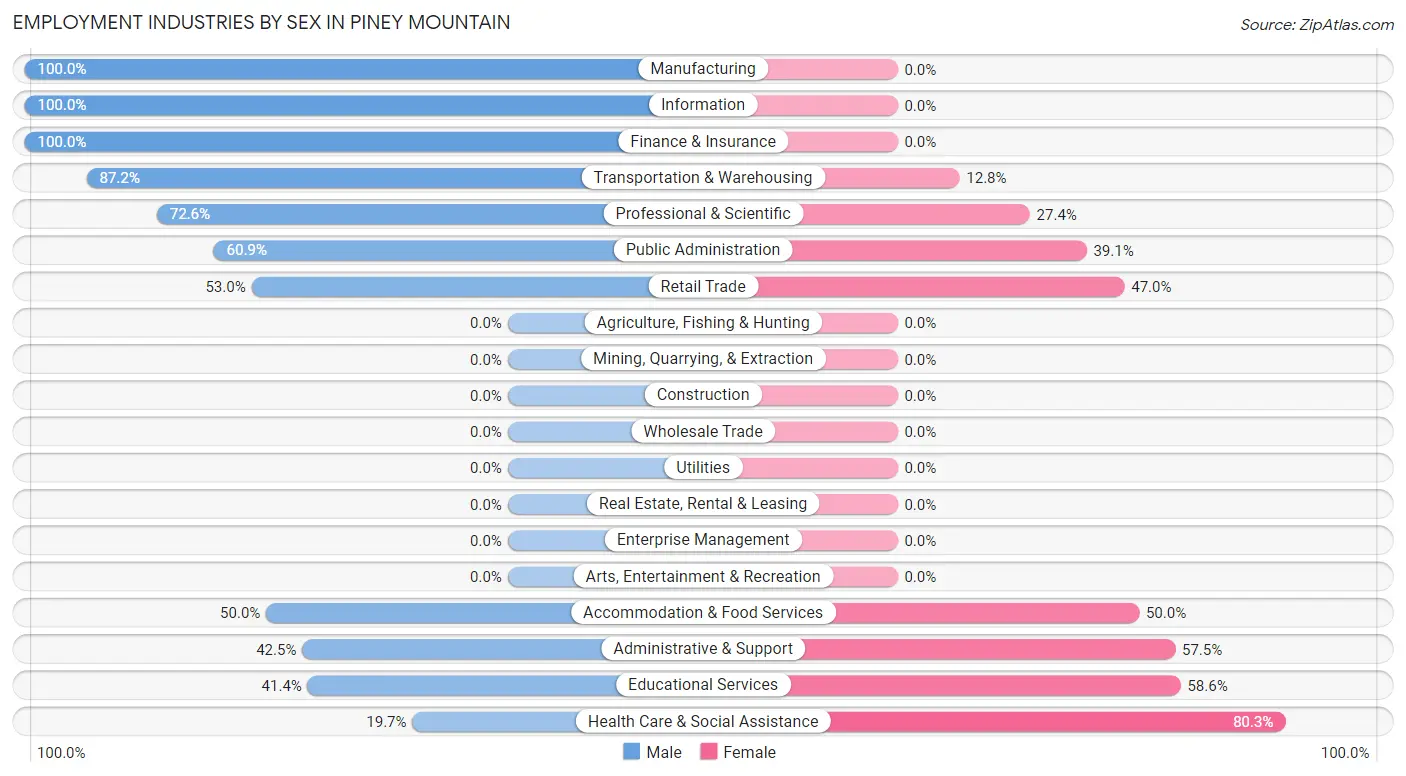
| Industry | Male | Female |
| Agriculture, Fishing & Hunting | 0 (0.0%) | 0 (0.0%) |
| Mining, Quarrying, & Extraction | 0 (0.0%) | 0 (0.0%) |
| Construction | 0 (0.0%) | 0 (0.0%) |
| Manufacturing | 60 (100.0%) | 0 (0.0%) |
| Wholesale Trade | 0 (0.0%) | 0 (0.0%) |
| Retail Trade | 61 (53.0%) | 54 (47.0%) |
| Transportation & Warehousing | 34 (87.2%) | 5 (12.8%) |
| Utilities | 0 (0.0%) | 0 (0.0%) |
| Information | 16 (100.0%) | 0 (0.0%) |
| Finance & Insurance | 11 (100.0%) | 0 (0.0%) |
| Real Estate, Rental & Leasing | 0 (0.0%) | 0 (0.0%) |
| Professional & Scientific | 138 (72.6%) | 52 (27.4%) |
| Enterprise Management | 0 (0.0%) | 0 (0.0%) |
| Administrative & Support | 37 (42.5%) | 50 (57.5%) |
| Educational Services | 53 (41.4%) | 75 (58.6%) |
| Health Care & Social Assistance | 75 (19.7%) | 305 (80.3%) |
| Arts, Entertainment & Recreation | 0 (0.0%) | 0 (0.0%) |
| Accommodation & Food Services | 66 (50.0%) | 66 (50.0%) |
| Public Administration | 14 (60.9%) | 9 (39.1%) |
| Total | 572 (47.8%) | 625 (52.2%) |
Education in Piney Mountain
School Enrollment in Piney Mountain
The most common levels of schooling among the 677 students in Piney Mountain are elementary school (215 | 31.8%), middle school (148 | 21.9%), and high school (143 | 21.1%).
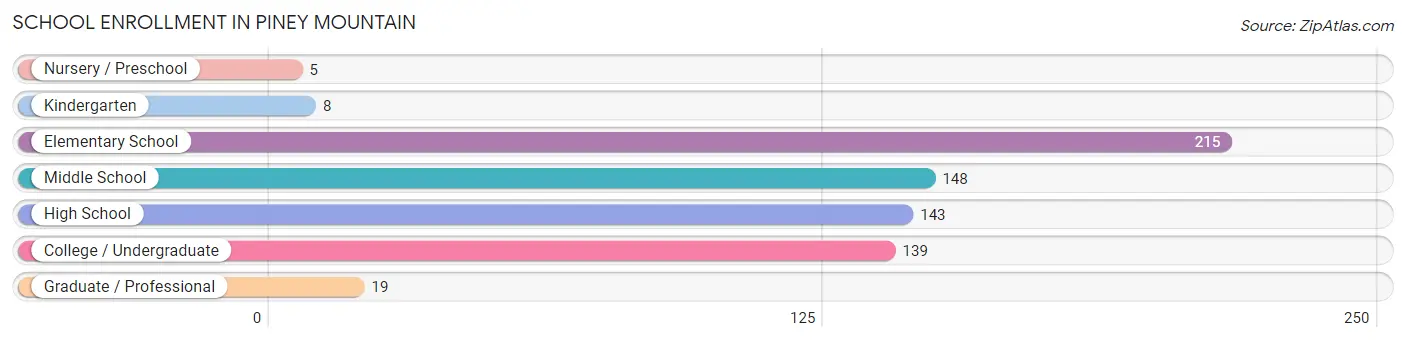
| School Level | # Students | % Students |
| Nursery / Preschool | 5 | 0.7% |
| Kindergarten | 8 | 1.2% |
| Elementary School | 215 | 31.8% |
| Middle School | 148 | 21.9% |
| High School | 143 | 21.1% |
| College / Undergraduate | 139 | 20.5% |
| Graduate / Professional | 19 | 2.8% |
| Total | 677 | 100.0% |
School Enrollment by Age by Funding Source in Piney Mountain
Out of a total of 677 students who are enrolled in schools in Piney Mountain, 8 (1.2%) attend a private institution, while the remaining 669 (98.8%) are enrolled in public schools. The age group of 5 to 9 year old has the highest likelihood of being enrolled in private schools, with 8 (3.9% in the age bracket) enrolled. Conversely, the age group of 10 to 14 year olds has the lowest likelihood of being enrolled in a private school, with 166 (100.0% in the age bracket) attending a public institution.
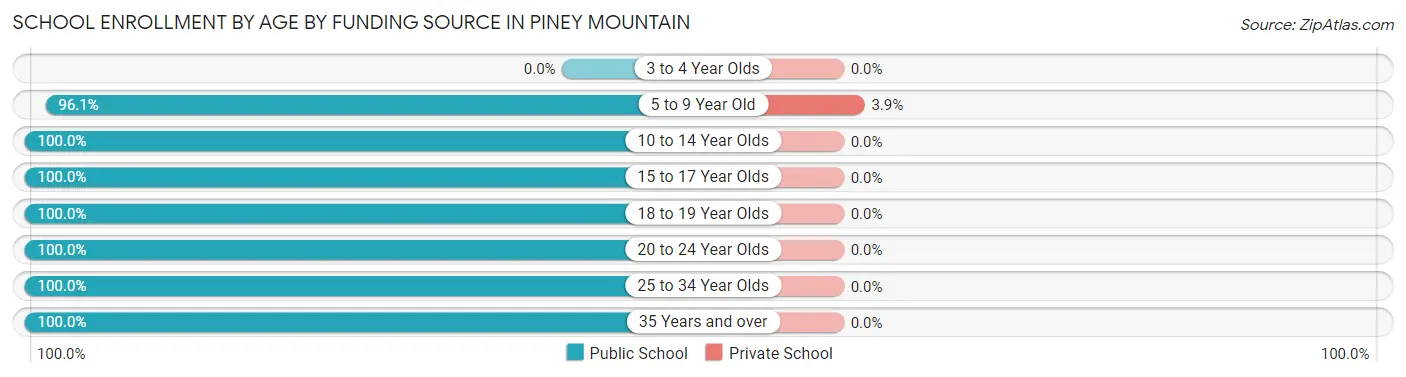
| Age Bracket | Public School | Private School |
| 3 to 4 Year Olds | 0 (0.0%) | 0 (0.0%) |
| 5 to 9 Year Old | 198 (96.1%) | 8 (3.9%) |
| 10 to 14 Year Olds | 166 (100.0%) | 0 (0.0%) |
| 15 to 17 Year Olds | 101 (100.0%) | 0 (0.0%) |
| 18 to 19 Year Olds | 77 (100.0%) | 0 (0.0%) |
| 20 to 24 Year Olds | 61 (100.0%) | 0 (0.0%) |
| 25 to 34 Year Olds | 57 (100.0%) | 0 (0.0%) |
| 35 Years and over | 9 (100.0%) | 0 (0.0%) |
| Total | 669 (98.8%) | 8 (1.2%) |
Educational Attainment by Field of Study in Piney Mountain
Business (137 | 20.4%), science & technology (91 | 13.5%), bio, nature & agricultural (79 | 11.8%), psychology (74 | 11.0%), and engineering (61 | 9.1%) are the most common fields of study among 672 individuals in Piney Mountain who have obtained a bachelor's degree or higher.
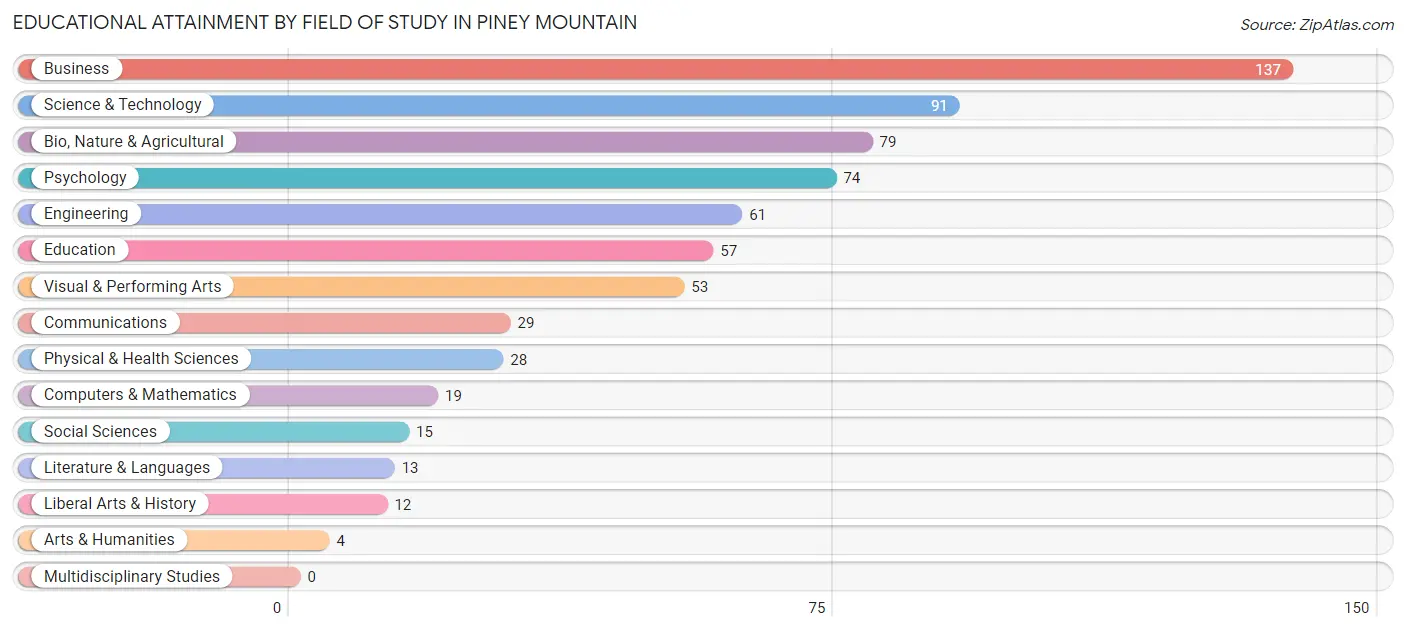
| Field of Study | # Graduates | % Graduates |
| Computers & Mathematics | 19 | 2.8% |
| Bio, Nature & Agricultural | 79 | 11.8% |
| Physical & Health Sciences | 28 | 4.2% |
| Psychology | 74 | 11.0% |
| Social Sciences | 15 | 2.2% |
| Engineering | 61 | 9.1% |
| Multidisciplinary Studies | 0 | 0.0% |
| Science & Technology | 91 | 13.5% |
| Business | 137 | 20.4% |
| Education | 57 | 8.5% |
| Literature & Languages | 13 | 1.9% |
| Liberal Arts & History | 12 | 1.8% |
| Visual & Performing Arts | 53 | 7.9% |
| Communications | 29 | 4.3% |
| Arts & Humanities | 4 | 0.6% |
| Total | 672 | 100.0% |
Transportation & Commute in Piney Mountain
Vehicle Availability by Sex in Piney Mountain
The most prevalent vehicle ownership categories in Piney Mountain are males with 2 vehicles (266, accounting for 45.6%) and females with 2 vehicles (270, making up 44.0%).
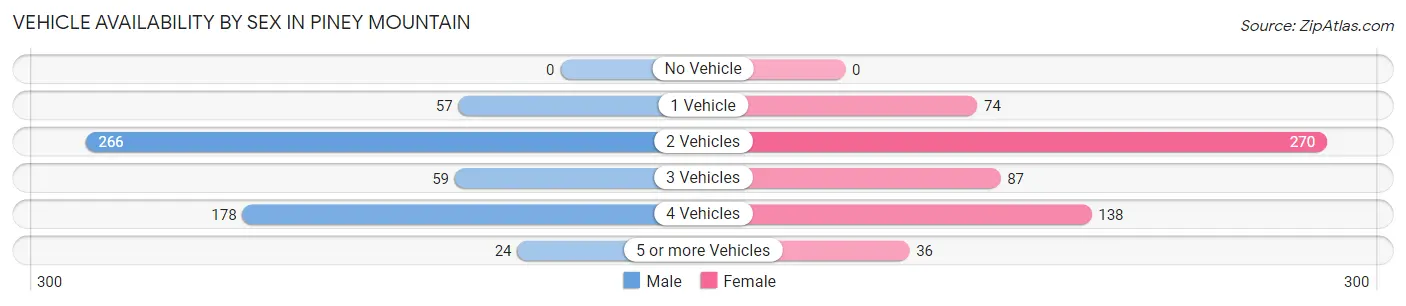
| Vehicles Available | Male | Female |
| No Vehicle | 0 (0.0%) | 0 (0.0%) |
| 1 Vehicle | 57 (9.8%) | 74 (12.2%) |
| 2 Vehicles | 266 (45.6%) | 270 (44.6%) |
| 3 Vehicles | 59 (10.1%) | 87 (14.4%) |
| 4 Vehicles | 178 (30.5%) | 138 (22.8%) |
| 5 or more Vehicles | 24 (4.1%) | 36 (5.9%) |
| Total | 584 (100.0%) | 605 (100.0%) |
Commute Time in Piney Mountain
The most frequently occuring commute durations in Piney Mountain are 25 to 29 minutes (234 commuters, 22.3%), 20 to 24 minutes (230 commuters, 22.0%), and 30 to 34 minutes (199 commuters, 19.0%).
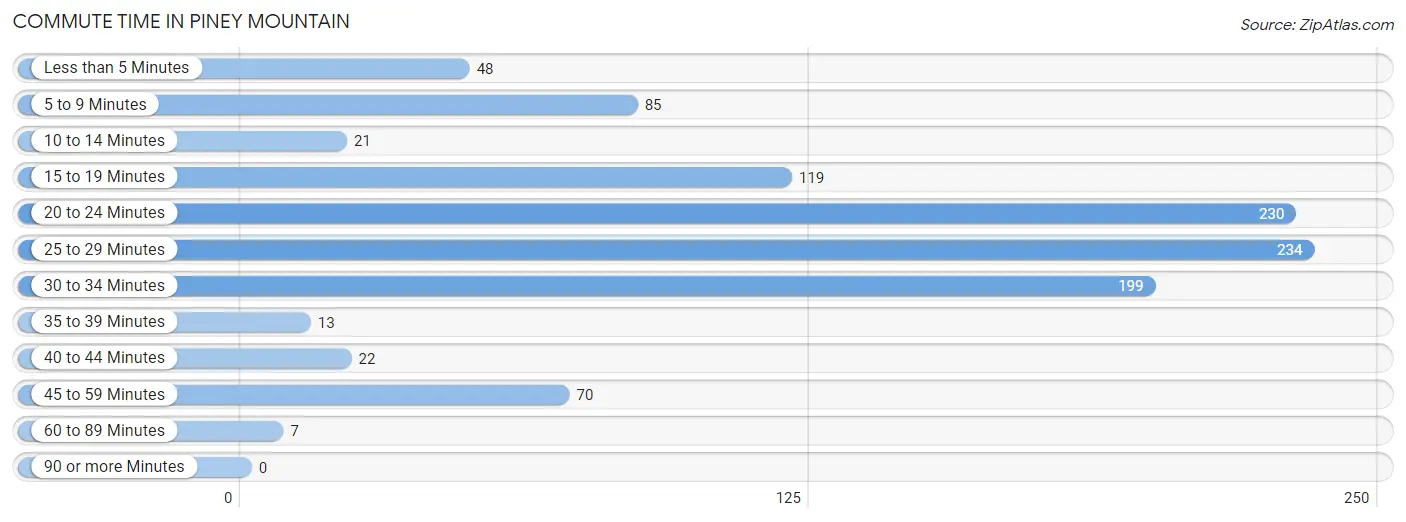
| Commute Time | # Commuters | % Commuters |
| Less than 5 Minutes | 48 | 4.6% |
| 5 to 9 Minutes | 85 | 8.1% |
| 10 to 14 Minutes | 21 | 2.0% |
| 15 to 19 Minutes | 119 | 11.4% |
| 20 to 24 Minutes | 230 | 22.0% |
| 25 to 29 Minutes | 234 | 22.3% |
| 30 to 34 Minutes | 199 | 19.0% |
| 35 to 39 Minutes | 13 | 1.2% |
| 40 to 44 Minutes | 22 | 2.1% |
| 45 to 59 Minutes | 70 | 6.7% |
| 60 to 89 Minutes | 7 | 0.7% |
| 90 or more Minutes | 0 | 0.0% |
Commute Time by Sex in Piney Mountain
The most common commute times in Piney Mountain are 25 to 29 minutes (112 commuters, 21.1%) for males and 20 to 24 minutes (144 commuters, 27.8%) for females.
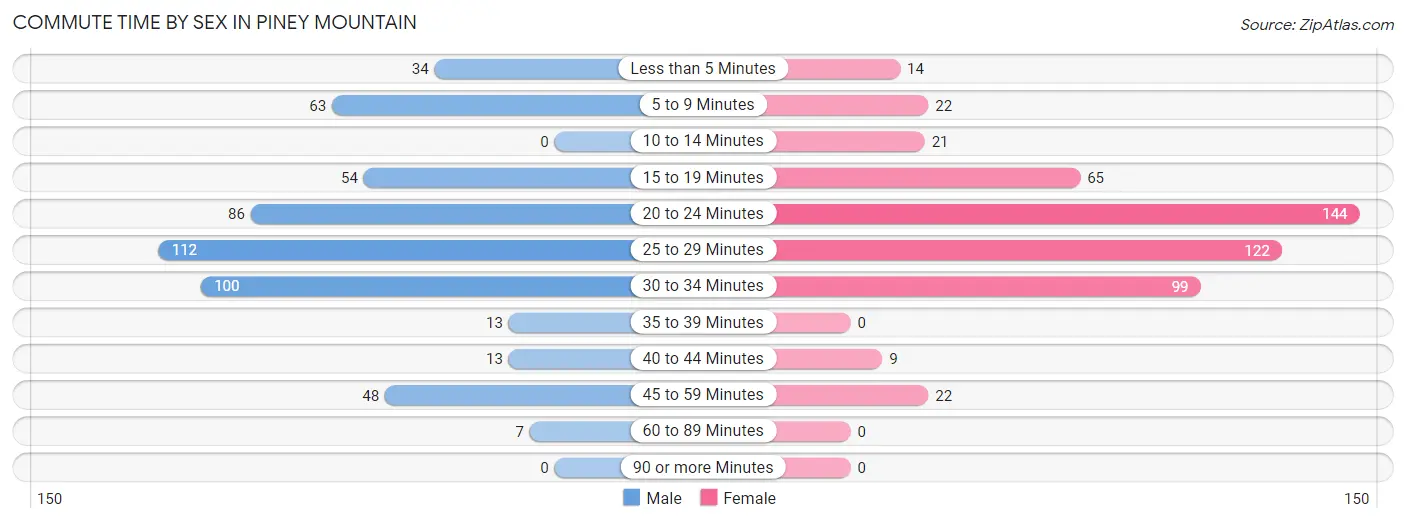
| Commute Time | Male | Female |
| Less than 5 Minutes | 34 (6.4%) | 14 (2.7%) |
| 5 to 9 Minutes | 63 (11.9%) | 22 (4.3%) |
| 10 to 14 Minutes | 0 (0.0%) | 21 (4.1%) |
| 15 to 19 Minutes | 54 (10.2%) | 65 (12.6%) |
| 20 to 24 Minutes | 86 (16.2%) | 144 (27.8%) |
| 25 to 29 Minutes | 112 (21.1%) | 122 (23.5%) |
| 30 to 34 Minutes | 100 (18.9%) | 99 (19.1%) |
| 35 to 39 Minutes | 13 (2.5%) | 0 (0.0%) |
| 40 to 44 Minutes | 13 (2.5%) | 9 (1.7%) |
| 45 to 59 Minutes | 48 (9.1%) | 22 (4.3%) |
| 60 to 89 Minutes | 7 (1.3%) | 0 (0.0%) |
| 90 or more Minutes | 0 (0.0%) | 0 (0.0%) |
Time of Departure to Work by Sex in Piney Mountain
The most frequent times of departure to work in Piney Mountain are 7:00 AM to 7:29 AM (163, 30.7%) for males and 6:30 AM to 6:59 AM (160, 30.9%) for females.
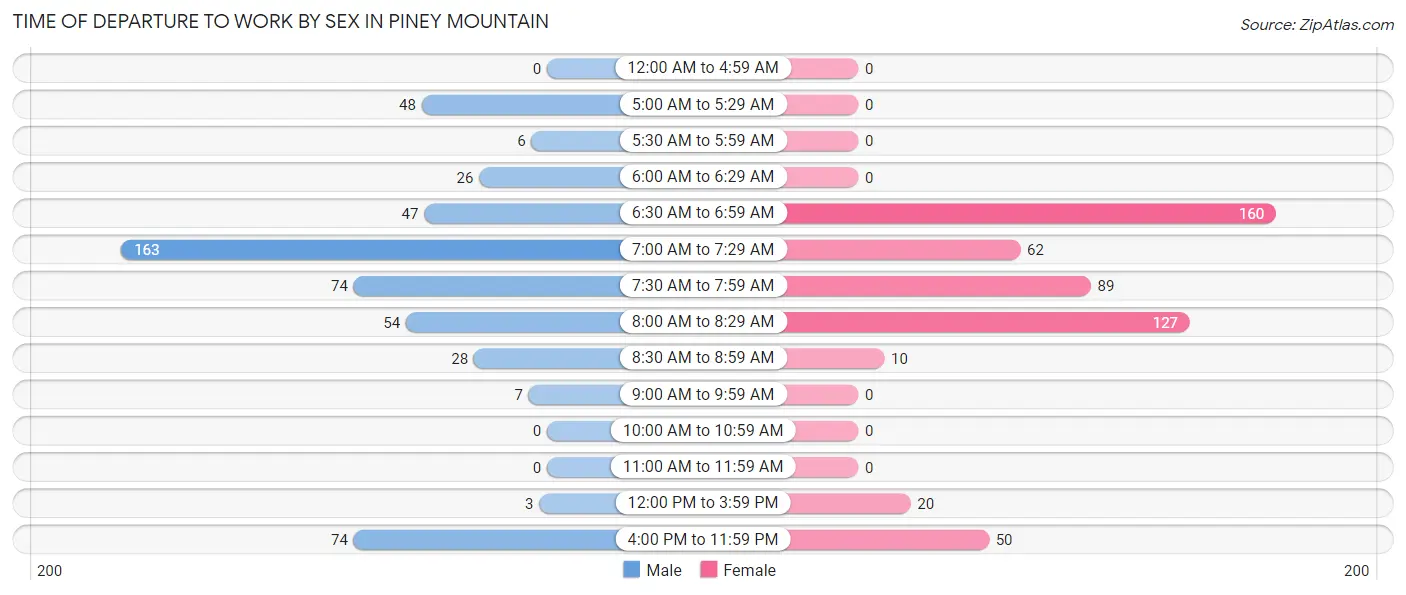
| Time of Departure | Male | Female |
| 12:00 AM to 4:59 AM | 0 (0.0%) | 0 (0.0%) |
| 5:00 AM to 5:29 AM | 48 (9.1%) | 0 (0.0%) |
| 5:30 AM to 5:59 AM | 6 (1.1%) | 0 (0.0%) |
| 6:00 AM to 6:29 AM | 26 (4.9%) | 0 (0.0%) |
| 6:30 AM to 6:59 AM | 47 (8.9%) | 160 (30.9%) |
| 7:00 AM to 7:29 AM | 163 (30.7%) | 62 (12.0%) |
| 7:30 AM to 7:59 AM | 74 (14.0%) | 89 (17.2%) |
| 8:00 AM to 8:29 AM | 54 (10.2%) | 127 (24.5%) |
| 8:30 AM to 8:59 AM | 28 (5.3%) | 10 (1.9%) |
| 9:00 AM to 9:59 AM | 7 (1.3%) | 0 (0.0%) |
| 10:00 AM to 10:59 AM | 0 (0.0%) | 0 (0.0%) |
| 11:00 AM to 11:59 AM | 0 (0.0%) | 0 (0.0%) |
| 12:00 PM to 3:59 PM | 3 (0.6%) | 20 (3.9%) |
| 4:00 PM to 11:59 PM | 74 (14.0%) | 50 (9.7%) |
| Total | 530 (100.0%) | 518 (100.0%) |
Housing Occupancy in Piney Mountain
Occupancy by Ownership in Piney Mountain
Of the total 684 dwellings in Piney Mountain, owner-occupied units account for 542 (79.2%), while renter-occupied units make up 142 (20.8%).
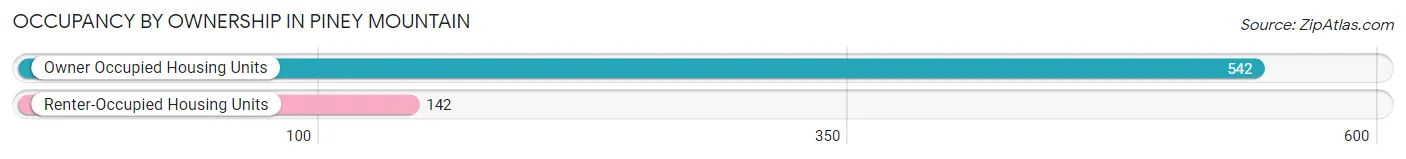
| Occupancy | # Housing Units | % Housing Units |
| Owner Occupied Housing Units | 542 | 79.2% |
| Renter-Occupied Housing Units | 142 | 20.8% |
| Total Occupied Housing Units | 684 | 100.0% |
Occupancy by Household Size in Piney Mountain
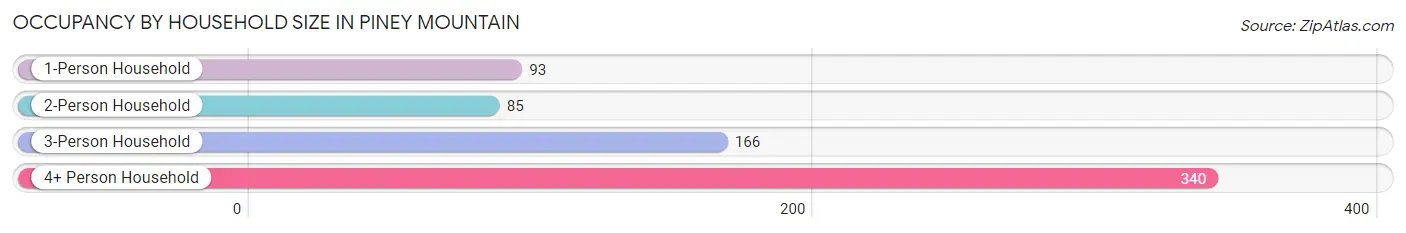
| Household Size | # Housing Units | % Housing Units |
| 1-Person Household | 93 | 13.6% |
| 2-Person Household | 85 | 12.4% |
| 3-Person Household | 166 | 24.3% |
| 4+ Person Household | 340 | 49.7% |
| Total Housing Units | 684 | 100.0% |
Occupancy by Ownership by Household Size in Piney Mountain
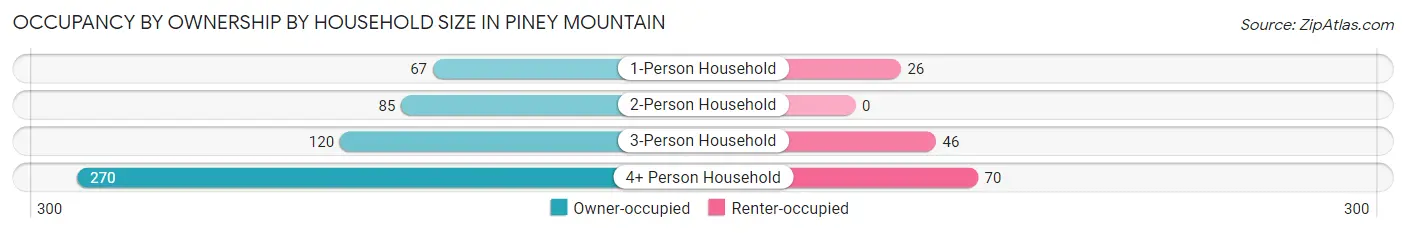
| Household Size | Owner-occupied | Renter-occupied |
| 1-Person Household | 67 (72.0%) | 26 (28.0%) |
| 2-Person Household | 85 (100.0%) | 0 (0.0%) |
| 3-Person Household | 120 (72.3%) | 46 (27.7%) |
| 4+ Person Household | 270 (79.4%) | 70 (20.6%) |
| Total Housing Units | 542 (79.2%) | 142 (20.8%) |
Occupancy by Educational Attainment in Piney Mountain
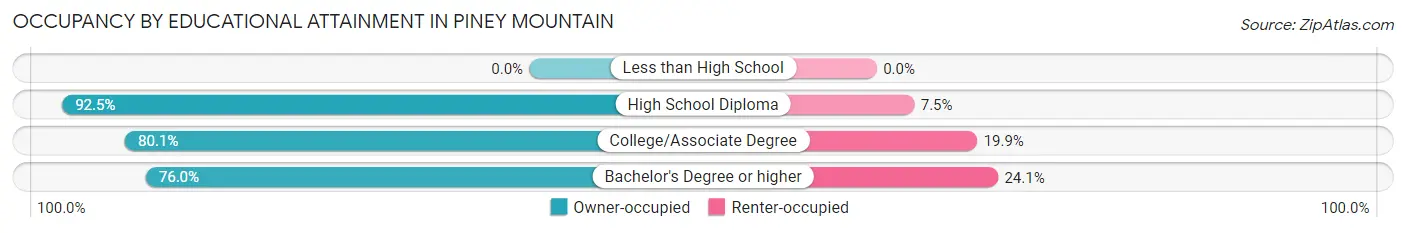
| Household Size | Owner-occupied | Renter-occupied |
| Less than High School | 0 (0.0%) | 0 (0.0%) |
| High School Diploma | 62 (92.5%) | 5 (7.5%) |
| College/Associate Degree | 221 (80.1%) | 55 (19.9%) |
| Bachelor's Degree or higher | 259 (75.9%) | 82 (24.0%) |
Occupancy by Age of Householder in Piney Mountain
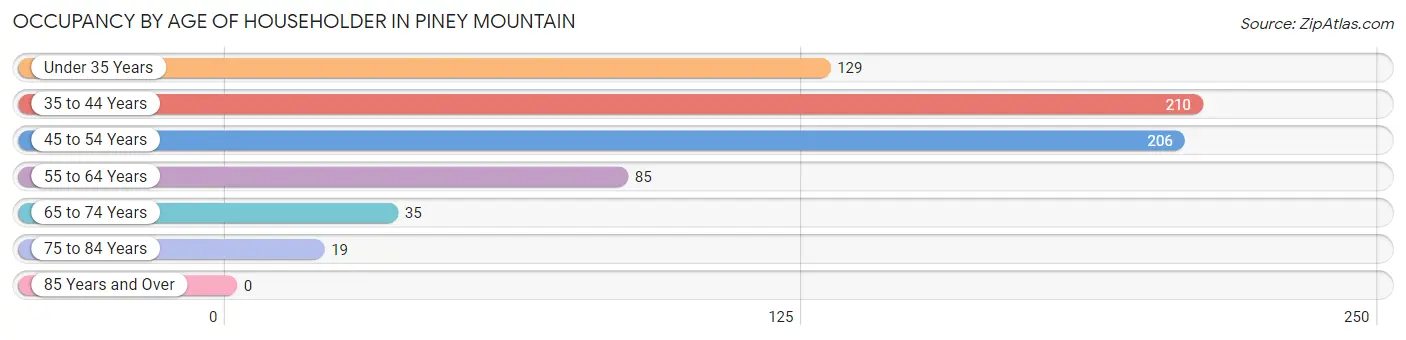
| Age Bracket | # Households | % Households |
| Under 35 Years | 129 | 18.9% |
| 35 to 44 Years | 210 | 30.7% |
| 45 to 54 Years | 206 | 30.1% |
| 55 to 64 Years | 85 | 12.4% |
| 65 to 74 Years | 35 | 5.1% |
| 75 to 84 Years | 19 | 2.8% |
| 85 Years and Over | 0 | 0.0% |
| Total | 684 | 100.0% |
Housing Finances in Piney Mountain
Median Income by Occupancy in Piney Mountain
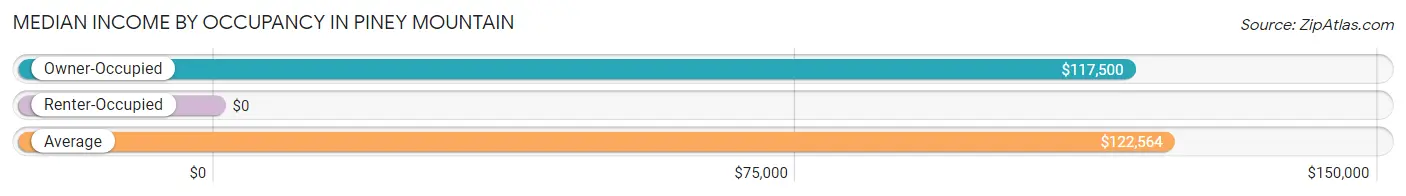
| Occupancy Type | # Households | Median Income |
| Owner-Occupied | 542 (79.2%) | $117,500 |
| Renter-Occupied | 142 (20.8%) | $0 |
| Average | 684 (100.0%) | $122,564 |
Occupancy by Householder Income Bracket in Piney Mountain
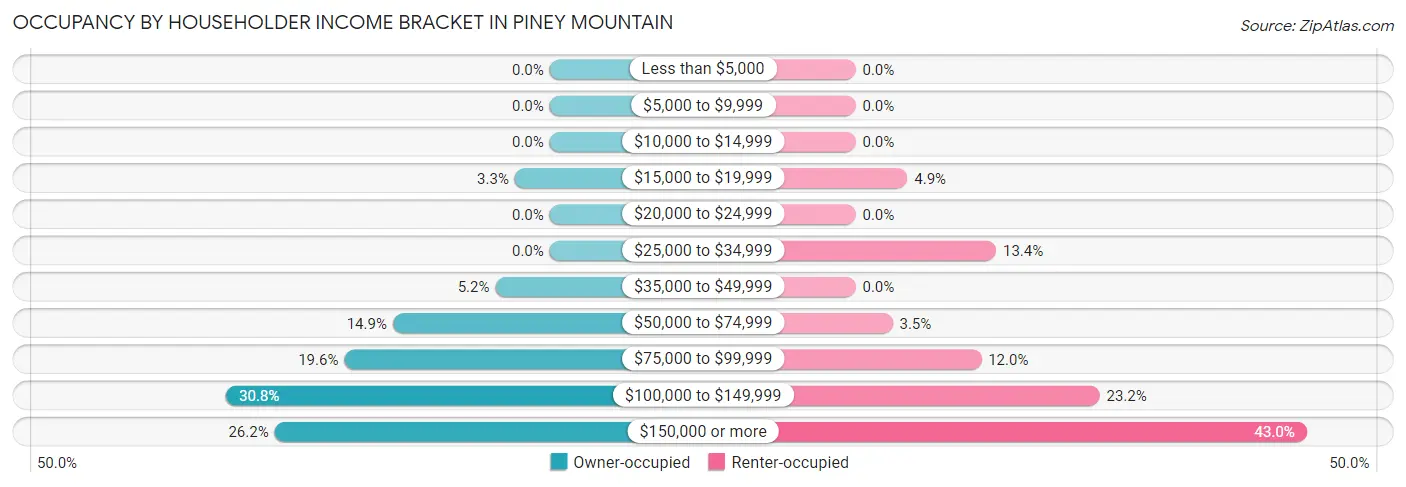
| Income Bracket | Owner-occupied | Renter-occupied |
| Less than $5,000 | 0 (0.0%) | 0 (0.0%) |
| $5,000 to $9,999 | 0 (0.0%) | 0 (0.0%) |
| $10,000 to $14,999 | 0 (0.0%) | 0 (0.0%) |
| $15,000 to $19,999 | 18 (3.3%) | 7 (4.9%) |
| $20,000 to $24,999 | 0 (0.0%) | 0 (0.0%) |
| $25,000 to $34,999 | 0 (0.0%) | 19 (13.4%) |
| $35,000 to $49,999 | 28 (5.2%) | 0 (0.0%) |
| $50,000 to $74,999 | 81 (14.9%) | 5 (3.5%) |
| $75,000 to $99,999 | 106 (19.6%) | 17 (12.0%) |
| $100,000 to $149,999 | 167 (30.8%) | 33 (23.2%) |
| $150,000 or more | 142 (26.2%) | 61 (43.0%) |
| Total | 542 (100.0%) | 142 (100.0%) |
Monthly Housing Cost Tiers in Piney Mountain
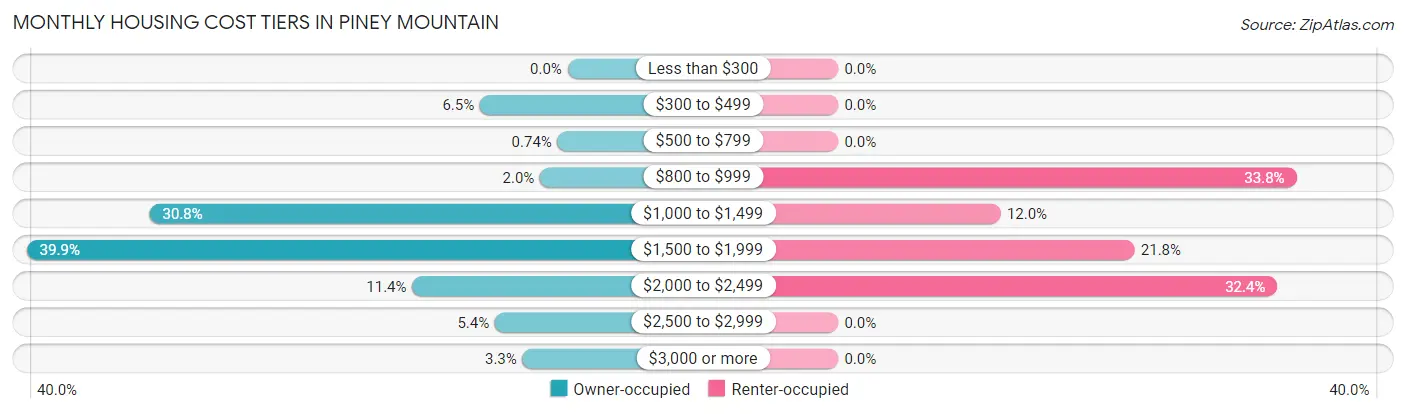
| Monthly Cost | Owner-occupied | Renter-occupied |
| Less than $300 | 0 (0.0%) | 0 (0.0%) |
| $300 to $499 | 35 (6.5%) | 0 (0.0%) |
| $500 to $799 | 4 (0.7%) | 0 (0.0%) |
| $800 to $999 | 11 (2.0%) | 48 (33.8%) |
| $1,000 to $1,499 | 167 (30.8%) | 17 (12.0%) |
| $1,500 to $1,999 | 216 (39.9%) | 31 (21.8%) |
| $2,000 to $2,499 | 62 (11.4%) | 46 (32.4%) |
| $2,500 to $2,999 | 29 (5.3%) | 0 (0.0%) |
| $3,000 or more | 18 (3.3%) | 0 (0.0%) |
| Total | 542 (100.0%) | 142 (100.0%) |
Physical Housing Characteristics in Piney Mountain
Housing Structures in Piney Mountain
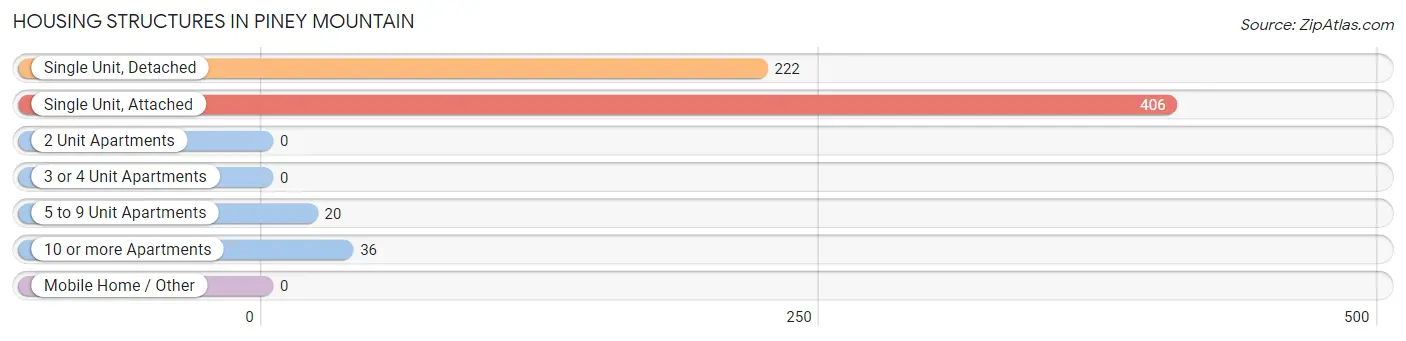
| Structure Type | # Housing Units | % Housing Units |
| Single Unit, Detached | 222 | 32.5% |
| Single Unit, Attached | 406 | 59.4% |
| 2 Unit Apartments | 0 | 0.0% |
| 3 or 4 Unit Apartments | 0 | 0.0% |
| 5 to 9 Unit Apartments | 20 | 2.9% |
| 10 or more Apartments | 36 | 5.3% |
| Mobile Home / Other | 0 | 0.0% |
| Total | 684 | 100.0% |
Housing Structures by Occupancy in Piney Mountain
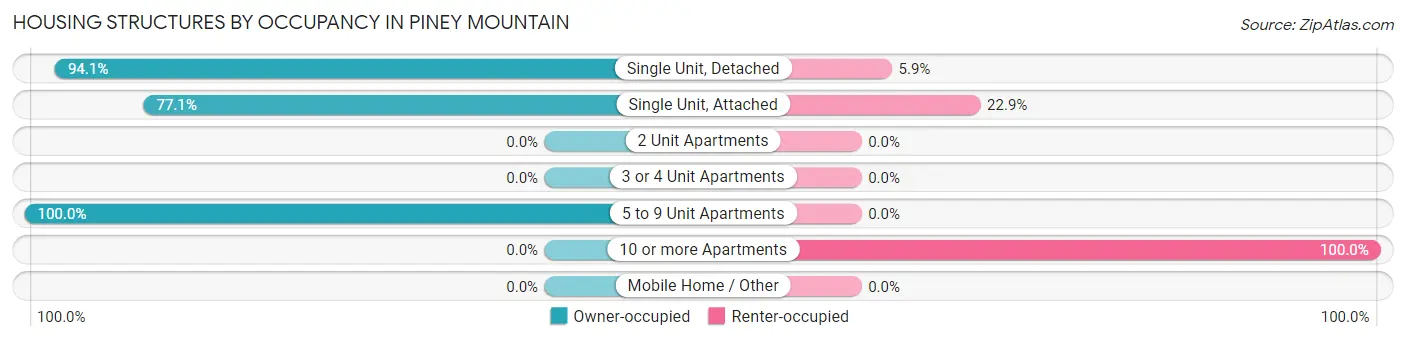
| Structure Type | Owner-occupied | Renter-occupied |
| Single Unit, Detached | 209 (94.1%) | 13 (5.9%) |
| Single Unit, Attached | 313 (77.1%) | 93 (22.9%) |
| 2 Unit Apartments | 0 (0.0%) | 0 (0.0%) |
| 3 or 4 Unit Apartments | 0 (0.0%) | 0 (0.0%) |
| 5 to 9 Unit Apartments | 20 (100.0%) | 0 (0.0%) |
| 10 or more Apartments | 0 (0.0%) | 36 (100.0%) |
| Mobile Home / Other | 0 (0.0%) | 0 (0.0%) |
| Total | 542 (79.2%) | 142 (20.8%) |
Housing Structures by Number of Rooms in Piney Mountain
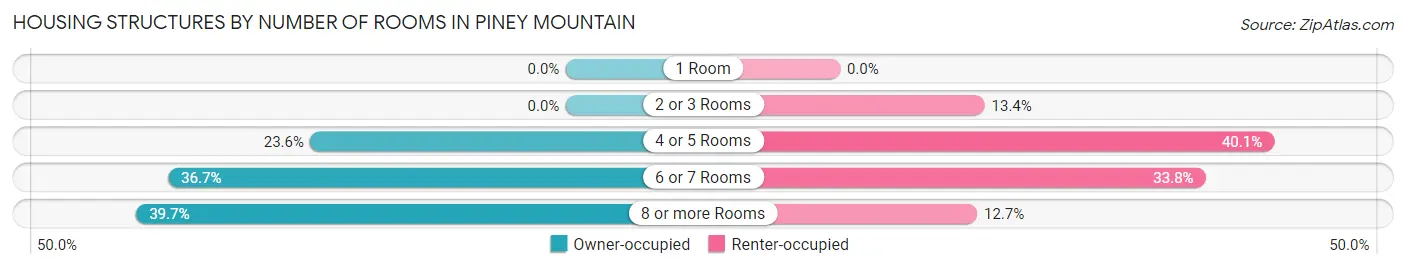
| Number of Rooms | Owner-occupied | Renter-occupied |
| 1 Room | 0 (0.0%) | 0 (0.0%) |
| 2 or 3 Rooms | 0 (0.0%) | 19 (13.4%) |
| 4 or 5 Rooms | 128 (23.6%) | 57 (40.1%) |
| 6 or 7 Rooms | 199 (36.7%) | 48 (33.8%) |
| 8 or more Rooms | 215 (39.7%) | 18 (12.7%) |
| Total | 542 (100.0%) | 142 (100.0%) |
Housing Structure by Heating Type in Piney Mountain
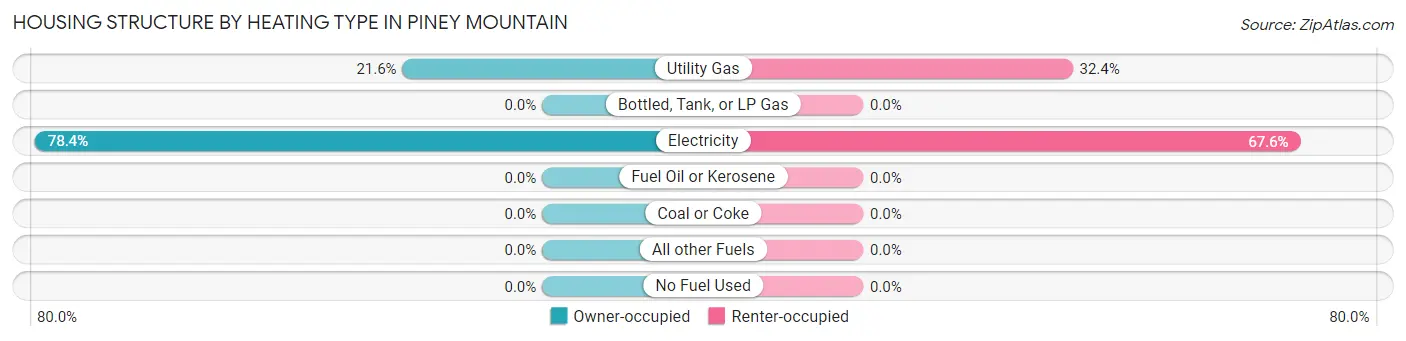
| Heating Type | Owner-occupied | Renter-occupied |
| Utility Gas | 117 (21.6%) | 46 (32.4%) |
| Bottled, Tank, or LP Gas | 0 (0.0%) | 0 (0.0%) |
| Electricity | 425 (78.4%) | 96 (67.6%) |
| Fuel Oil or Kerosene | 0 (0.0%) | 0 (0.0%) |
| Coal or Coke | 0 (0.0%) | 0 (0.0%) |
| All other Fuels | 0 (0.0%) | 0 (0.0%) |
| No Fuel Used | 0 (0.0%) | 0 (0.0%) |
| Total | 542 (100.0%) | 142 (100.0%) |
Household Vehicle Usage in Piney Mountain
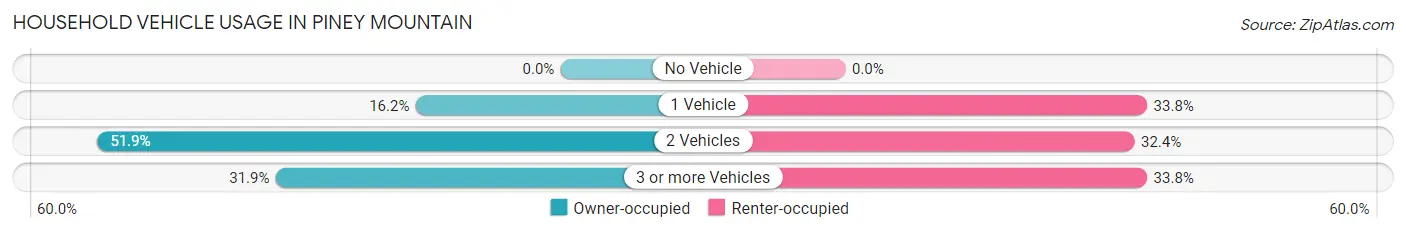
| Vehicles per Household | Owner-occupied | Renter-occupied |
| No Vehicle | 0 (0.0%) | 0 (0.0%) |
| 1 Vehicle | 88 (16.2%) | 48 (33.8%) |
| 2 Vehicles | 281 (51.8%) | 46 (32.4%) |
| 3 or more Vehicles | 173 (31.9%) | 48 (33.8%) |
| Total | 542 (100.0%) | 142 (100.0%) |
Real Estate & Mortgages in Piney Mountain
Real Estate and Mortgage Overview in Piney Mountain
| Characteristic | Without Mortgage | With Mortgage |
| Housing Units | 35 | 507 |
| Median Property Value | $273,200 | $244,800 |
| Median Household Income | $131,705 | $142 |
| Monthly Housing Costs | - | - |
| Real Estate Taxes | $1,659 | $4 |
Property Value by Mortgage Status in Piney Mountain
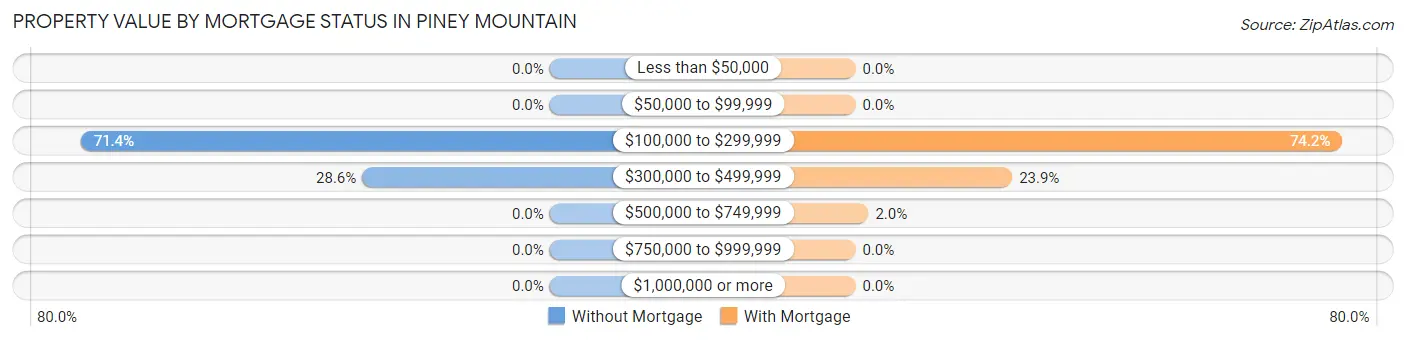
| Property Value | Without Mortgage | With Mortgage |
| Less than $50,000 | 0 (0.0%) | 0 (0.0%) |
| $50,000 to $99,999 | 0 (0.0%) | 0 (0.0%) |
| $100,000 to $299,999 | 25 (71.4%) | 376 (74.2%) |
| $300,000 to $499,999 | 10 (28.6%) | 121 (23.9%) |
| $500,000 to $749,999 | 0 (0.0%) | 10 (2.0%) |
| $750,000 to $999,999 | 0 (0.0%) | 0 (0.0%) |
| $1,000,000 or more | 0 (0.0%) | 0 (0.0%) |
| Total | 35 (100.0%) | 507 (100.0%) |
Household Income by Mortgage Status in Piney Mountain
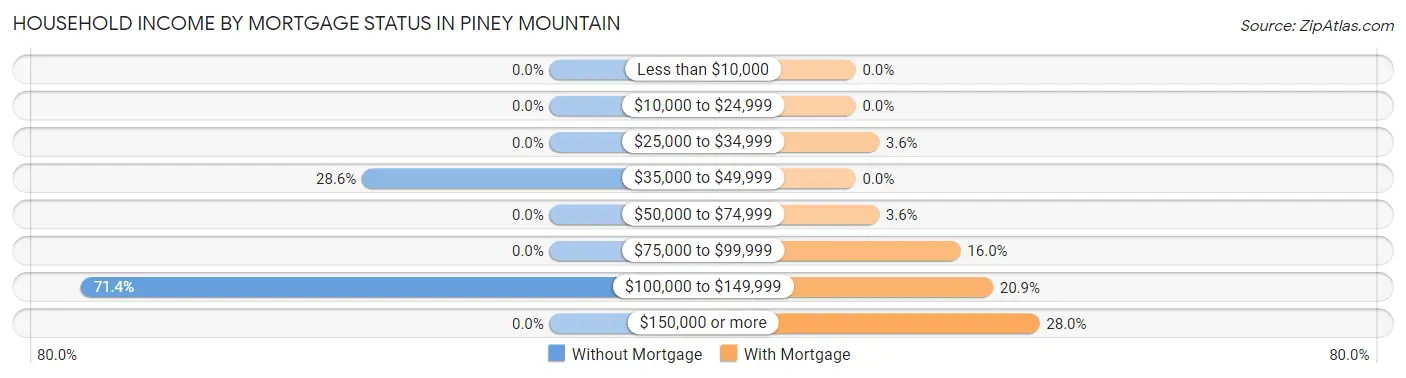
| Household Income | Without Mortgage | With Mortgage |
| Less than $10,000 | 0 (0.0%) | 0 (0.0%) |
| $10,000 to $24,999 | 0 (0.0%) | 0 (0.0%) |
| $25,000 to $34,999 | 0 (0.0%) | 18 (3.5%) |
| $35,000 to $49,999 | 10 (28.6%) | 0 (0.0%) |
| $50,000 to $74,999 | 0 (0.0%) | 18 (3.5%) |
| $75,000 to $99,999 | 0 (0.0%) | 81 (16.0%) |
| $100,000 to $149,999 | 25 (71.4%) | 106 (20.9%) |
| $150,000 or more | 0 (0.0%) | 142 (28.0%) |
| Total | 35 (100.0%) | 507 (100.0%) |
Property Value to Household Income Ratio in Piney Mountain
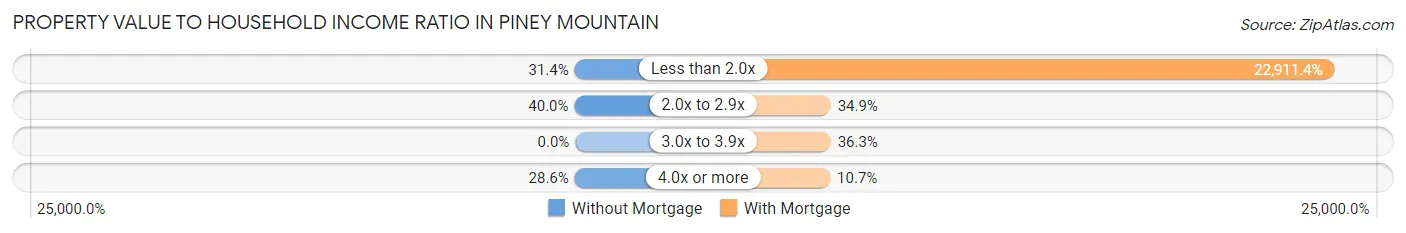
| Value-to-Income Ratio | Without Mortgage | With Mortgage |
| Less than 2.0x | 11 (31.4%) | 116,161 (22,911.4%) |
| 2.0x to 2.9x | 14 (40.0%) | 177 (34.9%) |
| 3.0x to 3.9x | 0 (0.0%) | 184 (36.3%) |
| 4.0x or more | 10 (28.6%) | 54 (10.6%) |
| Total | 35 (100.0%) | 507 (100.0%) |
Real Estate Taxes by Mortgage Status in Piney Mountain
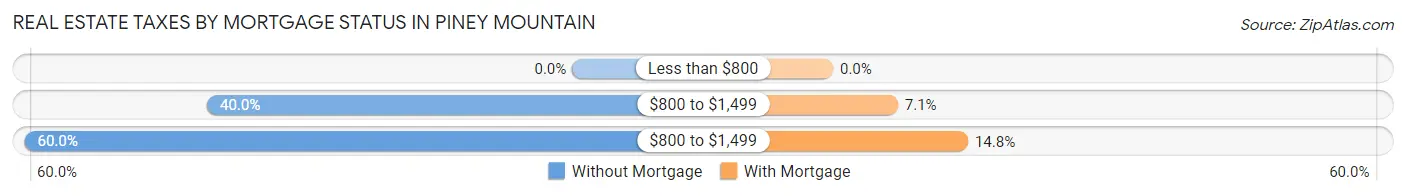
| Property Taxes | Without Mortgage | With Mortgage |
| Less than $800 | 0 (0.0%) | 0 (0.0%) |
| $800 to $1,499 | 14 (40.0%) | 36 (7.1%) |
| $800 to $1,499 | 21 (60.0%) | 75 (14.8%) |
| Total | 35 (100.0%) | 507 (100.0%) |
Health & Disability in Piney Mountain
Health Insurance Coverage by Age in Piney Mountain
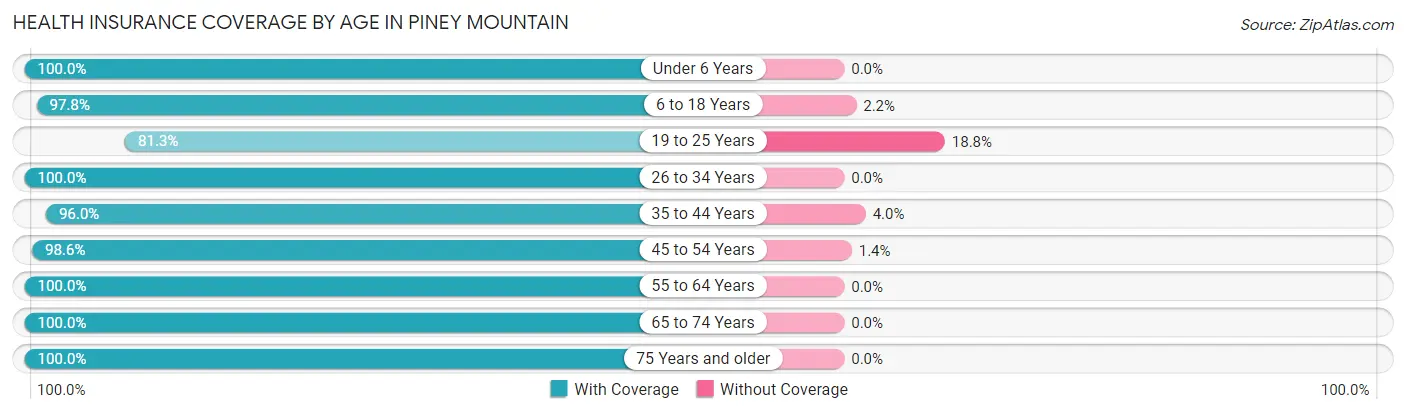
| Age Bracket | With Coverage | Without Coverage |
| Under 6 Years | 267 (100.0%) | 0 (0.0%) |
| 6 to 18 Years | 525 (97.8%) | 12 (2.2%) |
| 19 to 25 Years | 130 (81.2%) | 30 (18.8%) |
| 26 to 34 Years | 267 (100.0%) | 0 (0.0%) |
| 35 to 44 Years | 361 (96.0%) | 15 (4.0%) |
| 45 to 54 Years | 351 (98.6%) | 5 (1.4%) |
| 55 to 64 Years | 217 (100.0%) | 0 (0.0%) |
| 65 to 74 Years | 185 (100.0%) | 0 (0.0%) |
| 75 Years and older | 28 (100.0%) | 0 (0.0%) |
| Total | 2,331 (97.4%) | 62 (2.6%) |
Health Insurance Coverage by Citizenship Status in Piney Mountain
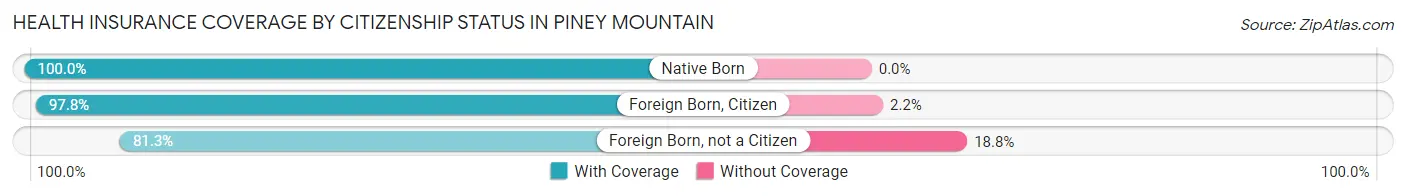
| Citizenship Status | With Coverage | Without Coverage |
| Native Born | 267 (100.0%) | 0 (0.0%) |
| Foreign Born, Citizen | 525 (97.8%) | 12 (2.2%) |
| Foreign Born, not a Citizen | 130 (81.2%) | 30 (18.8%) |
Health Insurance Coverage by Household Income in Piney Mountain
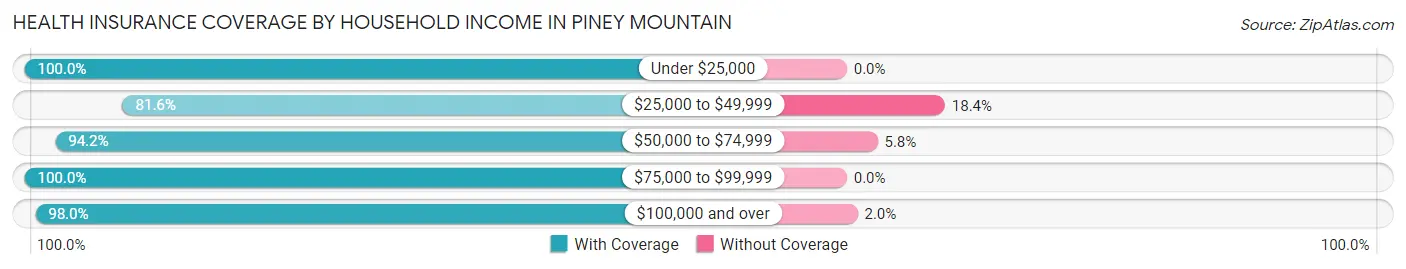
| Household Income | With Coverage | Without Coverage |
| Under $25,000 | 25 (100.0%) | 0 (0.0%) |
| $25,000 to $49,999 | 80 (81.6%) | 18 (18.4%) |
| $50,000 to $74,999 | 229 (94.2%) | 14 (5.8%) |
| $75,000 to $99,999 | 531 (100.0%) | 0 (0.0%) |
| $100,000 and over | 1,466 (98.0%) | 30 (2.0%) |
Public vs Private Health Insurance Coverage by Age in Piney Mountain
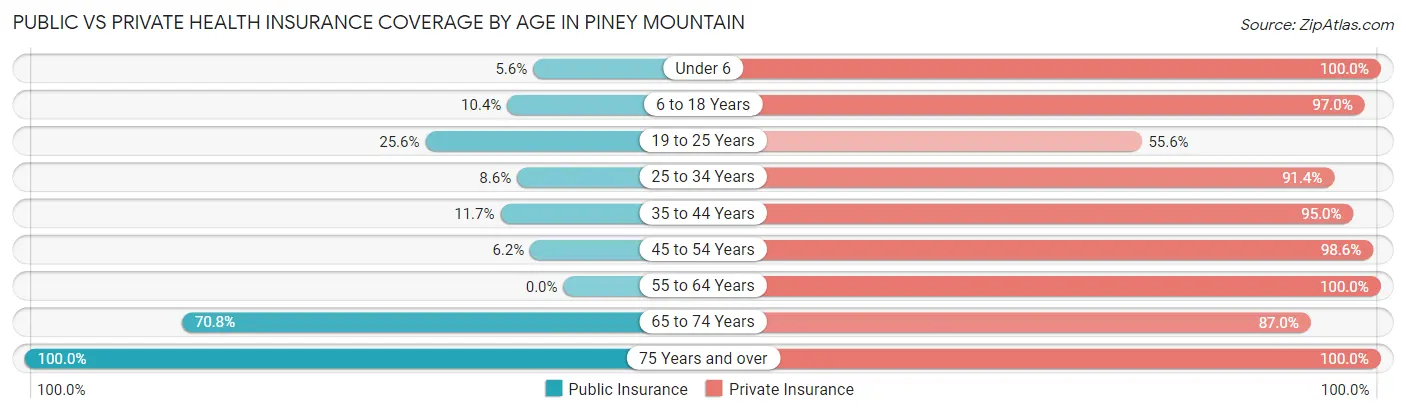
| Age Bracket | Public Insurance | Private Insurance |
| Under 6 | 15 (5.6%) | 267 (100.0%) |
| 6 to 18 Years | 56 (10.4%) | 521 (97.0%) |
| 19 to 25 Years | 41 (25.6%) | 89 (55.6%) |
| 25 to 34 Years | 23 (8.6%) | 244 (91.4%) |
| 35 to 44 Years | 44 (11.7%) | 357 (95.0%) |
| 45 to 54 Years | 22 (6.2%) | 351 (98.6%) |
| 55 to 64 Years | 0 (0.0%) | 217 (100.0%) |
| 65 to 74 Years | 131 (70.8%) | 161 (87.0%) |
| 75 Years and over | 28 (100.0%) | 28 (100.0%) |
| Total | 360 (15.0%) | 2,235 (93.4%) |
Disability Status by Sex by Age in Piney Mountain
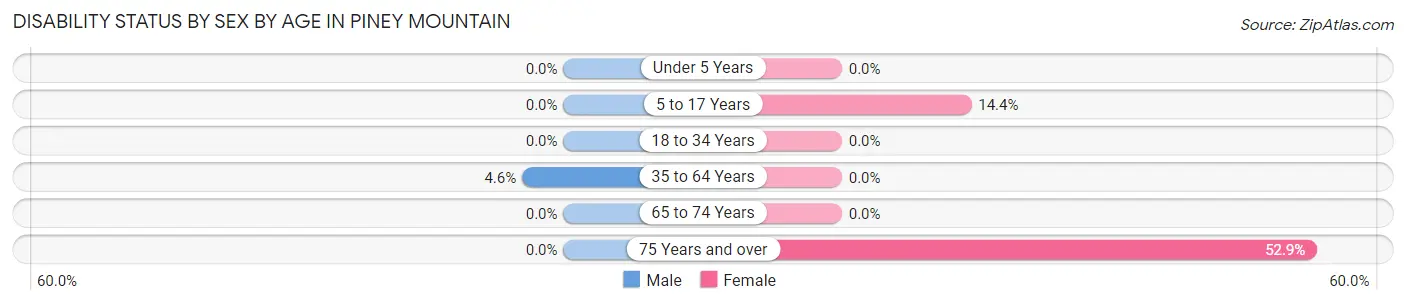
| Age Bracket | Male | Female |
| Under 5 Years | 0 (0.0%) | 0 (0.0%) |
| 5 to 17 Years | 0 (0.0%) | 15 (14.4%) |
| 18 to 34 Years | 0 (0.0%) | 0 (0.0%) |
| 35 to 64 Years | 23 (4.6%) | 0 (0.0%) |
| 65 to 74 Years | 0 (0.0%) | 0 (0.0%) |
| 75 Years and over | 0 (0.0%) | 9 (52.9%) |
Disability Class by Sex by Age in Piney Mountain
Disability Class: Hearing Difficulty
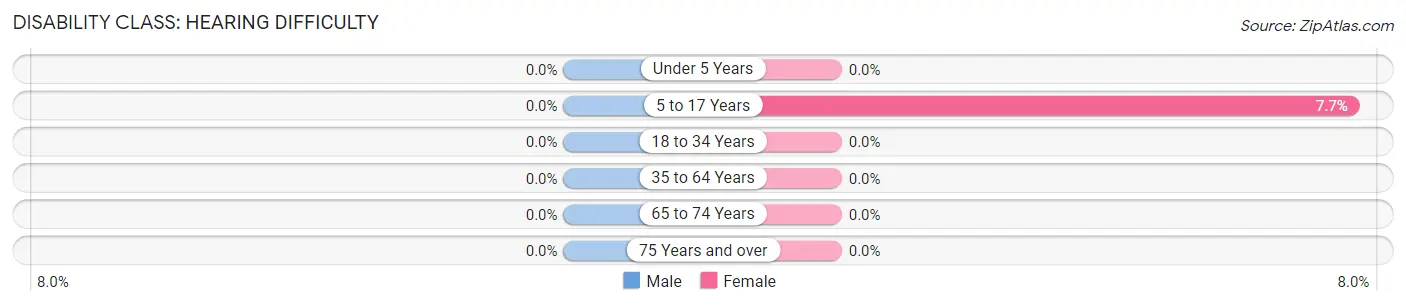
| Age Bracket | Male | Female |
| Under 5 Years | 0 (0.0%) | 0 (0.0%) |
| 5 to 17 Years | 0 (0.0%) | 8 (7.7%) |
| 18 to 34 Years | 0 (0.0%) | 0 (0.0%) |
| 35 to 64 Years | 0 (0.0%) | 0 (0.0%) |
| 65 to 74 Years | 0 (0.0%) | 0 (0.0%) |
| 75 Years and over | 0 (0.0%) | 0 (0.0%) |
Disability Class: Vision Difficulty
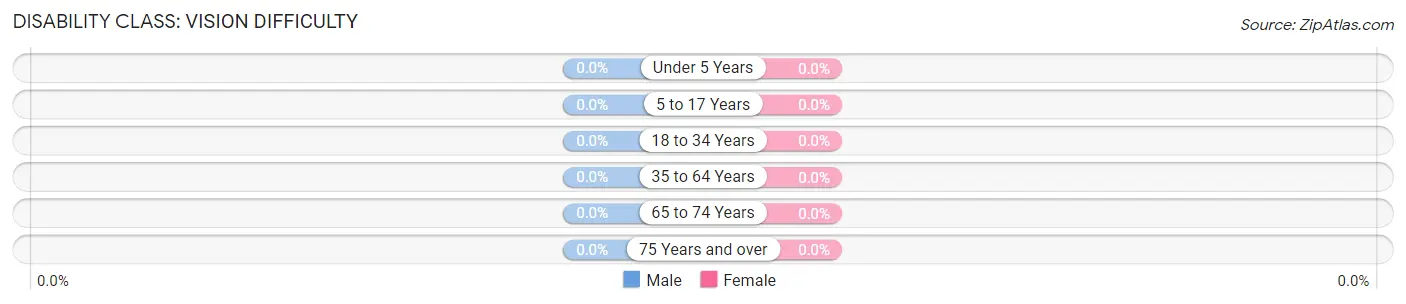
| Age Bracket | Male | Female |
| Under 5 Years | 0 (0.0%) | 0 (0.0%) |
| 5 to 17 Years | 0 (0.0%) | 0 (0.0%) |
| 18 to 34 Years | 0 (0.0%) | 0 (0.0%) |
| 35 to 64 Years | 0 (0.0%) | 0 (0.0%) |
| 65 to 74 Years | 0 (0.0%) | 0 (0.0%) |
| 75 Years and over | 0 (0.0%) | 0 (0.0%) |
Disability Class: Cognitive Difficulty
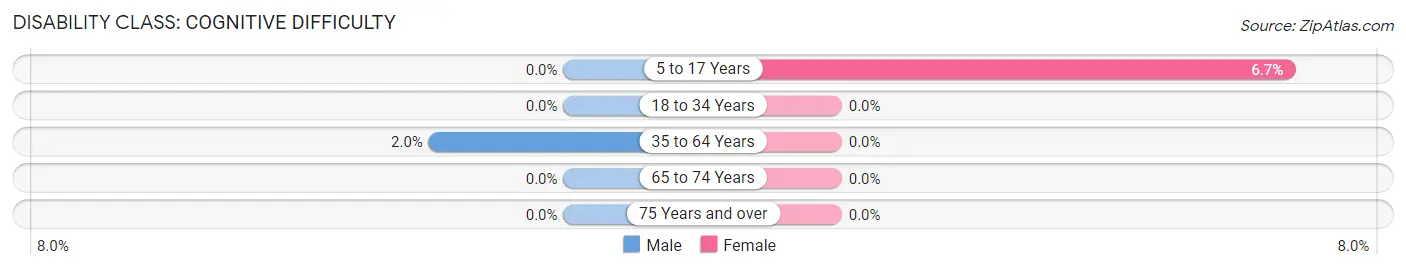
| Age Bracket | Male | Female |
| 5 to 17 Years | 0 (0.0%) | 7 (6.7%) |
| 18 to 34 Years | 0 (0.0%) | 0 (0.0%) |
| 35 to 64 Years | 10 (2.0%) | 0 (0.0%) |
| 65 to 74 Years | 0 (0.0%) | 0 (0.0%) |
| 75 Years and over | 0 (0.0%) | 0 (0.0%) |
Disability Class: Ambulatory Difficulty
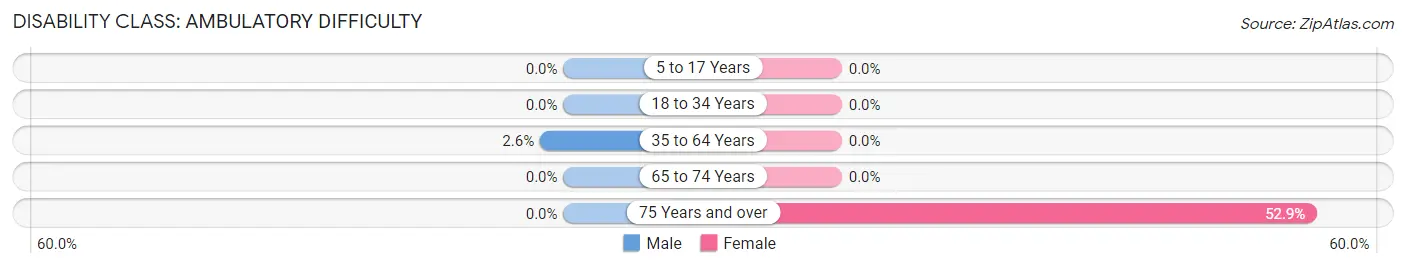
| Age Bracket | Male | Female |
| 5 to 17 Years | 0 (0.0%) | 0 (0.0%) |
| 18 to 34 Years | 0 (0.0%) | 0 (0.0%) |
| 35 to 64 Years | 13 (2.6%) | 0 (0.0%) |
| 65 to 74 Years | 0 (0.0%) | 0 (0.0%) |
| 75 Years and over | 0 (0.0%) | 9 (52.9%) |
Disability Class: Self-Care Difficulty
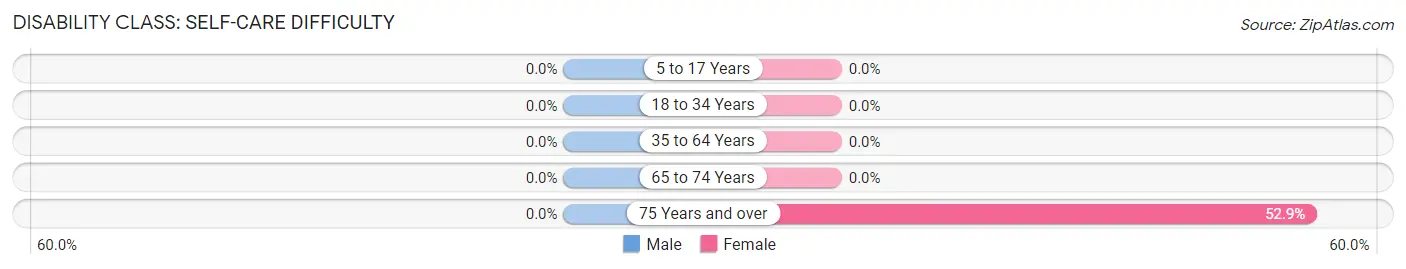
| Age Bracket | Male | Female |
| 5 to 17 Years | 0 (0.0%) | 0 (0.0%) |
| 18 to 34 Years | 0 (0.0%) | 0 (0.0%) |
| 35 to 64 Years | 0 (0.0%) | 0 (0.0%) |
| 65 to 74 Years | 0 (0.0%) | 0 (0.0%) |
| 75 Years and over | 0 (0.0%) | 9 (52.9%) |
Technology Access in Piney Mountain
Computing Device Access in Piney Mountain
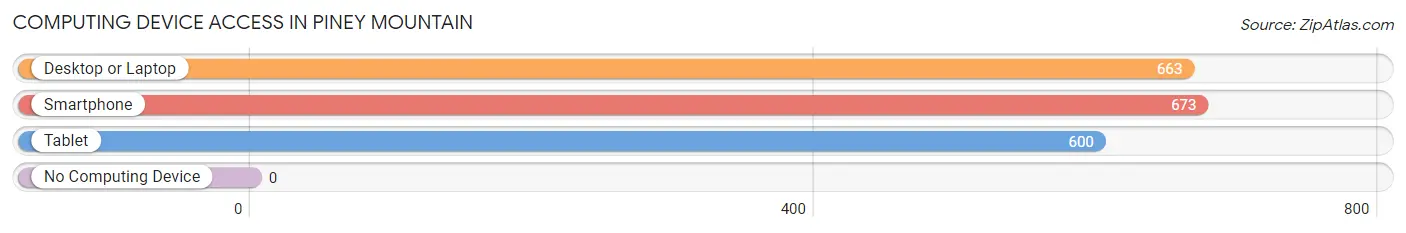
| Device Type | # Households | % Households |
| Desktop or Laptop | 663 | 96.9% |
| Smartphone | 673 | 98.4% |
| Tablet | 600 | 87.7% |
| No Computing Device | 0 | 0.0% |
| Total | 684 | 100.0% |
Internet Access in Piney Mountain
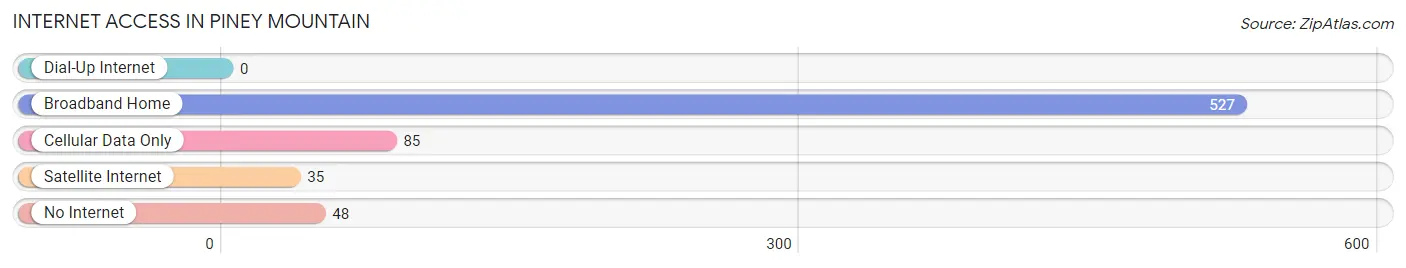
| Internet Type | # Households | % Households |
| Dial-Up Internet | 0 | 0.0% |
| Broadband Home | 527 | 77.0% |
| Cellular Data Only | 85 | 12.4% |
| Satellite Internet | 35 | 5.1% |
| No Internet | 48 | 7.0% |
| Total | 684 | 100.0% |
Piney Mountain Summary
Piney Mountain is a small, rural community located in the Blue Ridge Mountains of Virginia. It is situated in the western part of the state, in the county of Amherst. The community is located approximately 25 miles south of Lynchburg and about 50 miles north of Roanoke. The population of Piney Mountain was estimated to be around 1,000 people in 2020.
Geography
Piney Mountain is located in the foothills of the Blue Ridge Mountains, at an elevation of 1,500 feet. The area is characterized by rolling hills, dense forests, and numerous streams and creeks. The climate is generally mild, with temperatures ranging from the mid-30s in the winter to the mid-80s in the summer. The area receives an average of 40 inches of precipitation annually.
Economy
The economy of Piney Mountain is largely based on agriculture and forestry. The area is home to several small farms, which produce a variety of crops, including corn, soybeans, hay, and tobacco. The area is also home to several sawmills and lumber companies, which provide employment for many of the local residents. In addition, there are several small businesses in the area, including a general store, a gas station, and a few restaurants.
Demographics
The population of Piney Mountain is predominantly white, with a small minority population. The median household income is approximately $35,000, and the median age is around 40 years old. The area is home to a large number of retirees, as well as a significant number of young families.
History
Piney Mountain was first settled in the late 1700s by a group of settlers from Pennsylvania. The area was originally known as Piney Grove, and the settlers built a small church and a few log cabins. The area was largely agricultural, and the settlers grew corn, wheat, and tobacco. In the early 1800s, the area was home to several sawmills and lumber companies, which provided employment for many of the local residents.
In the late 1800s, the area was home to several small coal mines, which provided employment for many of the local residents. The area was also home to several small businesses, including a general store, a gas station, and a few restaurants.
In the early 1900s, the area was home to several small farms, which produced a variety of crops, including corn, soybeans, hay, and tobacco. The area was also home to several sawmills and lumber companies, which provided employment for many of the local residents.
In the late 1900s, the area was home to several small businesses, including a general store, a gas station, and a few restaurants. The area was also home to several small farms, which produced a variety of crops, including corn, soybeans, hay, and tobacco.
Today, Piney Mountain is a small, rural community with a population of around 1,000 people. The area is home to several small businesses, including a general store, a gas station, and a few restaurants. The area is also home to several small farms, which produce a variety of crops, including corn, soybeans, hay, and tobacco. The area is also home to several sawmills and lumber companies, which provide employment for many of the local residents.
Common Questions
What is Per Capita Income in Piney Mountain?
Per Capita income in Piney Mountain is $38,869.
What is the Median Family Income in Piney Mountain?
Median Family Income in Piney Mountain is $115,536.
What is the Median Household income in Piney Mountain?
Median Household Income in Piney Mountain is $122,564.
What is Income or Wage Gap in Piney Mountain?
Income or Wage Gap in Piney Mountain is 17.2%.
Women in Piney Mountain earn 82.8 cents for every dollar earned by a man.
What is Inequality or Gini Index in Piney Mountain?
Inequality or Gini Index in Piney Mountain is 0.29.
What is the Total Population of Piney Mountain?
Total Population of Piney Mountain is 2,415.
What is the Total Male Population of Piney Mountain?
Total Male Population of Piney Mountain is 1,364.
What is the Total Female Population of Piney Mountain?
Total Female Population of Piney Mountain is 1,051.
What is the Ratio of Males per 100 Females in Piney Mountain?
There are 129.78 Males per 100 Females in Piney Mountain.
What is the Ratio of Females per 100 Males in Piney Mountain?
There are 77.05 Females per 100 Males in Piney Mountain.
What is the Median Population Age in Piney Mountain?
Median Population Age in Piney Mountain is 34.3 Years.
What is the Average Family Size in Piney Mountain
Average Family Size in Piney Mountain is 3.7 People.
What is the Average Household Size in Piney Mountain
Average Household Size in Piney Mountain is 3.5 People.
How Large is the Labor Force in Piney Mountain?
There are 1,220 People in the Labor Forcein in Piney Mountain.
What is the Percentage of People in the Labor Force in Piney Mountain?
70.7% of People are in the Labor Force in Piney Mountain.