Nathalie, VA Map & Demographics
Nathalie Map
Nathalie Overview
$21,424
PER CAPITA INCOME
$43,571
AVG FAMILY INCOME
$43,571
AVG HOUSEHOLD INCOME
0.15
INEQUALITY / GINI INDEX
70
TOTAL POPULATION
56
MALE POPULATION
14
FEMALE POPULATION
400.00
MALES / 100 FEMALES
25.00
FEMALES / 100 MALES
31.9
MEDIAN AGE
3.2
AVG FAMILY SIZE
3.2
AVG HOUSEHOLD SIZE
55
LABOR FORCE [ PEOPLE ]
82.1%
PERCENT IN LABOR FORCE
Nathalie Zip Codes
Nathalie Area Codes
Income in Nathalie
Income Overview in Nathalie
Per Capita Income in Nathalie is $21,424, while median incomes of families and households are $43,571 and $43,571 respectively.
| Characteristic | Number | Measure |
| Per Capita Income | 70 | $21,424 |
| Median Family Income | 22 | $43,571 |
| Mean Family Income | 22 | $51,114 |
| Median Household Income | 22 | $43,571 |
| Mean Household Income | 22 | $51,114 |
| Income Deficit | 22 | $0 |
| Wage / Income Gap (%) | 70 | 0.00% |
| Wage / Income Gap ($) | 70 | 100.00¢ per $1 |
| Gini / Inequality Index | 70 | 0.15 |
Earnings by Sex in Nathalie
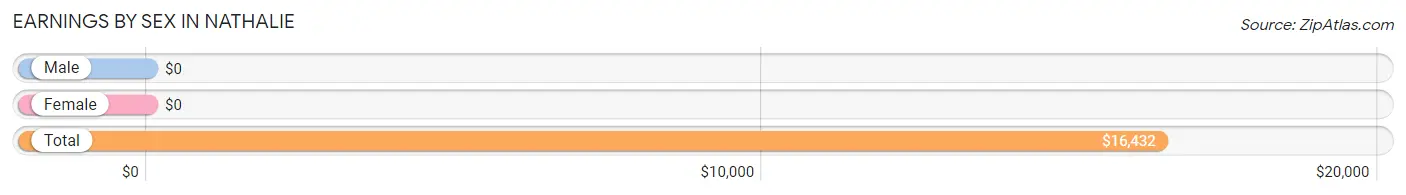
| Sex | Number | Average Earnings |
| Male | 51 (92.7%) | $0 |
| Female | 4 (7.3%) | $0 |
| Total | 55 (100.0%) | $16,432 |
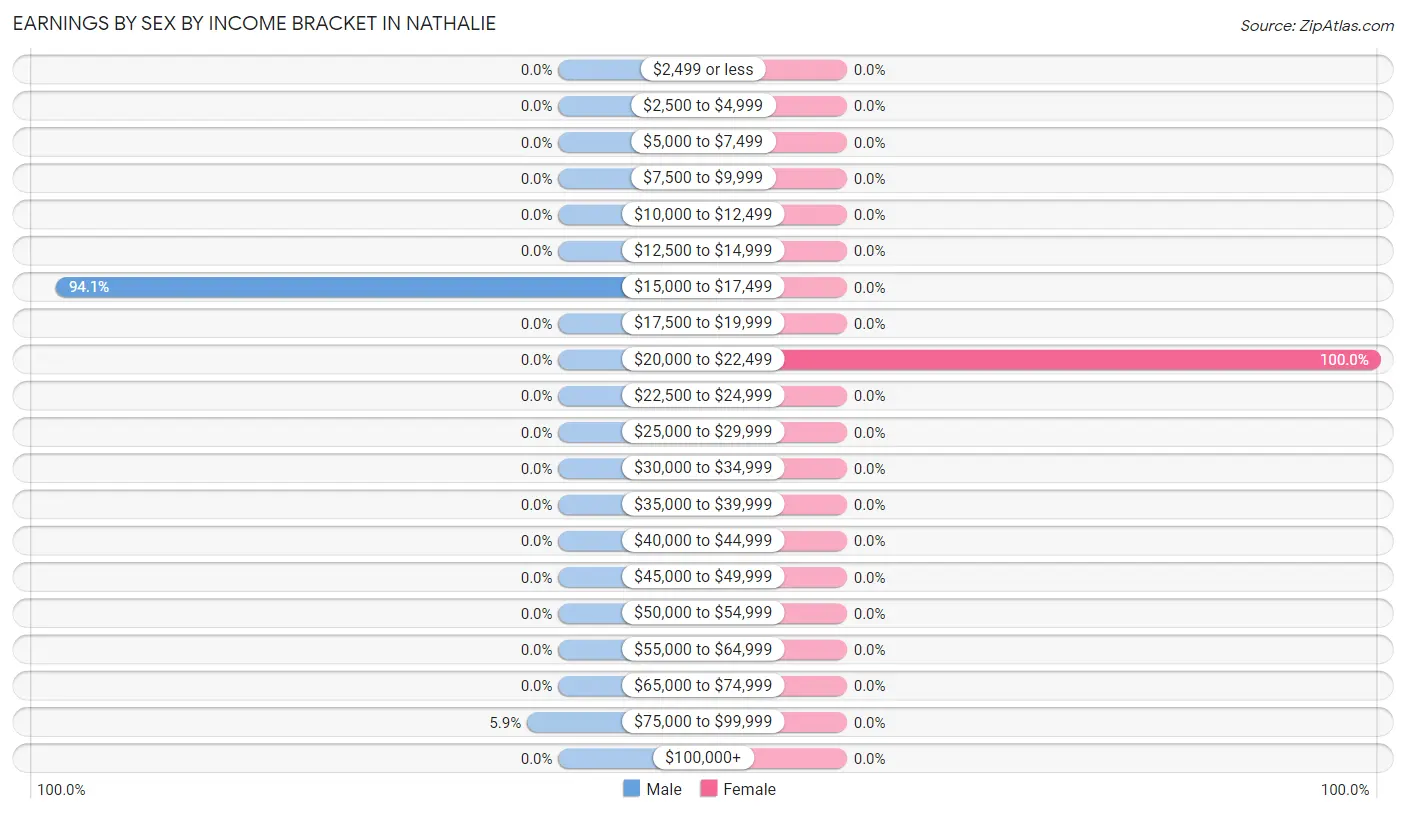
Earnings by Sex by Income Bracket in Nathalie
The most common earnings brackets in Nathalie are $15,000 to $17,499 for men (48 | 94.1%) and $20,000 to $22,499 for women (4 | 100.0%).
| Income | Male | Female |
| $2,499 or less | 0 (0.0%) | 0 (0.0%) |
| $2,500 to $4,999 | 0 (0.0%) | 0 (0.0%) |
| $5,000 to $7,499 | 0 (0.0%) | 0 (0.0%) |
| $7,500 to $9,999 | 0 (0.0%) | 0 (0.0%) |
| $10,000 to $12,499 | 0 (0.0%) | 0 (0.0%) |
| $12,500 to $14,999 | 0 (0.0%) | 0 (0.0%) |
| $15,000 to $17,499 | 48 (94.1%) | 0 (0.0%) |
| $17,500 to $19,999 | 0 (0.0%) | 0 (0.0%) |
| $20,000 to $22,499 | 0 (0.0%) | 4 (100.0%) |
| $22,500 to $24,999 | 0 (0.0%) | 0 (0.0%) |
| $25,000 to $29,999 | 0 (0.0%) | 0 (0.0%) |
| $30,000 to $34,999 | 0 (0.0%) | 0 (0.0%) |
| $35,000 to $39,999 | 0 (0.0%) | 0 (0.0%) |
| $40,000 to $44,999 | 0 (0.0%) | 0 (0.0%) |
| $45,000 to $49,999 | 0 (0.0%) | 0 (0.0%) |
| $50,000 to $54,999 | 0 (0.0%) | 0 (0.0%) |
| $55,000 to $64,999 | 0 (0.0%) | 0 (0.0%) |
| $65,000 to $74,999 | 0 (0.0%) | 0 (0.0%) |
| $75,000 to $99,999 | 3 (5.9%) | 0 (0.0%) |
| $100,000+ | 0 (0.0%) | 0 (0.0%) |
| Total | 51 (100.0%) | 4 (100.0%) |
Earnings by Sex by Educational Attainment in Nathalie
| Educational Attainment | Male Income | Female Income |
| Less than High School | - | - |
| High School Diploma | - | - |
| College or Associate's Degree | - | - |
| Bachelor's Degree | - | - |
| Graduate Degree | - | - |
| Total | - | - |
Family Income in Nathalie
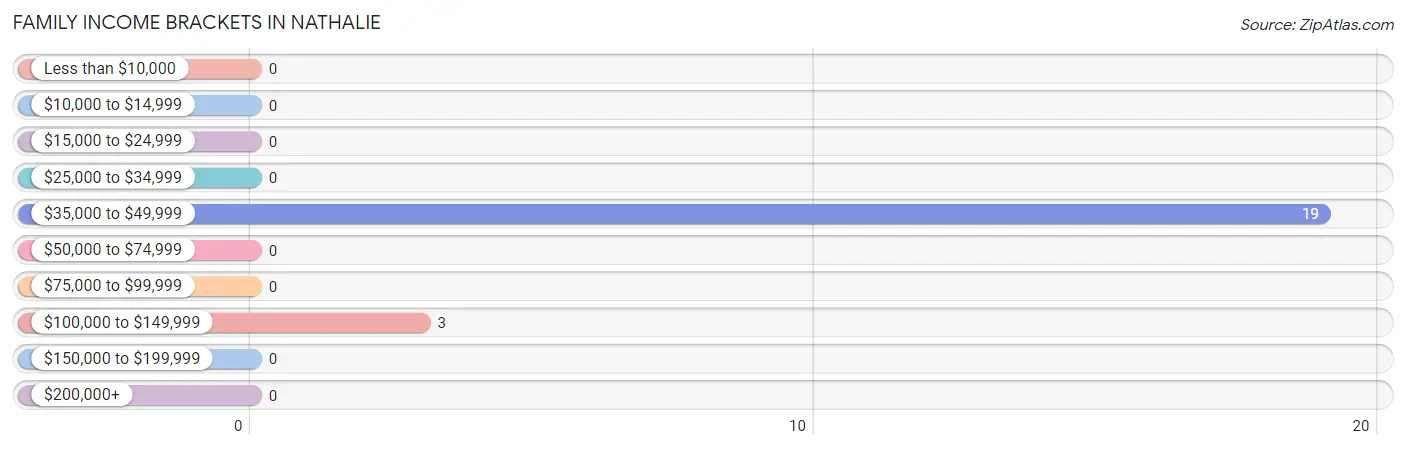
Family Income Brackets in Nathalie
According to the Nathalie family income data, there are 19 families falling into the $35,000 to $49,999 income range, which is the most common income bracket and makes up 86.4% of all families.
| Income Bracket | # Families | % Families |
| Less than $10,000 | 0 | 0.0% |
| $10,000 to $14,999 | 0 | 0.0% |
| $15,000 to $24,999 | 0 | 0.0% |
| $25,000 to $34,999 | 0 | 0.0% |
| $35,000 to $49,999 | 19 | 86.4% |
| $50,000 to $74,999 | 0 | 0.0% |
| $75,000 to $99,999 | 0 | 0.0% |
| $100,000 to $149,999 | 3 | 13.6% |
| $150,000 to $199,999 | 0 | 0.0% |
| $200,000+ | 0 | 0.0% |
Family Income by Famaliy Size in Nathalie
| Income Bracket | # Families | Median Income |
| 2-Person Families | 19 (86.4%) | $0 |
| 3-Person Families | 3 (13.6%) | $0 |
| 4-Person Families | 0 (0.0%) | $0 |
| 5-Person Families | 0 (0.0%) | $0 |
| 6-Person Families | 0 (0.0%) | $0 |
| 7+ Person Families | 0 (0.0%) | $0 |
| Total | 22 (100.0%) | $43,571 |
Family Income by Number of Earners in Nathalie
| Number of Earners | # Families | Median Income |
| No Earners | 5 (22.7%) | $0 |
| 1 Earner | 0 (0.0%) | $0 |
| 2 Earners | 17 (77.3%) | $0 |
| 3+ Earners | 0 (0.0%) | $0 |
| Total | 22 (100.0%) | $43,571 |
Household Income in Nathalie
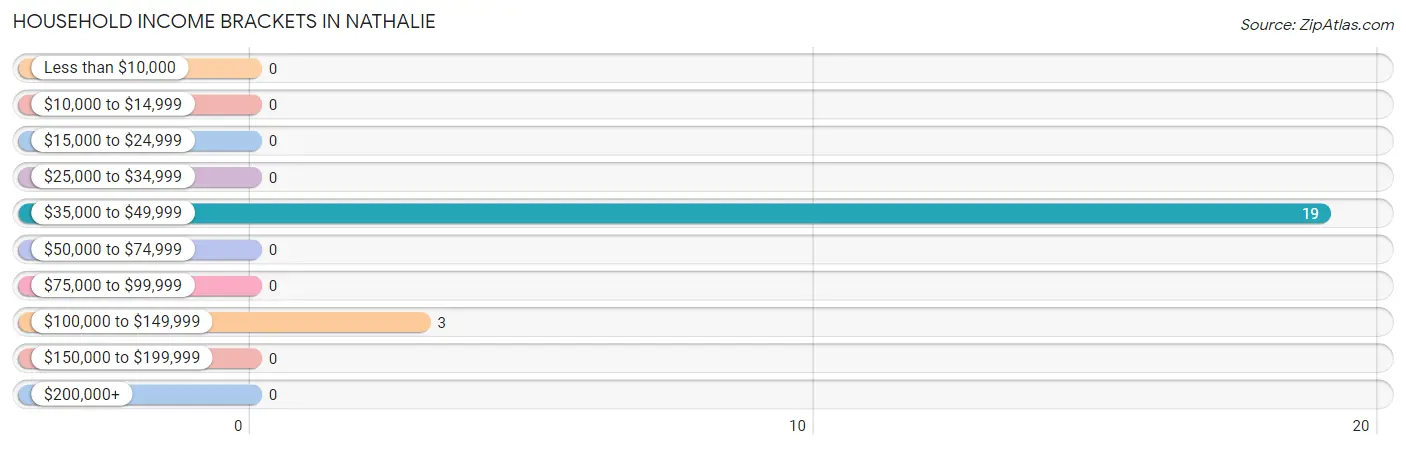
Household Income Brackets in Nathalie
With 19 households falling in the category, the $35,000 to $49,999 income range is the most frequent in Nathalie, accounting for 86.4% of all households.
| Income Bracket | # Households | % Households |
| Less than $10,000 | 0 | 0.0% |
| $10,000 to $14,999 | 0 | 0.0% |
| $15,000 to $24,999 | 0 | 0.0% |
| $25,000 to $34,999 | 0 | 0.0% |
| $35,000 to $49,999 | 19 | 86.4% |
| $50,000 to $74,999 | 0 | 0.0% |
| $75,000 to $99,999 | 0 | 0.0% |
| $100,000 to $149,999 | 3 | 13.6% |
| $150,000 to $199,999 | 0 | 0.0% |
| $200,000+ | 0 | 0.0% |
Household Income by Householder Age in Nathalie
| Income Bracket | # Households | Median Income |
| 15 to 24 Years | 0 (0.0%) | $0 |
| 25 to 44 Years | 3 (13.6%) | $0 |
| 45 to 64 Years | 0 (0.0%) | $0 |
| 65+ Years | 19 (86.4%) | $0 |
| Total | 22 (100.0%) | $43,571 |
Poverty in Nathalie
Income Below Poverty by Sex and Age in Nathalie
| Age Bracket | Male | Female |
| Under 5 Years | 0 (0.0%) | 0 (0.0%) |
| 5 Years | 0 (0.0%) | 0 (0.0%) |
| 6 to 11 Years | 0 (0.0%) | 0 (0.0%) |
| 12 to 14 Years | 0 (0.0%) | 0 (0.0%) |
| 15 Years | 0 (0.0%) | 0 (0.0%) |
| 16 and 17 Years | 0 (0.0%) | 0 (0.0%) |
| 18 to 24 Years | 0 (0.0%) | 0 (0.0%) |
| 25 to 34 Years | 0 (0.0%) | 0 (0.0%) |
| 35 to 44 Years | 0 (0.0%) | 0 (0.0%) |
| 45 to 54 Years | 0 (0.0%) | 0 (0.0%) |
| 55 to 64 Years | 0 (0.0%) | 0 (0.0%) |
| 65 to 74 Years | 0 (0.0%) | 0 (0.0%) |
| 75 Years and over | 0 (0.0%) | 0 (0.0%) |
| Total | 0 (0.0%) | 0 (0.0%) |
Income Above Poverty by Sex and Age in Nathalie
According to the poverty statistics in Nathalie, males aged 25 to 34 years and females aged under 5 years are the age groups that are most secure financially, with 100.0% of males and 100.0% of females in these age groups living above the poverty line.
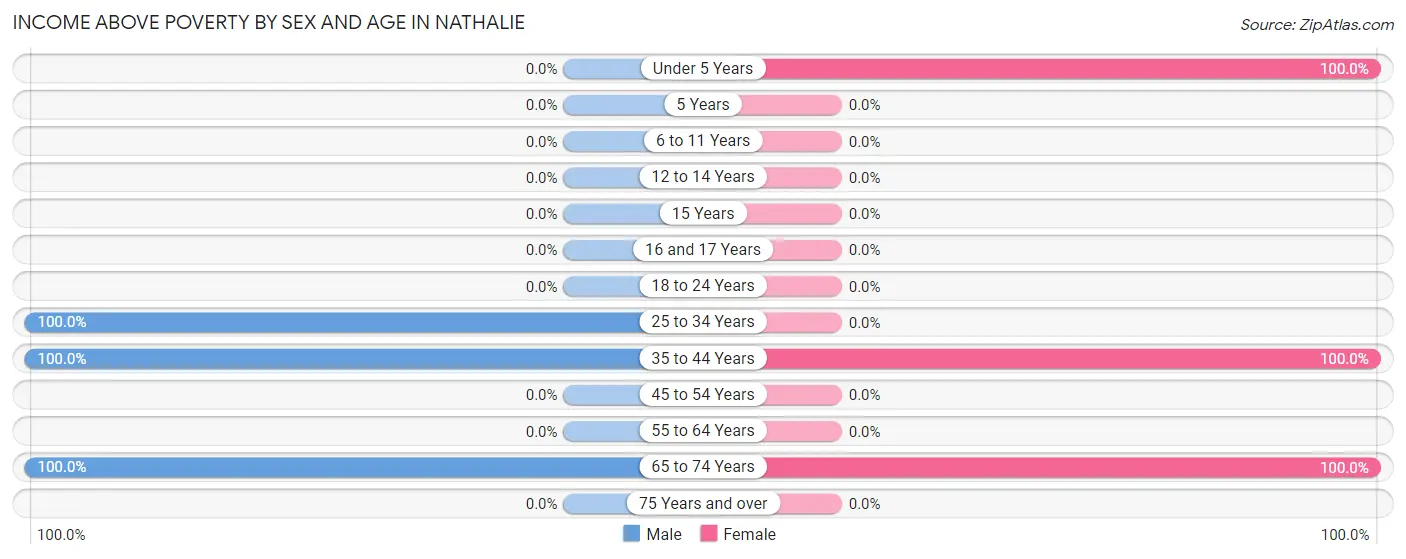
| Age Bracket | Male | Female |
| Under 5 Years | 0 (0.0%) | 3 (100.0%) |
| 5 Years | 0 (0.0%) | 0 (0.0%) |
| 6 to 11 Years | 0 (0.0%) | 0 (0.0%) |
| 12 to 14 Years | 0 (0.0%) | 0 (0.0%) |
| 15 Years | 0 (0.0%) | 0 (0.0%) |
| 16 and 17 Years | 0 (0.0%) | 0 (0.0%) |
| 18 to 24 Years | 0 (0.0%) | 0 (0.0%) |
| 25 to 34 Years | 34 (100.0%) | 0 (0.0%) |
| 35 to 44 Years | 3 (100.0%) | 4 (100.0%) |
| 45 to 54 Years | 0 (0.0%) | 0 (0.0%) |
| 55 to 64 Years | 0 (0.0%) | 0 (0.0%) |
| 65 to 74 Years | 19 (100.0%) | 7 (100.0%) |
| 75 Years and over | 0 (0.0%) | 0 (0.0%) |
| Total | 56 (100.0%) | 14 (100.0%) |
Income Below Poverty Among Married-Couple Families in Nathalie
| Children | Above Poverty | Below Poverty |
| No Children | 5 (100.0%) | 0 (0.0%) |
| 1 or 2 Children | 3 (100.0%) | 0 (0.0%) |
| 3 or 4 Children | 0 (0.0%) | 0 (0.0%) |
| 5 or more Children | 0 (0.0%) | 0 (0.0%) |
| Total | 8 (100.0%) | 0 (0.0%) |
Income Below Poverty Among Single-Parent Households in Nathalie
| Children | Single Father | Single Mother |
| No Children | 0 (0.0%) | 0 (0.0%) |
| 1 or 2 Children | 0 (0.0%) | 0 (0.0%) |
| 3 or 4 Children | 0 (0.0%) | 0 (0.0%) |
| 5 or more Children | 0 (0.0%) | 0 (0.0%) |
| Total | 0 (0.0%) | 0 (0.0%) |
Income Below Poverty Among Married-Couple vs Single-Parent Households in Nathalie
| Children | Married-Couple Families | Single-Parent Households |
| No Children | 0 (0.0%) | 0 (0.0%) |
| 1 or 2 Children | 0 (0.0%) | 0 (0.0%) |
| 3 or 4 Children | 0 (0.0%) | 0 (0.0%) |
| 5 or more Children | 0 (0.0%) | 0 (0.0%) |
| Total | 0 (0.0%) | 0 (0.0%) |
Race in Nathalie
The most populous races in Nathalie are Black / African American (60 | 85.7%), and White / Caucasian (10 | 14.3%).
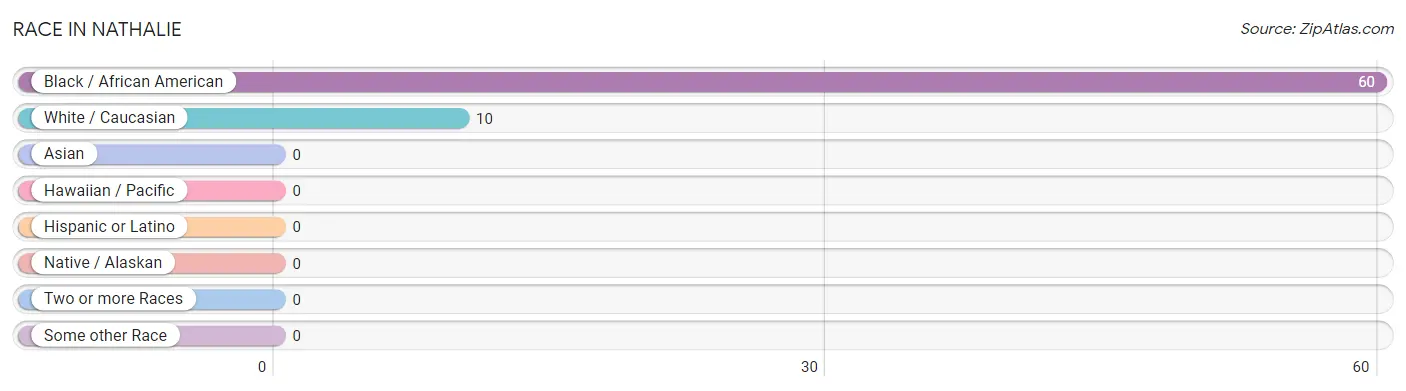
| Race | # Population | % Population |
| Asian | 0 | 0.0% |
| Black / African American | 60 | 85.7% |
| Hawaiian / Pacific | 0 | 0.0% |
| Hispanic or Latino | 0 | 0.0% |
| Native / Alaskan | 0 | 0.0% |
| White / Caucasian | 10 | 14.3% |
| Two or more Races | 0 | 0.0% |
| Some other Race | 0 | 0.0% |
| Total | 70 | 100.0% |
Ancestry in Nathalie

| Ancestry | # Population | % Population | View All 0 Rows |
Immigrants in Nathalie

| Immigration Origin | # Population | % Population | View All 0 Rows |
Sex and Age in Nathalie
Sex and Age in Nathalie
The most populous age groups in Nathalie are 30 to 34 Years (34 | 60.7%) for men and 65 to 69 Years (7 | 50.0%) for women.
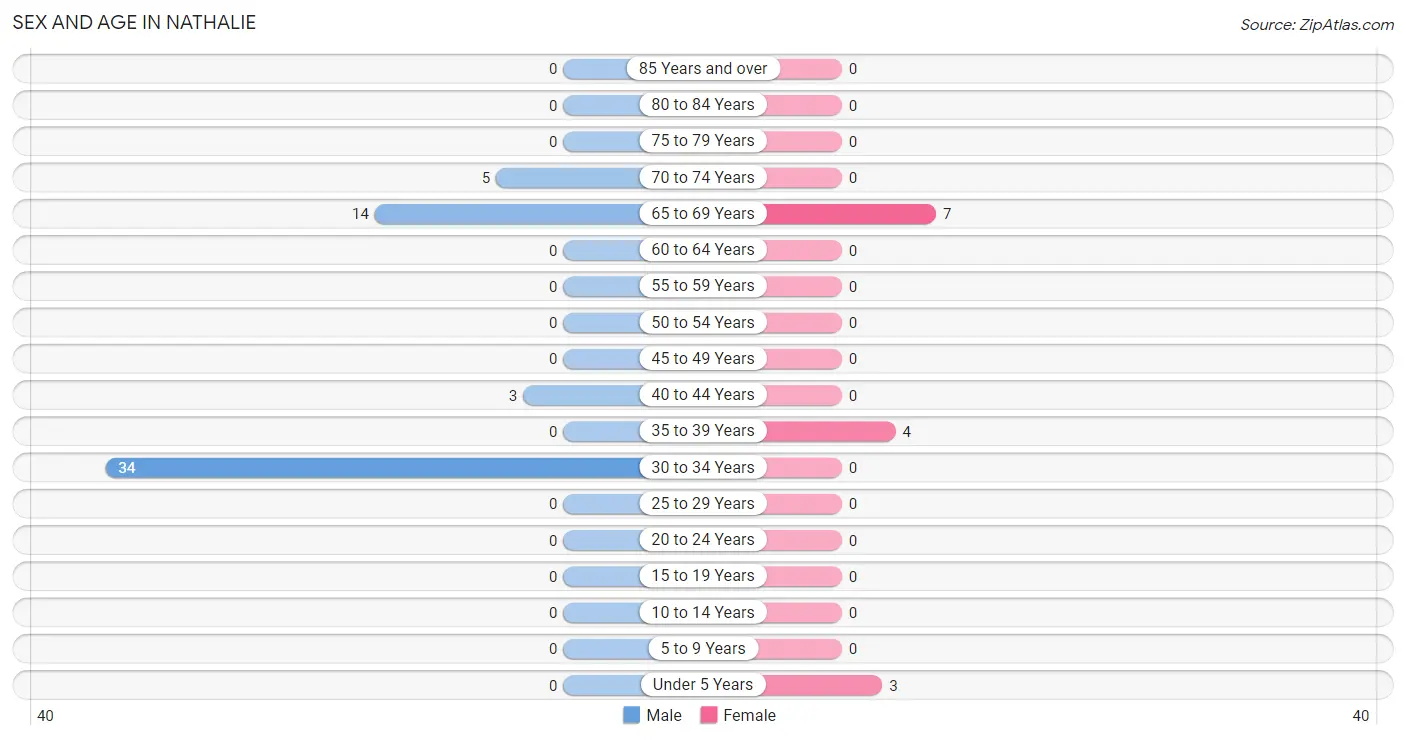
| Age Bracket | Male | Female |
| Under 5 Years | 0 (0.0%) | 3 (21.4%) |
| 5 to 9 Years | 0 (0.0%) | 0 (0.0%) |
| 10 to 14 Years | 0 (0.0%) | 0 (0.0%) |
| 15 to 19 Years | 0 (0.0%) | 0 (0.0%) |
| 20 to 24 Years | 0 (0.0%) | 0 (0.0%) |
| 25 to 29 Years | 0 (0.0%) | 0 (0.0%) |
| 30 to 34 Years | 34 (60.7%) | 0 (0.0%) |
| 35 to 39 Years | 0 (0.0%) | 4 (28.6%) |
| 40 to 44 Years | 3 (5.4%) | 0 (0.0%) |
| 45 to 49 Years | 0 (0.0%) | 0 (0.0%) |
| 50 to 54 Years | 0 (0.0%) | 0 (0.0%) |
| 55 to 59 Years | 0 (0.0%) | 0 (0.0%) |
| 60 to 64 Years | 0 (0.0%) | 0 (0.0%) |
| 65 to 69 Years | 14 (25.0%) | 7 (50.0%) |
| 70 to 74 Years | 5 (8.9%) | 0 (0.0%) |
| 75 to 79 Years | 0 (0.0%) | 0 (0.0%) |
| 80 to 84 Years | 0 (0.0%) | 0 (0.0%) |
| 85 Years and over | 0 (0.0%) | 0 (0.0%) |
| Total | 56 (100.0%) | 14 (100.0%) |
Families and Households in Nathalie
Median Family Size in Nathalie
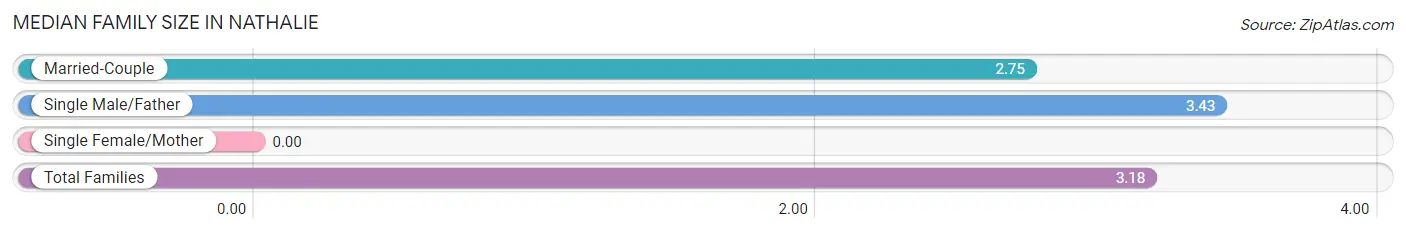
| Family Type | # Families | Family Size |
| Married-Couple | 8 (36.4%) | 2.75 |
| Single Male/Father | 14 (63.6%) | 3.43 |
| Single Female/Mother | 0 (0.0%) | - |
| Total Families | 22 (100.0%) | 3.18 |
Median Household Size in Nathalie
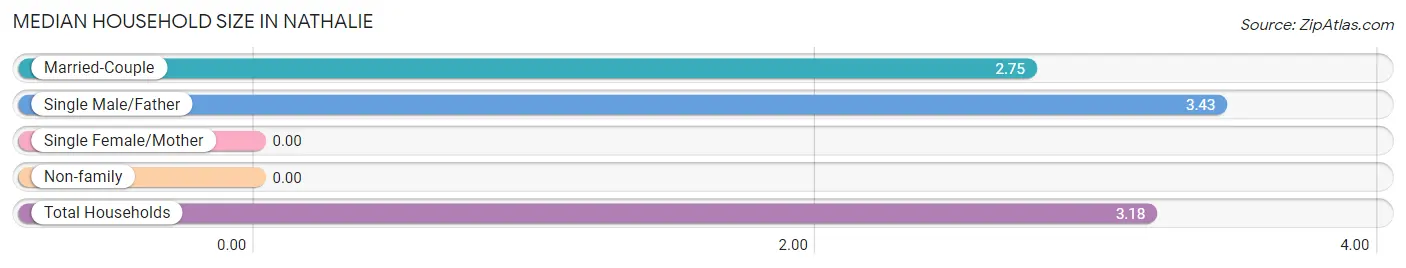
| Household Type | # Households | Household Size |
| Married-Couple | 8 (36.4%) | 2.75 |
| Single Male/Father | 14 (63.6%) | 3.43 |
| Single Female/Mother | 0 (0.0%) | - |
| Non-family | 0 (0.0%) | - |
| Total Households | 22 (100.0%) | 3.18 |
Household Size by Marriage Status in Nathalie
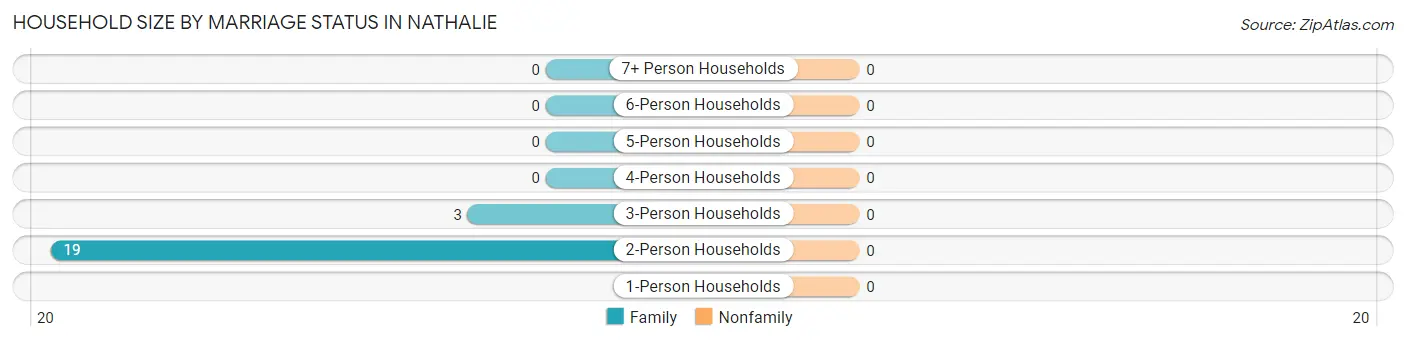
| Household Size | Family Households | Nonfamily Households |
| 1-Person Households | - | 0 (0.0%) |
| 2-Person Households | 19 (86.4%) | 0 (0.0%) |
| 3-Person Households | 3 (13.6%) | 0 (0.0%) |
| 4-Person Households | 0 (0.0%) | 0 (0.0%) |
| 5-Person Households | 0 (0.0%) | 0 (0.0%) |
| 6-Person Households | 0 (0.0%) | 0 (0.0%) |
| 7+ Person Households | 0 (0.0%) | 0 (0.0%) |
| Total | 22 (100.0%) | 0 (0.0%) |
Female Fertility in Nathalie
Fertility by Age in Nathalie
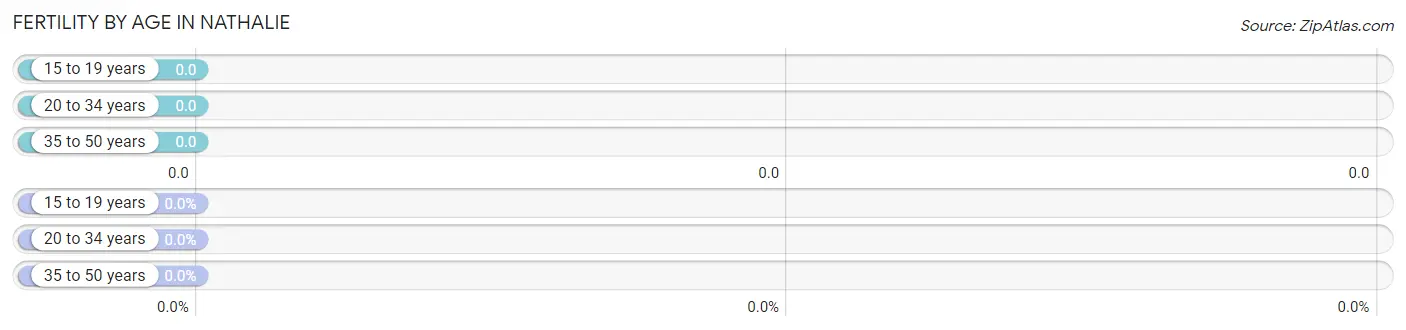
| Age Bracket | Women with Births | Births / 1,000 Women |
| 15 to 19 years | 0 (0.0%) | 0.0 |
| 20 to 34 years | 0 (0.0%) | 0.0 |
| 35 to 50 years | 0 (0.0%) | 0.0 |
| Total | 0 (0.0%) | 0.0 |
Fertility by Age by Marriage Status in Nathalie
| Age Bracket | Married | Unmarried |
| 15 to 19 years | 0 (0.0%) | 0 (0.0%) |
| 20 to 34 years | 0 (0.0%) | 0 (0.0%) |
| 35 to 50 years | 0 (0.0%) | 0 (0.0%) |
| Total | 0 (0.0%) | 0 (0.0%) |
Fertility by Education in Nathalie
| Educational Attainment | Women with Births | Births / 1,000 Women |
| Less than High School | 0 (0.0%) | 0.0 |
| High School Diploma | 0 (0.0%) | 0.0 |
| College or Associate's Degree | 0 (0.0%) | 0.0 |
| Bachelor's Degree | 0 (0.0%) | 0.0 |
| Graduate Degree | 0 (0.0%) | 0.0 |
| Total | 0 (0.0%) | 0.0 |
Fertility by Education by Marriage Status in Nathalie
| Educational Attainment | Married | Unmarried |
| Less than High School | 0 (0.0%) | 0 (0.0%) |
| High School Diploma | 0 (0.0%) | 0 (0.0%) |
| College or Associate's Degree | 0 (0.0%) | 0 (0.0%) |
| Bachelor's Degree | 0 (0.0%) | 0 (0.0%) |
| Graduate Degree | 0 (0.0%) | 0 (0.0%) |
| Total | 0 (0.0%) | 0 (0.0%) |
Employment Characteristics in Nathalie
Employment by Class of Employer in Nathalie
Among the 55 employed individuals in Nathalie, , and private company employees (55 | 100.0%) make up the most common classes of employment.
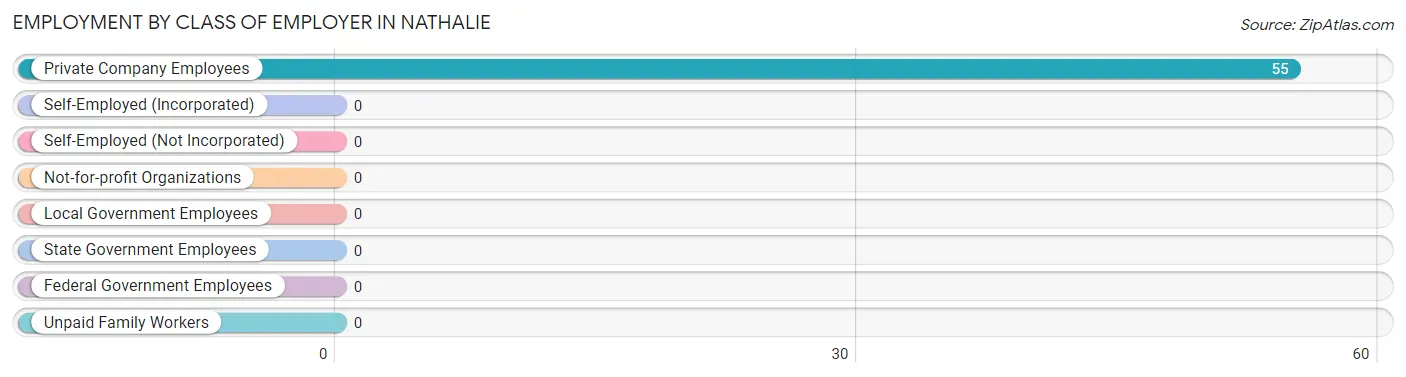
| Employer Class | # Employees | % Employees |
| Private Company Employees | 55 | 100.0% |
| Self-Employed (Incorporated) | 0 | 0.0% |
| Self-Employed (Not Incorporated) | 0 | 0.0% |
| Not-for-profit Organizations | 0 | 0.0% |
| Local Government Employees | 0 | 0.0% |
| State Government Employees | 0 | 0.0% |
| Federal Government Employees | 0 | 0.0% |
| Unpaid Family Workers | 0 | 0.0% |
| Total | 55 | 100.0% |
Employment Status by Age in Nathalie
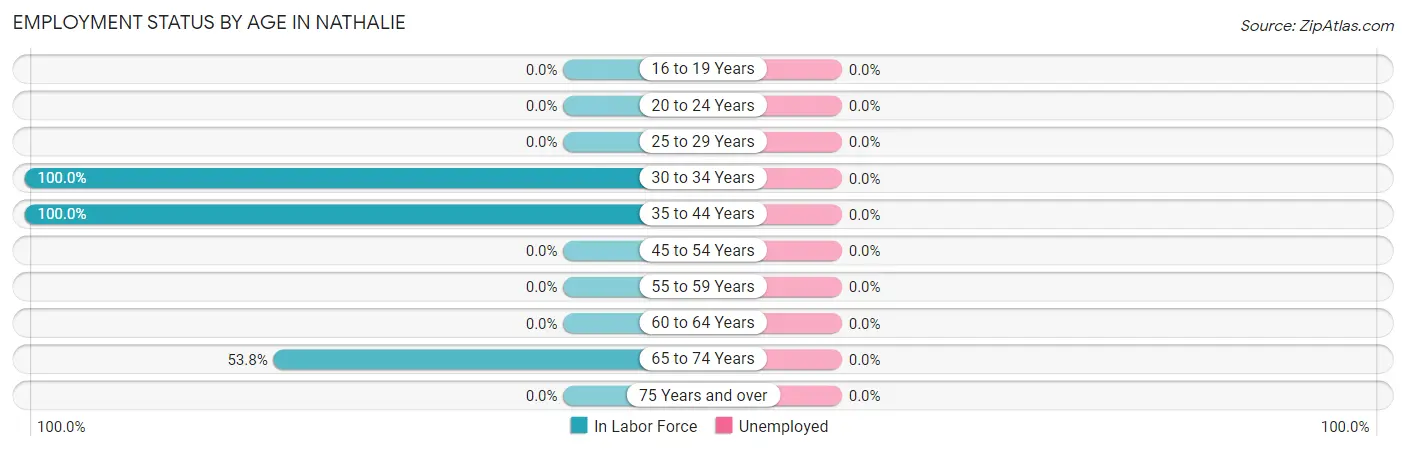
| Age Bracket | In Labor Force | Unemployed |
| 16 to 19 Years | 0 (0.0%) | 0 (0.0%) |
| 20 to 24 Years | 0 (0.0%) | 0 (0.0%) |
| 25 to 29 Years | 0 (0.0%) | 0 (0.0%) |
| 30 to 34 Years | 34 (100.0%) | 0 (0.0%) |
| 35 to 44 Years | 7 (100.0%) | 0 (0.0%) |
| 45 to 54 Years | 0 (0.0%) | 0 (0.0%) |
| 55 to 59 Years | 0 (0.0%) | 0 (0.0%) |
| 60 to 64 Years | 0 (0.0%) | 0 (0.0%) |
| 65 to 74 Years | 14 (53.8%) | 0 (0.0%) |
| 75 Years and over | 0 (0.0%) | 0 (0.0%) |
| Total | 55 (82.1%) | 0 (0.0%) |
Employment Status by Educational Attainment in Nathalie
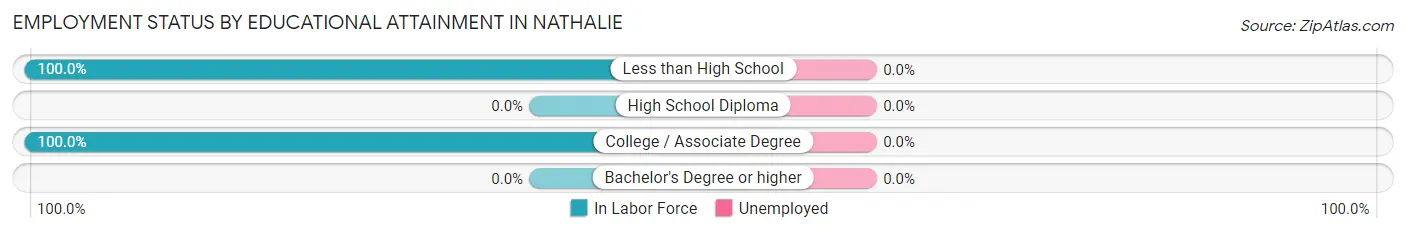
| Educational Attainment | In Labor Force | Unemployed |
| Less than High School | 34 (100.0%) | 0 (0.0%) |
| High School Diploma | 0 (0.0%) | 0 (0.0%) |
| College / Associate Degree | 7 (100.0%) | 0 (0.0%) |
| Bachelor's Degree or higher | 0 (0.0%) | 0 (0.0%) |
| Total | 41 (100.0%) | 0 (0.0%) |
Employment Occupations by Sex in Nathalie
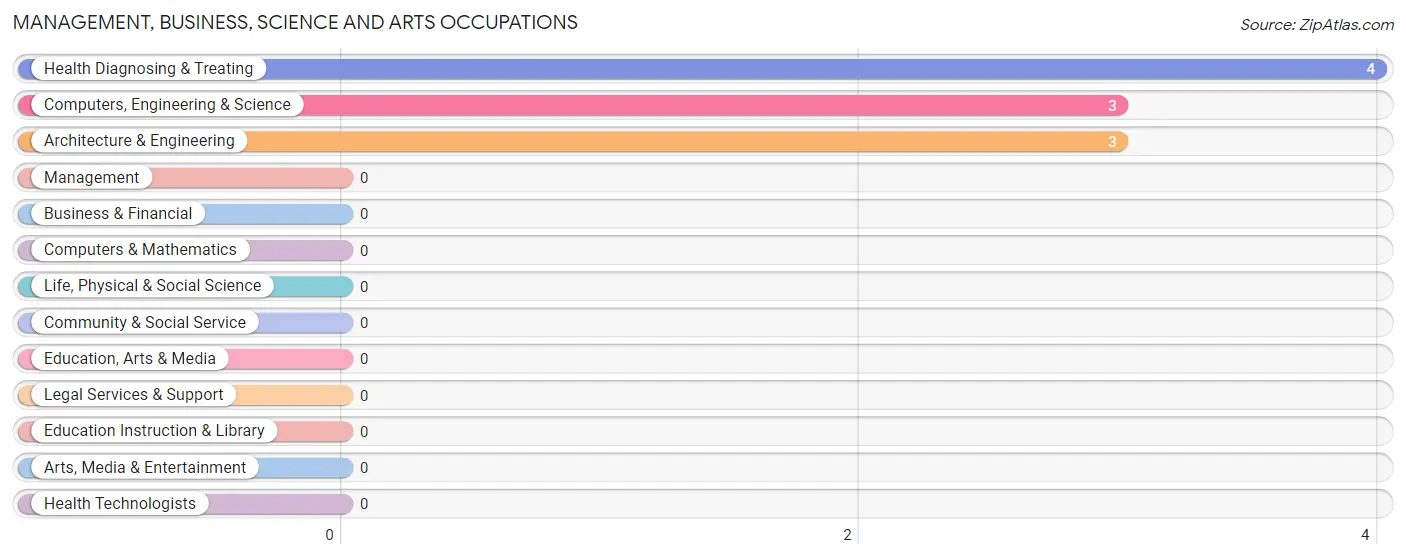
Management, Business, Science and Arts Occupations
The most common Management, Business, Science and Arts occupations in Nathalie are Health Diagnosing & Treating (4 | 7.3%), Computers, Engineering & Science (3 | 5.4%), and Architecture & Engineering (3 | 5.4%).
Management, Business, Science and Arts Occupations by Sex
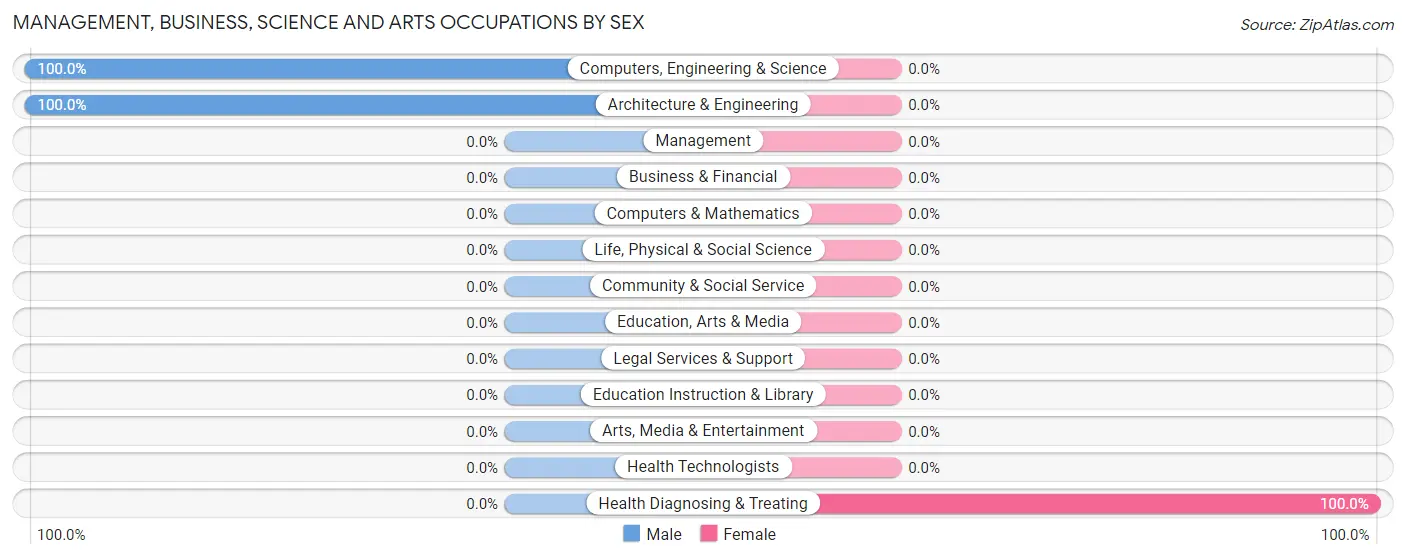
| Occupation | Male | Female |
| Management | 0 (0.0%) | 0 (0.0%) |
| Business & Financial | 0 (0.0%) | 0 (0.0%) |
| Computers, Engineering & Science | 3 (100.0%) | 0 (0.0%) |
| Computers & Mathematics | 0 (0.0%) | 0 (0.0%) |
| Architecture & Engineering | 3 (100.0%) | 0 (0.0%) |
| Life, Physical & Social Science | 0 (0.0%) | 0 (0.0%) |
| Community & Social Service | 0 (0.0%) | 0 (0.0%) |
| Education, Arts & Media | 0 (0.0%) | 0 (0.0%) |
| Legal Services & Support | 0 (0.0%) | 0 (0.0%) |
| Education Instruction & Library | 0 (0.0%) | 0 (0.0%) |
| Arts, Media & Entertainment | 0 (0.0%) | 0 (0.0%) |
| Health Diagnosing & Treating | 0 (0.0%) | 4 (100.0%) |
| Health Technologists | 0 (0.0%) | 0 (0.0%) |
| Total (Category) | 3 (42.9%) | 4 (57.1%) |
| Total (Overall) | 51 (92.7%) | 4 (7.3%) |
Services Occupations
Services Occupations by Sex
| Occupation | Male | Female |
| Healthcare Support | 0 (0.0%) | 0 (0.0%) |
| Security & Protection | 0 (0.0%) | 0 (0.0%) |
| Firefighting & Prevention | 0 (0.0%) | 0 (0.0%) |
| Law Enforcement | 0 (0.0%) | 0 (0.0%) |
| Food Preparation & Serving | 0 (0.0%) | 0 (0.0%) |
| Cleaning & Maintenance | 0 (0.0%) | 0 (0.0%) |
| Personal Care & Service | 0 (0.0%) | 0 (0.0%) |
| Total (Category) | 0 (0.0%) | 0 (0.0%) |
| Total (Overall) | 51 (92.7%) | 4 (7.3%) |
Sales and Office Occupations
Sales and Office Occupations by Sex
| Occupation | Male | Female |
| Sales & Related | 0 (0.0%) | 0 (0.0%) |
| Office & Administration | 0 (0.0%) | 0 (0.0%) |
| Total (Category) | 0 (0.0%) | 0 (0.0%) |
| Total (Overall) | 51 (92.7%) | 4 (7.3%) |
Natural Resources, Construction and Maintenance Occupations
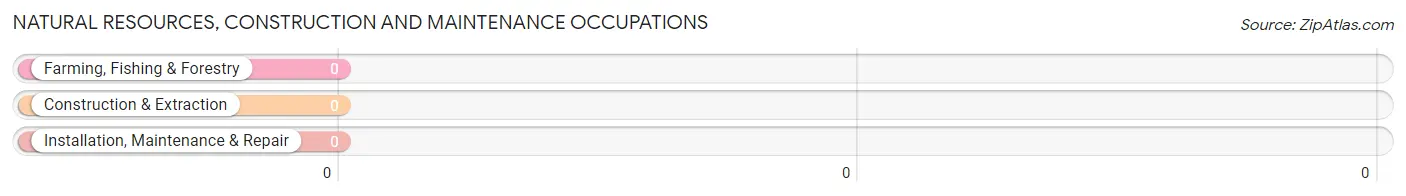
Natural Resources, Construction and Maintenance Occupations by Sex
| Occupation | Male | Female |
| Farming, Fishing & Forestry | 0 (0.0%) | 0 (0.0%) |
| Construction & Extraction | 0 (0.0%) | 0 (0.0%) |
| Installation, Maintenance & Repair | 0 (0.0%) | 0 (0.0%) |
| Total (Category) | 0 (0.0%) | 0 (0.0%) |
| Total (Overall) | 51 (92.7%) | 4 (7.3%) |
Production, Transportation and Moving Occupations
The most common Production, Transportation and Moving occupations in Nathalie are Material Moving (34 | 61.8%), and Production (14 | 25.5%).
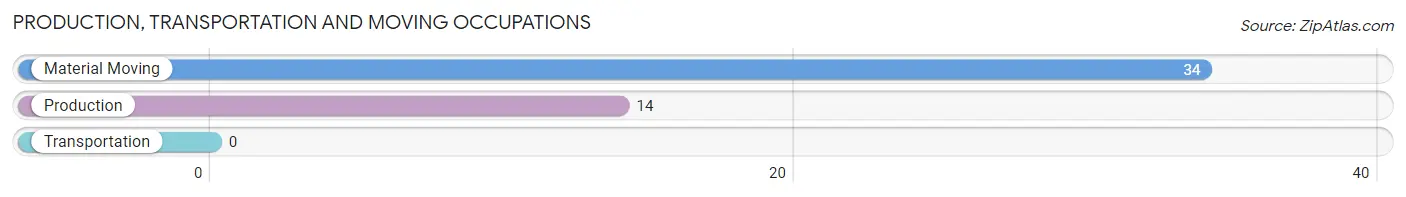
Production, Transportation and Moving Occupations by Sex
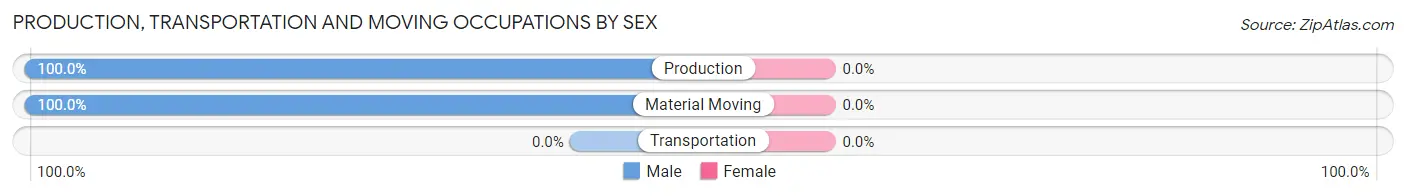
| Occupation | Male | Female |
| Production | 14 (100.0%) | 0 (0.0%) |
| Transportation | 0 (0.0%) | 0 (0.0%) |
| Material Moving | 34 (100.0%) | 0 (0.0%) |
| Total (Category) | 48 (100.0%) | 0 (0.0%) |
| Total (Overall) | 51 (92.7%) | 4 (7.3%) |
Employment Industries by Sex in Nathalie
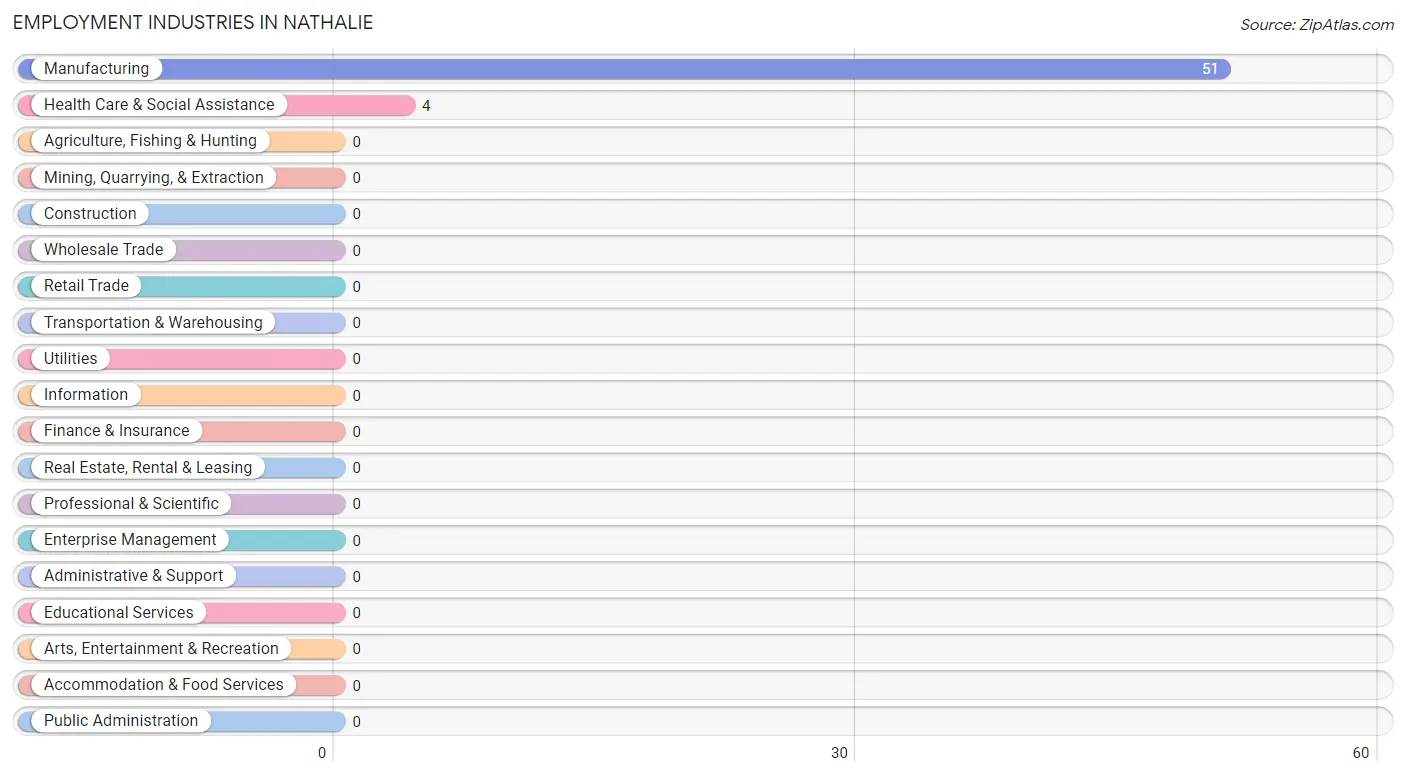
Employment Industries in Nathalie
The major employment industries in Nathalie include Manufacturing (51 | 92.7%), and Health Care & Social Assistance (4 | 7.3%).
Employment Industries by Sex in Nathalie
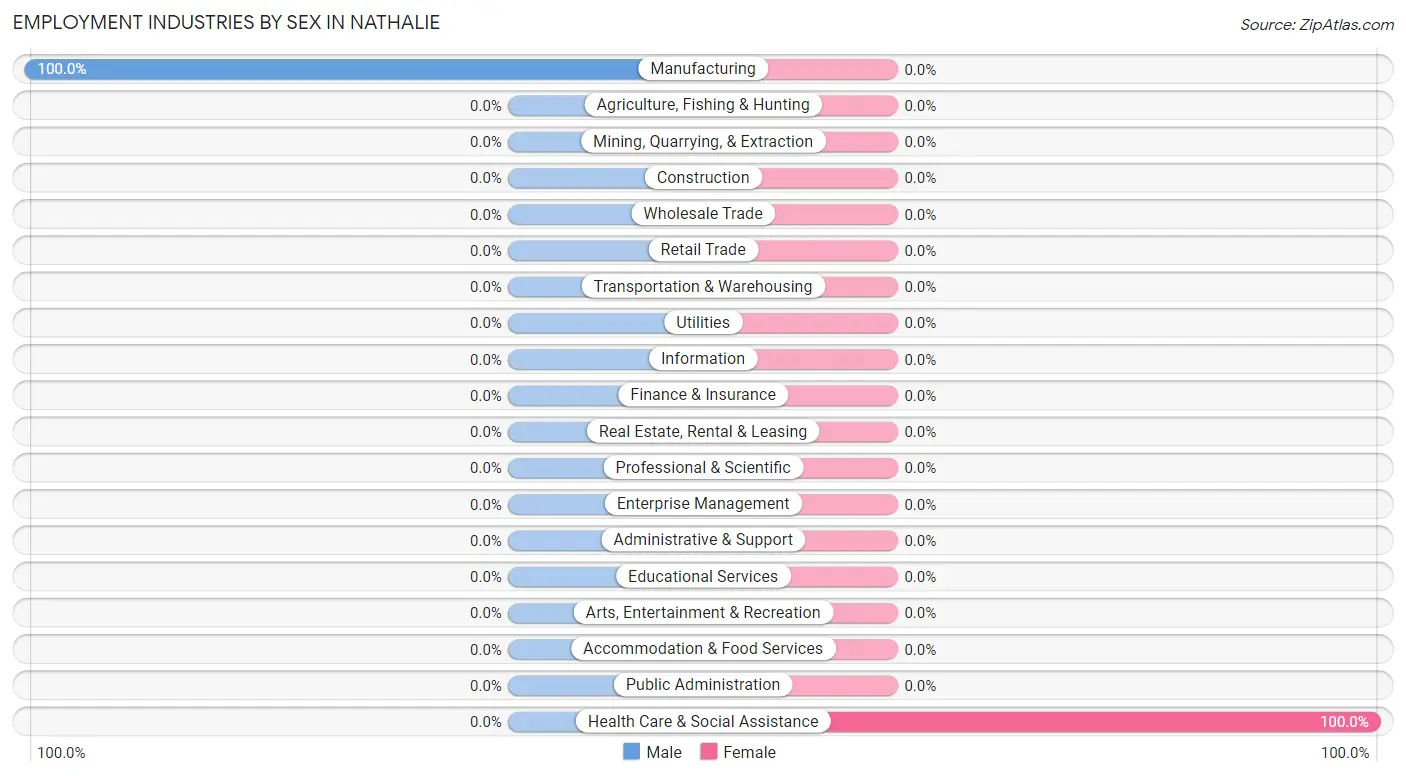
| Industry | Male | Female |
| Agriculture, Fishing & Hunting | 0 (0.0%) | 0 (0.0%) |
| Mining, Quarrying, & Extraction | 0 (0.0%) | 0 (0.0%) |
| Construction | 0 (0.0%) | 0 (0.0%) |
| Manufacturing | 51 (100.0%) | 0 (0.0%) |
| Wholesale Trade | 0 (0.0%) | 0 (0.0%) |
| Retail Trade | 0 (0.0%) | 0 (0.0%) |
| Transportation & Warehousing | 0 (0.0%) | 0 (0.0%) |
| Utilities | 0 (0.0%) | 0 (0.0%) |
| Information | 0 (0.0%) | 0 (0.0%) |
| Finance & Insurance | 0 (0.0%) | 0 (0.0%) |
| Real Estate, Rental & Leasing | 0 (0.0%) | 0 (0.0%) |
| Professional & Scientific | 0 (0.0%) | 0 (0.0%) |
| Enterprise Management | 0 (0.0%) | 0 (0.0%) |
| Administrative & Support | 0 (0.0%) | 0 (0.0%) |
| Educational Services | 0 (0.0%) | 0 (0.0%) |
| Health Care & Social Assistance | 0 (0.0%) | 4 (100.0%) |
| Arts, Entertainment & Recreation | 0 (0.0%) | 0 (0.0%) |
| Accommodation & Food Services | 0 (0.0%) | 0 (0.0%) |
| Public Administration | 0 (0.0%) | 0 (0.0%) |
| Total | 51 (92.7%) | 4 (7.3%) |
Education in Nathalie
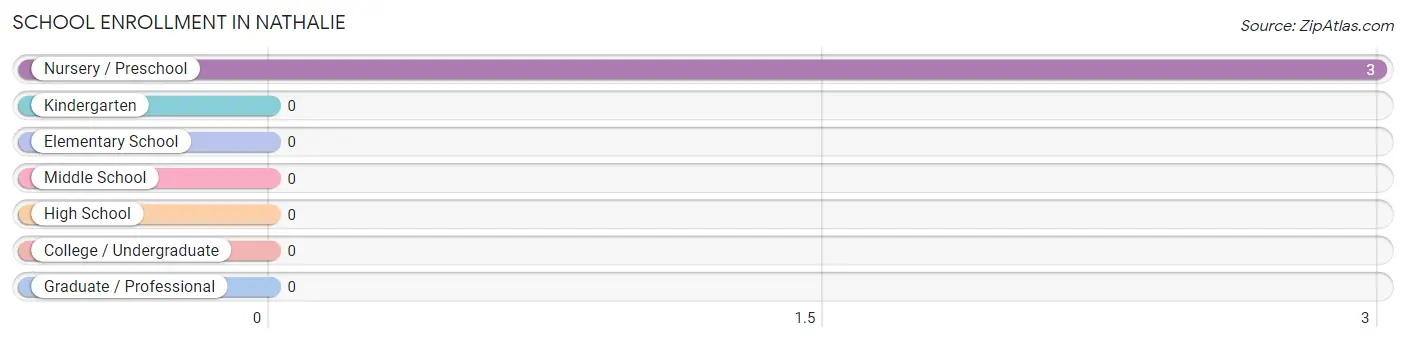
School Enrollment in Nathalie
| School Level | # Students | % Students |
| Nursery / Preschool | 3 | 100.0% |
| Kindergarten | 0 | 0.0% |
| Elementary School | 0 | 0.0% |
| Middle School | 0 | 0.0% |
| High School | 0 | 0.0% |
| College / Undergraduate | 0 | 0.0% |
| Graduate / Professional | 0 | 0.0% |
| Total | 3 | 100.0% |
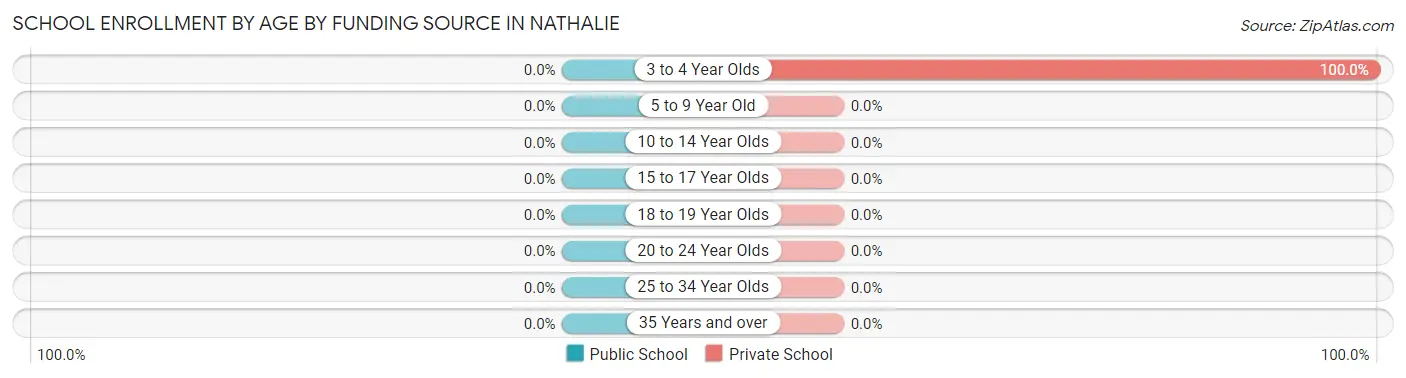
School Enrollment by Age by Funding Source in Nathalie
| Age Bracket | Public School | Private School |
| 3 to 4 Year Olds | 0 (0.0%) | 3 (100.0%) |
| 5 to 9 Year Old | 0 (0.0%) | 0 (0.0%) |
| 10 to 14 Year Olds | 0 (0.0%) | 0 (0.0%) |
| 15 to 17 Year Olds | 0 (0.0%) | 0 (0.0%) |
| 18 to 19 Year Olds | 0 (0.0%) | 0 (0.0%) |
| 20 to 24 Year Olds | 0 (0.0%) | 0 (0.0%) |
| 25 to 34 Year Olds | 0 (0.0%) | 0 (0.0%) |
| 35 Years and over | 0 (0.0%) | 0 (0.0%) |
| Total | 0 (0.0%) | 3 (100.0%) |
Educational Attainment by Field of Study in Nathalie
| Field of Study | # Graduates | % Graduates |
| Computers & Mathematics | 0 | 0.0% |
| Bio, Nature & Agricultural | 0 | 0.0% |
| Physical & Health Sciences | 0 | 0.0% |
| Psychology | 0 | 0.0% |
| Social Sciences | 0 | 0.0% |
| Engineering | 0 | 0.0% |
| Multidisciplinary Studies | 0 | 0.0% |
| Science & Technology | 0 | 0.0% |
| Business | 0 | 0.0% |
| Education | 0 | 0.0% |
| Literature & Languages | 0 | 0.0% |
| Liberal Arts & History | 0 | 0.0% |
| Visual & Performing Arts | 0 | 0.0% |
| Communications | 0 | 0.0% |
| Arts & Humanities | 0 | 0.0% |
| Total | 0 | 0.0% |
Transportation & Commute in Nathalie
Vehicle Availability by Sex in Nathalie
The most prevalent vehicle ownership categories in Nathalie are males with 2 vehicles (48, accounting for 94.1%) and females with 2 vehicles (0, making up 1,200.0%).
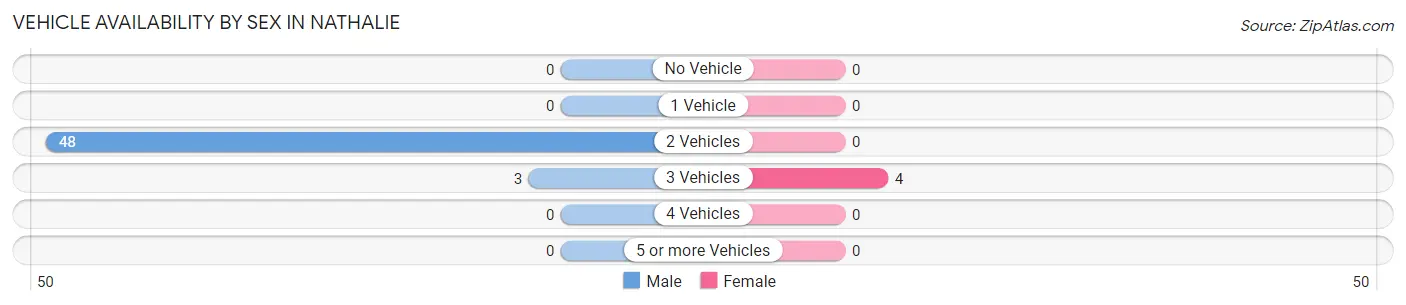
| Vehicles Available | Male | Female |
| No Vehicle | 0 (0.0%) | 0 (0.0%) |
| 1 Vehicle | 0 (0.0%) | 0 (0.0%) |
| 2 Vehicles | 48 (94.1%) | 0 (0.0%) |
| 3 Vehicles | 3 (5.9%) | 4 (100.0%) |
| 4 Vehicles | 0 (0.0%) | 0 (0.0%) |
| 5 or more Vehicles | 0 (0.0%) | 0 (0.0%) |
| Total | 51 (100.0%) | 4 (100.0%) |
Commute Time in Nathalie
The most frequently occuring commute durations in Nathalie are 5 to 9 minutes (48 commuters, 87.3%), 25 to 29 minutes (4 commuters, 7.3%), and 30 to 34 minutes (3 commuters, 5.4%).
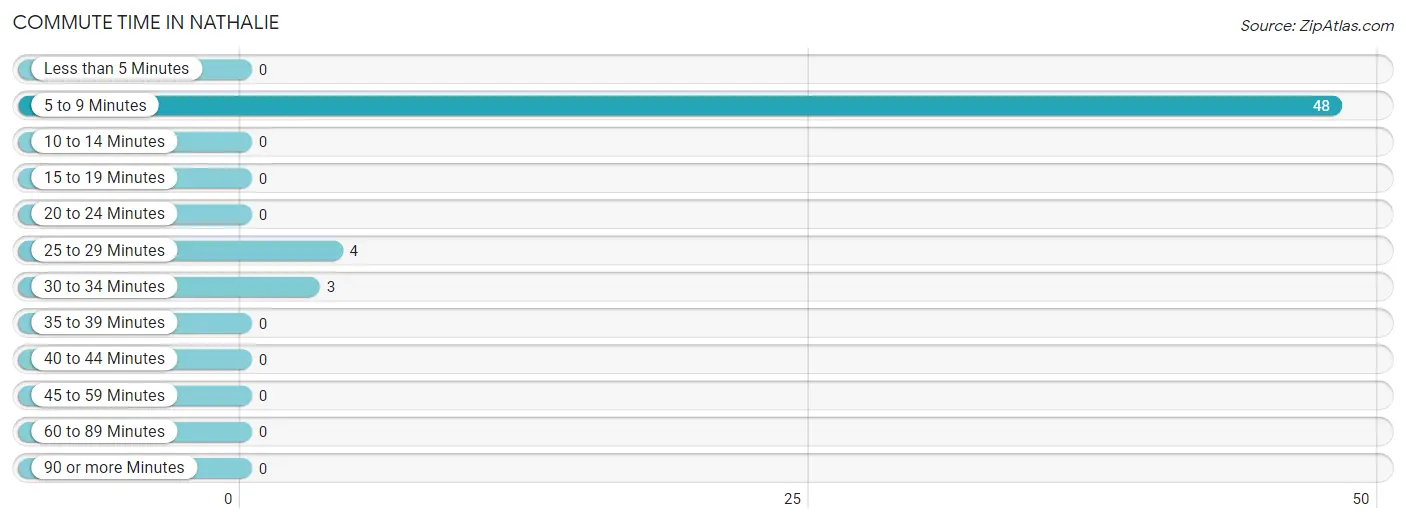
| Commute Time | # Commuters | % Commuters |
| Less than 5 Minutes | 0 | 0.0% |
| 5 to 9 Minutes | 48 | 87.3% |
| 10 to 14 Minutes | 0 | 0.0% |
| 15 to 19 Minutes | 0 | 0.0% |
| 20 to 24 Minutes | 0 | 0.0% |
| 25 to 29 Minutes | 4 | 7.3% |
| 30 to 34 Minutes | 3 | 5.4% |
| 35 to 39 Minutes | 0 | 0.0% |
| 40 to 44 Minutes | 0 | 0.0% |
| 45 to 59 Minutes | 0 | 0.0% |
| 60 to 89 Minutes | 0 | 0.0% |
| 90 or more Minutes | 0 | 0.0% |
Commute Time by Sex in Nathalie
The most common commute times in Nathalie are 5 to 9 minutes (48 commuters, 94.1%) for males and 25 to 29 minutes (4 commuters, 100.0%) for females.
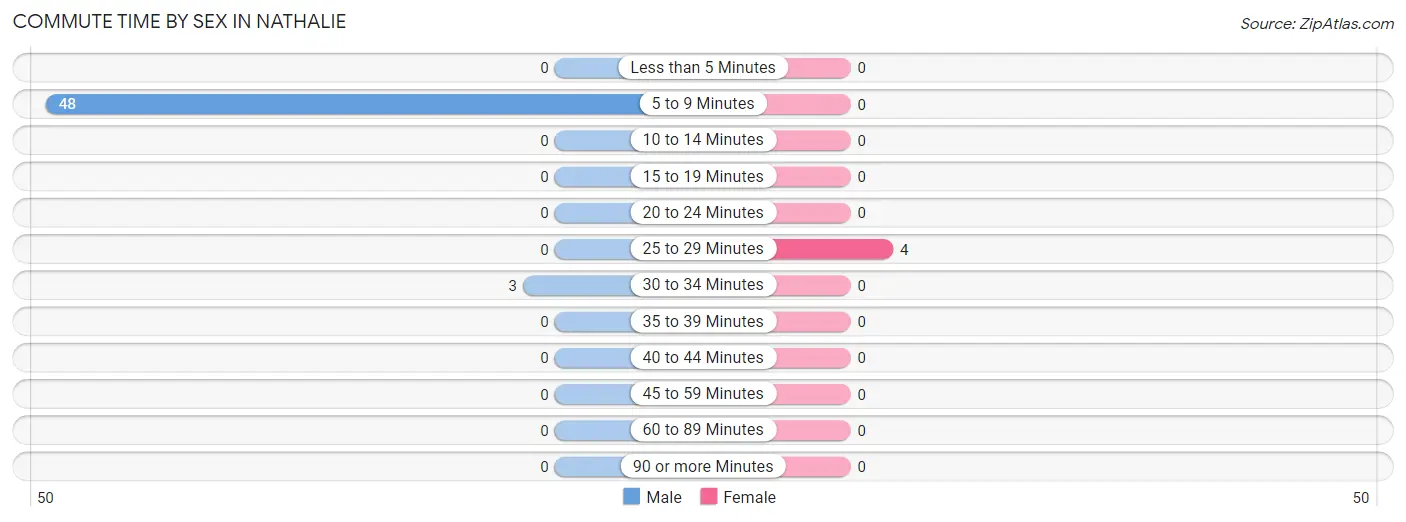
| Commute Time | Male | Female |
| Less than 5 Minutes | 0 (0.0%) | 0 (0.0%) |
| 5 to 9 Minutes | 48 (94.1%) | 0 (0.0%) |
| 10 to 14 Minutes | 0 (0.0%) | 0 (0.0%) |
| 15 to 19 Minutes | 0 (0.0%) | 0 (0.0%) |
| 20 to 24 Minutes | 0 (0.0%) | 0 (0.0%) |
| 25 to 29 Minutes | 0 (0.0%) | 4 (100.0%) |
| 30 to 34 Minutes | 3 (5.9%) | 0 (0.0%) |
| 35 to 39 Minutes | 0 (0.0%) | 0 (0.0%) |
| 40 to 44 Minutes | 0 (0.0%) | 0 (0.0%) |
| 45 to 59 Minutes | 0 (0.0%) | 0 (0.0%) |
| 60 to 89 Minutes | 0 (0.0%) | 0 (0.0%) |
| 90 or more Minutes | 0 (0.0%) | 0 (0.0%) |
Time of Departure to Work by Sex in Nathalie
The most frequent times of departure to work in Nathalie are 6:30 AM to 6:59 AM (34, 66.7%) for males and 6:00 AM to 6:29 AM (4, 100.0%) for females.
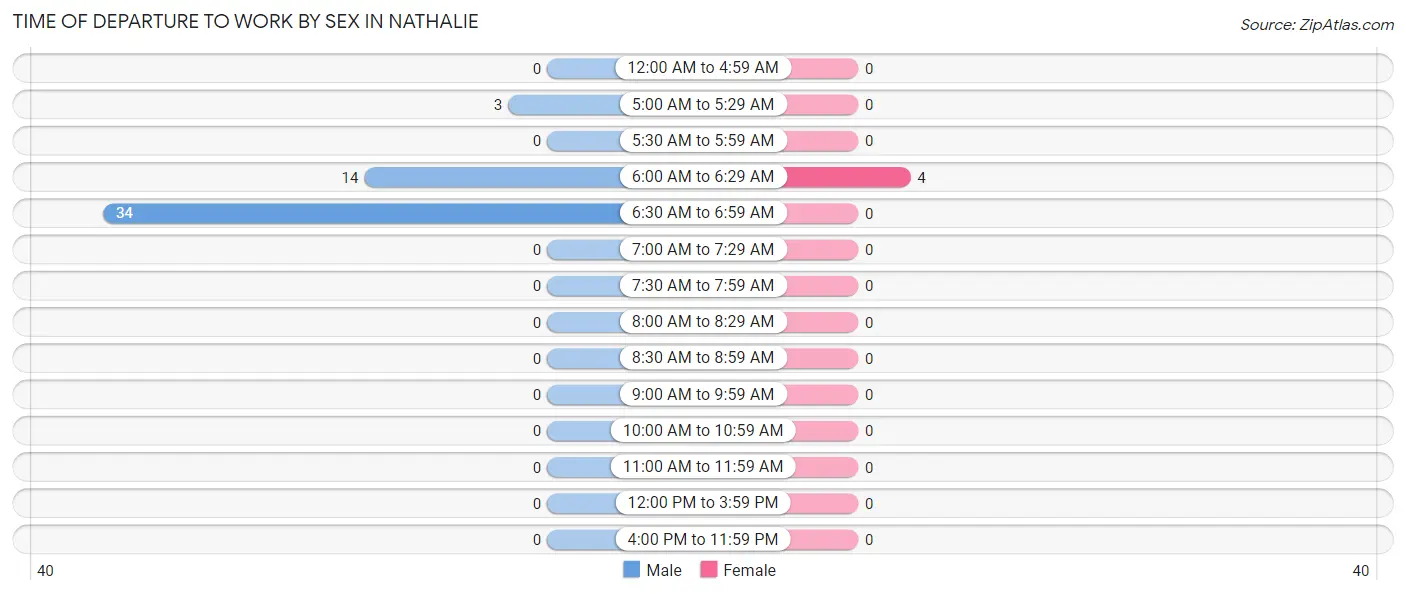
| Time of Departure | Male | Female |
| 12:00 AM to 4:59 AM | 0 (0.0%) | 0 (0.0%) |
| 5:00 AM to 5:29 AM | 3 (5.9%) | 0 (0.0%) |
| 5:30 AM to 5:59 AM | 0 (0.0%) | 0 (0.0%) |
| 6:00 AM to 6:29 AM | 14 (27.5%) | 4 (100.0%) |
| 6:30 AM to 6:59 AM | 34 (66.7%) | 0 (0.0%) |
| 7:00 AM to 7:29 AM | 0 (0.0%) | 0 (0.0%) |
| 7:30 AM to 7:59 AM | 0 (0.0%) | 0 (0.0%) |
| 8:00 AM to 8:29 AM | 0 (0.0%) | 0 (0.0%) |
| 8:30 AM to 8:59 AM | 0 (0.0%) | 0 (0.0%) |
| 9:00 AM to 9:59 AM | 0 (0.0%) | 0 (0.0%) |
| 10:00 AM to 10:59 AM | 0 (0.0%) | 0 (0.0%) |
| 11:00 AM to 11:59 AM | 0 (0.0%) | 0 (0.0%) |
| 12:00 PM to 3:59 PM | 0 (0.0%) | 0 (0.0%) |
| 4:00 PM to 11:59 PM | 0 (0.0%) | 0 (0.0%) |
| Total | 51 (100.0%) | 4 (100.0%) |
Housing Occupancy in Nathalie
Occupancy by Ownership in Nathalie
Of the total 22 dwellings in Nathalie, owner-occupied units account for 22 (100.0%), while renter-occupied units make up 0 (0.0%).
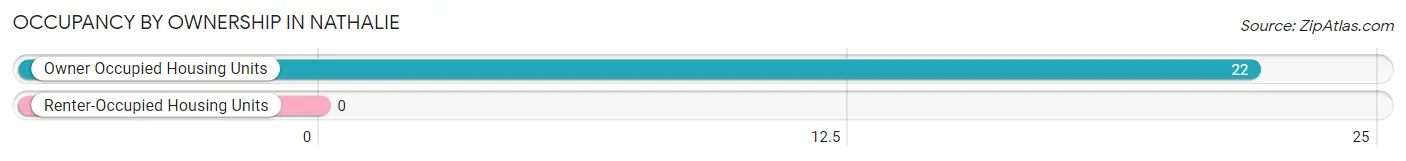
| Occupancy | # Housing Units | % Housing Units |
| Owner Occupied Housing Units | 22 | 100.0% |
| Renter-Occupied Housing Units | 0 | 0.0% |
| Total Occupied Housing Units | 22 | 100.0% |
Occupancy by Household Size in Nathalie
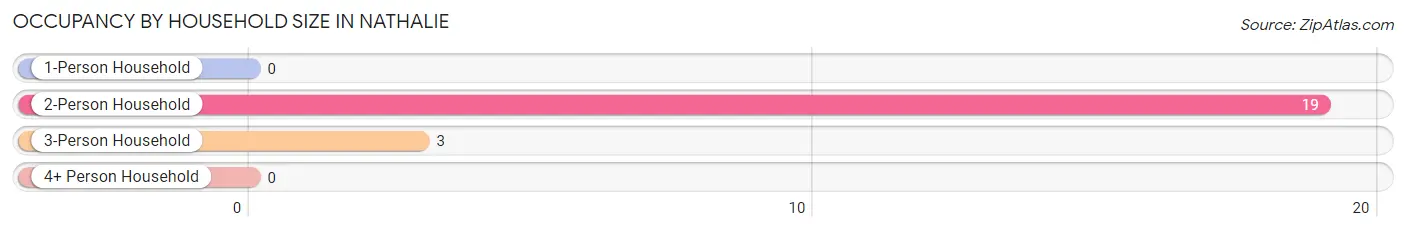
| Household Size | # Housing Units | % Housing Units |
| 1-Person Household | 0 | 0.0% |
| 2-Person Household | 19 | 86.4% |
| 3-Person Household | 3 | 13.6% |
| 4+ Person Household | 0 | 0.0% |
| Total Housing Units | 22 | 100.0% |
Occupancy by Ownership by Household Size in Nathalie
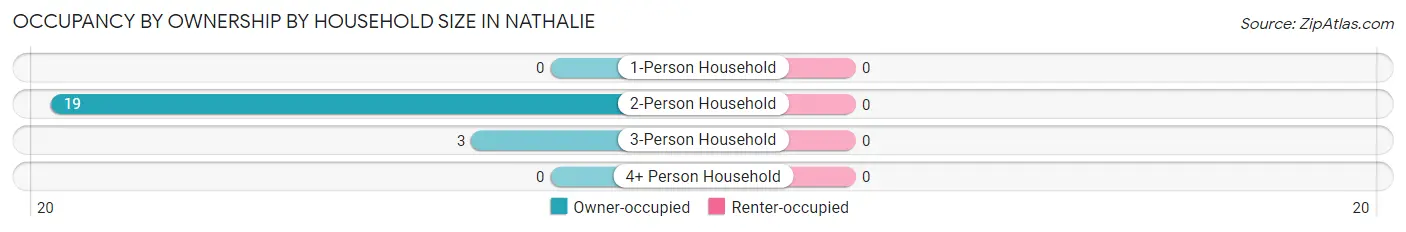
| Household Size | Owner-occupied | Renter-occupied |
| 1-Person Household | 0 (0.0%) | 0 (0.0%) |
| 2-Person Household | 19 (100.0%) | 0 (0.0%) |
| 3-Person Household | 3 (100.0%) | 0 (0.0%) |
| 4+ Person Household | 0 (0.0%) | 0 (0.0%) |
| Total Housing Units | 22 (100.0%) | 0 (0.0%) |
Occupancy by Educational Attainment in Nathalie
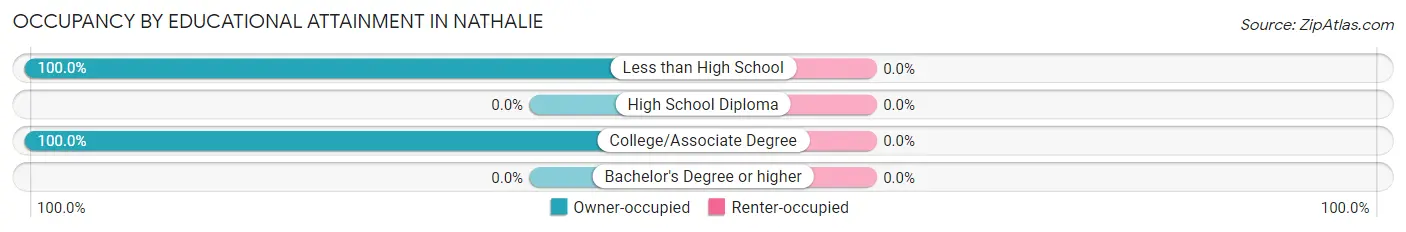
| Household Size | Owner-occupied | Renter-occupied |
| Less than High School | 19 (100.0%) | 0 (0.0%) |
| High School Diploma | 0 (0.0%) | 0 (0.0%) |
| College/Associate Degree | 3 (100.0%) | 0 (0.0%) |
| Bachelor's Degree or higher | 0 (0.0%) | 0 (0.0%) |
Occupancy by Age of Householder in Nathalie
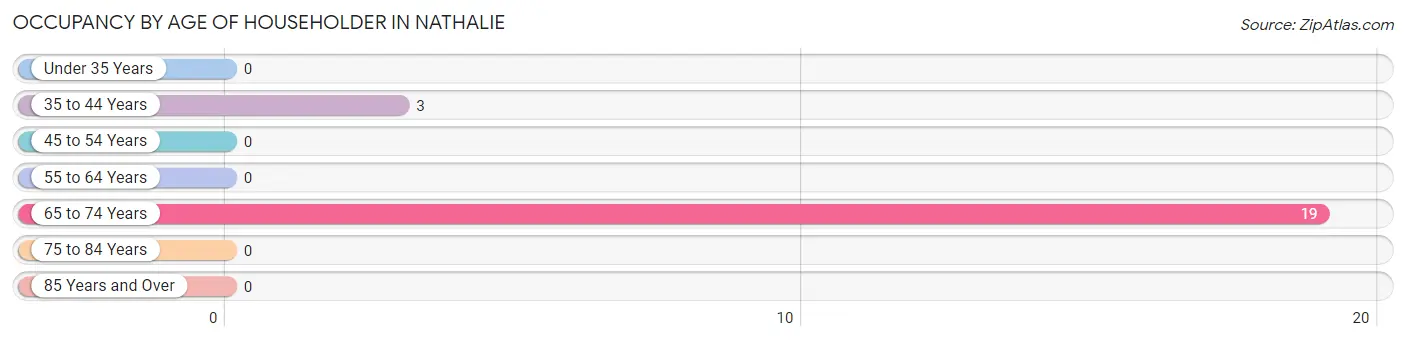
| Age Bracket | # Households | % Households |
| Under 35 Years | 0 | 0.0% |
| 35 to 44 Years | 3 | 13.6% |
| 45 to 54 Years | 0 | 0.0% |
| 55 to 64 Years | 0 | 0.0% |
| 65 to 74 Years | 19 | 86.4% |
| 75 to 84 Years | 0 | 0.0% |
| 85 Years and Over | 0 | 0.0% |
| Total | 22 | 100.0% |
Housing Finances in Nathalie
Median Income by Occupancy in Nathalie
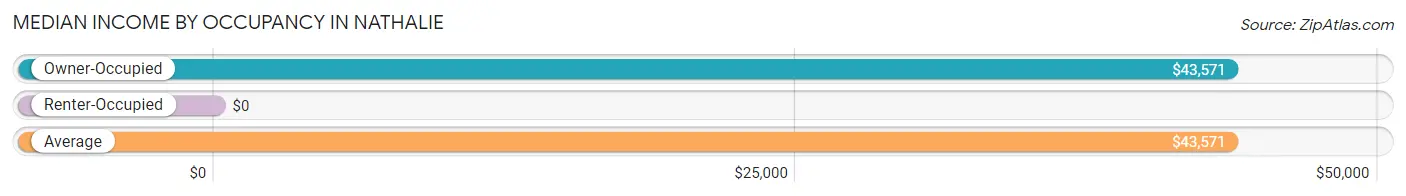
| Occupancy Type | # Households | Median Income |
| Owner-Occupied | 22 (100.0%) | $43,571 |
| Renter-Occupied | 0 (0.0%) | $0 |
| Average | 22 (100.0%) | $43,571 |
Occupancy by Householder Income Bracket in Nathalie
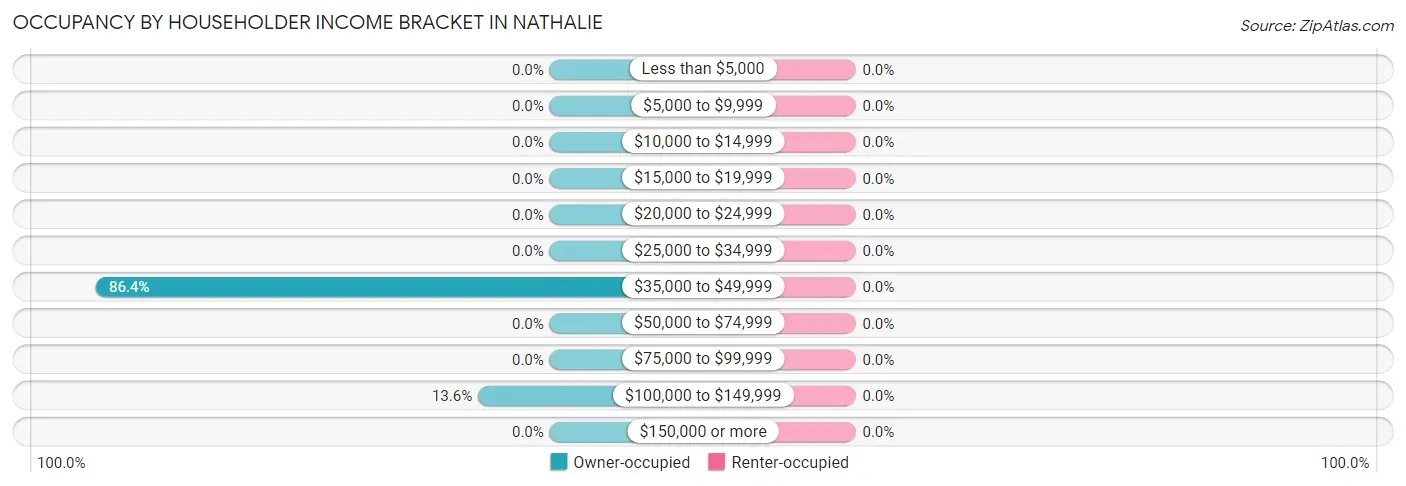
| Income Bracket | Owner-occupied | Renter-occupied |
| Less than $5,000 | 0 (0.0%) | 0 (0.0%) |
| $5,000 to $9,999 | 0 (0.0%) | 0 (0.0%) |
| $10,000 to $14,999 | 0 (0.0%) | 0 (0.0%) |
| $15,000 to $19,999 | 0 (0.0%) | 0 (0.0%) |
| $20,000 to $24,999 | 0 (0.0%) | 0 (0.0%) |
| $25,000 to $34,999 | 0 (0.0%) | 0 (0.0%) |
| $35,000 to $49,999 | 19 (86.4%) | 0 (0.0%) |
| $50,000 to $74,999 | 0 (0.0%) | 0 (0.0%) |
| $75,000 to $99,999 | 0 (0.0%) | 0 (0.0%) |
| $100,000 to $149,999 | 3 (13.6%) | 0 (0.0%) |
| $150,000 or more | 0 (0.0%) | 0 (0.0%) |
| Total | 22 (100.0%) | 0 (0.0%) |
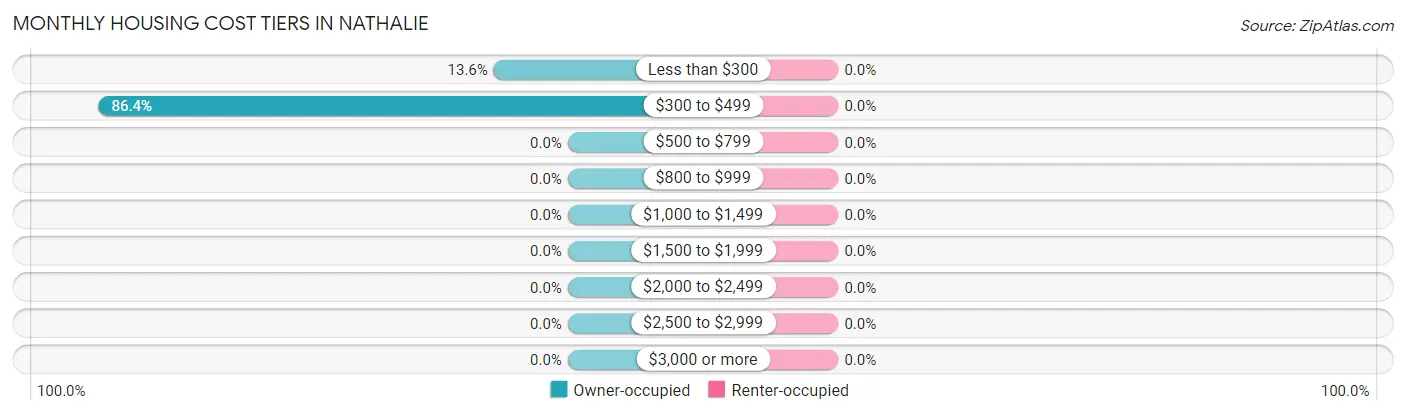
Monthly Housing Cost Tiers in Nathalie
| Monthly Cost | Owner-occupied | Renter-occupied |
| Less than $300 | 3 (13.6%) | 0 (0.0%) |
| $300 to $499 | 19 (86.4%) | 0 (0.0%) |
| $500 to $799 | 0 (0.0%) | 0 (0.0%) |
| $800 to $999 | 0 (0.0%) | 0 (0.0%) |
| $1,000 to $1,499 | 0 (0.0%) | 0 (0.0%) |
| $1,500 to $1,999 | 0 (0.0%) | 0 (0.0%) |
| $2,000 to $2,499 | 0 (0.0%) | 0 (0.0%) |
| $2,500 to $2,999 | 0 (0.0%) | 0 (0.0%) |
| $3,000 or more | 0 (0.0%) | 0 (0.0%) |
| Total | 22 (100.0%) | 0 (0.0%) |
Physical Housing Characteristics in Nathalie
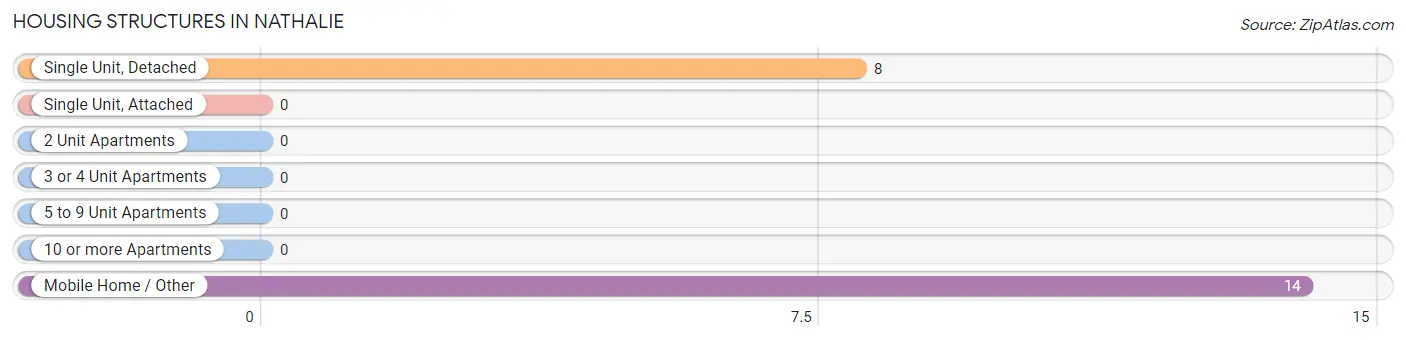
Housing Structures in Nathalie
| Structure Type | # Housing Units | % Housing Units |
| Single Unit, Detached | 8 | 36.4% |
| Single Unit, Attached | 0 | 0.0% |
| 2 Unit Apartments | 0 | 0.0% |
| 3 or 4 Unit Apartments | 0 | 0.0% |
| 5 to 9 Unit Apartments | 0 | 0.0% |
| 10 or more Apartments | 0 | 0.0% |
| Mobile Home / Other | 14 | 63.6% |
| Total | 22 | 100.0% |
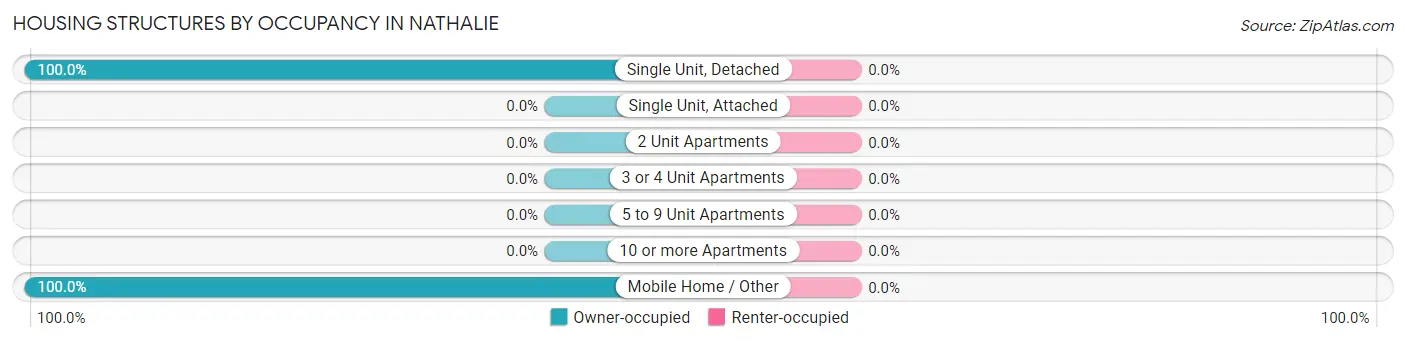
Housing Structures by Occupancy in Nathalie
| Structure Type | Owner-occupied | Renter-occupied |
| Single Unit, Detached | 8 (100.0%) | 0 (0.0%) |
| Single Unit, Attached | 0 (0.0%) | 0 (0.0%) |
| 2 Unit Apartments | 0 (0.0%) | 0 (0.0%) |
| 3 or 4 Unit Apartments | 0 (0.0%) | 0 (0.0%) |
| 5 to 9 Unit Apartments | 0 (0.0%) | 0 (0.0%) |
| 10 or more Apartments | 0 (0.0%) | 0 (0.0%) |
| Mobile Home / Other | 14 (100.0%) | 0 (0.0%) |
| Total | 22 (100.0%) | 0 (0.0%) |
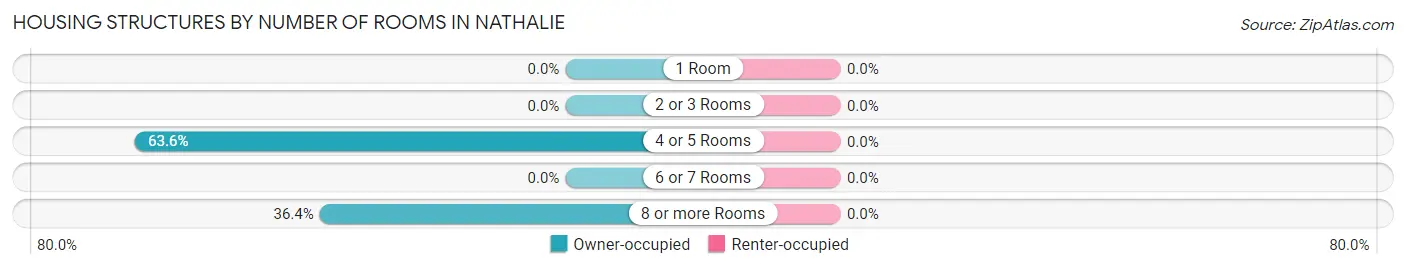
Housing Structures by Number of Rooms in Nathalie
| Number of Rooms | Owner-occupied | Renter-occupied |
| 1 Room | 0 (0.0%) | 0 (0.0%) |
| 2 or 3 Rooms | 0 (0.0%) | 0 (0.0%) |
| 4 or 5 Rooms | 14 (63.6%) | 0 (0.0%) |
| 6 or 7 Rooms | 0 (0.0%) | 0 (0.0%) |
| 8 or more Rooms | 8 (36.4%) | 0 (0.0%) |
| Total | 22 (100.0%) | 0 (0.0%) |
Housing Structure by Heating Type in Nathalie
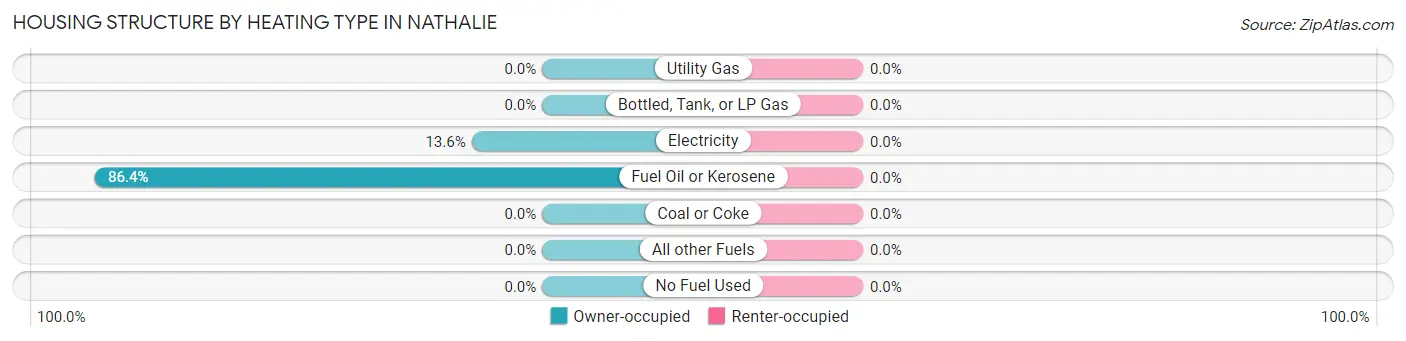
| Heating Type | Owner-occupied | Renter-occupied |
| Utility Gas | 0 (0.0%) | 0 (0.0%) |
| Bottled, Tank, or LP Gas | 0 (0.0%) | 0 (0.0%) |
| Electricity | 3 (13.6%) | 0 (0.0%) |
| Fuel Oil or Kerosene | 19 (86.4%) | 0 (0.0%) |
| Coal or Coke | 0 (0.0%) | 0 (0.0%) |
| All other Fuels | 0 (0.0%) | 0 (0.0%) |
| No Fuel Used | 0 (0.0%) | 0 (0.0%) |
| Total | 22 (100.0%) | 0 (0.0%) |
Household Vehicle Usage in Nathalie
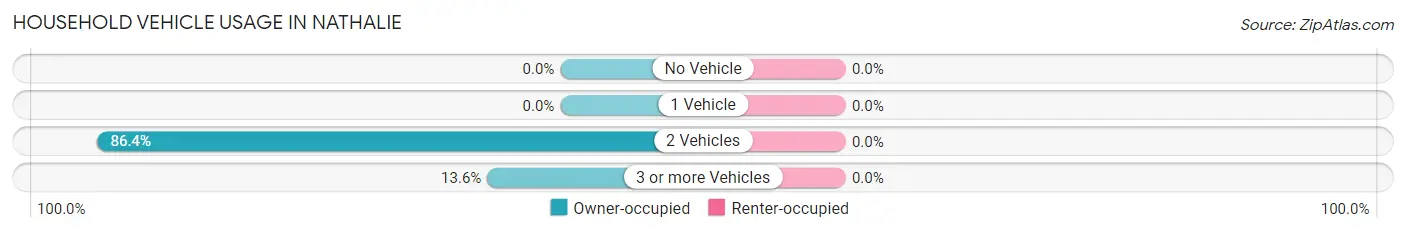
| Vehicles per Household | Owner-occupied | Renter-occupied |
| No Vehicle | 0 (0.0%) | 0 (0.0%) |
| 1 Vehicle | 0 (0.0%) | 0 (0.0%) |
| 2 Vehicles | 19 (86.4%) | 0 (0.0%) |
| 3 or more Vehicles | 3 (13.6%) | 0 (0.0%) |
| Total | 22 (100.0%) | 0 (0.0%) |
Real Estate & Mortgages in Nathalie
Real Estate and Mortgage Overview in Nathalie
| Characteristic | Without Mortgage | With Mortgage |
| Housing Units | 22 | 0 |
| Median Property Value | - | - |
| Median Household Income | $43,571 | $0 |
| Monthly Housing Costs | $329 | $0 |
| Real Estate Taxes | $343 | $0 |
Property Value by Mortgage Status in Nathalie
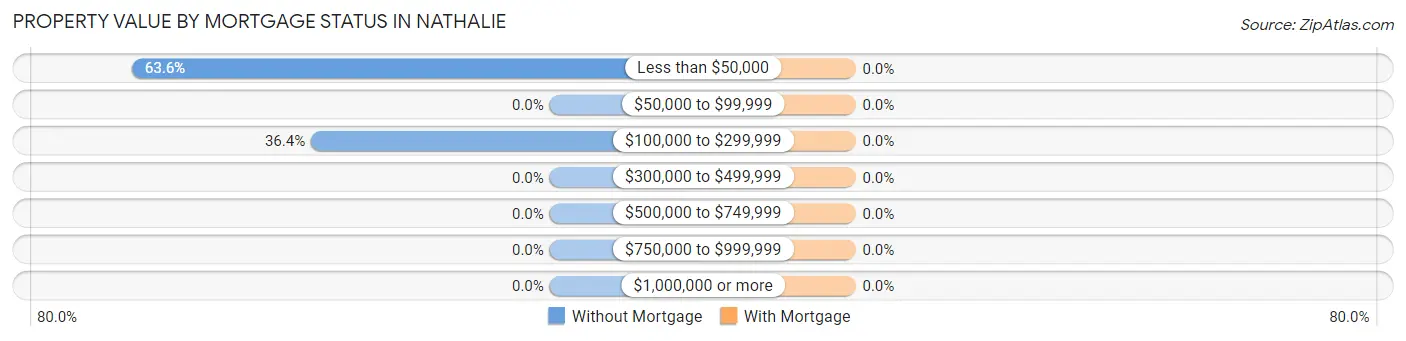
| Property Value | Without Mortgage | With Mortgage |
| Less than $50,000 | 14 (63.6%) | 0 (0.0%) |
| $50,000 to $99,999 | 0 (0.0%) | 0 (0.0%) |
| $100,000 to $299,999 | 8 (36.4%) | 0 (0.0%) |
| $300,000 to $499,999 | 0 (0.0%) | 0 (0.0%) |
| $500,000 to $749,999 | 0 (0.0%) | 0 (0.0%) |
| $750,000 to $999,999 | 0 (0.0%) | 0 (0.0%) |
| $1,000,000 or more | 0 (0.0%) | 0 (0.0%) |
| Total | 22 (100.0%) | 0 (0.0%) |
Household Income by Mortgage Status in Nathalie
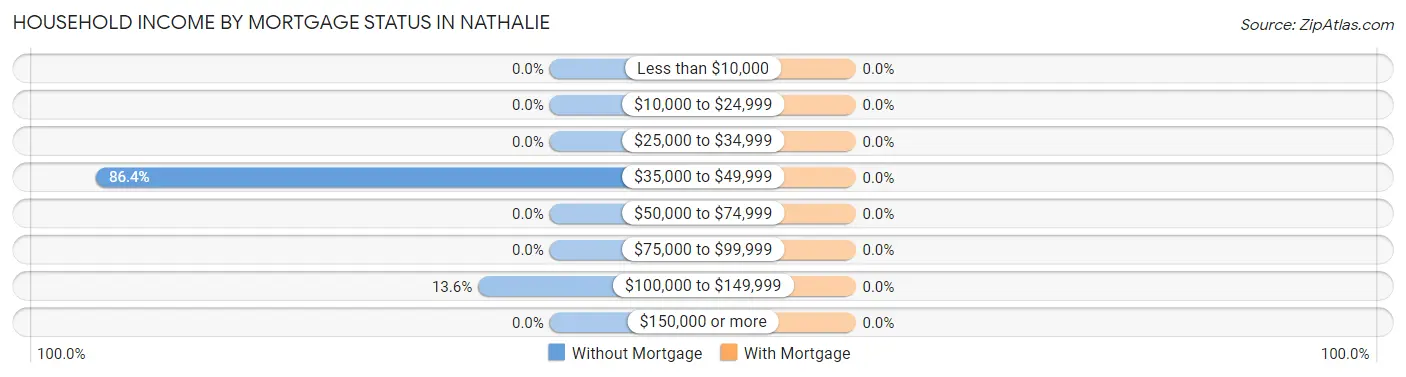
| Household Income | Without Mortgage | With Mortgage |
| Less than $10,000 | 0 (0.0%) | 0 (0.0%) |
| $10,000 to $24,999 | 0 (0.0%) | 0 (0.0%) |
| $25,000 to $34,999 | 0 (0.0%) | 0 (0.0%) |
| $35,000 to $49,999 | 19 (86.4%) | 0 (0.0%) |
| $50,000 to $74,999 | 0 (0.0%) | 0 (0.0%) |
| $75,000 to $99,999 | 0 (0.0%) | 0 (0.0%) |
| $100,000 to $149,999 | 3 (13.6%) | 0 (0.0%) |
| $150,000 or more | 0 (0.0%) | 0 (0.0%) |
| Total | 22 (100.0%) | 0 (0.0%) |
Property Value to Household Income Ratio in Nathalie
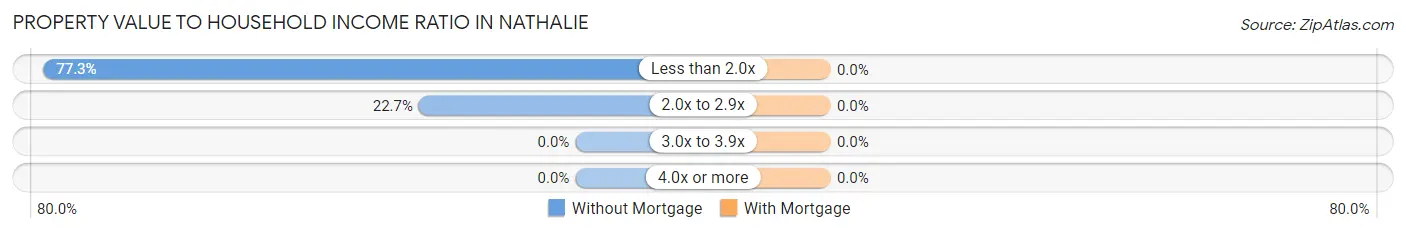
| Value-to-Income Ratio | Without Mortgage | With Mortgage |
| Less than 2.0x | 17 (77.3%) | 0 (0.0%) |
| 2.0x to 2.9x | 5 (22.7%) | 0 (0.0%) |
| 3.0x to 3.9x | 0 (0.0%) | 0 (0.0%) |
| 4.0x or more | 0 (0.0%) | 0 (0.0%) |
| Total | 22 (100.0%) | 0 (0.0%) |
Real Estate Taxes by Mortgage Status in Nathalie
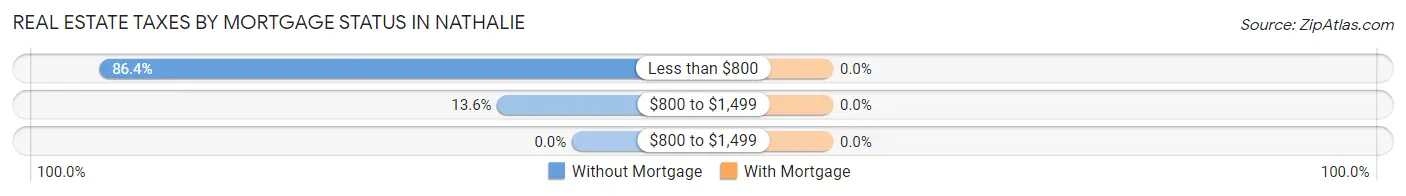
| Property Taxes | Without Mortgage | With Mortgage |
| Less than $800 | 19 (86.4%) | 0 (0.0%) |
| $800 to $1,499 | 3 (13.6%) | 0 (0.0%) |
| $800 to $1,499 | 0 (0.0%) | 0 (0.0%) |
| Total | 22 (100.0%) | 0 (0.0%) |
Health & Disability in Nathalie
Health Insurance Coverage by Age in Nathalie
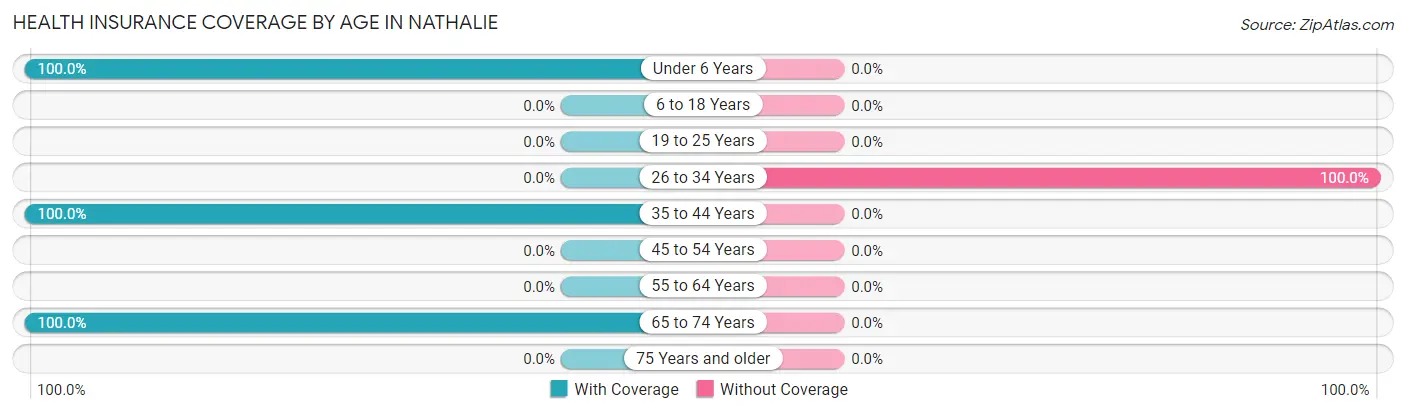
| Age Bracket | With Coverage | Without Coverage |
| Under 6 Years | 3 (100.0%) | 0 (0.0%) |
| 6 to 18 Years | 0 (0.0%) | 0 (0.0%) |
| 19 to 25 Years | 0 (0.0%) | 0 (0.0%) |
| 26 to 34 Years | 0 (0.0%) | 34 (100.0%) |
| 35 to 44 Years | 7 (100.0%) | 0 (0.0%) |
| 45 to 54 Years | 0 (0.0%) | 0 (0.0%) |
| 55 to 64 Years | 0 (0.0%) | 0 (0.0%) |
| 65 to 74 Years | 26 (100.0%) | 0 (0.0%) |
| 75 Years and older | 0 (0.0%) | 0 (0.0%) |
| Total | 36 (51.4%) | 34 (48.6%) |
Health Insurance Coverage by Citizenship Status in Nathalie
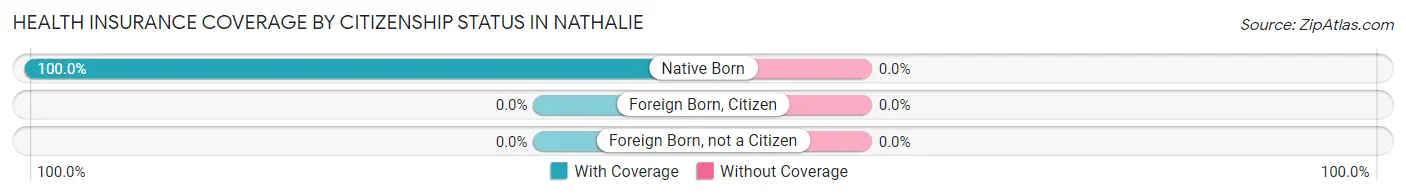
| Citizenship Status | With Coverage | Without Coverage |
| Native Born | 3 (100.0%) | 0 (0.0%) |
| Foreign Born, Citizen | 0 (0.0%) | 0 (0.0%) |
| Foreign Born, not a Citizen | 0 (0.0%) | 0 (0.0%) |
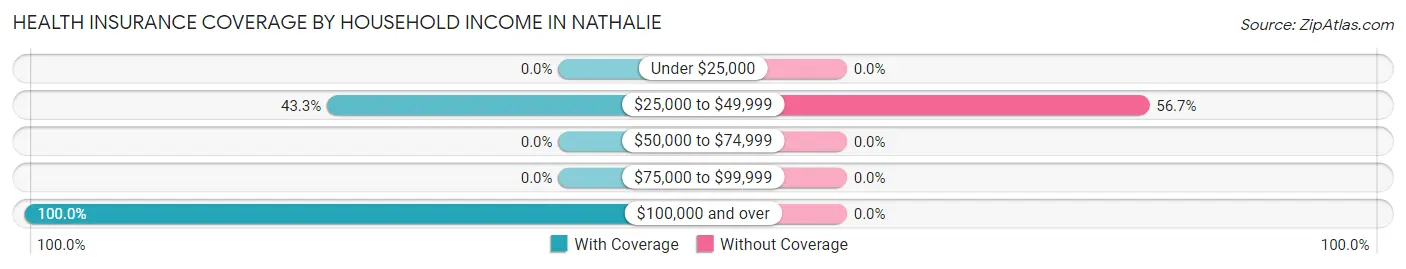
Health Insurance Coverage by Household Income in Nathalie
| Household Income | With Coverage | Without Coverage |
| Under $25,000 | 0 (0.0%) | 0 (0.0%) |
| $25,000 to $49,999 | 26 (43.3%) | 34 (56.7%) |
| $50,000 to $74,999 | 0 (0.0%) | 0 (0.0%) |
| $75,000 to $99,999 | 0 (0.0%) | 0 (0.0%) |
| $100,000 and over | 10 (100.0%) | 0 (0.0%) |
Public vs Private Health Insurance Coverage by Age in Nathalie
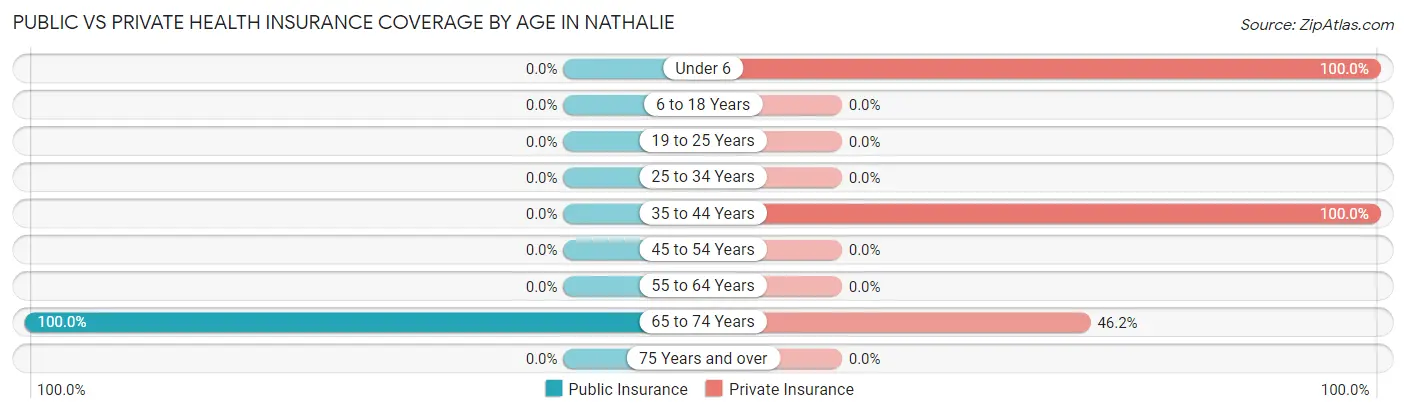
| Age Bracket | Public Insurance | Private Insurance |
| Under 6 | 0 (0.0%) | 3 (100.0%) |
| 6 to 18 Years | 0 (0.0%) | 0 (0.0%) |
| 19 to 25 Years | 0 (0.0%) | 0 (0.0%) |
| 25 to 34 Years | 0 (0.0%) | 0 (0.0%) |
| 35 to 44 Years | 0 (0.0%) | 7 (100.0%) |
| 45 to 54 Years | 0 (0.0%) | 0 (0.0%) |
| 55 to 64 Years | 0 (0.0%) | 0 (0.0%) |
| 65 to 74 Years | 26 (100.0%) | 12 (46.2%) |
| 75 Years and over | 0 (0.0%) | 0 (0.0%) |
| Total | 26 (37.1%) | 22 (31.4%) |
Disability Status by Sex by Age in Nathalie
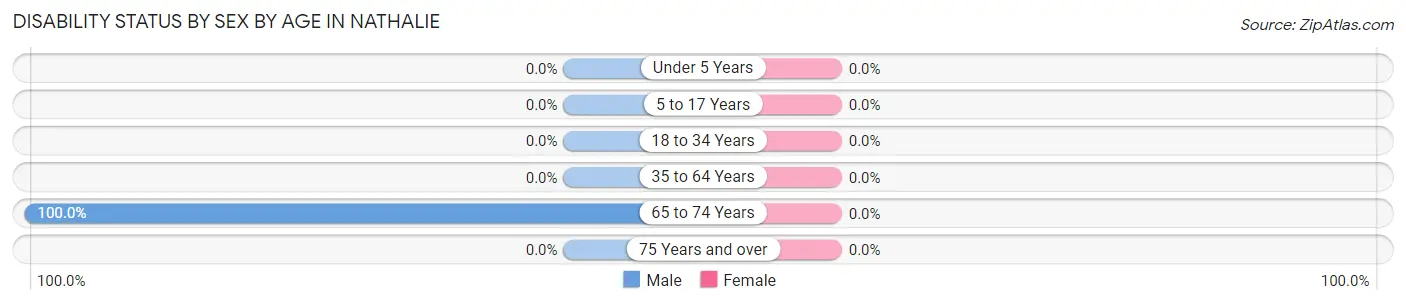
| Age Bracket | Male | Female |
| Under 5 Years | 0 (0.0%) | 0 (0.0%) |
| 5 to 17 Years | 0 (0.0%) | 0 (0.0%) |
| 18 to 34 Years | 0 (0.0%) | 0 (0.0%) |
| 35 to 64 Years | 0 (0.0%) | 0 (0.0%) |
| 65 to 74 Years | 19 (100.0%) | 0 (0.0%) |
| 75 Years and over | 0 (0.0%) | 0 (0.0%) |
Disability Class by Sex by Age in Nathalie
Disability Class: Hearing Difficulty
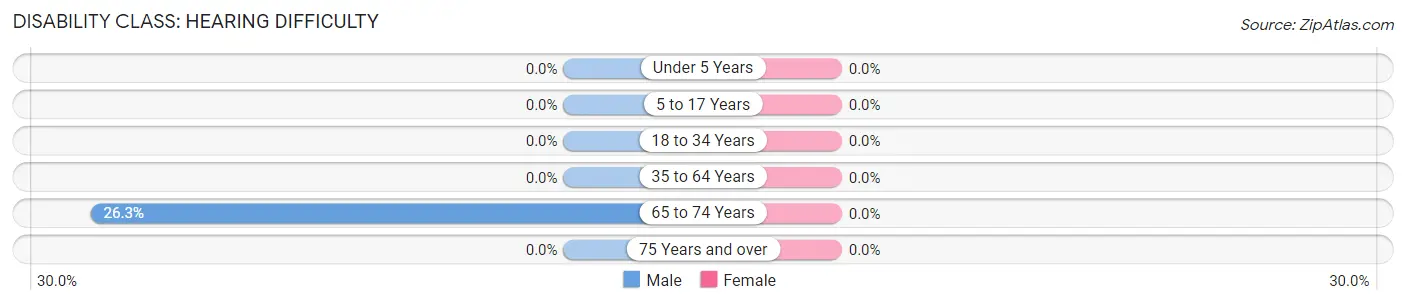
| Age Bracket | Male | Female |
| Under 5 Years | 0 (0.0%) | 0 (0.0%) |
| 5 to 17 Years | 0 (0.0%) | 0 (0.0%) |
| 18 to 34 Years | 0 (0.0%) | 0 (0.0%) |
| 35 to 64 Years | 0 (0.0%) | 0 (0.0%) |
| 65 to 74 Years | 5 (26.3%) | 0 (0.0%) |
| 75 Years and over | 0 (0.0%) | 0 (0.0%) |
Disability Class: Vision Difficulty
| Age Bracket | Male | Female |
| Under 5 Years | 0 (0.0%) | 0 (0.0%) |
| 5 to 17 Years | 0 (0.0%) | 0 (0.0%) |
| 18 to 34 Years | 0 (0.0%) | 0 (0.0%) |
| 35 to 64 Years | 0 (0.0%) | 0 (0.0%) |
| 65 to 74 Years | 0 (0.0%) | 0 (0.0%) |
| 75 Years and over | 0 (0.0%) | 0 (0.0%) |
Disability Class: Cognitive Difficulty
| Age Bracket | Male | Female |
| 5 to 17 Years | 0 (0.0%) | 0 (0.0%) |
| 18 to 34 Years | 0 (0.0%) | 0 (0.0%) |
| 35 to 64 Years | 0 (0.0%) | 0 (0.0%) |
| 65 to 74 Years | 0 (0.0%) | 0 (0.0%) |
| 75 Years and over | 0 (0.0%) | 0 (0.0%) |
Disability Class: Ambulatory Difficulty
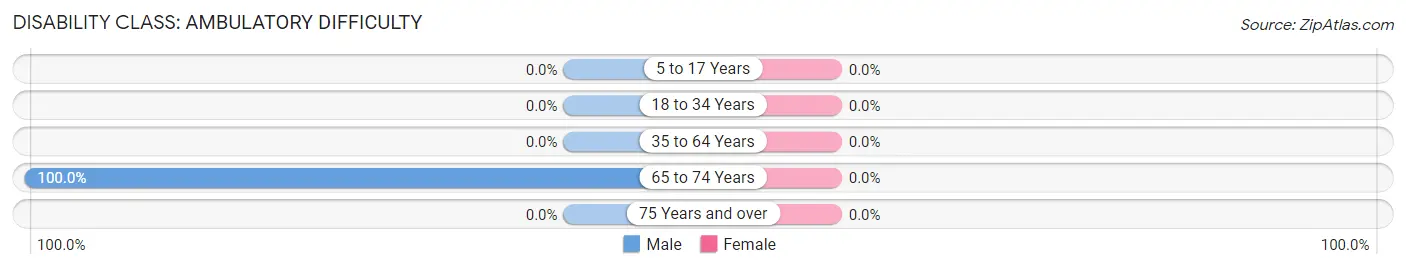
| Age Bracket | Male | Female |
| 5 to 17 Years | 0 (0.0%) | 0 (0.0%) |
| 18 to 34 Years | 0 (0.0%) | 0 (0.0%) |
| 35 to 64 Years | 0 (0.0%) | 0 (0.0%) |
| 65 to 74 Years | 19 (100.0%) | 0 (0.0%) |
| 75 Years and over | 0 (0.0%) | 0 (0.0%) |
Disability Class: Self-Care Difficulty
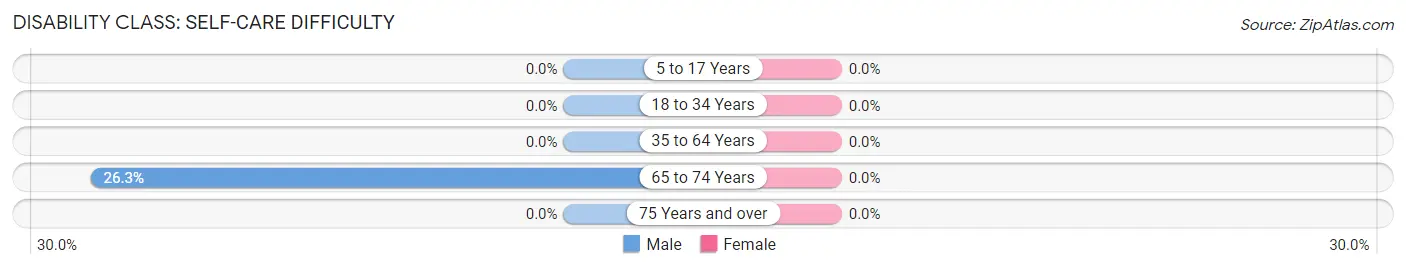
| Age Bracket | Male | Female |
| 5 to 17 Years | 0 (0.0%) | 0 (0.0%) |
| 18 to 34 Years | 0 (0.0%) | 0 (0.0%) |
| 35 to 64 Years | 0 (0.0%) | 0 (0.0%) |
| 65 to 74 Years | 5 (26.3%) | 0 (0.0%) |
| 75 Years and over | 0 (0.0%) | 0 (0.0%) |
Technology Access in Nathalie
Computing Device Access in Nathalie
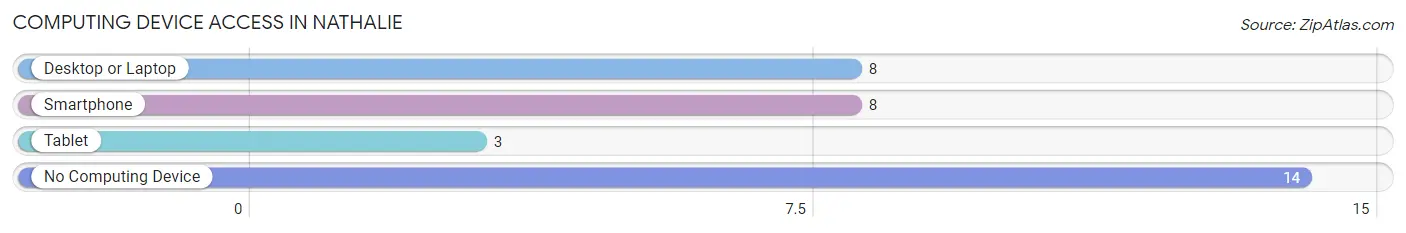
| Device Type | # Households | % Households |
| Desktop or Laptop | 8 | 36.4% |
| Smartphone | 8 | 36.4% |
| Tablet | 3 | 13.6% |
| No Computing Device | 14 | 63.6% |
| Total | 22 | 100.0% |
Internet Access in Nathalie
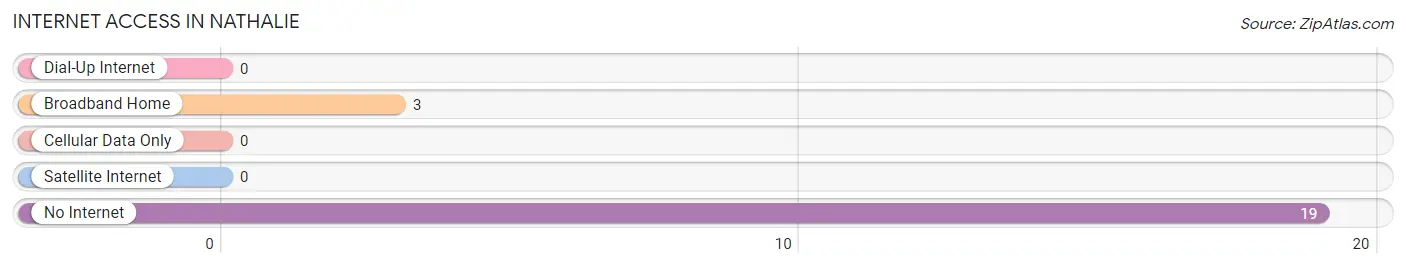
| Internet Type | # Households | % Households |
| Dial-Up Internet | 0 | 0.0% |
| Broadband Home | 3 | 13.6% |
| Cellular Data Only | 0 | 0.0% |
| Satellite Internet | 0 | 0.0% |
| No Internet | 19 | 86.4% |
| Total | 22 | 100.0% |
Nathalie Summary
VA History
Virginia, also known as the Old Dominion, is one of the original 13 colonies and the birthplace of the United States of America. The first permanent English settlement in the New World was established in 1607 at Jamestown, Virginia. The colony was founded by the Virginia Company of London, a joint-stock company that was granted a charter by King James I of England. The colony was initially established as a commercial venture, but it soon became a major center of political and social life in the New World.
Virginia was the first colony to declare its independence from Britain in 1776, and it was the tenth state to ratify the United States Constitution in 1788. During the American Revolution, Virginia was the home of many of the Founding Fathers, including George Washington, Thomas Jefferson, James Madison, and Patrick Henry.
Virginia was also the site of many important battles during the Civil War, including the Battle of Bull Run, the Battle of Fredericksburg, and the Battle of Appomattox Court House. After the war, Virginia was the first state to be readmitted to the Union in 1870.
Virginia has a long and rich history, and it has played an important role in the development of the United States. From the early days of the Jamestown settlement to the present day, Virginia has been a leader in politics, culture, and industry.
VA Geography
Virginia is located in the Mid-Atlantic region of the United States. It is bordered by Maryland and Washington, D.C. to the north, the Atlantic Ocean to the east, North Carolina and Tennessee to the south, and West Virginia to the west.
Virginia is divided into 95 counties and 38 independent cities. The state capital is Richmond, and the largest city is Virginia Beach. Other major cities include Norfolk, Chesapeake, Arlington, and Alexandria.
Virginia is home to a variety of landscapes, from the Appalachian Mountains in the west to the coastal plains in the east. The state is also home to numerous rivers, including the Potomac, Rappahannock, and James.
VA Economy
Virginia has a diverse and vibrant economy. The state is home to a variety of industries, including agriculture, manufacturing, technology, and tourism.
Agriculture is an important part of the state’s economy. Virginia is the leading producer of peanuts, soybeans, and tobacco in the United States. The state is also a major producer of poultry, dairy products, and livestock.
Manufacturing is another important sector of the economy. Virginia is home to a variety of industries, including shipbuilding, textiles, chemicals, and electronics.
Technology is a major driver of the state’s economy. Virginia is home to a number of technology companies, including Amazon, Microsoft, and AOL.
Tourism is also an important part of the economy. Virginia is home to a variety of attractions, including historical sites, beaches, and national parks.
VA Demographics
As of 2020, Virginia had an estimated population of 8.5 million people. The state is racially and ethnically diverse, with a population that is approximately 60% white, 20% African American, 8% Hispanic or Latino, and 8% Asian.
The median household income in Virginia is $71,535, and the median home value is $269,000. The state has a poverty rate of 11.2%, and the unemployment rate is 3.7%.
Conclusion
Virginia is a state with a long and rich history. It is the birthplace of the United States and the home of many of the Founding Fathers. Virginia is also home to a diverse and vibrant economy, with a variety of industries and attractions. The state is racially and ethnically diverse, with a population that is approximately 60% white, 20% African American, 8% Hispanic or Latino, and 8% Asian. Virginia is an important part of the United States, and it has played an important role in the development of the nation.
Common Questions
What is Per Capita Income in Nathalie?
Per Capita income in Nathalie is $21,424.
What is the Median Family Income in Nathalie?
Median Family Income in Nathalie is $43,571.
What is the Median Household income in Nathalie?
Median Household Income in Nathalie is $43,571.
What is Inequality or Gini Index in Nathalie?
Inequality or Gini Index in Nathalie is 0.15.
What is the Total Population of Nathalie?
Total Population of Nathalie is 70.
What is the Total Male Population of Nathalie?
Total Male Population of Nathalie is 56.
What is the Total Female Population of Nathalie?
Total Female Population of Nathalie is 14.
What is the Ratio of Males per 100 Females in Nathalie?
There are 400.00 Males per 100 Females in Nathalie.
What is the Ratio of Females per 100 Males in Nathalie?
There are 25.00 Females per 100 Males in Nathalie.
What is the Median Population Age in Nathalie?
Median Population Age in Nathalie is 31.9 Years.
What is the Average Family Size in Nathalie
Average Family Size in Nathalie is 3.2 People.
What is the Average Household Size in Nathalie
Average Household Size in Nathalie is 3.2 People.
How Large is the Labor Force in Nathalie?
There are 55 People in the Labor Forcein in Nathalie.
What is the Percentage of People in the Labor Force in Nathalie?
82.1% of People are in the Labor Force in Nathalie.